 Maurice Leponce1,2*
 Yves Basset3
 Ángela Aristizábal-Botero1Noui Baïben4Jérôme Barbut5
 Bart Buyck6Philip Butterill7
 Kim Calders8Glenda Cárdenas9
 Jean-François Carrias10Damien Catchpole11Barbara D’hont8Jacques Delabie12,13
 Jochen Drescher14Damien Ertz15,16André Heughebaert17
 Valérie Hofstetter18
 Céline Leroy19,20Frédéric Melki21
 Johan Michaux22Jhon César Neita-Moreno23Eddy Poirier24
 Rodolphe Rougerie6
 Germinal Rouhan6Vincent Rufray25
 Stefan Scheu14,26Jürgen Schmidl27Alain Vanderpoorten28Claire Villemant6Nabil Youdjou29Olivier Pascal21
- 1Biodiversity Monitoring and Assessment, Royal Belgian Institute of Natural Sciences, Brussels, Belgium
- 2Evolutionary Biology and Ecology, Université Libre de Bruxelles, Brussels, Belgium
- 3Smithsonian Tropical Research Institute, Panama City, Panama
- 4Accès Cimes, Lyon, France
- 5Direction Générale Déléguée Aux Collections, Muséum National d'Histoire Naturelle, Paris, France
- 6Institut de Systématique, Évolution, Biodiversité, Muséum National d’Histoire Naturelle / CNRS / EPHE-PSL / Sorbonne Université / Université des Antilles, Paris, France
- 7Biology Centre, Czech Academy of Sciences, České Budějovice, Czechia
- 8Q-ForestLab, Department of Environment, Faculty of Bioscience Engineering, Ghent University, Ghent, Belgium
- 9Biodiversity Unit, University of Turku, Turku, Finland
- 10Laboratoire Microorganismes: Génome et Environnement (LMGE), CNRS, Université Clermont-Auvergne, Clermont-Ferrand, France
- 11Independent Biodiversity Consultant, Lima, Peru
- 12Departamento de Ciências Agrárias e Ambientais, Centro de Pesquisas do Cacau – CEPEC/CEPLAC, Universidade Estadual Santa Cruz, Ilhéus, Brazil
- 13Departamento de Ciências Agrárias e Ambientais, Universidade Estadual Santa Cruz, Ilhéus, Brazil
- 14J. F. Blumenbach Institute of Zoology and Anthropology, University of Göttingen, Göttingen, Germany
- 15Department Research, Meise Botanic Garden, Meise, Belgium
- 16Service Général de l’Enseignement Supérieur et de la Recherche Scientifique, Fédération Wallonie-Bruxelles, Brussels, Belgium
- 17Belgian Biodiversity Platform, Belgian Science Policy, Brussels, Belgium
- 18Agroscope, Plant Protection, Mycology, Nyon, Switzerland
- 19AMAP (Univ. Montpellier, CIRAD, CNRS, INRAE, IRD), Montpellier, France
- 20EcoFoG, AgroParisTech / CIRAD / CNRS / INRAE / Université des Antilles / Université de Guyane, Kourou, France
- 21Fonds de Dotation Biotope Pour La Nature, Remire Montjoly, French Guiana
- 22Conservation Genetics Laboratory, Institute of Botany (Bat. 22), University of Liège, Liege, Belgium
- 23Invertebrate and Entomology Collection, Collections, and Species Management Center, Instituto de Investigación de Recursos Biológicos Alexander von Humboldt, Bogotá, Colombia
- 24Independent Entomologist, Cayenne, French Guiana
- 25Fondation Biotope, Remire Montjoly, French Guiana
- 26Centre of Biodiversity and Sustainable Land Use, University of Göttingen, Göttingen, Germany
- 27Department of Biology, Developmental Biology, Friedrich-Alexander-Universität Erlangen-Nürnberg, Erlangen, Germany
- 28Département de Biologie, Ecologie et Evolution, Integrative Biological Sciences (InBioS), Université de Liège, Liège, Belgium
- 29Scientific Websites and Application Team, Royal Belgian Institute of Natural Sciences, Brussels, Belgium
Large tropical trees are rightly perceived as supporting a plethora of organisms. However, baseline data about the variety of taxa coexisting on single large tropical trees are lacking and prevent a full understanding of both the magnitude of biodiversity and the complexity of interactions among organisms in tropical rainforests. The two main aims of the research program “Life on Trees” (LOT) are (1) to establish baseline knowledge on the number of eukaryote species supported/hosted by the above-ground part of a single tropical tree and (2) to understand how these communities of organisms are assembled and distributed on or inside the tree. To achieve the first goal, we integrated a set of 36 methods for comprehensively sampling eukaryotes (plants, fungi, animals, protists) present on a tropical tree. The resulting LOT protocol was conceived and implemented during projects in the Andean Amazon region and is proposed here as a guideline for future projects of a similar nature. To address the second objective, we evaluated the microclimatic differences between tree zones and tested state-of-the-art terrestrial laser scanning (TLS) and positioning technologies incorporating satellite and fixed base station signals (dGNSS). A marked variation in temperature and relative humidity was detected along a 6-zones Johansson scheme, a tree structure subdivision system commonly used to study the stratification of epiphytic plants. Samples were collected from these six zones, including three along the trunk and three in the canopy. To better understand how different tree components (e.g., bark, leaves, fruits, flowers, dead wood) contribute to overall tree biodiversity, we categorized observations into communities based on Johansson zones and microhabitats. TLS was an essential aid in understanding the complex tree architecture. By contrast, the accuracy of positioning samples in the tree with dGNSS was low. Comprehensively sampling the biota of individual trees offers an alternative to assessing the biodiversity of fewer groups of organisms at the forest scale. Large old tropical trees provide a wealth of microhabitats that encompass a wide range of ecological conditions, thereby capturing a broad spectrum of biodiversity.
1 Introduction
“A lifetime can be spent in a Magellanic voyage around the trunk of a single tree.”
Large old trees are keystone ecological structures (Tews et al., 2004), characterized by structural complexity that provides an extensive array of ecological niches and environmental resources (Lindenmayer and Laurance, 2017). On a global scale, the largest 1% of trees play a significant role in forest dynamics, contributing to half of the forest biomass and carbon in both primary and secondary forests (Lutz et al., 2018). They offer diverse microhabitats, including hollows and decaying wood (Remm and Lõhmus, 2011; Lindenmayer et al., 2012), water-retaining epiphytes (phytotelmata, Basham et al., 2022), trash-basket epiphytes (Eskov and Kolomeitseva, 2022), canopy soils (Lindo and Winchester, 2008), and create vertically stratified microclimatic conditions (Scheffers et al., 2013). Their extended lifespan, reaching up to 1,400 years for Amazonian trees (Chambers et al., 1998), promotes the colonization by a diverse array of organisms. Although the ecological importance of large old trees is acknowledged, there is limited knowledge regarding the diversity of organisms they can support at the individual scale.
Our present understanding of eukaryotic biodiversity (plants, fungi, animals, protists) at the level of individual trees is derived from a limited number of studies and is typically limited to a specific taxonomic group. Regarding vascular epiphytic plants, an influential investigation was conducted by Johansson (1974) in West Africa. He identified as many as 22 vascular species on a single tree and established a widely adopted stratification system of tree structure into five so-called Johansson zones (Zotz, 2007). Additional research has revealed varying richness on individual big trees, with studies indicating exceptionally high diversity in tropical premontane wet forests of Costa Rica (126 species, Schuettpelz and Trapnell, 2006) and Peruvian Andean forests (195 species, Catchpole and Kirkpatrick, 2010). In bryophytes, relatively few studies documented whole-tree species richness. The latter drastically varies among host-tree species identity and ecosystem types. In temperate forests and rainforests, around 10 species per tree were reported on beech and spruce (Boch et al., 2013), while 55 species were documented on an old Huon pine (Lagarostrobos franklinii) in western Tasmania (Jarman and Kantvilas, 1995). In mountain Costa Rican cloud forests, Sillett et al. (1995) observed up to 69 species, and in lower montane rainforests in Peru, Romanski (2007) found as many as 110 species. In the case of lichenized fungi, the highest number of lichen species ever recorded from one single tree came from an individual Elaeocarpus tree fallen during a recent storm in Papua New Guinea and on which a total of 173 species were found (Aptroot, 1997). Other studies have obtained a per-tree diversity of between 45 and 84 species in a lowland rainforest in Venezuela (Komposch and Hafellner, 2000), between 12 and 55 species in a tropical forest in French Guiana (Montfoort and Ek, 1990, in Gradstein, 1992) and 20–30 species in a mountain forest in Mexico (Córdova-Chávez et al., 2016). Studies on endophytic fungi from trees often aggregate results from multiple individuals. A total of 22 culturable fungal endophytes were found in the leaves of seven Guerea guidonia in Puerto Rico (Gamboa and Bayman, 2001) and 47 putative species were found in the leaves of 9 Hevea trees (de Oliveira Amaral et al., 2022). Additionally, a total of 115 endophytic fungal OTUs cultivated from leaves, stems and roots of 45 Hevea brasiliensis were identified to genus level (Araújo et al., 2020).
As far as animals are concerned, comprehensive surveys of invertebrates focused on individual trees are rare and tend to target specific biodiversity components such as vascular epiphytic plants, where as many as 47 ant species (DaRocha et al., 2015) and 99 spider species were documented (Méndez-Castro et al., 2018). In the seminal study that provided the basis for the first estimates of tropical arthropod species richness, Erwin and Scott (1980) found a maximum of 335 beetle species per tree of Luehea seemannii (Tiliaceae). Within vertebrates, certain species are well-suited for arboreal habitats, yet due to their mobility, studies typically assess their diversity on a broader scale than a single tree. Trees play a crucial role as resources for these species (Bütler et al., 2013), and they might modify their vertical distribution based on fine-scale environmental conditions (Basham et al., 2023). Protist communities in tree canopies remain understudied and to date have not been examined at the scale of individual trees (Carrias et al., 2012; Jauss et al., 2020; Walden et al., 2021).
While these investigations underscore the significance of exploring biodiversity at the level of individual trees rather than entire forests, as far as we know, none have endeavored to evaluate the maximum eukaryotic diversity that the above-ground part of a single tree can support. This can be explained by the various logistical and methodological obstacles associated with such an undertaking. The chosen tree must be as large as possible (i.e., emergent, among the trees in the region with the tallest and widest crowns), preferably with a wide geographic distribution (for the results to be relevant on a broad scale), contain a large number and diversity of microhabitats (e.g., vascular epiphytes), be in an environment undisturbed by human activity but close to an infrastructure that could be transformed into a field laboratory, present no danger to climbers (hardwood, absence of large social insect nests), be accessible at different seasons and in a zone where collection and export of biological organisms is allowed. From a human resources point of view, a wide range of expertise, both for collecting and for identifying organisms and analyzing results, needs to be assembled, coordinated and supported. However, recent advances in canopy access techniques and in overcoming the taxonomic impediment make this challenge more accessible than ever before (Cannon et al., 2021; Zamani et al., 2022).
The ambition of our Life on Trees (LOT)1 program is to (1) provide baseline data and assess thoroughly the maximum eukaryotic biodiversity that the above-ground part of a tree can host or support, as well as (2) understanding its distribution within the tree. In this paper, we present an integrated LOT protocol for investigating the biodiversity of individual trees. This protocol combines established morphological and molecular methods for studying the taxonomic diversity of all major eukaryotic arboreal organisms, as validated in three LOT projects. To contribute to the second objective, we evaluated the microclimatic differences between Johansson zones and tested state-of-the art Terrestrial Laser Scanning (TLS) and differential Global Navigation Satellite System (dGNSS) technologies to position samples, potentially at centimeter level, within the complex tree structure.
This marks an initial phase that may pave the way for examining the interactions among the collected organisms and the host tree, as well as interactions among the organisms themselves. It is important to note that the presence of certain organisms relies exclusively on the existence of the large old tree under study, serving as their habitat, shelter, and/or food source (e.g., endophytic fungi, mutualistic insects). Others may have a non-specific relationship with the host tree (e.g., a bryophyte species with low host specificity). Finally, a third category consists of simply visitors with no interaction with the tree (e.g., a bird just perching on a branch). We present here the range of methods for collecting or observing these 3 categories. The identification of the collected organisms for the LOT program is still an ongoing process, so the biodiversity results will be published later.
2 Materials and methods
2.1 Case studies: material and sites
In an endeavor to gauge the maximum biodiversity supported by the above-ground part of a tree, we positioned ourselves in one of the most biodiverse regions, situated along the eastern Andes cordillera connecting to Amazonia. The initial project unfolded in the lower Andean Amazon foothills in 2022, at an elevation of 400 m a.s.l. within the Río Abiseo National Park in Peru. The annual rainfall at the site is not known, but is probably higher than that of the nearby leeward town of Janjui (2,861 mm).2 We focused on investigating a 50 m-tall Dussia tessmannii (Fabaceae), designated as tree LOT01. It was located at coordinates 7.44822°S, 76.92285°W. Subsequently, in 2023, our project moved further up the Andes, situated at an elevation of 2,400 m a.s.l. within the Yanachaga-Chemillén National Park (3,247 mm/yr., Catchpole, 2012). This phase centered on examining a 32 m-tall Ficus americana subsp. andicola (Moraceae, LOT02) located at coordinates 10.54584°S, 75.35741°W, and utilizing a Beilschmiedia latifolia (Lauraceae) for support. The third tree, a Brosimum cf. utile (Moraceae, LOT03), standing at 40 m tall, was studied in 2024. It is located in the upper Andean Amazon foothills in Colombia (0.65550°N, 77.07306°W) within La Isla Escondida Nature Reserve (rainfall: 5064 mm recorded in 2023, J. Beckers, personal communication) at an elevation of 850 m a.s.l. The age of the trees studied is not known, and determining it is notoriously difficult for tropical trees. However, other studies recorded average maximum ages around 200 years and up to 414 years for tropical trees in Peru (Portal-Cahuana et al., 2023).
The methods presented here were tested during the three projects, but the results will only concern the biggest tree LOT01, chosen for illustrative purposes.
2.2 Canopy access
A new climbing system was devised to facilitate scientists’ access to the canopy. This system allowed them to reach a platform situated at the canopy’s center, 30 m above ground in the case of LOT01 (Figure 1 #08). Upon arriving at the site, the climbers install ropes on the top branches using a powerful catapult (“bigshot”). They then choose a clear spot to set up the platform, which is hoisted with vertical ropes and stabilized with lateral ropes. From this platform, scientists could either direct four skilled climbers for specimen collection or descend themselves to collect specimens along the trunk. The climbers were able to access almost the entire tree, except for the tips of the branches. During each field expedition, a series of eight 3-meter-long branch tips, distributed along eight cardinal directions (N, S, E, W, NE, SE, SW, NW), were collected (branch clipping method, Figure 1 #36). Using a rope, the branch tips were carefully lowered to the ground and then inspected in the laboratory. A minimum of 16 branches per tree were collected. Additional branches were collected opportunistically when an interesting organism (e.g., an orchid) beyond the reach of direct collection was detected by binoculars. The entire tree was thus explored. The ascension system comprised a large wheel functioning as a pulley, positioned below a high branch. A rope was looped around the wheel, connected to a boat winch (Harken Riggers 750) operated by a powerful cordless drill (DeWalt 18 V 5 Ah) (Figure 1 #07). This configuration enabled the effortless ascent for a person wearing a harness and facilitated the descent of samples.
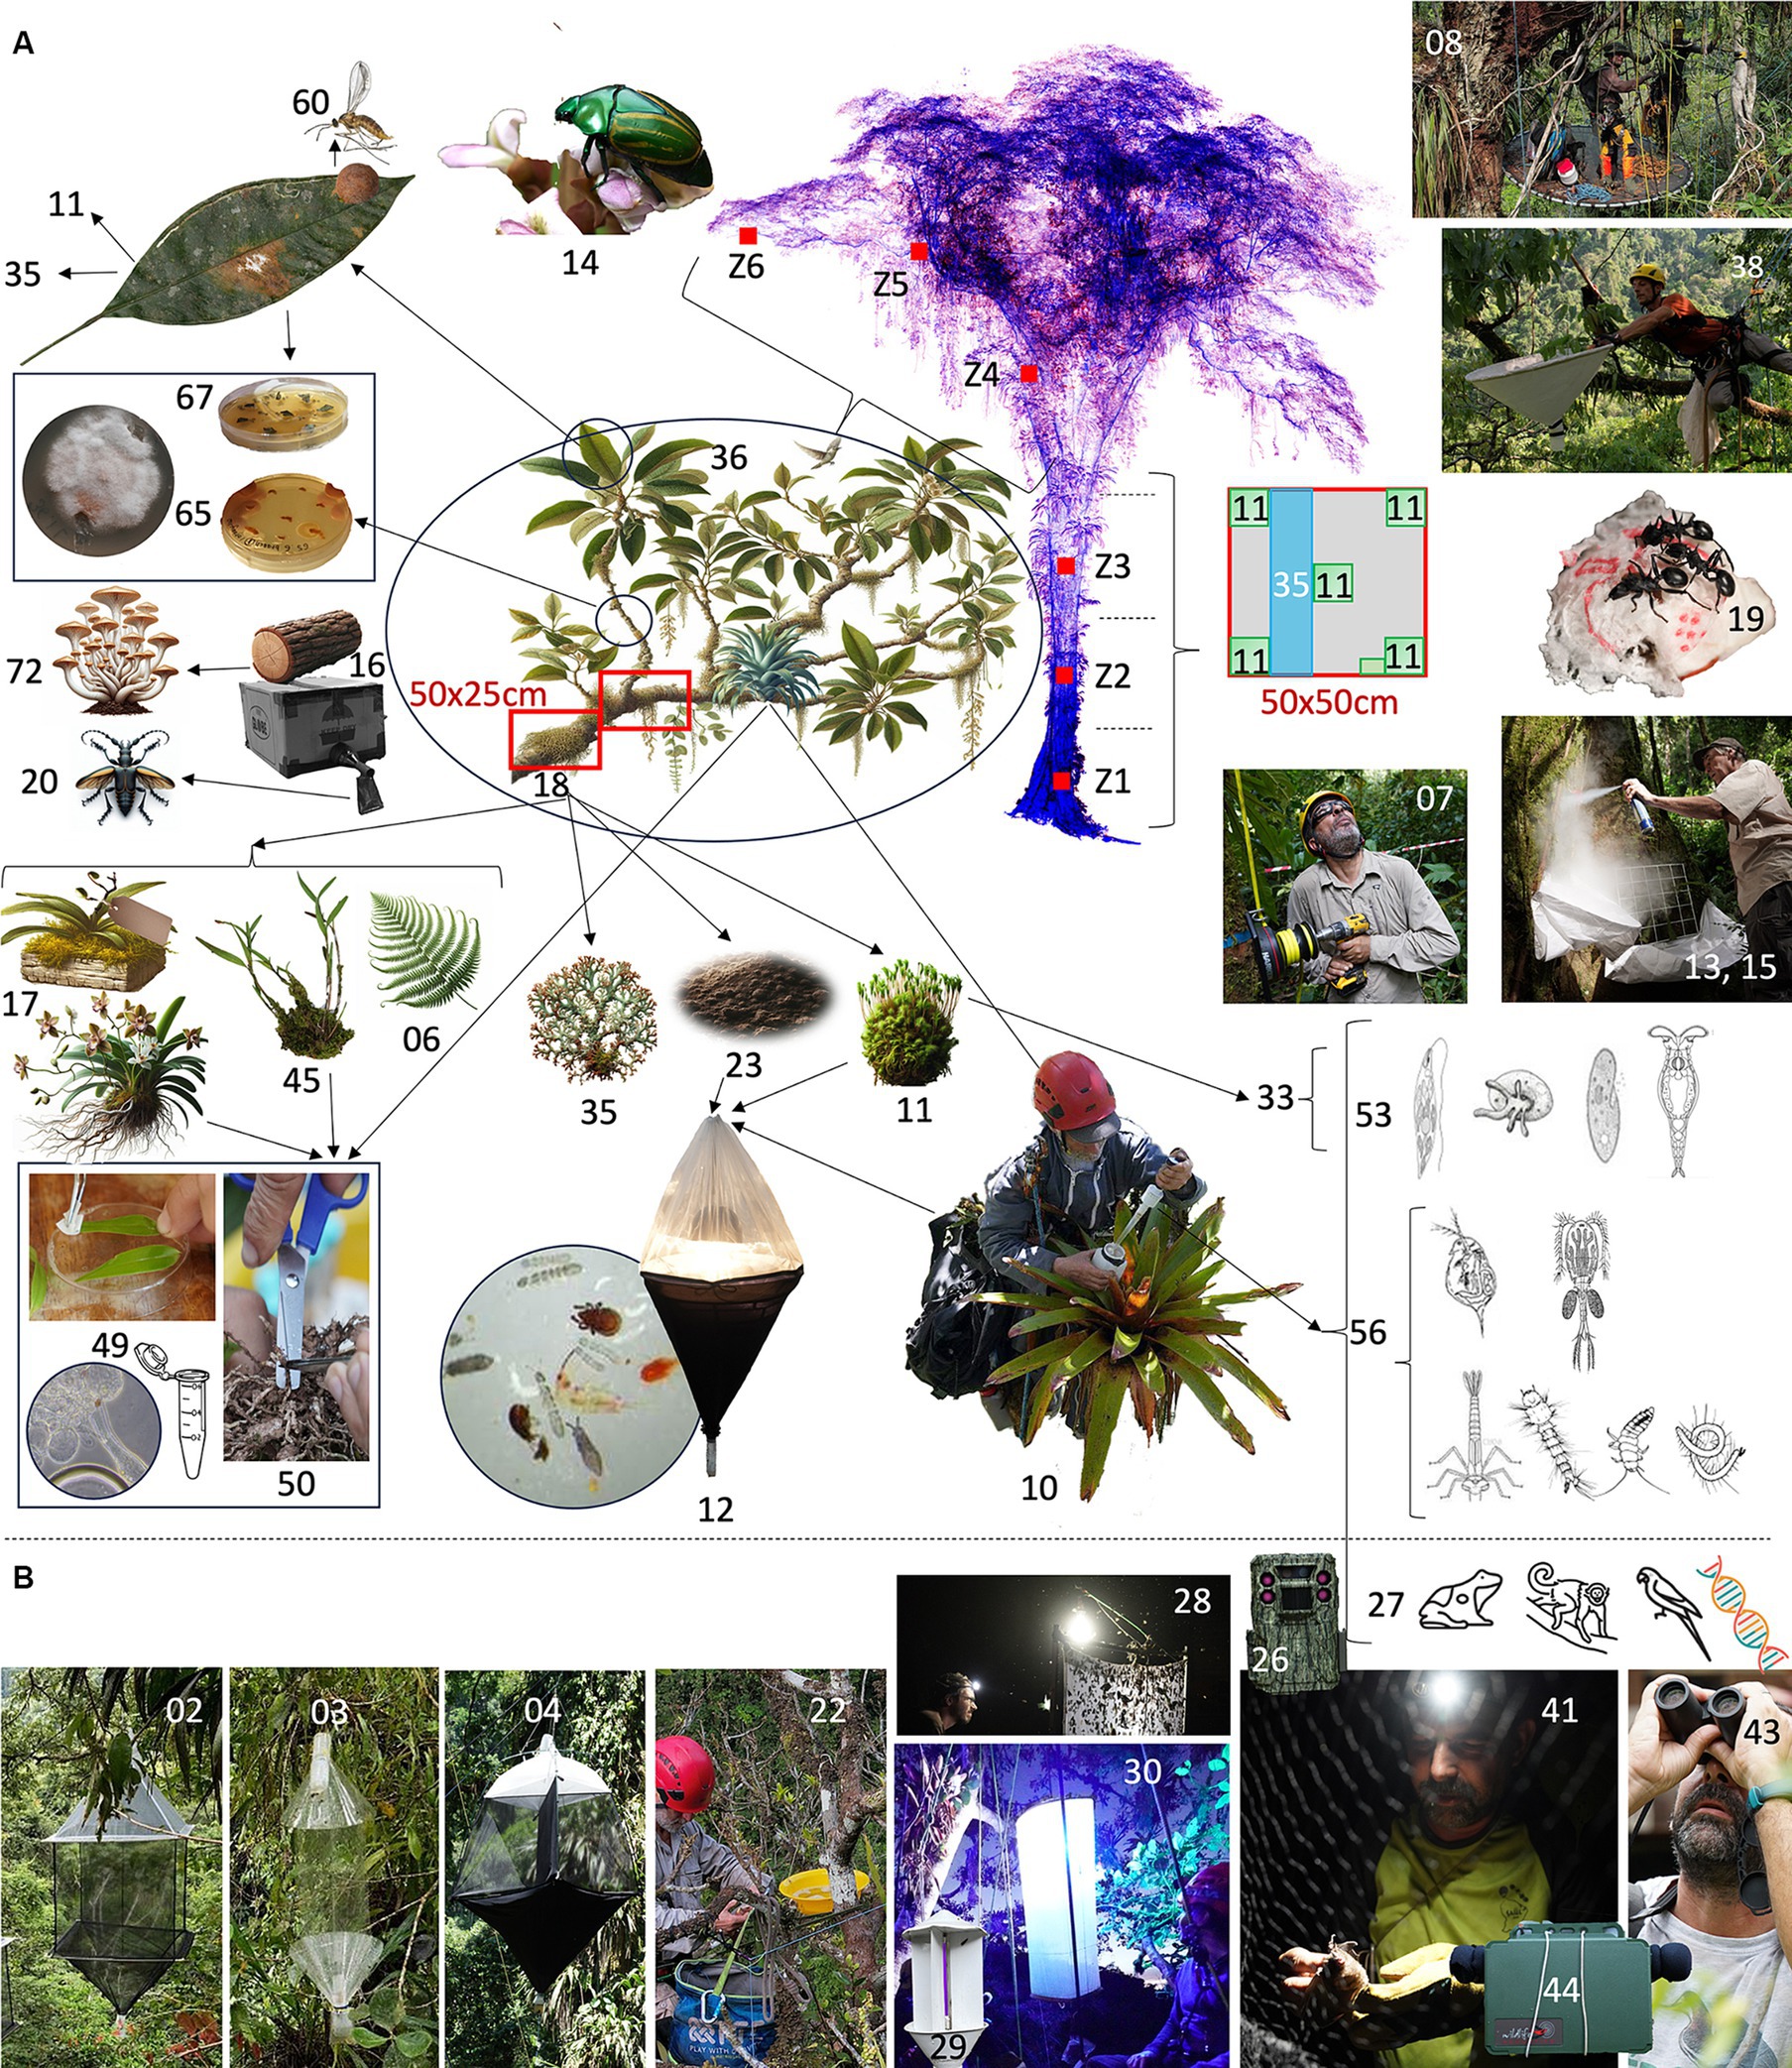
Figure 1. LOT protocol for studying eukaryotes in trees. Integration and nestedness (shown with arrows) of the 36 sampling methods used to collect the main eukaryote groups found on the above ground part of the target tree. Two methods of canopy access were utilized to facilitate scientists’ reach to the tree top: [07] an electric winch and [08] a platform. The study tree was divided in 6 Johansson zones (Z1–Z6). Samples were located and collected within each of these zones. (A) Methods used to collect organisms with no (sessiles) or low mobility: [06] pteridophytes, [10] water-tank bromeliads, [11] bryophytes, [12] micro-arthropods (Berlese extractor), [13] bark-dwelling organisms (insecticide spray), [14] invertebrates (hand-collection), [15] invertebrates (insecticide fogging), [16] organisms living on deadwood (rearing in cardboard boxes), [17] orchids (kept in a nursery until fertile), [18] epiphytes (clumps), [19] arboreal-dwelling ants (baits), [20] xylophagous insects, [23] suspended arboreal soil, [33] protists found within the water film covering bryophytes, [35] lichens (either corticolous, in 50 × 10 cm quadrats or epiphyllous, on tree or epiphyte leaves), [36] organisms living on a tree branch (branch clipping), [38] invertebrates living on the tree foliage (vegetation beating), [45] vascular epiphytes, [49] fungi on epiphytes leaves or [50] roots, [53] protists and [56] small invertebrates living in bromeliad water tank, [60] galls, [65] endophytic microfungi living inside tree wood or [67] tree leaves, [72] macrofungi growing on dead wood. (B) Methods used to collect organisms capable of long-distance movement: [02] Flying insects collected using either a Sante-type canopy trap, [03] a Wilkening-type polytrap, [04] a SLAM trap equipped with a bottom collector, or [22] a pan or light traps with [28] mercury lamp, [29] Neon UV, [30] LepiLED. Vertebrates [26] detected either with a camera trap, or [27] DNA traces in the water of bromeliads (eDNA), [41] capture-release with bat nets, [43] observed with binoculars and [44] recorded with an audio recording device. For further explanations, see text. The numerical method identifiers presented here were utilized as a prefix for the sample codes and do not adhere to any specific logic. Image credits: all photos by ML, drawings 06, 11, 17, 23, 35, 36 generated by Open AI DALL·E, TLS scan from BDH, other drawings come from open sources or JFC laboratory.
2.3 Spatio-temporal sampling
We implemented a zonation system derived from Cornelissen and ter Steege (1989), encompassing six zones instead of the initial five proposed by Johansson (1974). This system further divides the trunk into three zones. Zone 1 encompasses the basal part of the trunk, possibly including buttresses, until the trunk diameter stabilizes. Progressing upward and following branching patterns, the canopy is divided into a lower zone housing the primary branches (zone 4), transitioning into a middle zone (zone 5), and finally an upper canopy zone (zone 6) supporting the low diameter foliage branches (see Figure 1 Z1–Z6) (Normann et al., 2010). Widely employed for studying the distribution of epiphytes, this classification system enables comparisons between studies. However, its applicability to other eukaryotic groups is yet to be assessed.
Sampling efforts were focused on two periods, one towards the conclusion and the other at the commencement of the rainy season (April–May and September–October 2022 in the case of LOT01). Throughout these sessions, teams comprising 4 to 5 specialists for each main eukaryotes alternated in leading intensive sampling periods for their respective taxa. These teams were assisted by a group of 4 professional climbers. Nevertheless, certain sampling activities extended over several months or even a year, executed by park rangers or local experts (refer to §2.5.4.1.7 and §2.5.4.2.1).
2.4 Environmental data
2.4.1 Temperature and relative humidity
We placed Tinytag View 2 temperature and relative humidity data loggers with external probes along the trunk, in the middle of each of Johansson’s zones. The programmed interval was 5 min. Measurements were taken on LOT01 between August 29 and October 7, 2022.
2.4.2 Terrestrial laser scans and sample location
2.4.2.1 Terrestrial laser scanning (TLS) and dGNSS positioning
Terrestrial laser scanning (TLS) is the current state-of-the-art technology to accurately capture the 3D structure of forests, enabling the extraction of detailed structural information including tree dimensions, tree above ground biomass, gap fractions and leaf densities (Calders et al., 2020). TLS operates by emitting laser pulses at a high frequency. If it strikes an object, the distance between the laser scanner and the object can be determined based on the time of return of the reflected pulse. By aligning multiple scans from multiple locations, a point cloud of the environment is obtained. The quality of this point cloud depends on the scanner quality, the distance to the object of interest, the weather at the time of scanning and the forest complexity (Terryn et al., 2021). Tropical forests are very complex sites, often featuring multi-layered canopies and tall tree heights. Scanning from the ground, at a considerable distance from the canopy’s top, thus results in a less dense point cloud (due to the beam divergence of the instrument) and occlusion in the upper canopy due to plant material blocking the direct view between the scanner and plant material in the top of the canopy. A general idea of crown dimensions and biggest branches can be derived, but very detailed information on smaller branches and vegetation inside trees can be challenging to derive. To overcome this problem, the TLS scanner was installed, for the first time, at various points inside the tree crown (Calders et al., 2020) (D’hont et al., in preparation)4.
A 3D point cloud of the LOT01 tree was generated using a RIEGL VZ-400 from 23 ground locations, encompassing a zenith angle range of 30–130 degrees in the upright position. Additionally, for 12 of these locations, we obtained an extra 90-degree tilted scan to capture the complete hemisphere. After data analysis, 11 additional scans were acquired closer to the base of the tree to ensure a thorough capture of the buttress and the above-ground root system. To minimize occlusion of the top of the canopy, we added 2 scan locations at 35.5 m above ground. Eventually, 35 scans from the ground were used to create the 3D point cloud, and four were used from the canopy.
Reflective targets were used to co-register all the single scans into a single point cloud using Riegl’s RiSCAN PRO software package. We further refined the registration using the multi station adjustment (MSA) tool in RiSCAN PRO (version 2.15), in which the distance between overlapping areas is minimized using plane patches derived from the single scans.
The sample locations were georeferenced using a base rover set up using two Emlid Reach RS2+ GNSS receivers. The base station was located on a slope near the tree and was visible in the TLS point cloud. The requirement of a completely open area with clear sky view was, however, unattainable. The base station sent out Real Time Kinematic (RTK) corrections using LoRa to the receiver (rover), enabling (in theory) submeter georeferencing. The rovers were carried in a bag on the climbers’ backs. The climbers remained motionless at the sample collection point, while an operator on the ground triggered the measurement of the location via the EMLID ReachView software and a local Wi-Fi connection.
The point cloud and the sampling locations were then aligned in RISCAN PRO (version 2.15) (RIEGL, n.d.), on the basis of the location of the base station.
We calculated the functional diameter above buttress (fDAB), tree height and projected crown area (CA) using the R package ItsMe (Terryn et al., 2023). To calculate the functional diameter above the buttresses (fDAB), we calculated the diameter of a circle with an area equal to the area of the concave hull (concavity = 4) constructed on a horizontal slice of 6 cm above the buttress. Tree height was calculated as the height difference between the highest and the lowest point of the point cloud, and crown area was calculated as the area of a concave hull (concavity = 2) around the X, Y coordinates of the point cloud (Terryn et al., 2022).
2.4.2.2 Plumb line method
This method requires two operators. From the location where the sample was collected, the climber lowered a weighted measuring tape down to ground level and noted the vertical distance (VD). On the ground, from the point of impact of the weight, another operator aims at the center of the trunk to obtain the horizontal distance (HD – R) between the trunk surface and the weight. To this distance was added the average radius of the trunk at human height (R), deduced from the circumference of the tree at that height. The azimuth (varying between 0 and 360°) was also measured with a Trupulse® 360R rangefinder. The combination of the three values (VD, HD, and AZ) allowed for locating the sample in a three-dimensional space relative to the center of the trunk.
2.5 Sampling methods
2.5.1 Integrated, nested, multi-taxa sampling methods
During the LOT program, we endeavored to integrate various methods as much as possible in order to collect the widest range of organisms within the same sampling units. These methods are presented in detail below, for each main eukaryote group and illustrated in Figure 1.
2.5.2 Plantae (epiphytes)
2.5.2.1 Vascular
Lineages of vascular plants considered for sampling included ferns and lycophytes (Figure 1 #06) and angiosperms (#45) with a special focus on orchids (#17). Given preliminary empirical observations that these plants vary widely in size (from hidden in mosses to spotted from afar with the naked eye) and frequency (from ubiquitous to one or two individuals on the tree), two distinct and complementary sampling methods were conducted: (i) epiphyte clump collection; and (ii) selective collection. For the epiphyte clump collection from branches or trunk, clumps were defined as any contiguous group of epiphytes (or rarely a single plant) separated by bark devoid of vascular plants (Catchpole, 2004). The clump sampling area was limited to 50 × 25 cm (#18) and in the case of larger patches of continuous epiphytic vegetation, subdivisions were made into clumps of this size. Selective collection entailed the removal of individual plants of interest, such as new morphospecies, fertile specimens, parasitic plants and water-tank bromeliads (#10).
Within one given clump, species (or morpho-species) were listed and the number of individuals for each species or morpho-species recorded; rhizomatous or clumping patches of one species were counted as one individual, following the method of Sanford (1967). One modern collection (Gaudeul and Rouhan, 2013) was collected for each fertile morpho-species, including a high-resolution image of the living plant, herbarium voucher for later identification to species, and a silica-dried leaf piece for DNA analyses. Voucher specimens were deposited in local and foreign herbaria. In the case of sterile orchids, collected live plants were transferred to a nursery and maintained until flowering (#17).
2.5.2.2 Non vascular: bryophytes
The sampling protocol for bryophytes is most similar to the one employed for lichens (see §2.5.3.1), allowing cross-comparisons among these groups that share a number of similarities in terms of ecophysiology (poikilohydry), dispersal capacities (wind-dispersed diaspores) and hence, habitat preferences. To organize a sampling that captures the architectural heterogeneity of a tree and allows for an assessment of species frequencies and of the degree of completeness of the inventory, we implemented a hierarchical stratified design as follows. For each Johansson zone (Figure 1 Z1–Z6), 8 plots of 50 × 50 cm were sampled (Figure 1 #11). Each plot comprised five 10 × 10 cm sub-plots, located at the four corners and the center of the plot. Although cardinal orientation typically plays a limited role in explaining variation in epiphytic community composition in tropical rainforests (Song et al., 2011), plots located on the trunk (Z1–Z3) were regularly placed around the circumference to take potential variation due to exposure into account. For plots located in the canopy (Z4–Z6), plots were located on different main branches (Z4) that subsequently ramified into smaller branches (Z5) and branchlets (Z6). When a branch was too narrow to allow this, sub-plots were organized linearly along the branch (Z5). At zone Z6, a surface of 500 cm2 of branchlets, plus any leaves attached to them, was surveyed. Due to the difficult access to the outer canopy, sampling at Z6 was performed by cutting the target branches and studying them at the laboratory. Within each subplot, a complete species inventory was conducted. Representative specimens of each species were sampled in each sub-plot for subsequent identification in the laboratory using microscopic techniques. This systematic sampling was completed by the qualitative survey of samples made for other organisms, and in particular, epiphytes on orchids, ferns, and bromeliads (§2.5.2.1), as well as samples from the Berlese traps (§2.5.4.1.6, see below). A small 5 × 10 cm quadrat was also taken from the main quadrat to study moss-dwelling protists (§2.5.5).
2.5.3 Fungi
2.5.3.1 Lichenized fungi
The diversity of lichen species on a single individual tree was studied using a quadrats system. The division of a tree into six Johansson height zones was already applied in other lichen studies (e.g., Cornelissen and ter Steege, 1989; Komposch and Hafellner, 2000). Sampling quadrats of 50 × 10 cm using transparent plastic sheets were placed vertically at each cardinal point (N, E, S, W) as described by Asta et al. (2002) but without dividing the quadrats into smaller units (Figure 1 #35). In total, a minimum of 8 quadrats were placed per height zone, or more depending on available fieldwork time. Every distinct corticolous lichen species per quadrat was collected (Figure 2A); macrolichens were easily scraped from the bark surface, while the bark itself needed to be peeled for collecting the crustose lichens, using a knife with a rather thin blade (e.g., Opinel), with voucher specimens placed in paper envelopes. When epiphytic plants were present in the quadrats, the leaves having foliicolous lichens were also collected. Terminal branches (zone 6 in the canopy) were cut from each cardinal direction (N, E, S, W) by the climbers, and lowered gently with ropes to prevent damage and loss of species. Twigs and thin branches were placed side by side (richest side turned above) to cover the surface of a plot. When lichens were also present on the tree leaves (Figure 2B), for each of the lowered branches, the two biggest leaves of the first lateral branch were collected, then the two biggest leaves of the second lateral branch, etc. for a total of 10 leaves per branch. The samples were air-dried or sometimes dried using an oven or using a press for the leaves of vascular plants having foliicolous species. The corticolous samples were stored in paper envelopes (allowing them to further dry if needed; important for avoiding moisture) or in plastic bags using silicagel.
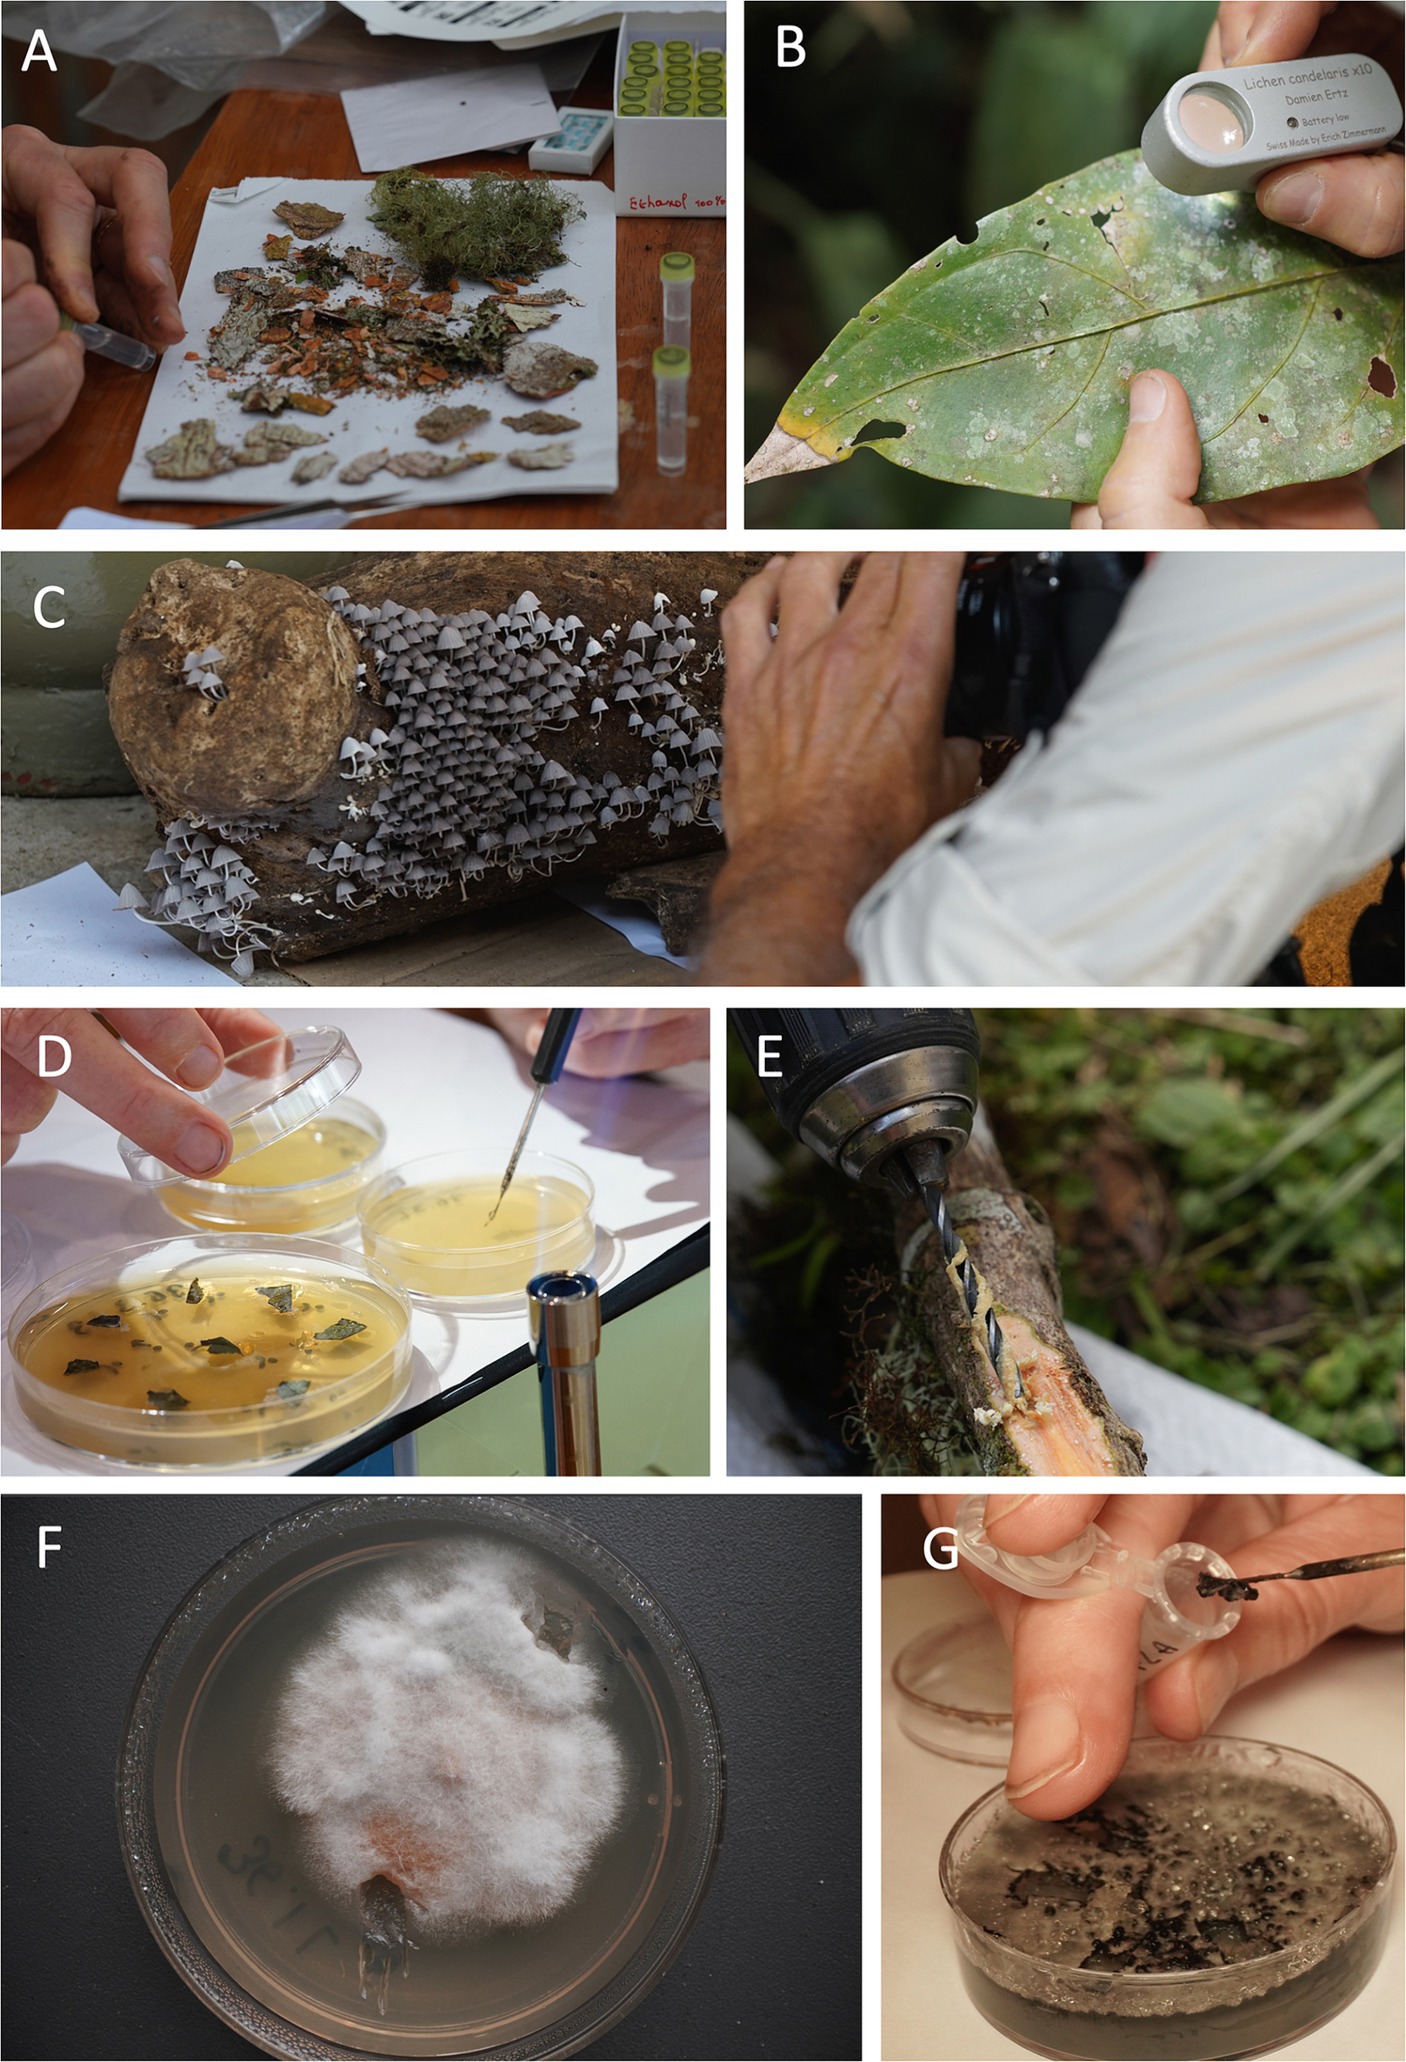
Figure 2. Methods used to study fungi: (A) lichens on bark, (B) lichens on leaves, (C) macro-fungi on dead wood, endophytes (D) from leaves or (E) from tree wood, (F) isolated in culture and (G) preserved in CTAB for genetic analysis. Image credits: all photos by ML.
Tiny pieces of every morphospecies were placed in 1.5 mL Eppendorf tubes containing a solution for long term preservation of the DNA (CTAB or ethanol) for DNA barcoding (Figure 2A); or “fresh” air-dried duplicates were frozen less than three months after the collection.
2.5.3.2 Macroscopic non-lichenized fungi
Two complementary approaches were followed. Firstly, a direct procedure was employed involving collecting fungi directly from the living tree, whose advantage is also the collection of the fungi growing on epiphytes, mosses etc., and on or in accumulations of soil and other plant material. Secondly, an indirect procedure was employed involving the collection of fungi on dead wood parts sampled from the tree 4–5 months prior for insect rearing boxes (§2.5.4.1.7), which at the end of the rearing process had been removed, placed in the open air and exposed to rains (Figure 1 #72). After a few days, fruiting bodies appeared (Figure 2C).
Both procedures are similar once the actual collecting is accomplished: before drying the fungi for conservation and later study, these need to be documented (notes on important fresh features, smell, taste, taking spore prints overnight), abundantly illustrated (photographs of all parts) and sampled for future sequencing (tissue in CTAB). For more information on collecting fungi and related aspects, see Buyck et al. (2010).
2.5.3.3 Microscopic non-lichenized endophytic fungi
The cultivable part of the fungal community associated with the tree was isolated from leaves and wood collected by professional climbers (Figure 1 #67,65). Leaves were collected from six canopy branches (6–8 leaves per branch in different terminal shoots) and their surface carefully cleaned by hand under tap water (Pietro-Souza et al., 2017; Ibrahim et al., 2021). Leaf parts (3 × 1 cm) were cut from different parts of each leaf and their surface sterilized for 45 s by immersion in 75% EtOH. All handling of harvested material was carried out near a Bunsen burner to create a sterile zone. Once the leaf fragments were dry, they were divided into four to eight smaller fragments (2 × 8 mm) and spread equidistantly over the surface of a Petri dish (Ø 9.4 cm/8 fragments per Petri dish) containing potato dextrose agar (PDA, Difco; Dos Reis et al., 2022) amended with aureomycin ([a], 12.5 mg L−1 to avoid co-culture of bacteria) (Yao et al., 2019) (Figure 2D). Wood sampling was performed using an electric drill fitted with a drill bit (Ø 3.5 mm), the surface of which had been sterilized with 80% ethanol. Before drilling into the wood, the bark was locally removed with a knife to sample the living wood (Figure 2E). Wood samples from each height zone of the tree (4–8 samples per zone, Figure 1) were obtained by rotating the drill very slowly when pulling it out of the wood. This allows for the coiled pieces of wood (3 cm long) to remain attached to the drill bit without falling apart, which is important to avoid the mixing of fungal species before plating. A separate drill bit was used for each wood sample which was then directly placed into a sterile plastic bag, carefully rolled to prevent the fragmentation of the wood coils. The drill bits carrying the wood samples were then transported to base camp as quickly as possible (a few hours) where they were each individually placed in a sterile empty Petri dish. The wood coil could then be delicately detached from the drill bit and, using sterilized tweezers, cut into fragments 0.6–0.8 mm long, which were then transferred onto a Petri dish (Ø 9.4 cm; 8 sub-samples per plate) containing PDAa medium. All inoculated plates were sealed and left under ambient conditions of daylight and temperature. Using this procedure, the fungal community associated with the wood of LOT01 was consistent with the study of Martin et al. (2015) who retrieved a significant proportion of Basidiomycota (e.g., several species of Coprinellus) from sap vessels.
Starting 48 h after inoculation until the end of the expedition, plates need to be inspected at least twice daily for growth of endophytes. Fungi are transferred to a new Petri dish (Ø 6 cm; PDAa) as soon as a mycelial zone of 2 mm is visible in the agar medium (Figure 2D). As each 9.4 cm Ø dish contained 8 leaf or wood fragments, the fragments from which no fungi had yet emerged need to be transferred onto a new plate as soon as one or more endophytes start to spread rapidly. Once the mycelium of a particular endophyte is sufficiently developed, 50–70 mg of fungal tissue is sampled and placed in cetyl-trimethyl-ammonium bromide (CTAB 1x; Mavrodiev et al., 2021) (Figure 2G). Fungal cultures that are still insufficiently developed at the end of the field work need to be transported to continue their development elsewhere under laboratory conditions. As most endophytes start growing between two and five days after inoculation (Figure 2F), care should be taken that leaf and wood fragments are not all harvested and plated on Petri dishes on the same day, unless two or more persons can be dedicated to the transfer of the emerging fungi. The number of people dedicated to the transfer of endophytes determines the size of the sampling.
Most endophytic fungi do not reproduce sexually in vitro, while most of the morphological characters allowing for their identification are observable only on the sexual morph. Consequently, identification of fungal endophytes usually relies on sequence-based identification using internal transcribed spacers (ITS, see details in Supplementary material S1.1).
2.5.3.4 Fungi associated to epiphyte plants
The most common epiphytic plant species were sampled from various parts of the tree crown and geolocalized. Our focus was on the fungal communities present on both roots and leaves surface, as well as inside the plant tissues. For each epiphytic plant, we sampled some roots in different parts of the root system (Figure 1 #50), as well as a young fully expanded leaf and an old leaf (Figures 1 #49, 3A). Some fully expanded young and old leaves of the host tree were also sampled. For large leaves, we took a subsample of 12 cm2, while for small leaves, we collected several young and old leaves to achieve the same surface area.
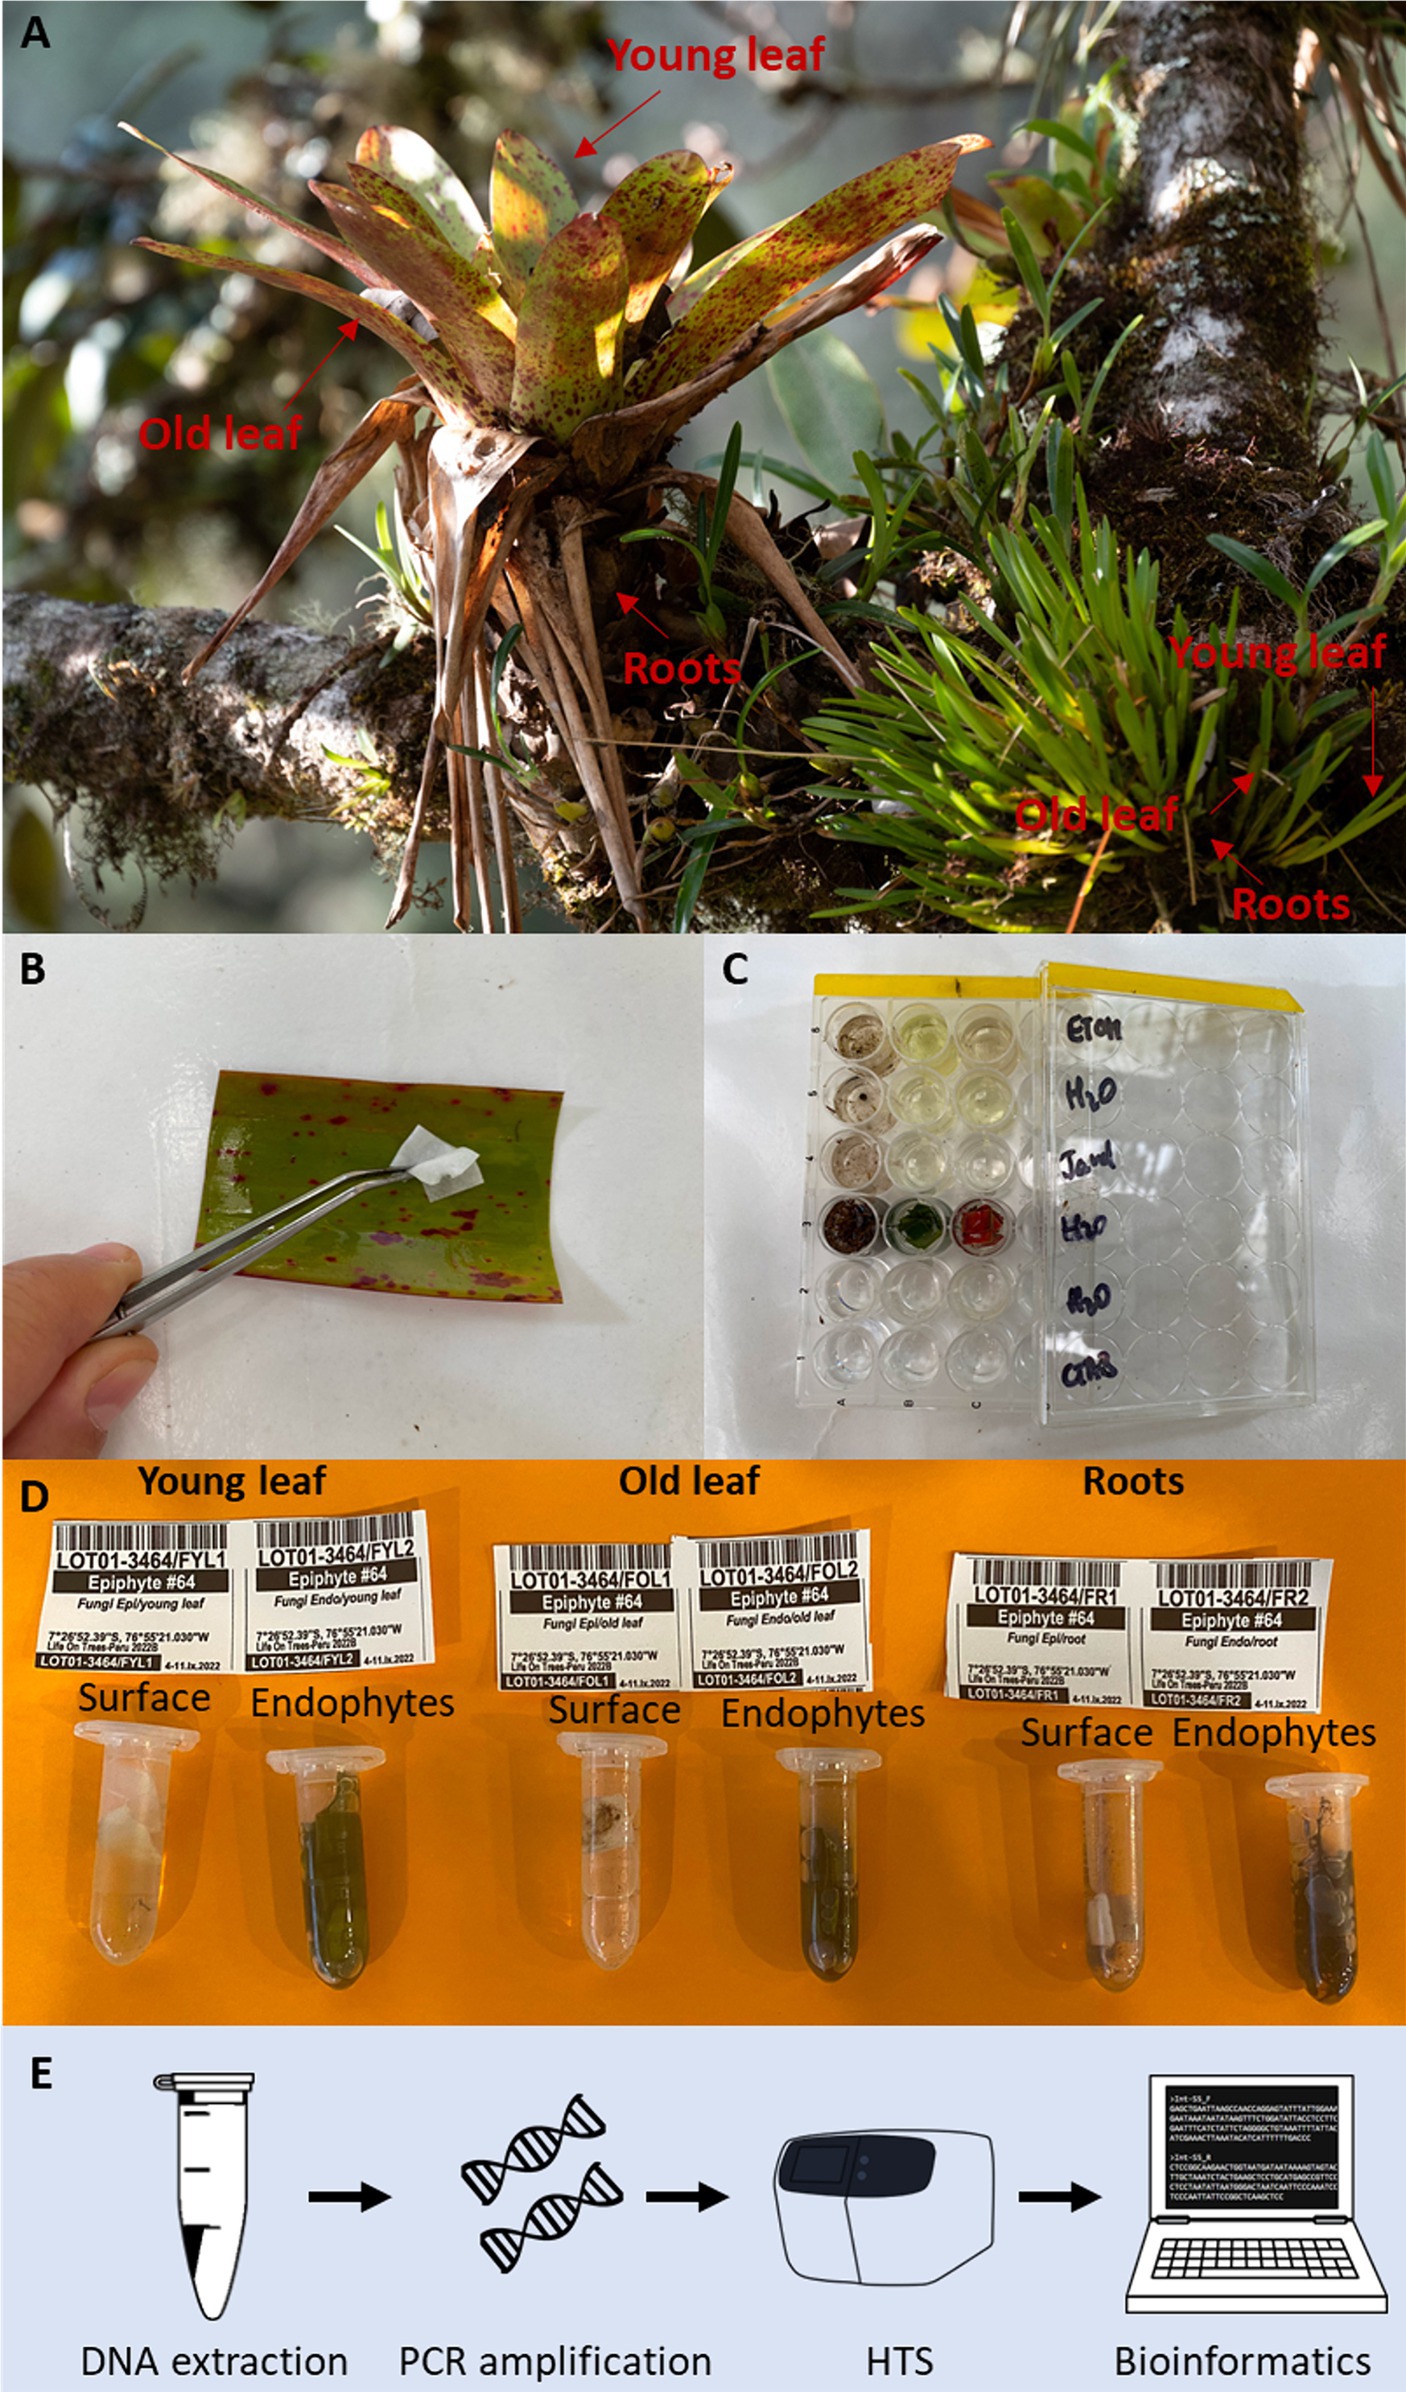
Figure 3. Procedure for isolating surface and endophytic fungi in epiphytic plants. (A) For each individual epiphytic plant, a young fully expanded leaf, an old leaf, and different parts of the root system were sampled. (B) Sampling of microfungi from the surface of the leaf was done using a piece of Whatman paper previously soaked in sterile CTAB buffer. (C) Surface sterilization for endophyte isolation by dipping the tissue portions successively into 70% ethanol, sterile water, 9% sodium hypochlorite, and then washing them twice in sterile water, and finally they were immersed in a sterile CTAB buffer. (D) DNA preservation was carried out in sterile Eppendorf tubes with CTAB buffer. (E) DNA metabarcoding workflow. Image credits: (A) Charlie Delhumeau, (B–D) CL.
First, we collected microfungi from the surfaces of the roots and leaves. We carefully wiped all root surfaces and the whole upper and lower surfaces at each leaf or leaf portion with a piece (1 × 3 cm) of Whatman® paper (Figure 3B), which has been sterilized by autoclaving (120°C, 20 min), and then soaked it in sterile CTAB buffer (2% cetyl trimethylammonium bromide, 1% polyvinyl pyrrolidone, 100 mM Tris–HCl, 1.4 M NaCl, 20 mM EDTA) in 2 mL sterile Eppendorf tubes. Next, the plant tissues were surface sterilized using widely used ethanol and sodium hypochlorite sterilant for endophytes isolation (Sahu et al., 2022). The roots and the leaves were surface sterilized by dipping the tissue portions successively into 70% ethanol, sterile water, and 9% sodium hypochlorite (i.e., commercial bleach) for 1 min each (Figure 3C). Subsequently, the leaf and root portions were washed twice in sterile water, each time for 1 min, and finally immersed for 1 min in a sterile CTAB buffer. The sterilized samples were then stored in 2 mL Eppendorf in sterile CTAB buffer to preserve DNA for a long term for subsequent metabarcoding (Figure 3D). To assess the effectiveness of the sterilization in removing fungi from the surface of the leaves and roots, the final rinse in the CTAB buffer from some samples was saved and used as a sterilization control. Before DNA extraction, the CTAB buffer was removed from all tubes containing either Whatman papers or plant organs. Leaves and roots were then freeze-dried (Alpha 1–2 LD; Christ) and ground to a fine powder in a Retsch MM301 Mixer Mill. A 50-mg dry weight subsample of roots and leaves was used for DNA extraction (Figure 3E). DNA was extracted using a CTAB extraction method and identification of fungi relied on sequence-based identification using ITS (see Supplementary material S1.2 for details).
2.5.4 Animalia
A large array of complementary sampling methods was used to collect or observe animals in the tree. A double approach, based on morphology and/or genetic analyses is used to identify them.
2.5.4.1 Methods targeting tree microhabitat invertebrates
2.5.4.1.1 Bark, leaves, flowers, fruits: hand collecting
The insects collected by hand on the tree (e.g., on flowers, Figure 1 #14) were placed individually in labeled vials indicating the date, host plant and zone of capture. The sampling effort was not quantified; these were opportunistic collections to complete the species list and document species resource use.
2.5.4.1.2 Bark and leaves: fumigation
Fumigation was used at two scales: the canopy and trunk (fogging method), and a small area of bark (bark spray method) (Figure 1 #13,15). To avoid interference between the two methods, barkspray was carried out before fogging and during a different field campaign (Table 1). The fogging method involved dispersing a cloud of insecticide over the tree’s crown and trunk (Adis et al., 1998; Floren, 2010). The pyrethroid insecticide (Permethrin 2% diluted in BioEco Neb white oil, 4 L per tree) used is a synthetic insecticide inspired by pyrethrins, a natural insecticide derived from chrysanthemum flowers. It has a knock-down action on arthropods and can have negative effects on aquatic organisms, including amphibians, but has low toxicity to mammals (Ranatunga et al., 2023). The fogging machine used was a Swingtec Swingfog® SN-50 suspended from a rope installed on a summit branch. The machine travels up and down the tree, whirling and dispersing the solution. Around the base of the tree, 4 × 5 m tarpaulins arranged in concentric circles were used to collect arthropods. Targeted fumigation by Johansson zone was not feasible. However, where possible, a 4 × 10 m tarpaulin was placed just below the canopy to collect arthropods more selectively.
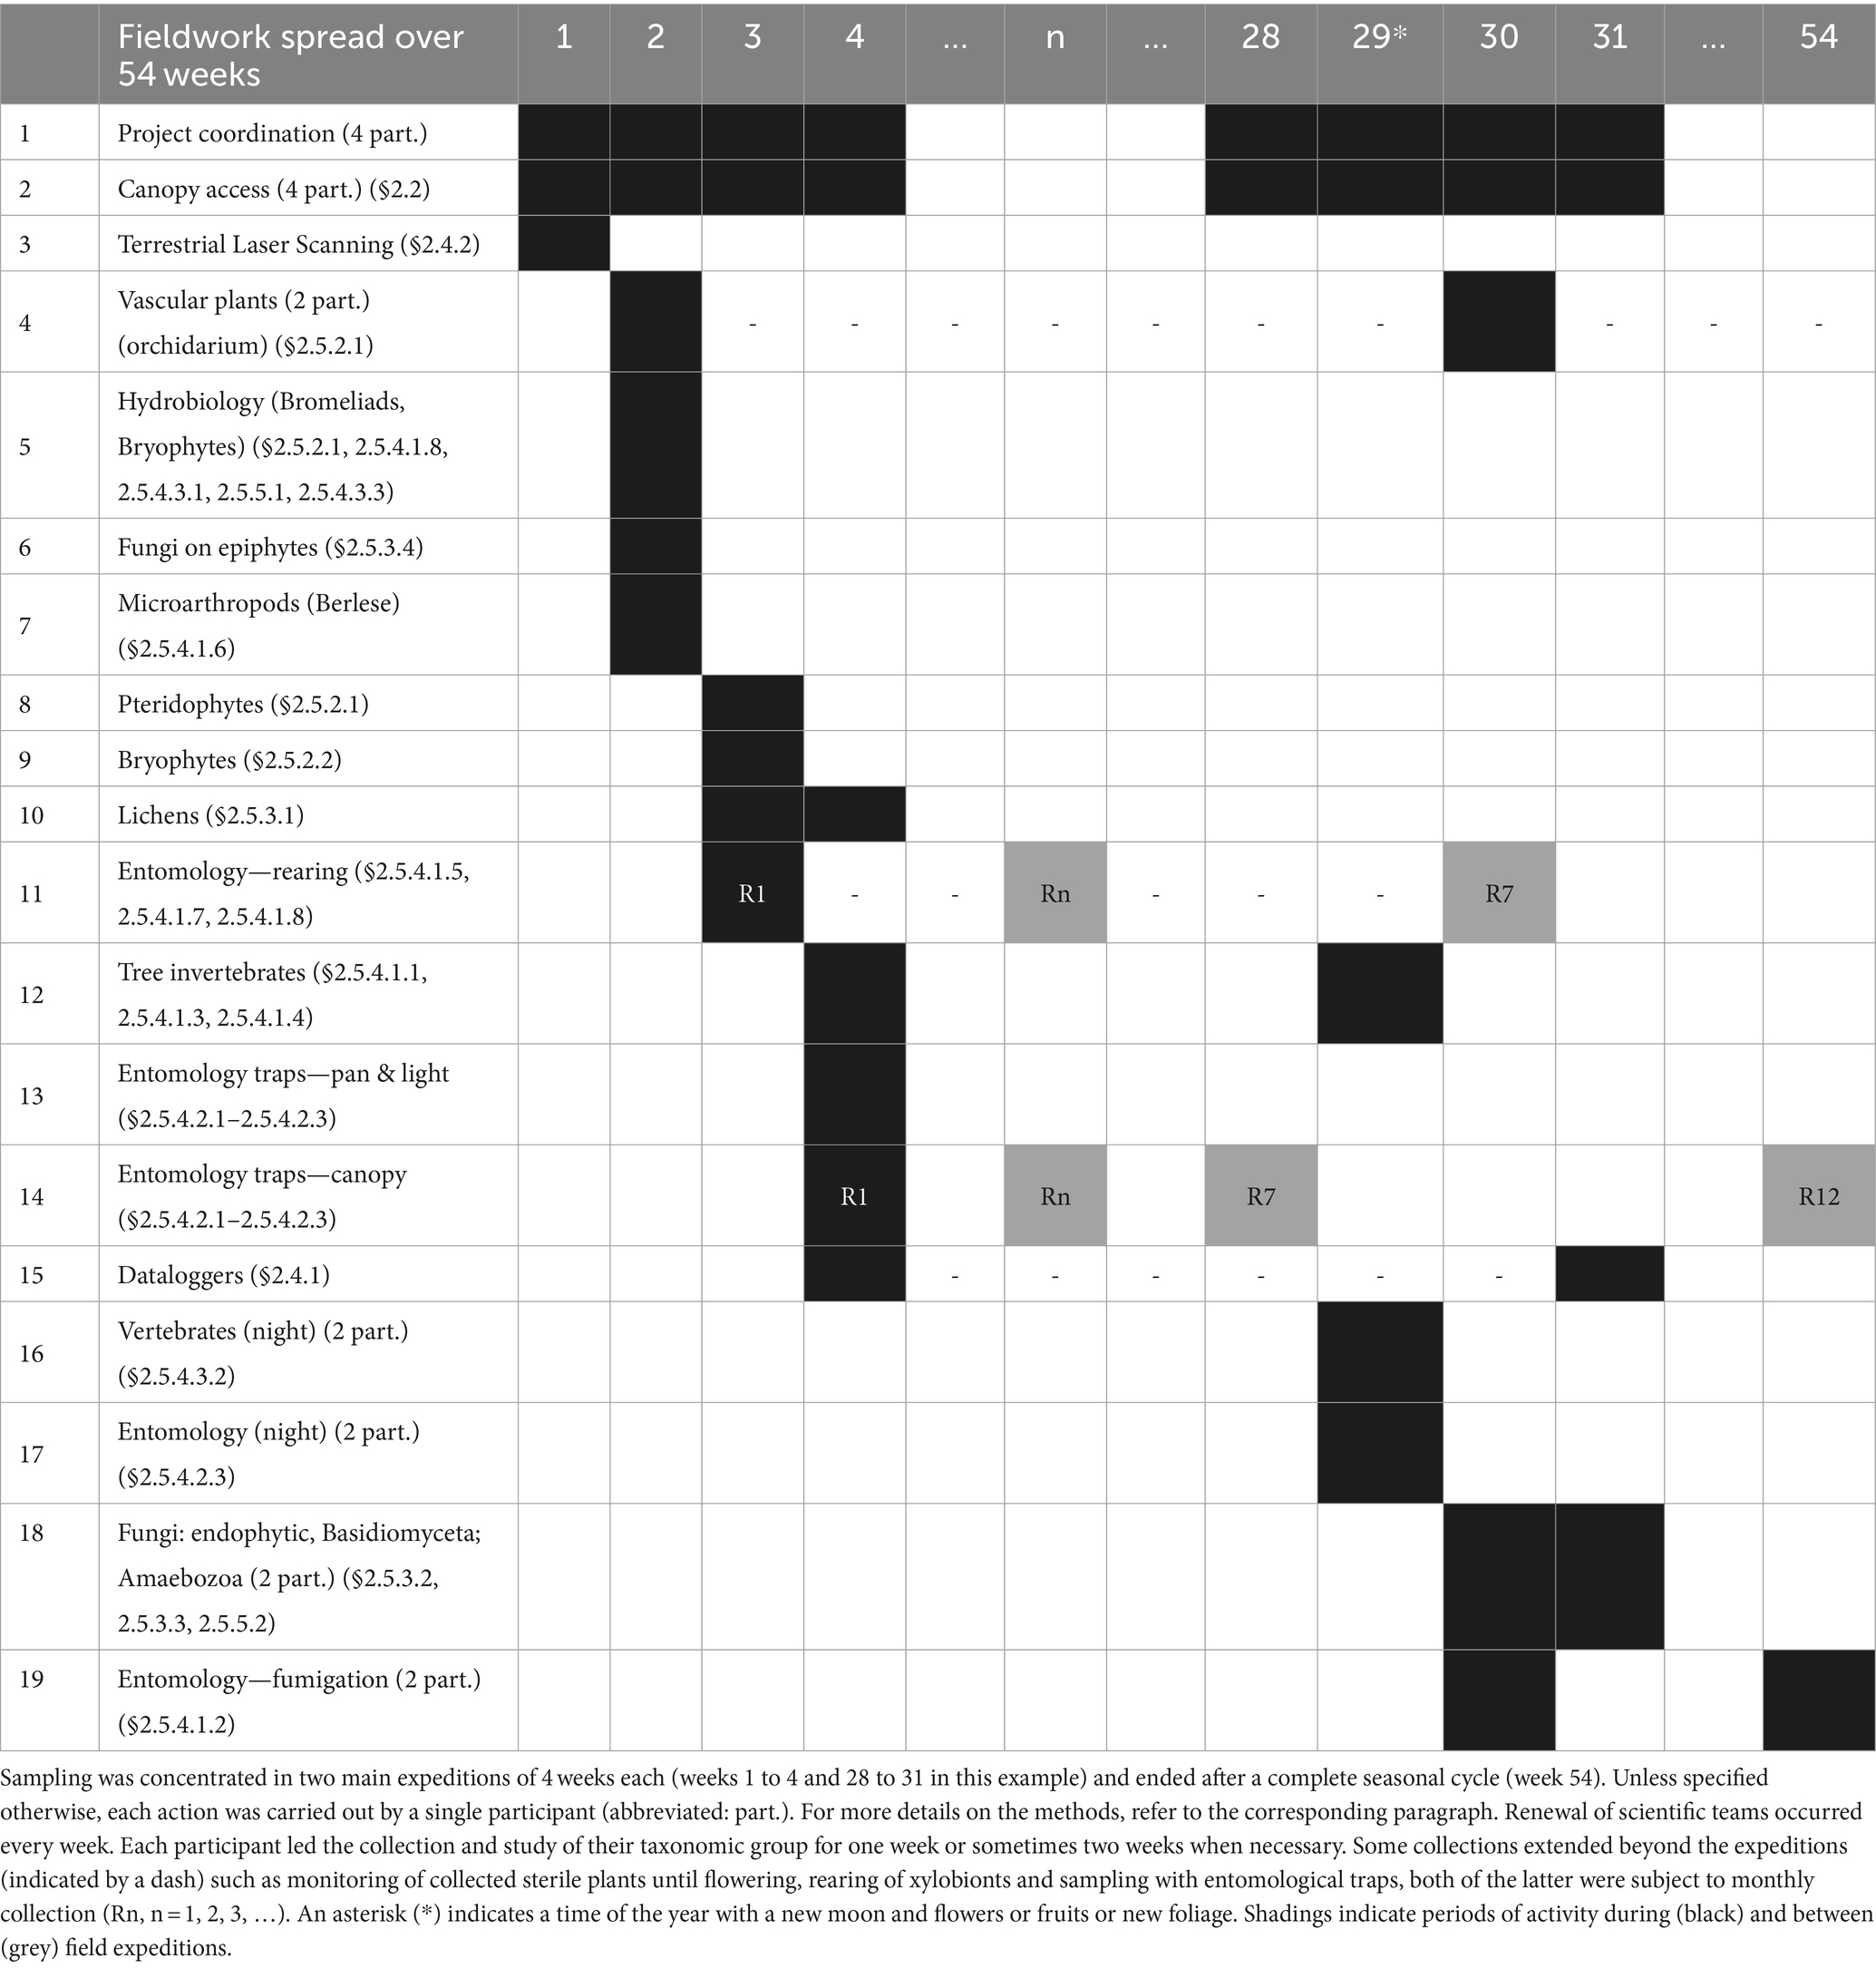
Table 1. Sequence of methods and teams of scientists according to the LOT protocol.
The bark spray method involved spraying a non-sticky insecticide on a small area of bark (delimited by a 50 × 50 cm metal frame), allowing samples of local arthropod assemblages to be obtained. A plastic sheet in the shape of a gutter is placed under the quadrat. The insects were collected 15 min after the spray was applied, using a camel brush and forceps. They were stored in a 7-oz Whirl-pak® containing a pre-printed label and 25 mL of 96% ethanol. This method proved logistically difficult to implement elsewhere than in zone 1, at ground level, where 8 quadrats were collected all around the trunk.
2.5.4.1.3 Baits to collect arboreal ants
We used the method of arboreal baitlines, which are particularly effective in attracting the numerically dominant ants present on a tree (Leponce et al., 2021b). Baits were prepared from a mixture of tinned fish and honey (2 tablespoons of honey per 100 g of fish). A teaspoon of this mixture was placed on a paper towel (10 × 20 cm) which was then folded into a small bag, (Figure 1 #19). These baits were placed along a rope every 5 meters from the bottom (2 m above ground) to the top of the trunk (zones 1 to 3). In the canopy, the climbers placed the baits along the branches, with 5 baits at 5-m intervals per zone (zones 4 to 6). The baits were installed in the morning, during dry and sunny weather, and collected in the afternoon (3 h later). When collected, they were placed individually in 24-oz Whirl-pak® bags with a label. On return to the laboratory the ants on the baits were preserved in 2-mL vials with 96% ethanol.
2.5.4.1.4 Leaves: vegetation beating
This method involves beating branches over a tray to dislodge the invertebrates from the vegetation (Figure 1 #38). Beating was performed during day-time, on dry vegetation. The canvas sheet was circular, with a diameter of 72 cm in diameter (total collecting area 0.4 m2) and had a convenient inner handle (Bioform model, Germany). The beating tray was funnel-shaped with a central perforated hole, to which a collecting jar fitted with a removable Nasco 7-oz Whirl-pak® was attached. The tray was foldable, allowing it to be easily transported in the canopy. All items such as the beating canvas, beating stick and brush were secured, so that they did not fall to the ground. The beating sheet was placed below the foliage so that a good layer of leaves above occupied approximately the entire area of the sheet. The invertebrates were dislodged from the foliage with five good strokes for each sample, and gently brushed towards the central hole and the Whirl-pak®. A brush dipped in ethanol was used to capture arthropods trying to escape from the sheet.
2.5.4.1.5 Leaves: rearing insect galls
Insects, particularly those of the orders Hymenoptera and Diptera, are the main generators of galls on plants, although a variety of organisms, including viruses, bacteria, nematodes and mites, can also induce gall formation. Gall-makers alter plant metabolism to generate tumor-like growths that serve as a source of nutrition and protection for their larvae against harsh environmental conditions and predators. This creates a habitat that can be utilized by various arthropod groups. Gall inquilines are herbivorous or omnivorous insects that exploit the tissue of the gall and may facultatively or obligatorily kill the gall inducer to take over the gall. Gall successors are arthropods that inhabit abandoned galls once the previous occupants have vacated. These successors primarily utilize galls for food and/or shelter. However, fungi that attack dead or decaying gall tissue can also serve as a food source. Gall-makers and inquilines may also serve as hosts for hymenopteran parasitoids, which develop inside the gall and eventually kill their hosts (Sanver and Hawkins, 2000; Luz and Mendonça, 2019). We collected bud-galls from branches collected using the branch clipping method (see §2.2., Figure 1 #36, #60). Some of these galls were dissected in the field laboratory to examine and preserve the living or deceased occupants, or any arthropod remnants found inside, which were then stored in 96% ethanol for future identification. Additionally, a portion of old galls was placed in a sieve within a Berlese funnel (Figure 1 #12) to capture the arthropods emerging from the galls. These arthropods, along with those fleeing from light, were collected in a vial containing 96% ethanol.
2.5.4.1.6 Organic matter: Berlese
Invertebrates inhabiting the proto-soil organic matter within and below bromeliads, epiphyte clumps and branch forks (see §2.5.2.1) (Figure 1 #12) were collected in two ways: First, the organic matter (broken down roots and leaves) of bromeliads and epiphyte clumps (mosses, lichen, others) was scanned for invertebrates visible to the naked eye. Invertebrates collected this way ranged in size from a ca. 5 cm long beetle larva (Coleoptera: Scarabaeidae) to springtails of the Entomobryidae with ca. 1 mm. Second, ca. 500 g (wet weight) of the remaining organic matter that was disassembled for the above was transferred to mesh bags of 1.5–2 mm pore diameter and placed on Berlese extractors into which we fitted 60 W /80 W light bulbs, roughly 5 cm above the surface of the organic matter. Berlese extractors had a diameter of 30 cm and 43 cm, and up to nine 500 g subsamples of organic matter per unit of bromeliad or epiphyte clump or loose arboreal soil were subjected to heat extraction this way. Up to 30 individual Berlese heat extractions were run at the same time, using one or several generators providing at least 3,000 W overall. Extractions lasted 48 h for most of the samples, and only very wet ones were run for 72 h, while very dry ones were run for 24 h. Invertebrates evading the heat and light were captured in 50 mL Falcon tubes filled with 70% Ethanol. Dried organic matter was weighed after extraction for calibration purposes.
2.5.4.1.7 Deadwood: insect rearing
Dead wood hanging in the canopy was collected and placed in emergence boxes to allow the larvae present to complete their cycle (Figure 1 #16). The wood was packed in reinforced rubbish bags. The bag is then placed in a cardboard box (60 × 45 × 35 cm) and a hole is made in one side of the box to allow the end of the bag to emerge. A plastic collecting bottle is attached to the end of the bag and is extended by a T-shaped PVC tube ending in a wire mesh. A Whirl-pak® partially filled with 96% alcohol is attached to the lower end, and replaced every month for 6 months. The insect imagos naturally move towards the light and thus into the collecting Whirl-pak®.
2.5.4.1.8 Epiphytic tank bromeliads: aquatic invertebrates
We selected large, mature tank bromeliads (typically 14 to 20 individuals of the most representative species) with a rosette diameter of more than 50 cm (Figure 1 #10). The water contained in the tank was directly sampled on the tree by the climbers for the inventory of aquatic organisms (Figure 4A). In most cases all the wells in each plant were emptied by sucking the water out using 10-mL and 20-mL micropipettes with the end trimmed to widen the aperture allowing the sampling of the water, the organic matter, and the aquatic organisms. The water volume was recorded for each plant (Figure 4B) and samples were then processed for eukaryotic diversity survey (Figures 4E–H). For each bromeliad, the water was filtered through a 150-μm mesh to isolate organic matter and macroinvertebrates and the retained macroinvertebrates were immediately sorted and identified by morphotypes according to their morphology, size, and behavior (Figure 1 #56). Macroinvertebrates were photographed alive, then fixed in 96% ethanol and stored at 4°C until further determination by professional taxonomists (Figure 4G). After water collection, each sampled bromeliad was removed from the tree, covering it with a white bag to prevent other inhabitants from escaping from it. Collected bromeliads were transported in closed bags to the field laboratory at the research station, where they were measured and photographed. Morphometric data such as the length and width of the longest leaf, number of mature leaves, maximum diameter and height of the complete individual, and wet weight were registered (Figure 4C). The leaves were carefully dismantled to collect all the aquatic animals living in the water reservoirs formed by overlapping leaf bases and which have not been captured by pipetting (North et al., 2013; Figure 4D). The larvae from Odonata were reared in individual plastic jars under the same conditions: natural room temperature around 21°C (±5°C), relative humidity from 80 to 100%, and a 12: 12 h light–dark regime (Aristizábal-Botero et al., 2023). All the aquatic invertebrates, the emerged Odonata adults, and its exuviae were photographed alive, then preserved in 96% ethanol until further determination by professional taxonomists. Aquatic invertebrates were also detected using eDNA from the water of bromeliads (see Supplementary material S2.1).
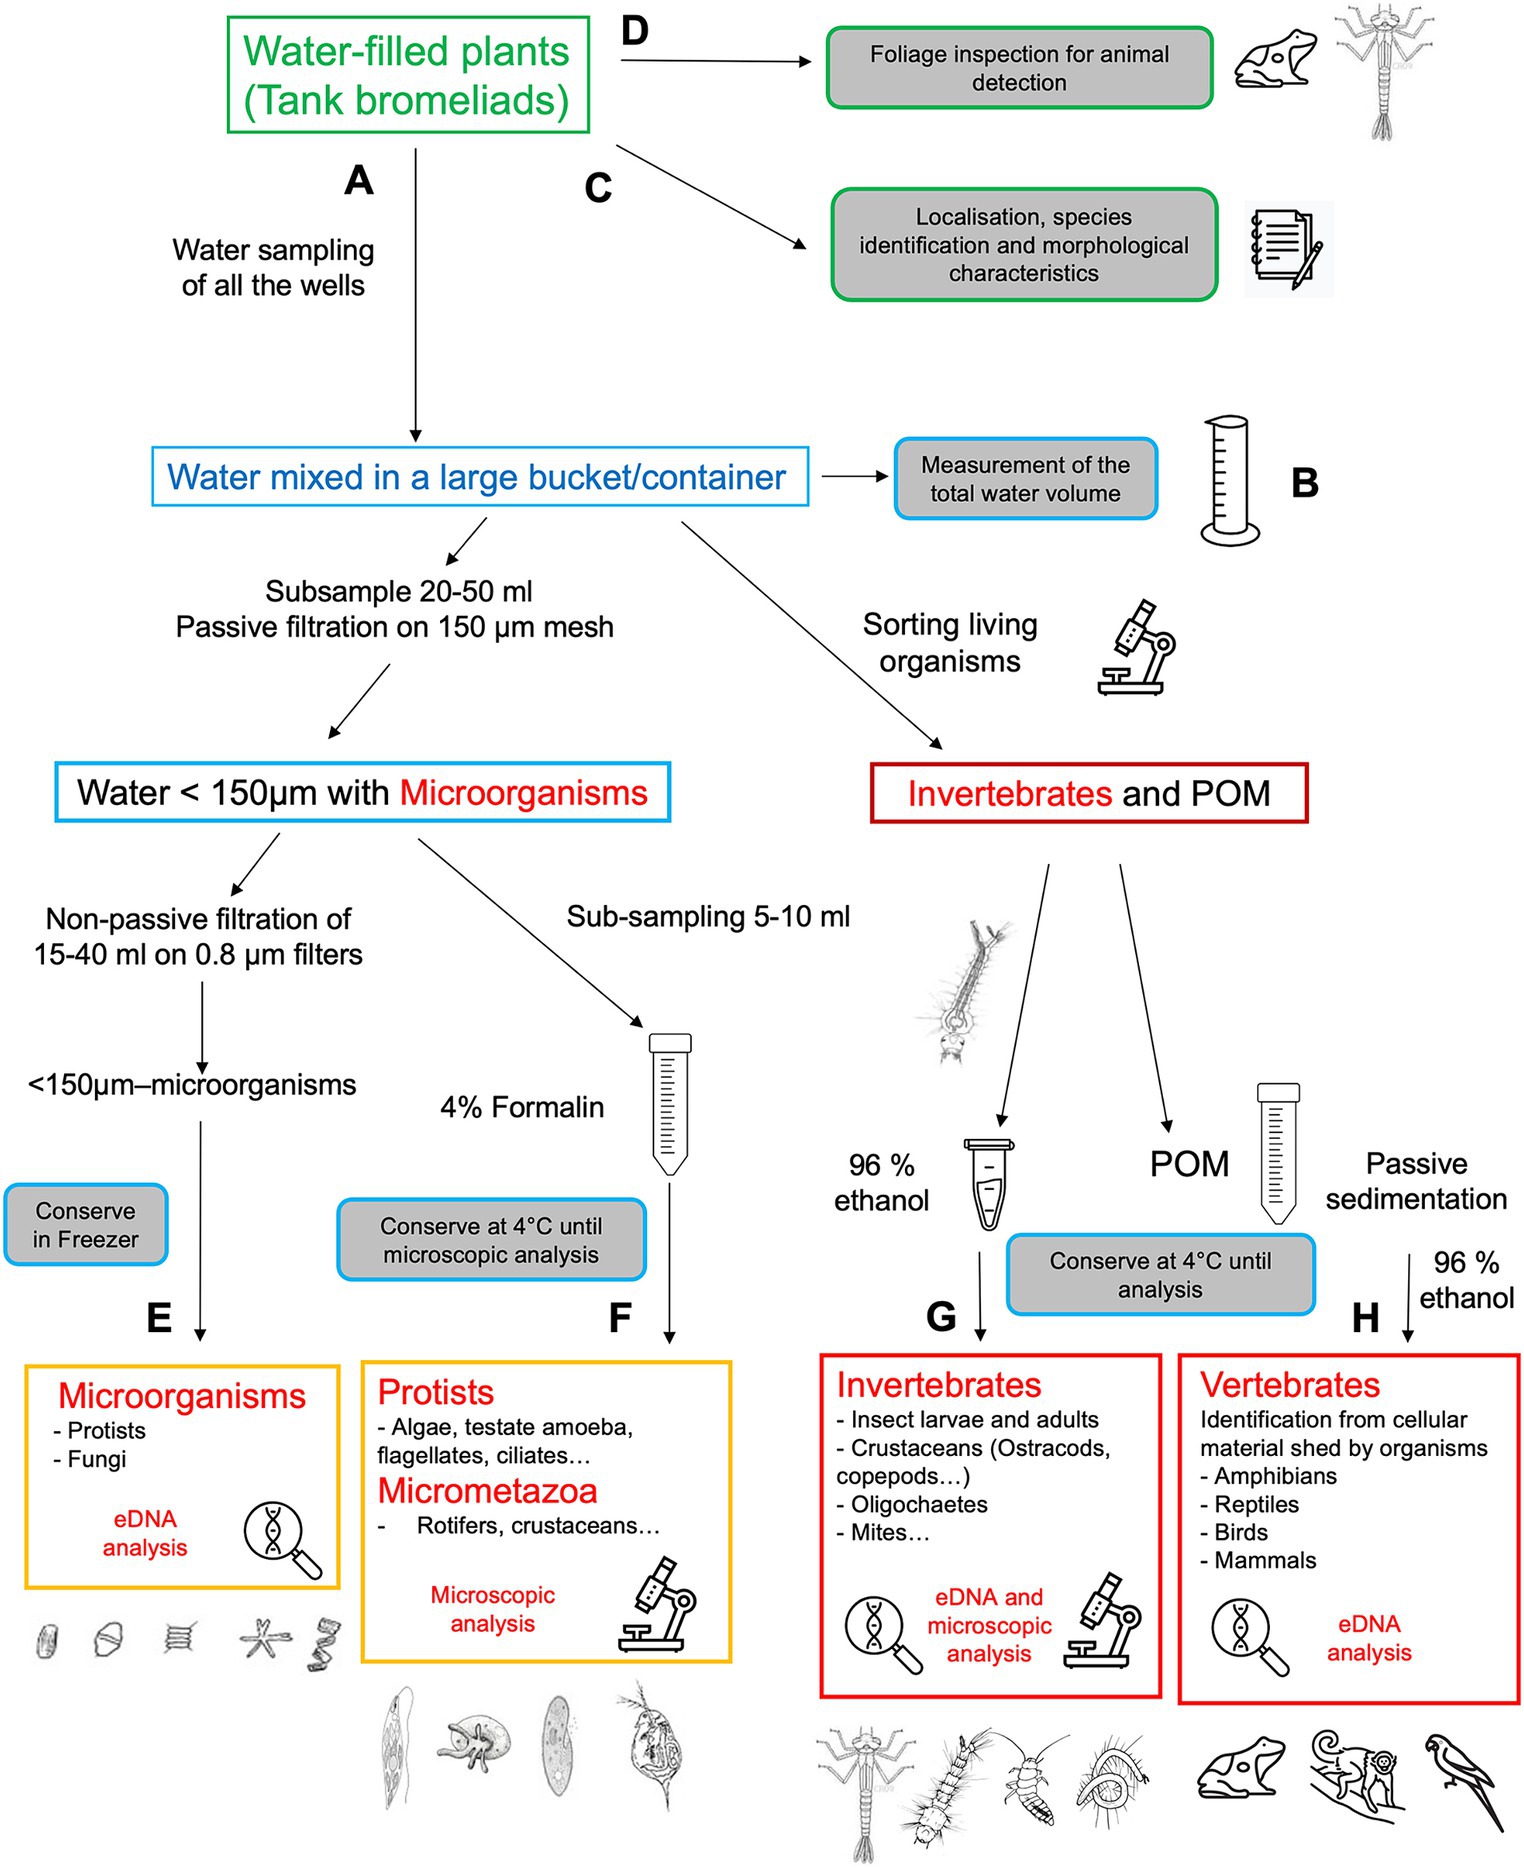
Figure 4. Sampling and various approaches for analyzing eukaryotic biodiversity associated with epiphytic tank-bromeliads. (A) water processing, (B) water volume of the aquatic habitat, (C) plant characteristics, (D) foliage inspection, (E) eDNA detection of microorganisms, (F) microscopic examination of protists and micrometazoa, (G) eDNA detection and microscopic examination of macroinvertebrates, (H) eDNA detection of vertebrates from bromeliad sediments. Image credits: drawings come from open sources or JFC laboratory.
2.5.4.2 Methods targeting flying invertebrates
2.5.4.2.1 Canopy interception traps
Three models of interception trap were used in the canopy. The first two models combined the advantages of a Malaise trap, particularly effective for capturing Hymenoptera and Diptera, and a window trap, particularly effective for capturing Coleoptera and also acting as arboreal pitfall traps (Basset, 1988; Leponce et al., 2021a; Skvarla et al., 2021). We used two different sizes and designs of these combined traps, comprising a top and a bottom collector. The large model (242 cm high, interception surface of 4.5 m2) was designed by the supplier Sante Traps (Figure 1 #02). The smaller model, which we called Polytrap, was based on a transparent interception trap developed by the Purpan engineering school (Toulouse, France) and which we modified according to the scheme of Wilkening et al. (1981) and built with Makrolon® polycarbonate (Figure 1 #03). Polytraps had a total (double-sided) flight intercept surface of 1 m2 (two double-sided 40 × 62.5 cm). The third model used was a Bugdorm SLAM (sea, land, air Malaise, 110 cm high, with an interception surface of 2 m2) trap (Figure 1 #04).
The advantage of the Sante model was its large flight intercept surface (ca. 4 m2). It was placed in the tree canopy (zones 4 and 5). However, its size becomes a disadvantage when a more localized sampling is required (e.g., in the center of the tree crown or during the flowering period to collect flower-visiting insects). In such cases, the Polytrap model was used. The SLAM model had the advantage of being self-supported and free-standing and was deployed on some occasions in the upper canopy (zone 6). Its lower collector was removed when the SLAM was placed above fruits or flowers. For all models, the collecting bottles were filled with 96% ethanol and the standardized collection period was 72 h (3 days). The ethanol was refreshed at the laboratory and samples were stored in a freezer at −18°C. To take account of seasonal variations in insect composition and abundance (Basset et al., 2015), the Sante and Polytraps traps were used once a month, for 3 days, for a full year. The traps were suspended by a rope forming a loop and sliding on a pulley placed under supporting branches.
2.5.4.2.2 Colored pan traps
Yellow pan traps, filled with water and detergent, effectively capture a variety of arthropods, particularly diurnal flying anthophilous species such as Diptera and Hymenoptera, attracted by the color (Buffington et al., 2021). Pans with a diameter of 40 cm and a height of 10 cm were used (Figure 1 #22). Three 3 mm-diameter holes were drilled 2 cm from the top edge of the basin to drain off excess water in the event of rain. They were hung horizontally, in groups of three, under branches of zones 6, 5 and 4, and on the ground of zone 1. Collections were carried out over a 10-day period, with catches taken every two days to avoid decomposition of the collected organisms, which were then preserved in a Whirl-pak® with 96% ethanol.
2.5.4.2.3 Light traps
The overall goal was to sample as exhaustively as possible the moths that were active at night in the tree and its vicinity, and to build a DNA barcode reference library for this community. The library will then be used to identify the caterpillars collected directly on the tree through a sequence match between the DNA barcodes of the caterpillars and those obtained from the adult stage captured by light trapping (for details, see Supplementary material S2.2). Collections were done during the new moon phase. Moths were collected using three distinct devices: (1) low-voltage, ca. 13 W LED-based light-source (LepiLED; Brehm et al., 2021; Figure 1 #30), powered with a 26,800 mAh power bank battery, placed within a white mesh cylinder (1.8 m in height, 60 cm in diameter) closed at its top and standing on an aluminium pole; (2) a single 125 W mercury-vapor bulb placed in front of a vertical white sheet (approximately 2 m in length and 1.8 m in height), called “main trap,” powered by a generator Figure 1 #28; and (3) a 4 W 12 V UV Fluorescent Neon, 28.5 cm long by 1 cm in diameter (Figure 1 #29). All devices were operated all night, from dusk to dawn (swapping batteries for the LepiLED once a night) to account for variations in flight activity time between species and thus avoid missing many species active late at night or early in the morning (Lamarre et al., 2015). Moths were collected by hand or with the help of a net, killed in a cyanide jar or with a thoracic injection of ammonia, and placed in glassine envelopes for preservation and further study. The main trap, despite being more powerful, is nonetheless expected to document the local community of moths; its attraction radius has been estimated to be less than 60 m (with a 50% attraction radius of less than 30 m; see Beck and Linsenmair, 2006). This trap was placed in the closest opening found in the vicinity of the studied tree, aiming at documenting the diversity of moths present and active in the nearby habitats. The LepiLED traps, with a far shorter attraction radius (10–20 m, see Truxa and Fiedler, 2012, Brehm et al., 2021) were placed in the forest undercover, in the direct vicinity but at different distances from the studied tree to document communities of moths that are less-mobile and possibly repulsed by strong light-sources. The Neon trap was placed within the tree canopy and had a short attraction radius, attracting flying microarthropods most likely present in the tree microhabitats. The species collected by the light trap, and generally by other flying insect traps, will be considered as “non-specific interactions” if they cannot be directly linked to the tree, unless the interaction can be corroborated by information from other datasets documenting specific interactions, or from the literature that might suggest a specific interaction or reinforce an already established specific interaction.
2.5.4.3 Vertebrates
2.5.4.3.1 eDNA of phytothelms
All the organic matter collected from each epiphytic tank bromeliad were sedimented in sterile plastic tubes during 48 h after invertebrates sorting (Figure 4H). The water in each tube was removed, and the organic matter was fixed with 96% ethanol until laboratory analysis of eDNA (Figures 1 #27, 4H, see Supplementary material S2.1 for details).
2.5.4.3.2 Birds and mammals
Bats were inventoried by capture using Japanese nets placed on the ground at the base of the tree and in the canopy using lifting systems (Figure 1 #41). Captured animals were measured, weighed, sexed, and identified using available keys for South America (Lopez-Baucells et al., 2016; Díaz et al., 2021). Each captured individual underwent a biopsy on the patagium for genetic identification confirmation, particularly for cryptic species.
The birds inhabiting the tree canopy were inventoried using classic techniques of visual observations (Figure 1 #43) and listening points (see Bibby et al., 2000) from both the ground and the observation platform in the canopy of the studied tree (Figure 1 #8). Surveys took place in the morning from dawn until mid-morning, and then from late afternoon to sunset, over 9 consecutive days. Non-volant mammals were opportunistically inventoried during these bird observation sessions.
Bird and bat sounds were also recorded (Figure 1 #44) using Wildlife Acoustics Sound Mini, Song Meter SM4 Bat Full Spectrum and Echo Meter Touch Pro 2 devices. Sounds were analyzed using SonoChiro software developed by Biotope. Sonograms were visualized using Batsound software from Pettersson Elektronik AB. Bat ultrasounds were determined mainly using keys available in Brazil and in French Guiana (Barataud et al., 2013; Arias-Aguilar et al., 2018). In addition, camera traps were installed in the tree (Figure 1 #26). We did not consider studying vertebrate feces because there were so few of them on the tree. Trials using traps to collect hairs were also unsuccessful.
2.5.4.3.3 Reptiles and amphibians: hand collection
Reptiles and amphibians found within tank bromeliads’ foliage were directly captured during sampling or after the plants were harvested and carefully inspected (Figure 1 #27). These animals were temporarily housed in a vivarium for photography and identification by local experts. Subsequently, they were released back into their natural habitat or, in certain instances, deposited in the natural history collection of the host country.
2.5.5 Protists
2.5.5.1 Filtration of phytothelms and bryophytes
Sub-samples of the tank bromeliad water (Figure 1 #53, see also §2.5.4.1.8), filtered through a 150 μm nylon mesh, were used as follows: (1) filtration through a 0.8 μm GTTP filter for eDNA analysis (see Supplementary material S1.2); and (2) fixation with 4% (final concentration) formaldehyde for microscopic analysis (Figures 4E,F and Supplementary material S3 for details). These samples were stored at the appropriate temperature until laboratory analysis.
Protist sampling of bryophytes from the six height zones (Figure 1 #33) consisted of removing the living part of the mosses from two 10 × 10 cm quadrats per zone. The samples were then gradually dried in plastic bags with silicagel and stored in sterile conditions until processing. In the laboratory, samples were re-hydrated with 200 mL of a Hoagland solution and maintained in climate-controlled chambers at 25 ± 1°C with a 12: 12 h light–dark cycle for 7 d. Samples were sieved through a 500 μm mesh size to separate mosses from protists. The filtrate was processed as follows: (1) a 15 mL sub-sample was filtered through a 150 μm nylon mesh and then sieved through a 0.8 μm GTTP filter for DNA metabarcoding analysis (see Supplementary material S1.2 for details); (2) a 5 mL sub-sample was filtered through a 150 μm nylon mesh and the filtrate was fixed with 4% (final concentration) formaldehyde for microscopic analysis of small sized protists (algae, flagellates, small ciliates); and (3) the remaining 180 mL was fixed with Lugol iodine solution for microscopic analysis of large sized protists (Testate amoeba, large sized algae and ciliates).
2.5.5.2 Amoebozoa
We limited our focus to the plasmodial slime molds (Ceratiomyxa and Myxogastria) within the Amoebozoa supergroup, a group that branches with the common ancestor of animals and fungi (Opisthokonts). Other groups of Amoebozoa would need to be observed on media in Petri dishes, which would be too time-consuming in the field.
Collecting slime molds—both directly on the tree and on wood from the insect rearing boxes (see §2.5.4.1.7)—follows similar procedures as for the larger fungi (§2.5.3.2), including visual inspection of substrates for presence of sporophores and their subsequent storage once completely dry. An advantage is that they do not require immediate documentation because their morphology remains unchanged when dry after being freshly collected. The most notable differences with fungal collection reside in their much smaller size (the majority of slime molds are hardly visible without a hand lens) and their extreme fragility (which requires special care when collecting and during further handling and subsequent conditioning in boxes). It’s also possible to collect the immature plasmodial stages provided they can mature further under moist conditions, a method commonly known as the “moist chamber (MC) technique” (Stephenson and Stempen, 1994). This technique is typically also used ex situ to allow development of myxomycetes on various types of collected litter, even long after the field work was done (De Basanta and Estrada-Torres, 2017).
2.5.6 Tracking of samples
2.5.6.1 Sample coding system
The sample code is composed of a prefix with the tree studied (e.g., LOT01) followed by a method number (two digits, see Figure 1), a tree zone number (1–6) and a sample number (2 to 3 digits). Additional information includes the branch color code (see §3.1). An example would be “LOT01-17612 red”: an orchid (method #17), collected on zone 6 on the red branch of tree LOT01, and being the twelfth sample of orchid. Its parent samples are an epiphyte clump (method #18) collected on a branch (method #36). Parent samples have the same sample code structure. Subsamples, for example a flower, roots, insects found on a plant keep the main sample code followed by a slash and a subsample code (e.g., “LOT01-17612/f”). All these data were encoded in a database and will allow us to explore the coexistence between organisms and their environment.
2.5.6.2 Web application
A web application3 has been developed to communicate with the numerous participants of the project and the public. The public section includes general information about the program: participant list, organization into working groups, expeditions, publications, images, news, etc. A private section, called “LOT-Central,” aims to facilitate the work of experts associated with the program. The functioning of LOT-Central was inspired by websites used by scientific journals to invite reviewers to evaluate manuscripts. It includes mandatory registration for each participant, providing access to a private workspace called “My Workspace” and a shared space called “General Info.” In “My Workspace,” each participant can invite colleagues to collaborate in their work group(s). They will thus become a “workgroup leader” and will be responsible for the proper functioning of their group of experts. Like all program participants, these experts must register in LOT-Central and accept the general terms and conditions. Similarly, the list of materials sent to other experts must be uploaded to LOT-Central upon submission. The structure of the work groups is hierarchical due to the invitation chain, ensuring proper tracking of specimens in accordance with the Nagoya Protocol and the laws of the host countries. An automated email system allows each expert to invite new participants to their work group or send a progress report request to existing members.
Each participant can share (upload) documents with others (e.g., sample lists, species lists, publications, images), all of which are archived in LOT-Central and eventually accessible in the “General Info” section. The data provided to LOT-Central in the participant’s private workspace is only visible to the participant, its mentors (i.e., the inviter and superiors in the invitation chain), and the database administrators. Although the data remain the intellectual property of the participant, they may be used in publications summarizing all results, with the participant invited to be a co-author.
3 Results
3.1 Temperature and relative humidity
One-way Kruskal-Wallis analyses of variance on ranks revealed differences between Johansson zones for temperature (H = 202.0, df = 5, p < 0.001) and relative humidity (5484.6, df = 5, p < 0.001) (Figure 5). For temperature, differences were measured between the bottom (Z1) and the top of the trunk (Z2–Z3), and between the heart (Z4) and the periphery of the canopy (Z5-Z6) (Tukey tests, p < 0.05). The same results were obtained for relative humidity, but with differences between Z2 and Z3.
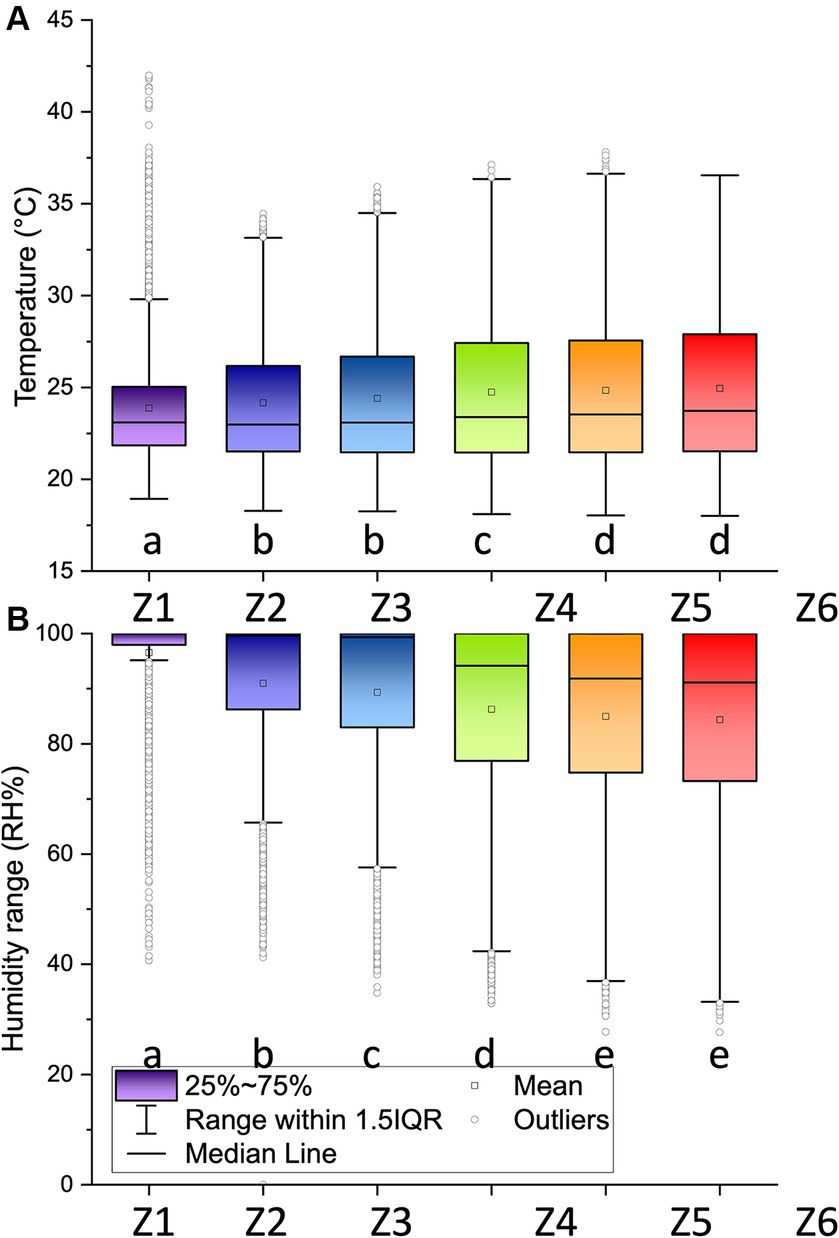
Figure 5. (A) Temperature and (B) relative humidity along the LOT01 tree between August 29 and October 7, 2022, measured at intervals of 5 min. Different letters show significant differences between Johansson zones (Z1–Z6, see Figure 1) according to a Tukey test (p < 0.05). Data loggers were placed in the middle of each zone.
3.2 Terrestrial laser scans and sample location
The segmented point cloud, down sampled to 1 cm, consisted of 27,405,498 points. We could derive a tree height of 49.5 m, a projected crown area of 1,068 m2, and a functional diameter above buttress of 1.86 m at a height of 6.88 m. We were able to identify 4 main branches to which different colors have been assigned (orange, red, blue, green) (Figure 6). Flags with these colors were placed in the tree to make it easier to locate the samples. Epiphyte plants were visible on the scans (Figure 1).
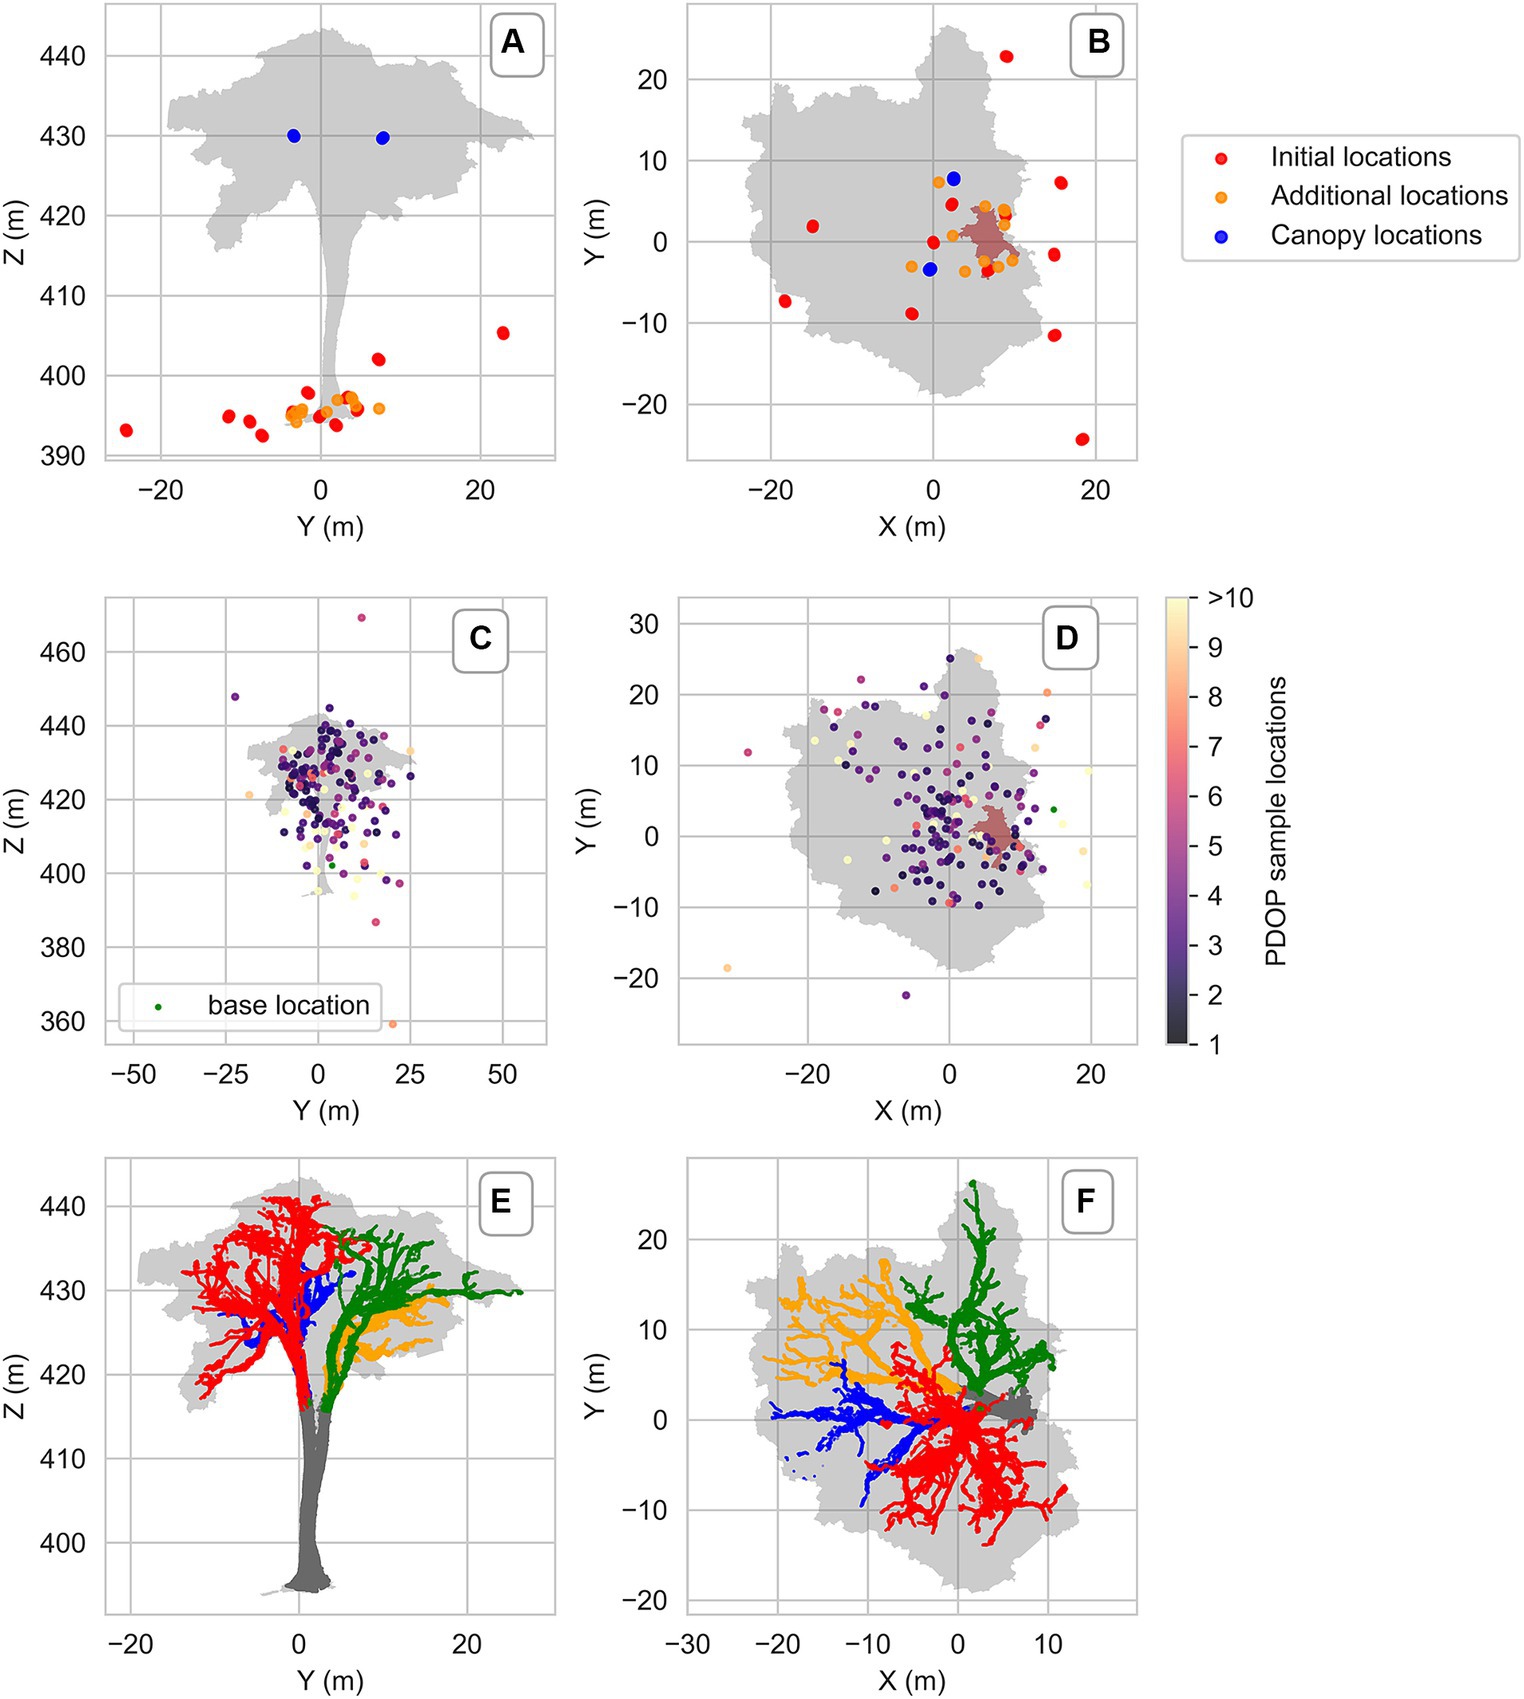
Figure 6. Vertical (left) and horizontal (right) projection of the tree LOT01 constructed by Terrestrial Laser Scans (TLS). The grey and brown area, respectively, show the tree and the first seven meters of the stem. (A,B) Laser scanner locations, (C,D) location of the dGNSS base station and of sampling units colored by Position Dilution Of Precision (PDOP). The higher the PDOP value, the lower the accuracy of sample location, (E,F) the four main branches and stem distinguishable by color.
The significant error in the sample dGNSS location accuracy was primarily vertical (Figure 6). We achieved an RTK fix (centimetric precision) solution for only one sample, while the rest had RTK float and single solutions. 99% of our samples had PDOP values exceeding 2, indicating a high Position Dilution of Precision (PDOP), which represents the impact of the relative position of the satellites on the overall accuracy. In ideal conditions, a PDOP value should be 1; values greater than 2 adversely affect accuracy.
3.3 Integration and chronosequence of methods
In total, 36 methods have been integrated into the LOT protocol to sample eukaryotes (Figure 1). The typical succession of collections according to this protocol is presented in Table 1. Two main scientific expeditions took place, respectively, at the end and beginning of the rainiest season. A scientific, technical, and logistical coordination team was present throughout the duration of the collection missions, supporting the scientists. It was responsible for obtaining multiple permits to collect and export the specimens (this process was generally complex and took several weeks). Rotation of scientific teams (4 to 5 participants) usually occurred weekly. However, studying certain taxonomic groups that are particularly diverse required a longer stay. The start of the expedition (week 1) was devoted to preparing operations before the arrival of biologists: installation of canopy access, field laboratory, and TLS scanning of the tree to identify main branches and Johansson zones. The first team of biologists, arriving in week 2, focused on studying epiphyte clumps and bromeliads. Fungi were collected on these epiphytes. Microfauna living in the soil accumulated on certain branches or under the epiphytes was extracted using Berlese funnels. A second team of experts arrived in week 3 and continued work on the epiphytes: ferns, mosses, and lichens. Sterile plants were placed in nurseries to await flowering or fructification and were monitored by a local support team working on site (park rangers or local employees). Deadwood from the tree was placed in emergence boxes to collect xylobionts. Specimen collection (Rn, n = 1, 2, 3, …) took place every month and continued until the second expedition. The third team of scientists focused on entomology, particularly on installing canopy traps that will be running every month during a year. Microclimatic data loggers were installed and collected measurements until the next expedition. The second expedition took place during a period when the tree provided a peak of resources for fauna (flowers, fruits, or new leaves; for example, week 28 in Table 1). The first few days were again devoted to installing canopy access devices and the field laboratory. The first team of scientists mainly focused on night observations and collections in and around the tree, during the new moon (week 29). Invertebrates of the tree were sampled again, ideally during a resource peak, on different parts of the tree, notably through bark spraying. The second team (week 30) focused on complementary collections of epiphytic plants, with an emphasis on collecting flowering or fruiting plants. The collection and cultivation of endophytic fungi and fungi that have developed on deadwood, which was removed from the emergence boxes originally intended for xylobiont collection, also began. The last week (week 31) was devoted to completing the cultivation of fungi and recording environmental data (data loggers). At this time, a rope and pulley system was installed to allow hoisting and manipulation of a fumigator, the final collection operation, which ideally took place at the end of sampling (week 54), after removing the canopy entomological traps.
4 Conclusions and perspectives
The main characteristics of the integrative LOT protocol presented here are: (1) focus on a single tree; (2) incorporation of the various microenvironments of large old trees and precise localization of samples within them; (3) use of a wide range of methods for sampling and identification; and (4) sampling at different times of the year.
The advantage of spatially concentrating the sampling effort implies, from a logistical point of view, that it is not necessary to cover large areas to carry out the sampling which reduces the travel time and the time needed to install canopy access equipment (ropes, winch, platform) for the scientific and technical team, especially for climbers who perform physically demanding work. The use of an electric winch and a canopy platform helps reduce this fatigue. Specialized arborists are required for the hazardous canopy sampling, who can climb laterally on even the thinnest of branches. Other options for accessing the canopy exist, such as construction cranes (Basset et al., 2012) or scaffolding (Aráça project), but they do not allow direct access to the entire tree. Another logistical constraint is that a field laboratory must be nearby, within an hour’s walk of the study tree, to process (dry, prepare, etc.) samples collected as they arrive. This can be challenging when the trees of interest are rare. In the context of the “Life on Trees” project, a deliberate approach has been to choose large old trees with numerous microhabitats (epiphytic plants). These trees are rare and generally victims of deforestation outside protected areas, making it necessary to carry out reconnaissance missions to detect them. This reconnaissance can be facilitated using drones, especially those equipped with LiDAR sensors (Terryn et al., 2022).
Our microclimatic measurements confirmed the differences between ground- and canopy-level conditions (Scheffers et al., 2013). Globally, the extreme values and variations in temperature and humidity at the top of the tree were significantly higher than those at lower, more shaded levels. Differences were found between Johansson zones except between Z5 and Z6 for temperature and relative humidity and between Z2 and Z3 for temperature. However, a fine subdivision into 6 zones can be justified to study the distribution of certain organisms such as vascular epiphytes (Krömer et al., 2006). TLS scans, especially those conducted from canopy branches with the assistance of climbers, allowed for the precise three-dimensional modeling of the tree’s architecture and visualization of epiphytes on the branches. Processing the scans directly after their capture was very useful for defining the main branches of the tree, to which color codes were assigned, facilitating the identification of samples in the highly complex canopy environment. Another high-tech solution that was also attempted for the first time to precisely geolocate samples in the tree, the use of dGNSS, proved to be less promising, with low positional accuracy, especially along the vertical axis. Multiple factors can explain thus low accuracy: (1) multipath effect where signals reflected by the forest canopy create multiple signal paths, causing interference and distortion of signal amplitude and phase (Zheng et al., 2005; Brach et al., 2019); (2) low satellite coverage in the site especially at ground level; and (3) instability of the rover position during the acquisition of the location due to wind and climber movements. For sample location it is therefore recommended to rely on Johansson zone, branch color and plumb line positioning.
In total, we used no less than 36 different methods to collect eukaryotes in the tree. The multiplication of sampling methods and their repetition at various times of the year helps to increase the accuracy and reliability of the results (Yanoviak et al., 2003; Leponce et al., 2010; Basset et al., 2012).
The approach of having a wide taxonomic scope allows for a global view of the taxonomic composition of organisms present on a tree but has various implications. First, gathering the necessary expertise is a challenge. Second, we could only invite one or two experts per major group of eukaryotes because the number of people able to collect in the tree at the same time and because the capacity of the field laboratories was limited. Third, another difficulty arose in obtaining permits. No country has the expertise to identify all the eukaryotes collected. It is therefore necessary to export material beyond the country’s borders, which faces administrative difficulties. Permit applications generally need to include a detailed list of sample contents, specifying the number and identification of individuals collected. While a preliminary and indicative list can be provided, a detailed list can only be obtained at the end of the study due to the difficulty of identification and the significant amount of material collected, especially for small organisms.
The discovery potential of new species is significant, particularly for projects conducted in the canopy and in little explored regions, but taxonomists’ study time is often long and varies depending on the groups (Lawton et al., 1998; Fontaine et al., 2012). The current approach of integrative taxonomy partly overcomes the taxonomic impediment (Meierotto et al., 2019) by using DNA barcoding and metabarcoding for species identification.
Barcoding, through DNA sequencing, is based on the principle that a short, standardized DNA sequence can distinguish individuals of different species because genetic variation between species is expected to exceed that within species. It was first promoted for animals by Hebert et al. (2003). For animals, the mitochondrial cytochrome c oxidase subunit 1 (CO1) gene is commonly used as the barcode region (Andújar et al., 2018). For fungi, these are the internal transcribed spacers 1 and 2 (ITS) of the nuclear ribosomal DNA that are regularly used as a barcode (Schoch et al., 2012). Any sequence-based identification of fungi suffers from several limitations, especially the high number of misidentified sequences in databases and the insufficient taxonomic knowledge for correct interpretation of blast results (Thines et al., 2018; Hofstetter et al., 2019; Lücking et al., 2021). In addition, several fungal genera (e.g., Colletotrichum [Bhunjun et al., 2021], Fusarium [Thomas et al., 2019], etc.) include species complexes in which different species can share an identical ITS sequences and, consequently, cannot be correctly identified without a labor-intensive, multigene approach based on a representative sampling of the species described in these genera. For protists, regions such as the small subunit ribosomal RNA (SSU rRNA) gene are widely employed (Burki et al., 2021).
In land plants (Embryophytes), the 2-locus combination of the plastid rbcL and matK has been proposed as the barcode to identify specimens; this choice results from the universality of primers located in flanking conserved regions while exhibiting an ability to discriminate about 72% of terrestrial plant species (CBOL Plant Working Group, 2009). Subsequent testing of these and other cpDNA loci in plants and especially in spore-bearing plants (bryophytes, ferns, and lycophytes) revealed several difficulties for the routine use of these supposedly universal DNA sequence data. Due to a rearrangement of the chloroplast in the ancestor of ferns, no universal primers are available that work for matK across all ferns (Kuo et al., 2011), while rbcL has a relatively slow rate of evolution at the species level and, in many cases, cannot be used alone to distinguish between species of land plants. Therefore, equivocal results were retrieved due to the lack of suitable variation at the species level in many instances (see Dantas et al., 2018 and references therein), returning multiple matches at 100% similarity from different species for the same query to the Basic Local Alignment Search Tool (BLAST, Camacho et al., 2009; Callaghan et al., 2020). Results from the nDNA and much more variable ITS locus are also equivocal. For example, Callaghan et al. (2020) reported very low similarity matches in BLAST searches of ITS sequences from UK samples of mosses, either reflecting low representation of the marker on GenBank, or the confounding issue of paralogous copies of the locus. Given these difficulties in applying the “official” barcode of plants, most studies have instead taken an ad hoc approach, selecting DNA markers tailored to their own taxonomic group. Epiphytic plant species growing on big tropical trees represent taxa from many high taxonomic levels (above family and order ranks). Due to the lack of universal DNA barcode loci for all plants and the limited discrimination power of any single-locus or even 2-loci DNA markers, sometimes even at higher taxonomic levels (family, genus), identifying plant specimens to the species level through DNA barcoding remains highly challenging (Kress, 2017). This process would require selecting a large diversity of DNA markers as ad hoc barcodes, even within each of the four major lineages of land plants that are commonly observed on big trees (bryophytes, ferns, lycophytes, seed plants). In the future, whole-chloroplast genome sequencing, along with short-read reduced genome techniques such as genome skimming and target capture, should enhance plant species identification (Li et al., 2015; Pezzini et al., 2023). However, being able to molecularly distinguish from each other all the plant species observed does not mean being able to reliably identify the species themselves. Such an achievement supposes to have available complete reference DNA libraries for each taxonomic group. It is still rare for tropical organisms for which, even more so, discovering and describing species is still a routine project (the exploration of plant diversity allows the description of more than 2000 new plant species every year) (Rouhan and Gaudeul, 2021; International Plant Names Index (IPNI), 2024). From a practical point of view, a key strength of molecular taxonomy is however that it can be performed on any life stage—even some that bear no or only few morphological characters such as seedlings or fern gametophytes (Nitta and Chambers, 2022) this is a critical help for identifying plants found young and sterile on a big tree.
To sum up, DNA barcoding can enable precise identification to species level when reference sequences are available in the database, which is rarely the case for tropical organisms from little-explored regions (Souto-Vilarós et al., 2024). Metabarcoding is its extension, allowing for the identification of various taxa present in environmental samples, such as water or the contents of entomological traps. However, the success of sequencing depends on factors such as the choice of DNA marker, primer design, sequencing depth, and bioinformatics analysis methods. This justifies the necessity to keep a dual approach, based on morphology and molecular analysis, whenever possible.
In conclusion, comprehensively sampling the biota of individual trees offers an alternative to assessing the biodiversity of fewer groups of organisms at the forest scale. The main interest is to understand, on the scale of a tree, how the different organisms it supports interact before moving to a broader understanding. Large old trees have a wide range of microhabitats and possibly a significant portion of local forest biodiversity, especially for organisms with little specificity to the host tree. It should be noted, however, that for example, in the case of vascular epiphytes, while a significant portion is found on trees, another part is confined to understory shrubs (Krömer et al., 2006). Documenting the species living on individual trees could provide baseline data against which future changes in biodiversity can be measured, essential for long-term ecological monitoring. It allows for the study of within-tree turnover of species over time. For example, in the case of LOT02, whose epiphytic plants were exhaustively inventoried 20 years ago (Catchpole, 2004), we will be able to study the changes in species composition and relative abundance. In the case of a tree surrounded by a strangler fig, as is the case for LOT02, it will also be possible to study the effect of the tree species on the composition of associated organisms, for example, on endophytic fungi or epiphytic plants of each of the two trees. Studying the colonization over time of the same tree, from the young to the old stage, is another long-term research theme that could be envisioned. The tree can also be seen as a mini ecosystem that will probably shift in response to the future warming of forest (Doughty et al., 2023). Insights from a global network regularly monitored inventoried trees would enable a holistic study of biological interactions at tree level.
The integrative LOT protocol requires significant resources in terms of expertise and organization due to its comprehensiveness. If one wishes to conduct less extensive assessments, allowing the study of a higher number of trees, prioritizations are conceivable. Firstly, focusing on sampling methods capturing the organisms most intimately associated with the tree, in descending order: those found in the tree’s internal tissues (mainly endophytic fungi or mining insects), those using the tree’s organs (e.g., leaves, wood, flowers, fruits) as a resource, those living as or on epiphytes, and finally flying organisms. We chose to include all these categories to meet the objective of assessing the diversity of organisms hosted and supported by a tree. In educational terms, this allows us to illustrate, for a unique keystone structure, the tree, what biodiversity means and what the impact of the destruction of a large old tree is. It also supports and justifies conservation measures for this type of key organism and its habitat. Secondly, the identification of collected organisms can be made less labor-intensive by resorting to a purely molecular approach, despite the limitations of this approach as discussed before. Thirdly, if access to the canopy by climbers is not possible, the use of fixed installations (e.g., cranes) or collecting drones can be considered, especially for collections outside the canopy or along the trunk (Cannon et al., 2021). A final research perspective, still focusing on individual trees, would be to also study prokaryotic organisms or the underground part of the tree, but these are other significant challenges, highlighting how immense the task of studying terrestrial biodiversity is.
Data availability statement
The raw data supporting the conclusions of this article will be made available by the authors, without undue reservation.
Ethics statement
Written informed consent was obtained from the individual(s) for the publication of any potentially identifiable images or data included in this article.
Author contributions
ML: Conceptualization, Formal analysis, Investigation, Methodology, Supervision, Writing – original draft, Writing – review & editing. YB: Methodology, Writing – review & editing. ÁA-B: Methodology, Writing – review & editing. NB: Methodology, Writing – review & editing. JB: Methodology, Writing – review & editing. BB: Methodology, Writing – review & editing. PB: Methodology, Writing – review & editing. KC: Formal analysis, Methodology, Writing – review & editing. GC: Methodology, Writing – review & editing. J-FC: Methodology, Writing – review & editing. DC: Methodology, Writing – review & editing. BD'h: Formal analysis, Methodology, Visualization, Writing – review & editing. JaD: Methodology, Writing – review & editing. JoD: Methodology, Writing – review & editing. DE: Methodology, Writing – review & editing. AH: Methodology, Writing – review & editing. VH: Methodology, Writing – review & editing. CL: Methodology, Writing – review & editing. FM: Methodology, Writing – review & editing. JoM: Methodology, Writing – review & editing. JCN-M: Methodology, Writing – review & editing. EP: Methodology, Writing – review & editing. RR: Methodology, Writing – review & editing. GR: Methodology, Writing – review & editing. VR: Methodology, Writing – review & editing. SS: Methodology, Writing – review & editing. JS: Methodology, Writing – review & editing. AV: Methodology, Writing – review & editing. CV: Methodology, Writing – review & editing. NY: Methodology, Writing – review & editing. OP: Funding acquisition, Methodology, Project administration, Supervision, Writing – review & editing.
Funding
The author(s) declare financial support was received for the research, authorship, and/or publication of this article. The “Life on Trees” (LOT) research program was funded by the Fonds de Dotation Biotope Pour La Nature (FDD Biotope), France. JD and SS were partly funded by Deutsche Forschungsgemeinschaft (DFG, German Research Foundation) project number 192 626 868, CRC990-EFForTS, and CL was supported by an Investissement d’Avenir grant managed by the Agence Nationale de la Recherche (CEBA, ref. ANR-10-LABX-25-01).
Acknowledgments
This study was conducted in the framework of the “Life on Trees” (LOT) Program (2020–2025), a joint initiative of the Royal Belgian Institute of Natural Sciences (RBINS) and the Fonds de Dotation Biotope pour la Nature (FDD Biotope). We thank the following institutions and individuals for their support. In Perú, the Museo de Historia Natural Universidad Mayor de San Marcos (D. Silva-Dávila, J. Albán-Castillo, L. Pillaca-Huacre), CINBIOTYC (L. Ocupa-Horna), Servicio Nacional de Áreas Naturales Protegidas por el Estado, PN del Río Abiseo (V. Macedo Cuenca, M. Salas Guerrero), PN Yanachaga Chemillén (S. Antezano-Angoma), Herbarium Selva Central Oxapampa HOXA (R. Rojas, R. Vásquez, L. Valenzuela), SERFOR (L. Cayo Rodriguez and J. Marroquín Gonzales), CDS (F. Rizo-Patrón), SUMPA (J.M. Fernández Zeballos), PUCP (N. Salinas-Revilla, G. Bañares de Dios, A. Nina). In Colombia, the Research Institute of Biological Resources Alexander von Humboldt (G. Bravo Mora and J. Montes), RN La Isla Escondida (J. Beckers). The climbers of Accès Cimes (M. Audoin, S. Guetta, M. Loubes, B. Rebreyend, J.-Y. Serein), V. Le Prince (FDD Biotope) as well as the numerous other participants are also deeply thanked: scientists, park rangers, field assistants, and volunteers (see www.lifeontrees.org). The two referees are thanked for their helpful comments and suggestions.
Conflict of interest
The authors declare that the research was conducted in the absence of any commercial or financial relationships that could be construed as a potential conflict of interest.
Publisher’s note
All claims expressed in this article are solely those of the authors and do not necessarily represent those of their affiliated organizations, or those of the publisher, the editors and the reviewers. Any product that may be evaluated in this article, or claim that may be made by its manufacturer, is not guaranteed or endorsed by the publisher.
Supplementary material
The Supplementary material for this article can be found online at: https://www.frontiersin.org/articles/10.3389/ffgc.2024.1425492/full#supplementary-material
Footnotes
2. ^https://weatherandclimate.com/peru/san-martin/juanjui
4. ^D’hont, B., Calders, K., Antonelli, A., Berg, T., Cherlet, W., Dayal, K., et al. (in preparation). Integrating terrestrial and canopy laser scanning for comprehensive analysis of large old trees: Implications for single trees and biodiversity research.
References
Adis, J., Basset, Y., Floren, A., Hammond, P. M., and Linsenmair, K. E. (1998). Canopy fogging of an overstory tree-recommendations for standardization. Ecotropica 4, 93–97.
Andújar, C., Arribas, P., Yu, D. W., Vogler, A. P., and Emerson, B. C. (2018). Why the COI barcode should be the community DNA metabarcode for the metazoa. Mol. Ecol. 27, 3968–3975. doi: 10.1111/mec.14844
Aptroot, A. (1997). Lichen biodiversity in Papua New Guinea, with the report of 173 species on one tree. Biblioth. Lichenol. 68, 203–213.
Araújo, K. S., Brito, V. N., Veloso, T. G., de Leite, T. S., Alves, J. L., da Hora Junior, B. T., et al. (2020). Diversity and distribution of endophytic fungi in different tissues of Hevea brasiliensis native to the Brazilian Amazon forest. Mycol. Prog. 19, 1057–1068. doi: 10.1007/s11557-020-01613-4
Arias-Aguilar, A., Hintze, F., Aguiar, L. M., Rufray, V., Bernard, E., and Pereira, M. J. R. (2018). Who’s calling? Acoustic identification of Brazilian bats. Mammal Res. 63, 231–253. doi: 10.1007/s13364-018-0367-z
Aristizábal-Botero, Á., Snoeks, J. M., Realpe, E., and Vanschoenwinkel, B. (2023). Conductivity and water level modulate developmental plasticity and explain distribution patterns in a diverse neotropical Odonata assemblage. Freshw. Biol. 68, 1558–1571. doi: 10.1111/fwb.14151
Asta, J., Erhardt, W., Ferretti, M., Fornasier, F., Kirschbaum, U., Nimis, P. L., et al. (2002). “Mapping lichen diversity as an indicator of environmental quality” in Monitoring with lichens – monitoring lichens, Nato Science Series. IV. Earth and Environmental Sciences. eds. P. L. Nimis, C. Scheidegger, and P. A. Wolseley (Dordrecht, The Netherlands: Kluwer Academic Publishers), 273–279.
Barataud, M., Giosa, S., Leblanc, F., Rufray, V., Disca, T., Tillon, L., et al. (2013). Identification et écologie acoustique des chiroptères de Guyane française. Le Rhinolophe 19, 103–145.
Basham, E. W., Baecher, J. A., Klinges, D. H., and Scheffers, B. R. (2023). Vertical stratification patterns of tropical forest vertebrates: a meta-analysis. Biol. Rev. Camb. Philos. Soc. 98, 99–114. doi: 10.1111/brv.12896
Basham, E. W., Gonzalez-Pinzon, M., Romero-Marcucci, A., Carl, N., Baecher, J. A., and Scheffers, B. R. (2022). Large, old trees define the vertical, horizontal, and seasonal distributions of a poison frog. Oecologia 199, 257–269. doi: 10.1007/s00442-022-05108-9
Basset, Y. (1988). A composite interception trap for sampling arthropods in tree canopies. Aust. J. Entomol. 27, 213–219. doi: 10.1111/j.1440-6055.1988.tb01527.x
Basset, Y., Cizek, L., Cuenoud, P., Didham, R. K., Guilhaumon, F., Missa, O., et al. (2012). Arthropod diversity in a tropical forest. Science 338, 1481–1484. doi: 10.1126/science.1226727
Basset, Y., Cizek, L., Cuenoud, P., Didham, R. K., Novotny, V., Odegaard, F., et al. (2015). Arthropod distribution in a tropical rainforest: tackling a four dimensional puzzle. PLoS One 10:e0144110. doi: 10.1371/journal.pone.0144110
Beck, J., and Linsenmair, K. E. (2006). Feasibility of light-trapping in community research on moths: attraction radius of light, completeness of samples, nightly flight times and seasonality of southeast-Asian hawkmoths (Lepidoptera: Sphingidae). J. Res. Lepid. 39, 18–36. doi: 10.5962/p.266537
Bhunjun, C. S., Phukhamsakda, C., Jayawardena, R. S., Jeewon, R., Promputtha, I., and Hyde, K. D. (2021). Investigating species boundaries in Colletotrichum. Fungal Divers. 107, 107–127. doi: 10.1007/s13225-021-00471-z
Bibby, C. J., Burgess, N. D., Hill, D. A., and Mustoe, S. H. (2000). Bird census techniques. Second Edn. U.K.: Elsevier.
Boch, S., Müller, J., Prati, D., Blaser, S., and Fischer, M. (2013). Up in the tree – the overlooked richness of bryophytes and lichens in tree crowns. PLoS One 8:e84913. doi: 10.1371/journal.pone.0084913
Brach, M., Stereńczak, K., Bolibok, L., Kwaśny, Ł., Krok, G., and Laszkowski, M. (2019). Impacts of forest spatial structure on variation of the multipath phenomenon of navigation satellite signals. Folia For. Pol. 61, 3–21. doi: 10.2478/ffp-2019-0001
Brehm, G., Niermann, J., Jaimes Nino, L. M., Enseling, D., Jüstel, T., Axmacher, J. C., et al. (2021). Moths are strongly attracted to ultraviolet and blue radiation. Insect Conserv. Diver. 14, 188–198. doi: 10.1111/icad.12476
Buffington, M. L., Garretson, A., Kula, R. R., Gates, M. W., Carpenter, R., Smith, D. R., et al. (2021). Pan trap color preference across Hymenoptera in a forest clearing. Entomol. Exp. Appl. 169, 298–311. doi: 10.1111/eea.13008
Burki, F., Sandin, M. M., and Jamy, M. (2021). Diversity and ecology of protists revealed by metabarcoding. Curr. Biol. 31, R1267–R1280. doi: 10.1016/j.cub.2021.07.066
Bütler, R., Lachat, T., Larrieu, L., and Paillet, Y. (2013). “Habitat trees: key elements for forest biodiversity” in Integrative approaches as an opportunity for the conservation of Forest biodiversity. eds. D. Kraus and F. Krumm (Freiburg, Germany: In Focus – Managing Forest in Europe, European Forest Institute), 84–91.
Buyck, B., Laessoe, T., Meyer, M., and Hofstetter, V. (2010). Chapter 12. Collecting the neglected kingdom: Guidelines for the field mycologist with emphasis on the larger fungi. In Manual on field recording techniques and protocols for all taxa biodiversity inventories, vol 8, eds. J. Eymann, J. Degreef, C. Häuser, J.C. Monje, Y. Samyn, and D. VandenSpiegel (Brussels, Belgium: ABC Taxa), 18–48.
Calders, K., Adams, J., Armston, J., Bartholomeus, H., Bauwens, S., Bentley, L. P., et al. (2020). Terrestrial laser scanning in forest ecology: expanding the horizon. Remote Sens. Environ. 251:112102. doi: 10.1016/j.rse.2020.112102
Callaghan, D. A., During, H. J., Forrest, L. L., and Wilkinson, K. (2020). Neglected and at risk: bryophyte diaspore banks of coastal dune systems. J. Bryol. 42, 223–234. doi: 10.1080/03736687.2020.1743561
Camacho, C., Coulouris, G., Avagyan, V., Ma, N., Papadopoulos, J., Bealer, K., et al. (2009). BLAST+: architecture and applications. BMC Bioinf. 10:421. doi: 10.1186/1471-2105-10-421
Cannon, C. H., Borchetta, C., Anderson, D. L., Arellano, G., Barker, M., Charron, G., et al. (2021). Extending our scientific reach in arboreal ecosystems for research and management. Front. For. Global Change 4. doi: 10.3389/ffgc.2021.712165
Carrias, J. F., Brouard, O., Leroy, C., Céréghino, R., Pelozuelo, L., Dejean, A., et al. (2012). An ant–plant mutualism induces shifts in the protist community structure of a tank-bromeliad. Basic Appl. Ecol. 13, 698–705. doi: 10.1016/j.baae.2012.10.002
Catchpole, D. (2004). The ecology of vascular epiphytes on a Ficus L. host (Moraceae) in a Peruvian cloud forest. [Honorus degree thesis]. [Tasmania (AU)]: University of Tasmania.
Catchpole, D. (2012). Orographic gradients in climate and forest cover at the cordillera Yanachaga, Peru. [PhD dissertation]. [Tasmania (AU)]: University of Tasmania.
Catchpole, D. J., and Kirkpatrick, J. B. (2010). “The outstandingly speciose epiphytic flora of a single stranger fig (Ficus crassiuscula) in a Peruvian montane cloud forest” in Tropical montane cloud forests. eds. L. A. Bruijnzeel, F. N. Scatena, and L. S. Hamilton (New York: Cambridge University Press), 142–146.
Chambers, J. Q., Higuchi, N., and Schimel, J. P. (1998). Ancient trees in Amazonia. Nature 391, 135–136. doi: 10.1038/34325
Córdova-Chávez, O., Castillo-Campos, G., Pérez-Pérez, R. E., García-Franco, J. G., and Cáceres, M. E. S. (2016). Alpha diversity of lichens associated with Quercus laurina in a mountain cloud forest at Cofre de Perote eastern slope (La Cortadura), Veracruz, Mexico. Cryptogam. Mycol. 37, 193–204. doi: 10.7872/crym/v37.iss2.2016.193
Cornelissen, J. H. C., and ter Steege, H. T. (1989). Distribution and ecology of epiphytic bryophytes and lichens in dry evergreen forest of Guyana. J. Trop. Ecol. 5, 131–150. doi: 10.1017/S0266467400003400
Dantas, T. S., Valente, D. V., Carvalho-Silva, M., and Câmara, P. E. A. S. (2018). Bryophyte phylogeny and DNA barcoding: tools for assessing Brazilian diversity. Rev. Bras. Bot. 41, 497–505. doi: 10.1007/s40415-018-0473-9
DaRocha, W. D., Ribeiro, S. P., Neves, F. S., Fernandes, G. W., Leponce, M., and Delabie, J. H. C. (2015). How does bromeliad distribution structure the arboreal ant assemblage (Hymenoptera: Formicidae) on a single tree in a Brazilian Atlantic forest agroecosystem? Myrmecol. News 21, 83–92. doi: 10.25849/myrmecol.news_021:083
De Basanta, D. W., and Estrada-Torres, A. (2017). Chapter 10 “Techniques for recording and isolating Myxomycetes,” in Myxomycetes, eds. S.L. Stephenson and C. Rojas (Cambridge, Massachusetts, USA: Academic Press), 333–363
de Oliveira Amaral, A., E Ferreira, A. F. T. A. F., and Da Silva Bentes, J. L. (2022). Fungal endophytic community associated with Hevea spp.: diversity, enzymatic activity, and biocontrol potential. Braz. J. Microbiol. 53, 857–872. doi: 10.1007/s42770-022-00709-1
Díaz, M. M., Solari, S., Gregorin, R., Aguirre, L. F., and Barquez, R. M. (2021). Clave de identificación de los murciélagos Neotropicales/Chave de indentifição dos morcegos Neotropicais. Argentina: Publicación Especial PCMA 4, 211.
Dos Reis, J. B. A., Lorenzi, A. S., and do Vale, H. M. M. (2022). Methods used for the study of endophytic fungi: A review on methodologies and challenges, and associated tips. Arch. Microbiol. 204:675. doi: 10.1007/s00203-022-03283-0
Doughty, C. E., Keany, J. M., Wiebe, B. C., Rey-Sanchez, C., Carter, K. R., Middleby, K. B., et al. (2023). Tropical forests are approaching critical temperature thresholds. Nature 621, 105–111. doi: 10.1038/s41586-023-06391-z
Erwin, T. L., and Scott, J. C. (1980). Seasonal and size patterns, trophic structure, and richness of Coleoptera in the tropical arboreal ecosystem: the fauna of the tree Luehea seemanii Triana and planch in the canal zone of Panama. Coleopt. Bull. 34, 305–322.
Eskov, A. K., and Kolomeitseva, G. L. (2022). Vascular epiphytes: plants that have broken ties with the ground. Biol. Bull. Rev. 12, 304–333. doi: 10.1134/s2079086422030033
Floren, A. (2010). “Sampling arthropods from the canopy by insecticidal knockdown,” in Manual on field recording techniques and protocols for all taxa biodiversity inventories, part 1, vol. 8, eds. J. Eymann, J. Degreef, C. Häuser, J.C. Monje, and Y. Samyn and VandenSpiegel, D. (Brussels, Belgium: ABC Taxa), 158–172.
Fontaine, B., Perrard, A., and Bouchet, P. (2012). 21 years of shelf life between discovery and description of new species. Curr. Biol. 22, R943–R944. doi: 10.1016/j.cub.2012.10.029
Gamboa, M. A., and Bayman, P. (2001). Communities of endophytic fungi in leaves of a tropical timber tree (Guarea guidonia: Meliaceae). Biotropica 33, 352–360. doi: 10.1111/j.1744-7429.2001.tb00187.x
Gaudeul, M., and Rouhan, G. (2013). A plea for modern botanical collections to include DNA-friendly material. Trends Plant Sci. 18, 184–185. doi: 10.1016/j.tplants.2012.12.006
Gradstein, R. S. (1992). “The vanishing tropical rainforest as an environment for bryophytes and lichens” in Bryophytes and lichens in a changing environment. eds. J. W. Bates and A. M. Farmer (Oxford: Oxford University Press), 232–256.
Hebert, P. D., Cywinska, A., Ball, S. L., and DeWaard, J. R. (2003). Biological identifications through DNA barcodes. Proc. Biol. Sci. 270, 313–321. doi: 10.1098/rspb.2002.2218
Hofstetter, V., Buyck, B., Eyssartier, G., Schnee, S., and Gindro, K. (2019). The unbearable lightness of sequenced-based identification. Fungal Divers. 96, 243–284. doi: 10.1007/s13225-019-00428-3
CBOL Plant Working GroupHollingsworth, P. M., Forrest, L. L., Spouge, J. L., Hajibabaei, M., Ratnasingham, S., et al. (2009). A DNA barcode for land plants. Proc. Natl. Acad. Sci. U. S. A. 106, 12794–12797. doi: 10.1073/pnas.0905845106
Ibrahim, M., Oyebanji, E., Fowora, M., Aiyeolemi, A., Orabuchi, C., Akinnawo, B., et al. (2021). Extracts of endophytic fungi from leaves of selected Nigerian ethnomedicinal plants exhibited antioxidant activity. BMC Complement Med. Ther. 21:98. doi: 10.1186/s12906-021-03269-3
International Plant Names Index (IPNI) (2024). The Royal Botanic Gardens, Kew, Harvard University Herbaria and Libraries and Australian National Herbarium. Available at: http://www.ipni.org (Accessed March 11, 2024).
Jarman, S. J., and Kantvilas, G. (1995). Epiphytes on an old Huon pine tree (Lagarostrobos franklinii) in Tasmanian rainforest. N. Z. J. Bot. 33, 65–78. doi: 10.1080/0028825X.1995.10412944
Jauss, R.-T., Walden, S., Fiore-Donno, A. M., Dumack, K., Schaffer, S., Wolf, R., et al. (2020). From Forest soil to the canopy: increased habitat diversity does not increase species richness of Cercozoa and Oomycota in tree canopies. Front. Microbiol. 11:592189. doi: 10.3389/fmicb.2020.592189
Johansson, D. (1974). Ecology of vascular epiphytes in west African rain forest. Acta Phytogeogr. Suec. 59, 1–136.
Komposch, H., and Hafellner, J. (2000). Diversity and vertical distribution of lichens in a Venezuelan tropical lowland rain forest. Selbyana 21, 11–24. doi: 10.2307/41760048
Kress, W. J. (2017). Plant DNA barcodes: applications today and in the future. J. Syst. Evol. 55, 291–307. doi: 10.1111/jse.12254
Krömer, T., Kessler, M., and Gradstein, S. R. (2006). Vertical stratification of vascular epiphytes in submontane and montane forest of the Bolivian Andes: the importance of the understory. Plant Ecol. 189, 261–278. doi: 10.1007/s11258-006-9182-8
Kuo, L. Y., Li, F. W., Chiou, W. L., and Wang, C. N. (2011). First insights into fern matK phylogeny. Mol. Phylogenet. Evol. 59, 556–566. doi: 10.1016/j.ympev.2011.03.010
Lamarre, G. P. A., Mendoza, I., Rougerie, R., Decaëns, T., Hérault, B., and Beneluz, F. (2015). Stay out (almost) all night: contrasting responses in flight activity among tropical moth assemblages. Neotrop. Entomol. 44, 109–115. doi: 10.1007/s13744-014-0264-3
Lawton, J. H., Bignell, D. E., Bolton, B., Bloemers, G. F., Eggleton, P., Hammond, P. M., et al. (1998). Biodiversity inventories, indicator taxa and effects of habitat modification in tropical forest. Nature 391, 72–76. doi: 10.1038/34166
Leponce, M., Corbara, B., Delabie, J. H. C., Orivel, J., Aberlenc, H.-P., Bail, J., et al. (2021a). Spatial and functional structure of an entire ant assemblage in a lowland Panamanian rainforest. Basic Appl. Ecol. 56, 32–44. doi: 10.1016/j.baae.2021.06.007
Leponce, M., Dejean, A., Mottl, O., and Klimes, P. (2021b). Rapid assessment of the three-dimensional distribution of dominant arboreal ants in tropical forests. Insect Conserv. Diversity 14, 426–438. doi: 10.1111/icad.12486
Leponce, M., Meyer, C., Hauser, C., Bouchet, P., Delabie, J. H. C., Weigt, L., et al. (2010). “Challenges and solutions for planning and implementing large-scale biotic inventories” in Manual on field recording techniques and protocols for all taxa biodiversity inventories. eds. J. Eymann, J. Degreeg, Ch. Hauser, J. C. Monje, and D. Van den Spiegel (ABC taxa), 8, 19–49.
Lindenmayer, D. B., Blanchard, W., McBurney, L., Blair, D., Banks, S., Likens, G. E., et al. (2012). Interacting factors driving a major loss of large trees with cavities in a forest ecosystem. PLoS One 7:e41864. doi: 10.1371/journal.pone.0041864
Lindenmayer, D. B., and Laurance, W. F. (2017). The ecology, distribution, conservation and management of large old trees. Biol. Rev. Camb. Philos. Soc. 92, 1434–1458. doi: 10.1111/brv.12290
Lindo, Z., and Winchester, N. (2008). Scale dependent diversity patterns in arboreal and terrestrial oribatid mite (Acari: Oribatida) communities. Ecography 31, 53–60. doi: 10.1111/j.2007.0906-7590.05320.x
Li, X., Yang, Y., Henry, R. J., Rossetto, M., Wang, Y., and Chen, S. (2015). Plant DNA barcoding: from gene to genome. Biol. Rev. Camb. Philos. Soc. 90, 157–166. doi: 10.1111/brv.12104
Lopez-Baucells, A., Rocha, R., Bobrowiec, P. E. D., Palmeirim, J. M., and Meyer, C. F. J. (2016). Field guide to Amazonian bats. Manaus: INPA, 174.
Lücking, R., Aime, M. C., Robbertse, B., Miller, A. N., Aoki, T., Ariyawansa, H. A., et al. (2021). Fungal taxonomy and sequence-based nomenclature. Nat. Microbiol. 6, 540–548. doi: 10.1038/s41564-021-00888-x
Lutz, J. A., Furniss, T. J., Johnson, D. J., Davies, S. J., Allen, D., Alonso, A., et al. (2018). Global importance of large-diameter trees. Glob. Ecol. Biogeogr. 27, 849–864. doi: 10.1111/geb.12747
Luz, F. A., and Mendonça Jr, D. S. M. (2019). Guilds in insect galls: who is who. Fla. Entomol. 102, 207–210. doi: 10.1653/024.102.0133
Martin, R., Gazis, R., Skaltsas, D., Chaverri, P., and Hibbett, D. (2015). Unexpected diversity of basidiomycetous endophytes in sapwood and leaves of Hevea. Mycologia 107, 284–297. doi: 10.3852/14-206
Mavrodiev, E. V., Dervinis, C., Whitten, W. M., Gitzendanner, M. A., Kirst, M., Kim, S., et al. (2021). A new, simple, highly scalable, and efficient protocol for genomic DNA extraction from diverse plant taxa. Appl. Plant Sci. 9:e11413. doi: 10.1002/aps3.11413
Meierotto, S., Sharkey, M. J., Janzen, D. H., Hallwachs, W., Hebert, P. D. N., Chapman, E. G., et al. (2019). A revolutionary protocol to describe understudied hyperdiverse taxa and overcome the taxonomic impediment. Dtsch. Entomol. Z. 66, 119–145. doi: 10.3897/dez.66.34683
Méndez-Castro, F. E., Bader, M. Y., Mendieta-Leiva, G., and Rao, D. (2018). Islands in the trees: A biogeographic exploration of epiphyte-dwelling spiders. J. Biogeogr. 45, 2262–2271. doi: 10.1111/jbi.13422
Montfoort, D., and Ek, R. C. (1990). Vertical distribution and ecology of epiphytic bryophytes and lichens in a lowland rain forest in French Guiana. Utrecht: Institute of Systematic Botany.
Nitta, J. H., and Chambers, S. M. (2022). Identifying cryptic fern gametophytes using DNA barcoding: A review. Appl. Plant Sci. 10:e11465. doi: 10.1002/aps3.11465
Normann, F., Weigelt, P., Gehrig-Downie, C., Gradstein, S. R., Sipman, H. J. M., Obregon, A., et al. (2010). Diversity and vertical distribution of epiphytic macrolichens in lowland rain forest and lowland cloud forest of French Guiana. Ecol. Indic. 10, 1111–1118. doi: 10.1016/j.ecolind.2010.03.008
North, G. B., Lynch, F. H., Maharaj, F. D., Phillips, C. A., and Woodside, W. T. (2013). Leaf hydraulic conductance for a tank bromeliad: axial and radial pathways for moving and conserving water. Front. Plant Sci. 4:78. doi: 10.3389/fpls.2013.00078
Pezzini, F. F., Ferrari, G., Forrest, L. L., Hart, M. L., Nishii, K., and Kidner, C. A. (2023). Target capture and genome skimming for plant diversity studies. Appl. Plant Sci. 11:e11537. doi: 10.1002/aps3.11537
Pietro-Souza, W., Mello, I. S., Vendruscullo, S. J., Silva, G. F. D., Cunha, C. N. D., White, J. F., et al. (2017). Endophytic fungal communities of Polygonum acuminatum and Aeschynomene fluminensis are influenced by soil mercury contamination. PLoS One 12:e0182017. doi: 10.1371/journal.pone.0182017
Portal-Cahuana, L. A., Fontana, C., Assis-Pereira, G., Groenendijk, P., Roig, F. A., and Tomazello-Filho, M. (2023). Thirty-four years of dendrochronological studies in Perú: A review of advances and challenges. Dendrochronologia 78:126058. doi: 10.1016/j.dendro.2023.126058
Ranatunga, M., Kellar, C., and Pettigrove, V. (2023). Toxicological impacts of synthetic pyrethroids on non-target aquatic organisms: A review. Environ. Adv. 12:100388. doi: 10.1016/j.envadv.2023.100388
Remm, J., and Lõhmus, A. (2011). Tree cavities in forests – the broad distribution pattern of a keystone structure for biodiversity. For. Ecol. Manag. 262, 579–585. doi: 10.1016/j.foreco.2011.04.028
RIEGL (n.d.), Laser measurement systems GmbH, Horn, Austria. Available at: www.riegl.com, version 2.15.
Romanski, J. (2007). Epiphytic bryophytes and habitat microclimate variation in lower montane rainforest, Peru. [PhD dissertation]. [Tasmania (AU)]: University of Tasmania.
Rouhan, G., and Gaudeul, M. (2021). Plant taxonomy: A historical perspective, current challenges, and perspectives. Methods Mol. Biol. 2222, 1–37. doi: 10.1007/978-1-0716-0997-2_1
Sahu, P. K., Tilgam, J., Mishra, S., Hamid, S., Gupta, A., Verma, S. K., et al. (2022). Surface sterilization for isolation of endophytes: Ensuring what (not) to grow. J. Basic Microbiol. 62, 647–668. doi: 10.1002/jobm.202100462
Sanford, W. W. (1967). Distribution of epiphytic orchids in semi-deciduous tropical forest in southern Nigeria. J. Ecol. 56, 697–705. doi: 10.2307/2258101
Sanver, D., and Hawkins, B. A. (2000). Galls as habitats: the inquiline communities of insect galls. Basic Appl. Ecol. 1, 3–11. doi: 10.1078/1439-1791-00001
Scheffers, B. R., Phillips, B. L., Laurance, W. F., Sodhi, N. S., Diesmos, A., and Williams, S. E. (2013). Increasing arboreality with altitude: a novel biogeographic dimension. Proc. Biol. Sci. 280:20131581. doi: 10.1098/rspb.2013.1581
Schoch, C. L., Seifert, K. A., Huhndorf, S., Robert, V., Spouge, J. L., Levesque, C. A., et al. (2012). Nuclear ribosomal internal transcribed spacer (ITS) region as a universal DNA barcode marker for Fungi. Proc. Natl. Acad. Sci. 109, 6241–6246. doi: 10.1073/pnas.1117018109
Schuettpelz, E., and Trapnell, D. W. (2006). Exceptional epiphyte diversity on a single tree in Costa Rica. Selbyana 27, 65–71.
Sillett, S. C., Gradstein, S. R., and Griffin, D. (1995). Bryophyte diversity of Ficus tree crowns from cloud forest and pasture in Costa Rica. Bryologist 98, 251–260. doi: 10.2307/3243312
Skvarla, M. J., Larson, J. L., Fisher, J. R., and Dowling, A. P. (2021). A review of terrestrial and canopy malaise traps. Ann. Entomol. Soc. Am. 114, 27–47. doi: 10.1093/aesa/saaa044
Song, L. W. Y., Liu, W. Y., Ma, W. Z., and Tan, Z. H. (2011). Bole epiphytic bryophytes on Lithocarpus xylocarpus (Kurz) Markgr. in the Ailao Mountains, SW China. Ecol. Res. 26, 351–363. doi: 10.1007/s11284-010-0790-3
Souto-Vilarós, D., Basset, Y., Blažek, P., Laird-Hopkins, B., Segar, S. T., Navarro-Valencia, E., et al. (2024). Illuminating arthropod diversity in a tropical forest: assessing biodiversity by automatic light trapping and DNA metabarcoding. Environ. DNA 6:e540. doi: 10.1002/edn3.540
Stephenson, S. L., and Stempen, H. (1994). Myxomycetes: A handbook of slime molds. USA: Timber Press Inc., University of Minnesota.
Terryn, L., Calders, K., Åkerblom, M., Bartholomeus, H., Disney, M., Levick, S., et al. (2023). Analysing individual 3D tree structure using the R package ITSMe. Methods Ecol. Evol. 14, 231–241. doi: 10.1111/2041-210X.14026
Terryn, L., Calders, K., Bartholomeus, H., Bartolo, R. E., Brede, B., D'Hont, B., et al. (2021). Quantifying tropical forest stand structure through terrestrial and UAV laser scanning fusion. Brussels, Belgium: 2021 IEEE International Geoscience and Remote Sensing Symposium IGARSS, 8281–8284. doi: 10.1109/IGARSS47720.2021.9553992
Terryn, L., Calders, K., Bartholomeus, H., Bartolo, R. E., Brede, B., D'hont, B., et al. (2022). Quantifying tropical forest structure through terrestrial and UAV laser scanning fusion in Australian rainforests. Remote Sens. Environ. 271:112912. doi: 10.1016/j.rse.2022.112912
Tews, J., Brose, U., Grimm, V., Tielbörger, K., Wichmann, M. C., Schwager, M., et al. (2004). Animal species diversity driven by habitat heterogeneity/diversity: the importance of keystone structure. J. Biogeogr. 31, 79–92. doi: 10.1046/j.0305-0270.2003.00994.x
Thines, M., Crous, P. W., Aime, M. C., Aoki, T., Cai, L., Hyde, K. D., et al. (2018). Ten reasons why a sequence-based nomenclature is not useful for fungi anytime soon. IMA Fungus 9, 177–183. doi: 10.5598/imafungus.2018.09.01.11
Thomas, B., Audonneau, N. C., Machouart, M., and Debourgogne, A. (2019). Molecular identification of fusarium species complexes: which gene and which database to choose in clinical practice? J Mycol. Med. 29, 56–58. doi: 10.1016/j.mycmed.2019.01.003
Truxa, C., and Fiedler, K. (2012). Attraction to light – from how far do moths (Lepidoptera) return to weak artificial sources of light? Eur. J. Entomol. 109, 77–84. doi: 10.14411/eje.2012.010
Walden, S., Jauss, R.-T., Feng, K., Fiore-Donno, A. M., Dumack, K., Schaffer, S., et al. (2021). On the phenology of protists: recurrent patterns reveal seasonal variation of protistan (Rhizaria: Cercozoa and Endomyxa) communities in tree canopies. FEMS Microbiol. Ecol. 97:fiab081. doi: 10.1093/femsec/fiab081
Wilkening, A. J., Foltz, J. L., Atkinson, T. H., and Connor, M. D. (1981). An omnidirectional flight trap for ascending and descending insects. Can. Entomol. 113, 453–455. doi: 10.4039/Ent113453-5
Yanoviak, S. P., Nadkarni, N. M., and Gering, J. C. (2003). Arthropods in epiphytes: a diversity component that is not effectively sampled by canopy fogging. Biodivers. Conserv. 12, 731–741. doi: 10.1023/A:1022472912747
Yao, H., Sun, X., He, C., Maitra, P., Li, X. C., and Guo, L. D. (2019). Phyllosphere epiphytic and endophytic fungal community and network structures differ in a tropical mangrove ecosystem. Microbiome 7:57. doi: 10.1186/s40168-019-0671-0
Zamani, A., Dal Pos, D., Fric, Z. F., Orfinger, A. B., Scherz, M. D., Bartoňová, A. S., et al. (2022). The future of zoological taxonomy is integrative, not minimalist. Syst. Biodivers. 20, 1–14. doi: 10.1080/14772000.2022.2063964
Zheng, J., Wang, Y., and Nihan, N. L. (2005). “Quantitative evaluation of GPS performance under forest canopies,” Proceedings. 2005 IEEE Networking, Sensing and Control, 2005. Tucson, AZ, USA, 777–782. doi: 10.1109/ICNSC.2005.1461289
Keywords: canopy, eukaryotes, Johansson zones, microclimate, Amazon-Andes, terrestrial laser scanning, taxonomy, biodiversity magnitude
Citation: Leponce M, Basset Y, Aristizábal-Botero Á, Baïben N, Barbut J, Buyck B, Butterill P, Calders K, Cárdenas G, Carrias J-F, Catchpole D, D’hont B, Delabie J, Drescher J, Ertz D, Heughebaert A, Hofstetter V, Leroy C, Melki F, Michaux J, Neita-Moreno JC, Poirier E, Rougerie R, Rouhan G, Rufray V, Scheu S, Schmidl J, Vanderpoorten A, Villemant C, Youdjou N and Pascal O (2024) Unveiling the above-ground eukaryotic diversity supported by individual large old trees: the “Life on Trees” integrative protocol. Front. For. Glob. Change. 7:1425492. doi: 10.3389/ffgc.2024.1425492
Edited by:
Roger Laurence Kitching, Griffith University, AustraliaReviewed by:
Erica Odell, RMIT University, AustraliaLouise A. Ashton, The University of Hong Kong, Hong Kong SAR, China
Copyright © 2024 Leponce, Basset, Aristizábal-Botero, Baïben, Barbut, Buyck, Butterill, Calders, Cárdenas, Carrias, Catchpole, D’hont, Delabie, Drescher, Ertz, Heughebaert, Hofstetter, Leroy, Melki, Michaux, Neita-Moreno, Poirier, Rougerie, Rouhan, Rufray, Scheu, Schmidl, Vanderpoorten, Villemant, Youdjou and Pascal. This is an open-access article distributed under the terms of the Creative Commons Attribution License (CC BY). The use, distribution or reproduction in other forums is permitted, provided the original author(s) and the copyright owner(s) are credited and that the original publication in this journal is cited, in accordance with accepted academic practice. No use, distribution or reproduction is permitted which does not comply with these terms.
*Correspondence: Maurice Leponce, bWxlcG9uY2VAbmF0dXJhbHNjaWVuY2VzLmJl