 Sean M. P. Cahoon
 Colin Maher2,3†
 Daniel Crawford
 Patrick F. Sullivan
94% of researchers rate our articles as excellent or good
Learn more about the work of our research integrity team to safeguard the quality of each article we publish.
Find out more
ORIGINAL RESEARCH article
Front. For. Glob. Change, 22 July 2024
Sec. Temperate and Boreal Forests
Volume 7 - 2024 | https://doi.org/10.3389/ffgc.2024.1419813
Alaska’s boreal forests are experiencing rapid changes in climate that may favor deciduous-dominated systems, with important implications for global biogeochemical and energy cycles. However, aspen (Populus tremuloides Michx.) has experienced substantial defoliation from the aspen leaf miner (Phyllocnistis populiella Cham., hereafter ALM) in Alaska, resulting in significant growth reductions. We conducted a tree-ring and Δ13C study to test the hypothesis that moisture limitation may have predisposed aspen to leaf miner damage. Contrary to our hypothesis, differences in climate-growth correlations between relatively severely and lightly affected trees were negligible during the pre-outbreak decades. Stands with greater summer precipitation had more limited ALM impact, however differences among models were small and multiple climate variables were suitable predictors of ALM impact. The strong negative relationship we detected between tree-ring Δ13C and basal area increment (BAI) suggested that interannual variation in Δ13C was driven primarily by variation in photosynthesis, limiting the utility of Δ13C as a tool to detect stomatal responses to moisture-limitation. Instead, we found that larger, faster-growing individuals on gentler slopes showed a stronger absolute reduction in BAI (pre-ALM BAI−post-ALM BAI), but were similar in relative BAI reduction (pre-ALM BAI/post-ALM BAI), with smaller, slower growing trees. Older trees and stands with greater relative abundance of white spruce [Picea glauca (Moench) Voss] had greater relative ALM impact whereas slower growing trees on steeper slopes were less affected. The significant effect of white spruce abundance on ALM impact was likely due to favorable leaf miner overwintering habitat provided beneath white spruce trees, which can lead to increased leaf miner survival and thus greater reductions in aspen growth. Our results illustrate the subtle but complex biotic interaction between microclimate and pest physiology in determining ALM-induced aspen growth reductions, adding important nuance to a hypothesized increase in deciduous tree cover in Alaska’s boreal forest.
The boreal forest is experiencing rapid changes in climate with important implications for global biogeochemical and energy cycles (Bonan, 2008; Mack et al., 2021). Air temperatures at northern high latitudes have warmed faster than the global average (Ballinger et al., 2020), with complex impacts on forest productivity. In particular, warming-induced drought conditions have contributed to widespread declines in tree growth and increasing mortality in many boreal regions (Michaelian et al., 2011; Peng et al., 2011; Ma et al., 2012; Chen et al., 2017), while other areas appear to show increasing productivity (Berner and Goetz, 2022). Changing climate has also triggered episodic or sustained insect outbreaks that have caused substantial mortality and declines in growth throughout boreal North America (Berg et al., 2006; Csank et al., 2016; Chen et al., 2018; Foster et al., 2022). The singular and interactive effects of drought and insect outbreaks have led to significant changes in carbon (C) cycling and reduced ecosystem services such as timber supply and carbon storage (Volney and Fleming, 2000; Price et al., 2013). As warming is expected to continue throughout the 21st century (IPCC, 2023), disentangling the effects of insects and climate on tree growth remains an important challenge.
In general, the growth-differentiation balance hypothesis posits that plants face the trade-off of growing to compete or defending against pathogens and herbivores. In an abundance of water and nutrients, plants are expected to prioritize growth and reproduction over cell differentiation and the storage of secondary metabolites, including defensive compounds (Herms and Mattson, 1992). However, when conditions become limiting, for instance during moderate drought conditions, growth is often constrained as C resources are allocated to non-structural carbohydrate pools, including defensive compounds (Lorio, 1986), resulting in reduced plant productivity. Prolonged or severe drought that results in hydraulic failure or sustained stomatal closure to limit water loss (McDowell et al., 2008; McDowell, 2011) reduces photosynthesis and carbohydrate production, eventually leading to the depletion of C-based resources (Anderegg et al., 2015; Gely et al., 2020). While drought can directly affect within-plant carbon and water budgets, the role insects play in impacting plant productivity involves a complex array of biological processes including feeding strategies, seasonality, drought severity and duration, and insect physiology (Koricheva et al., 1998; Jactel et al., 2012; Anderegg et al., 2015; Gely et al., 2020).
The interactive effects of drought-induced reductions in productivity and insect defoliation are possible precursors to tree mortality (Anderegg et al., 2015). However, the outcomes of interactions between drought effects on trees and defoliators appears to vary among and within insect guilds and tree responses to drought severity (Mattson and Haack, 1987; Huberty and Denno, 2004; Jactel et al., 2012). For example, moderate drought has been shown to increase leaf nitrogen concentration, thus encouraging N-limited defoliators such as leaf miners (Mattson and Haack, 1987; Huberty and Denno, 2004). On the other hand, the increased production of secondary metabolites used in defense may counteract the benefits of high nutrient concentrations on insect performance (Jamieson et al., 2017). Drought stress can also result in tougher foliage (Wright and Westoby, 2002) reducing the availability of nitrogen and resulting in lower herbivory among leaf chewing insects (Jactel et al., 2012). Although insect outbreaks are often associated with periods of moisture limitation (Kolb et al., 2016), evidence of drought predisposing trees to defoliation – and subsequent reductions in growth – has been mixed, especially among leaf miners (Jactel et al., 2012).
In Alaska, trembling aspen (Populus tremuloides Michx.; hereafter aspen) has experienced widespread damage from the defoliating insect aspen leaf miner (Phyllocnistis populiella Cham.) since the late 1990s, affecting over 300 thousand hectares at its peak in 20071 and causing a significant reduction in aspen growth (Cahoon et al., 2018). While the large aspen tortrix (Choristoneura conflictana Wlkr) affected aspen in interior Alaska between 1966 and 1969 (Torgersen and Beckwith, 1974), there are no prior reported widespread outbreaks of ALM. ALM larvae impact aspen growth by killing stomata guard cells, reducing gas exchange and limiting C uptake (Wagner et al., 2008, 2020). Recent dendrochronological and forest inventory analyses in interior Alaska have found aspen growth and productivity are sensitive to summer moisture availability and atmospheric vapor pressure deficit (Cahoon et al., 2018; Trugman et al., 2018; Boyd et al., 2021). In western Canada, aspen has shown sensitivity to moisture limitation and insect defoliation, resulting in widespread dieback and a substantial loss of ecosystem C (Hogg et al., 2002, 2008; Michaelian et al., 2011; Chen et al., 2018). In addition, Ruess et al. (2021) linked recent aspen mortality in interior Alaska with the co-occurring effects of moisture limitation, an aggressive fungal stem canker disease, and the ongoing ALM outbreak. Meanwhile, seasonal and annual temperature has increased since the middle of the 20th Century for most of interior Alaska (Ballinger et al., 2023). Annual precipitation has also increased in the same region. However, seasonal variability has resulted in significant increases in summer precipitation and a slight decline in spring precipitation (Ballinger et al., 2023). While the changing climate is expected to have direct impacts on tree growth, it remains unclear whether climate conditions in the late 1990s may have predisposed aspen to greater ALM defoliation through the depletion of defensive compounds and/or favorable conditions for ALM growth and reproduction.
Boyd et al. (2021) showed greater sensitivity to moisture limiting conditions among aspen that died during the ALM outbreak. However, growth of trees that died after the height of the ALM outbreak diverged from living trees in the late 1940s, well before the ALM outbreak in 2000. Moreover, dying trees were smaller and lower in the canopy, suggesting competitive interactions may have been an additional precursor to greater mortality among ALM impacted trees. Despite the dramatic and widespread impact ALM has had on aspen growth in interior Alaska, tree physiological status prior to−and potentially affecting impacts of−the ALM outbreak remains unknown. Stable C isotope discrimination in radial growth rings may provide insight in this regard. Attempts to characterize tree physiology using carbon isotope analysis have focused on the interaction between climate and ALM during an outbreak (Boyd et al., 2019; Wagner et al., 2020). However, evidence from leaf-level studies indicates that adaxial and abaxial feeding habits have differential effects on leaf δ13C (Wagner et al., 2020), thus complicating the interpretation of tree-ring δ13C results during an outbreak without detailed knowledge of leaf miner feeding location and intensity. In contrast, improving our understanding of aspen physiological status prior to an outbreak may lead to more accurate predictions of defoliator impacts on aspen growth if certain conditions predispose aspen to more severe insect herbivory. Tree-ring records provide an opportunity to test these ideas with respect to the most recent ALM outbreak.
Our primary goal in this study was to test the hypothesis that the unprecedented ALM outbreak in the 2000s occurred because moisture limitation predisposed aspen to severe damage. If moisture limitation predisposed aspen to ALM herbivory, we predicted that older trees may have experienced more severe ALM impacts as aspen are susceptible to decay after age 60 (Peterson et al., 1992) due to degraded pit membranes (Sperry et al., 1991), making them more sensitive to hydraulic failure during periods of low water availability. Furthermore, we predicted more severe ALM impacts in locations with steep, well-drained soils, which should exacerbate soil moisture limitation and increase aspen sensitivity to drought conditions. More generally, because we predicted that plant water status would play a key role in determining ALM impact, we aimed to characterize aspen moisture relations prior to the outbreak using annual tree-ring α-cellulose carbon isotope composition (δ13C). Tree-ring δ13C represents a time-integrated measure of tree physiological responses to environmental change (Cernusak and Ubierna, 2022), and is a powerful tool used in dendrochronological studies to assess long-term trends in annual water use efficiency. If moisture limitation played an important physiological role in predisposing aspen to ALM, we expected C isotope discrimination (Δ13C) and growth to decline in the years prior to the ALM outbreak and that trees more severely impacted by ALM would show greater reductions in Δ13C. An alternative hypothesis to moisture limitation predisposing aspen to ALM herbivory is that stand basal area composition played a role in ALM impacts on aspen growth due to preferred ALM overwintering habitat in white spruce [Picea glauca (Moench) Voss] litter. ALM moths have been shown to have better survival rates when utilizing drier white spruce litter for overwintering (Wagner et al., 2012). Thus, we predicted that sites with a greater proportion of white spruce would show greater ALM damage by providing preferential ALM hibernacula.
This study took place throughout the Tanana Valley in interior Alaska, broadly encompassed by the southeast interior climate division (Ballinger et al., 2023). Study sites were roughly centered around Fairbanks which experiences a continental climate with warm summers (1981–2010 summer mean temperature: 15.4°C), cold winters (1981–2010 winter mean temperature: −20.3°C) and relatively light precipitation (1981–2010 total precipitation normal: 27.5 cm; NOAA NCEI 2020). The forested area is comprised mainly of black spruce (52%; Picea mariana Mill.), Alaska paper birch (18.7%; Betula neoalaskana Sarg.), white spruce (16.3%); and aspen (8.2%) (Cahoon and Baer, 2022).
Between June and September 2019, we visited 22 sites throughout the Tanana Valley (Figure 1) where we collected aspen tree cores and conducted simple forest inventories. As a guide, we targeted our sampling sites using aerial surveys of ALM damage conducted between 2016 and 2018 by the USFS Forest Health Protection (FHP) program (see text footnote 1). In addition to mapping ALM damage extent, USFS personnel assign damage severity classes to each polygon, based on the percent of live and standing dead trees that are damaged or recently dead. We elected to use the 2016-2018 polygons, as opposed to older versions, because they served as a more recent guide to ALM damage and aligned closely with our 2019 sampling season. Because we were limited to road-accessible plots, our sample size was unequal among FHP damage classes (Supplementary Table 1). However, the distribution of damage classes we sampled was similar to the overall distribution among all FHP polygons (Supplementary Figure 1). At each site, we navigated to a random point within each polygon that was dominated by aspen and conducted an inventory of all trees ≥ 5 cm in diameter at breast height (DBH; approximately 1.37 m from the ground) within a circular plot. The radius of each plot varied among plot locations to efficiently inventory and core a representative number of trees. Plot radius was determined by ensuring the size of the plot would include at least 30 aspen trees. To increase our sample size, we included tree cores collected during previous studies in the region. Three plots (BD35, F028, MDMX) were sampled in 2016, two plots were sampled in 2015 (CPCRW and BCEF), and one plot (LVN137) was sampled in 2013. At the five sites that were visited prior to 2019, trees were sampled unsystematically, plot radius was not determined and information on non-focal species was not available. Slope, elevation, and aspect were measured at plot center using a clinometer and handheld GPS. We extracted missing terrain data from a digital elevation model (Arctic DEM, v3; Porter et al., 2023)
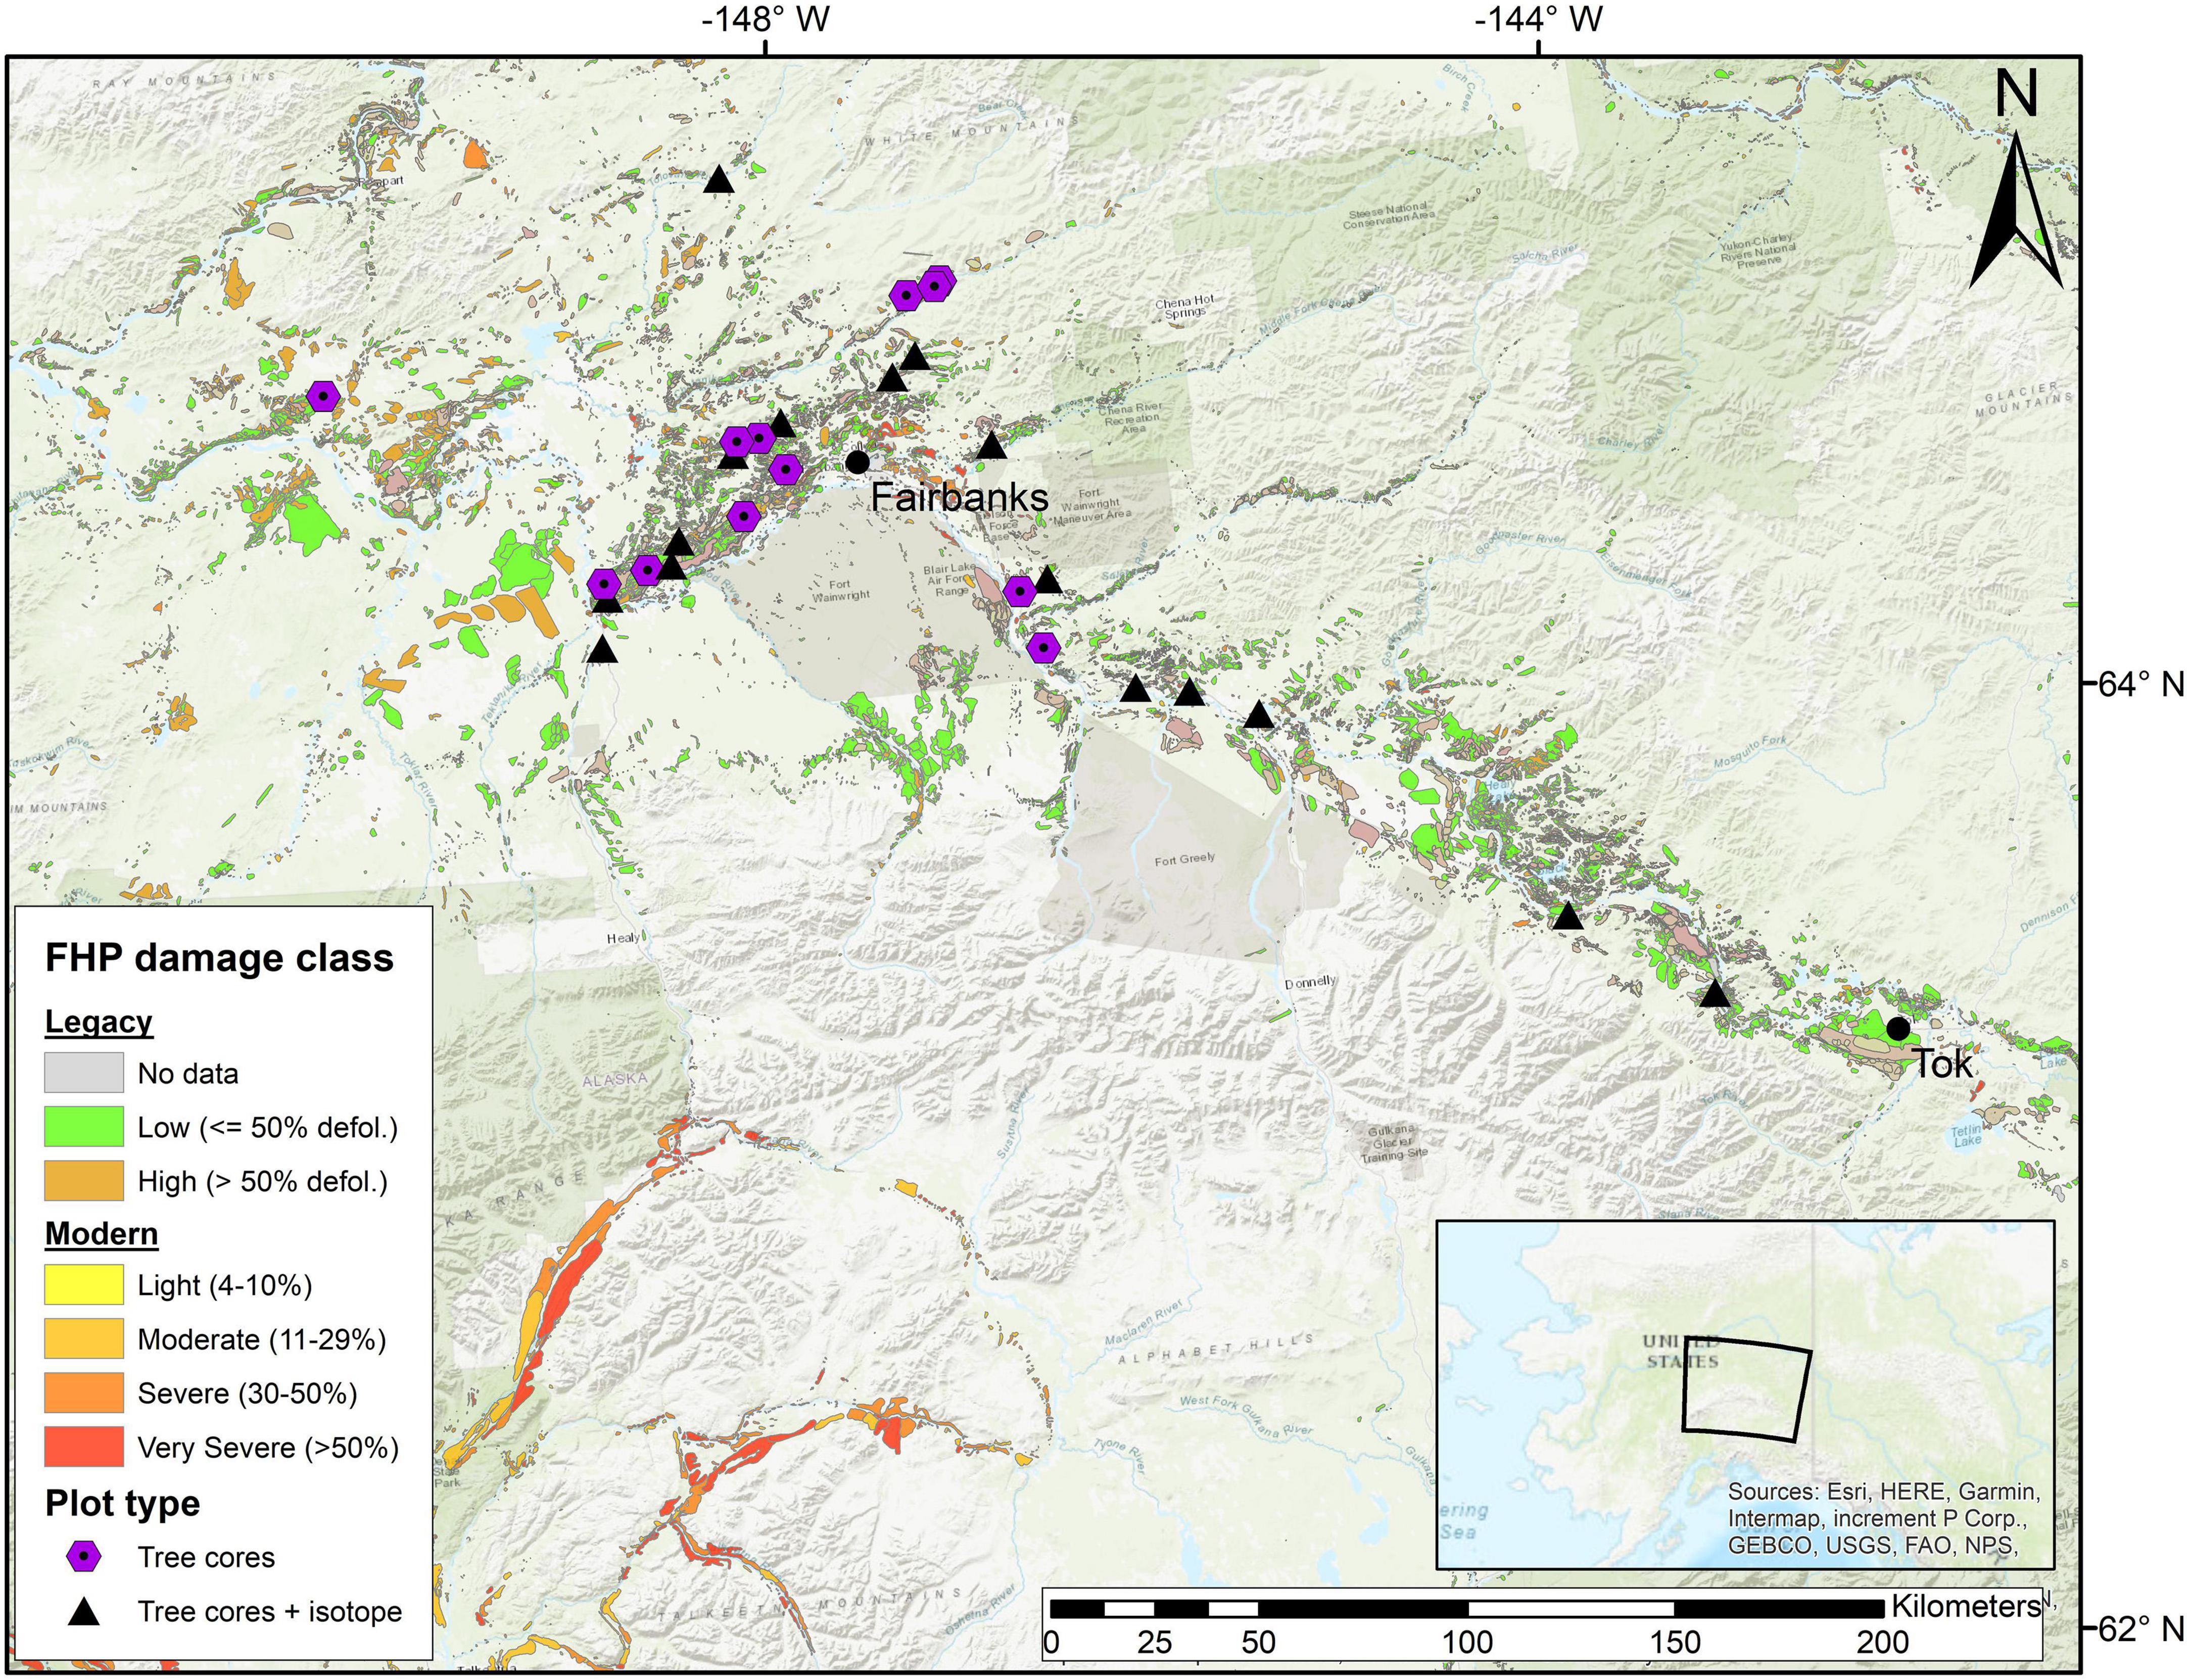
Figure 1. Map of plot locations and aspen leaf miner (ALM) damage throughout the Tanana Valley, Alaska. ALM damage polygons were provided by the Forest Health Protection (FHP) aerial detection surveys (https://www.fs.usda.gov/detailfull/r10/forest-grasslandhealth/?cid=FSEPRD639288&width=full). Between 1997 and 2015, FHP used a simplified classification of defoliation, where areas with less than or equal 50% crown defoliation were consired low impact, whereas locations greater than 50% defoliation were considered high impact (“Legacy” in legend). Since 2016 (“Modern” in legend), FHP classifies damage with more detailed categories ranging from very light (1–3% defoliation) to very severe (> 50% defoliation). This study relied on the modern classification. Very light and light polygons were collapsed into a single “light” category. Tree cores were collected at all locations following a plot inventory. Plots marked with a black triangle represent locations where additional C isotope data were collected from annual tree rings.
For plots sampled in 2019, trees were selected for coring by randomly choosing 12–15 trees from across five size classes, after completing the inventory. This stratified random sampling design reduces tree selection bias and ensures trees from all age/size classes are included in the tree core sample (Nehrbass-Ahles et al., 2014). When possible, we collected a single through core from each tree at breast height that contained two radii. However, heart rot was common and limited sampling to a single radius in many cases. The aspen running canker (Neodothiora populina Crouse, G.C. Adams, & Winton; Crous et al., 2020) is a major source of mortality in the region, often leading to mortality after a single growing season (Ruess et al., 2021). Trees were inspected for signs of canker along the bole, but the disease was not detected in our study sites. In the lab, cores were mounted on wooden blocks and sanded using progressively finer-grit sandpaper up to 1200 grit. Individual ring widths were measured on digital scans of one radius per core using either web-based micrometry2 or WinDENDRO (Version 2017a, Regent Instruments Canada Inc. Quebec City, Quebec, Canada). Challenging samples were measured using a sliding bench micrometer with a digital encoder (Velmex Inc. Bloomfield, New York, USA) and the shadow technique to identify ring boundaries (DeRose and Gardner, 2010). Age was estimated when possible using the pith offset tool in CooRecorder (Version 9.6, Cybis Elektronik & Data AB, Saltsjöbaden, Sweden) for cores that did not include pith. Each growth ring was aligned with a calendar year and cross-dated with the overall chronology of all cores using COFECHA. Cores that were not significantly (P ≥ 0.05) correlated with the overall chronology were reexamined under a microscope to identify the numerous micro rings during the outbreak years. Potential dating errors identified by COFECHA were adjusted only when visual evidence of a missing ring was obvious (e.g. abnormally large rings when narrow rings were expected). Overall, the mean interseries correlation was 0.52 (SD ± 0.14) from 270 trees spanning the years 1825–2018.
To examine long-term aspen growth trends, we converted ring width data to basal area increment (BAI, mm2 year–1) using the “outside-in” method in the dplR package (Bunn, 2008, 2010) in R (R Core Team, 2022). The substantial heart rot we encountered in many cores made pith offset estimates unreliable. Instead, we estimated inner-bark diameter with field DBH measurements and by measuring bark thickness in the laboratory for a subset of 107 cores and included an estimate of confidence in identifying bark completeness (high, medium, low) based on whether inner and other bark layers could be identified for each observation. Bark thickness among our samples (minimum = 1.6 mm; maximum = 13.4 mm, mean = 5.1 mm) was similar to other allometric studies (Johansson, 1996; Konôpka et al., 2022). We then applied a multiple regression model to predict high confidence bark thickness of the remaining cores using DBH and confidence as the independent variables (R2 = 0.55, P < 0.001). Finally, bark thickness was subtracted from DBH to obtain inner-bark diameter.
Annual BAI was averaged among trees across polygons within each of the 4 FHP damage classes. Because we expected ALM effects on individual trees to vary within FHP severity classes, we created an individual tree ALM impact index by comparing BAI before and after the 2000 ALM outbreak. To do so, we calculated post-ALM growth for each tree as the sum of BAI for the time period common to all trees following the ALM outbreak (12 years; 2001–2012). We then calculated pre-ALM growth as the sum of BAI for the 12 years prior to the ALM outbreak (1989–2000) for each tree. The ALM impact index was then calculated as the ratio between pre-ALM BAI and post-ALM BAI and represents the relative reduction in BAI caused by ALM. Finally, we categorized our dataset into high and low ALM impact classes based on whether each tree fell below or above the median ALM impact index. We then compared growth chronologies between trees in high and low ALM impact categories by calculating the arithmetic mean annual BAI for each category.
We obtained a time series of downscaled monthly average air temperature (°C; Tave), total monthly precipitation (PPT, mm), and climate moisture index (CMI) for each plot location using ClimateNA (Wang et al., 2016). ClimateNA downscales the parameter-elevation regressions on independent slopes model (PRISM; Daly et al., 2008) using climate normal data (1971–2000) at 800m resolution to derive monthly, seasonal, and annual variables at specific locations. CMI is the difference between monthly precipitation and PET (Hogg, 1997) and has been linked with drought-driven declines in aspen growth in Canada (Hogg et al., 2008; Michaelian et al., 2011) and Alaska (Boyd et al., 2019). Positive CMI values represent greater moisture availability, whereas negative values represent a deficit. We also obtained standardized precipitation-evapotranspiration index data (SPEI, unitless; Vicente-Serrano et al., 2010) from the SPEIbase dataset3 for each location in monthly increments to compare temporal trends of CMI and SPEI and examine variation among indices that may affect aspen growth (Supplementary Figure 2). SPEI is a multi-scalar drought index with a 0.5° spatial resolution that relies on monthly precipitation minus potential evapotranspiration (PET; using the Penman-Monteith method), relative to the long-term mean. Positive SPEI values represent a relative abundance in moisture availability, whereas negative values represent moisture deficit.
To examine tree water relations prior to the 2000 ALM outbreak, we analyzed carbon isotope composition (δ13C) in tree-ring α-cellulose from 44 trees across 16 plots in our study region for the period 1970–2000. We omitted years during the outbreak, as ALM feeding habits can have confounding effects on δ13C (Wagner et al., 2020) and because one of our primary objectives was to investigate tree-water relations as a possible predisposing factor of ALM impact. From each plot, 2–4 cores with the highest correlation with the master chronology (i.e., cores with the highest cross-dating confidence) were selected for isotope sampling. Tissue from annual growth rings was extracted using a razor blade and milled to fine powder. Tree ring α-cellulose was isolated using a water modified Brendel method (Brendel et al., 2000; Gaudinski et al., 2005), dried overnight at 40° C and analyzed for δ13C using an elemental analyzer (Costech 4010, Costech Analytical, Valencia, CA) coupled with a continuous-flow isotope mass spectrometer (Thermo-Finnigan Delta Plus XP, Thermo Electron Corp., Waltham, MA) at the Environment and Natural Resources Institute’s Stable Isotope Laboratory, University of Alaska Anchorage.
We calculated carbon isotope discrimination (Δ13C) as:
where δ13Catm and δ13Cp are C isotope ratios of atmospheric CO2 and plant material, respectively, and d represents the post-photosynthetic fractionation between leaf material and wood. We used atmospheric δ13Catm data compiled by Belmecheri and Lavergne (2020) to correct plant δ13C for the gradual depletion in atmospheric δ13Catm (i.e., the Suess effect) and a post-photosynthetic fractionation constant (d) of 2.1‰ (Frank et al., 2015).
We examined the temporal relationship between climate and aspen growth using Spearman correlations after removing temporal autocorrelation in ring width and climate data. First, we fit an autoregressive integrated moving average (ARIMA) function, selected using Akaike’s Information Criteria (AICc) to identify the best-fit model for each ring width series with the auto.arima function in the forecast package in R (Hyndman and Khandakar, 2008). Ring width index (RWI) was then calculated as the residual difference between observed and modeled ring-width values. To determine whether autocorrelation had been sufficiently removed from the ring-width data, we computed Pearson’s correlation coefficients in each series for a maximum lag of three years using the acf function in R (Supplementary Figure 3). Finally, we calculated mean RWI chronologies for high and low ALM impact index categories using Tukey’s biweight mean to avoid the influence of outliers. We also controlled for any autocorrelation in the climate data by applying the same ARIMA fitting and residual extraction process to each climate variable prior to climate-growth correlation analyses.
To gain insight into tree-level conditions prior to the ALM outbreak, we grouped trees into three growth classes (fast, intermediate, and slow) based on mean diameter increment in the 12 years prior to the ALM outbreak (1989–2000). We calculated diameter increment by first subtracting twice the annual ring width increment (mm) from the inner-bark diameter at the time of coring for each growth year. The mean diameter increment was then calculated as the difference in inner bark diameter between 2000 and 1989, divided by 12. We then compared the distribution of tree size (DBH) and age (assessed at the time of coring) among growth classes to better understand demographic differences. Because we expected slope may affect water availability and hence, ALM impact, we also examined the distribution of plot slope among growth classes. Finally, we compared the relative (i.e. ALM impact index) and absolute (i.e. the difference between pre-ALM BAI and post-ALM BAI) impact of ALM among growth classes. The purpose of this analysis was to examine whether tree size and age affected growth rates, and whether ALM exerted differential effects among tree growth classes. We elected to use mean diameter increment for this analysis to avoid the influence of tree size on BAI.
We tested for differences in plot characteristics (e.g. basal area, elevation, aspect, slope, MAT, MAP) and tree attributes (i.e. DBH and age) among FHP damage classes using an analysis of variance model in R. The same procedure was used to test for differences in DBH, age, slope, ALM impact index (i.e. relative ALM impact), and BAIpreALM - BAIpostALM (i.e. absolute ALM impact) among growth classes. Pairwise comparisons were made among FHP damage classes and growth classes using Tukey’s Honest Significant Difference (HSD), and considered significant if P < 0.05. Spearman correlation coefficients were calculated between mean RWI chronologies and climate variables (e.g. Tave, PPT, SPEI, and CMI) for each month, and every combination of consecutive months for the growth year and the year prior to growth in the modendro package in R (github.com/ctmaher/modendro). To determine which drought index was best correlated with aspen growth, we compared Spearman correlation coefficients between monthly SPEI and CMI, and the overall mean RWI chronology (Supplementary Figure 4). To explore the influence of plot slope on climate sensitivity, we first created RWI chronologies at each location as the mean of all trees cored on every plot, after removing temporal autocorrelation using the same ARIMA method mentioned above. We then calculated Spearman correlation coefficients between monthly growing season (May-August) downscaled climate at the same location and plot-level mean RWI. Again, temporal autocorrelation in the climate data was removed using the same ARIMA model fitting process. We then categorized each plot as steep or gentle based on whether the slope was greater or less than the overall median value (7.8°; n = 11 plots per category) and tested for differences in correlation coefficients between slope categories using an analysis of variance (ANOVA) model. Correlations were considered significant if P < 0.05. To avoid the biological influence of ALM in our climate-growth correlation analyses, we excluded years after 2000 when the ALM outbreak expanded rapidly.
To determine the most important predictors of ALM impact index (BAIpreALM / BAIpostALM), we constructed a series of linear mixed effects models (LMEM) and a model selection approach that began with a full model that included tree age, slope, white spruce proportional basal area (PIGL_propBA) and mean climate averaged over the 12 years prior to the ALM outbreak in 2000. Tree age provided a better fit with the data than tree diameter, as assessed by a lower AICc value (Age model AICc = 197.4; diameter model AICc = 203.5, Table 1). To narrow the range of possible climate variables to include in our LMEM analysis, we used the results from our climate-growth correlation analysis (see above) to select the strongest significant climate-growth (RWI) correlations in the decades prior to the ALM outbreak. These included March-May mean air temperature (Tave_sp), total June-August precipitation in the year prior to ring formation (prev_PPT_sm), and mean June-August SPEI in the year prior to ring formation (prev_SPEI_sm). Although our climate-growth correlation analysis revealed significant correlations with SPEI throughout the current growth year, we limited our selection to the summer months because these were most likely to influence radial growth and were some of the highest correlation values among all months examined. CMI showed fewer and weaker temporal correlations with aspen RWI compared with SPEI (Supplementary Figure 4), therefore, we opted to drop CMI as a predictor variable in our LMEM analysis. PIGL_propBA was calculated on each plot where a complete inventory of trees was available by summing the basal area of all white spruce trees, then dividing by total plot basal area of all species. PIGL_propBA was not correlated with plot basal area (Spearman’s ρ = −0.06, P = 0.81), nor plot size (Spearman’s ρ = −0.16, P = 0.52). We then created seven versions of the full model that only varied in the combination of the three climate variables chosen above (i.e., Tave_sp, prev_PPT_sm, and prev_SPEI_sm; Table 1). Variance inflation factors (VIF) never exceeded 2.5.
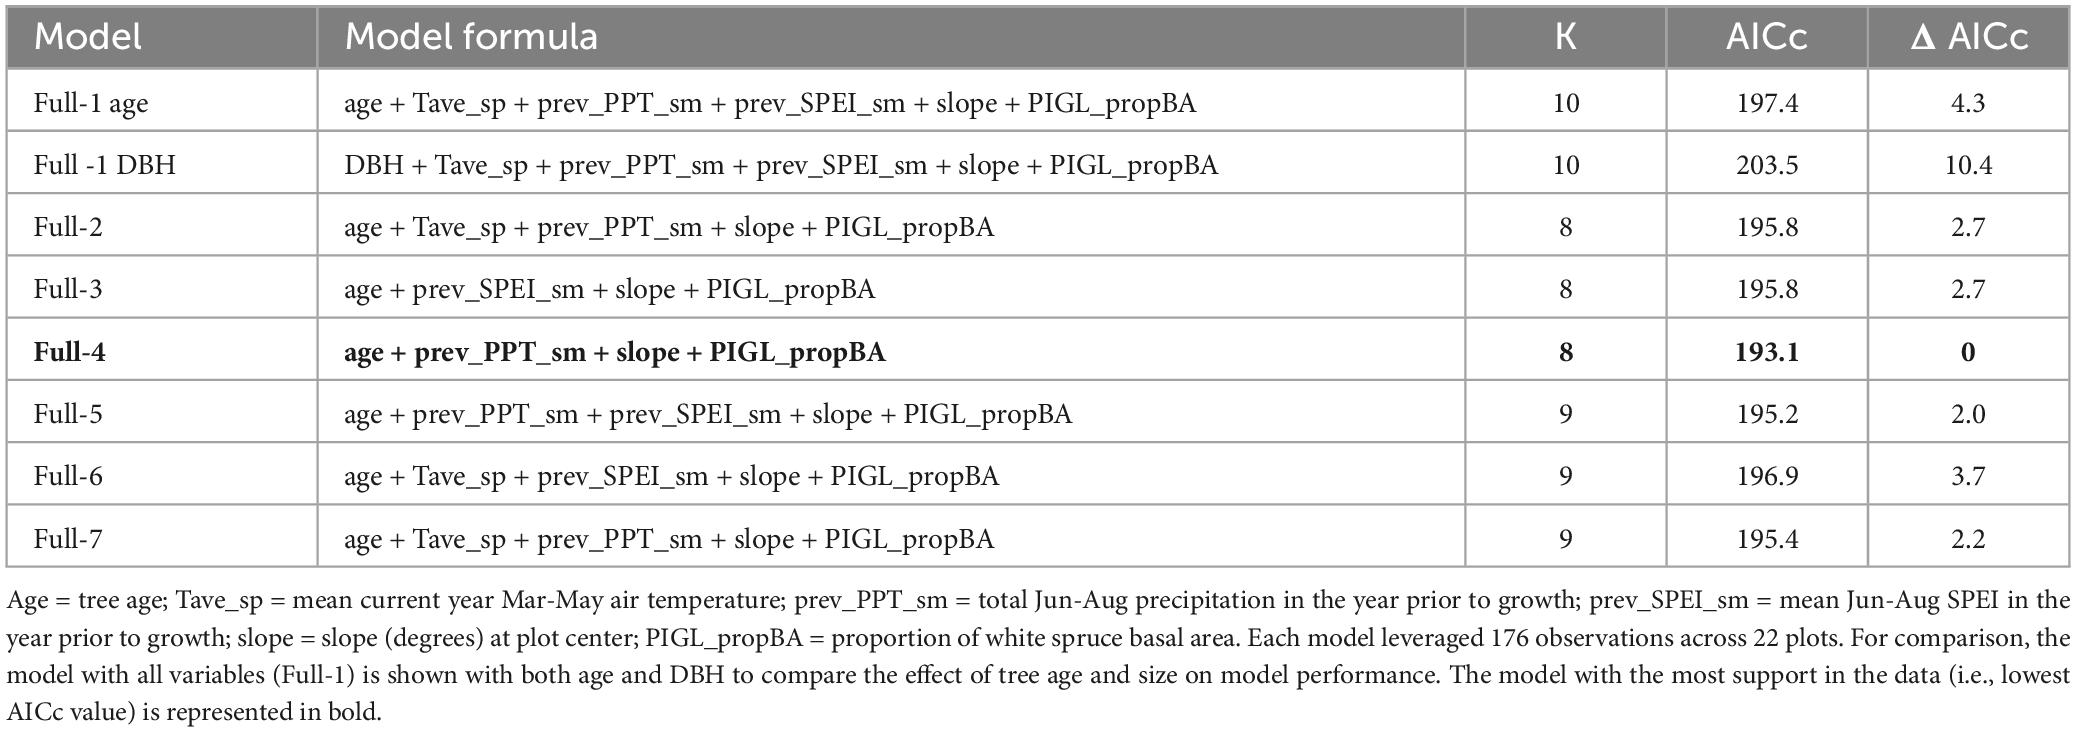
Table 1. Description and comparison of eight linear mixed effects models designed to assess support for different climate variables affecting spatial variation in ALM impact index.
Among the seven full models, the version with the lowest AICc value was considered to have the most support in the data (Table 1). Using this full model, we then tested our predictions by iteratively removing individual variables from subsequent models and compared each reduced model to the full version using a likelihood ratio test. We rejected predictions when the reduced model was not significantly different from the full version. Each reduced model was designed to test our predictions that (P1) older trees experienced greater ALM impact; (P2) locations with greater precipitation would result in more moderate ALM impact; (P3) slope would exacerbate moisture limitation, strengthening the severity of ALM; (P4) the proportion of white spruce basal area would promote ALM overwinter survival, resulting in a positive effect on ALM impact; and (P5) trees with more severe ALM impact would show lesser Δ13C as an indication of moisture limitation. The latter prediction was tested using the smaller subset of tree cores (n = 44) that were analyzed for C isotope analysis, but included annual Δ13C averaged over the 12 years prior to the ALM outbreak to align with the ALM impact index and climate variable summaries.
All models were fit using the maximum likelihood method in the nlme package (Pinheiro et al., 2021) in R and included a random effect of plot. To meet the assumptions of normality and homoscedasticity we log-transformed ALM impact index and visually examined histograms of residuals and plotting residuals against fitted values (Supplementary Figure 5). Both diagnostic steps confirmed that our model met underlying LMEM assumptions (Zuur et al., 2010).
Finally, to explore the possibility that interannual variation in Δ13C may have been influenced more by variation in photosynthesis than in stomatal conductance, we used a LMEM with year, BAI (mm2; log-transformed), ALM impact index (high or low), and their interaction as fixed effects. As Δ13C is a proxy for water-use-efficiency (photosynthesis/stomatal conductance), we expected a negative relationship between BAI and Δ13C if photosynthesis was the primary driver of interannual Δ13C, because greater growth would correspond with greater photosynthesis and reduced Δ13C. Alternatively, a positive relationship between BAI and Δ13C may indicate stomatal conductance as the primary driver of interannual Δ13C, because more open stomata would be associated with greater growth and greater Δ13C. We included the interaction between BAI and ALM impact index to examine whether differences Δ13C varied among trees with different relative ALM impact. Random effects included tree nested within plot. To account for temporal autocorrelation in Δ13C values, we included a first order autocorrelation structure for each tree nested within plot with year as the time covariate.
Plots sampled as part of this study were broadly similar in stand structure and landscape position, as we only detected significant differences among FHP classes in plot elevation (Figure 2; average elevation: Light = 247 m; Moderate = 353 m; Severe = 286 m; Very severe = 246 m). Live tree basal area (m2), ranged from a mean of 1.07 m2 in moderately affected stands to 1.38 m2 in lightly affected stands (Figure 2; Supplementary Table 1). Slope ranged from a mean of 4.3 degrees on lightly affected plots, to a mean of 12.8 degrees on very severely affected locations, a difference that approached statistical significance (P = 0.08). Mean annual temperature (MAT, °C) and mean annual precipitation (MAP, mm) spanned a broader range among moderate plots, however no significant differences arose among FHP damage categories. Overall, the oldest trees tended to be in the severe and very severely affected categories (severe mean age: 129, very severe mean age: 108), whereas the largest trees were mostly found in the moderately affected stands (mean = 27.4 cm DBH). However, differences in DBH and age were not significant among FHP damage classes.
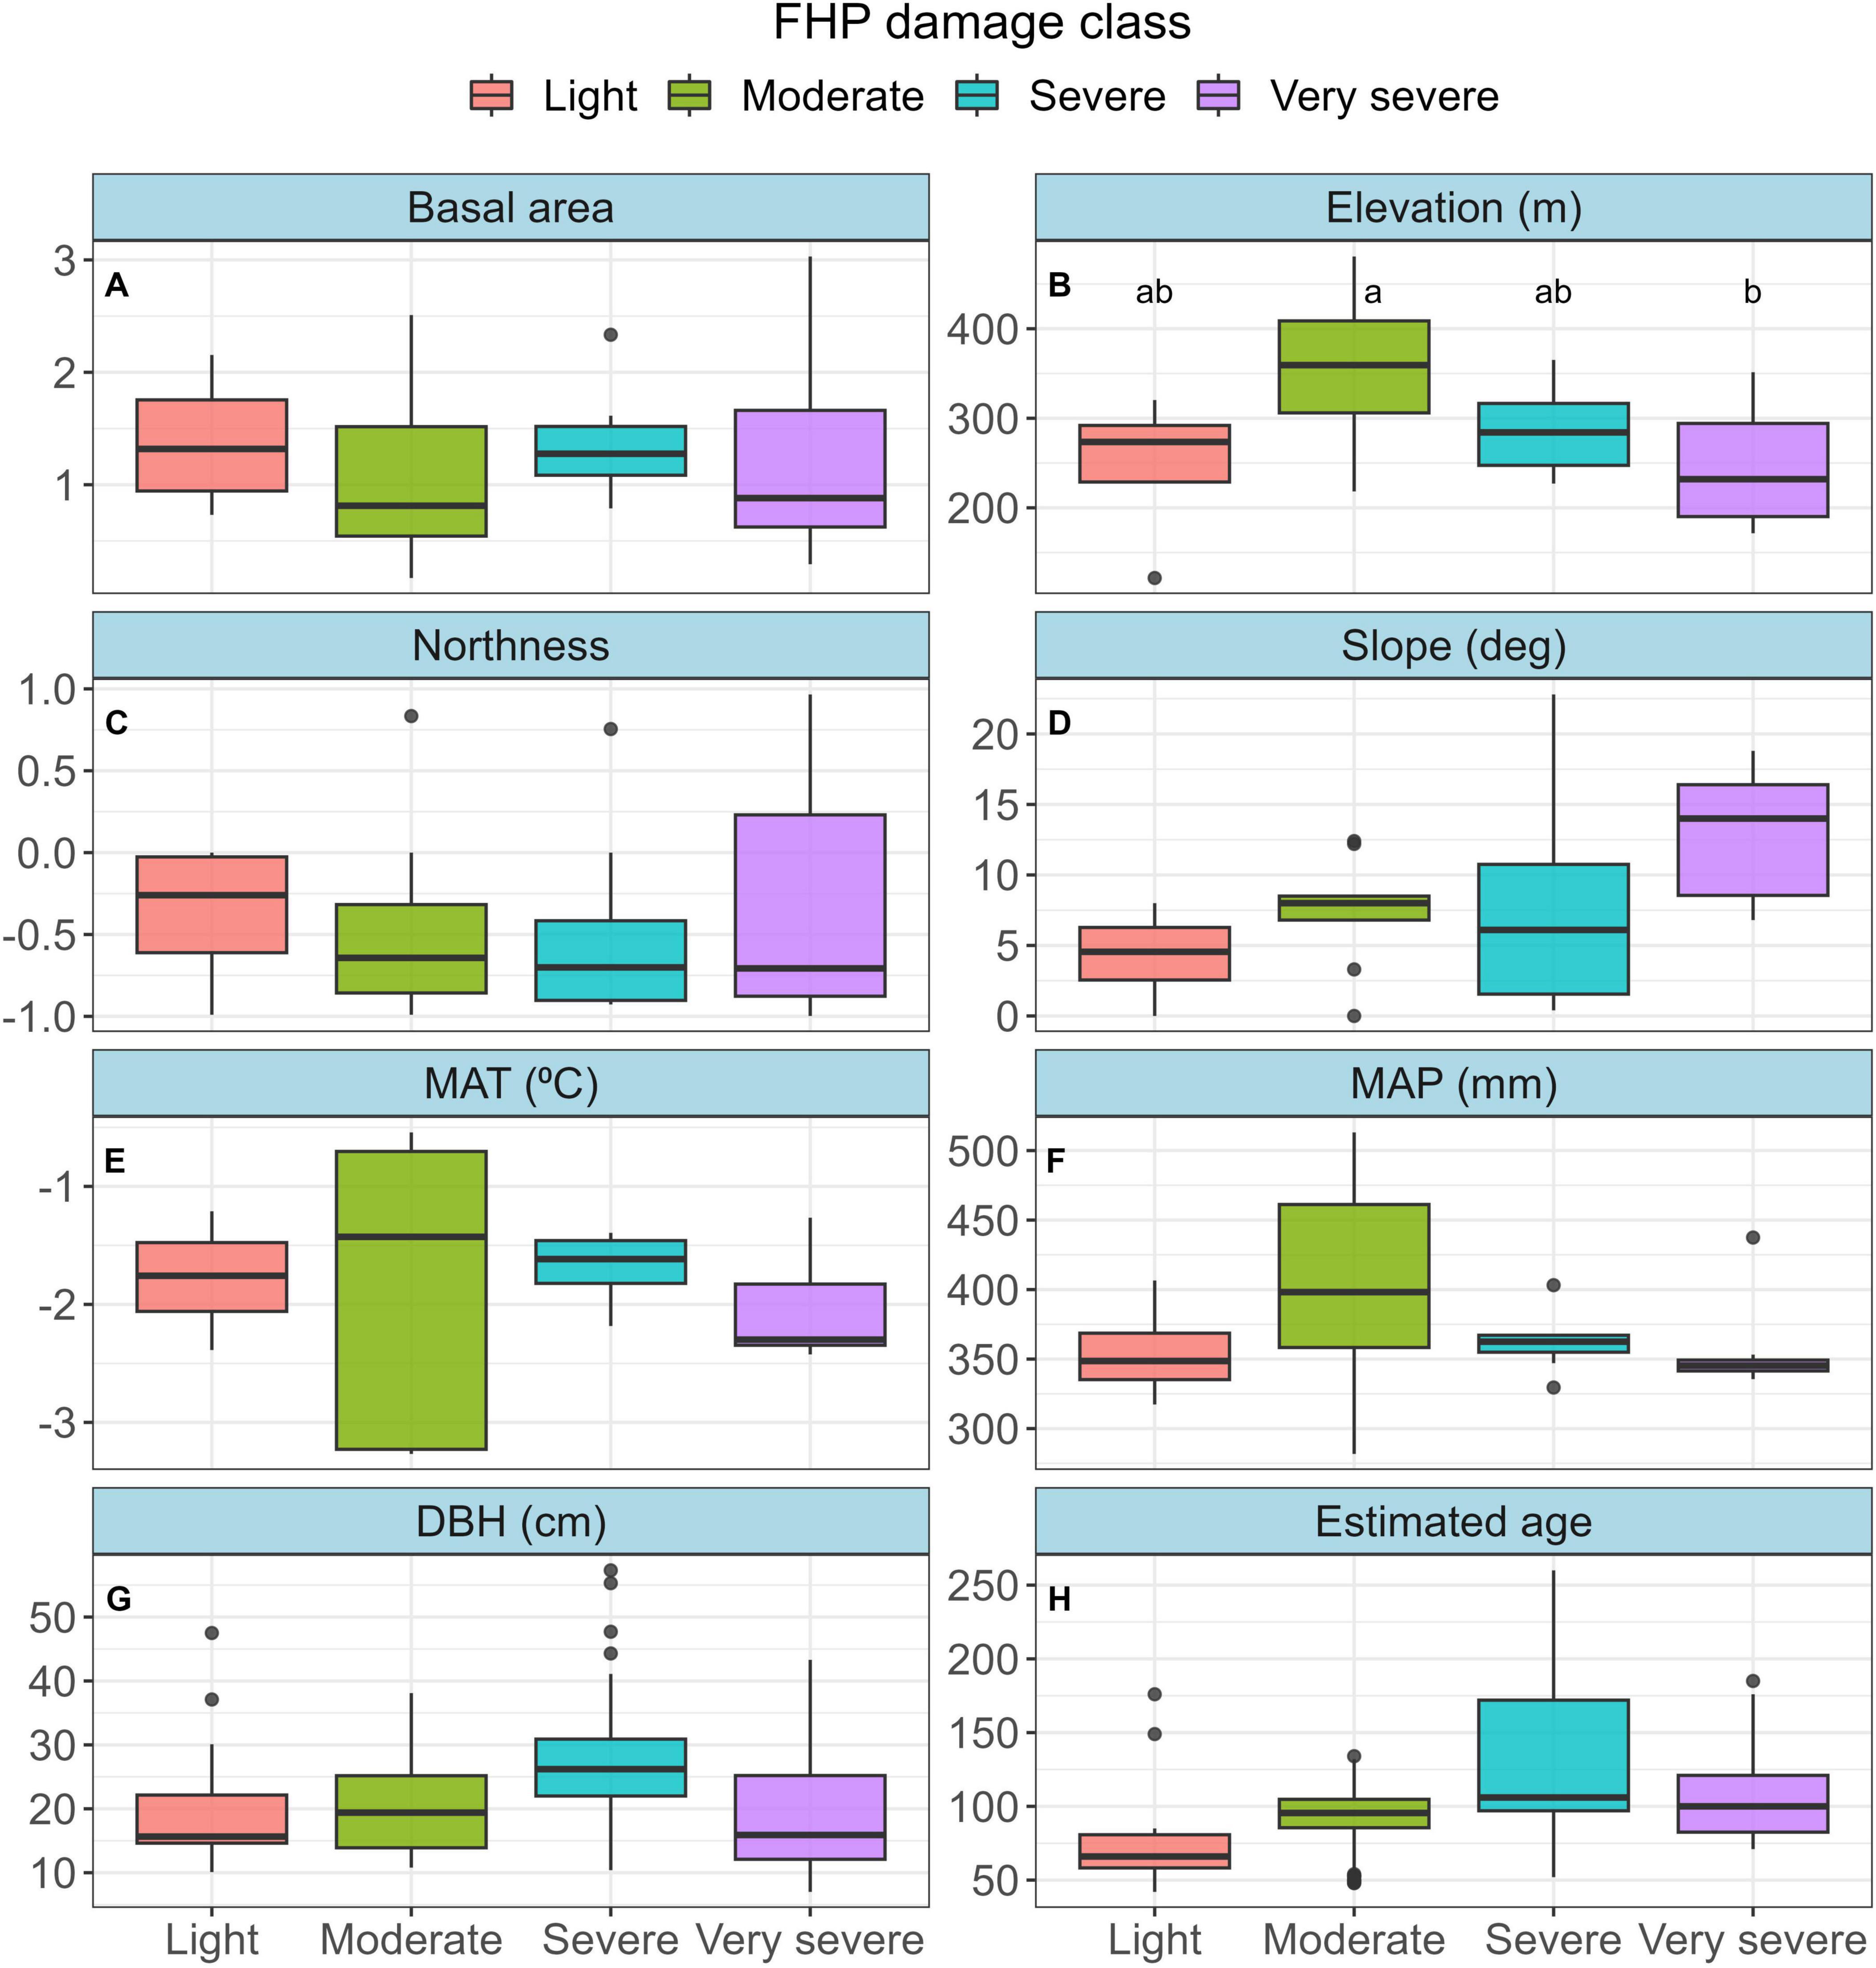
Figure 2. Distribution of plot and tree variables among Forest Health Protection (FHP) damage classes. Basal area (A; m2) is the sum of live trees on each plot. Elevation (B), northness (C) and slope (D) were measured at plot center, or using a digital elevation map. Northness is a linearized version of aspect where –1 = due south, and 1 = due north. Mean annual temperature (E; MAT) and mean annual precipitation (F; MAP) are the mean values over the 30-year period from 1990 to 2010 among all plots in each category. Diameter at breast height (G; DBH, cm) represents cored trees, and estimated age (H) is the approximate age of cored trees after accounting for samples with missing pith. Tukey’s HSD pairwise comparisons were made among FHP damage classes for each variable. Boxplots that share a lowercase letter were not significantly different (P < 0.05) in elevation. Letters were omitted from other panels because significant differences did not arise among FHP damage classes.
Between 1900 and 2020, there was a slight increase in annual temperature, June-August temperature, and March-May temperature, when averaged over all plot locations (Figures 3A, B). There was a notable rise in the rate of temperature increase beginning approximately 1960, especially during the spring months (March-May) and annually. Meanwhile, total annual precipitation showed little trend since 1900, except for an increase since the early 21st century (Figure 3C). Similarly, SPEI showed considerable decadal variation, but no trend over time (Figure 3D). SPEI was mostly positive since 2000 (e.g. relative abundance of moisture), with two notable negative departures (i.e., water deficits) in 2004 and 2013.
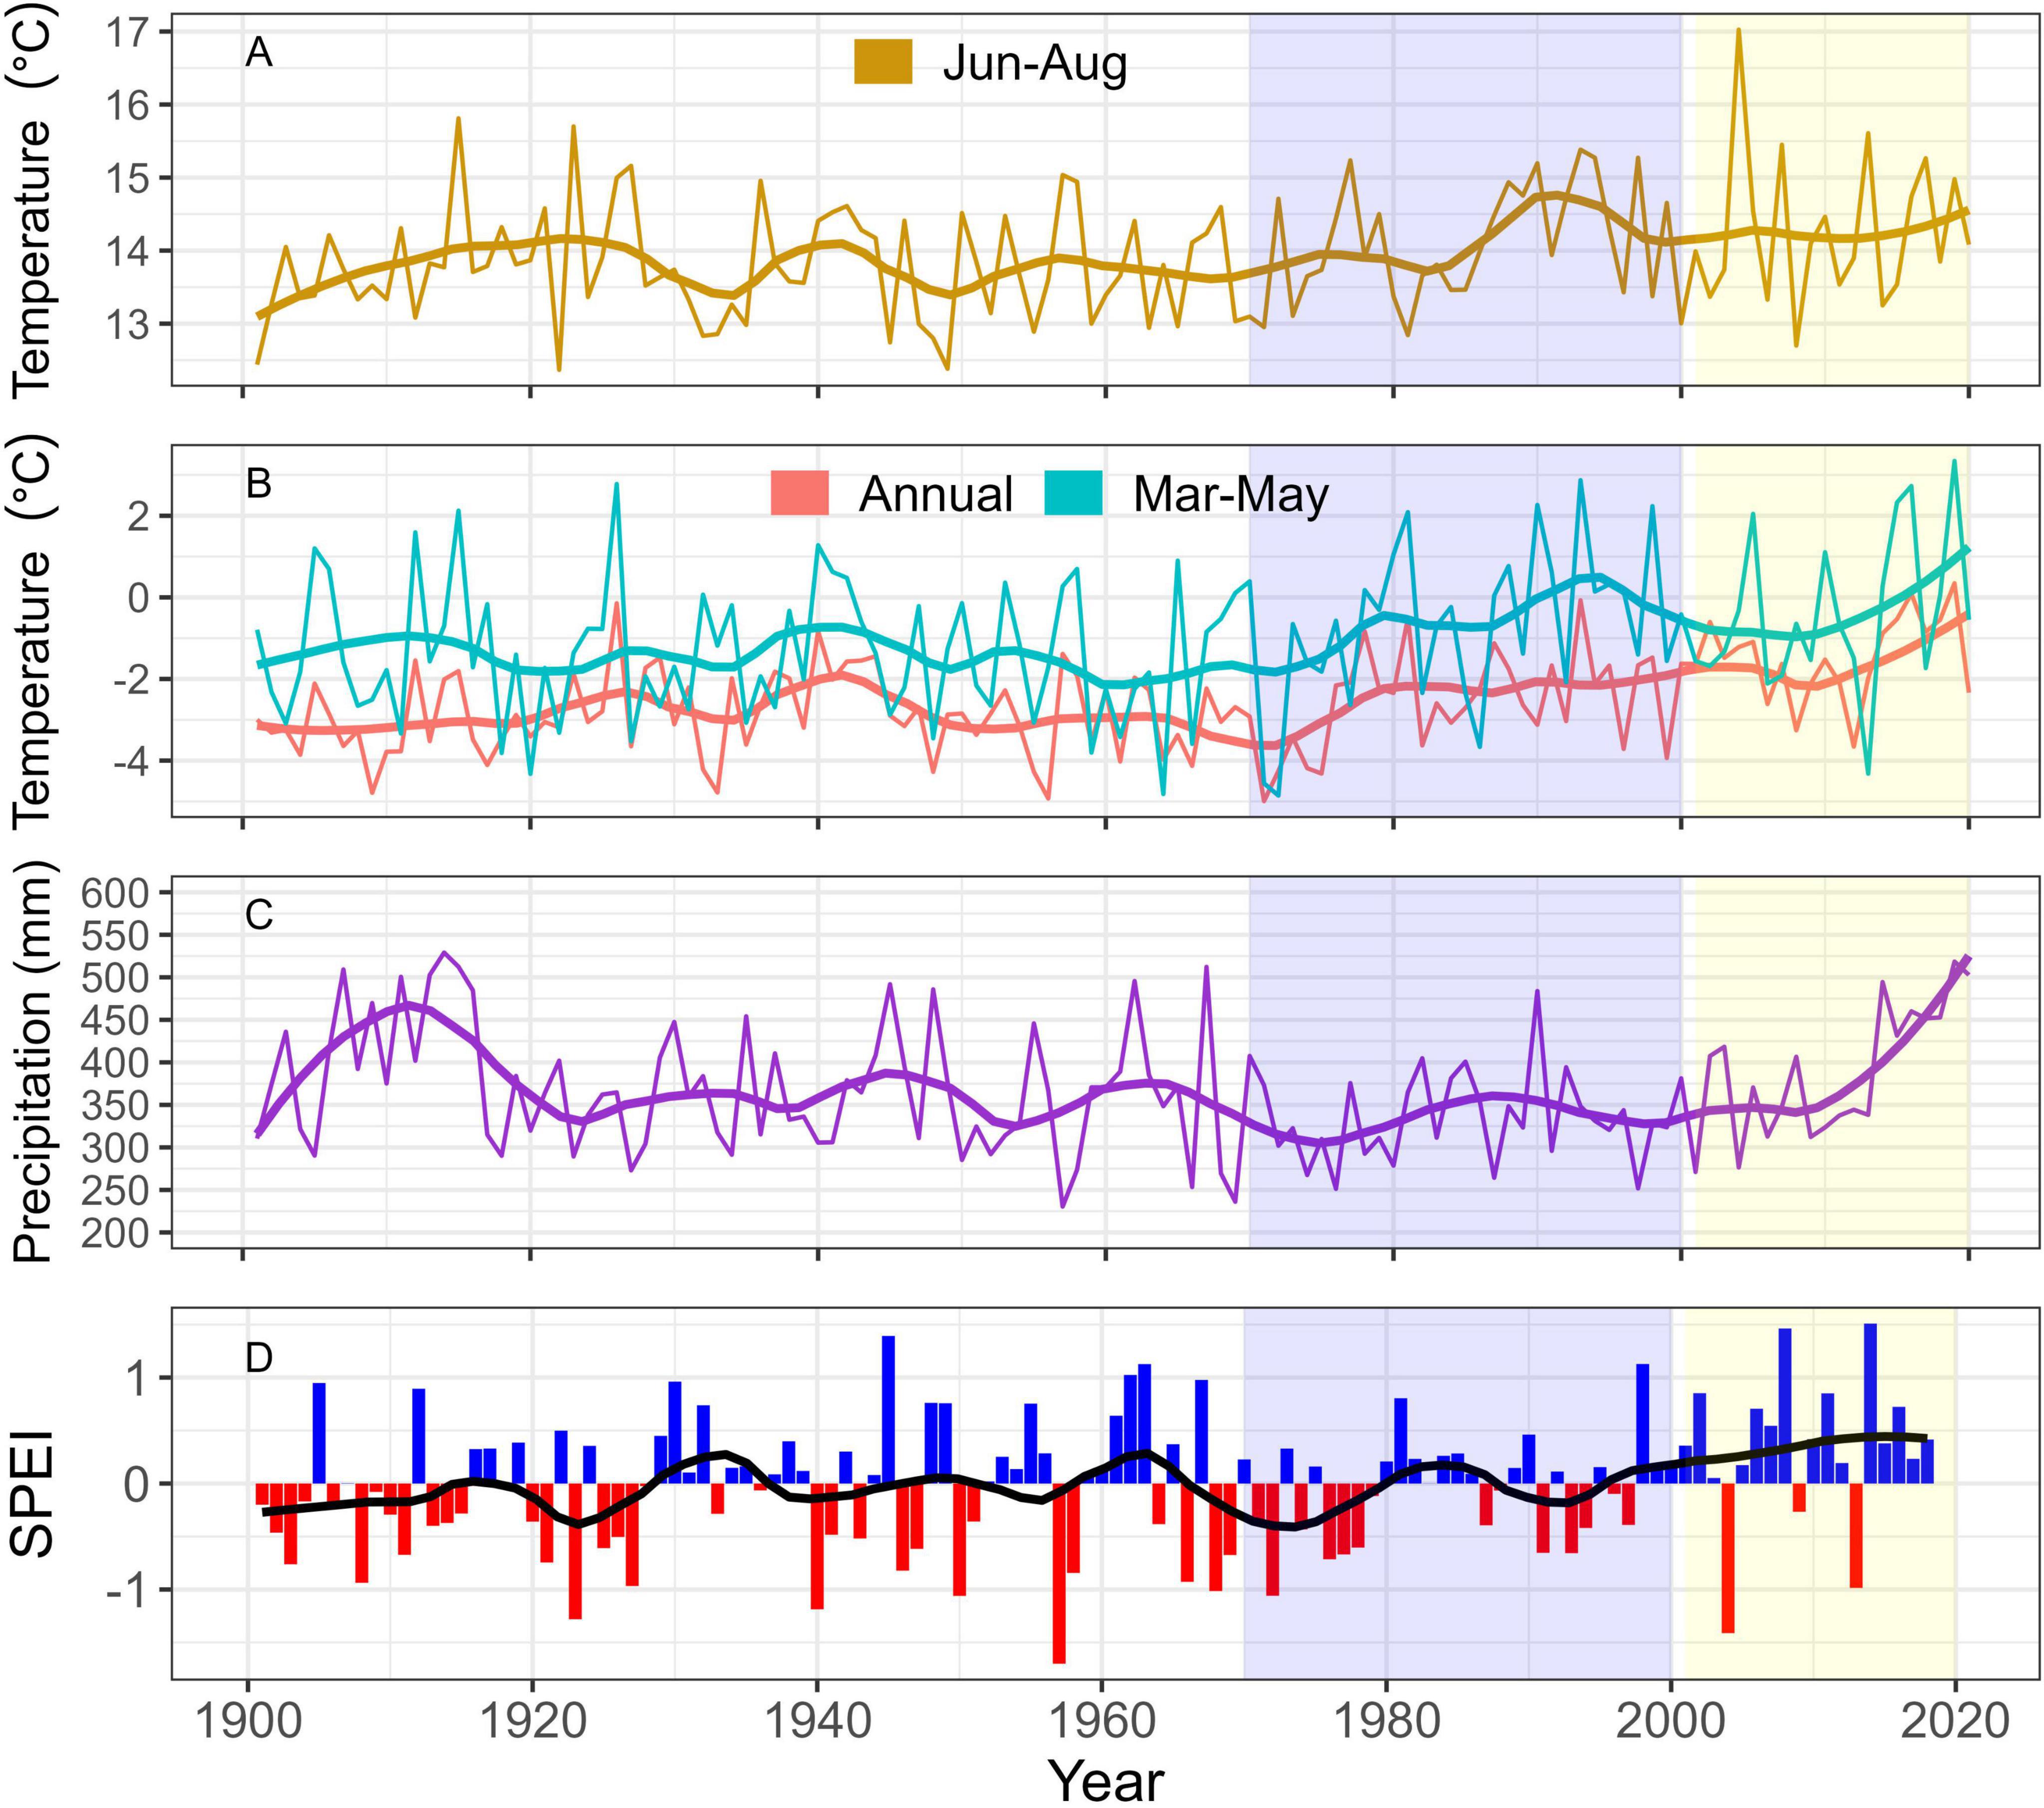
Figure 3. Time series of air temperature, total precipitation, and SPEI averaged over all sampling locations for each year (1901–2019). Downscaled air temperature and precipitation data were obtained from ClimateNA (Wang et al., 2016). Air temperature was averaged over the growing season months June-August (Jun-Aug); (A), spring months March-May (Mar-May; B), and over all months in a calendar year (Annual); (B). Precipitation (C) was summed over all months in a calendar year at each location. Standardized precipitation-evapotranspiration index (SPEI); (D) was obtained using the SPEIbase dataset (Vicente-Serrano et al., 2010). Positive SPEI values represent a relative abundance in moisture availability, whereas negative values represent moisture deficit. Yearly values were smoothed using a loess function, represented as thicker solid lines in each panel. Blue shading indicates years when tree-ring isotope data were analyzed, and yellow shading represents ALM outbreak years.
The ALM outbreak that began in the early 2000s resulted in a dramatic decline in aspen BAI among all four FHP damage categories (Figure 4A). However, the steepest decline in BAI was in the Light and Severe categories (83% and 78%, respectively), when comparing the highest average BAI prior to the ALM outbreak with the lowest BAI following the outbreak. Notably, trees in the Light and Severe categories appeared to show positive growth since approximately 2010, whereas trees in the Moderate and Very severe categories appear to have not recovered to pre-outbreak growth.
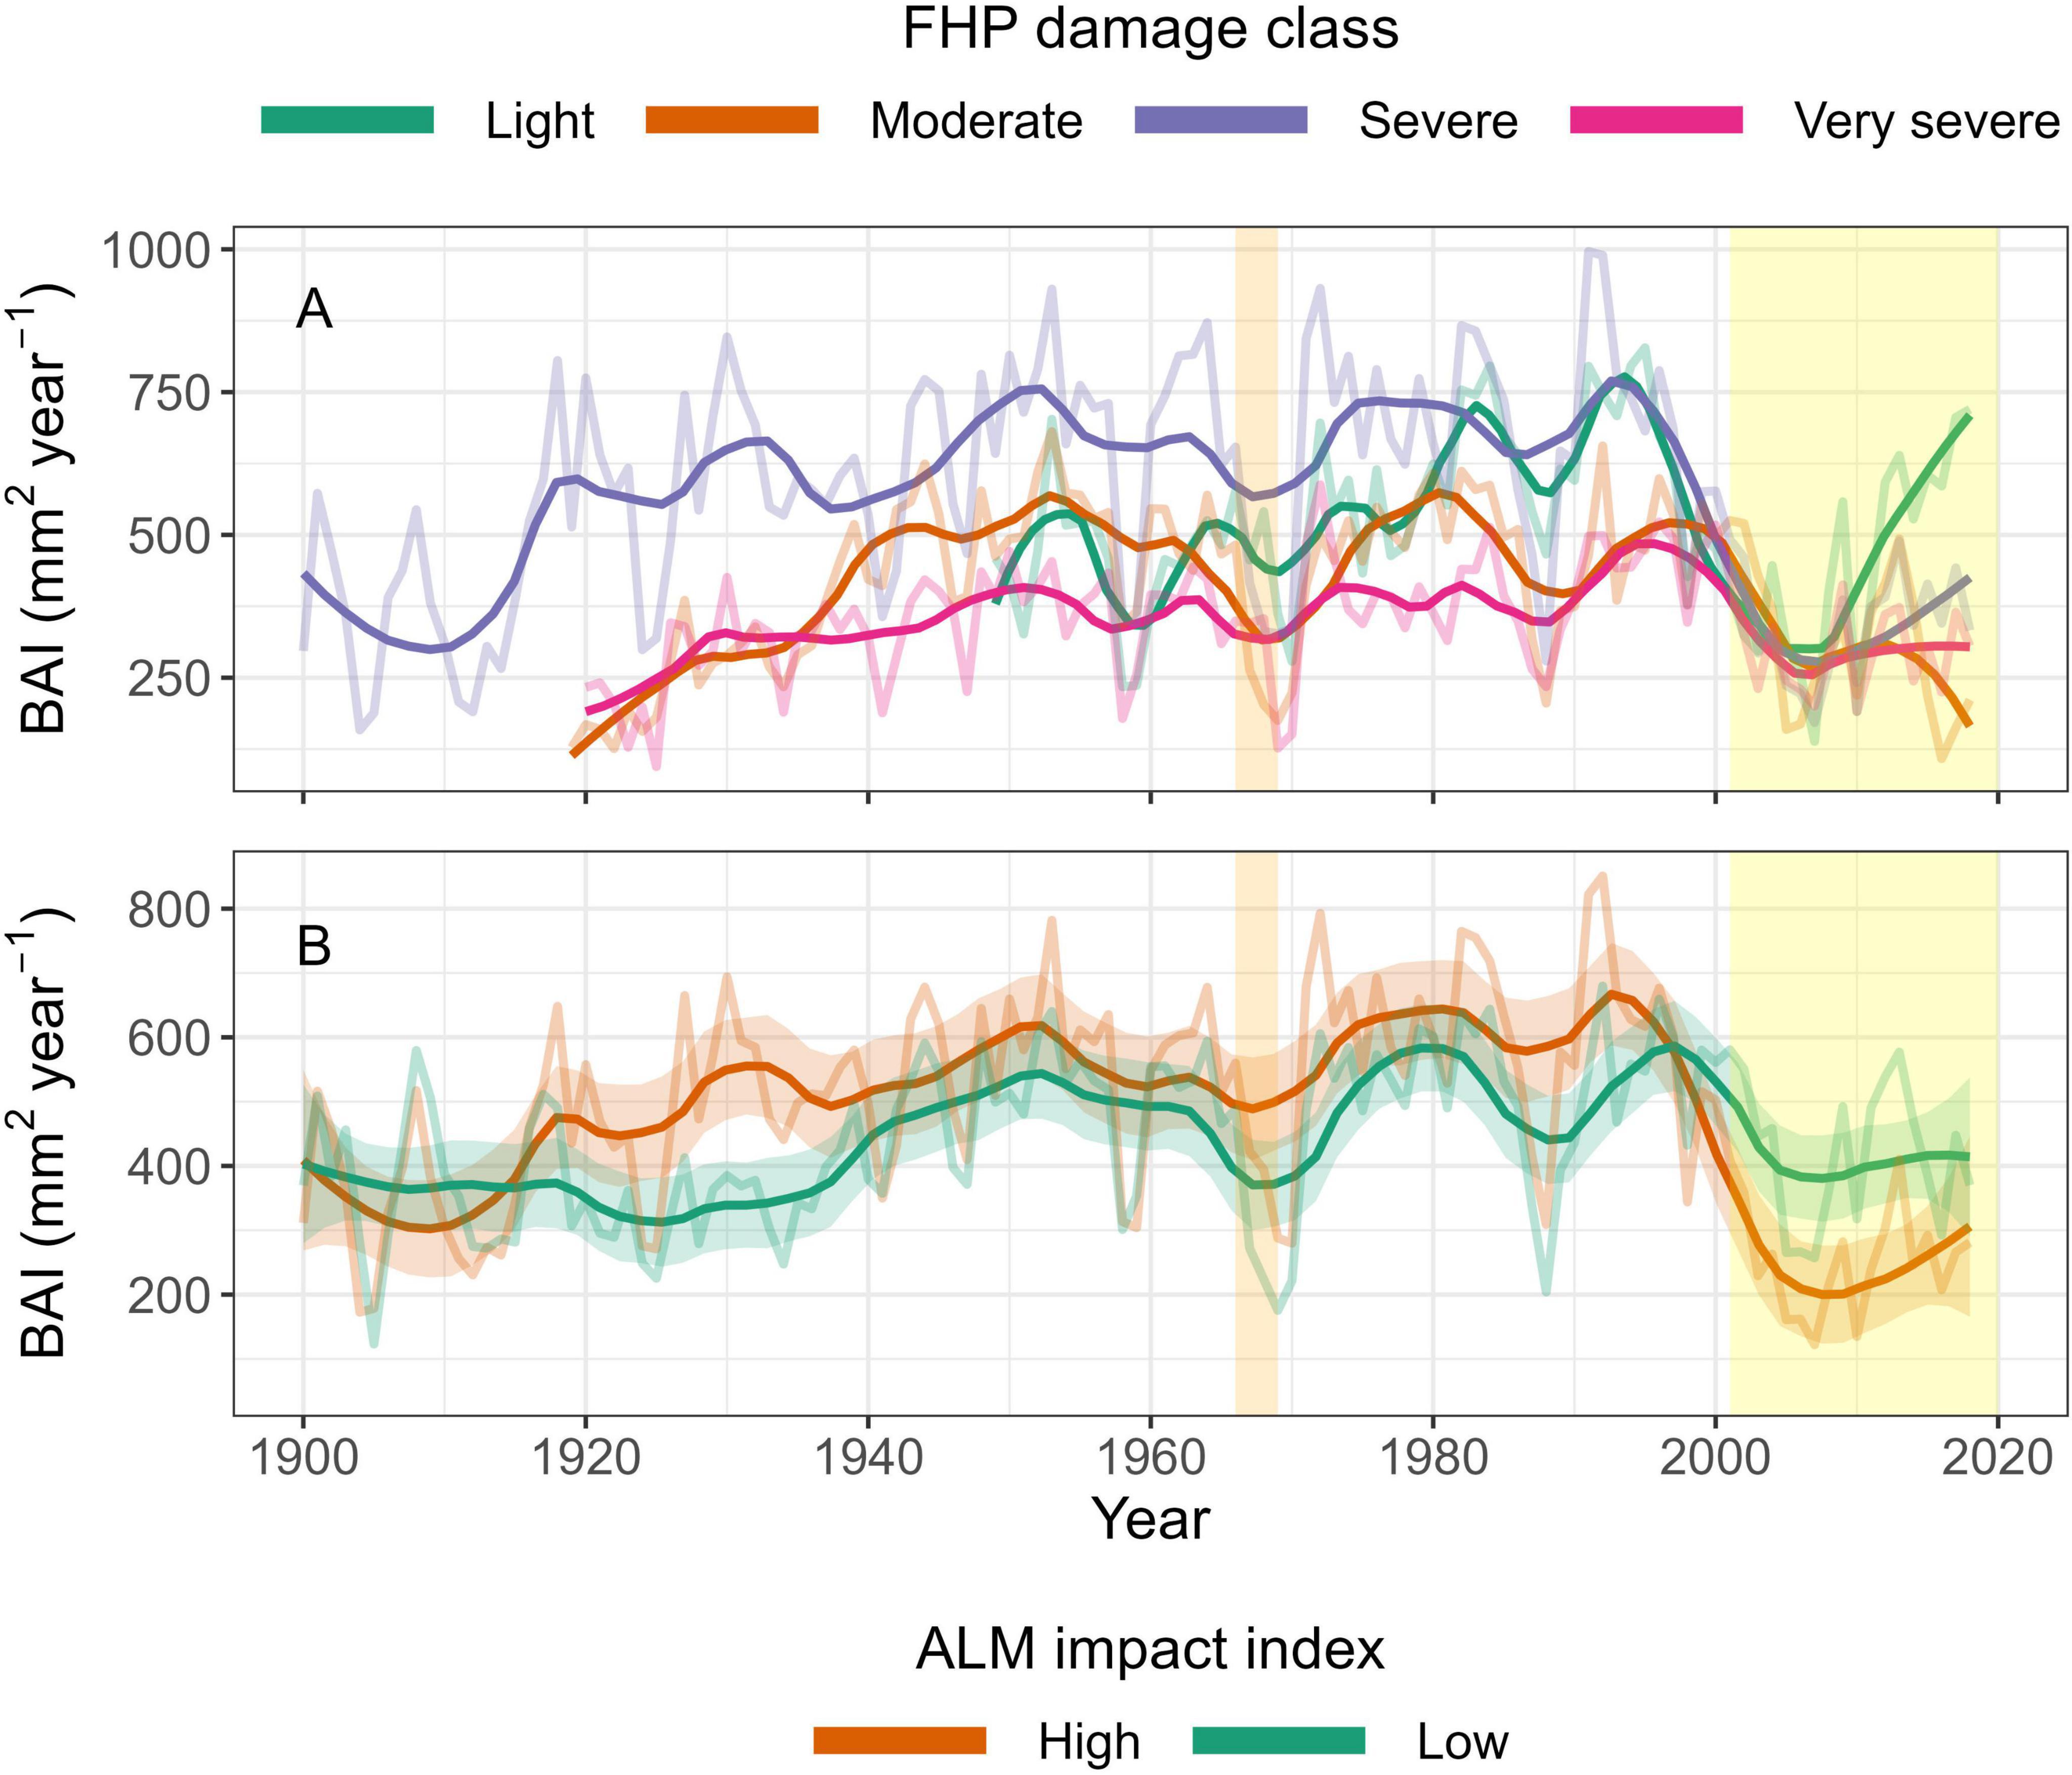
Figure 4. Growth trends (BAI mm2 year–1) among FHP 2016–2018 aerial survey damage classes (A) and ALM impact index categories (B) between 1900 and 2018. ALM impact index was calculated as the ratio of summed BAI before (1989-2000) and during the ALM outbreak (2001–2012). High and low categories were created based on whether the tree fell above or below the overall median ALM impact index, respectively. Sample sizes (n trees) for FHP categories were: Light = 28, Moderate = 102, Severe = 85, Very severe = 55. A total of 130 and 134 trees were classified as High and Low impact index, respectively. Light shaded lines are the annual mean for each category and darker lines are smoothed means of annual BAI. Shading around the dark lines in panel B is ± 1 standard error around the smoothed mean. The orange shaded section represents the large aspen tortrix outbreak and the yellow shaded section represents the aspen leaf miner outbreak.
We analyzed the effect of ALM on individual trees by comparing the ratio of BAI pre- to post-ALM as an index of ALM impact. After categorizing trees (high and low) based on the median ALM impact index, we detected no difference in size (P = 0.31; High DBHmean: 24.3 cm. Low mean DBHmean: 22.1 cm; Supplementary Figure 6). Highly affected trees were marginally non-significantly (P = 0.06) older than lightly affected trees (High mean age: 120.8, Low mean age: 101.6) Both groups of trees experienced moderate increases in growth since 1900 (Figure 4B), which could have been influenced by ontogenetic effects. The large aspen tortrix (Choristoneura conflictana Wlkr) outbreak that occurred between 1966 and 1969 (Torgersen and Beckwith, 1974) caused a brief sharp decline in BAI in both categories of trees. In contrast, the ALM outbreak in 2000 caused a sustained reduction in BAI in both categories of trees, with those in the high category experiencing an 82% decline in BAI, whereas those classified as low saw a 61% decline in BAI in the years following the ALM outbreak in 2000. However, unlike the tortrix outbreak, aspen growth generally has not yet recovered to pre-outbreak levels.
Among the three growth classes, the fastest growing trees were significantly younger than slow growing trees, and significantly larger than slow growing trees (Figures 5A, C). Slow growing trees predominantly occurred at steeper locations, where the mean slope was 9.8 degrees, compared to 7.2 degrees and 6.0 degrees among intermediate and fast-growing trees, respectively (Figure 5B). Relative ALM impact index (i.e. the ratio of pre-ALM vs. post-ALM BAI) did not differ among growth classes (Figure 5D), however the absolute reduction in BAI was significantly greater among fast growing individuals (Figure 5E).
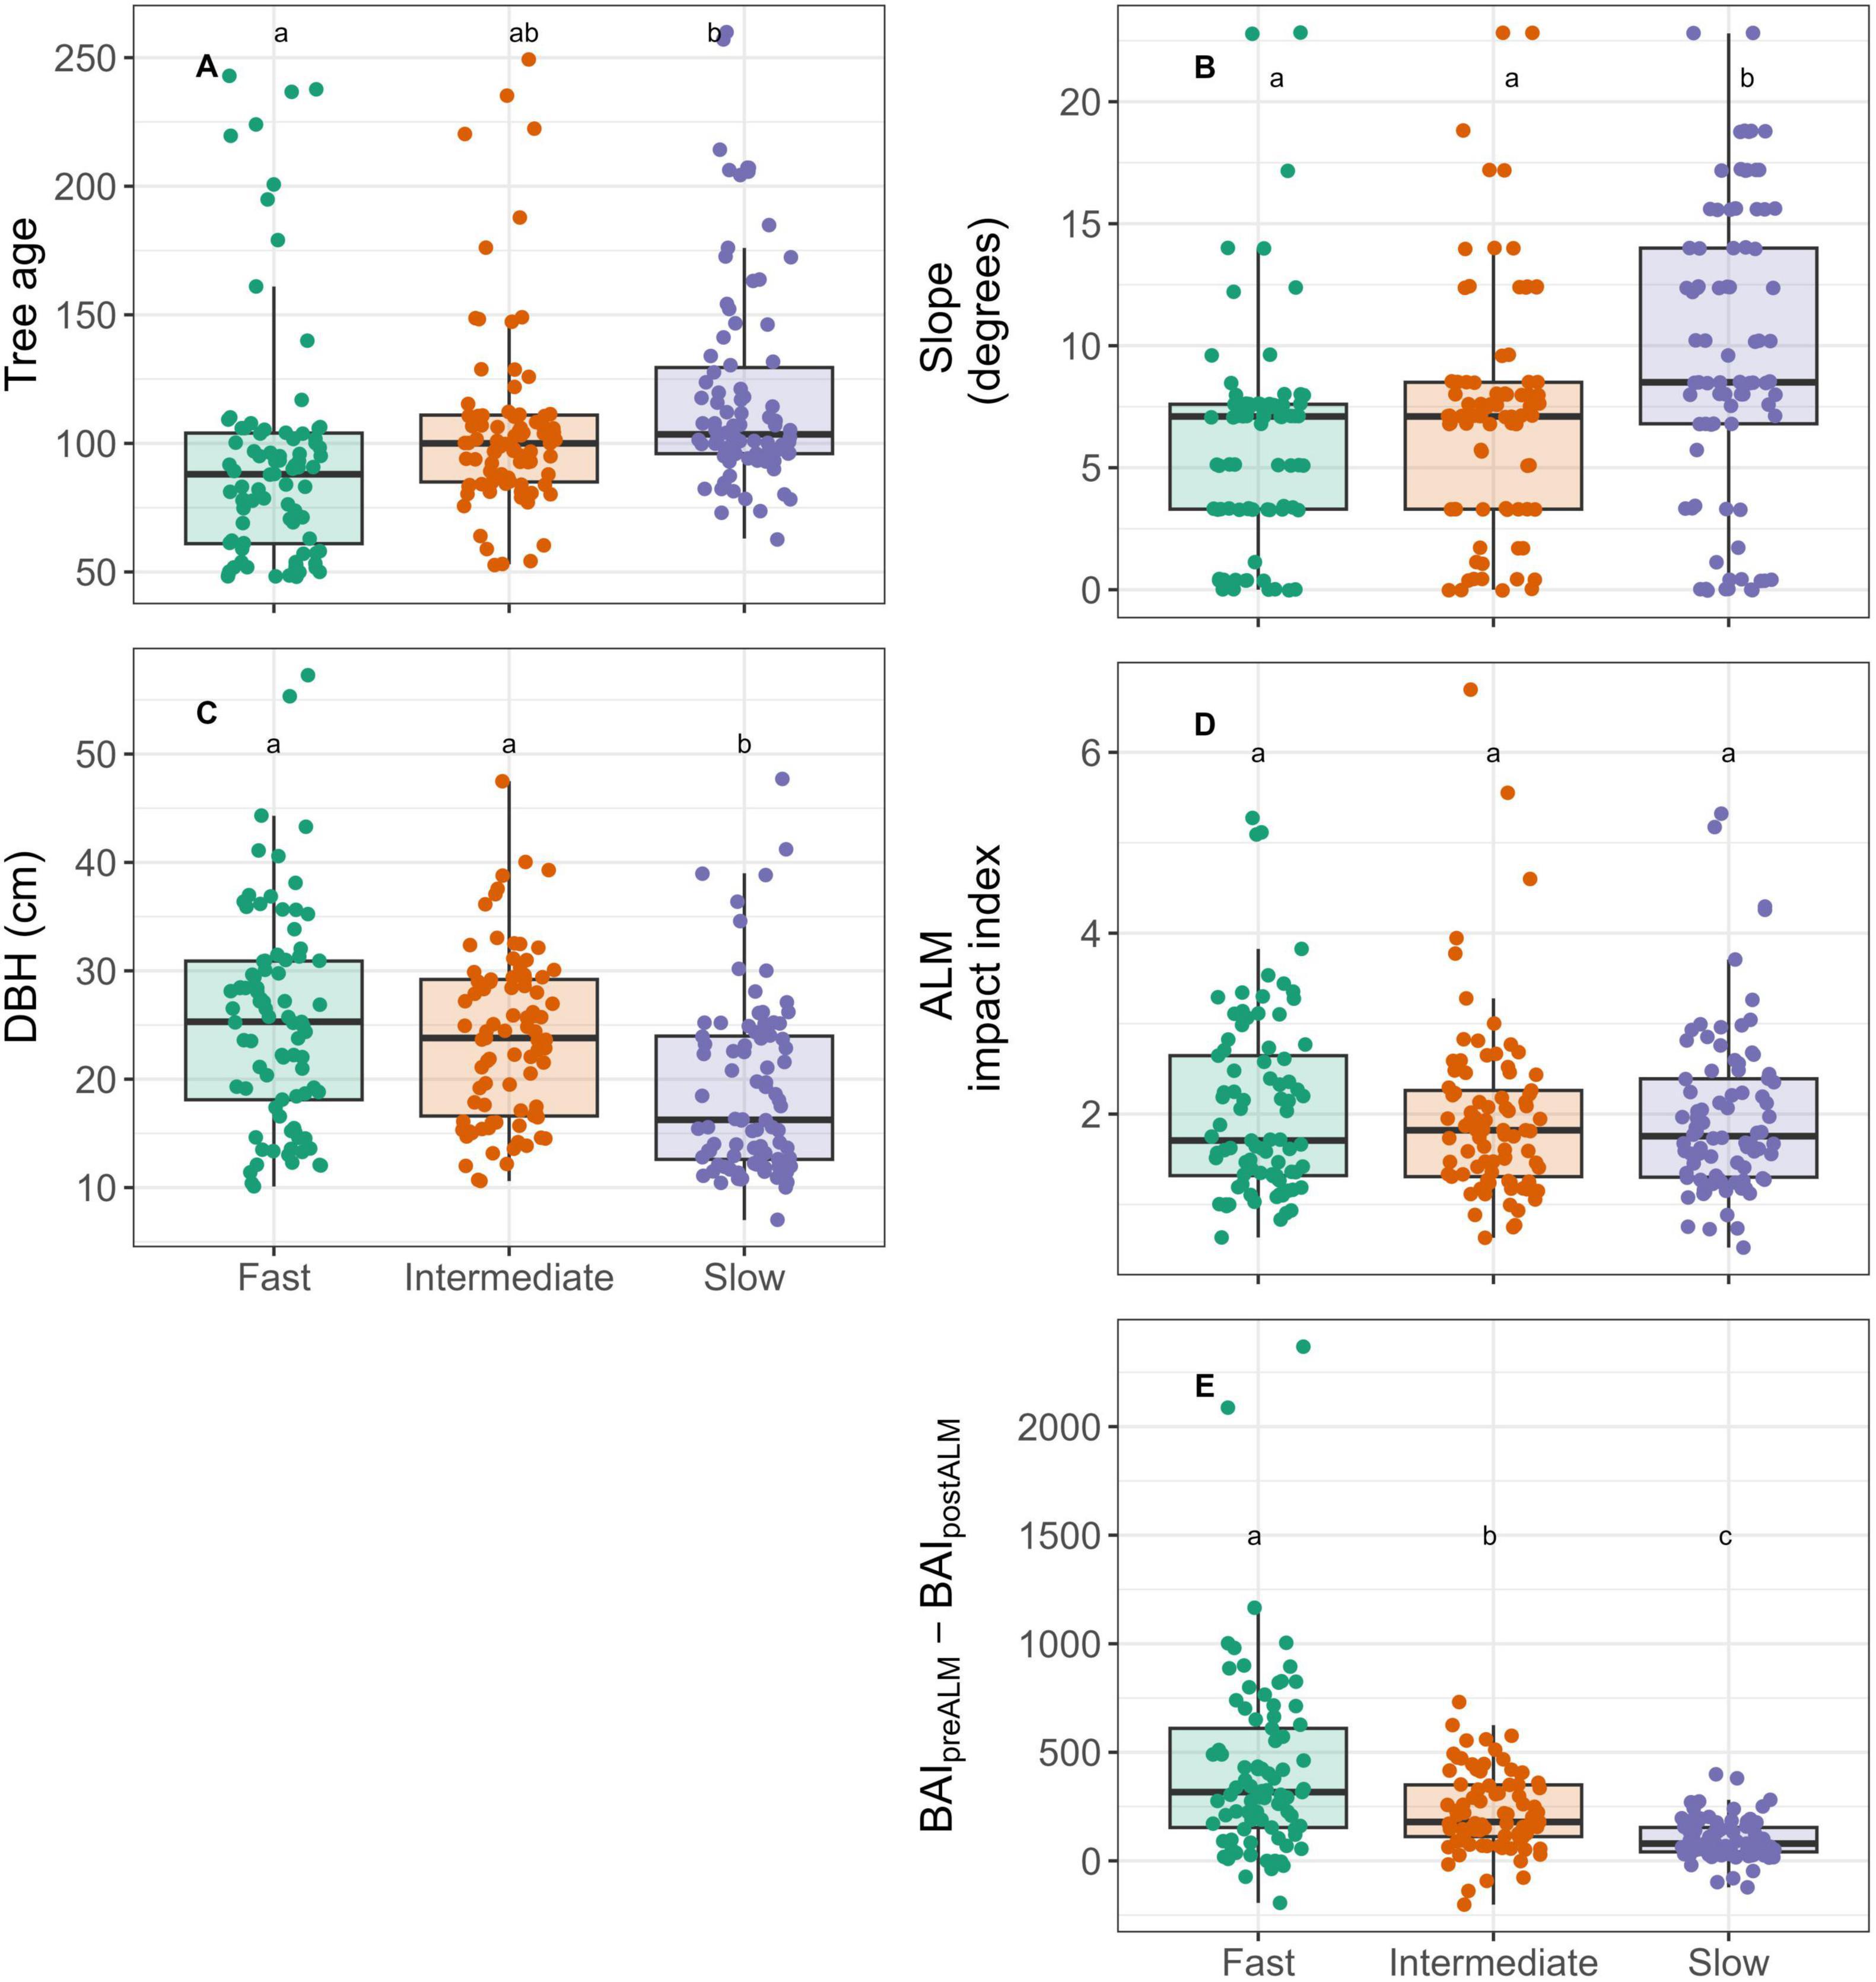
Figure 5. Distribution of tree age (A), plot slope (B), DBH (C), ALM impact index (D) and absolute ALM impact (E) calculated as the difference between mean BAI in the 12 years prior to the ALM outbreak (1989–2000) and mean BAI during the outbreak (2001–2012) among fast, intermediate, and slow growing trees. Trees were separated into growth classes based on mean pre-ALM diameter growth (1989–2000). Comparisons among growth classes were made using an ANOVA model with different lowercase letters indicating significant (P < 0.05) differences among growth classes using Tukey’s Honest Significant Difference.
After combining successive months of climate data over time, we found evidence of moisture limitation overall in growth-climate relationships, although there were only small differences in climate sensitivity between high and low ALM impact indices (Figure 6). Negative correlations with current year monthly average temperature (Tave) were strongest among less impacted trees, however the overall magnitude was moderate (Spearman ρ = −0.42, P < 0.001; Figures 6A–D). Correlations between RWI and precipitation (PPT; Figures 6E–H) through the summer months of the previous year were weaker, and differences between ALM impact indices were small (High: 0.31, P = 0.002; Low: 0.26, P = 0.007). The strongest correlations between RWI and SPEI (Figures 6I–L) were during the summer months (June-August) in the year prior to ring formation among the highly impacted trees (ρ = 0.33, P < 0.001), whereas the strongest correlations in less impacted trees occurred in the current year spring months (March - May; ρ = 0.31, P < 0.001). Similar patterns in climate-growth correlations emerged when we used the absolute reduction in BAI (e.g. BAIpreALM - BAIpostALM) instead of the relative reduction in BAI (e.g. BAIpreALM / BAIpostALM) as the ALM impact index. In our plot-level analysis, we found that trees growing on steeper slopes showed significantly stronger negative correlations with current year temperature in May and August than trees on gentler slopes (Figure 7B). Trees growing on steeper slopes showed significantly stronger positive correlations with SPEI in August of the previous year (Figure 7E). The maximum strength of correlations among steep plots between plot-mean RWI and temperature, precipitation, and SPEI was −0.34 (P = 0.21), 0.25 (P = 0.98), and 0.34 (P = 0.03), respectively (Figure 7).
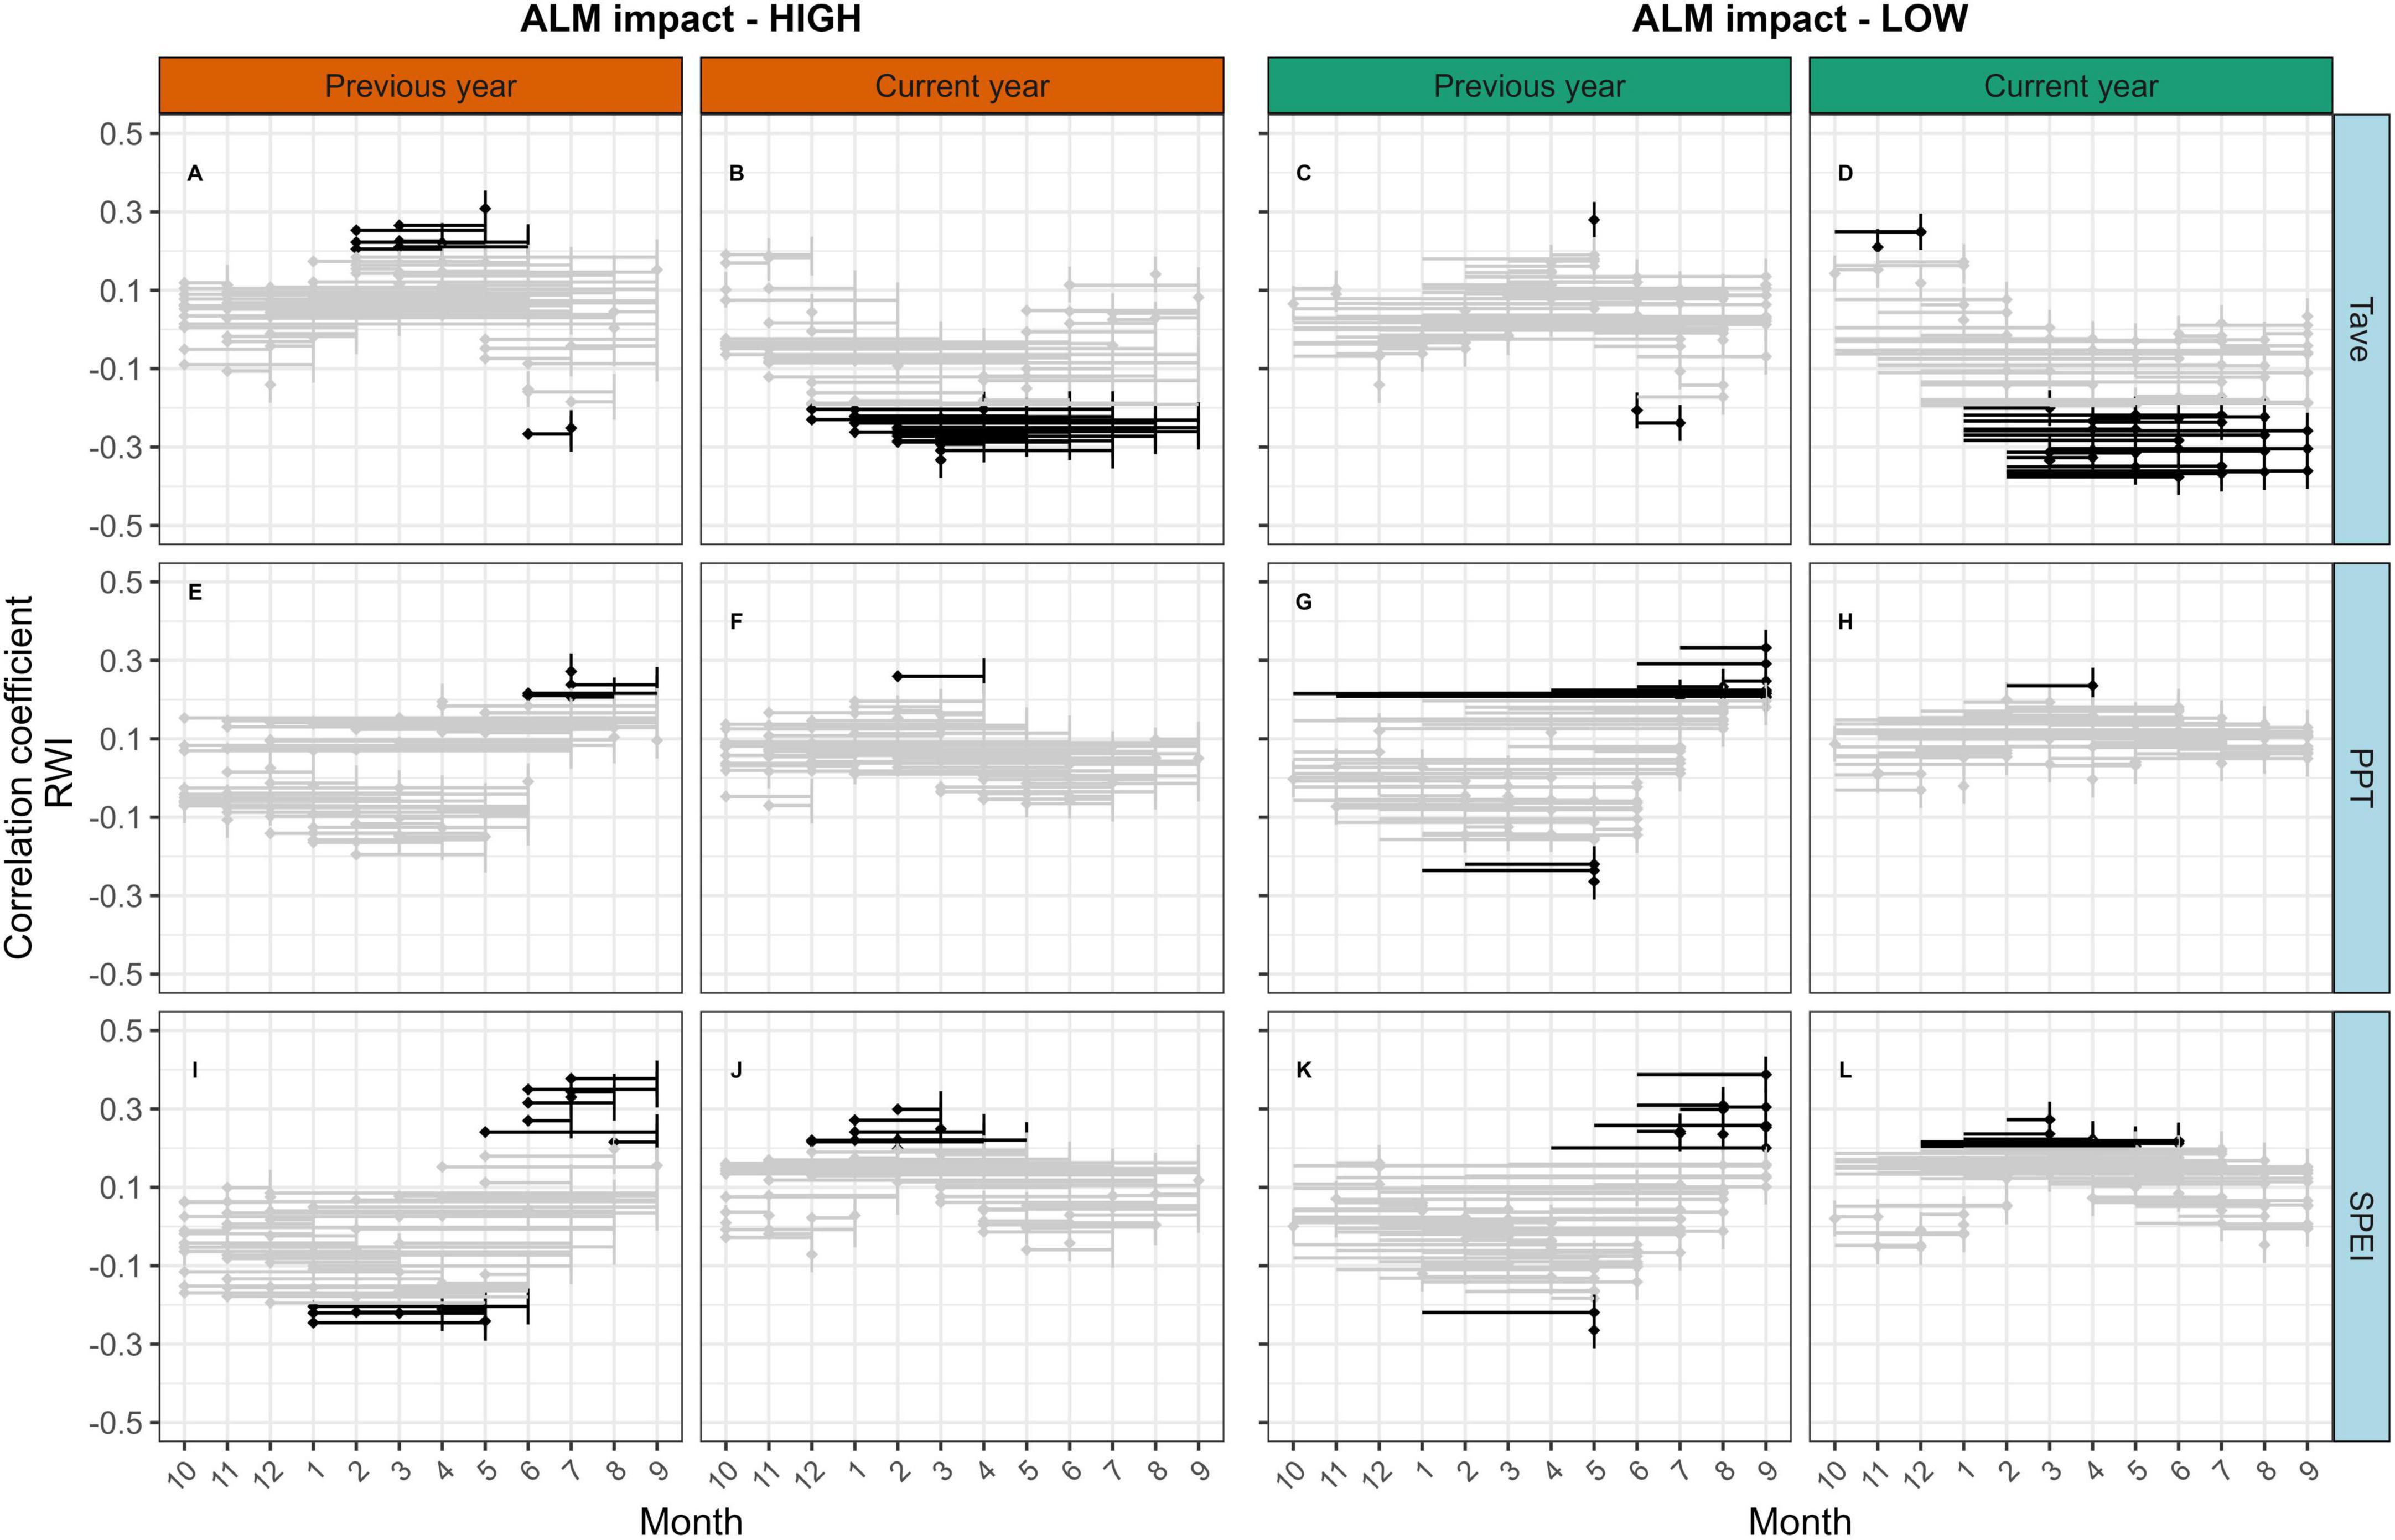
Figure 6. Spearman correlation coefficients (ρ) between monthly climate variables and ring width index (RWI). RWI was calculated as the difference between measured and fitted values after removing autocorrelation in the tree-ring data using best-fit ARIMA models. Monthly average temperature (A–D; Tave), total monthly precipitation (E–H; PPT), and mean standardized precipitation-evapotranspiration index (I–L; SPEI) were averaged over all plot locations for each month and fit with the same ARIMA process as the ring width data. RWI was averaged over all trees in each ALM impact index category using Tukey’s bi-weight mean. Correlations were assessed for individual months and all consecutive months in the year of ring formation (Current year) and the year prior to growth (Previous year), beginning with the month when growth ceases (September). Significant correlations (P < 0.05) are shown in bold, non-significant correlations are in gray. Data were limited to the pre-ALM years 1901–2000. Mean RWI chronologies for each category are shown in Supplementary Figure 7.
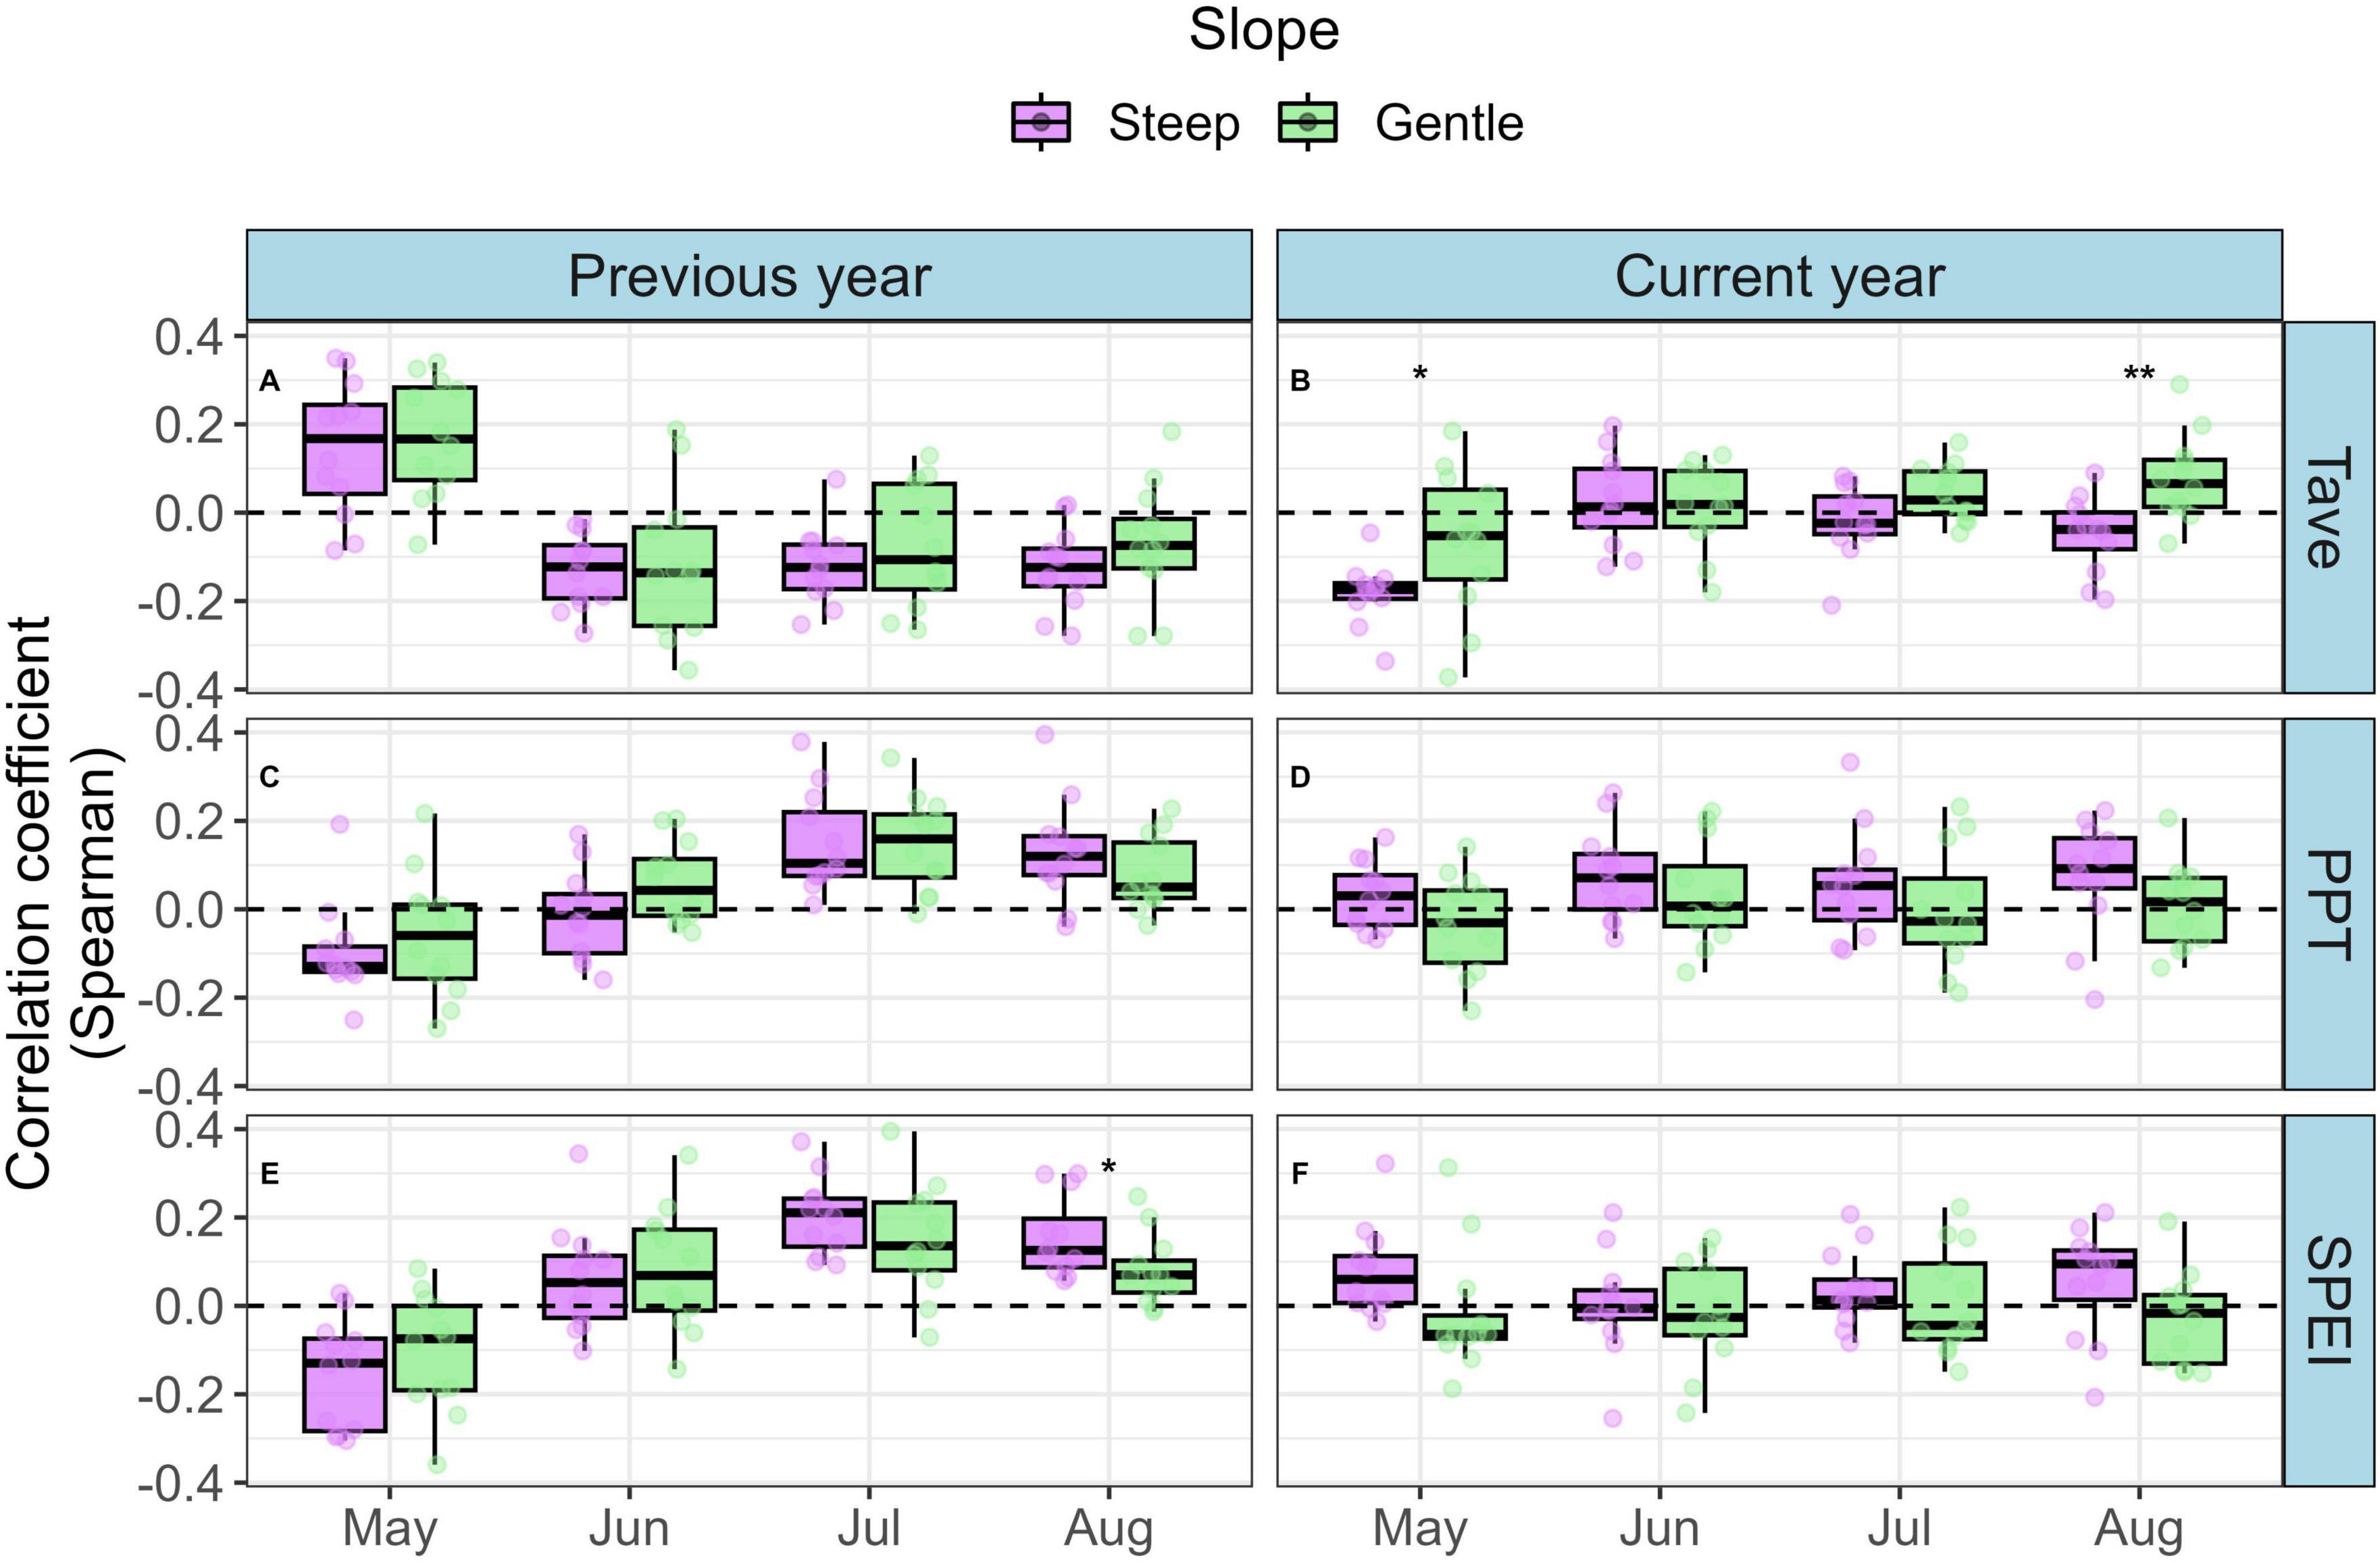
Figure 7. Distribution of climate-growth Spearman correlations among growing season months between trees growing on steep and gentle slopes. Plot-level mean ring width chronologies were created after removing autocorrelation in each series using an ARIMA model. The same model was used to remove autocorrelation in plot-level climate data. Correlation coefficients between annual plot-level chronologies and downscaled monthly average temperature (A,B; Tave), total monthly precipitation (C,D; PPT), and standardized precipitation-evapotranspiration index (E,F; SPEI) were generated for each month of the growing season. Plots were classified as steep or gentle categories based on the median (7.8°) of plot-center slope measurements. Differences in correlation values between slope categories were examined using an analysis of variance model for each climate variable. Significant differences in correlation strength between steep and gentle slopes are represented with stars (**P < 0.01; *P < 0.05). Non-significant (P < 0.05) differences are omitted for clarity.
While climate-growth correlation analyses offer insight into the temporal effects of temperature, precipitation, and SPEI, our LMEMs were designed to incorporate spatial variation in climate on ALM impact. The model that included June-August precipitation in the year prior to growth (prev_PPT_sm) had the most support in the data (lowest AICc value, Table 1), although the difference in AICc values among models that included age as a fixed effect was small, ranging from 2.0 to 4.3. Results from our likelihood ratio tests revealed that all sub-models were significantly different from the full version (Table 2). Parameter estimates from the best-fit model (Table 3) using the full dataset revealed a significant positive effect of tree age (4.66e–03, P = 0.004) and PIGL_propBA (0.54, P = 0.039) on ALM impact index, whereas slope and prev_PPT_sm had significant negative effects (−0.02, P = 0.016; −4.11e–03 P = 0.028, respectively). Replacing proportional white spruce basal area with raw white spruce basal area had a minor effect on model support (ΔAIC < 0.04). Overall, our LMEMs supported our predictions that older trees (P1) and those associated with a relatively large proportion of white spruce basal area (P4) would experience more severe ALM impacts. The significant negative effect of prev_PPT_sm supported our prediction of greater ALM impacts at locations with less precipitation (P2), while the significant negative effect of slope (P3) contrasted with our original hypothesis. Importantly, the small sample size (176 trees) and little difference in AICc values among sub-models (D AICc ≤ 5.81) suggests similarity among models despite significant likelihood ratio tests.
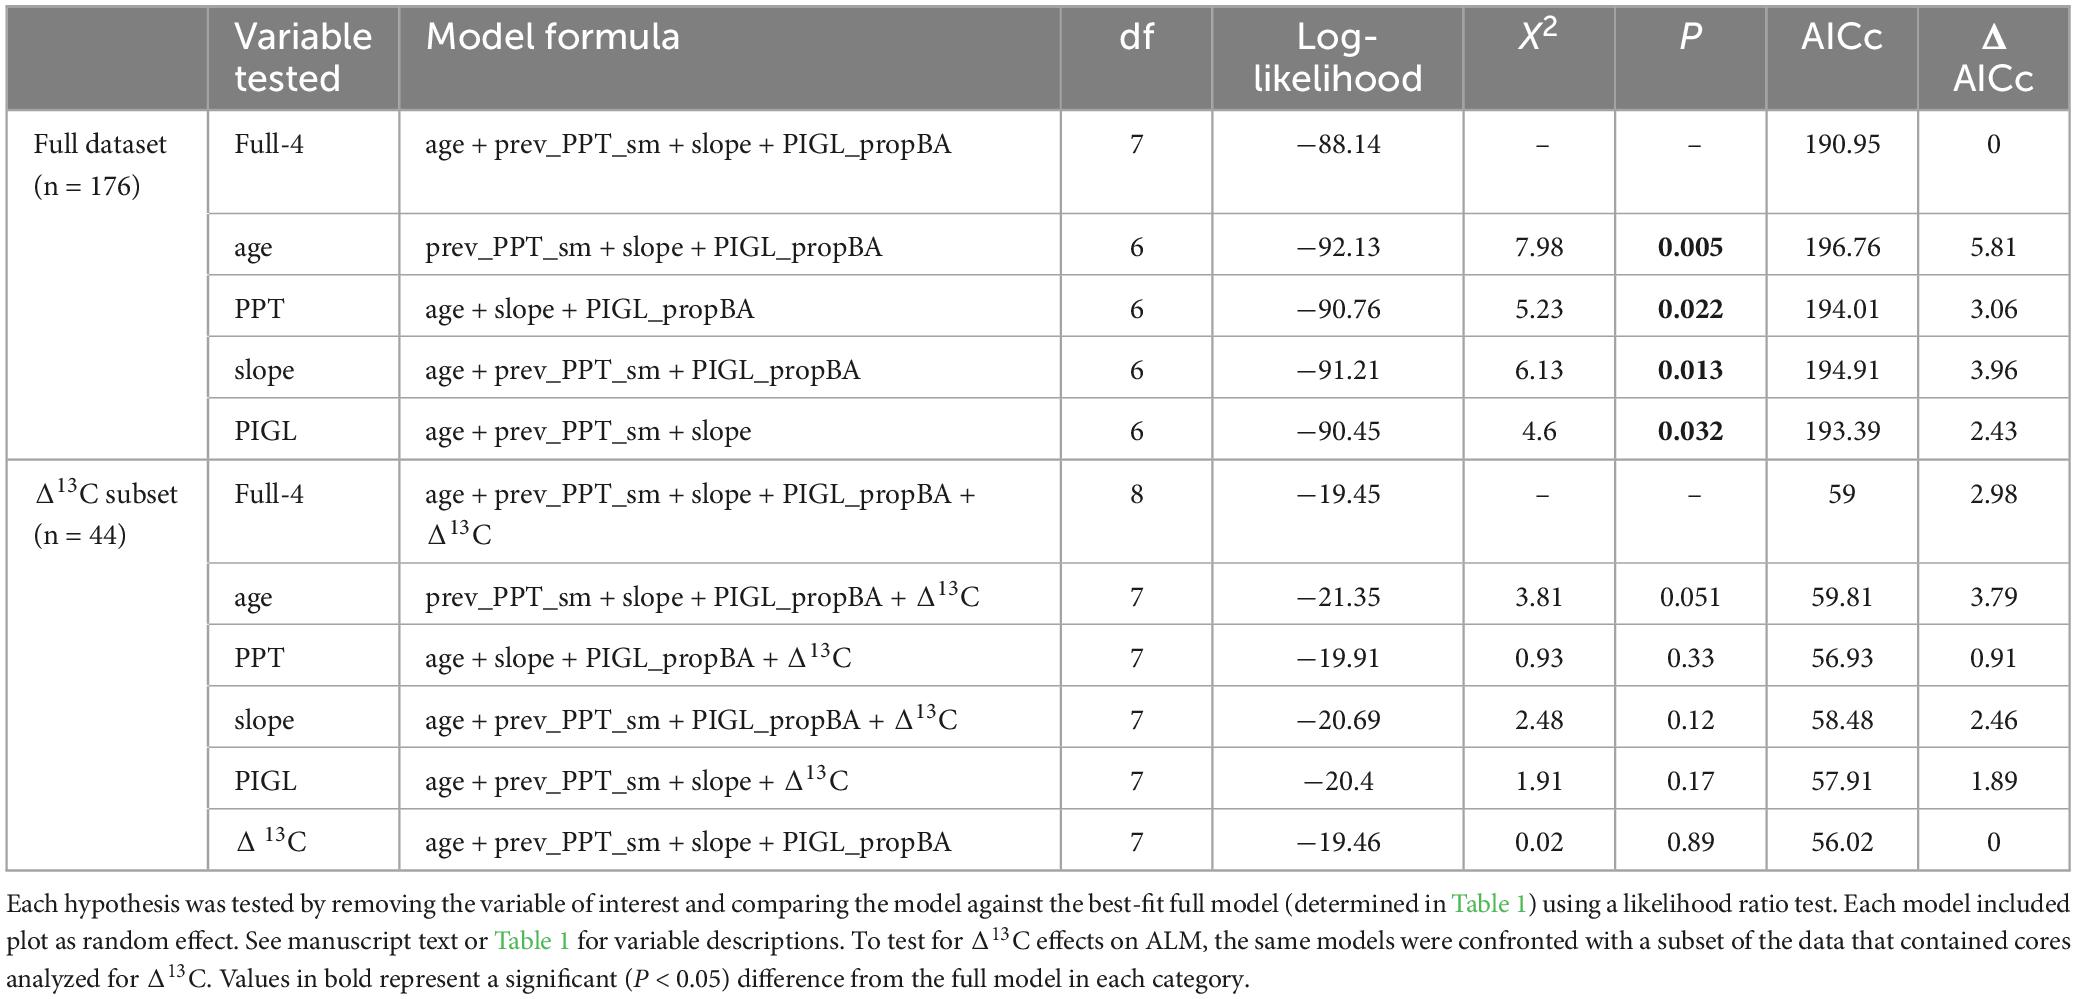
Table 2. Summary of LMEMs designed to test our hypotheses describing factors affecting spatial variation in ALM impact index.
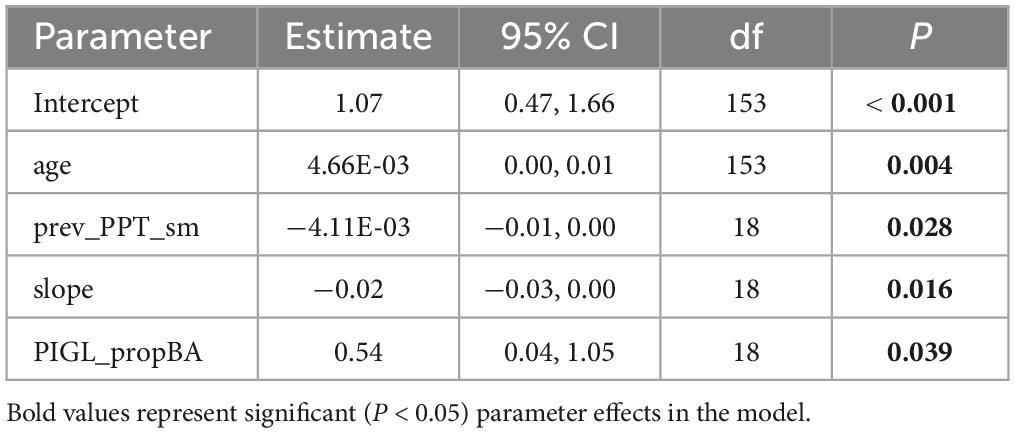
Table 3. Parameter estimates, 95% confidence intervals (CI), degrees of freedom (df) and significance tests (P) for the fixed effects in the best-fit LMEM in Table 2 (Full-4), designed to examine the factors affecting ALM impact index. See manuscript text or Table 1 for variable descriptions.
Using the subset of cores to test for the effect of Δ13C on ALM impact, no sub-model was significantly different from the full version (Table 2), although the model that omitted age approached significance (P = 0.051). Importantly, we detected a significant negative relationship between BAI (−0.28, P < 0.001) and Δ13C, while the interaction between BAI and ALM impact category was not significant (−0.15, P = 0.076; Table 4).
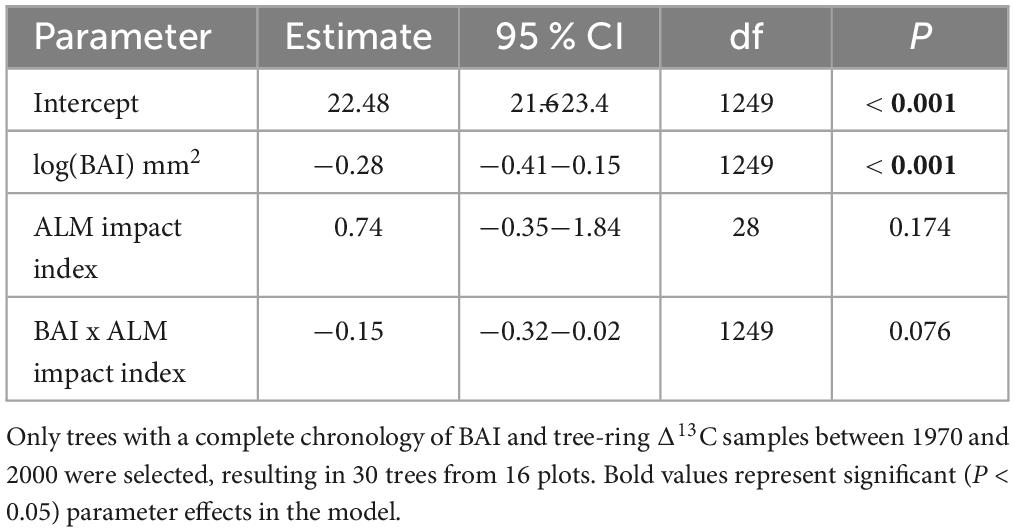
Table 4. Parameter estimates, 95% confidence intervals (CI), degrees of freedom (df) and significance tests (P) from a linear mixed effects model designed to examine the effects of BAI and ALM impact index on tree-ring Δ13C.
As interior Alaska has warmed since the early and middle 20th Century (Bieniek et al., 2014; Ballinger et al., 2023), we anticipated that moisture limitation would predispose aspen to greater ALM impacts on growth. However, we found mixed evidence that sensitivity to moisture limitation contributed to the severity of ALM impacts on growth. Although our climate-growth analysis indicated aspen growth was generally limited by warm and dry conditions, we detected little difference in climate-growth correlations between trees that were most affected by ALM and those least affected. Second, although, summer precipitation was a significant source of spatial variation in ALM impact in our LMEM analysis, differences among competing models were small, suggesting multiple factors contributed to variation in ALM impact. Finally, tree-ring Δ13C showed limited evidence of stomatal control in the years prior to the ALM outbreak. Instead, the negative relationship between Δ13C and BAI suggests that variation in photosynthesis may have been a more important source of variation in Δ13C than stomatal conductance, complicating our ability to test for a link between moisture sensitivity and ALM-induced growth decline. Collectively, our study showed that spatial variation in white spruce abundance and slope, along with endogenous tree characteristics such as age and growth rate – in addition to precipitation – were major factors contributing to the ALM impact in interior Alaska.
Previous studies have pointed to moisture sensitivity among ALM-affected trees (Trugman et al., 2018; Boyd et al., 2021). In contrast, we detected limited differences in growth sensitivity to drought conditions between ALM impact index categories. While Boyd et al. (2021) found that aspen trees killed by ALM showed a strong negative growth response to growing season (May-Sep) temperature in the years preceding the ALM outbreak, growth among living and dying trees diverged well before the ALM outbreak, despite no trend in summer temperature or CMI. Boyd et al. (2021) suggested that dying aspen may have been predisposed to ALM starting with a growth decline in response to drought in 1957 and the large aspen tortrix outbreak in the late 1960s. Our data show similar brief declines in BAI, but also rapid recovery to pre-drought and pre-tortrix growth, also shown in Boyd et al.’s study. The same authors highlighted the importance of factors such as tree size, canopy position, or competition that may have played an important role in aspen response to ALM, suggesting that because aspen is a shade-intolerant species, understory individuals may have been less able to produce defensive compounds and were more susceptible to ALM defoliation. Although we lacked detailed inventory data to directly test the effect of canopy position, our protocol sampled a wide range of tree age classes and sizes that included canopy dominant and subdominant individuals, and yet we found little evidence of drought sensitivity contributing to variation in ALM impact. In general, the trees that we sampled were larger than those sampled by Boyd et al. (2021), which may help explain the apparent discrepancy in conclusions between the studies.
Our LMEM analysis pointed to additional spatial and tree-level factors that contributed to greater ALM impact. Our results supported our prediction that older trees would experience greater reductions in ALM-induced growth (P1), which might have been due to older trees being more susceptible to drought (Sperry et al., 1991). Alternatively, older and taller individuals may have experienced greater ALM defoliation due to a larger insect population in canopy dominant trees. ALM pupae have much higher survival rates in taller trees, which receive higher solar radiation in spring, resulting in earlier leaf out than sub-dominant individuals, thus providing more suitable oviposition locations than shorter trees at a time when ALM larvae begin feeding (Tundo, 2021). Although we lack tree height data, tree age covaried with DBH (R2 = 0.32, P < 0.001), suggesting the oldest trees were more likely canopy-dominant and may have been more susceptible to ALM attack. Thus, the phenological synchrony between tree canopy position and ALM oviposition preferences may provide an additional underlying mechanism to explain the pattern of greater ALM impact on older trees. The reduction in growth among older aspen in response to ALM could hold important implications for stand structure dynamics. For example, the premature mortality of older, dominant trees could alleviate intra- and interspecific competition and stimulate growth among suppressed individuals (Reyes-Hernández and Comeau, 2014), or accelerate succession to white spruce dominance, if white spruce are present in the understory.
While our climate-growth correlation analysis captured long-term (1901–2000) interannual variation in precipitation, our LMEMs were designed to examine spatial variation in mean (12 year) precipitation across all plots. Our best-fit LMEM provided some evidence that moisture limitation contributed to variation in ALM impact (P2). However, a few caveats are worth mentioning. First, downscaled precipitation in Alaska is notoriously difficult to model due to inhomogeneities in the underlying datasets (McAfee et al., 2013) and because measured precipitation varies substantially over short distances (Ballinger et al., 2023). In fact, we found notable differences in the accuracy of monthly total precipitation derived from downscaled SNAP4 and ClimateNA models compared with first-order observations (Supplementary Figure 8 and Table 2). Indeed, when precipitation from ClimateNA was replaced with precipitation from SNAP in the best-fit model, precipitation became non-significant (P = 0.086). Moreover, differences between full models that included a variety of climate variables were small (Table 1), suggesting other climate variables could adequately replace precipitation with the same outcome. Therefore, we urge caution in placing too much weight in this result and instead emphasize the relative importance of smaller scale landscape features that are more confidently quantified such as slope and stand characteristics that may contribute to differences in ALM impact among individual trees.
Our best-fit LMEM indicated less severe ALM impact on steeper slopes, whereas we expected greater ALM impact on steeper slopes where access to soil water would exacerbate moisture sensitivity (P3). One possible explanation for the negative effect of slope on ALM impact is that trees growing on steeper hillsides had lower growth prior to the outbreak, which, when expressed as a ratio of pre- vs. post-ALM BAI, the ALM effect would be lower than among trees growing more vigorously prior to the outbreak in flatter areas. Indeed, when we separated trees into growth classes, slow growing trees were predominantly found on steeper slopes (Figure 5). The same trees had a similar relative reduction in growth rate (i.e. the ratio of pre- vs. post-ALM BAI) with other growth classes, but the absolute reduction in BAI (i.e. the difference between pre-ALM and post-ALM BAI) was much smaller. This may also help to explain the stronger negative correlations with summer temperature among lightly affected trees (Figure 6D). Trees categorized as Low ALM impact index may have been more climate sensitive due to their landscape position, resulting in lower pre-ALM growth. On the other hand, trees growing in more favorable sites avoided the strongest moisture limitations, resulting in greater growth, but also the most severe reduction in BAI following the ALM outbreak. Despite the modest range in slope in our study (0–23°), our results point to the importance of topography on soil moisture and tree growth, a mechanism that is likely to endure at steeper locations, especially at a continental region such as interior Alaska.
Lower pre-ALM growth on steep slopes likely reflects greater soil water drainage and may have led to greater climate sensitivity. For instance, our plot-level analysis indicated that trees growing on steeper slopes had significantly stronger positive correlations with SPEI than those found on gentler slopes (Figure 7E). In addition, although aspen has been shown to overcome water shortage on steeper slopes through adaptive strategies such as deeper roots to access groundwater, root architecture that grows downslope (Snedden, 2013), or utilizing spring snowmelt to subsidize mid-summer water deficit (Young-Robertson et al., 2016; Love et al., 2019), our results point to locations across the landscape where limited access to soil water resulted in lower growth prior to the ALM outbreak, suggesting that topography may mediate precipitation effects on aspen growth. Indeed, our results show that gentler slopes, which likely have greater soil moisture, were associated with faster growth. However, these trees also experienced the most significant absolute reduction in growth following the ALM outbreak. Our data indicate that ALM larvae might prefer faster growing, canopy dominant individuals, with an abundance of favorable oviposition locations, whereas slow-growing host trees may not provide suitable habitat or forage to support large ALM populations. Other factors such as localized wind speeds and body size may also affect ALM dispersal dynamics (Tundo, 2021), and thus their impact across the landscape. Our finding that ALM inflict the most severe reduction in BAI among large, robust hosts is similar to colonization by mountain pine beetle (Dendroctonus ponderosae Hopkins [Coleoptera: Scolytidae]) in western North America, which also favors large diameter and older trees as hosts (Safranyik and Wilson, 2006). This result may have implications for management strategies in areas where the aesthetic or socioeconomic value of aspen trees is given priority.
In contrast with the mixed evidence of moisture limitation predisposing aspen to ALM-induced growth decline, we found strong support for our fourth hypothesis that the relative abundance of white spruce would influence ALM impact (P4), pointing to the important influence of stand composition on ALM impacts to aspen radial growth. Sites with relatively high white spruce basal area represent areas that have entered the latter stages of succession, where conifers have become canopy dominant or co-dominant. In these scenarios, the combined effects of interspecies competition for belowground nutrients and light, and older, taller aspen providing favorable habitat for pupae (see above), could have contributed to greater ALM impact. An additional factor contributing to greater ALM impact at sites with abundant white spruce is the complex interaction between climate, microsite conditions and ALM overwintering strategies. Wagner et al. (2012) showed that ALM employ an overwinter freeze-avoidance strategy by entering a supercooled state, and that differences in litter hibernacula microclimate has a substantial impact on ALM survival. They showed that although overwinter temperature was much colder in spruce litter compared to aspen litter, likely due to a shallower snowpack, moth survival in the spring was more than four times higher in spruce litter where conditions were drier. Drier habitats benefit freeze-avoiding insects which are susceptible to mortality when exposed to ice or water (Sinclair et al., 2003).
We suspect that the strong significant effect of white spruce on ALM impact was partly due to an abundance of favorable overwintering microhabitat for hibernating moths, resulting in a larger population emerging in the subsequent spring that defoliated co-occurring aspen at a higher rate. Although they offered little interpretation, Trugman et al. (2018) also noted a significant effect of gymnosperm abundance on aspen mortality in interior Alaska, particularly in dry soils, offering further support for the trends we observed. Our results suggest the impact of ALM defoliation is a function of the complex interplay among winter temperature, forest community composition, and pest physiology. Our finding that white spruce abundance plays an indirect, but integral role in ALM defoliation could have significant implications for mid-succession stands that may accelerate the timing of white spruce succession.
We hypothesized that warm and dry conditions would act as a precursor to ALM defoliation, and predicted that trees severely impacted by ALM would exhibit lower Δ13C, reflecting stomatal closure in response to moisture limitation (P5). However, δ13C of organic matter is influenced by the balance of photosynthesis to stomatal conductance. Here, we detected a significant negative correlation between BAI and Δ13C (Table 4), suggesting variation in Δ13C−assuming there is more growth when photosynthetic assimilation is higher – may have been driven more by variation in photosynthesis than by variation in stomatal conductance. If stomatal conductance was the primary driver of interannual variation in Δ13C, a positive relationship would indicate increased diffusion of CO2 through more open stomata, leading to an increase in the substrate used for growth (i.e. increased intercellular [CO2], ci), and greater Δ13C. Our analysis points to the limitations of Δ13C as a tool to infer variation in stomatal conductance and tree physiological responses to moisture limitation, at least for aspen growing in interior Alaska.
Although deciduous species have been predicted to benefit from warmer temperatures and increasing fire severity, aspen has experienced substantial defoliation from the aspen leaf miner (ALM) since the turn of the 21st century. We investigated whether moisture limitation may have predisposed aspen to greater ALM-induced reductions in basal area increment (BAI). Our analyses revealed conflicting lines of evidence that moisture limitation acted as a precursor to ALM defoliation. Overall, aspen growth showed a positive response to summer precipitation, but there was little difference in precipitation-growth correlations between trees that experienced greater versus lesser relative ALM impacts on their growth. Meanwhile, stands that are thought to receive greater summer precipitation showed more limited ALM impact. However, our tree-ring isotope analysis suggested that Δ13C was not a reliable indicator of variation in stomatal conductance and Δ13C was not correlated with ALM impacts on growth. Instead, we found that growth prior to the ALM outbreak, tree age, and relative abundance of white spruce were the primary factors contributing to ALM-induced declines in BAI. Trees that experienced the most severe absolute reduction in BAI were the larger and faster growing trees on gentler slopes, providing insight into beetle-host interactions. Our analysis showed greater ALM impact in stands with a larger proportion of white spruce, which may have provided drier and more suitable overwintering habitat for ALM moths, leading to greater ALM impact. Within the context of shifting boreal forest dominance, our results point to the importance of non-climatic drivers of aspen growth that may limit its ability to replace conifers at broad scales. While temperature in Alaska’s boreal forest has increased since the industrial revolution, precipitation has also increased since the early 1990s, which may alleviate drought-related declines in growth, and shift the importance of insects to the forefront as drivers of forest composition and productivity.
The datasets presented in this study can be found in online repositories. The names of the repository/repositories and accession number(s) can be found below: https://github.com/SMPCahoon/Aspen_INTAK.
SC: Conceptualization, Data curation, Formal analysis, Investigation, Methodology, Visualization, Writing–original draft, Writing–review and editing. CM: Formal analysis, Methodology, Software, Writing–review and editing, Investigation. DC: Data curation, Formal analysis, Methodology, Writing–review and editing, Investigation. PS: Conceptualization, Funding acquisition, Investigation, Methodology, Project administration, Resources, Supervision, Writing–review and editing.
The author(s) declare financial support was received for the research, authorship, and/or publication of the article. Funding for the tree core and tree-ring δ13C analyses was provided by agreement number 19-JV-11261919-092 between the USDA Forest Service and the University of Alaska Anchorage. CTM’s position as an ORISE fellow is supported by agreement number 22-IA-11261919-042.
We would like to thank Jamie Hollingsworth and Jocelyn Cramer for their assistance with field work, and Annalis Brownlee for her diligence processing and analyzing tree cores. We are grateful to John Ferguson for producing high quality carbon isotope data. Daniel Griffin supplied access to Dendro Elevator for web-based micrometry. We thank two referees who provide helpful comments and improved the quality of our manuscript. The findings and conclusions in this publication are those of the authors and should not be construed to represent any official USDA or U.S. Government determination or policy.
The authors declare that the research was conducted in the absence of any commercial or financial relationships that could be construed as a potential conflict of interest.
The author(s) declared that they were an editorial board member of Frontiers, at the time of submission. This had no impact on the peer review process and the final decision.
All claims expressed in this article are solely those of the authors and do not necessarily represent those of their affiliated organizations, or those of the publisher, the editors and the reviewers. Any product that may be evaluated in this article, or claim that may be made by its manufacturer, is not guaranteed or endorsed by the publisher.
The Supplementary Material for this article can be found online at: https://www.frontiersin.org/articles/10.3389/ffgc.2024.1419813/full#supplementary-material
Anderegg, W. R. L., Hicke, J. A., Fisher, R. A., Allen, C. D., Aukema, J., Bentz, B., et al. (2015). Tree mortality from drought, insects, and their interactions in a changing climate. New Phytol. 208, 674–683. doi: 10.1111/nph.13477
Ballinger, T. J., Bhatt, U. S., Bieniek, P. A., Brettschneider, B., Lader, R. T., Littell, J. S., et al. (2023). Alaska terrestrial and marine climate trends, 1957–2021. J. Clim. 36, 4375–4391. doi: 10.1175/JCLI-D-22-0434.1
Ballinger, T. J., Overland, J. E., Wang, M., Bhatt, U. S., Hanna, E., Hanssen-Bauer, I., et al. (2020). “Surface air temperature,” in Arctic Report Card 2020, eds R. L. Thoman, J. Richter-Menge, and M. L. Druckenmiller. doi: 10.25923/gcw8-2z06
Belmecheri, S., and Lavergne, A. (2020). Compiled records of atmospheric CO2 concentrations and stable carbon isotopes to reconstruct climate and derive plant ecophysiological indices from tree rings. Dendrochronologia 63:125748. doi: 10.1016/j.dendro.2020.125748
Berg, E. E., David Henry, J., Fastie, C. L., De Volder, A. D., and Matsuoka, S. M. (2006). Spruce beetle outbreaks on the Kenai Peninsula, Alaska, and Kluane National Park and Reserve, Yukon Territory: Relationship to summer temperatures and regional differences in disturbance regimes. For. Ecol. Manag. 227, 219–232. doi: 10.1016/j.foreco.2006.02.038
Berner, L. T., and Goetz, S. J. (2022). Satellite observations document trends consistent with a boreal forest biome shift. Glob. Change Biol. 28, 3275–3292. doi: 10.1111/gcb.16121
Bieniek, P. A., Walsh, J. E., Thoman, R. L., and Bhatt, U. S. (2014). Using climate divisions to analyze variations and trends in alaska temperature and precipitation. J. Clim. 27, 2800–2818. doi: 10.1175/JCLI-D-13-00342.1
Bonan, G. B. (2008). Forests and climate change: Forcings, feedbacks, and the climate benefits of forests. Science 320, 1444–1449. doi: 10.1126/science.1155121
Boyd, M. A., Berner, L. T., Doak, P., Goetz, S. J., Rogers, B. M., Wagner, D., et al. (2019). Impacts of climate and insect herbivory on productivity and physiology of trembling aspen (Populus tremuloides) in Alaskan boreal forests. Environ. Res. Lett. 14:085010. doi: 10.1088/1748-9326/ab215f
Boyd, M. A., Berner, L. T., Foster, A. C., Goetz, S. J., Rogers, B. M., Walker, X. J., et al. (2021). Historic declines in growth portend trembling aspen death during a contemporary leaf miner outbreak in Alaska. Ecosphere 12:3569. doi: 10.1002/ecs2.3569
Brendel, O., Iannetta, P. P. M., and Stewart, D. (2000). A rapid and simple method to isolate pure alpha-cellulose. Phytochem. Anal. 11, 7–10. doi: 10.1002/(SICI)1099-1565(200001/02)11:1<7::AID-PCA488<3.0.CO;2-U
Bunn, A. G. (2008). A dendrochronology program library in R (dplR). Dendrochronologia 26, 115–124. doi: 10.1016/j.dendro.2008.01.002
Bunn, A. G. (2010). Statistical and visual crossdating in R using the dplR library. Dendrochronologia 28, 251–258. doi: 10.1016/j.dendro.2009.12.001
Cahoon, S. M. P., and Baer, K. C. (2022). Forest resources of the Tanana unit, Alaska: 2018. Portland, OR: U.S. Department of Agriculture, Forest Service, Pacific Northwest Research Station, doi: 10.2737/PNW-GTR-1005
Cahoon, S. M. P., Sullivan, P. F., Brownlee, A. H., Pattison, R. R., Andersen, H., Legner, K., et al. (2018). Contrasting drivers and trends of coniferous and deciduous tree growth in interior Alaska. Ecology 99, 1284–1295. doi: 10.1002/ecy.2223
Cernusak, L., and Ubierna, N. (2022). “Carbon Isotope Effects in Relation to CO2 Assimilation by Tree Canopies,” in Stable isotopes in tree rings. Tree physiology, eds R. T. W. Siegwolf, J. R. Brooks, J. Roden, and M. Saurer (Cham: Springer), 291–310. doi: 10.1007/978-3-030-92698-4
Chen, L., Huang, J.-G., Alam, S. A., Zhai, L., Dawson, A., Stadt, K. J., et al. (2017). Drought causes reduced growth of trembling aspen in western Canada. Glob. Change Biol. 23, 2887–2902. doi: 10.1111/gcb.13595
Chen, L., Huang, J.-G., Dawson, A., Zhai, L., Stadt, K. J., Comeau, P. G., et al. (2018). Contributions of insects and droughts to growth decline of trembling aspen mixed boreal forest of western Canada. Glob. Change Biol. 24, 655–667. doi: 10.1111/gcb.13855
Crous, P. W., Cowan, D. A., Maggs-Kölling, G., Yilmaz, N., Larsson, E., Angelini, C., et al. (2020). Fungal Planet description sheets: 1112–1181. Persoonia Mol. Phylogeny Evol. Fungi 45, 251–409. doi: 10.3767/persoonia.2020.45.10
Csank, A. Z., Miller, A. E., Sherriff, R. L., Berg, E. E., and Welker, J. M. (2016). Tree-ring isotopes reveal drought sensitivity in trees killed by spruce beetle outbreaks in south-central Alaska. Ecol. Appl. 26, 2001–2020. doi: 10.1002/eap.1365
Daly, C., Halbleib, M., Smith, J. I., Gibson, W. P., Doggett, M. K., Taylor, G. H., et al. (2008). Physiographically sensitive mapping of climatological temperature and precipitation across the conterminous United States. Int. J. Climatol. 28, 2031–2064. doi: 10.1002/joc.1688
DeRose, J. R., and Gardner, R. S. (2010). Technique to Improve Visualization of Elusive Tree-Ring Boundaries in Aspen (Populus tremuloides). Tree-Ring Res. 66, 75–78. doi: 10.3959/2009-11.1
Foster, A. C., Wang, J. A., Frost, G. V., Davidson, S. J., Hoy, E., Turner, K. W., et al. (2022). Disturbances in North American boreal forest and Arctic tundra: Impacts, interactions, and responses. Environ. Res. Lett. 17:113001. doi: 10.1088/1748-9326/ac98d7
Frank, D. C., Poulter, B., Saurer, M., Esper, J., Huntingford, C., Helle, G., et al. (2015). Water-use efficiency and transpiration across European forests during the Anthropocene. Nat. Clim. Change 5, 579–583. doi: 10.1038/nclimate2614
Gaudinski, J. B., Dawson, T. E., Quideau, S., Schuur, E. A. G., Roden, J. S., Trumbore, S. E., et al. (2005). Comparative analysis of cellulose preparation techniques for use with 13C, 14C, and 18O isotopic measurements. Anal. Chem. 77, 7212–7224. doi: 10.1021/ac050548u
Gely, C., Laurance, S. G. W., and Stork, N. E. (2020). How do herbivorous insects respond to drought stress in trees? Biol. Rev. 95, 434–448. doi: 10.1111/brv.12571
Herms, D. A., and Mattson, W. J. (1992). The dilemma of plants: To grow or defend. Q. Rev. Biol. 67, 283–335. doi: 10.1086/417659
Hogg, E. H. (1997). Temporal scaling of moisture and the forest-grassland boundary in western Canada. Agric. For. Meteorol. 84, 115–122. doi: 10.1016/S0168-1923(96)02380-5
Hogg, E. H., Brandt, J. P., and Kochtubajda, B. (2002). Growth and dieback of aspen forests in northwestern Alberta, Canada, in relation to climate and insects. Can. J. For. Res. 32, 823–832. doi: 10.1139/x01-152
Hogg, E. H., Brandt, J. P., and Michaelian, M. (2008). Impacts of a regional drought on the productivity, dieback, and biomass of western Canadian aspen forests. Can. J. For. Res. 38, 1373–1384. doi: 10.1139/X08-001
Huberty, A. F., and Denno, R. F. (2004). Plant water stress and its consequences for herbivorous insects: A new synthesis. Ecology 85, 1383–1398. doi: 10.1890/03-0352
Hyndman, R. J., and Khandakar, Y. (2008). Automatic time series forecasting: The forecast package for R. J. Stat. Softw. 27, 1–22. doi: 10.18637/jss.v027.i03
IPCC (2023). Climate Change 2023: Synthesis Report. Contribution of Working Groups I, II and III to the Sixth Assessment Report of the Intergovernmental Panel on Climate Change, eds Core Writing Team, H. Lee and J. Romero (Geneva: IPCC), 35–115. doi: 10.59327/IPCC/AR6-9789291691647
Jactel, H., Petit, J., Desprez-Loustau, M.-L., Delzon, S., Piou, D., Battisti, A., et al. (2012). Drought effects on damage by forest insects and pathogens: A meta-analysis. Glob. Change Biol. 18, 267–276. doi: 10.1111/j.1365-2486.2011.02512.x
Jamieson, M. A., Burkle, L. A., Manson, J. S., Runyon, J. B., Trowbridge, A. M., and Zientek, J. (2017). Global change effects on plant–insect interactions: The role of phytochemistry. Curr. Opin. Insect Sci. 23, 70–80. doi: 10.1016/j.cois.2017.07.009
Johansson, T. (1996). Site index curves for European aspen (Populus tremula L.) growing on forest land of different soils in Sweden. Silva Fenn. 30:8503. doi: 10.14214/sf.a8503
Kolb, T. E., Fettig, C. J., Ayres, M. P., Bentz, B. J., Hicke, J. A., Mathiasen, R., et al. (2016). Observed and anticipated impacts of drought on forest insects and diseases in the United States. For. Ecol. Manag. 380, 321–334. doi: 10.1016/j.foreco.2016.04.051
Konôpka, B., Pajtík, J., Šebeň, V., and Merganičová, K. (2022). Modeling bark thickness and bark biomass on stems of four broadleaved tree species. Plants 11:1148. doi: 10.3390/plants11091148
Koricheva, J., Larsson, S., and Haukioja, E. (1998). Insect performance on experimentally stressed woody plants: A meta-analysis. Annu. Rev. Entomol. 43, 195–216. doi: 10.1146/annurev.ento.43.1.195
Lorio, P. L. (1986). Growth-differentiation balance: A basis for understanding southern pine beetle-tree interactions. For. Ecol. Manag. 14, 259–273. doi: 10.1016/0378-1127(86)90172-6
Love, D. M., Venturas, M. D., Sperry, J. S., Brooks, P. D., Pettit, J. L., Wang, Y., et al. (2019). Dependence of aspen stands on a subsurface water subsidy: Implications for climate change impacts. Water Resour. Res. 55, 1833–1848. doi: 10.1029/2018WR023468
Ma, Z., Peng, C., Zhu, Q., Chen, H., Yu, G., Li, W., et al. (2012). Regional drought-induced reduction in the biomass carbon sink of Canada’s boreal forests. Proc. Natl. Acad. Sci. U.S.A. 109, 2423–2427. doi: 10.1073/pnas.1111576109
Mack, M. C., Walker, X. J., Johnstone, J. F., Alexander, H. D., Melvin, A. M., Jean, M., et al. (2021). Carbon loss from boreal forest wildfires offset by increased dominance of deciduous trees. Science 372, 280–283. doi: 10.1126/science.abf3903
Mattson, W. J., and Haack, R. A. (1987). The role of drought in outbreaks of plant-eating insects. BioScience 37, 110–118. doi: 10.2307/1310365
McAfee, S. A., Guentchev, G., and Eischeid, J. K. (2013). Reconciling precipitation trends in Alaska: 1. Station-based analyses: Precipitation trends in Alaska. J. Geophys. Res. Atmospheres 118, 7523–7541. doi: 10.1002/jgrd.50572
McDowell, N. G. (2011). Mechanisms linking drought, hydraulics, carbon metabolism, and vegetation mortality. Plant Physiol. 155, 1051–1059. doi: 10.1104/pp.110.170704
McDowell, N., Pockman, W. T., Allen, C. D., Breshears, D. D., Cobb, N., Kolb, T., et al. (2008). Mechanisms of plant survival and mortality during drought: Why do some plants survive while others succumb to drought? New Phytol. 178, 719–739. doi: 10.1111/j.1469-8137.2008.02436.x
Michaelian, M., Hogg, E. H., Hall, R. J., and Arsenault, E. (2011). Massive mortality of aspen following severe drought along the southern edge of the Canadian boreal forest. Glob. Change Biol. 17, 2084–2094. doi: 10.1111/j.1365-2486.2010.02357.x
Nehrbass-Ahles, C., Babst, F., Klesse, S., Nötzli, M., Bouriaud, O., Neukom, R., et al. (2014). The influence of sampling design on tree-ring-based quantification of forest growth. Glob. Change Biol. 20, 2867–2885. doi: 10.1111/gcb.12599
Peng, C., Ma, Z., Lei, X., Zhu, Q., Chen, H., Wang, W., et al. (2011). A drought-induced pervasive increase in tree mortality across Canada’s boreal forests. Nat. Clim. Change 1, 467–471. doi: 10.1038/nclimate1293
Peterson, E. B., and Peterson, N. M., and Northern Forestry Centre. (1992). Ecology, management, and use of aspen and balsam poplar in the Prairie provinces, Canada. Edmonton, AB: Northern Forestry Centre.
Pinheiro, J., Bates, D. B., DebRoy, S., Sarkar, D., Heisterkamp, S., et al. (2021). nlme: Linear and nonlinear mixed effects models. Available online at: https://cran.r-project.org/web/packages/nlme/index.html (accessed September 01, 2021).
Porter, C., Howat, I., Noh, M.-J., Husby, E., Khuvis, S., Danish, E., et al. (2023). ArcticDEM - mosaics, Version 4.1. doi: 10.7910/DVN/3VDC4W
Price, D. T., Alfaro, R. I., Brown, K. J., Flannigan, M. D., Fleming, R. A., Hogg, E. H., et al. (2013). Anticipating the consequences of climate change for Canada’s boreal forest ecosystems. Environ. Rev. 21, 322–365. doi: 10.1139/er-2013-0042
R Core Team (2022). R: A Language and Environment for Statistical Computing. R Foundation for Statistical Computing, Vienna.
Reyes-Hernández, V., and Comeau, P. G. (2014). Survival probability of white spruce and trembling aspen in boreal pure and mixed stands experiencing self-thinning. For. Ecol. Manag. 323, 105–113. doi: 10.1016/j.foreco.2014.03.010
Ruess, R. W., Winton, L. M., and Adams, G. C. (2021). Widespread mortality of trembling aspen (Populus tremuloides) throughout interior Alaskan boreal forests resulting from a novel canker disease. PLoS One 16:e0250078. doi: 10.1371/journal.pone.0250078
Safranyik, L., and Wilson, B. (2006). The mountain pine beetle: A synthesis of biology, management and impacts on lodgepole pine. Victoria, BC: Pacific Forestry Centre.
Sinclair, B. J., Vernon, P., Jaco Klok, C., and Chown, S. L. (2003). Insects at low temperatures: An ecological perspective. Trends Ecol. Evol. 18, 257–262. doi: 10.1016/S0169-5347(03)00014-4
Snedden, J. (2013). The root distribution, architecture, transpiration and root sapflow dynamics of mature trembling aspen (Populus tremuloides) growing along a hillslope. Master’s thesis. Edmonton: University of Alberta.
Sperry, J. S., Perry, A. H., and Sullivan, J. E. M. (1991). Pit membrane degradation and air-embolism formation in ageing xylem vessels of Populus tremuloides Michx. J. Exp. Bot. 42, 1399–1406. doi: 10.1093/jxb/42.11.1399
Torgersen, T. R., and Beckwith, R. C. (1974). Parasitoids associated with the large aspen totrix, Choristoneura conflictana (Lepidoptera: Tortricidae), in interior Alaska. Can. Entomol. 106, 1247–1265. doi: 10.4039/Ent1061247-12
Trugman, A. T., Medvigy, D., Anderegg, W. R. L., and Pacala, S. W. (2018). Differential declines in Alaskan boreal forest vitality related to climate and competition. Glob. Change Biol. 24, 1097–1107. doi: 10.1111/gcb.13952
Tundo, G. (2021). How aspen tree height influences aspen leaf miner (Phyllocnistis populiella) oviposition and performance. Master’s thesis. Fairbanks, AK: University of Alaska Fairbanks.
Vicente-Serrano, S. M., Beguería, S., and López-Moreno, J. I. (2010). A multiscalar drought index sensitive to global warming: The standardized precipitation evapotranspiration index. J. Clim. 23, 1696–1718. doi: 10.1175/2009JCLI2909.1
Volney, W. J. A., and Fleming, R. A. (2000). Climate change and impacts of boreal forest insects. Agric. Ecosyst. Environ. 82, 283–294. doi: 10.1016/S0167-8809(00)00232-2
Wagner, D., DeFoliart, L., Doak, P., and Schneiderheinze, J. (2008). Impact of epidermal leaf mining by the aspen leaf miner (Phyllocnistis populiella) on the growth, physiology, and leaf longevity of quaking aspen. Oecologia 157, 259–267.
Wagner, D., Doak, P., Sformo, T., Steiner, P. M., and Carlson, B. (2012). Overwintering physiology and microhabitat use of Phyllocnistis populiella (Lepidoptera: Gracilliariidae) in interior alaska. Environ. Entomol. 41, 180–187. doi: 10.1603/EN11193
Wagner, D., Wheeler, J. M., and Burr, S. J. (2020). The leaf miner Phyllocnistis populiella negatively impacts water relations in aspen. Tree Physiol. 40, 580–590. doi: 10.1093/treephys/tpz109
Wang, T., Hamann, A., Spittlehouse, D., and Carroll, C. (2016). Locally downscaled and spatially customizable climate data for historical and future periods for North America. PLoS One 11:e0156720. doi: 10.1371/journal.pone.0156720
Wright, I. J., and Westoby, M. (2002). Leaves at low versus high rainfall: Coordination of structure, lifespan and physiology. New Phytol. 155, 403–416. doi: 10.1046/j.1469-8137.2002.00479.x
Young-Robertson, J. M., Bolton, W. R., Bhatt, U. S., Cristobal, J., and Thoman, R. (2016). Deciduous trees are a large and overlooked sink for snowmelt water in the boreal forest. Sci. Rep. 6:29504. doi: 10.1038/srep29504
Keywords: aspen leaf miner, boreal forest, dendroecology, isotopes, Populus tremuloides, Phyllocnistis populiella, tree ring
Citation: Cahoon SMP, Maher C, Crawford D and Sullivan PF (2024) White spruce presence increases leaf miner effects on aspen growth in interior Alaska. Front. For. Glob. Change 7:1419813. doi: 10.3389/ffgc.2024.1419813
Received: 18 April 2024; Accepted: 02 July 2024;
Published: 22 July 2024.
Edited by:
Andrei G. Lapenas, Albany State University, United StatesReviewed by:
Robert Rathbone Pattison, Bureau of Land Management, United StatesCopyright © 2024 Cahoon, Maher, Crawford and Sullivan. This is an open-access article distributed under the terms of the Creative Commons Attribution License (CC BY). The use, distribution or reproduction in other forums is permitted, provided the original author(s) and the copyright owner(s) are credited and that the original publication in this journal is cited, in accordance with accepted academic practice. No use, distribution or reproduction is permitted which does not comply with these terms.
*Correspondence: Sean M. P. Cahoon, c2Vhbi5jYWhvb25AdXNkYS5nb3Y=
†ORCID: Colin Maher, orcid.org/0000-0001-8409-7775
Disclaimer: All claims expressed in this article are solely those of the authors and do not necessarily represent those of their affiliated organizations, or those of the publisher, the editors and the reviewers. Any product that may be evaluated in this article or claim that may be made by its manufacturer is not guaranteed or endorsed by the publisher.
Research integrity at Frontiers
Learn more about the work of our research integrity team to safeguard the quality of each article we publish.