 Bruno A. Aparício
 Alan A. Ager2
94% of researchers rate our articles as excellent or good
Learn more about the work of our research integrity team to safeguard the quality of each article we publish.
Find out more
ORIGINAL RESEARCH article
Front. For. Glob. Change, 30 July 2024
Sec. Fire and Forests
Volume 7 - 2024 | https://doi.org/10.3389/ffgc.2024.1419288
Increasing impacts from wildfires are reshaping fire policies worldwide, with expanded investments in a wide range of fuel reduction strategies. In many fire prone regions, especially in the Mediterranean basin, fuel management programs have relied on fuel break networks for decades to facilitate fire suppression and reduce area burned and damage. By contrast, on the fire prone federal forests in the western United States, fuel management is guided primarily by landscape restoration goals, including improving fire resiliency such that wildfires can be managed for ecological benefit, and suppression is used more as a tool to shape burn patterns and less to extinguish fires. New policies in both fire systems are now calling for hybrid approaches that rely on both types of investments and efficient allocation of alternative spatial treatment patterns: linear networks versus patches across the landscape. However, studies that combine these strategies and examine alternative co-prioritization outcomes and potential synergies are largely non-existent. Here, we analyzed scenarios for implementing both types of treatments in concert while varying the prioritization metrics for one type or the other on a western United States national forest. We measured the response related to both treatment strategies including fire intersection rate, improvement in forest resiliency, and net revenue. We found that projects with benefits to both strategies can be identified and mapped independently of the implementation scenario and restoration objective. However, scenarios prioritized for fuel breaks preceding restoration resulted in the identification of more projects that met the criteria for providing dual benefits. The study is a rare example of optimizing hybrid fuel treatment projects that serve both restoration and fire protection goals with different spatial treatment designs.
A combination of climate change, land use practices, and human activity is reshaping wildland fire frequency, intensity, and fire regimes worldwide (Pausas and Fernández-Muñoz, 2012; Williams et al., 2019; Galizia et al., 2023). In Mediterranean Europe, prolonged droughts, heatwaves and increases in wildland fuel load and continuity in rural landscapes have exacerbated wildfire activity (Moreira et al., 2020), prompting governments and regional entities to increase investments in fire suppression resources and scale up a wide range of wildland fuel reduction strategies (AGIF, 2020; Ministry of Environment and Energy Greece, 2022; Pandey et al., 2023). Similarly, in the United States, a new Forest Service wildfire strategy (USDA Forest Service, 2022) calls for treating 20 million hectares on large landscapes that are the source of the bulk of the wildfire risk to adjacent developed areas. The treatment plans address the full spectrum of restoration and wildfire protection needs for a wide range of socioeconomic and biodiversity conservation objectives within prioritized 100,000 ha firesheds surrounding major developed areas. Fuel management activities are being prioritized and implemented at the scale of 10,000–40,000 ha project areas within firesheds with treatments dispersed across the landscape to reduce fuel loadings on 30–40% of the landscape. Multiple fuel reduction methods are being used to reduce surface and canopy fuels and restore fire resiliency using well-established methods from the literature (Agee et al., 2000). Landscape scale forest and fuel management is being augmented in the United States and elsewhere by treating fuels along networks of potential fire suppression control lines (Thompson et al., 2022). These linear features are typically interconnected along roads while recognizing topography, existing infrastructure, and potential fire behavior (O’Connor et al., 2016). The level of investments required to treat fuels to create safe and effective control locations has not been quantified despite extensive investments in the planning process. In one recent study conducted on a western United States national forest approximately 97% of the mapped network required treatment to meet the expectations of local fire managers (Ager et al., 2023). It was estimated that fuel management specifically to create effective control lines along roads on this particular national forest would cost approximately $33,000 per km of linear control feature, or about $75 million to build the entire network. However, substantial revenue was predicted from harvested logs in many of the stands along the network buffer, and implementation of the entire network was predicted to generate a net revenue of around $65 million (Figures 8D, 10 in Ager et al. (2023)).
Both landscape and fuel break network treatment programs face substantial backlog of areas to treat and thus face a similar problem of prioritizing treatments on western United States national forests and neighboring public lands. Several studies have analyzed individual prioritization strategies for restoration (e.g., Ager et al., 2016; Belavenutti et al., 2022) or fuel break networks (e.g., Zong et al., 2021; Ager et al., 2023), but studies are lacking that examine the problem of co-prioritizing these spatially divergent treatment strategies. For instance, given finite budgets should managers use fuel break networks as a triage in areas that are low priority for restoration work and where potential revenue will not support large-scale forest and fuel management, or should they be co-implemented in tandem with restoration projects? If the latter, what level of treatments should be allocated to the different treatment strategies? Although landscape restoration treatments share many but not all the goals of more narrow fuel reduction programs (Stephens et al., 2021), the two divergent strategies may or may not complement each other in terms of long-term landscape resiliency, reduction of fire intensity, and ultimately, reduce burned area and wildfire-related losses (Xanthopoulos et al., 2006; Ascoli et al., 2018; Ager et al., 2021; Benali et al., 2021). For instance, landscape treatment programs can generate substantial revenue to meet a wide range of socioeconomic and conservation management objectives (Stephens et al., 2024), but may offer less tactical response for fire suppression.
In this study, we analyzed alternative co-implementation strategies of fuel breaks vs. landscape restoration treatments where one strategy was the priority for locating projects, and the other was implemented as a secondary objective. In essence, when a project area of one of the strategies was implemented, it was followed by the implementation of one project of the other strategy in adjacent areas. The benefits of each of the strategies were then evaluated to locate where maximum dual benefits potentially exist. This study was motivated by gaps in current planning and prioritization at the scale of national forests tasked with implementing the 2022 Wildfire Crisis Strategy (USDA Forest Service, 2022).
The study was located on the Umatilla National Forest, situated in the Blue Mountains ecoregion (Oregon and Washington states; Figure 1) (USDA Forest Service, 1994). The national forest spans ca. 580,000 ha, with ca. 80,000 ha within the proposed fuel break network and ca. 10,000 ha designated as wilderness (Figure 1). Elevation generally ranges from 900 to 1,500 m, with the highest peaks close to 3,000 m. Forest composition and structure follow elevational gradients with the lower elevations dominated by dry forests of ponderosa pine (Pinus ponderosa Lawson & C. Lawson) interspersed with grass and basalt scablands, while the higher elevations are covered by dry mixed conifer [grand fir (Abies grandis (Douglas ex D. Don) Lindl] and Douglas-fir [Pseudotsuga menziesii (Mirb.) Franco)]. Cold dry forested areas are dominated by lodgepole pine (Pinus contorta Douglas ex Loudon) at higher elevations. The west-facing steep canyon lands are often characterized by basalt scablands and extensive grasslands where soil moisture limits the development of vegetation (Geist and Cochran, 1991).
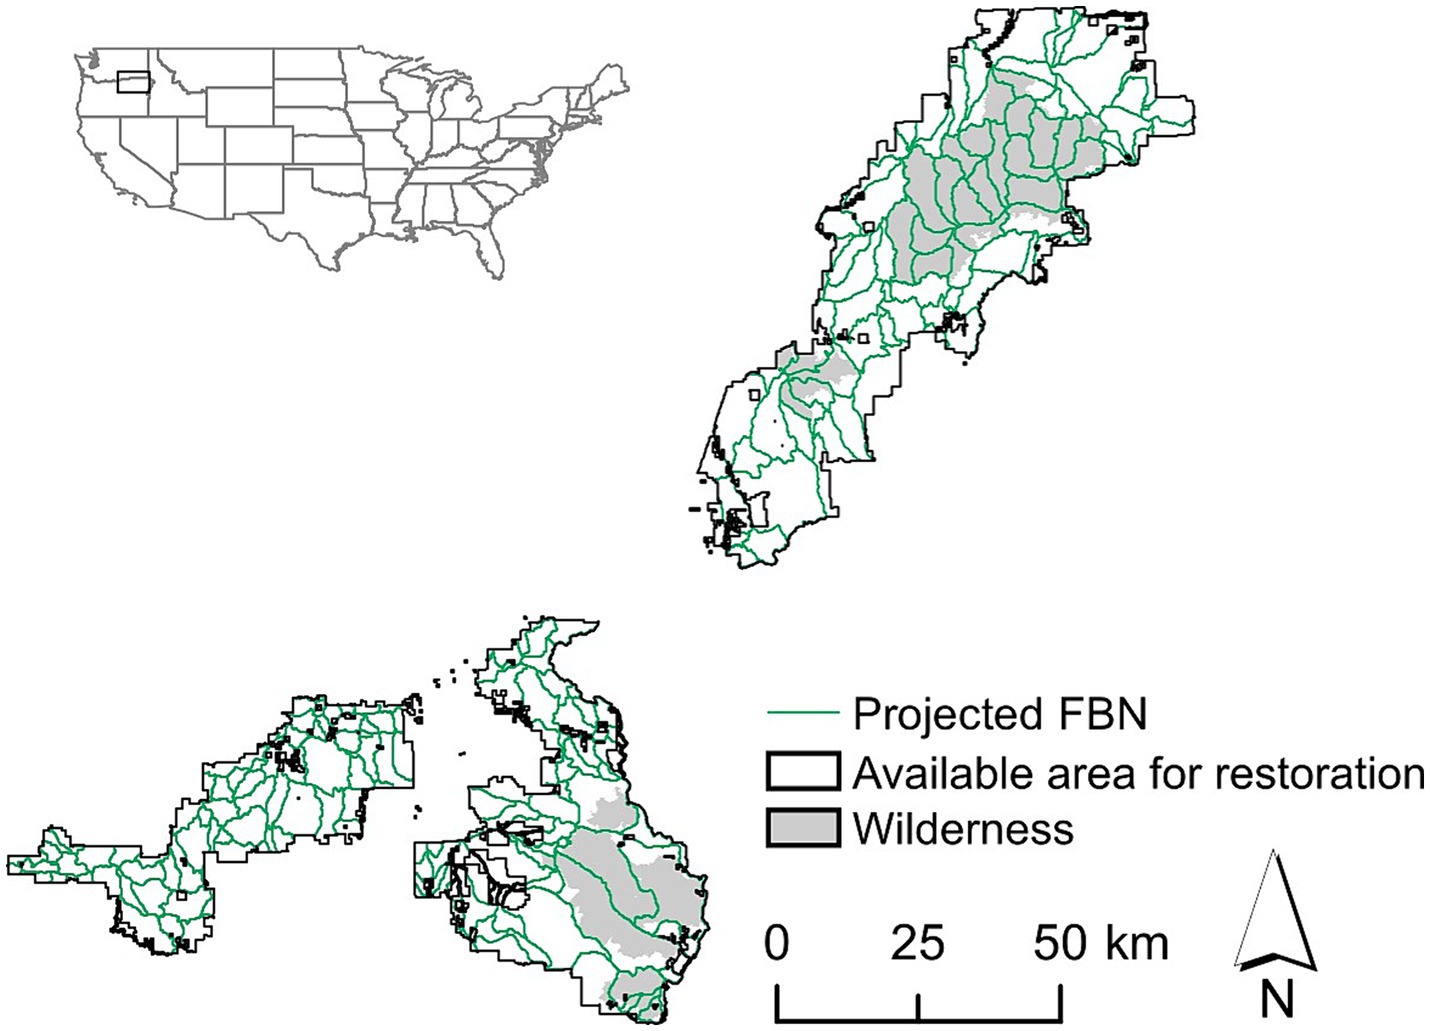
Figure 1. Study area showing the proposed fuel break network (FBN) and the available area for restoration projects (i.e., excluding wilderness) on the Umatilla National Forest.
Under pre-settlement conditions wildfires on the national forest and surrounding Blue Mountains were common and typically low intensity that burned for weeks or even months, ignited by either lightning or indigenous people (Heyerdahl et al., 2001). Densification from fire suppression and selective logging has reshaped the fire regime to one characterized by mixed severity fires, resulting in the loss of 20–70% of the dominant tree basal area or canopy cover (Hessburg et al., 2016). On average, 4,961 ha burn annually, predominantly due to lightning-caused wildfires (1992–2020) (Short, 2022). For the period 1992–2020, the largest fires burning on the national forest were the Columbia Complex (44,215 ha), the Butte Creek (32,460 ha), Red Hill (21,630 ha), School (21,043 ha), Monument Complex (13,092 ha), and Green Ridge (17,188 ha).
The bulk of the vegetation management on the national forest is focused on restoring landscape fire resiliency using a number of treatment regimens including commercial and commercial thin, selective thinning from below to reduce canopy fuels and fire intolerant species, pile and broadcast burning or mastication. An average of about 4,000 ha per year is treated with broadcast burning based on a 10-year average.
Green (1977) defines fuel break networks (henceforth FBN) as “strategically located wide blocks or strips, on which a cover of dense, heavy, or flammable vegetation has been permanently changed to one of lower fuel volume or reduced flammability.” The FBN on the Umatilla National Forest was planned in 2020 and was designed with input from local fire managers. The full FBN consists of 1,752 km (with an extra 1,787 km on lands adjacent to the forest), with a total width of 300 m, as established by federal legislation (U.S. House of Representatives, 2022). Its main purpose is to allow for suppression efforts and other fire management activities. Ager et al. (2023) report that 83% of the FBN is available for management, i.e., is outside wilderness areas; and around 2% is considered non-conifer forest, generally associated with basalt scablands and grasslands that have low fuel loadings.
The FBN was subdivided into 2,766 treatment decision units averaging 1,000-m in length and 300-m in width (ca. 30 ha in area). In accordance with local managers, stands exceeding 15% canopy cover were considered for thinning, while stands with less than 15% canopy closure but with more than 20% of simulated fires exhibiting a flame length > 1.2 m [estimated from FSim (Finney et al., 2011) and wildfire simulation outputs (Helmbrecht, 2019)] identified for surface fuel treatment. FSim is a well-used wildfire simulation model in the United States that simulates large wildfire events and generates a suite of outputs that can be used for risk assessment and forest and fuel management prioritization (Ager et al., 2021).
Fuel break network projects were created by Ager et al. (2023) using the ForSys planning model (Day et al., 2023; see section 2.5). ForSys is a multicriteria optimization-planning model that identifies stands (or treatment units) that maximize attainment for single or multiple objectives with varying priority weights. The ForSys algorithm employs a greedy search heuristic that tests each stand as a seed to construct projects within the surrounding landscape. The search continues, adding adjacent parcels, until the project constraint is met. Ager et al. (2023) prioritized FBN projects exploring alternative project scale geometries (radial vs. linear, with a total of 800–1,200 ha treated per project) outside of wilderness areas and limited to forest lands and evaluated based on several response metrics (Ager et al., 2023). The radial geometry is characterized by a dense, semi-circular web of treatments radiating from the project centroid, while in the linear geometry, segments span longer distances, away from the project centroid (Supplementary Figure S4). The result was a sequence of prioritized projects for four scenarios, where geometry was maximized alone or together with revenue. In each scenario, a total of 32–34 projects met the 800–1,200 ha treatment target and were kept as projects (71–76% of the total FBN). Among the scenarios created, the Umatilla National Forest was most interested in implementing the linear geometry scenarios (i.e., projects spanning longer distances) given several advantages related to potential fire control and efficiency of the treatments intercepting future fires (see Figure 8 in Ager et al., 2023). Hence, the 32 linear FBN projects generated in Ager et al. (2023) were used in this study.
Landscape restoration can be defined as strategic placement of fuel treatments “to mitigate the collective effects of fires interacting over broad spatial and temporal extents” (Gray and Dickson, 2016). Restoration treatments on the Umatilla National Forest are driven both by resiliency and economic objectives. Revenue was determined by subtracting the harvested log values from the costs associated with harvesting, hauling, and fuel reduction, consistent with methodologies outlined in previous research (Ager et al., 2017, 2023; Belavenutti et al., 2021, 2022). Parameters for costs (that include stratified costs for logging, transportation, and harvesting system) were obtained from local timber sale planning staff and then updated in 2020 with input from the Umatilla National Forest. Pile burn treatments were assigned a cost of $1,110 per ha. The dimensions and species makeup of harvested logs were modeled using the Forest Vegetation Simulator (FVS) Blue Mountains variant (Keyser and Dixon, 2015), and economic calculations, including revenue and merchantable volume, were conducted utilizing the FVS economics extension (Martin, 2013). FVS is a widely used individual-tree forest growth model that simulates growth and mortality of forest vegetation and response to a wide range of management activities.
Mean log value per species and diameter at the small end were sourced from timber mills operating within the research area. Net revenue was derived by deducting costs from revenue and then apportioned to individual stands based on area-weighted values to accommodate variations in stand polygon sizes across each segment. The estimation of net revenue did not consider: (1) planning and contracting costs, (2) cost of road maintenance and construction, and (3) removal of non-merchantable volume generated from thinned stands and marginal merchantable pulpwood material. More detailed information on the calculation of net revenue can be found in Ager et al. (2023).
We measured resiliency as the percentage above maximum Stand Density Index (SDI—Cochran et al., 1993; North et al., 2022). Maximum SDI for each Plant Association Group (dominant plant composition associated with climate and other abiotic conditions) was assigned according to Cochran et al. (1993) and Powell (2010). SDI represents the relative stand density, relying on the correlation between the average size of trees and the number of trees within a given area in densely populated stands. SDI provides information on the competitive interactions between individuals in a population, characterizing how growth and survival are affected by competition between trees (USDA Forest Service, 2024), and has been used as a measure of resiliency on western US national forests (North et al., 2022). For example, stands with a percentage above maximum SDI of 55% are considered overstocked, characterized by full site occupancy, stagnation, declining of whole stand volume growth due to mortality and active competition-induced mortality (USDA Forest Service, 2024). Maximum SDI in the Blue Mountains was established by Powell (2010) for the various ecological conditions in the region. Consistent with current management practices, stands that exceed 55% of the maximum are targeted for treatment prescriptions that thin from below, retaining fire adapted species, and reduce the stocking to 35% of the max SDI. The resulting stands have crown bulk densities well below the thresholds for crown fire and are not susceptible to crown fire. The effect of these specific prescriptions on modeled fire behavior was reported in detail in Ager et al. (2007).
Modeled fire perimeters were obtained using a library of simulated fires on the Umatilla National Forest (n = 33,405) from the FSim fire model. The same fire library was previously used in other prioritization studies on the Umatilla National Forest (Belavenutti et al., 2021, 2022; Ager et al., 2023). Similar to Ager et al. (2023), we intersected all simulated fire perimeters with the FBN projects for all implementation scenarios and calculated: (1) the total number of unique fires intersected per hectare treated in the restoration project, (2) the total length of intersection between the FBN and the fire perimeter per hectare treated in the restoration project, and (3) the number of fully intersected fires. In addition, we calculated FBN density as the length of the FBN per hectare treated in restoration projects. The total number of fires intersected was calculated considering all intersections (i.e., regardless of partial intersection or full intersection; Figure 2), and the intersection length was calculated by summing the length of intersection between all fire perimeters and each FBN project. The number of fully intersected fires followed the approach previously developed in Aparício et al. (2022a,b) and illustrated in Figure 2. This approach excludes fire perimeters where only a portion of the fire footprint intersected the FBN. A more detailed analysis was carried out for these fully intersected fires by quantifying those that intersect landscape restoration treatments before hitting the FBN (Figures 2B,C). The intersection of the FBN with landscape treatments is expected to influence fire behavior by reducing fire intensity and rate of spread (among others; see Ott et al., 2023), and hence, potentially improve the capacity to stop the fire at the FBN (by giving more time to deploy fire brigades and decrease fire intensity in its vicinity). We recognize that whether the fire is actually controlled at the fuel break depends on multiple factors, such as the type of suppression work executed on the FBN, the flame length, and the intersection angle between the fire and FBN (Ortega et al., 2024).
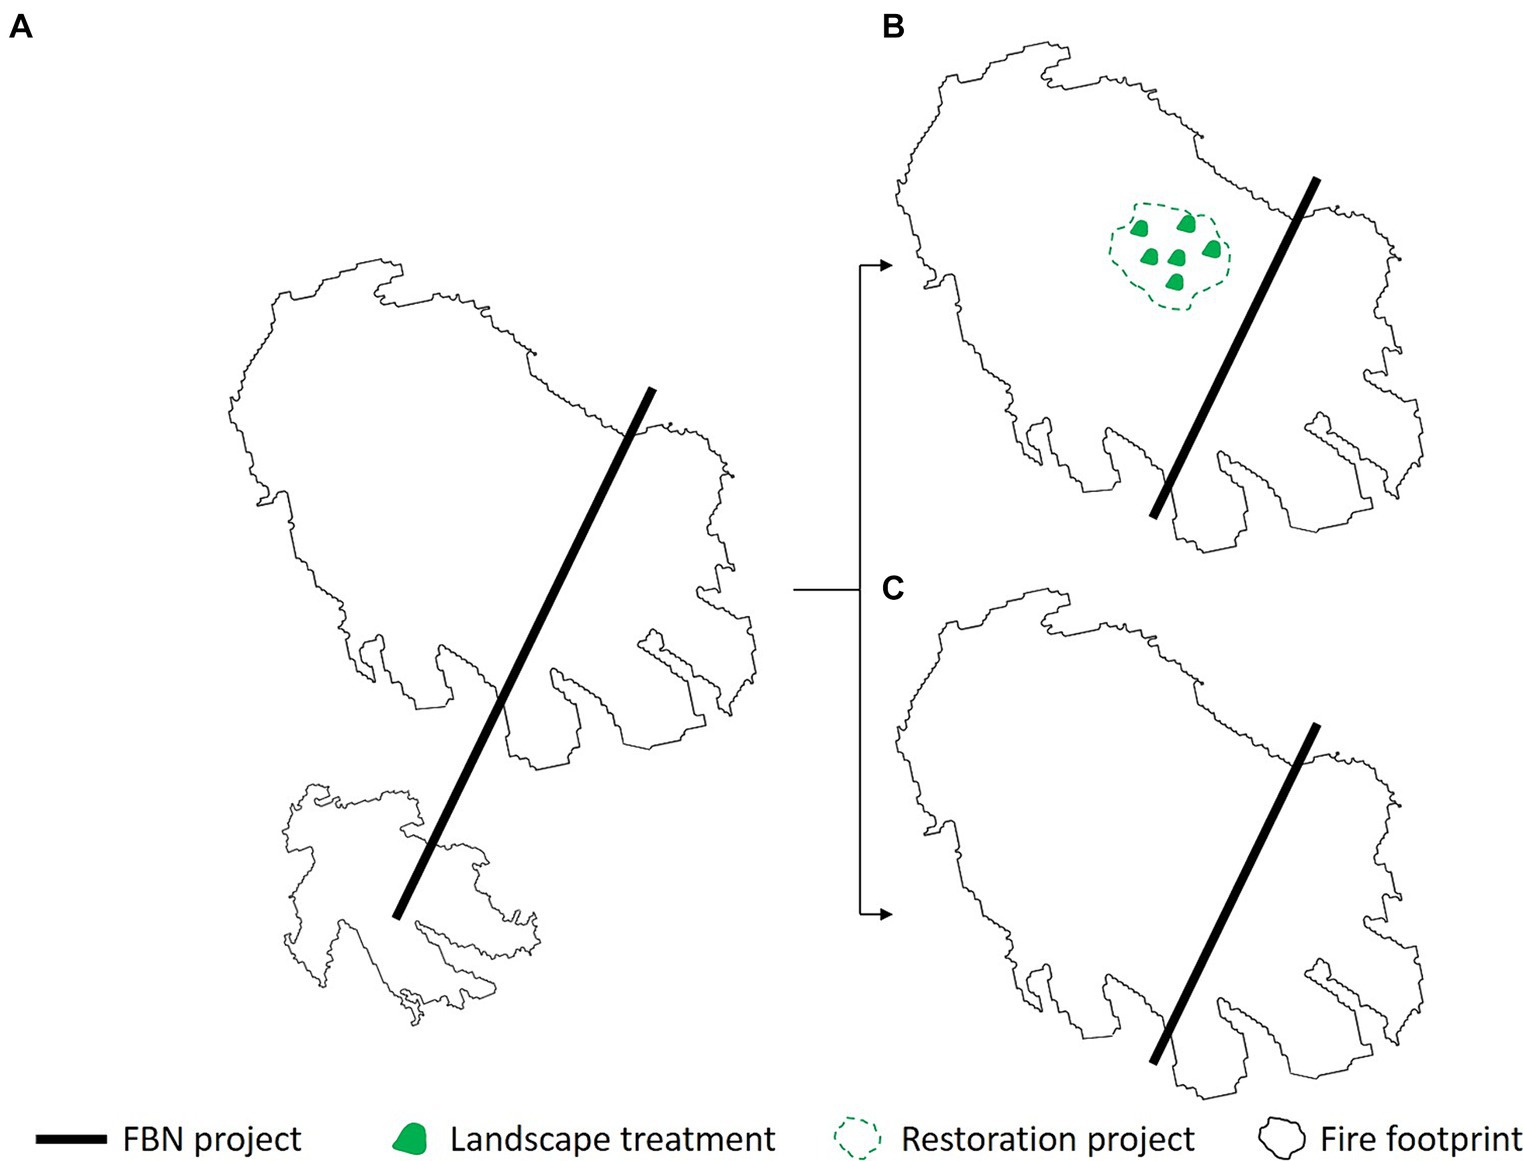
Figure 2. Illustration of the method used to calculate the number of fully intersected fires by the fuel break network (FBN). For a fire to be considered for the analysis, its footprint had to be completely intersected by a portion of the FBN (top fire perimeter in panel A); partial intersections were not considered in the analysis (fire perimeter in the bottom of panel A). All fires fully intersected by the FBN were then further investigated to quantify the percentage that intersects landscape restoration projects prior to reaching the FBN (panel B vs. panel C).
To model the co-implementation of FBN and landscape restoration projects, we simulated scenarios where either FBN projects were prioritized first and a restoration project was then implemented in the surrounding landscape, or restoration projects were implemented first and FBN network segments were implemented within the perimeter of the restoration project (Figure 3). Note that the FBN projects were prioritized based on creating the longest linear length (Ager et al., 2023), and the restoration treatments based on net revenue or resiliency resulting in four scenarios (Table 1): (i) FBN-first with restoration objective as net revenue; (ii) FBN-first with restoration objective as resiliency; (iii) restoration-first with objective as net revenue; and (iv) restoration-first with objective as resiliency. Specifically, when restoration was the primary benefit (either based on resiliency or net revenue) all FBN segments that fell inside the project were implemented (Figure 3A) and when fire control was the primary benefit, high value stands based on either resiliency or net revenue within a distance of 5 km from the FBN were included (Figure 3B), in accordance with the recommendations from local managers based on the accessibility from the FBN. This assumption was made for operational and logistical reasons, as restoration projects need to go through National Environmental Policy Act (NEPA) planning and need a defined boundary according to planning regulations. Treatments cannot be located outside the boundary established in the planning process. By contrast, the FBN is covered under a federal categorical exclusion and can easily be implemented anywhere through an entirely different planning process. It is possible to use both and achieve FBN projects extending from the boundary, but they are implemented as different prioritization and planning processes. The assumption made it easier to frame restoration projects as a separate strategy than fuel breaks. The recursive steps required to implement both strategies were automated using the newly developed ForSysXR R package (Aparício et al., 2024), that integrates the desktop ForSysX application in R (available upon request; Supplementary material I).
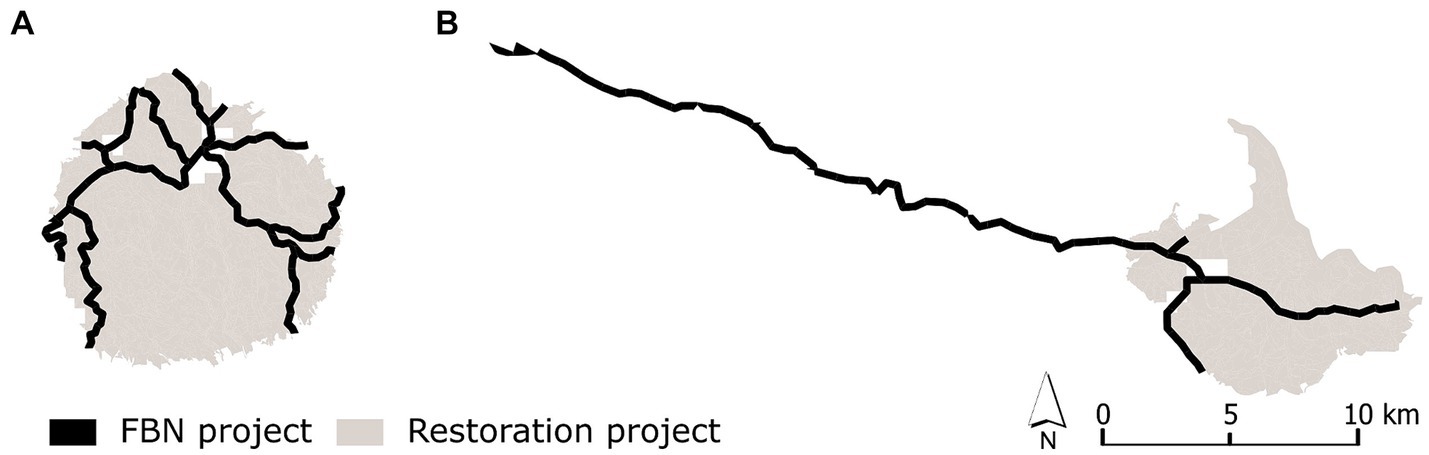
Figure 3. Illustration of co-implementation strategies between the restoration-first (A) and fuel break network (FBN)-first (B) strategies.
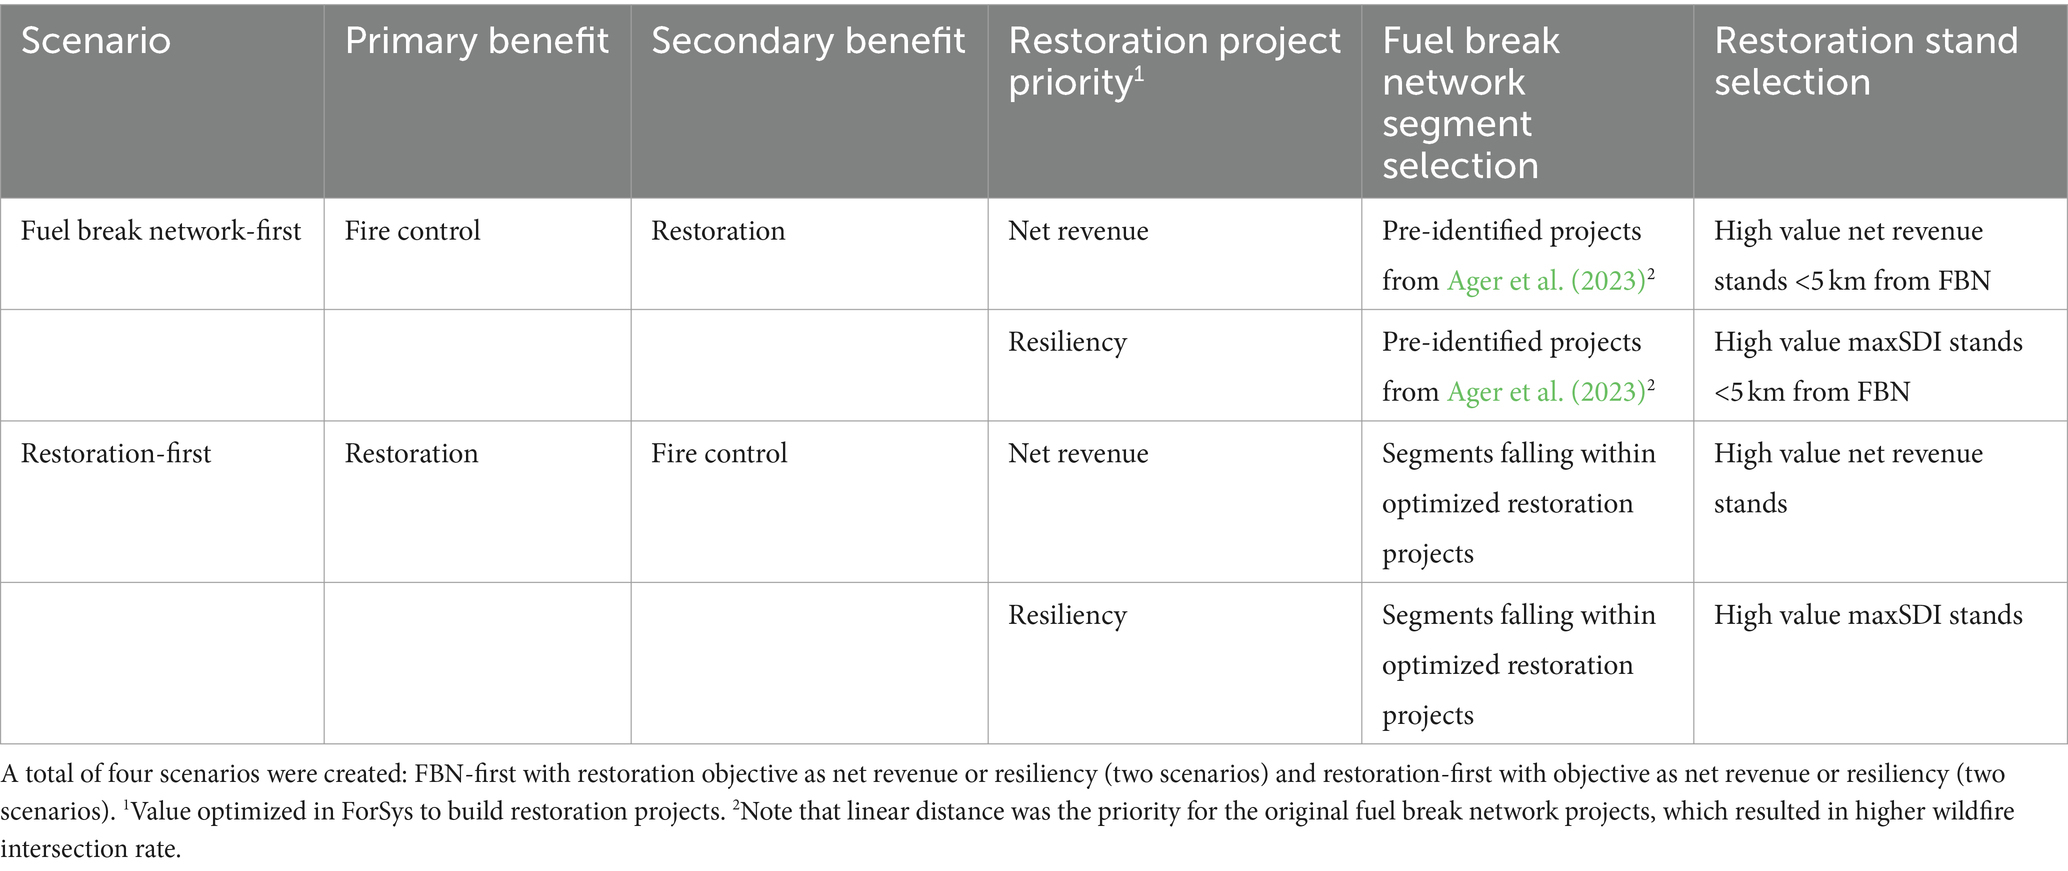
Table 1. Restoration and fire control co-implementation scenarios modeled in ForSysXR.
Landscape restoration projects were optimized using ForSys and considering the restoration objective and a maximum diameter constraint for all projects was set to 11,300 m to create realistic projects in terms of implementation under NEPA. Stands were excluded from wilderness. Following input from local fire managers, landscape restoration projects were set to be 4,000 ha in treated area, and projects failing to reach 1,000 ha in treated area were discarded from the analysis.
For each scenario, we simulated the implementation of 32 restoration projects. Data from all valid projects, meaning those that met the respective treatment constraints (between 1,000 and 4,000 ha treated), were joined for each scenario, but the total combined restoration and fuel break network area treated varied among scenarios. Projects were sorted based on the primary and secondary benefit metrics (i.e., restoration and fire control) and plotted on defined quadrants (Figure 4) to understand which projects best met the restoration vs. FBN objective, or both. Fire control metrics include FBN density (length of FBN implemented divided by the area of the restoration project), number of fires intersected by the FBN and fire length intersection. Since the area of the restoration projects can vary from 1,000 to 4,000 ha, all the metrics were normalized by the area of the restoration project. These values were then normalized by calculating their quantile for each metric. This approach allowed comparison of the different metrics.
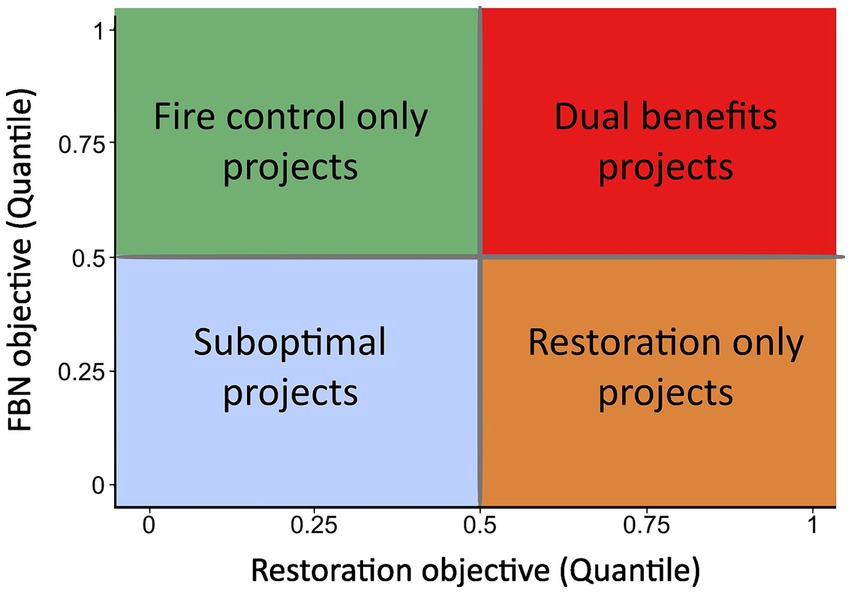
Figure 4. Illustration of the ranking of projects by their quantile. Metrics for restoration included net revenue and resiliency, and for fuel break network (FBN) included FBN density, number of unique fires intersected and total fire length intersection. Quadrant “Fire control only projects” represents high priority projects for FBN objectives; quadrant “Restoration only projects” represents high priority projects for restoration objectives; quadrant “Dual benefits projects” represents high priority projects for both FBN and restoration objectives; and the quadrant “Suboptimal projects” represents projects that are not a priority for any of the objectives.
The quantiles calculated for each project were used to identify areas on the landscape with high dual benefits. For each project created under the different implementation scenarios, the quantiles for the FBN objectives were summed (i.e., FBN density, number of fires intersected, and fire length intersection), and rescaled to range between 0 and 1. Likewise, quantiles for the restoration projects were summed (i.e., net revenue or resiliency). The rescaling of objectives ensures that both restoration and FBN objectives are equally accounted for in the identification of areas with highest dual benefit. Following the approach explained in Figure 4, the projects were attributed to one of the quadrants given their relevance for the objectives, and mapped on the Umatilla National Forest.
We found that co-implementing 32 FBN projects, each treating between 800 and 1,200 ha, and 32 restoration projects of 1,000–4,000 ha in treated area optimized for the respective objectives was not always possible due to lack of treatment area within the defined project containers. Specifically, considering the objectives of net revenue and resiliency respectively, five and eight projects were discarded for the FBN-first, and one and six projects were discarded for the restoration-first scenarios (Supplementary Figure S4) due to a lack of potential treatment area. This is a consequence of the sometimes small area available for treatment adjacent to the FBN project, either because prior restoration projects were already implemented or because the FBN was implemented in areas of poor quality for restoration (low revenue or maximum SDI below 55%). The final number of projects used in the subsequent analysis was 51 for the FBN-first scenario, and 57 for restoration-first scenario.
The projects with highest dual benefits were identified for five different metrics: net revenue, resiliency, FBN density, number of unique fires intersected by the FBN project, and total fire length intersection by the FBN project. Figure 5 shows the distribution of the projects in quantiles, considering the different metrics listed above. As expected, in both implementation scenarios and for all metrics, the projects are distributed along the four quadrants, with restoration-first projects dominating the Restoration only projects quadrant, and FBN-first projects dominating the Fire control only quadrant (see Figure 4 for illustration). Nevertheless, for all metrics, both implementation scenarios were able to generate dual benefit projects (i.e., above quantile 0.5 when compared to both revenue and resiliency).
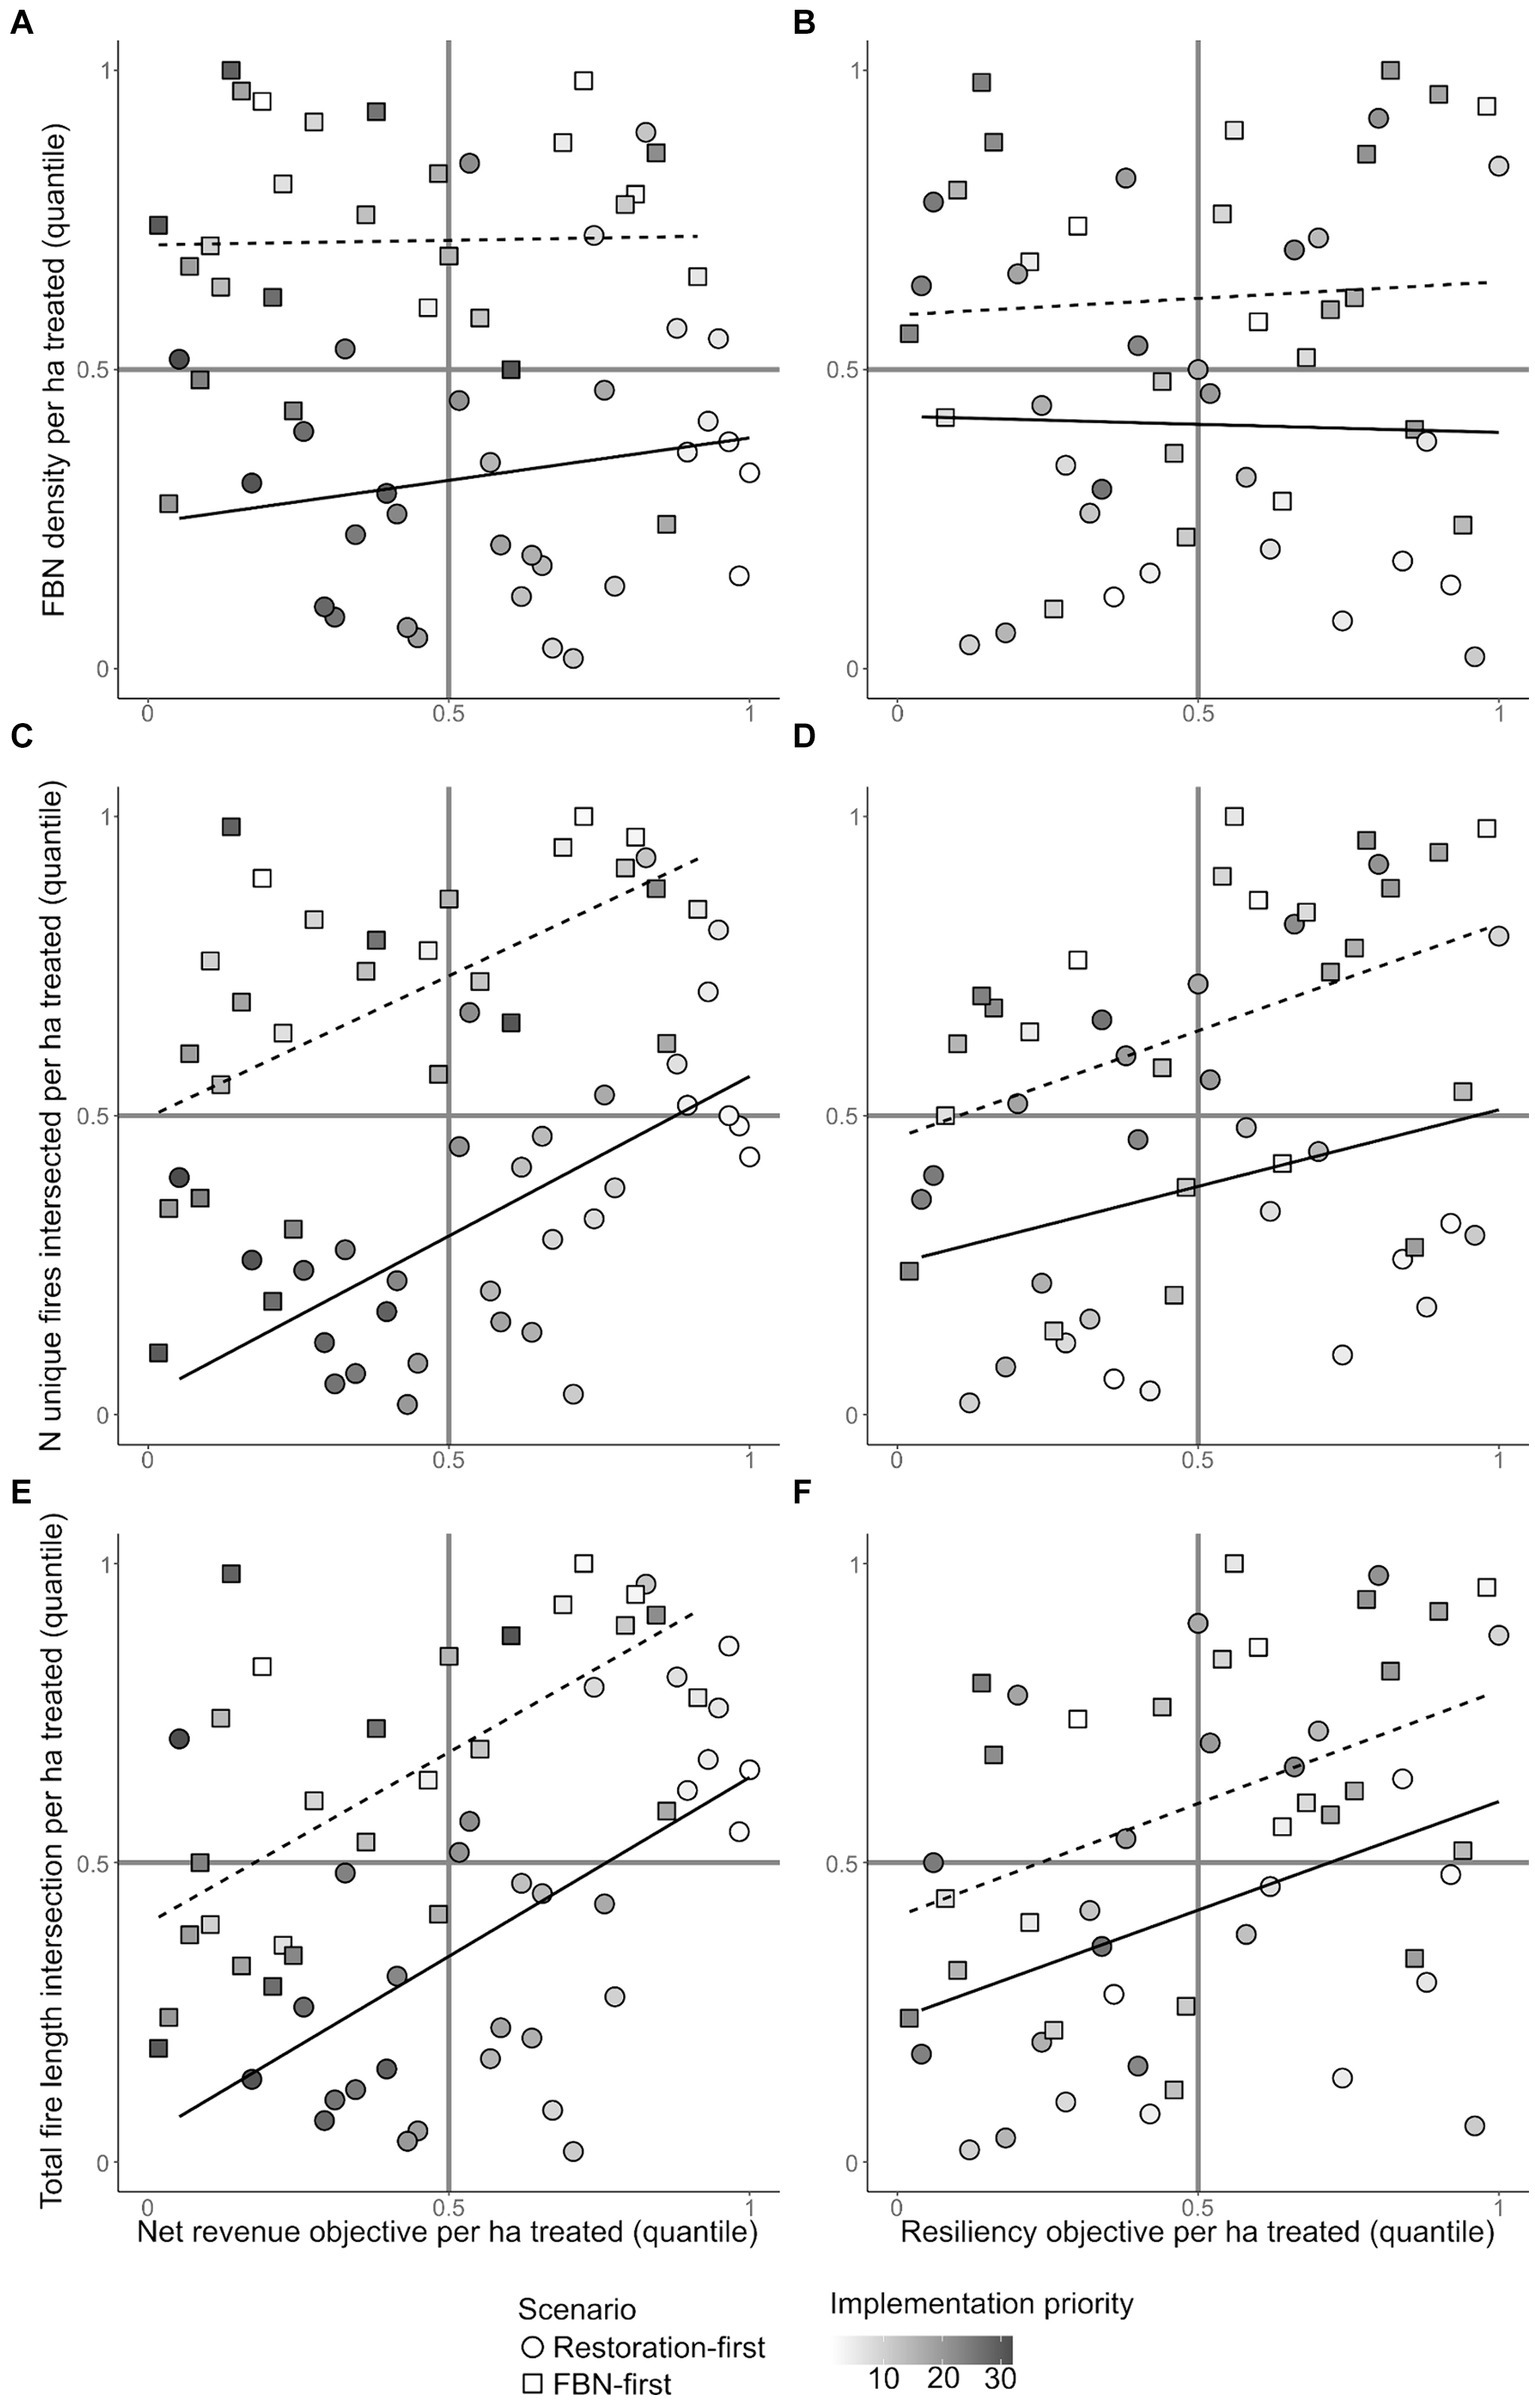
Figure 5. Plots of project mean values for response metrics for the restoration-first (circles) versus fuel break network (FBN)-first (squares) scenarios. Symbols are filled according to their implementation priority, where project 1 is the highest priority and the least shading. Panel rows show FBN response metrics, while panel columns show restoration objectives corrected per hectare treated. The four quadrants illustrate how well projects performed according to the different scenario objectives, restoration versus FBN, or both (see Figure 4). The dashed line represents the linear regression for the FBN-first projects and the solid line represents the linear regression for the restoration-first projects.
It is also important to note that for the resiliency objective, the majority of the dual benefit projects are created under the FBN-first scenario. On the other hand, for the net revenue objective, there is a more balanced distribution of projects originated under the two scenarios in the dual benefit quadrant. Another relevant difference between the projects created under the two restoration objectives is that, for the resiliency objective, the projects’ implementation priority does not seem to predict the dual benefits of the projects, with high priority and low priority projects appearing spread out in the quadrants (Figure 5). Regarding the net revenue objective, the projects with higher implementation priority (i.e., lower number) tend to be located in the dual benefit quadrant. These results point to the fact that net revenue and fire control objectives may have a higher spatial overlap than fire control and resiliency objectives.
As expected, the amount of the objective treated varies with the scenario objective, with restoration scenarios treating more areas with high SDI or net revenue (Figure 6). The FBN-first scenario led to more FBN implemented and a higher number of fires intersected and number of unique fires fully intersected.
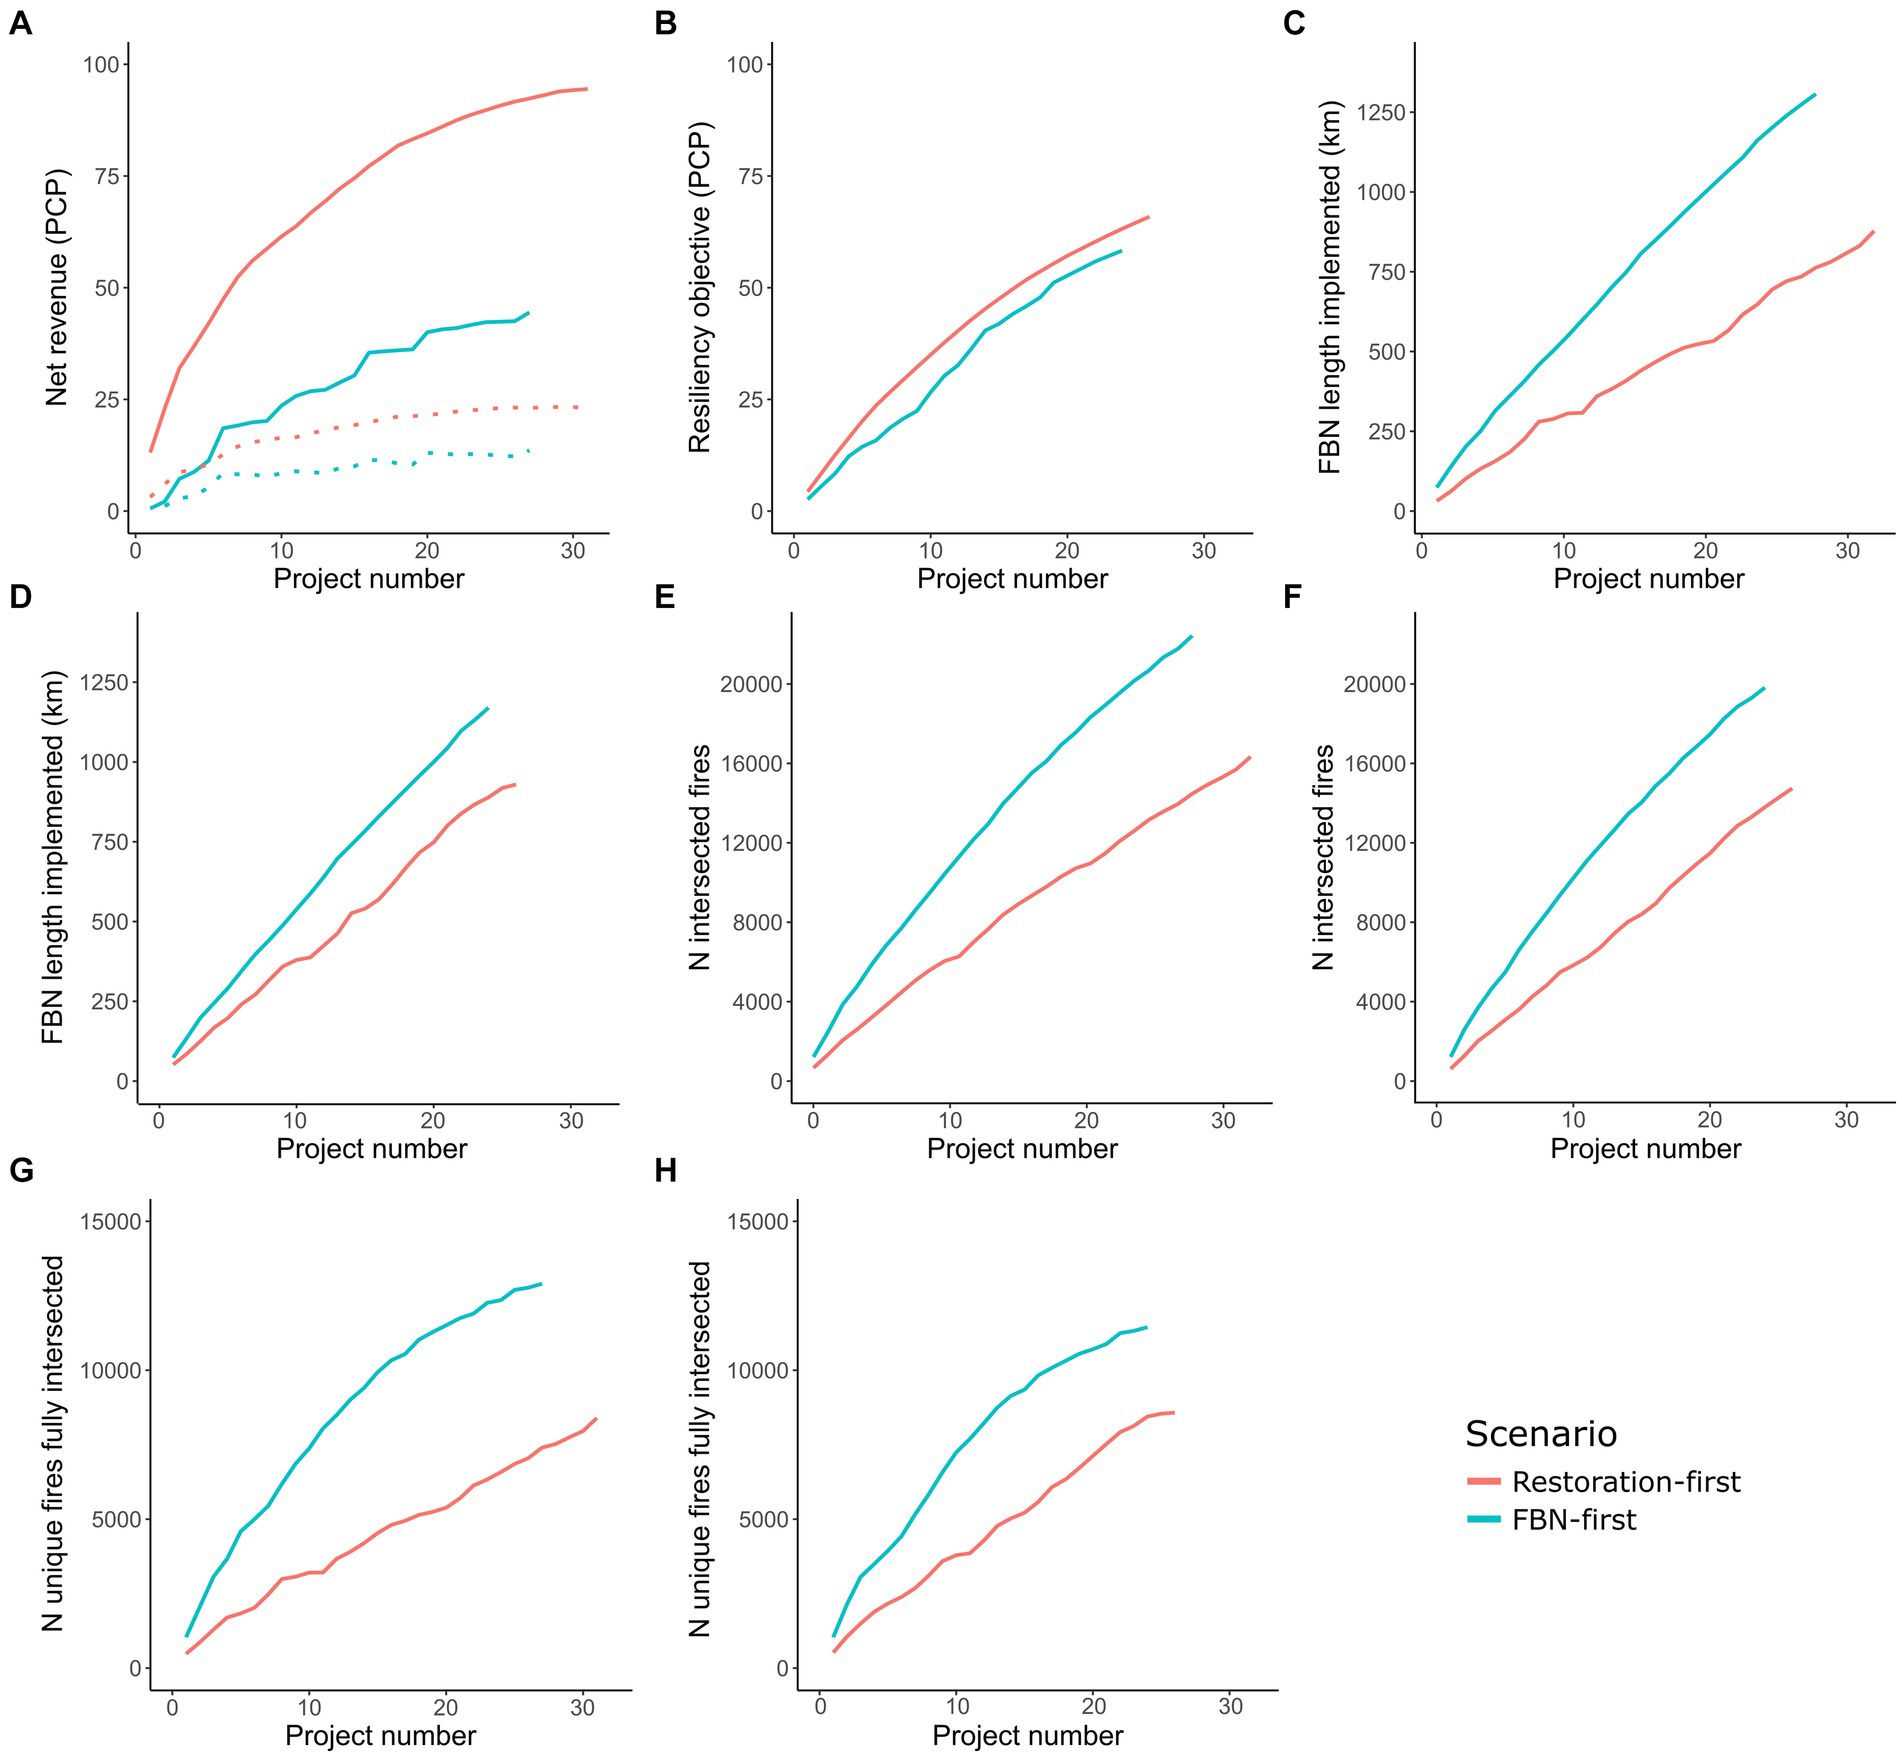
Figure 6. Cumulative outcome per project under the restoration-first and the fuel break network (FBN) first implementation scenarios. Panels (A,C,E,G) were obtained with net revenue as the objective. Panels (B,D,F,H) were obtained with resiliency as the objective. Note the different number of projects implemented between restoration objectives (58 for net revenue and 50 for resiliency, across FBN-first and restoration-first scenarios). Dashed lines in panel A represent the net revenue exclusively from the implementation of the FBN (subset of the total represented by the solid lines).
Figure 7 shows the number of fires that fully intersected the FBN implemented under the two scenarios and the number of these fires that intersected at least one landscape restoration treatment prior to reaching the FBN. The hypothesis is that fires intersecting restoration treatments potentially represent low intensity fires and increase fire control success. As expected, the highest number of fires fully intersected is obtained when the FBN is implemented first (Figure 7A), also reflecting the scenario with the largest amount of FBN implemented (Figure 6). The FBN-first scenario with resiliency as the objective potentially mitigates fewer fires than when the objective is net revenue because there is a lower number of valid restoration projects (i.e., with treated area ≥ 1,000 ha). From all the fires with full intersection (fuel break network intersects fire across entire perimeter) for the FBN-first scenario, only ca. 52–58% (when the objective is resiliency or net revenue, respectively) intersect any restoration treatments prior to the FBN. On the contrary, although implementing restoration projects first will lead to fully intersecting considerably fewer fires (ca. 36% less when compared with FBN first with net revenue as objective), ca. 92–95% of these fires (when the objective is resiliency or net revenue, respectively) intersect a landscape treatment before reaching the FBN, arguably increasing the chances of success in suppression efforts (Figure 7A). These results were expected given that for the restoration first scenarios, the FBN is only implemented within restoration treatment boundaries, forcing the restoration treatments to be adjacent to the FBN, while in the FBN-first scenario, the restoration treatments could be up to 5 km from a fuel break.
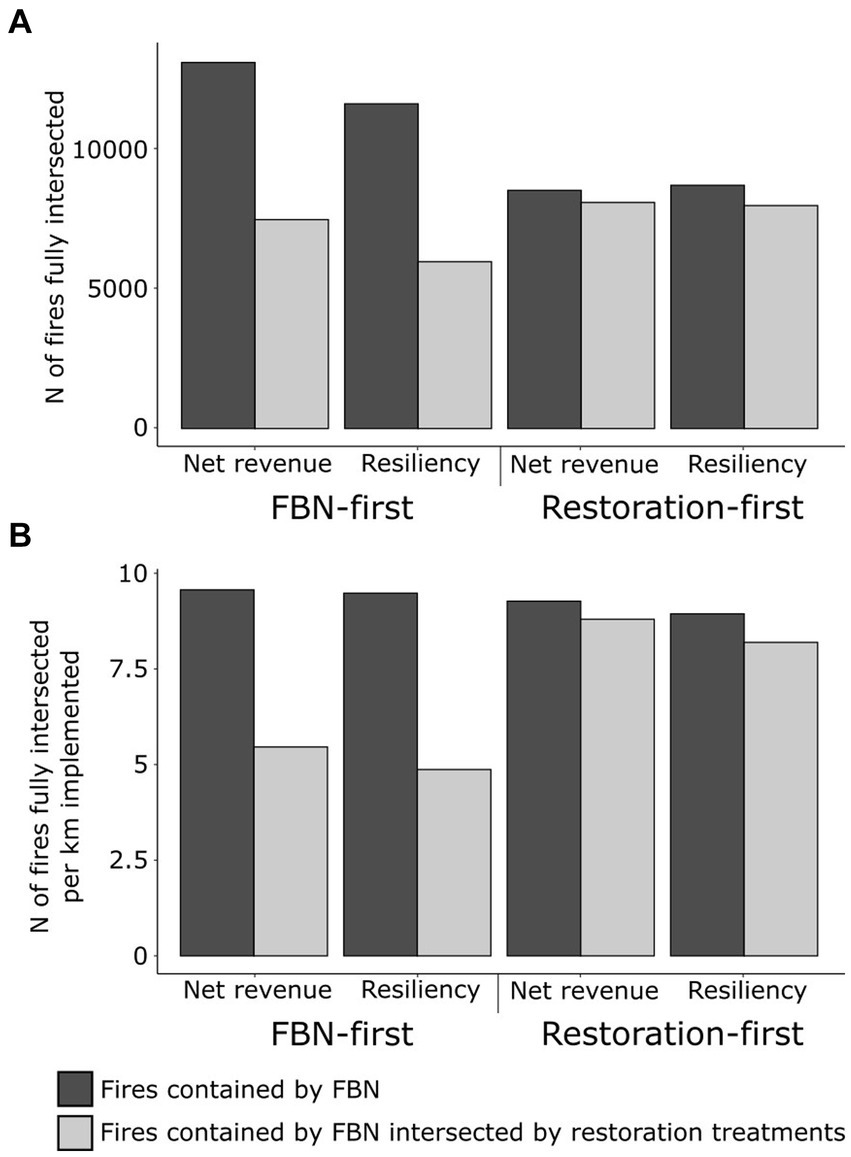
Figure 7. Number of unique fires fully intersected (A) by the fuel break network (FBN) and (B) the number of fires fully intersected per kilometer of FBN implemented under the FBN-first (left columns) and restoration-first (right columns) scenarios.
Figure 7B shows the number of fires fully intersected per km of the FBN implemented, correcting for the different length of the FBN implemented in each scenario. As the figure shows, there is not a considerable difference between the fires fully intersected per km of FBN under different implementation scenarios. However, and as described above, the number of fires fully intersected per km of the FBN that intersect a landscape restoration treatment is considerably higher in the restoration-first scenario than in FBN-first scenario.
Figure 8 shows the areas with highest dual benefits under FBN-first and restoration-first scenarios, considering all the metrics used, i.e., net revenue and resiliency were combined for the restoration objective, and FBN density, number of fires intersected per ha treated in the restoration project and fire length intersection per ha treated in the restoration project were combined for the FBN objective. Broadly, for the FBN-first scenario, the FBN projects where it is possible to obtain the highest dual benefit (considering that a restoration project can be located within a 5 km buffer from the FBN project) are located in the northern parcel of the national forest for both restoration objectives. Other dual benefit FBN projects created in this scenario are spread across the national forest, particularly in the southwest when the restoration objective is resiliency.
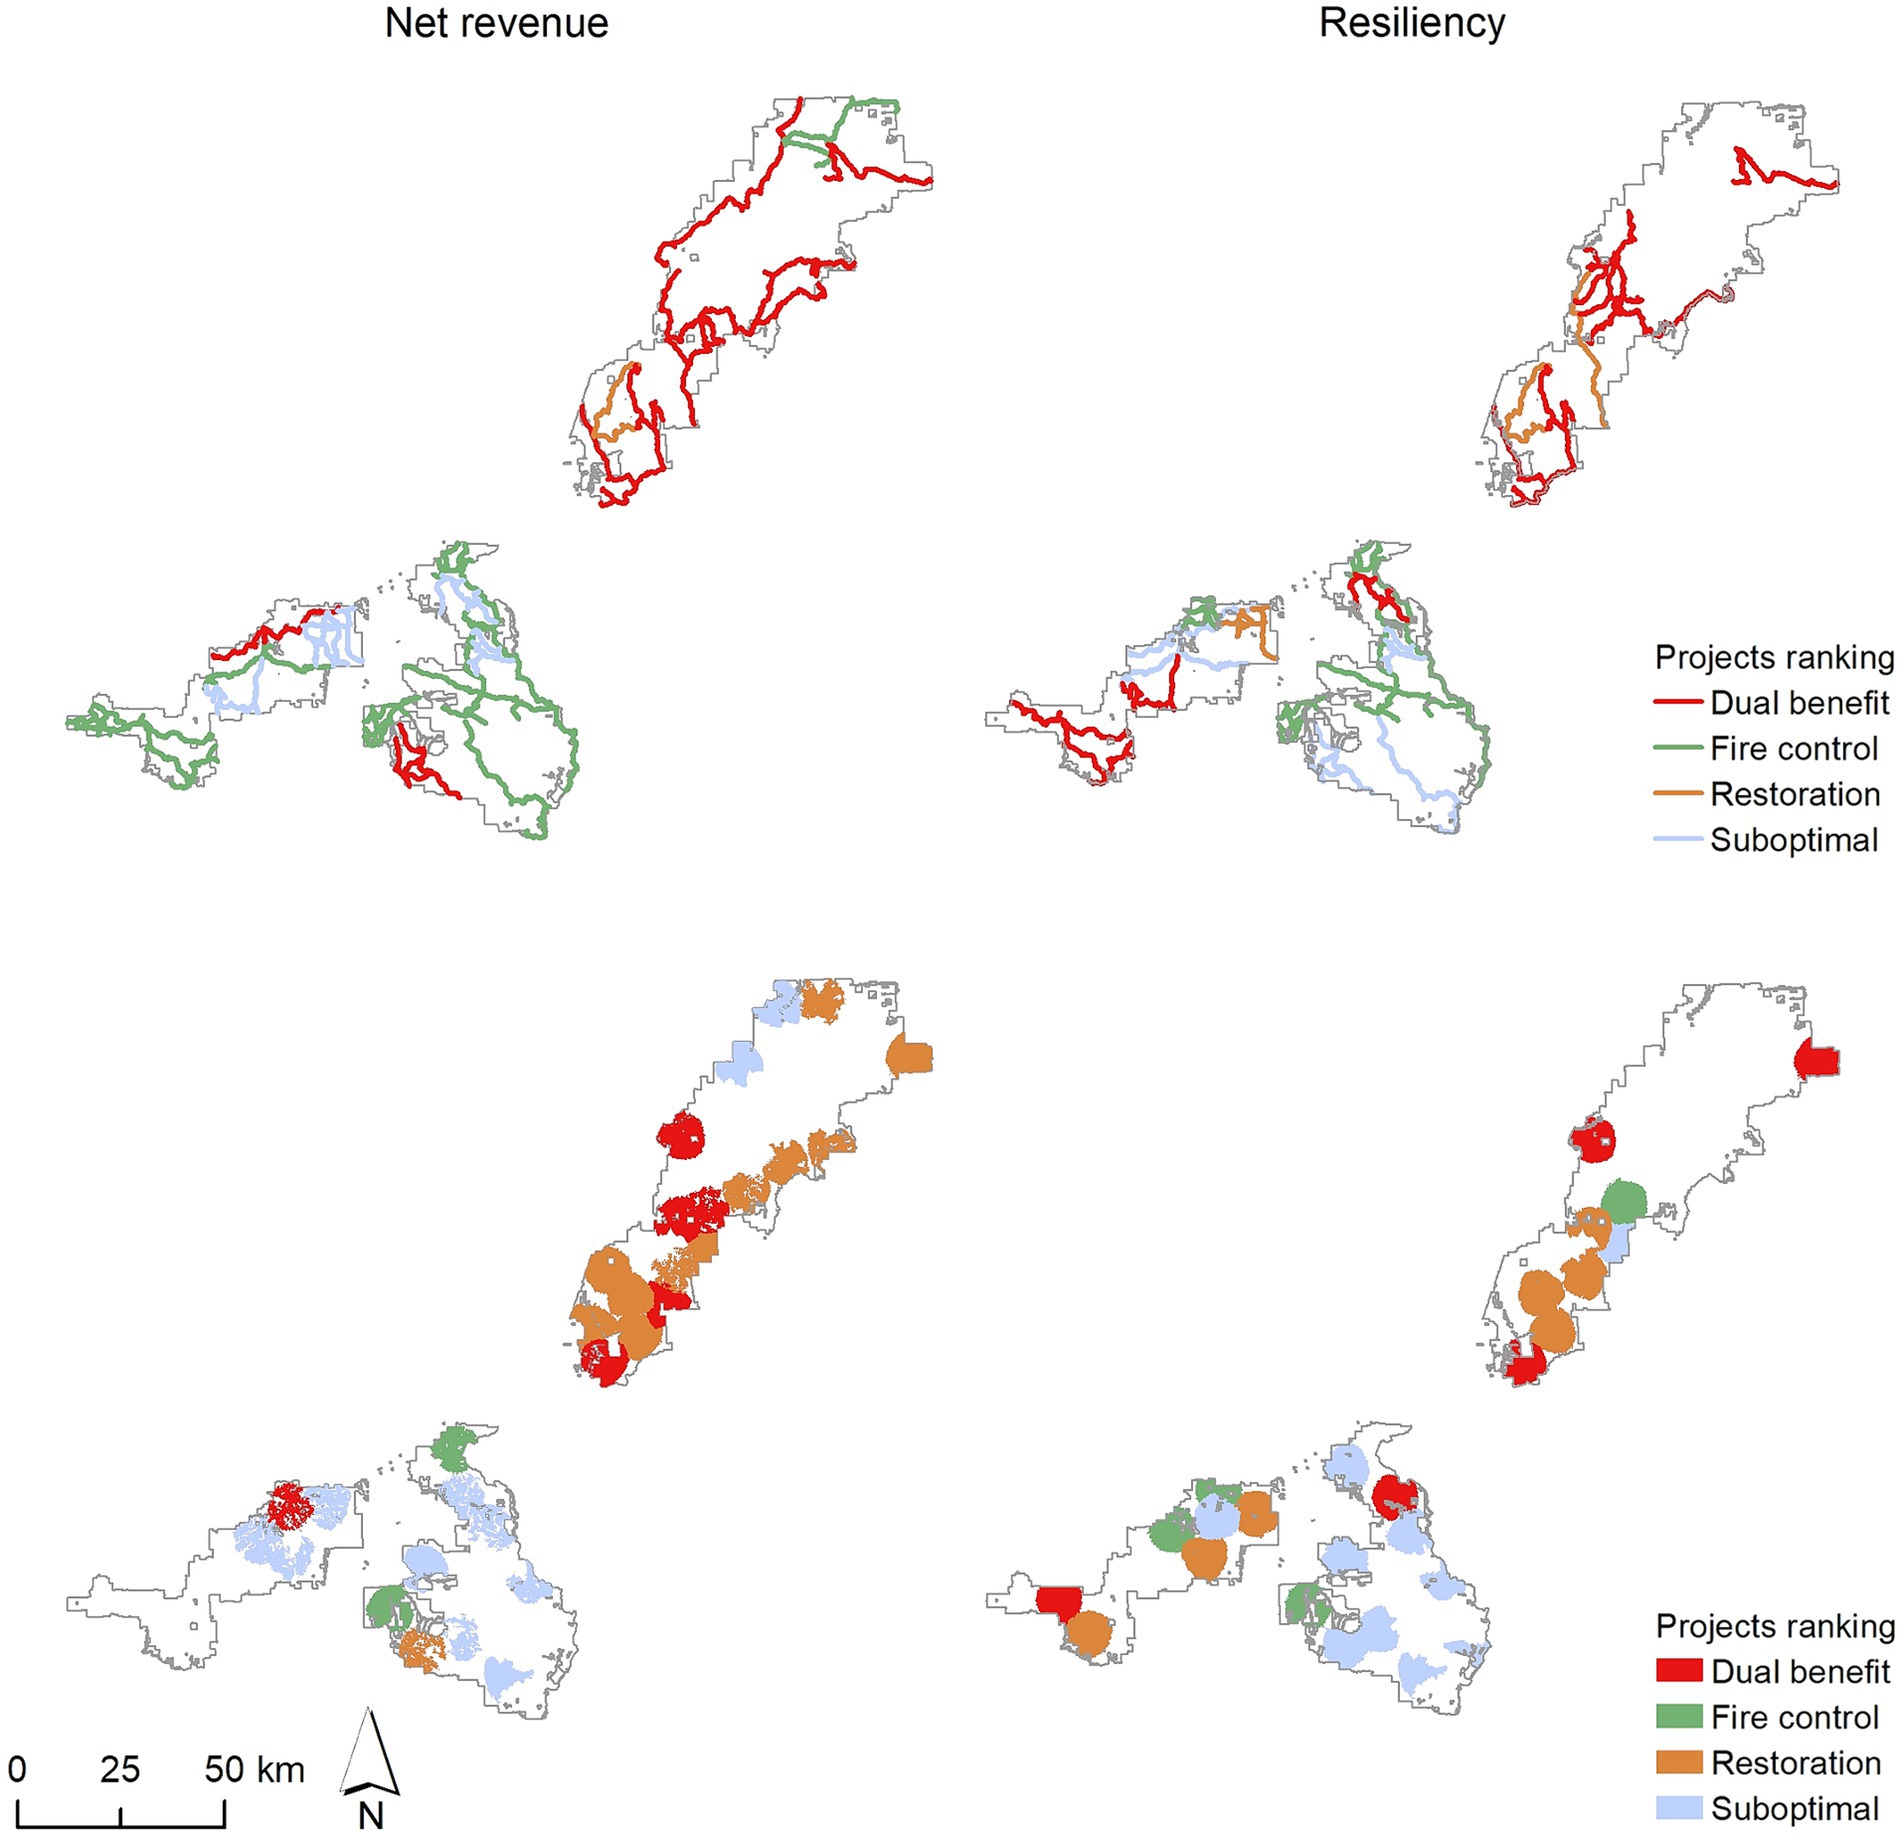
Figure 8. Identification of fuel break network (FBN) projects and restoration projects with highest dual benefit for the FBN-first (top) vs. restoration-first (bottom) scenarios. Columns represent the restoration objective in the scenarios. Secondary benefit projects are not shown. In each panel, response metric quantile results were summed and rescaled from 0 to 1. For example, FBN density, number of fires intersected, and fire length intersected were all combined in the top scenarios. The scenarios represented are the same shown in Table 1.
When considering dual benefit projects in the restoration-first scenario for both objectives, the areas with the highest expected dual benefits are also located in the northern portion of the national forest, particularly in the center-south. It is important to note that for the resiliency objective, the dual benefit projects are spread across and within parcels. In this implementation scenario, projects highly important for fire control only are mostly absent from the map.
The location of the highest dual benefit projects for both implementation scenarios is coincide, namely in the center-south portion of the northern parcel of the national forest. This suggests that when considering dual benefits, this specific region should be considered first. Finally, it is worth noting that the FBN-first scenario is able to create almost two times more dual benefit projects than restoration-first (a total of 20 projects for FBN-first vs. 11 for restoration-first, considering both restoration objectives).
Fuel reduction treatment plans are increasingly receiving more investment across the globe, as part of government efforts to dampen escalation of wildfire impacts on people, assets and ecosystems (Pandey et al., 2023). These plans usually focus simultaneously on two strategies: creation or expansion of fuel break networks and landscape restoration treatments. Although the two are often the core of fuel reduction plans, there is little guidance on how they can be co-prioritized and their synergies enhanced. To our knowledge, this is the first study that quantifies and identifies areas with high-expected dual benefits. Given the difference in objectives between FBN and landscape restoration treatments (Ager et al., 2016; Zong et al., 2021), the metrics used to characterize and prioritize the two strategies are also different, with the FBN projects generally being evaluated regarding FBN density, number of fires intersected and length of fire intersection (Ager et al., 2023), and landscape restoration projects being evaluated regarding their relevance for net revenue and forest resiliency (Belavenutti et al., 2021).
Fuel break networks can play a role in reducing burned area and communities’ exposure to wildfires (Oliveira et al., 2016; Aparício et al., 2022a,b). However, it is widely recognized that fuel breaks are unlikely to halt fire progression without suppression resources (Syphard et al., 2011a,b), as they frequently fail to function as intended during wildfire events (Gannon et al., 2023). Even when fire brigades conduct suppression activities at the FBN the fire may not stop, as success of fire suppression in the FBN is known to decline with increases in fire behavior, namely in rate of spread, intensity, initiation of spotting and transition to crown fire (Agee et al., 2000; Wollstein et al., 2022; Gannon et al., 2023; Ortega et al., 2024). Hence, placing landscape restoration treatments in the vicinity of the FBN may help increase suppression effectiveness at the FBN. On the other hand, implementing landscape restoration treatments may require the scale-up of fuel treatments (Davim et al., 2021), and long-term changes in rural economies (Lecina-Diaz et al., 2023), which may require decades to be in place. Such constraints may be overcome by exploring the dual benefits between the two (Barros et al., 2023). Our results showed, as expected, that implementing a FBN project first followed by a restoration project in its vicinity will increase the rate at which FBN objectives may be reached (i.e., higher number of fires intersected, higher length of fire intersection). On the other hand, implementing a landscape restoration project first and then the FBN inside the project perimeter will facilitate achieving restoration objectives (net revenue or resiliency). Notwithstanding, our analysis also revealed that it is possible to find projects with high dual benefit created under both implementation scenarios (i.e., above quantile 0.5 for the FBN and restoration metrics). These are the projects that should be priorities for early implementation. It is worth noting that for the FBN-first scenario almost two times more dual benefit projects are identified when compared to the restoration-first scenario, with greatest differences occurring when the restoration objective is resiliency.
Our results also show, not surprisingly, that implementing an FBN project first followed by a restoration project will result in fully intersecting more fires. In this scenario, just over half of the fully intersected fires meet any landscape restoration treatment prior to the FBN thus potentially changing fire behavior. In contrast, implementing restoration projects first followed by FBN projects will fully intersect fewer fires. Notwithstanding, almost all fires that are fully intersected under this scenario, (>90%) will intersect a landscape restoration treatment before reaching the FBN. This will arguably increase the chances of suppression success at the FBN (Agee et al., 2000).
Finally, we were able to identify and map restoration areas and FBN projects with highest expected dual benefits, i.e., areas where FBN projects or restoration projects are simultaneously relevant for their corresponding objectives. The extent of lands with higher dual benefits was found to be dependent on the restoration objective considered, with larger extent of area and FBN segments showing high dual benefits expected when net revenue is the restoration objective. We also identified the northern portion of the Umatilla National Forest as the location where higher dual benefits may be expected, regardless of the restoration objective and the implementation scenario. Future studies can expand the dual benefits of both strategies by re-simulating fire spread after the implementation of landscape restoration projects. This would quantify the expected increase in suppression opportunities (considering fire intensity when intersecting the FBN), and consequently, the expected decrease in burned area (Aparício et al., 2022a). Moreover, fire management needs to recognize climate change impacts on both fire regimes (Galizia et al., 2023; Wasserman and Mueller, 2023) and fire behavior (Parks et al., 2016; Wotton et al., 2017; Aparício et al., 2022b), and will most likely require enhancement of synergies created by the combination of both strategies as landscape treatments expand on the landscape. Hence, studies that demonstrate the dual benefits of both strategies across fire regimes are of the most importance.
The methodology presented here can easily be applied to other fire prone regions on the globe where landscape restoration and FBNs are being implemented in concert (Shinneman et al., 2023; Crist et al., n.d.) and optimizing dual benefits is of interest. Advances in the ForSys model platform (e.g., ForSysXR—Aparício et al., 2024) expanded its functionality to process landscapes recursively while accounting for potential wildfire impacts over the course of a planned implementation period. Application of the model has been extensive in the Mediterranean region and these new capabilities can be leveraged to improve prioritization and planning of ongoing fuel reduction programs (Martin et al., 2016; Salis et al., 2016; Palaiologou et al., 2021). Recent enhancements to ForSys also include linkages to fire spread models (Finney, 2006; Ager et al., 2011), and automated processes to analyze changes in fire behavior and risk from optimized treatment programs. Research is underway to leverage these new features in both forested and rangeland systems in the western United States.
Current strategies for reducing fuels in fire frequent regions consider both linear fuel break networks (FBN) and dispersed treatments across large landscapes to reduce the size, intensity, and potential damage from future wildfire events. The co-implementation of these strategies is a complex problem for managers, and precisely how to blend them to optimize synergistic effects will remain an important research topic for the next decade or longer as fuel treatment programs continue to expand. This study sheds light on the crucial need to identify priority areas for the co-implementation of FBN and landscape restoration, an essential aspect of effective wildfire management under limited budgets and in the face of evolving climate change. We were able to identify areas with the highest dual benefits by assessing restoration and fire control metrics across strategies, and locate areas where both objectives were maximized. The methodology presented is adaptable to any other fire prone region, and can be further refined by, for instance, re-simulating fire spread after the implementation of landscape restoration and FBN projects. This latter enhancement would provide information for cost benefit and other economic analyses to refine and optimize co-implementation strategies within United States national forests and in other countries faced with similar wildland fire and fuel management problems.
The raw data supporting the conclusions of this article will be made available by the authors, without undue reservation.
BA: Conceptualization, Formal analysis, Investigation, Methodology, Software, Visualization, Writing – original draft, Writing – review & editing. AA: Conceptualization, Methodology, Supervision, Validation, Writing – review & editing. MD: Conceptualization, Methodology, Supervision, Validation, Writing – review & editing.
The author(s) declare that financial support was received for the research, authorship, and/or publication of this article. Funding was provided by the USDA Forest Service, Rocky Mountain Research Station and National Fire Decision Support Center.
We thank Umatilla National Forest staff including Andrew Stinchfield for his technical assistance with designing the methodology. We thank Chris Ringo and Rachel Houtman for their work on the Umatilla stand layer. We would also like to thank the five reviewers that helped improve the quality of the manuscript.
The authors declare that the research was conducted in the absence of any commercial or financial relationships that could be construed as a potential conflict of interest.
All claims expressed in this article are solely those of the authors and do not necessarily represent those of their affiliated organizations, or those of the publisher, the editors and the reviewers. Any product that may be evaluated in this article, or claim that may be made by its manufacturer, is not guaranteed or endorsed by the publisher.
The Supplementary material for this article can be found online at: https://www.frontiersin.org/articles/10.3389/ffgc.2024.1419288/full#supplementary-material
Agee, J. K., Bahro, B., Finney, M. A., Omi, P. N., Sapsis, D. B., Skinner, C. N., et al. (2000). The use of shaded fuelbreaks in landscape fire management. For. Ecol. Manag. 127, 55–66. doi: 10.1016/S0378-1127(99)00116-4
Ager, A. A., Day, M. A., Aparício, B. A., Houtman, R., and Stinchfield, A. (2023). Optimizing the implementation of a forest fuel break network. PLoS One 18:e0295392. doi: 10.1371/journal.pone.0295392
Ager, A. A., Day, M. A., and Vogler, K. (2016). Production possibility frontiers and socioecological tradeoffs for restoration of fire adapted forests. J. Environ. Manag. 176, 157–168. doi: 10.1016/j.jenvman.2016.01.033
Ager, A. A., Evers, C. R., Day, M. A., Alcasena, F. J., and Houtman, R. (2021). Planning for future fire: scenario analysis of an accelerated fuel reduction plan for the western United States. Landsc. Urban Plan. 215:104212. doi: 10.1016/j.landurbplan.2021.104212
Ager, A. A., McMahan, A. J., Barrett, J. J., and McHugh, C. W. (2007). A simulation study of thinning and fuel treatments on a wildland–urban interface in eastern Oregon, USA. Landsc. Urban Plan. 80, 292–300. doi: 10.1016/j.landurbplan.2006.10.009
Ager, A. A., Vaillant, N. M., and Finney, M. A. (2011). Integrating fire behavior models and geospatial analysis for wildland fire risk assessment and fuel management planning. J. Comb. 2011:572452. doi: 10.1155/2011/572452
Ager, A. A., Vogler, K. C., Day, M. A., and Bailey, J. D. (2017). Economic opportunities and trade-offs in collaborative Forest landscape restoration. Ecol. Econ. 136, 226–239. doi: 10.1016/j.ecolecon.2017.01.001
AGIF (2020). National Plan for Integrated Wildfire Management 2020–2030. Lisbon, Portugal: Agência para a Gestão Integrada de Fogos Rurais, I.P.
Aparício, B. A., Alcasena, F., Ager, A., Chung, W., Pereira, J. M. C., and Sá, A. C. L. (2022a). Evaluating priority locations and potential benefits for building a nation-wide fuel break network in Portugal. J. Environ. Manag. 320:115920. doi: 10.1016/j.jenvman.2022.115920
Aparício, B.A., Bunzel, K., Day, M., and Ager, A. (2024). ForSysXR: A R package to execute C++ (ForSysX) version of the ForSys scenario planning model. R package version 0.9.
Aparício, B. A., Santos, J. A., Freitas, T. R., Sá, A. C. L., Pereira, J. M. C., and Fernandes, P. M. (2022b). Unravelling the effect of climate change on fire danger and fire behaviour in the transboundary biosphere Reserve of Meseta Ibérica (Portugal-Spain). Clim. Chang. 173:5. doi: 10.1007/s10584-022-03399-8
Ascoli, D., Russo, L., Giannino, F., Siettos, C., and Moreira, F. (2018). “Firebreak and Fuelbreak” in Encyclopedia of Wildfires and Wildland-Urban Interface (WUI) Fires. ed. S. L. Manzello (Cham: Springer International Publishing), 1–9.
Barros, A.M.G., Day, M.A., Ager, A.A., Hersey, C., and Spaeth, A.., Watkins, J. (2023). Alignment between state and federal forest health strategies in eastern Washington. Olympia, WA.
Belavenutti, P., Ager, A. A., Day, M. A., and Chung, W. (2022). Designing forest restoration projects to optimize the application of broadcast burning. Ecol. Econ. 201:107558. doi: 10.1016/j.ecolecon.2022.107558
Belavenutti, P., Chung, W., and Ager, A. A. (2021). The economic reality of the forest and fuel management deficit on a fire prone western US national forest. J. Environ. Manag. 293:112825. doi: 10.1016/j.jenvman.2021.112825
Benali, A., Sá, A. C. L., Pinho, J., Fernandes, P. M., and Pereira, J. M. C. (2021). Understanding the impact of different landscape-level fuel management strategies on wildfire Hazard in Central Portugal. Forests 12:522. doi: 10.3390/f12050522
Cochran, P.H., Geist, J.M., Clemens, D.L., Clausnitzer, R.R., and Powell, D.C. (1993). Suggested stocking levels for forest stands in northeastern Oregon and southeastern Washington. U.S. Department of Agriculture, Forest Service, Pacific Northwest Research Station.
Crist, M.R., Short, K.C., Cross, T.B., Doherty, K.E., and Olszewski, J.H. (n.d.). Will it burn? Characterizing wildfire risk for the sagebrush conservation design. Rangeland Ecology & Management.
Davim, D. A., Rossa, C. G., and Fernandes, P. M. (2021). Survival of prescribed burning treatments to wildfire in Portugal. For. Ecol. Manag. 493:119250. doi: 10.1016/j.foreco.2021.119250
Day, M.A., Ager, A.A., Houtman, R.M., and Evers, C.R. (2023). Prioritizing restoration and risk reduction landscape projects with the ForSys planning system. Gen. Tech. Rep. RMRS-GTR-XXX. Fort Collins, CO.
Finney, M.A. (2006). “An overview of FlamMap fire modeling capabilities” in Fuels Management-How to Measure Success: Conference Proceedings. (Comps.) Andrews, P.L., Butler, B.W. Portland, OR; March 28–30, 2006. Proceedings RMRS-P-41. US Department of Agriculture, Forest Service, Rocky Mountain, Fort Collins, CO.
Finney, M. A., McHugh, C. W., Grenfell, I. C., Riley, K. L., and Short, K. C. (2011). A simulation of probabilistic wildfire risk components for the continental United States. Stoch. Env. Res. Risk A. 25, 973–1000. doi: 10.1007/s00477-011-0462-z
Galizia, L. F., Barbero, R., Rodrigues, M., Ruffault, J., Pimont, F., and Curt, T. (2023). Global warming reshapes European Pyroregions. Earth Future 11:e2022EF003182. doi: 10.1029/2022EF003182
Gannon, B., Wei, Y., Belval, E., Young, J., Thompson, M., O’Connor, C., et al. (2023). A quantitative analysis of fuel break effectiveness drivers in southern California national forests. Firehouse 6:104. doi: 10.3390/fire6030104
Geist, J.M., and Cochran, P.H. (1991). “Influences of volcanic ash and pumice deposition on productivity of western interior forest soils” in Proceedings of Management and Productivity of Western-Montane Forest Soils. (Compilers) Harvey, AE, Neuenschwander, LF. USDA For. Serv. Gen. Tech. Rep. INT-280, Ogden, UT 82–88.
Gray, M. E., and Dickson, B. G. (2016). Applying fire connectivity and centrality measures to mitigate the cheatgrass-fire cycle in the arid west, USA. Landsc. Ecol. 31, 1681–1696. doi: 10.1007/s10980-016-0353-2
Green, L. (1977). Fuelbreaks and Other Fuel Modification for Wildland Fire Control. Washington, DC: US Department of Agriculture, Forest Service, Agricultural Handbook.
Helmbrecht, D. (2019). Blue Mountains forest resiliency project: quantitative wildfire risk assessment. Prepared for the Ochoco, Umatilla, and Wallowa-Whitman National Forests.
Hessburg, P. F., Spies, T. A., Perry, D. A., Skinner, C. N., Taylor, A. H., Brown, P. M., et al. (2016). Tamm review: management of mixed-severity fire regime forests in Oregon, Washington, and northern California. For. Ecol. Manag. 366, 221–250. doi: 10.1016/j.foreco.2016.01.034
Heyerdahl, E. K., Brubaker, L. B., and Agee, J. K. (2001). Spatial controls of historical fire regimes: a multiscale example from the interior west, USA. Ecology 82, 660–678. doi: 10.1890/0012-9658(2001)082[0660:SCOHFR]2.0.CO;2
Keyser, C., and Dixon, G. (2015). Blue Mountains (BM) Variant Overview–Forest Vegetation Simulator. Fort Collins, CO.
Lecina-Diaz, J., Chas-Amil, M.-L., Aquilué, N., Sil, Â., Brotons, L., Regos, A., et al. (2023). Incorporating fire-smartness into agricultural policies reduces suppression costs and ecosystem services damages from wildfires. J. Environ. Manag. 337:117707. doi: 10.1016/j.jenvman.2023.117707
Martin, F. (2013). User guide to the economic extension (ECON) of the forest vegetation simulator. US Department of Agriculture, Forest Service, Forest Management Service Center: Fort Collins, CO, USA 43.
Martin, A., Botequim, B., Oliveira, T. M., Ager, A., and Pirotti, F. (2016). Temporal optimisation of fuel treatment design in blue gum (Eucalyptus globulus) plantations. For Syst 25:eRC09. doi: 10.5424/fs/2016252-09293
Moreira, F., Ascoli, D., Safford, H., Adams, M. A., Moreno, J. M., Pereira, J. M. C., et al. (2020). Wildfire management in Mediterranean-type regions: paradigm change needed. Environ. Res. Lett. 15:11001. doi: 10.1088/1748-9326/ab541e
North, M. P., Tompkins, R. E., Bernal, A. A., Collins, B. M., Stephens, S. L., and York, R. A. (2022). Operational resilience in western US frequent-fire forests. For. Ecol. Manag. 507:120004. doi: 10.1016/j.foreco.2021.120004
O’Connor, C. D., Thompson, M. P., and Rodríguez y Silva, F. (2016). Getting ahead of the wildfire problem: quantifying and mapping management challenges and opportunities. Geosciences 6:35. doi: 10.3390/geosciences6030035
Oliveira, T. M., Barros, A. M., Ager, A. A., and Fernandes, P. M. (2016). Assessing the effect of a fuel break network to reduce burnt area and wildfire risk transmission. Int. J. Wildland Fire 25, 619–632. doi: 10.1071/WF15146
Ortega, M., Silva, F. R., and Molina, J. R. (2024). Modeling fuel break effectiveness in southern Spain wildfires. Fire Ecol. 20:40. doi: 10.1186/s42408-024-00270-2
Ott, J. E., Kilkenny, F. F., and Jain, T. B. (2023). Fuel treatment effectiveness at the landscape scale: a systematic review of simulation studies comparing treatment scenarios in North America. Fire Ecol. 19:10. doi: 10.1186/s42408-022-00163-2
Palaiologou, P., Kalabokidis, K., Ager, A. A., Galatsidas, S., Papalampros, L., and Day, M. A. (2021). Spatial optimization and tradeoffs of alternative Forest management scenarios in Macedonia. Forests 12:697. doi: 10.3390/f12060697
Pandey, P., Huidobro, G., Lopes, L. F., Ganteaume, A., Ascoli, D., Colaco, C., et al. (2023). A global outlook on increasing wildfire risk: current policy situation and future pathways. Trees For People 14:100431. doi: 10.1016/j.tfp.2023.100431
Parks, S. A., Miller, C., Abatzoglou, J. T., Holsinger, L. M., Parisien, M.-A., and Dobrowski, S. Z. (2016). How will climate change affect wildland fire severity in the western US? Environ. Res. Lett. 11:035002. doi: 10.1088/1748-9326/11/3/035002
Pausas, J. G., and Fernández-Muñoz, S. (2012). Fire regime changes in the Western Mediterranean Basin: from fuel-limited to drought-driven fire regime. Clim. Chang. 110, 215–226. doi: 10.1007/s10584-011-0060-6
Powell, D. (2010). Range of variation recommendations for dry, moist, and cold forests. White paper F14-SO-WP-Silv-3. USDA Forest Service, Pacific northwest Research Station. Pendleton, OR. Available at: http://orsolutions.org/wp-content/uploads/2012/02/WP3-RV-white-paper.pdf
Salis, M., Laconi, M., Ager, A. A., Alcasena, F. J., Arca, B., Lozano, O., et al. (2016). Evaluating alternative fuel treatment strategies to reduce wildfire losses in a Mediterranean area. For. Ecol. Manag. 368, 207–221. doi: 10.1016/j.foreco.2016.03.009
Shinneman, D. J., Strand, E. K., Pellant, M., Abatzoglou, J. T., Brunson, M. W., Glenn, N. F., et al. (2023). Future direction of fuels management in Sagebrush Rangelands. Rangel. Ecol. Manag. 86, 50–63. doi: 10.1016/j.rama.2022.10.009
Short, K.C. (2022). Spatial wildfire occurrence data for the United States, 1992–2020 [FPA_FOD_20221014]. Forest Service Research Data Archive, Fort Collins, CO.
Stephens, S. L., Battaglia, M. A., Churchill, D. J., Collins, B. M., Coppoletta, M., Hoffman, C. M., et al. (2021). Forest restoration and fuels reduction: convergent or divergent? Bioscience 71, 85–101. doi: 10.1093/biosci/biaa134
Stephens, S. L., Foster, D. E., Battles, J. J., Bernal, A. A., Collins, B. M., Hedges, R., et al. (2024). Forest restoration and fuels reduction work: different pathways for achieving success in the Sierra Nevada. Ecol. Appl. 34:e2932. doi: 10.1002/eap.2932
Syphard, A. D., Keeley, J. E., and Brennan, T. J. (2011a). Comparing the role of fuel breaks across southern California national forests. For. Ecol. Manag. 261, 2038–2048. doi: 10.1016/j.foreco.2011.02.030
Syphard, A. D., Keeley, J. E., and Brennan, T. J. (2011b). Factors affecting fuel break effectiveness in the control of large fires on the Los padres National Forest, California. Int. J. Wildland Fire 20, 764–775. doi: 10.1071/WF10065
Thompson, M. P., O’Connor, C. D., Gannon, B. M., Caggiano, M. D., Dunn, C. J., Schultz, C. A., et al. (2022). Potential operational delineations: new horizons for proactive, risk-informed strategic land and fire management. Fire Ecol. 18:17. doi: 10.1186/s42408-022-00139-2
U.S. House of Representatives (2022). H.R.3684—infrastructure investment and jobs act. Washington, D.C.
USDA Forest Service (1994). Bailey’s ecoregions of the conterminous United States. United States Geological Survey. Available at: https://www.sciencebase.gov/catalog/item/54244abde4b037b608f9e23d
USDA Forest Service (2022). Confronting the wildfire crisis: A 10-year implementation plan. FS-1187b. Washington, D.C. Available at: https://www.fs.usda.gov/sites/default/files/fs_media/fs_document/WCS-Implementation-Plan.pdf
USDA Forest Service (2024). Stand density index (SDI). Available at: https://www.fs.usda.gov/Internet/FSE_DOCUMENTS/stelprdb5270993.pdf
Wasserman, T. N., and Mueller, S. E. (2023). Climate influences on future fire severity: a synthesis of climate-fire interactions and impacts on fire regimes, high-severity fire, and forests in the western United States. Fire Ecol. 19:43. doi: 10.1186/s42408-023-00200-8
Williams, A. P., Abatzoglou, J. T., Gershunov, A., Guzman-Morales, J., Bishop, D. A., Balch, J. K., et al. (2019). Observed impacts of anthropogenic climate change on wildfire in California. Earths Future 7, 892–910. doi: 10.1029/2019EF001210
Wollstein, K., O’Connor, C., Gear, J., and Hoagland, R. (2022). Minimize the bad days: wildland fire response and suppression success. Rangelands 44, 187–193. doi: 10.1016/j.rala.2021.12.006
Wotton, B. M., Flannigan, M. D., and Marshall, G. A. (2017). Potential climate change impacts on fire intensity and key wildfire suppression thresholds in Canada. Environ. Res. Lett. 12:95003. doi: 10.1088/1748-9326/aa7e6e
Xanthopoulos, G., Caballero, D., Galante, M., Alexandrian, D., Rigolot, E., and Marzano, R. (2006). “Forest Fuels Management in Europe” in Fuels management-how to measure success. eds. Andrews, P.L., Butler, B.W. U.S. Department of Agriculture, Forest Service, Rocky Mountain Research Station, Portland, OR, Fort Collins, CO. pp. 29–46.
Keywords: ForSys, fuel break networks, spatial optimization, fuel reduction treatments, forest landscape restoration, restoration planning
Citation: Aparício BA, Ager AA and Day MA (2024) Maximizing opportunities for co-implementing fuel break networks and restoration projects. Front. For. Glob. Change. 7:1419288. doi: 10.3389/ffgc.2024.1419288
Edited by:
Fermín Alcasena, Public University of Navarre, SpainReviewed by:
Morgan D. Roche, United States Geological Survey, United StatesCopyright © 2024 Aparício, Ager and Day. This is an open-access article distributed under the terms of the Creative Commons Attribution License (CC BY). The use, distribution or reproduction in other forums is permitted, provided the original author(s) and the copyright owner(s) are credited and that the original publication in this journal is cited, in accordance with accepted academic practice. No use, distribution or reproduction is permitted which does not comply with these terms.
*Correspondence: Bruno A. Aparício, QnJ1bm8uYS5hcGFyaWNpb0BnbWFpbC5jb20=
Disclaimer: All claims expressed in this article are solely those of the authors and do not necessarily represent those of their affiliated organizations, or those of the publisher, the editors and the reviewers. Any product that may be evaluated in this article or claim that may be made by its manufacturer is not guaranteed or endorsed by the publisher.
Research integrity at Frontiers
Learn more about the work of our research integrity team to safeguard the quality of each article we publish.