 Yelong Zeng
 Li Jia1,2*
 Chaolei Zheng
94% of researchers rate our articles as excellent or good
Learn more about the work of our research integrity team to safeguard the quality of each article we publish.
Find out more
ORIGINAL RESEARCH article
Front. For. Glob. Change, 23 May 2024
Sec. Forest Management
Volume 7 - 2024 | https://doi.org/10.3389/ffgc.2024.1416373
This article is part of the Research TopicChanging Driving Mechanisms of Climate Change and Human Management on Forest and Other Vegetation EcosystemsView all 8 articles
Introduction: The vegetation dynamics of the Sahel-Sudan-Guinea region in Africa, one of the largest transition zones between arid and humid zones, is of great significance for understanding regional ecosystem changes. However, a time-unvarying trend based on linear assumption challenges the overall understanding of vegetation greenness evolution and of tracking a complex ecosystem response to climate in the Sahel-Sudan-Guinea region.
Methods: This study first applied the ensemble empirical mode decomposition (EEMD) method to detect the time-varying trends in vegetation greenness based on normalized difference vegetation index (NDVI) data in the region during 2001–2020, and then identified the dominant climatic drivers of NDVI trends by employing explainable machine learning framework.
Results: The study revealed an overall vegetation greening but a significant nonlinear spatio-temporal evolution characteristic over the region. Trend reversals, i.e., browning-to-greening and greening-to-browning, were dominant in approximately 60% of the study area. The browning-to-greening reversal was primarily observed in the southern Sahel, Congo Basin north of the Equator, and East Africa, with a breakpoint around 2008, while the greening-to-browning reversal was mainly observed in West Africa, with a breakpoint around 2011. The sustained greening primarily took place in northern Sahel, Central African Republic and South Sudan; while sustained browning clustered in central West Africa and Uganda, mainly in agricultural lands. Furthermore, the combination of Random Forest (RF) algorithm and the SHapley Additive exPlanations (SHAP) method could robustly model and reveal the relationships between the observed trends in NDVI and in climatic variables, also detected by applying EEMD. The results suggested that air temperature and precipitation were the most important climatic drivers controlling the NDVI trends across the Sahel-Sudan-Guinea region. The NDVI trends were more likely to have negative correlations with solar radiation and vapor pressure deficit in arid areas, while they could have positive correlations in humid areas. The study also found that large-scale climate changes induced by sea surface temperature (SST) anomalies had strong relationships with trend reversals in vegetation greenness at a sub-continental scale. These findings advanced the understanding of the impacts of climatic drivers on vegetation greenness evolution in the Sahel-Sudan-Guinea region.
The vegetation dynamics of the Sahel-Sudan-Guinea region in Africa, one of the largest transition zones between arid and humid zones, is vulnerable to the interference of climatic anomalies and human activities (Milas, 1984; Leroux et al., 2017; Fu et al., 2021; Zhou et al., 2021a). Spreading desertification/land degradation has risen to the top of ecological concerns since the Sahel belt (annual precipitation ranging from 100 to 900 mm) experienced severe drought in the 1970s and 1980s (Wang'ati, 1996; Fensholt et al., 2017; Kusserow, 2017). However, increasing trends in the vegetation greenness and productivity of the region, a process known as greening, have been indicated by in-situ observations and satellite observations, e.g., Normalized Difference Vegetation Index (NDVI), along with increasing precipitation since the mid-1980s (Herrmann et al., 2005; Fensholt and Rasmussen, 2011; Dardel et al., 2014; Kaptué et al., 2015; Fensholt et al., 2017). In contrast to the findings on global greening (Zhu et al., 2016; Piao et al., 2020), studies have also documented a decrease in vegetation greenness, known as browning, in certain areas of the Sahel-Sudan-Guinea region, known as browning, such as the lateritic plateaus of southern Niger (Leroux et al., 2017). Although there have been numerous studies on vegetation greenness dynamics in the region using Earth Observation (EO) data in the first two decades of the 21st century (Leroux et al., 2017; D'Adamo et al., 2021; Ogutu et al., 2021; Jiang et al., 2022; Zeng et al., 2023), a comprehensive understanding of the process of vegetation greening or browning is still lacking.
The first consideration is the nonlinearity and evolution of vegetation greenness trend analysis. Most vegetation dynamic studies at regional and global scales express trend as a straight line, such as the ordinary least squares linear regression method and the Theil-Sen trend approach, which only estimate a constant greening or browning rate throughout the study period (Dardel et al., 2014; Leroux et al., 2017; Piao et al., 2020; Jiang et al., 2022). Such linear trend analyses are conducted under the assumption of stationarity, and potential long-period oscillations may be confounded with the vegetation trends (Yin et al., 2017). In fact, vegetation growth time series reflect nonlinear and non-stationary underlying processes due to their susceptibility to perturbations from factors such as climate anomalies and human activities, resulting in a combination of seasonal, gradual, and abrupt changes (Verbesselt et al., 2010; de Jong et al., 2012). Even annual statistics, such as annual means, extracted from vegetation index time series may contain periodic signals of several years to decades due to inter-annual and inter-decadal periodic oscillations, such as El Niño and the Southern Oscillation (Hawinkel et al., 2015; Pan et al., 2018). These emphasize the importance of accounting for variability in trend. In addition, the limitation of trend analysis methods based on linear assumption may be one of the reasons for the discrepancy in vegetation greenness trends for a given region (de Jong and de Bruin, 2012; Rasmussen et al., 2016). In the context of increasing global environmental change, the linear trends fail to capture the hidden features of non-stationarity and to reveal the evolution of vegetation, e.g., trend reversals and acceleration or deceleration of the change rate.
Second, the climatic drivers of vegetation greenness trends in the Sahel-Sudan-Guinea region need to be carefully examined. Although a number of studies have evaluated the connection between climate and vegetation at various spatial and temporal scales in this region (Fensholt and Rasmussen, 2011; Hoscilo et al., 2015; Kaptué et al., 2015; Zhou et al., 2021a; Jiang et al., 2022), our understanding of the underlying mechanisms is incomplete. Precipitation is considered a key climatic factor affecting vegetation dynamics in this region, but recent studies have shown that its role is weakening (Leroux et al., 2017; Zeng et al., 2023). Even in water-limited drylands, precipitation only explains vegetation greenness trends in less than half of the region (Zeng et al., 2023). In addition to precipitation, other climatic factors, such as air temperature, solar radiation, and atmospheric VPD, which are related to plant biophysical processes, also play a significant role in influencing the spatial heterogeneity of vegetation dynamics (Piao et al., 2020; Tagesson et al., 2021). For example, several studies have clearly documented the negative effects of water stress caused by warming and increasing atmospheric vapor pressure deficit (VPD) on vegetation greenness and productivity (Epule et al., 2014; Abdi et al., 2017; Yuan et al., 2019; Zhang et al., 2022). Furthermore, the response of vegetation greenness to such multiple climatic factors may be nonlinear, which introduces complexities when explaining the relationship between observed vegetation dynamics and specific driving factors. However, most studies assume linearity when analyzing climate trends and attribution (Herrmann et al., 2005; Hoscilo et al., 2015; Zeng et al., 2023). This makes it difficult to accurately capture the relationship between trends in vegetation greenness and climate.
In summary, consideration of the time-varying trends and nonlinear relationship between vegetation greenness trends and multiple climatic factors is the key for clarifying a complex ecosystem response to climate in the Sahel-Sudan-Guinea region. The Ensemble Empirical Mode Decomposition (EEMD) method is an adaptive time series analysis approach that does not assume a predetermined functional form of the components and decomposes the time series into a finite set of oscillatory components with decreasing frequencies and a residual trend component (Huang et al., 1998; Wu et al., 2007; Wu and Huang, 2009; Ji et al., 2014). The EEMD method can powerfully reveal more biophysical information conveyed by nonlinear and non-stationary time series, especially the response of the vegetation evolution to climate change (Hawinkel et al., 2015; Pan et al., 2018; Feng et al., 2021; Yang et al., 2021). Additionally, machine learning algorithms are widely used for attribution analyses, because they can produce reliable prediction results and extract non-linear relationships between feature variables and target variable (Devine et al., 2017; Leroux et al., 2017; Berdugo et al., 2022). The black-box nature of machine learning, however, hinders the transparency and physical interpretability of the estimated relationships. To overcome this problem, an explainable machine learning framework has been proposed to understand the biophysical processes underlying the black-box relationships detected by machine learning (Lundberg and Lee, 2017), which has tremendous application prospects for understanding complex relationships between bio-geophysical observables (Li et al., 2022; Ham et al., 2023).
This study aims to better understand the spatial and temporal evolution of vegetation greenness using satellite time series in the Sahel-Sudan-Guinea region during 2001–2020. The specific objectives are: (1) to detect the spatio-temporal characteristics of trend reversals and evolution of vegetation greenness dynamics by using the EEMD method; (2) to assess the dominant climatic drivers of vegetation greenness trends by using the explainable machine learning framework.
The African Sahel-Sudan-Guinea region (0–25°N, 20°W-53°E) is known as a transition zone between arid and humid climates, located south of the Sahara Desert and north of the Equator, extending from the Atlantic coast in the west to the Red Sea and the Indian Ocean in the east (Figure 1A). This region exhibits a significant climate gradient from north to south, with average annual precipitation ranging from less than 100 mm in the northern areas to more than 1,100 mm in the southern areas. Climate conditions in the western region are primarily regulated by the West African Monsoon, which is characterized by a rainy season spanning from June to October (Nicholson, 2009; Nicholson, 2013). Conversely, the eastern part has a notable variation in the spatial distribution of precipitation, mainly due to the influence of sea surface temperature (SST) in the equatorial Pacific and Indian Ocean, as well as a complex topography (Nicholson, 2017; Endris et al., 2019), which distinguishes it from West Africa. As a result of these geographic variations and climatic gradients, a wide range of biomes occur in close succession along the spatial gradient. These biomes include grasslands, savannas, shrublands, dry forests, and humid forests (Figure 1B).
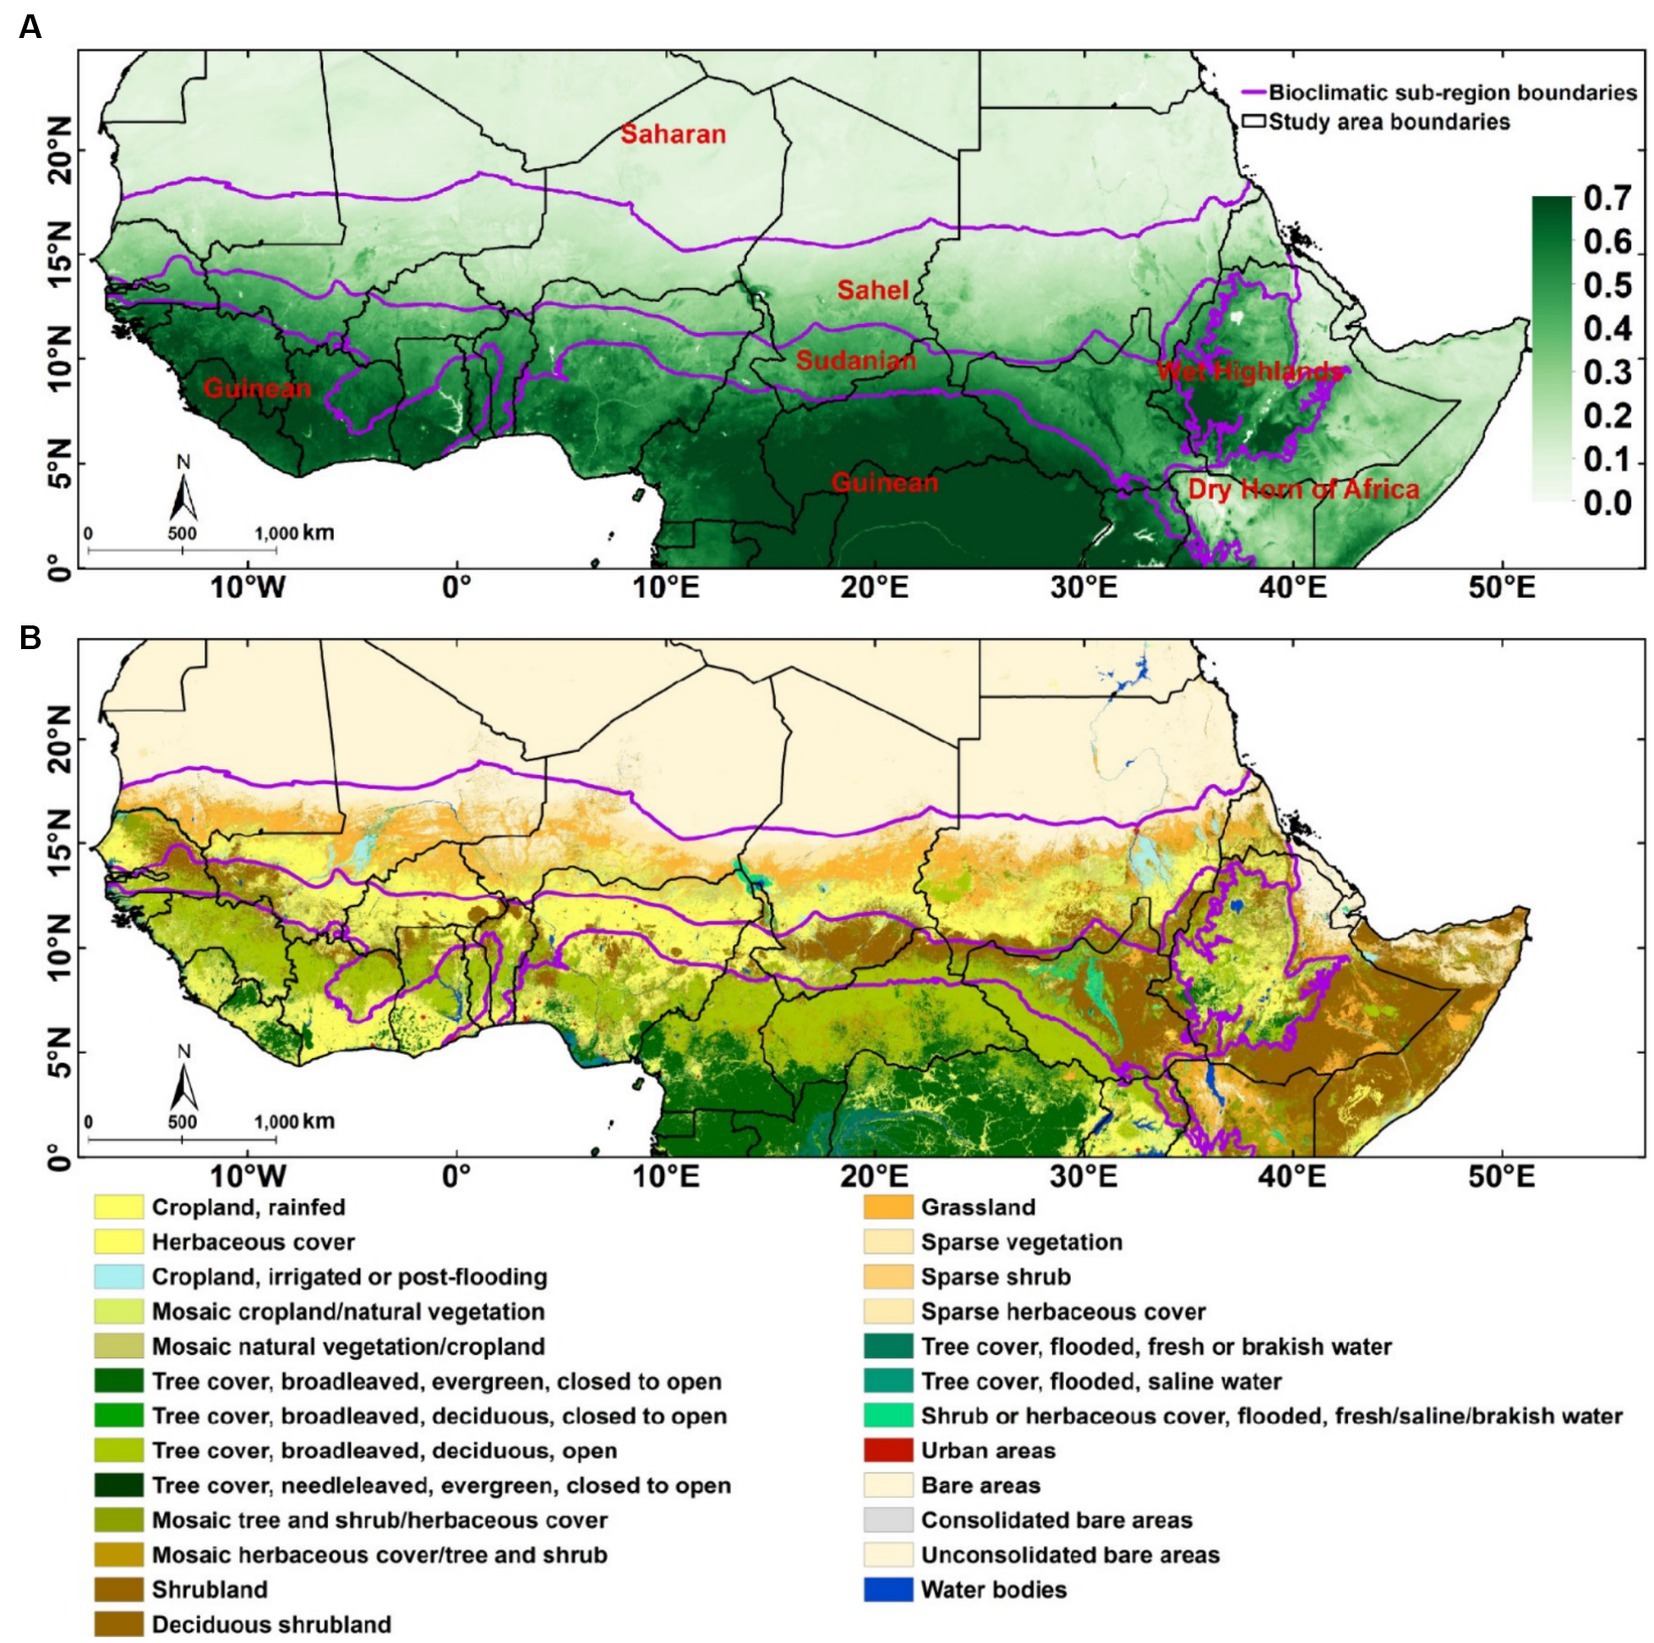
Figure 1. The study area Sahel-Sudan-Guinea region in Africa: (A) Mean annual NDVI in 2001–2020 and (B) land use/land cover (LULC) map in 2020. The NDVI was derived from Moderate Resolution Imagery Spectroradiometer (MODIS) surface reflectance data and the LULC information was extracted from ESA CCI-LC maps. The purple lines represent the boundaries of bioclimatic sub-regions.
The Moderate Resolution Imagery Spectroradiometer (MODIS) 8-day composite surface reflectance product (MOD09Q1, Collection 6.1) at 250-m spatial resolution1 was used to derive the NDVI as a proxy for vegetation greenness for the period 2001–2020. An improved Harmonic ANalysis of Time Series (iHANTS) algorithm was used to remove the outliers and reconstruct the NDVI time series. The iHANTS method is an updated tool that improves the original HANTS (Menenti et al., 1993; Verhoef et al., 1996) for time series reconstruction, which applies the Fourier transform theory with several parameter settings, including inter-annual harmonic components, dynamic fitting error tolerance (FET) scheme, and dynamic update of weights to remove the outliers and fill the gaps in a time series. Global assessments (Zhou et al., 2016, 2021b) and a performance test in the Sahel-Sudan-Guinea region (Jiang et al., 2022) showed a good performance in the reconstruction of NDVI time series. In this study, we averaged the reconstructed 8-day NDVI time-series data to a spatial resolution of 0.05° and calculated the annual mean NDVI for each pixel. To reduce the impacts of non-vegetated or sparse vegetation areas, the pixels with multiple-year mean NDVI <0.1, permanent bare lands and permanent water bodies were masked out (Pan et al., 2018; Feng et al., 2021).
In this study, we selected climatic factors related to water, heat, and energy to identify the dominant climatic drivers of vegetation growth, captured through greenness trends. These drivers include precipitation (Dardel et al., 2014; Zeng et al., 2023), atmospheric vapor pressure deficit (Yuan et al., 2019), air temperature and solar radiation (Piao et al., 2020; Yang et al., 2021). The total annual precipitation (Pre) data at a spatial resolution of 0.05° for the period 2001–2020 were obtained from the Climate Hazards Group InfraRed Precipitation with Station (CHIRPS, Version 2.0).2 The monthly air temperature (Tem), dew point temperature (Td) and solar radiation (Rad) data with a spatial resolution of 0.1° were obtained from the European Centre for Medium-Range Weather Forecasts (ECMWF) Reanalysis v5 Land (ERA5-Land).3 In this study, the air temperature (Tem) and dew point temperature (Td) were used to calculate vapor pressure deficit (VPD) following the previous study (Yuan et al., 2019). The monthly Tem, Rad and VPD data were resampled from the original spatial resolution to 0.05° using the cubic spline method (Keys, 1981) and then the annual averages (Tem and VPD) and annual sum (Rad) were calculated for the period 2001–2020.
The land use/land cover (LULC) data at 300-m spatial resolution for the period 1992–2020 were obtained from the European Space Agency (ESA) Climate Change Initiative (CCI) Land Cover annual maps.4 In this study, the 37 original LC classes were reclassified into 10 classes according to Supplementary Table S1. Then the major “no change” LULC types and paired LULC change types during 2001–2020 were identified following previous studies (Song et al., 2018; Zeng et al., 2023) based on the total change of each LULC fraction at a spatial resolution of 0.05°. The total change estimated by the linear method was replaced by the accumulated variation using the EEMD method (see Supplementary A and Supplementary Figure S1). In addition, we used the global Human Modification (HM) dataset sourced from the Socioeconomic Data and Applications Center (SEDAC) of the National Aeronautics and Space Administration (NASA)5 with 1-km spatial resolution to represent human activity intensity. This dataset provides information on five major anthropogenic pressure sources around the year 2016: human settlements, agriculture, transportation, mining and energy production, and electrical power infrastructure (Kennedy et al., 2019, 2020). In this study, we averaged the global Human Modification (HM) dataset to a spatial resolution of 0.05° to match other raster data.
We used the WorldClim historical precipitation dataset (version 2.1)6 to derive mean annual precipitation isohyets to delineate bioclimatic sub-region boundaries following previous studies (Weltzien et al., 2006; Herrmann et al., 2020). The following sub-regions were delineated: Saharan (Pre < 100 mm), Sahel (100 mm ≤ Pre < 700 mm), Sudanian (700 mm ≤ Pre < 1,100 mm), and Guinean (Pre ≥ 1,100 mm). To distinguish the geographical sub-regions of East Africa, we also defined Wet Highlands, i.e., Pre ≥ 700 mm and elevation ≥1,000 m in the Ethiopian Highlands, and Dry Horn of Africa, i.e., Pre < 700 mm in Horn of Africa (Figure 1) based on WorldClim mean annual precipitation and elevation obtained by the NASA Shuttle Radar Topographic Mission (SRTM, version 4).7 The aridity index (AI) data at 1-km spatial resolution provided by the Consultative Group for International Agriculture Research-Consortium for Spatial Information (CGIAR-CSI)8 and the annual percentage of tree cover at 250-m spatial resolution obtained from the MODIS product (MOD44B, Collection 6.1)9 were used for ancillary analysis.
To investigate the evolution of NDVI, a proxy for vegetation greenness, in the Sahel-Sudan-Guinea region from 2001 to 2020, this study involved two main steps (Figure 2):
1. NDVI trend analysis at regional scale and pixel-wise scale. We first used both Theil-Sen method and EEMD method to compare the overall trends in NDVI at the regional scale. Then, we analyzed the spatio-temporal pattern of evolution and trend reversals in NDVI by applying pixel-wise EEMD method.
2. Analysis of dominant climatic drivers of vegetation greenness trends. We first extracted EEMD trends in air temperature, precipitation, solar radiation and vapor pressure deficit for the same period. Then, we explored the dominant climatic drivers of the observed trends in NDVI by applying the explainable machine learning framework, i.e., Random Forest (RF) and SHapley Additive exPlanations (SHAP). To perform raster calculations at different spatial resolutions, all raster data were uniformly sampled to a spatial resolution of 0.05° and all the data processing and analysis were implemented in the R (version 4.3.1) software.
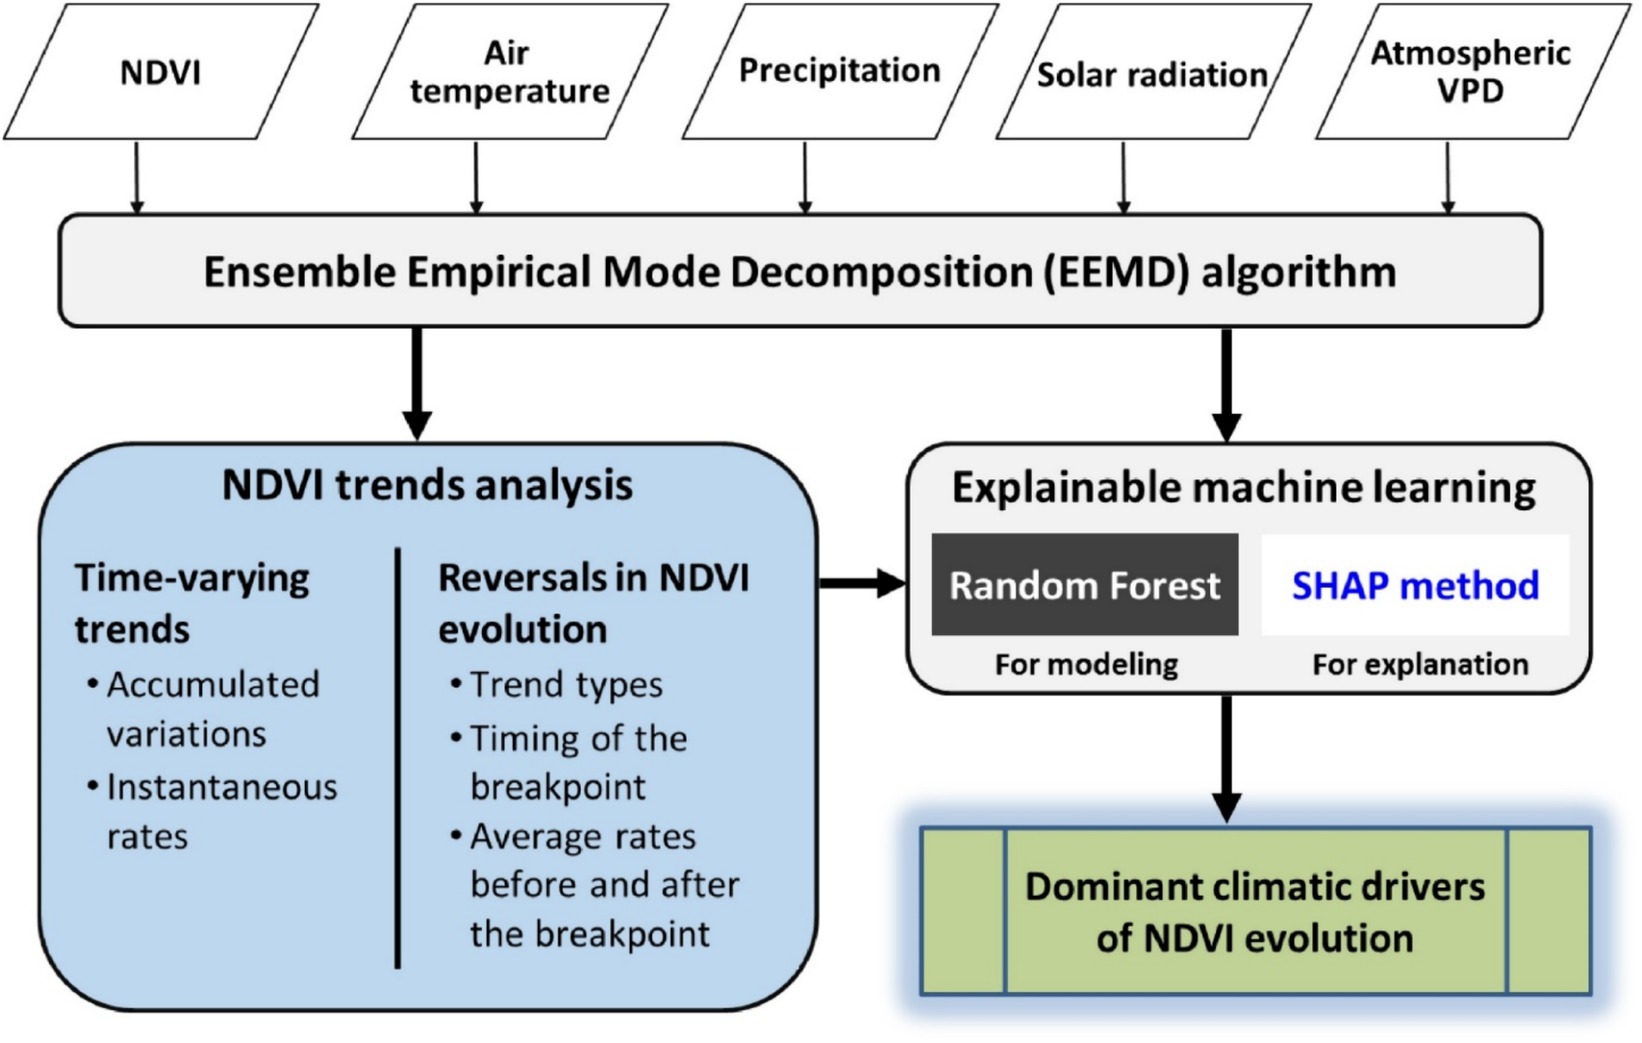
Figure 2. Flowchart of the study.
The Theil-Sen trend approach was used to estimate linear trends in this study, which is widely used as a robust linear trend estimator to detect long-term trends in the time series of ecological and climatic variables (Ahmedou et al., 2008; Chen et al., 2019). The Yue-Pilon pre-whitening Mann–Kendall test (Yue et al., 2002) was used to assess the significance of NDVI trends, and the trend was considered significant if the confidence level was greater than 95% (p < 0.05).
The EEMD is an adaptive time series analysis method, and decomposes nonlinear and non-stationary time series data into finite physically meaningful components with decreasing frequencies, called Intrinsic Mode Functions (IMF), and a secular trend (Huang et al., 1998; Wu and Huang, 2009). This method does not follow a priori shape, but runs through a ‘sifting’ process using only the information of local extrema, and has been widely applied to evaluate trends in climate and vegetation variables (Wu et al., 2007; Wu and Huang, 2009; Ji et al., 2014; Hawinkel et al., 2015; Pan et al., 2018). The main steps of EEMD method can be seen in Supplementary B. In this study, following Ji et al. (2014), the accumulated variation V(t) in a secular trend component (Rn) was defined as the accumulated variation in Rn from the starting time (i.e., 2001) to any specific time (Eq. 1):
The instantaneous rate at t of a secular trend was determined as the first temporal derivative of the V(t) or the first temporal derivative of the Rn(t) (Eq. 2):
Here, a positive instantaneous rate in NDVI secular trend indicates greening and a negative instantaneous rate indicates browning. To facilitate a comparison between a nonlinear trend with time-varying rates and a linear trend with a constant rate, the accumulated variation of the trend component over a specific time interval proves to be a useful measure. It enables us to quantify the cumulative change within a specific period of time (e.g., 2001–2020), providing a measure of the overall trend magnitude that can be compared to a linear trend. We can identify trend types and trend reversals based on the occurrence of extrema within a secular trend. For a secular trend with no extrema, the trend type is identified as monotonically increasing and monotonically decreasing (for NDVI monotonic greening and monotonic browning, respectively). A secular trend with one extrema is considered to have a trend reversal, and the type is identified as increasing-to-decreasing transition and decreasing-to-increasing transition (for NDVI greening-to-browning transition and browning-to-greening transition, respectively). Also, the location of the extrema is identified as the breakpoint (BP).
In this study, the EEMD method was applied by using the R package “Rlibeemd” (Luukko et al., 2016). We used the number of 100 copies with 0.2 standard deviations of the raw data to generate Gaussian white noises (Wu and Huang, 2009). To reduce over-sifting signals and ensure that the final results meet the requirements of the IMF, we adopted the S-number stopping criterion. This criterion stops the iteration when the number of zero crossings and extrema differ by at most one, and these numbers remain the same for S consecutive iterations (Huang et al., 1999). The S-number was set to 4 according to the optimal range of 3 to 8 (Huang et al., 2003; Luukko et al., 2016). In addition, the Monte Carlo significance test approach developed in previous studies (Ji et al., 2014; Pan et al., 2018) was implemented to test EEMD trend (see Supplementary B).
The RF algorithm is widely used to predict and classify all sorts of variables due to its robust accuracy based on the construction of multiple mutually independent basic learners through a bootstrap aggregation strategy (Breiman, 2001). Moreover, it allows for training a nonlinear relationship between the target variable and the predictors without any statistical hypothesis and can isolate the relative importance of each predictor on the target variable (Breiman, 2001; Leroux et al., 2017). The SHAP method has been proposed as a unified and powerful tool to explain a relationship constructed by machine learning (e.g., RF) by isolating the marginal contributions of each predictor on the target variable. It uses the concept of Shapley values, rooted in cooperative game theory (Shapley, 1953), to link optimal credit allocation with local explanations, providing a comprehensive framework for assessing the importance of features and understanding the contribution of individual features in the prediction process (Lundberg and Lee, 2017). This method directly measures the impact of individual features (e.g., Tem, Pre, Rad and VPD) on model loss (Lundberg and Lee, 2017; Wang et al., 2022), i.e., the differences between the predicted and expected values of the target variable (e.g., NDVI) (Eq. 3):
The SHAP value is a metric of the mean marginal contribution of a feature in all possible coalitions of feature inputs (Eq. 4):
We conducted the climatic driver analysis at the pixel-wise scale using the RF algorithm and SHAP method. Before calculating the SHAP values, we tuned the hyper-parameter settings of the RF model according to the grid search method (Li et al., 2022) using the R package “ranger” (Wright and Ziegler, 2015), including mtry, splitrule and min.node.size, to obtain high accuracy predictions. The hyper-parameter settings of RF model were tuned as follows:
1. Randomly selected 1,000 vector points in the study area and extracted the secular trends in NDVI (target variable) and in climatic variables (predictor variables) during 2001–2020 at each point by EEMD method.
2. Implemented a RF model with 5-fold cross-validation and ntree = 500 to determine the optimal hyper-parameters according to the grid search method and varied hyper-parameters (Table 1) for each point. The determination coefficient (R2) and root mean squared error (RMSE) were calculated and the minimum RMSE criterion was used to determine the optimal hyper-parameters.
3. Excluded points with R2 < 0.9 of RF modeling and selected the most frequent value of each parameter in the remaining points as the best parameter.
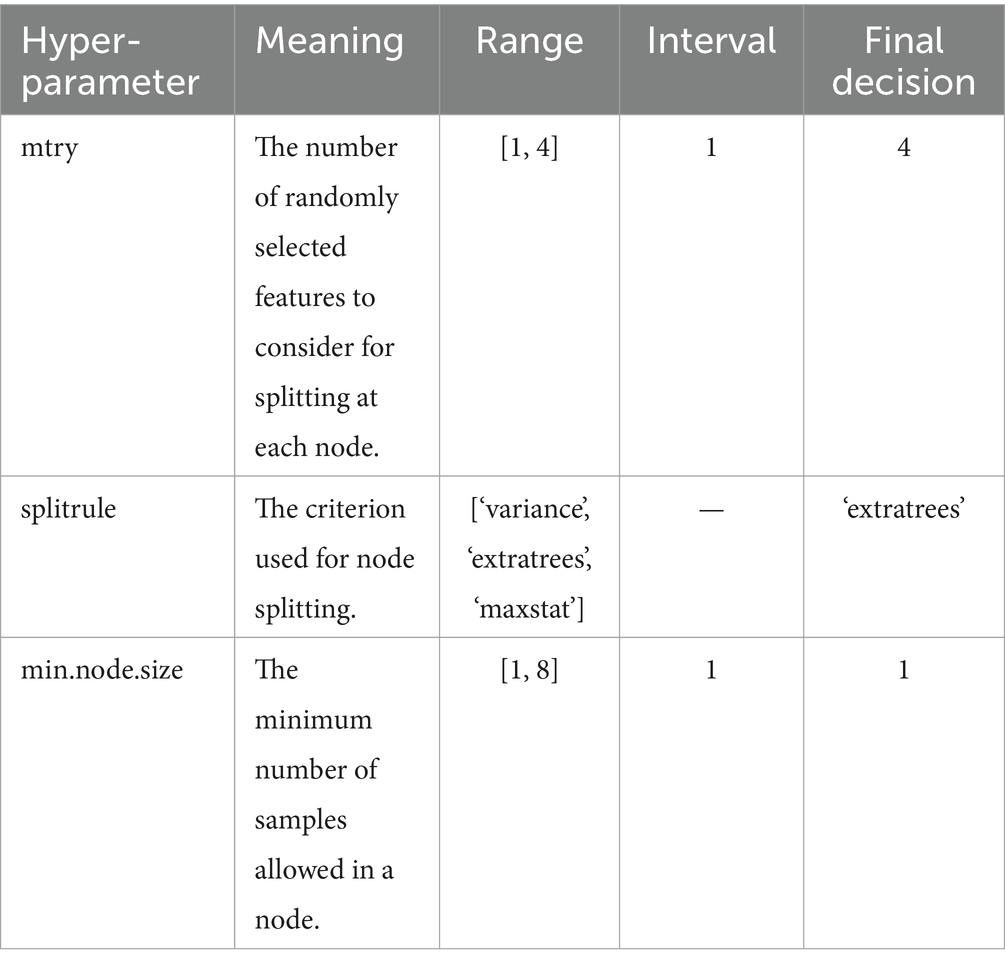
Table 1. Hyper-parameter settings for grid search in the RF models.
After obtaining the best hyper-parameter settings (mtry = 4, splitrule = ‘extratrees’ and min.node.size = 1), we implemented a pixel-wise RF model with 5-fold cross-validation and SHAP method to get SHAP relative importance of the climatic variables. At the same time, the relative importance of the climatic variables in the RF model was estimated using the impurity method (Wright and Ziegler, 2015). For a Random Forest Regression, the impurity method measures the importance of a particular feature by evaluating the reduction in variance of the predicted target variable before and after introducing that feature at each node split. A large reduction in variance indicates a high level of feature importance.
We conducted further statistical analyses based on the SHAP results. The global SHAP feature importance was calculated as the mean absolute value of the SHAP values for each driving factor, and the direction of the global SHAP feature importance was defined as the sign of the correlation coefficient between the local SHAP values for the dependent variable (secular trend in NDVI) and each independent variable (secular trend in each climatic variable) (Hasan et al., 2021; Green et al., 2022). Furthermore, the driving factor with the largest global SHAP feature importance value was selected as the dominant driving factor. To test the climatic driver disturbance from human footprint, we performed the driver analysis both without and after removing the areas with high human activity intensity, represented by human modification degree data. Followed Kennedy et al. (2019), the high human activity intensity regions were defined as pixels where the human modification degree exceeded 0.4.
The trends in annual mean NDVI for the period 2001–2020 for the entire Sahel-Sudan-Guinea region and bioclimatic sub-regions are shown in Figure 3. The NDVI in the entire Sahel-Sudan-Guinea region showed a significant linear increasing trend (rate of change 1.06 × 10⁻³ yr.−1, p < 0.05) and a significant secular increasing trend by EEMD (mean rate of change 1.01 × 10⁻³ yr.−1, p < 0.05) over 2001–2020 (Figure 3A). In terms of bioclimatic sub-regions, both Theil-Sen trends and EEMD trends in NDVI were all increasing, but the EEMD trends showed different aspects. The NDVI trends in the Saharan, Sahel, Sudanian and Guinean sub-regions were found to monotonically increase by EEMD (Figures 3B–D,F). In particular, the highest average growth rate was observed in the Sudanian sub-region, reaching 1.41 × 10⁻³ yr.−1. In contrast, both the Wet Highlands and the Dry Horn of Africa sub-regions showed a significant browning-to-greening transition (i.e., decrease to increase in NDVI) with the breakpoints around the years 2008 and 2006, respectively (Figures 3E,G). Their mean rates of decrease before the reversals were − 1.83 × 10⁻³ yr.−1 and -6.20 × 10⁻⁴ yr.−1, respectively, while the mean rates of increase after the reversals were 2.98 × 10⁻³ yr.−1 and 2.20 × 10⁻³ yr.−1, respectively. In general, both linear trends and EEMD trends showed an overall greening over the Sahel-Sudan-Guinea region from 2001 to 2020, but the EEMD method puts more emphasis on the detailed evolutionary process, e.g., significant trend reversals (browning-to-greening) with time-varying rate of change were detected.
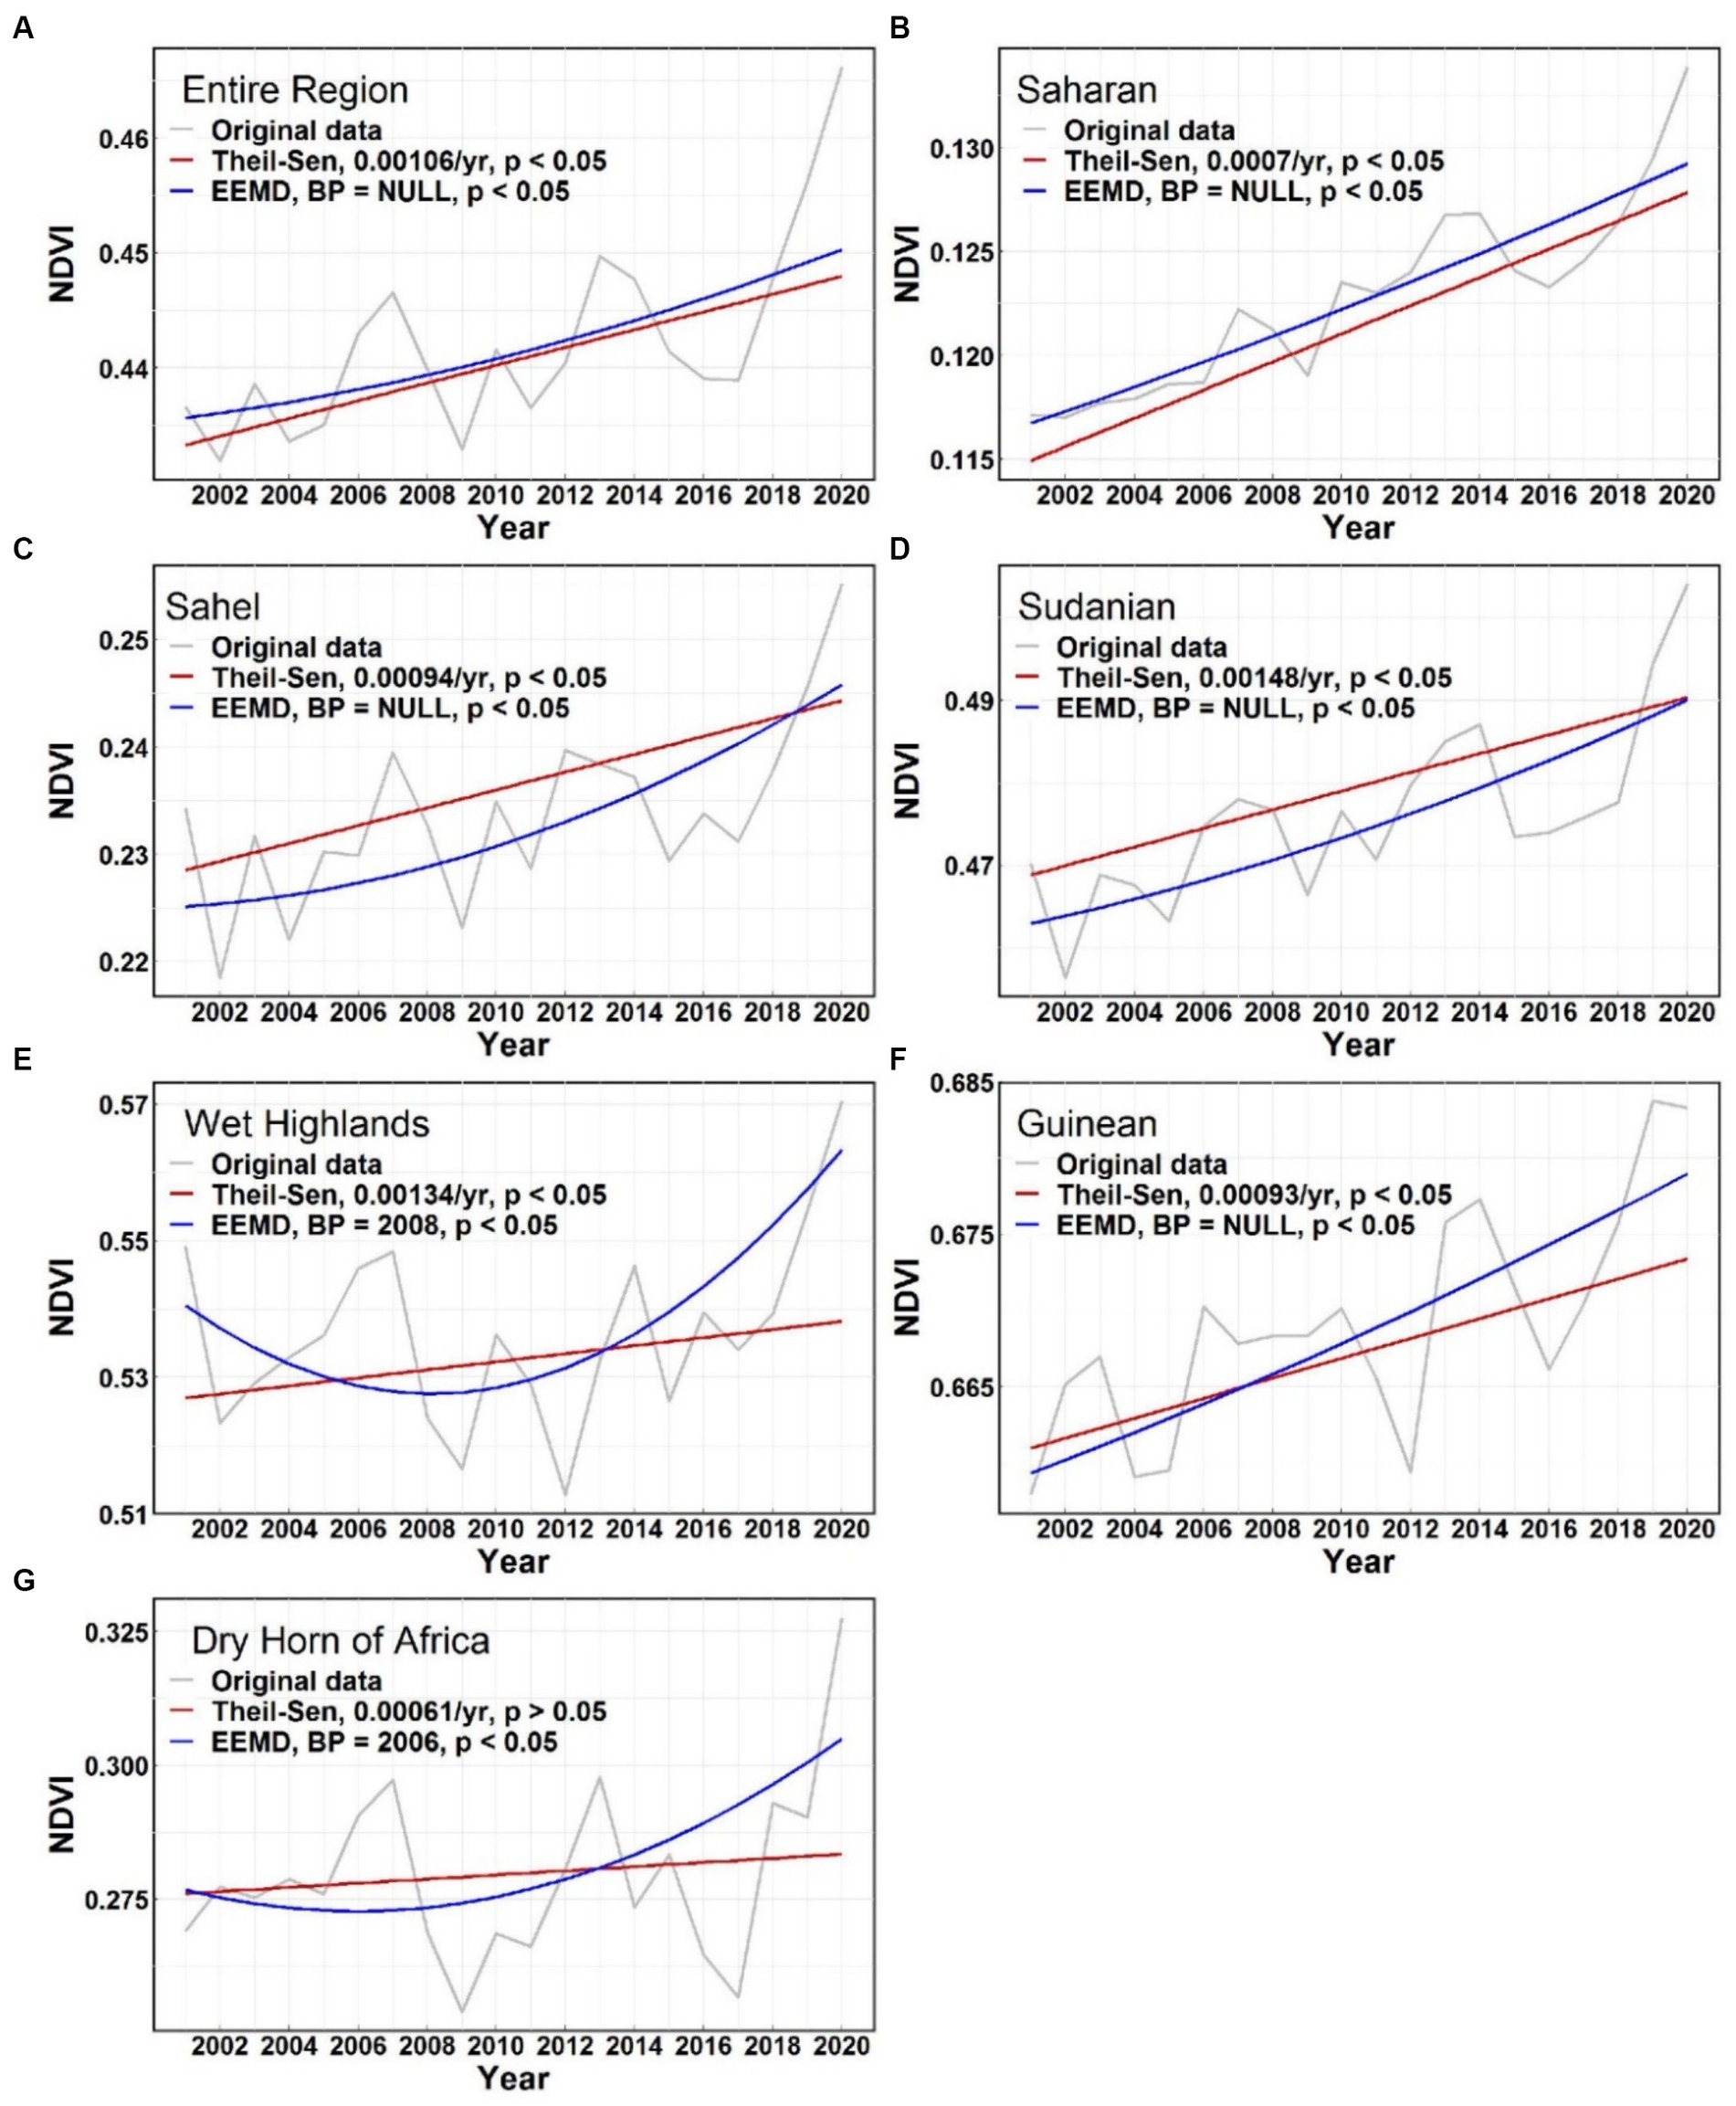
Figure 3. Trends in annual mean NDVI using Theil-Sen method and EEMD method for the period 2001–2020 in different bioclimatic sub-regions: (A) Entire study area, (B) Saharan, (C) Sahel, (D) Sudanian, (E) Wet Highlands, (F) Guinean, and (G) Dry Horn of Africa. The BP indicates the timing of the breakpoint, and NULL denotes without breakpoint.
The spatio-temporal patterns of EEMD trends in NDVI in the Sahel-Sudan-Guinea region during 2001–2020 are shown in Figure 4. Since 2001, there has been an overall positive accumulated variation in NDVI, indicating a greener vegetation compared to the year 2001. Before 2005, the areas with positive accumulated variation in NDVI were little more than half of the total study area (Figure 4A). The positive accumulated variations were mainly distributed in West Africa, Central African Republic and South Sudan, while the negative accumulated variations were clustered in the central Sudanian, Wet Highlands and Horn of Africa regions. By 2010, the extent of the positive accumulated variation was increasing, with some areas that had a negative accumulated variation prior to 2005 shifting to a positive one. After 2015, the area with positive accumulated variation in NDVI increased and exceeded 70% of the study area. Compared to the previous decade, the area with positive accumulated variation increased in western Sahel, Central African Republic and South Sudan, while the area with negative accumulated variation decreased in the Wet Highlands and Dry Horn of Africa sub-regions. Notably, the spatial pattern of accumulated variation in NDVI from 2001 to 2020 estimated by EEMD was similar to that obtained by applying the Theil-Sen trend (Figure 4D; Supplementary Figure S2).
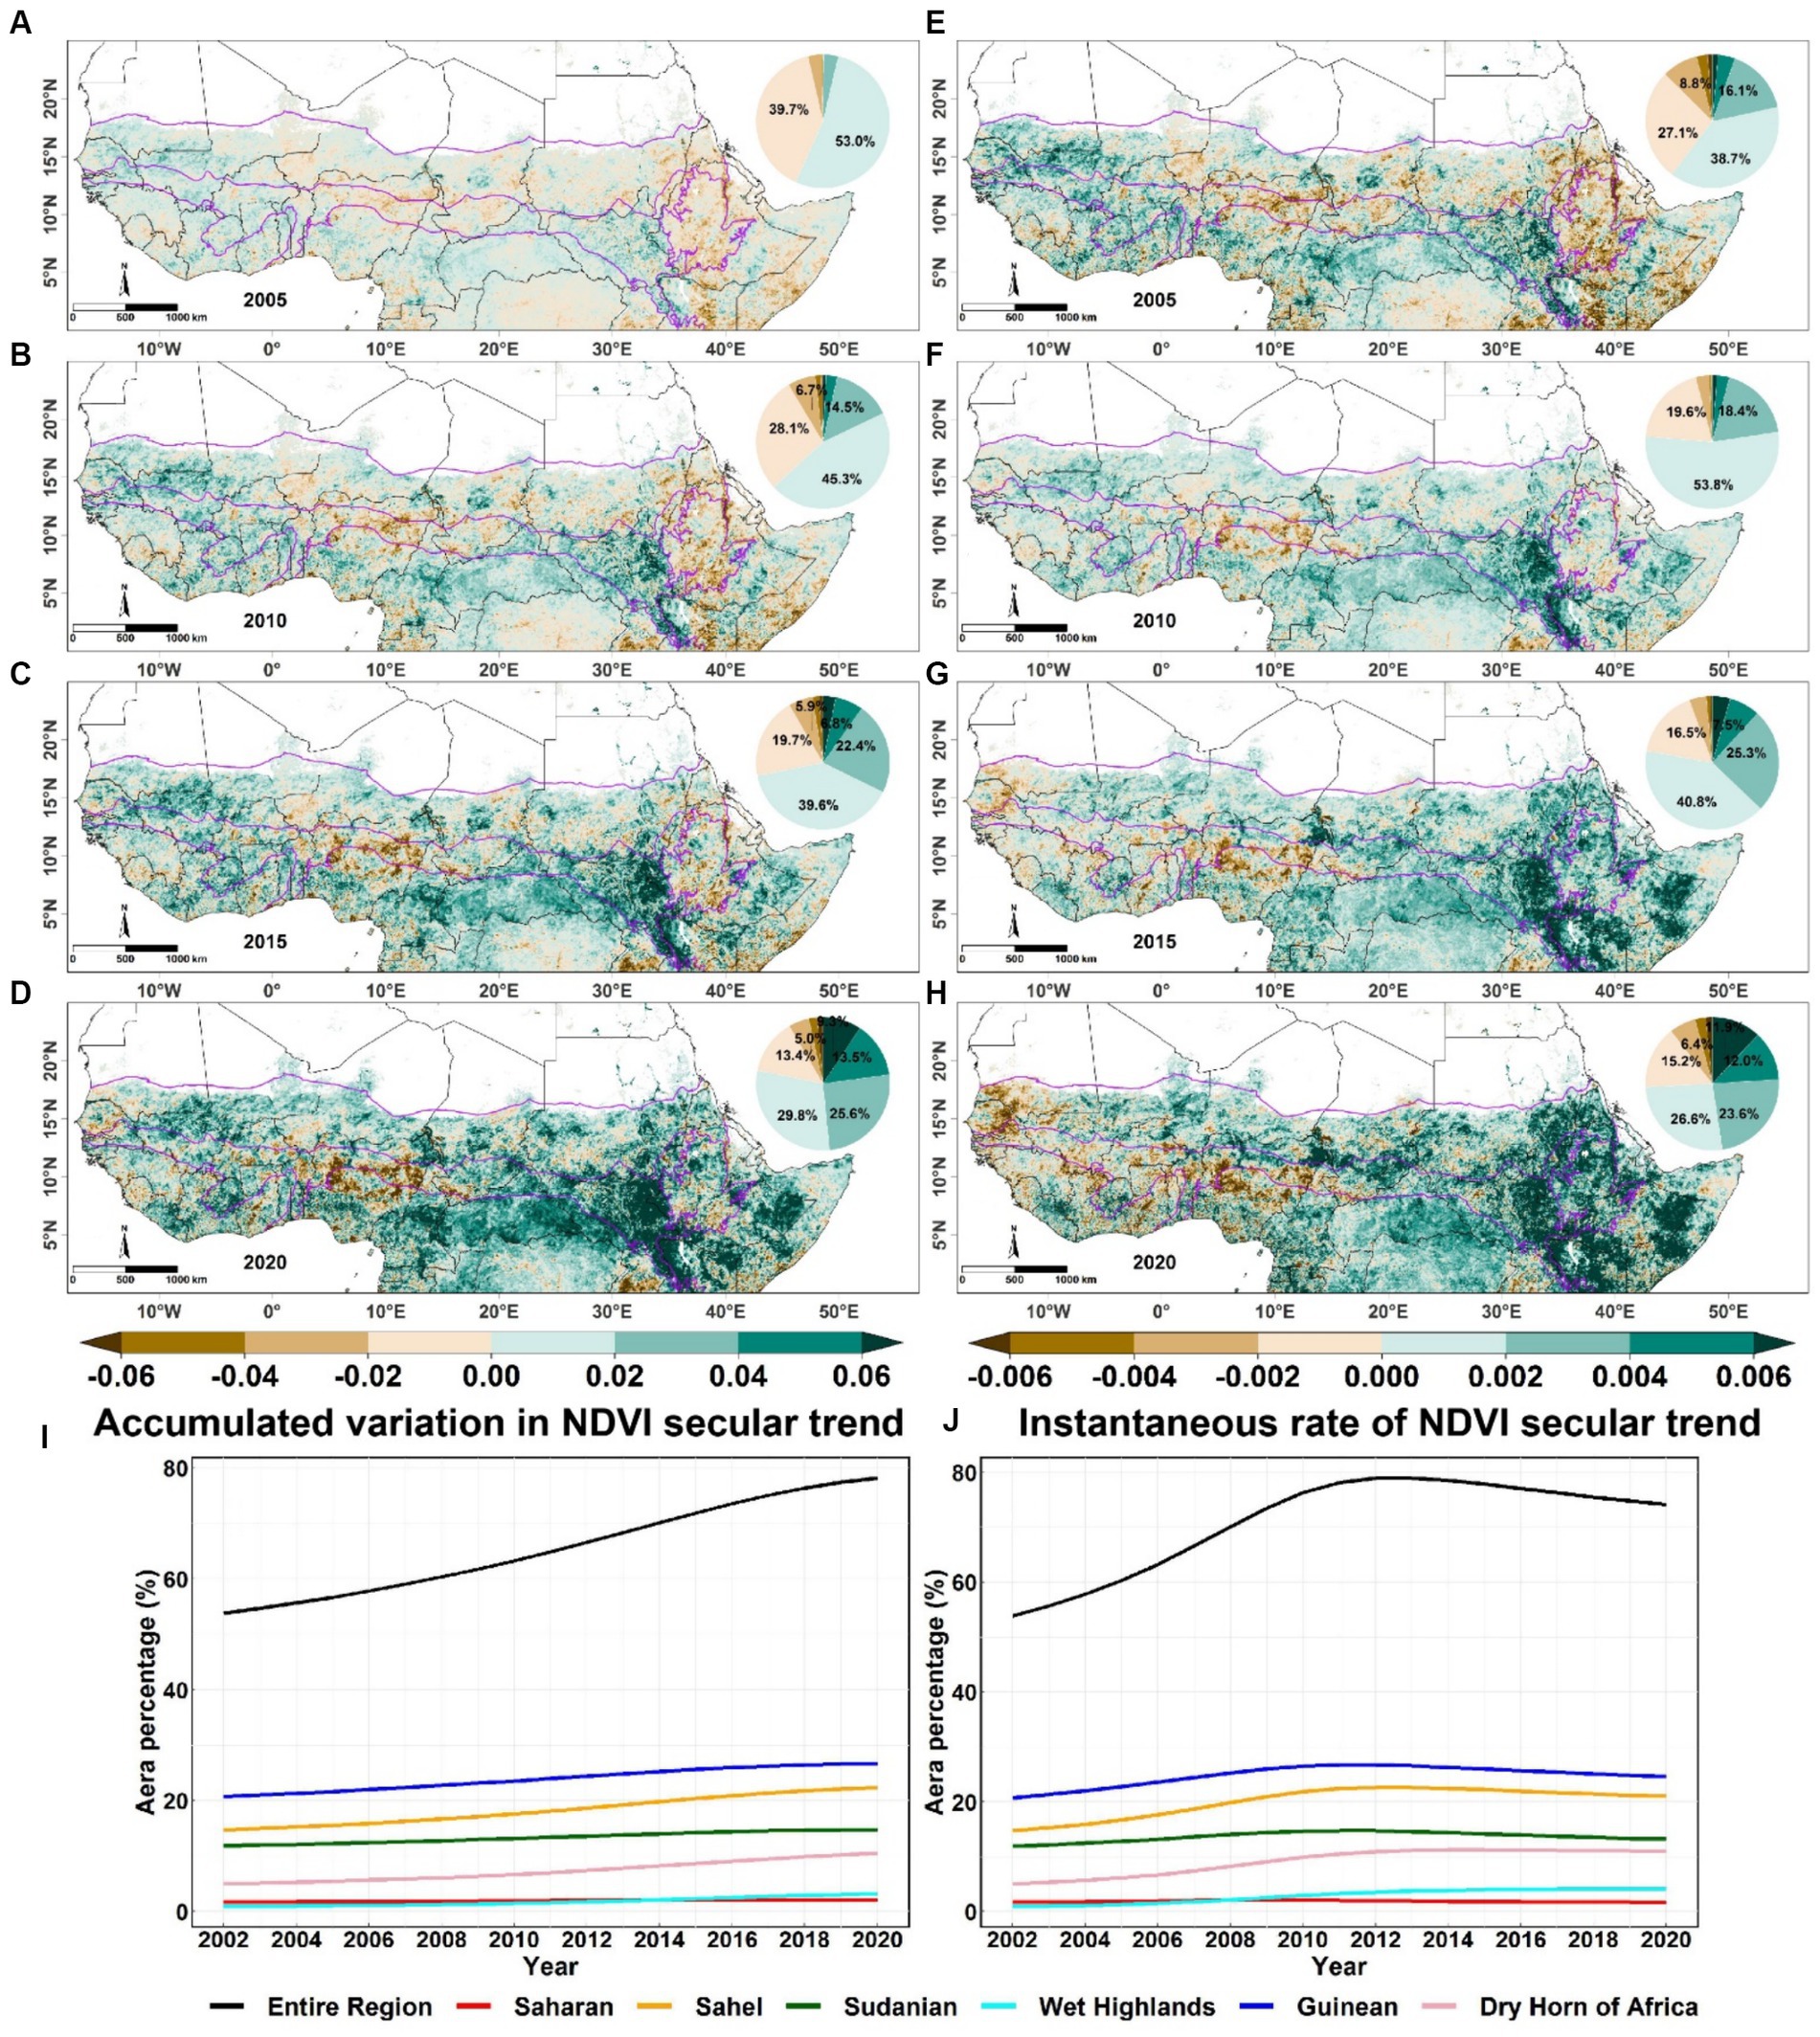
Figure 4. Spatio-temporal pattern of the accumulated variation and the instantaneous rate of NDVI secular trend during 2001–2020. (A–D) Accumulated variations in NDVI secular trend in the periods ending in 2005, 2010, 2015 and 2020, respectively; (E–H) instantaneous rates of the NDVI secular trend in 2005, 2010, 2015 and 2020, respectively. (I,J) Variations in the fractional abundance of the area with positive accumulated variation and positive instantaneous rate in different bioclimatic sub-regions, respectively. The inserted pie charts show the frequency distribution of the corresponding values.
As for the instantaneous rates of the secular trend, they had similar spatio-temporal characteristics as the accumulated variation. However, the area of greening rates (i.e., positive instantaneous rates in NDVI) experienced a process from growth to decline, although greening rates dominated the entire period (Figures 4E–H,J). Specifically, the area of greening rates had a noticeable increase before 2012, reaching a maximum of 79% of the study area (8.54 million km2), but this percentage declined in the following 8 years (Figure 4J). Such a decline in the extent of greening rate caused a slowdown or stagnation of early greening in some places in West Africa, such as Mauritania, Senegal, Mali, Burkina Faso and Guinea. We checked the significance of the EEMD trends, and found that the phenomenon of slowing or stagnation of early greening was also evident (Supplementary Figure S3). In addition, Guinean and Sahel sub-regions dominated the greening across the region and across the temporal range, with or without significance tests.
According to the EEMD method, the time-varying trends gave the spatial distribution of trend reversals in NDVI during 2001–2020, including trend types, timing of the reversal (i.e., the breakpoint), and mean instantaneous rates before and after the breakpoint (Figure 5). A monotonic greening trend (i.e., a sustained increase) in NDVI was observed in about 34% of the Sahel-Sudan-Guinea region during the study period (Figure 5A), mainly in the southern Guinean, the Sahel belt and eastern Sudanian sub-regions. In contrast, the extent of monotonic browning (sustained decrease) was much smaller, covering 6% of the study area. They were clustered in central West Africa (Burkina Faso, Benin, Niger, Nigeria, and southern Chad), Uganda and Somalia. The trend reversals in NDVI, which varied from east to west, were the main feature of the Sahel-Sudan-Guinea region over the last 20 years. The browning-to-greening transition occurred in 40% of the study area and was the most widespread of the four trend types. A noticeable browning-to-greening transition (70% of the total transition area) appeared before 2009 and was particularly clustered in the southern Sahel, East Africa and Congo Basin north of the Equator (Figure 5D). Although there was an overall greening trend in the Sahel-Sudan-Guinea region, the greening-to-browning transition occurred in almost 20% of the study area. A majority of greening-to-browning transition (66% of the total transition area) appeared after 2011, and were mainly distributed in West Africa (Figure 5D). Notably, the greening-to-browning transition occurred in some areas of Mauritania, Senegal, Mali, Guinea and Nigeria were in early 2007.
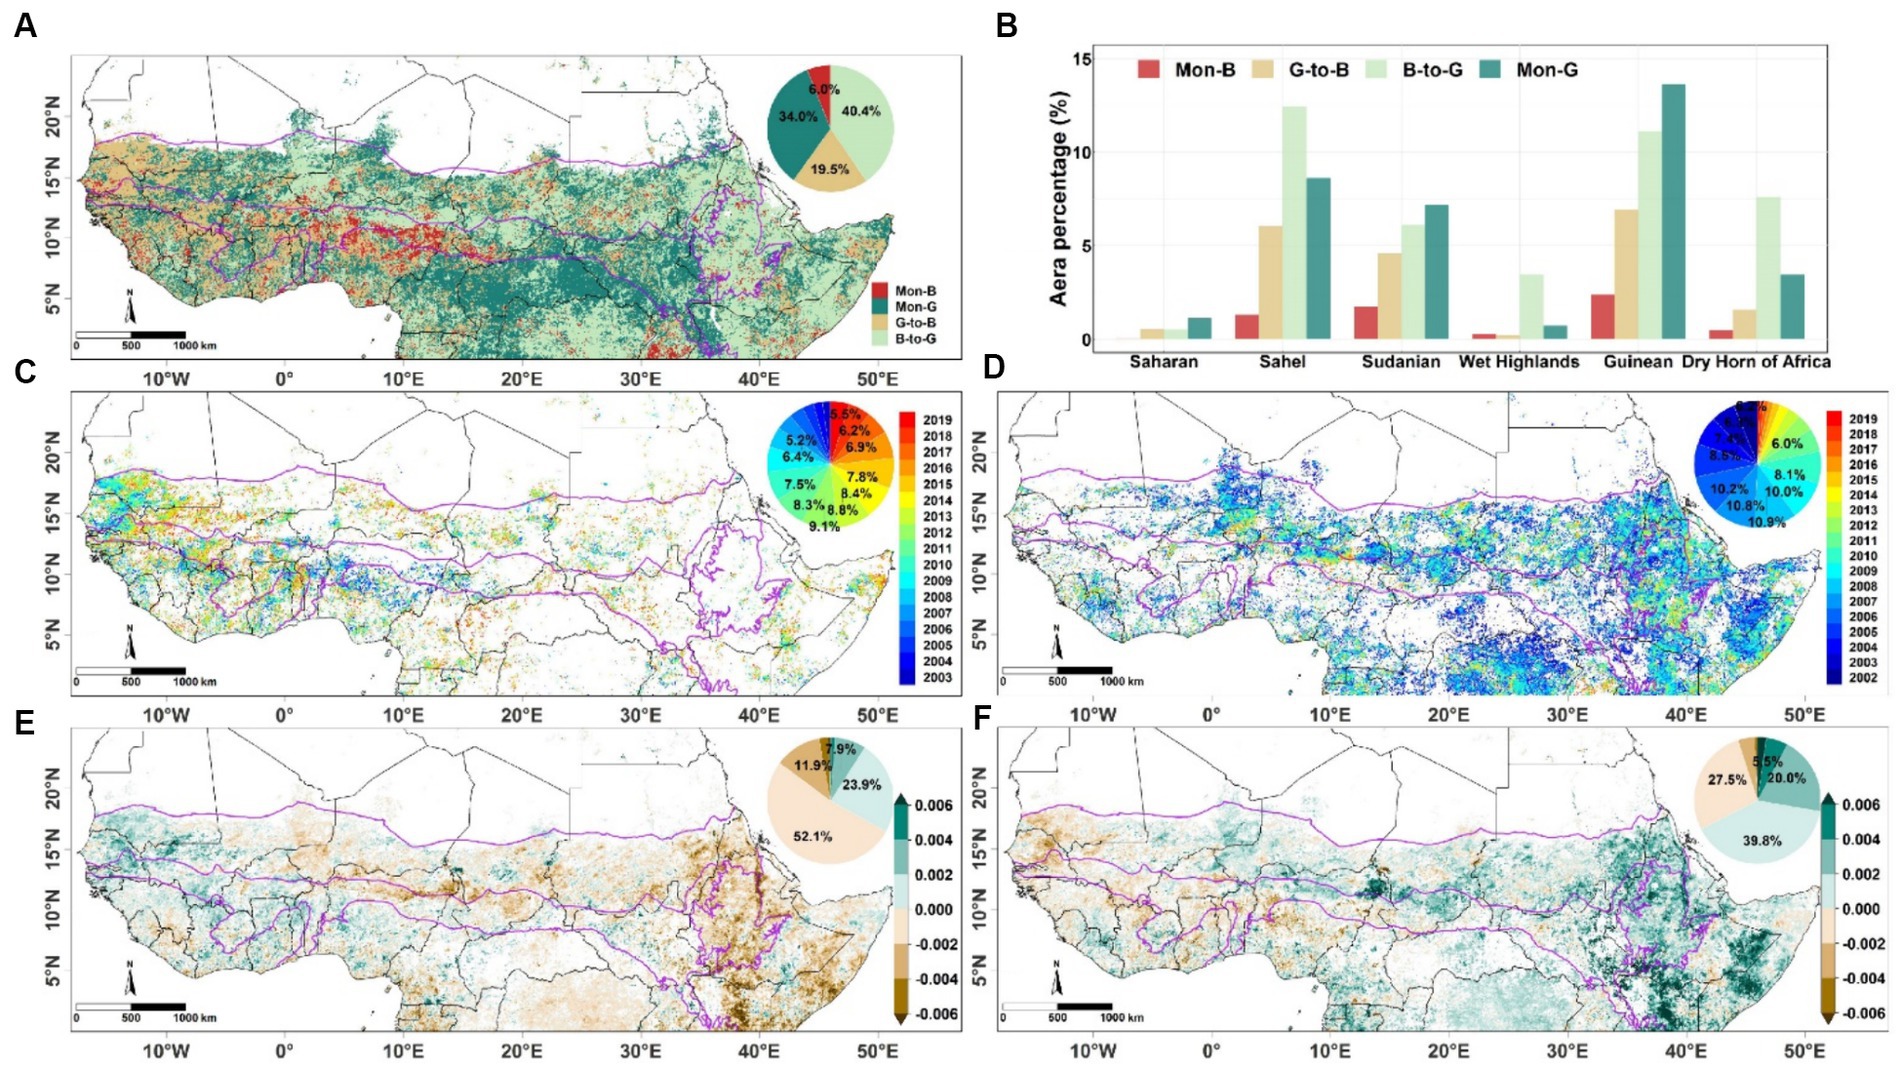
Figure 5. Spatial distribution of NDVI trend reversals during 2001–2020. (A) Trend types of NDVI derived by the EEMD. Mon-B: monotonic browning; Mon-G: monotonic greening; G-to-B: greening-to-browning transition; B-to-G: browning-to-greening transition. (B) Fractional abundance of the four trend types in different bioclimatic sub-regions. (C,D) Timing of the greening-to-browning transition and browning-to-greening transition, respectively. (E,F) Mean instantaneous rates before and after the trend reversal, respectively. The pie charts show the frequency distribution of the corresponding values. The areas with monotonic browning and monotonic greening were masked out in (C–F).
Before the breakpoints, widespread browning trends were detected by the EEMD throughout the Sahel-Sudan-Guinea region (Figure 5E), accounting for 40.1% of the study area. In comparison, pre-breakpoint greening trends occurred over much smaller areas, covering only 19.8% of the study area and were generally weaker. However, vegetation greenness trends reversed after the breakpoints. Large-scale greening trends continued to expand and intensified form west to east, covering 40.5% of the study area, particularly in Ethiopia, Somalia and Uganda (Figure 5F). In addition, greening-to-browning transition covered 19.5% of the study area and occurred mainly in West Africa.
To better capture the main features of the reversals in NDVI evolution, we investigated the temporal variations in the mean instantaneous rates and fractional abundance of the browning rate of the NDVI trend in each longitude bin, aridity index gradient, precipitation gradient and LULC type (Figure 6). Indeed, the trends in NDVI of the Sahel-Sudan-Guinea region had a markedly divergent evolution from west to east (Figures 6A,E). A greening-to-browning transition was observed around 2011 west of 0° longitude in the study area. Narrow bands at 3–10°E and 13–20°E were dominated by sustained browning and sustained greening, respectively. A browning-to-greening transition was observed around 2008 east of 20°E. With respect to the aridity gradient, a browning-to-greening transition occurred in arid, semi-arid and humid regions, while the frequency of browning increased in the sub-humid region (Figures 6B,F). Similarly, but more clearly related to the aridity gradient, areas with precipitation between 100 and 1,000 mm a−1 and greater than 1,600 mm a−1 experienced a browning-to-greening transition around 2008. Conversely, areas with precipitation between 1,000 and 1,300 mm a−1 tended to experience sustained browning (Figures 6C,G). In terms of LULC, both the major stable LULC types and the major LULC change types experienced a browning-to-greening transition, except for cropland gain with shrubland loss, which showed sustained browning (Figures 6D,H). In addition, cropland expansion and grassland loss at the edge of bare lands were more susceptible to browning risk in the early years of the study period.
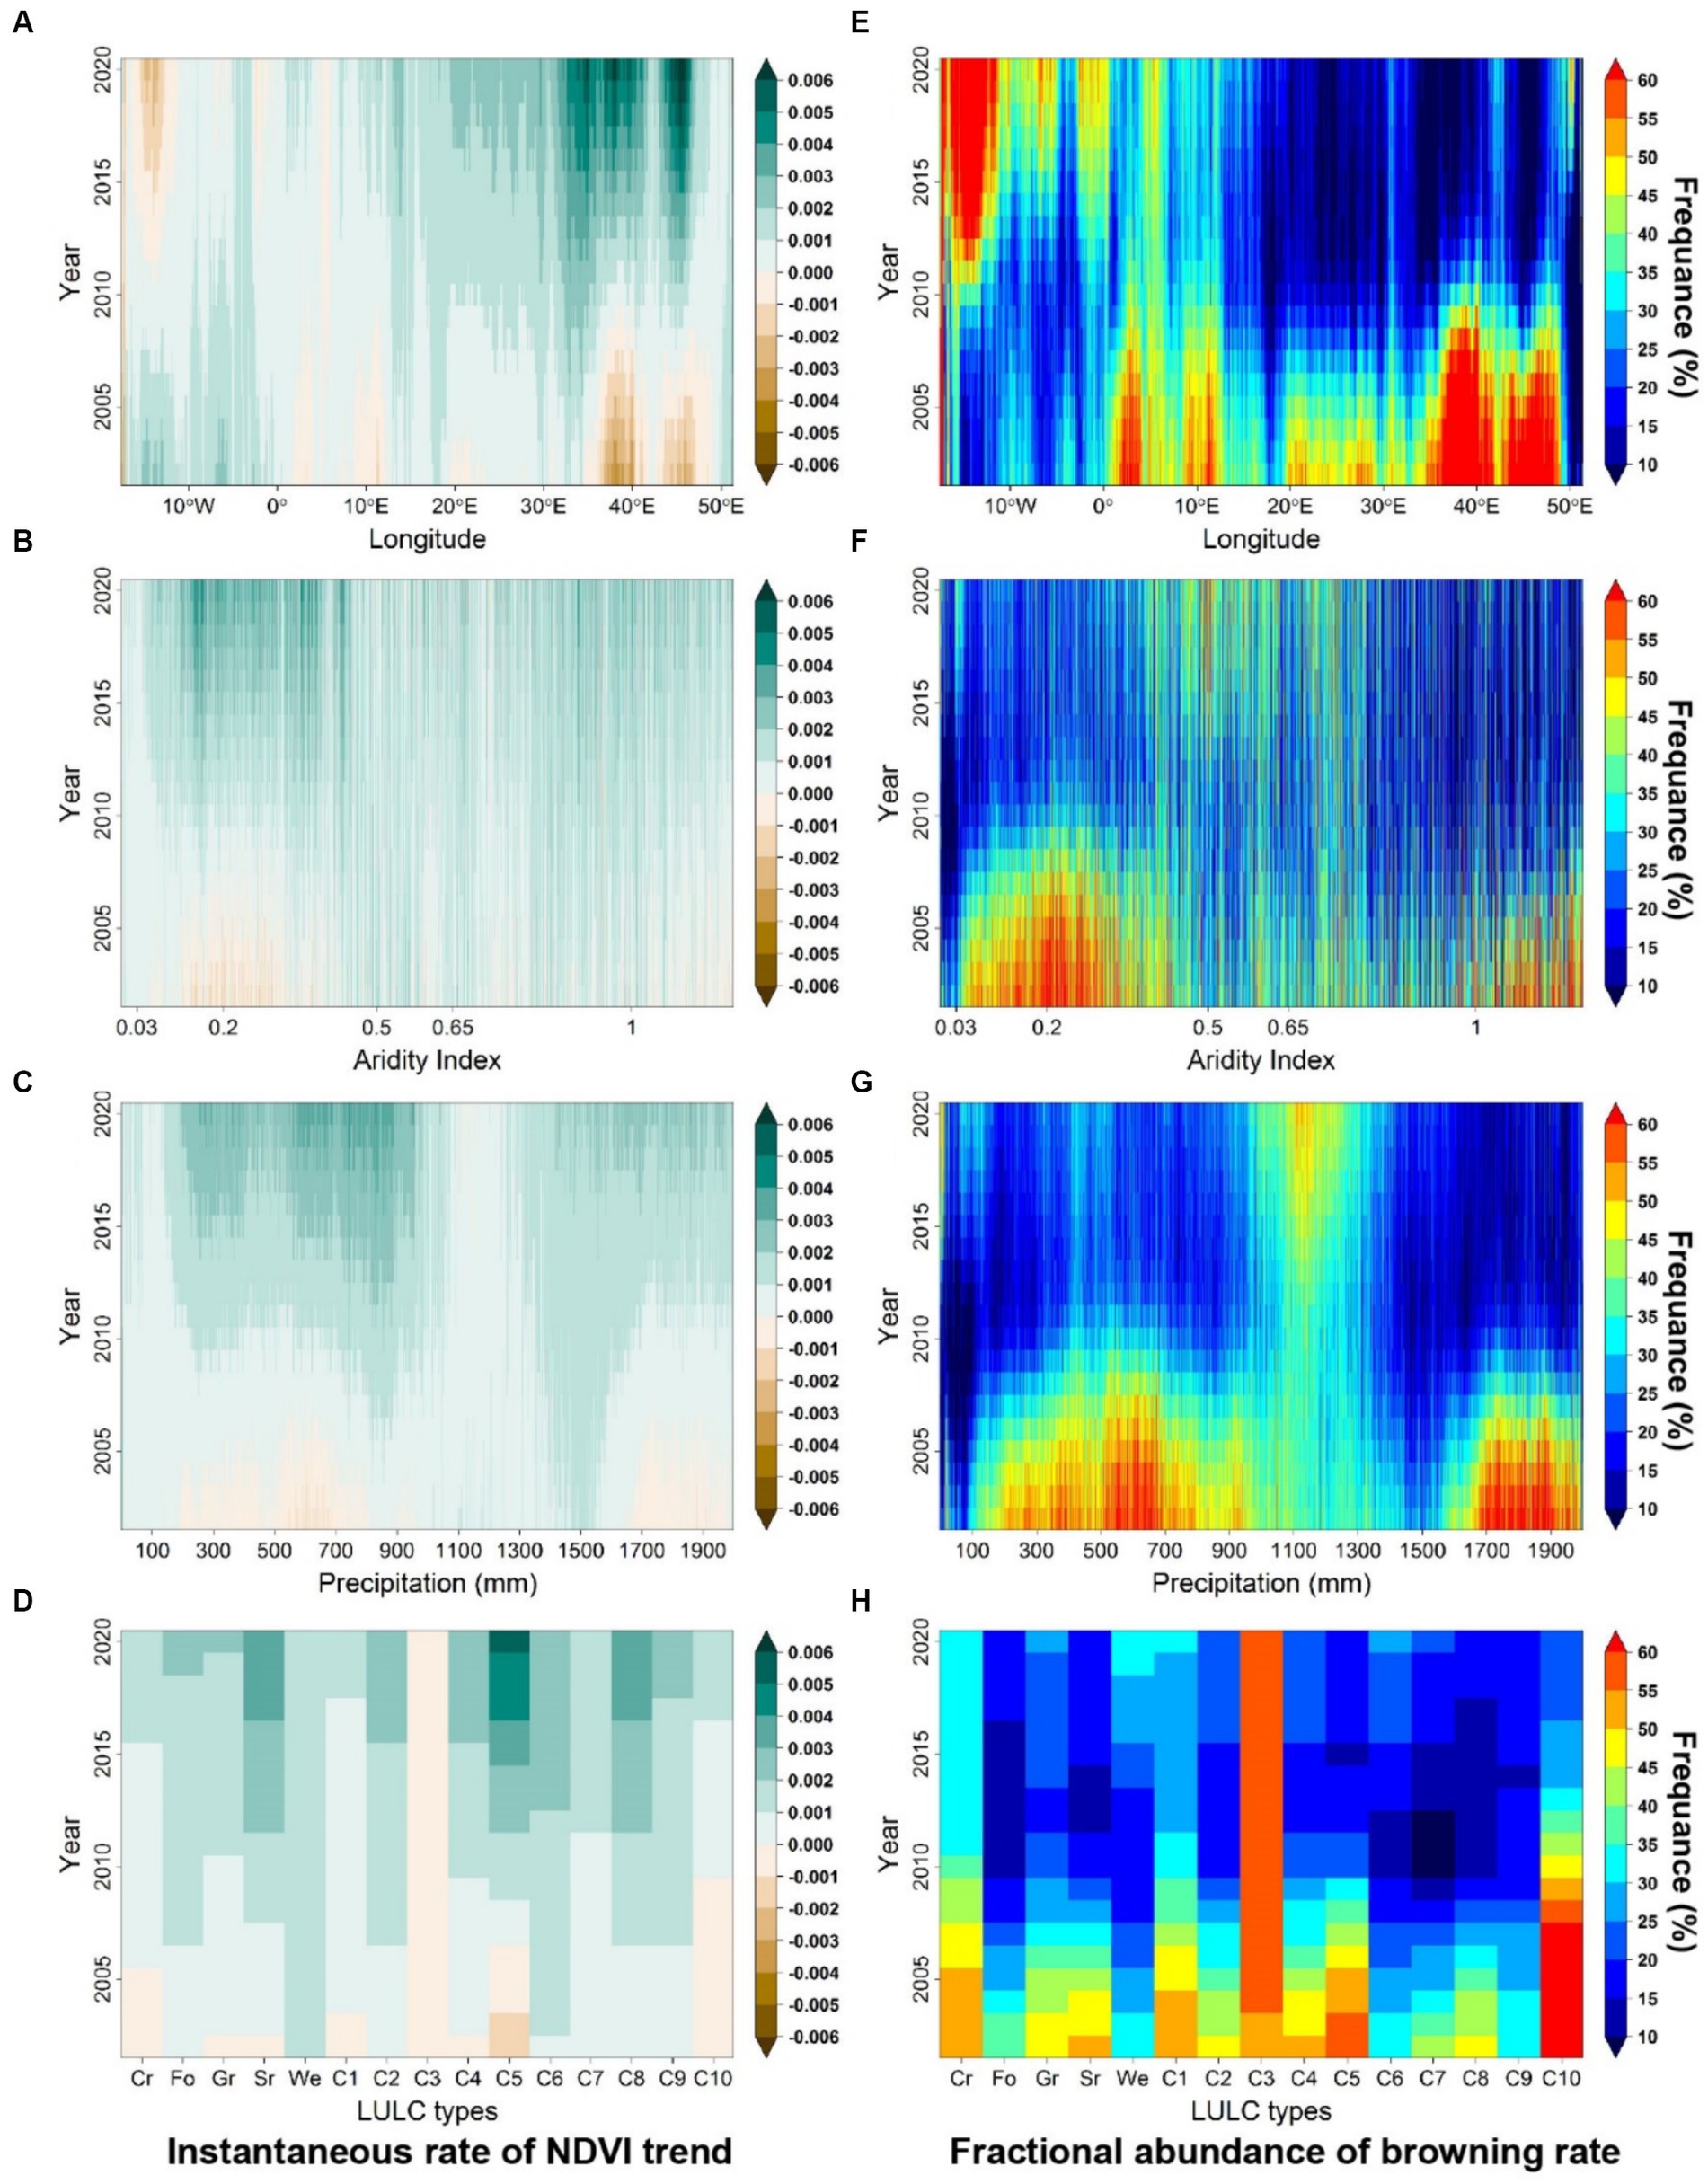
Figure 6. Evolution of NDVI trends along different geographical gradients. The left column (A–D) shows temporal variations in the mean instantaneous rate of NDVI trend in each longitude bin, aridity index gradient, precipitation gradient and LULC type, respectively. The right column (E–H) shows temporal variations in the fractional abundance of browning rate in each longitude bin, aridity index gradient, precipitation gradient and LULC type, respectively. Aridity conditions can be identified according to AI values: (i) hyper-arid (AI < 0.03), (ii) arid (0.03 ≤ AI < 0.2), (iii) semi-arid (0.2 ≤ AI < 0.5), (iv) dry sub-humid (0.5 ≤ AI < 0.65), and (v) humid (AI ≥0.65). Cr, Fo, Gr, Sr. and We denote unchanged LULC types, i.e., Cropland, Forest, Grassland, Shrubland and Wetland, respectively. C1 to C10 denote changed LULC types, i.e., Cropland gain with Forest loss (C1), Cropland gain with Grassland loss(C2), Cropland gain with Shrubland loss (C3), Forest gain with Cropland loss (C4), Forest gain with Grassland loss (C5), Forest gain with Shrubland loss (C6), Grassland gain with Bareland loss (C7), Shrubland gain with Cropland loss (C8), Shrubland gain with Forest loss (C9), and Bareland gain with Grassland loss (C10).
In this study, the pixel-wide RF algorithm was used to model the relationships between the observed secular trends in NDVI and in climatic variables. The cross-validation of the RF relationships showed that the estimated secular trends in NDVI were in good agreement with the observed secular trends in NDVI (Figure 7). The area with a R2 value greater than 0.95 and a low RMSE value (RMSE <0.005) covered more than 95% of the study area. This suggested that the relationships established using the RF model were reliable, and it was appropriate to use the SHAP method to interpret the RF models and identify the dominant climatic drivers. These considerations may not fully apply to areas characterized by intense human activity and substantial changes in LULC, as these regions showed relatively low R2 values and high RMSE values (Supplementary Figure S1; Figure 7).
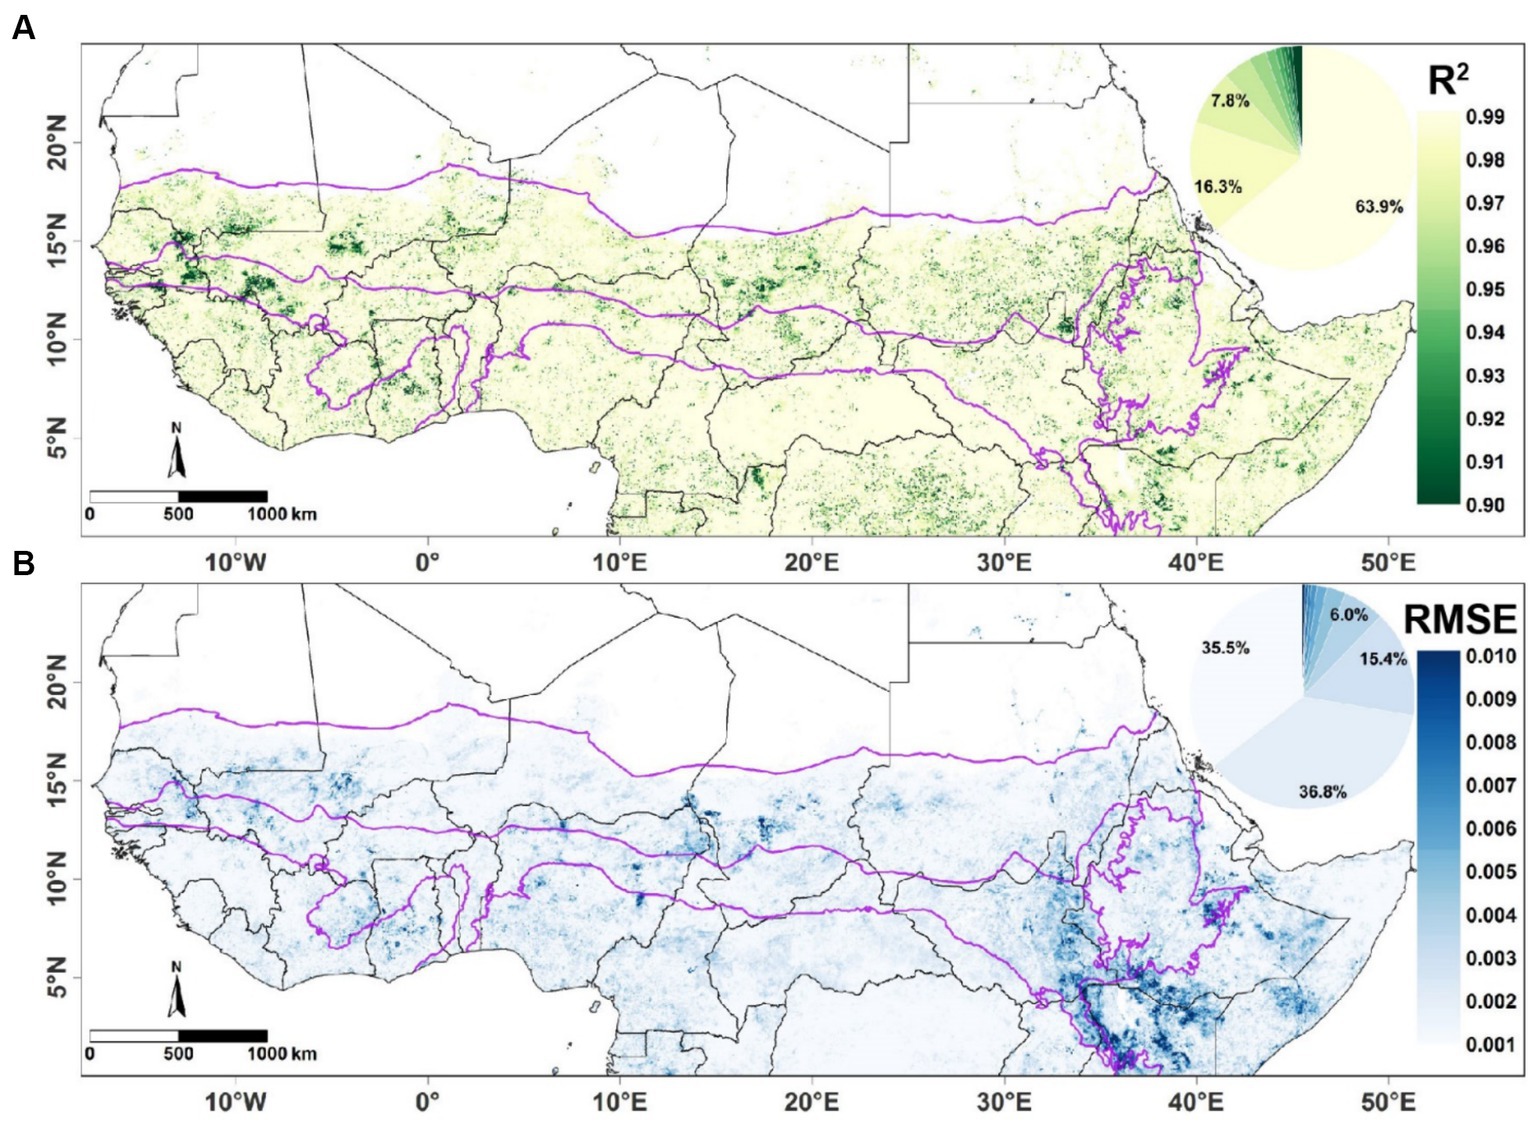
Figure 7. Spatial distribution of (A) determination coefficient (R2) and (B) root mean squared error (RMSE) of the RF model with 5-fold cross-validation for modeling secular trends in NDVI based on secular trends in climatic variables. The inset pie charts show the frequency distribution of the corresponding values.
Overall, the results based on explainable machine learning indicated that temperature and precipitation were the most important climatic factors controlling the evolution of NDVI trends and varied across the Sahel-Sudan-Guinea region, accounting for 31.7 and 27.3% of the study area, respectively (Figures 8A,B). Rising temperature had dominant contributions to the monotonic greening and to the browning-to-greening transition in the large Guinean and southeastern Sudanian sub-regions (Figures 8A,B; Supplementary Figure S4B). Increasing precipitation was the major climatic driver of monotonic greening and of the browning-to-greening transition in the Saharan, Sahel belt, southeastern Sudanian and central Dry Horn of Africa sub-regions, while decreasing precipitation had dominant contributions to the greening-to-browning transition in the western Sudanian sub-region (Figure 8A). Our results suggest that secular trends in solar radiation explained nearly 23% of the NDVI trends. Decreasing solar radiation primarily drove monotonic greening and browning-to-greening transition in the northern Sahel, eastern Dry Horn of Africa and central Wet Highlands, whereas the monotonic greening and the browning-to-greening transition in some areas of the Congo basin were primarily driven by increasing solar radiation. Increasing VPD was a dominant driver of the greening-to-browning transition in some areas of West Africa, while the decreasing VPD was a dominant driver of the browning-to-greening transition in some areas of the Wet Highlands and Dry Horn of Africa sub-regions. It should be noted that the dominant climatic drivers identified the SHAP method without considering direction had a similar spatial pattern as those detected by the impurity relative importance method applied in combination with RF (Supplementary Figure S5). We also performed the driver analysis after removing the areas with high human activity intensity. The results showed that the area percentages of dominant climatic drivers for vegetation dynamics after removing the areas with high human activity intensity were very close to that of without removing the areas with high human activity intensity (Figure 8; Supplementary Figure S6).
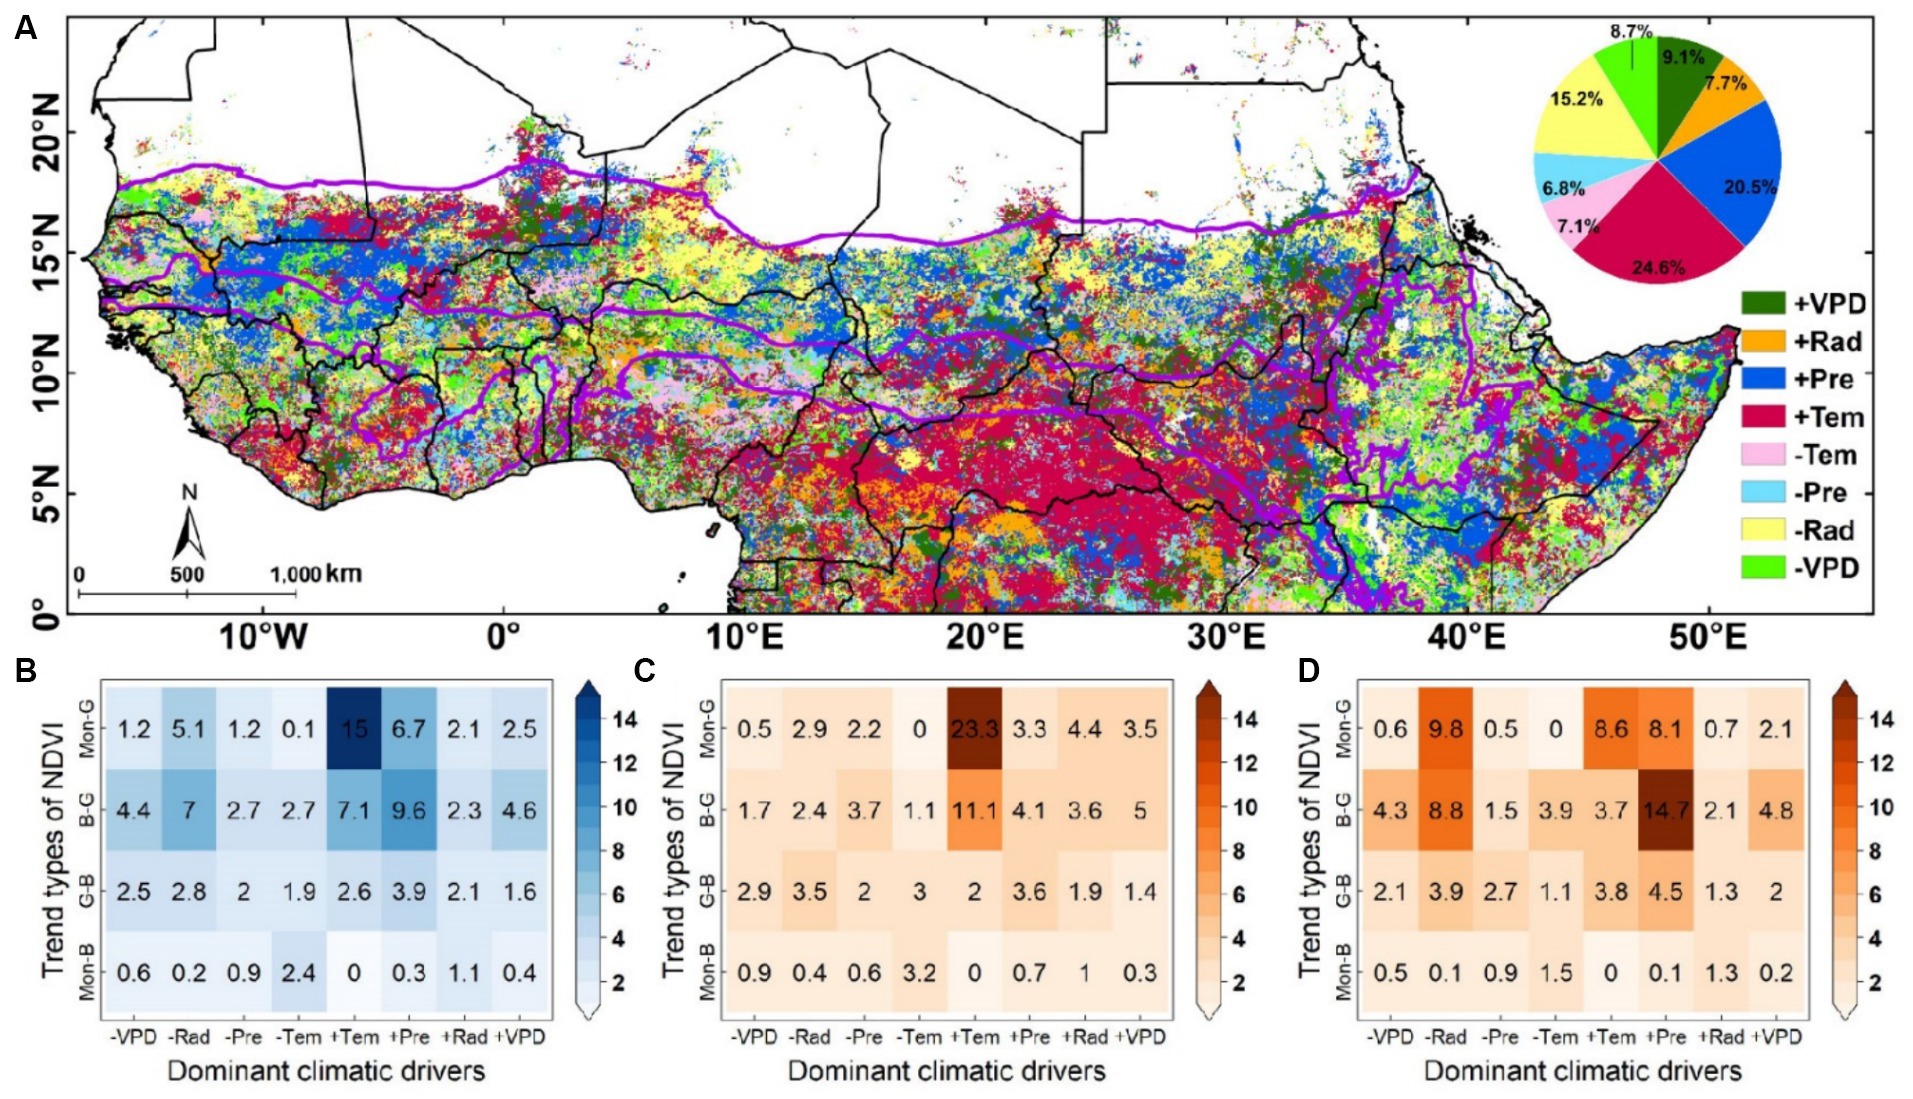
Figure 8. Spatial pattern of dominant climatic drivers of secular trends in NDVI based on the RF and SHAP methods during 2001–2020. (A) Spatial distribution of dominant climatic drivers of secular trends in NDVI. A prefix ‘+’ of the climatic drivers indicates an overall increase (decrease) in the climatic variable causing an overall increase (decrease) in NDVI, while ‘−’ indicates an overall increase (decrease) in climatic variable trend causing an overall decrease(increase) in NDVI. (B) Fractional abundance of trend types associated with dominant climatic drivers across the study area. (C,D) Same as (B), but for the Guinean and Sahel sub-regions, respectively.
To demonstrate the relationship between the trend reversals in NDVI and climate on the continental side closer to the ocean, we investigated the evolution of climatic variables in each longitude bin. The results showed that the timing of trend reversals in precipitation and in VPD in the western region (west of 0° longitude) and eastern region (east of 35°E) were very close to those in NDVI (Figures 6A,B, 9). Furthermore, these regions experienced strong evolution correlations between precipitation, VPD and NDVI before and after the breakpoints. These remarkable spatial correlations of trends in climatic variables and in NDVI before and after the breakpoints suggest that the trend reversals in vegetation greenness at sub-continental scale are largely controlled by precipitation and VPD, which may be associated with large-scale ocean-induced anomalies. In summary, the evolution of climatic variables and pixel-scale explainable machine learning provide more direct insights into the underlying drivers of vegetation greenness evolution.
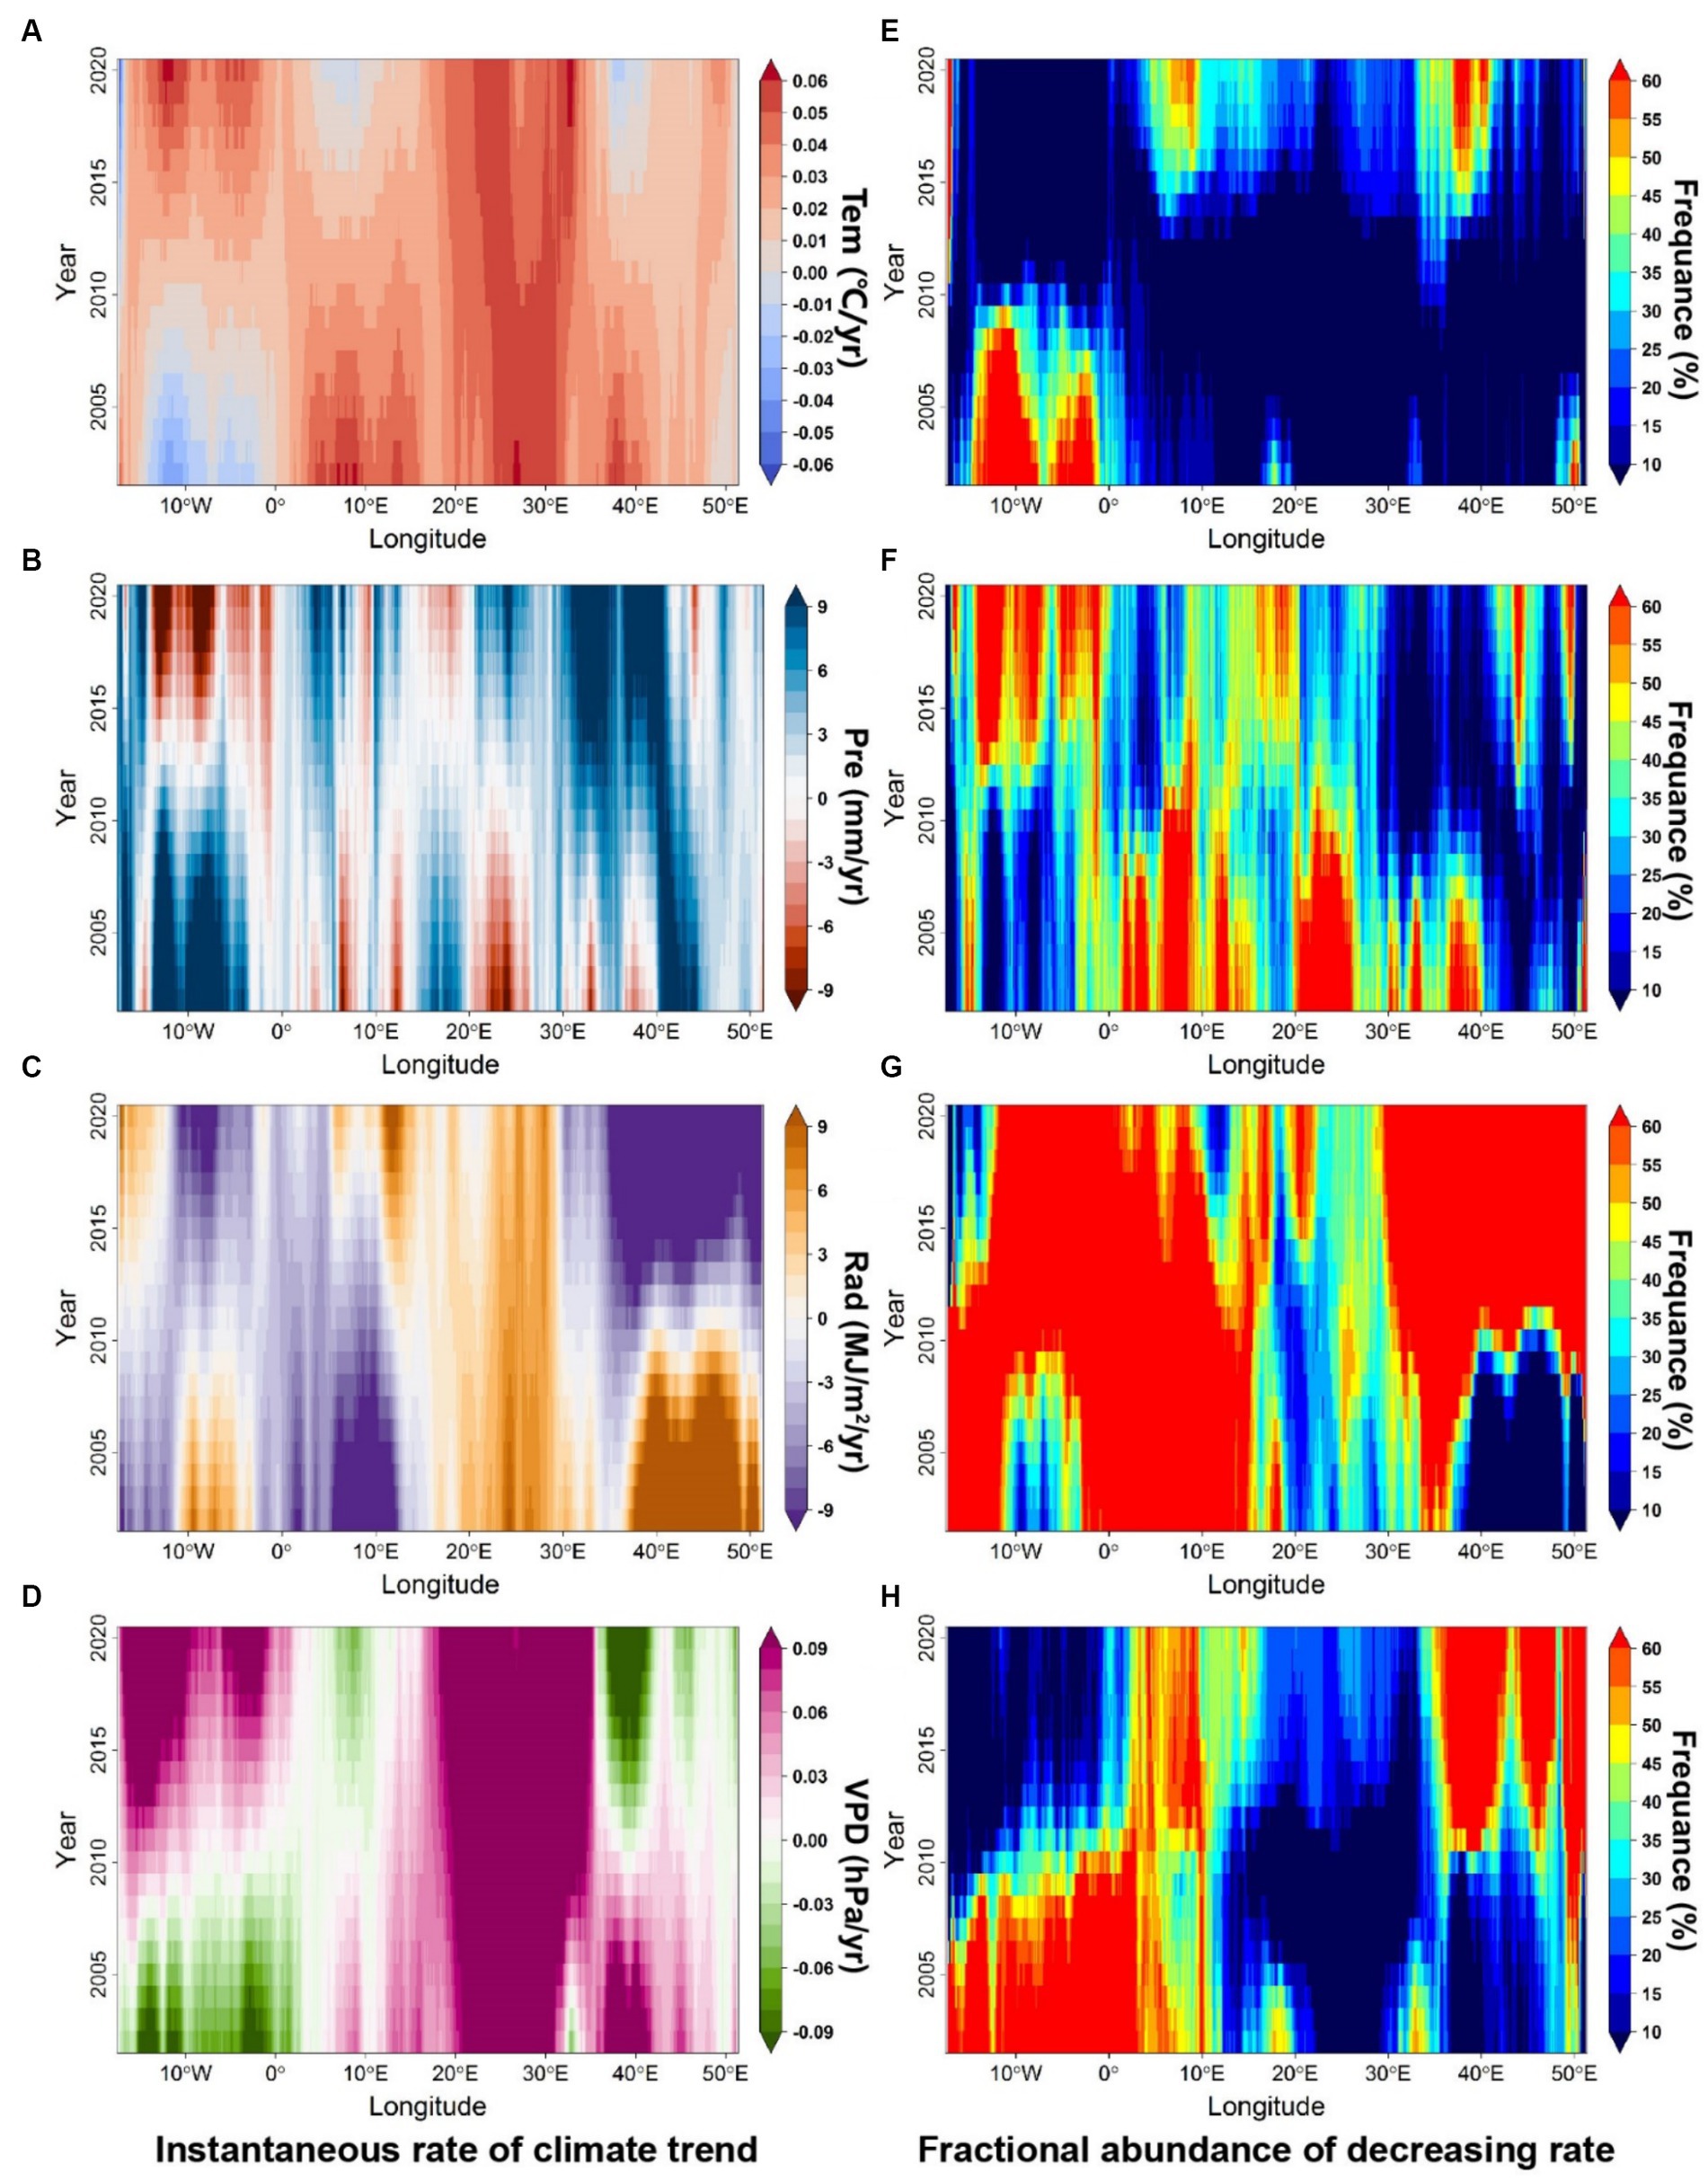
Figure 9. Evolution of climatic variables along longitude gradients. The left column (A–D) shows temporal variations in the mean instantaneous rate of temperature (Tem), precipitation (Pre), solar radiation (Rad) and vapor pressure deficit (VPD) in each longitude bin, respectively. The right column (E–H) shows temporal variations in the fractional abundance of the decreasing rate of Tem, Pre, Rad and VPD in each longitude bin, respectively.
In this study, the ensemble empirical mode decomposition (EEMD) method was applied to capture the nonlinear trends in NDVI and reveal their evolution in the Sahel-Sudan-Guinea region during 2001–2020. Although both Theil-Sen and the EEMD methods showed overall greening in the region, the EEMD is more suitable to characterize non-stationary time series with trend reversals by separating oscillatory components with decreasing frequencies and a residual trend component (Wu and Huang, 2009; Ji et al., 2014; Yang et al., 2021). Specifically, a considerable portion of the NDVI trends in West Africa were shown as greening by the Theil-Sen method, but were described as browning in the later years by the EEMD method (Supplementary Figure S2; Figure 4). This cannot be captured by linear trends, especially the decline in NDVI after 2015, because linear trends are only represented as the average state over the entire time series based on the stationarity assumption.
Our study also revealed a noticeable spatio-temporal evolution in NDVI trends, suggesting divergent trends in the western and eastern Sahel-Sudan-Guinea regions. The results showed that the main feature of vegetation greenness trends was trend reversals (i.e., greening-to-browning transition and browning-to-greening transition), accounting approximately 60% of the study area (Figures 5, 6). The greening-to-browning transition mainly occurred in West Africa, extending from arid areas with low precipitation to humid areas with high precipitation. Browning in these regions mostly occurred after 2011, which differs from the findings of other global or regional greening trend studies for the similar period but using linear trend methods (Chen et al., 2019; Piao et al., 2020; Jiang et al., 2022; Zeng et al., 2023). Despite an overall vegetation greening in the entire Sahel-Sudan-Guinea region during 2001–2020, e.g., an overall positive accumulated variation and positive instantaneous rate of NDVI during different periods (Figures 4A–H), the most noticeable greening trend was observed in southern Sahel and East Africa, and was characterized by a trend type of browning-to-greening reversal (Figure 5A). The timing of the browning-to-greening transition was mainly around 2008 in the southern Sahel and east of 20°E, covering arid, semi-arid and humid regions. Both secular trends before 2008 using the EEMD and many previous studies using linear trends (Hoscilo et al., 2015; Piao et al., 2020; Jiang et al., 2022; Zeng et al., 2023) support the browning in some sub-regions of East Africa, but only a few studies focused on the browning-to-greening transition after 2008 in these regions (Barvels and Fensholt, 2021). These results clearly indicated that vegetation greenness in the Sahel-Sudan-Guinea region showed trend reversals during 2001–2020, confirming that vegetation dynamics was nonlinear. Our results support the fact that sustained greening is occurring in the northern Sahel belt, Central African Republic, and South Sudan, which is consistent with the trends evaluated in previous studies using different datasets and different time periods (Cho et al., 2015; Hoscilo et al., 2015; Leroux et al., 2017; Chen et al., 2019; Piao et al., 2020; Zeng et al., 2023). We also analyzed the dynamics of woody vegetation using tree cover data derived from the MODIS Vegetation Continuous Fields product, confirming the continued encroachment of woody vegetation into mesic savannas and drylands reported in previous studies (Devine et al., 2017; Venter et al., 2018). In contrast, sustained browning is clustered in central West Africa and Uganda, and generally overlaps with agricultural lands. It is likely associated with extensive agricultural activities and repeated fires (Leroux et al., 2017; Jiang et al., 2022; Zeng et al., 2023).
In this study, we applied explainable machine learning methods, i.e., RF and SHAP, to identify dominant climatic drivers of vegetation greenness trends. Generally, these methods provide valuable insights into the reasons and causality behind the evolution of vegetation greenness, which is highly heterogeneous across the Sahel-Sudan-Guinea region. Notably, previous studies on the analysis of climatic driver of vegetation greenness trends in this region have usually focused on a few sites or small areas (Dardel et al., 2014; Rishmawi and Prince, 2016; Tian et al., 2016; Leroux et al., 2017). As a result, the findings on the relationship between climatic variables and vegetation greenness were less general and representative. This limitation would be somewhat mitigated in our study, as a pixel-wise analysis was performed throughout the arid and humid areas of the region.
We found that temperature and precipitation were the most important climatic drivers among selected potential climatic factors controlling the NDVI evolution. Although the regional-scale interaction between changes in temperature and vegetation is less well understood for Africa, we observed that increasing temperature dominated the greening in the tropical humid areas of central Africa. The theory of optimal temperature for ecosystems would provide an explanation (Medlyn et al., 2002; Lloyd and Farquhar, 2008; Niu et al., 2012). The theory suggests that the photosynthetic capacity of vegetation increases with temperature up to an optimal temperature, but decreases sharply above this optimal temperature. A recent study shows that the average maximum temperature during the growing season in most land areas is still lower than the optimal temperature for vegetation productivity (Huang et al., 2019), indicating that temperature has not yet had a significant inhibitory effect on photosynthetic activity. In addition, higher temperature combined with elevated CO2 concentration can improve the water use efficiency of ecosystems within a certain temperature threshold, thereby stimulating vegetation growth (Lu et al., 2016; Devine et al., 2017). Changes in precipitation have been proposed as the main driving climatic driver of greening in dryland ecosystems, especially in the Sahel, confirming that the water availability is a critical constraint on vegetation growth in arid regions (Fensholt and Rasmussen, 2011; Fensholt et al., 2017; Kusserow, 2017). In fact, the observed greening in the Sahel correlates with increased precipitation due to the northward shift of the West African Monsoon system, as reported by regional climate models and remote sensing precipitation data (Ramel et al., 2006; Cook and Vizy, 2019).
Our results also revealed that trends in vegetation greenness with different dry/wet conditions respond differently to solar radiation and vapor pressure deficit. Solar radiation and vapor pressure deficit are more likely to be negatively correlated with vegetation greenness trends in arid regions, while they may be positively correlated in humid regions. In arid regions, grasslands and low shrubs are the major components of vegetation and are highly sensitive to water availability. An increase in solar radiation or VPD often leads to an increase in evapotranspiration, which can exacerbate vegetation water stress and negatively affect vegetation growth (Cheng and Huang, 2016; Berg and Sheffield, 2018; Yuan et al., 2019; Yang et al., 2023). In addition, increased VPD is expected to limit vegetation photosynthesis at the leaf scale by decreasing stomatal conductance and increasing non-photochemical quenching (Flexas et al., 2002; Yuan et al., 2019; Fu et al., 2022). Understanding these key mechanisms will greatly contribute to the protection of vulnerable areas with limited water supply under a changing climate. In contrast, humid areas dominated by woody vegetation have a more abundant water availability. The increased solar radiation and VPD could stimulate the enhancement of vegetation photosynthesis by increasing light energy supply (Mercado et al., 2009; Wild, 2009) and by accelerating the replacement of old leaves (Green et al., 2020), respectively, thereby promoting vegetation growth.
Essentially, trend reversals in vegetation greenness (i.e., greening-to-browning and browning-to-greening) occurred predominantly closer to the continental side adjacent to the ocean. The timing of these reversals increased with the distance from the ocean, particularly along the North Atlantic coast of West Africa (Figures 5A,C,D). At the same time, selected climatic variables, especially precipitation and VPD, exhibited distinct trend reversals in West Africa along the Atlantic and in East Africa along the Red Sea-Indian Ocean, showing strong correlations with vegetation greenness trends before and after the breakpoints (Figures 5, 6, 9). These results suggest that large-scale ocean-induced climate changes have triggered trend reversals in vegetation greenness at a sub-continental scale. Actually, precipitation variability in West Africa is regulated by competing mechanisms related to sea surface temperature (SST) forcing: equatorial Atlantic SST gradients and North Atlantic SST gradients (Nicholson, 2013; Rodríguez-Fonseca et al., 2015). Specifically, tropical warming leads to drought, while North Atlantic warming promotes an increase in precipitation. In comparison, the trend reversals in precipitation (decrease-to-increase) and VPD (increase-to-decrease) were likely the dominant drivers of this browning-to-greening reversal in the East Africa during 2001–2020 based on the results of explainable machine learning driver analysis (Figure 8A) and sub-continental evolution of climate factors (Figures 9B,D,F,H). This would be linked the Indian Ocean Dipole (IOD) and the Madden-Julian Oscillation (MJO), which are driven by changes in SST in the Indian Ocean alter regional atmospheric circulation and dry-wet transitions in East Africa (Zaitchik, 2017; Wainwright et al., 2021; Palmer et al., 2023). The IOD consists of differences in the SST anomaly between the western (50°E-70°E, 10°S-10°N) and the eastern (90°E-110°E, 10°S-0°) Indian Ocean, while the MJO involves the eastward propagation of enhanced regional convection across the tropics. The positive IOD (a SST anomaly difference of at least +0.4°C between the warmer west and the cooler east for at least 3 months) and stronger MJO are linked with a wetter climate, while the negative IOD (a sustained negative SST anomaly difference of at least 0.4°C) and weaker MJO are associated with dryer climate.
In summary, our results provide empirical evidence of the impact of climatic drivers on the evolution of vegetation greenness in the Sahel-Sudan-Guinea region. It can be inferred that the terrestrial ecosystems are experiencing a pronounced increase in sensitivity to climate change and are becoming more heterogeneous and more complex in space and time under global warming. In addition, the climatic drivers of ecosystems may be more uncertain due to land changes associated with direct human activities, including agricultural expansion and management, grazing, deforestation, and reforestation. The use of RF and the SHAP methods could capture the relationships between climatic variables and NDVI, but these relationships may not align with physical consistency, requiring cautious interpretation of their results. In the future, it is crucial to establish a feasible benchmark to evaluate the interpretability of explainable machine learning (Huang et al., 2023). Thus, regular monitoring and rigorous assessment related to many other potential human-environment drivers (Piao et al., 2020; Abel et al., 2021, 2023; Zeng et al., 2023) at fine spatial and temporal scales are still needed to tease out the intricate nuances and fully understand the complex dynamics involved.
In this study, we first applied the EEMD method to detect the evolution of vegetation greenness using EO time series in the Sahel-Sudan-Guinea region during 2001–2020, and then identified its dominant climatic drivers using an explainable machine learning framework. Our study revealed an overall vegetation greening but a significant nonlinear spatio-temporal evolution characteristic over the region. Trend reversals, i.e., browning-to-greening and greening-to-browning, were dominant in approximately 60% of the study area. The browning-to-greening reversal was primarily observed in the southern Sahel, Congo Basin north of the Equator, and East Africa, with a breakpoint around 2008, while the greening-to-browning reversal was mainly observed in West Africa, with a breakpoint around 2011. Sustained greening trends mainly occurred in northern Sahel, Central African Republic and South Sudan, while sustained browning trends clustered in central West Africa and Uganda, mainly in agricultural areas. We highlighted the performance of the EEMD method in detecting long-term vegetation dynamics, as it has the ability to adaptively capture the evolution of time-varying trends and potential nonlinear trend reversals, in contrast to linear trend methods. Furthermore, an explainable machine learning framework, i.e., the combination of RF and the SHAP method, could robustly model and reveal the relationships between the observed trends in NDVI and in climatic variables, thereby identifying the dominant climatic drivers of vegetation greenness dynamics. The results showed that air temperature and precipitation were the most important climatic drivers controlling the vegetation greenness trends across the Sahel-Sudan-Guinea region. Solar radiation and vapor pressure deficit were more likely to be negatively correlated with vegetation greenness trends in arid areas, while they could be positively correlated in humid regions. We also found that large-scale climate changes induced by sea surface temperature (SST) change had strong relationships with trend reversals in vegetation greenness at the sub-continental scale. These findings advanced our overall understanding of vegetation dynamics in response to climate change in the Sahel-Sudan-Guinea region.
The datasets presented in this study can be found in online repositories. The names of the repository/repositories and accession number(s) can be found in the article/Supplementary material.
YZ: Conceptualization, Data curation, Formal analysis, Methodology, Software, Validation, Visualization, Writing – original draft, Writing – review & editing. LJ: Conceptualization, Funding acquisition, Methodology, Project administration, Resources, Supervision, Validation, Visualization, Writing – review & editing. MM: Conceptualization, Funding acquisition, Methodology, Project administration, Resources, Supervision, Validation, Visualization, Writing – review & editing. MJ: Methodology, Validation, Visualization, Writing – review & editing. CZ: Methodology, Validation, Visualization, Writing – review & editing. AB: Investigation, Visualization, Writing – review & editing. YL: Investigation, Visualization, Writing – review & editing.
The author(s) declare financial support was received for the research, authorship, and/or publication of this article. This work was jointly supported by the projects funded by the Open Research Program of the International Research Center of Big Data for Sustainable Development Goals (grant no. CBAS2023ORP05), the Key Collaborative Research Program of the Alliance of International Science Organizations (grant no. ANSO-CR-KP-2022-02), the MOST High Level Foreign Expert Program (grant no. G2022055010L) and the Chinese Academy of Sciences President’s International Fellowship Initiative (grant no. 2020VTA0001).
The authors would like to extend special thanks to Professor Fei Ji from College of Atmospheric Sciences, Lanzhou University, for his helpful comments on EEMD method.
The authors declare that the research was conducted in the absence of any commercial or financial relationships that could be construed as a potential conflict of interest.
The handling editor NC declared a shared affiliation with the authors at the time of review.
All claims expressed in this article are solely those of the authors and do not necessarily represent those of their affiliated organizations, or those of the publisher, the editors and the reviewers. Any product that may be evaluated in this article, or claim that may be made by its manufacturer, is not guaranteed or endorsed by the publisher.
The Supplementary material for this article can be found online at: https://www.frontiersin.org/articles/10.3389/ffgc.2024.1416373/full#supplementary-material
1. ^https://e4ftl01.cr.usgs.gov/MOLT/MOD09Q1.061/
2. ^https://data.chc.ucsb.edu/products/CHIRPS-2.0/
3. ^https://doi.org/10.24381/cds.68d2bb30
4. ^http://maps.elie.ucl.ac.be/CCI/viewer/download.php
5. ^https://sedac.ciesin.columbia.edu/data/set/lulc-human-modification-terrestrial-systems
6. ^https://www.worldclim.org/data/worldclim21.html
7. ^https://srtm.csi.cgiar.org/
8. ^https://figshare.com/articles/dataset/Global_Aridity_Index_and_Potential_Evapotranspiration_ET0_Climate_Database_v2/7504448/3
Abdi, A. M., Boke-Olén, N., Tenenbaum, D. E., Tagesson, T., Cappelaere, B., and Ardö, J. (2017). Evaluating water controls on vegetation growth in the semi-arid Sahel using field and earth observation data. Remote Sens. 9:294. doi: 10.3390/rs9030294
Abel, C., Abdi, A. M., Tagesson, T., Horion, S., and Fensholt, R. (2023). Contrasting ecosystem vegetation response in global drylands under drying and wetting conditions. Glob. Change Biol. 29, 3954–3969. doi: 10.1111/gcb.16745
Abel, C., Horion, S., Tagesson, T., De Keersmaecker, W., Seddon, A. W. R., Abdi, A. M., et al. (2021). The human-environment nexus and vegetation-rainfall sensitivity in tropical drylands. Nat. Sustain. 4, 25–32. doi: 10.1038/s41893-020-00597-z
Ahmedou, O. C. A., Nagasawa, R., Osman, A. E., and Hattori, K. (2008). Rainfall variability and vegetation dynamics in the Mauritanian Sahel. Clim. Res. 38, 75–81. doi: 10.3354/cr00776
Barvels, E., and Fensholt, R. (2021). Earth observation-based detectability of the effects of land management programmes to counter land degradation: a case study from the highlands of the Ethiopian plateau. Remote Sens. 13:1297. doi: 10.3390/rs13071297
Berdugo, M., Gaitán, J. J., Delgado-Baquerizo, M., Crowther, T. W., and Dakos, V. (2022). Prevalence and drivers of abrupt vegetation shifts in global drylands. Proc. Natl. Acad. Sci. USA 119:e2123393119. doi: 10.1073/pnas.2123393119
Berg, A., and Sheffield, J. (2018). Climate change and drought: the soil moisture perspective. Curr. Clim. Chang. Rep. 4, 180–191. doi: 10.1007/s40641-018-0095-0
Chen, C., Park, T., Wang, X., Piao, S., Xu, B., Chaturvedi, R. K., et al. (2019). China and India lead in greening of the world through land-use management. Nat. Sustain. 2, 122–129. doi: 10.1038/s41893-019-0220-7
Cheng, S., and Huang, J. (2016). Enhanced soil moisture drying in transitional regions under a warming climate. J. Geophys. Res.-Atmos. 121, 2542–2555. doi: 10.1002/2015JD024559
Cho, J., Lee, Y.-W., and Lee, H.-S. (2015). The effect of precipitation and air temperature on land-cover change in the Sahel. Water Environ. J. 29, 439–445. doi: 10.1111/wej.12118
Cook, K. H., and Vizy, E. K. (2019). Contemporary climate change of the African monsoon systems. Curr. Clim. Chang. Rep. 5, 145–159. doi: 10.1007/s40641-019-00130-1
D'Adamo, F., Ogutu, B., Brandt, M., Schurgers, G., and Dash, J. (2021). Climatic and non-climatic vegetation cover changes in the rangelands of Africa. Glob. Planet. Change 202:103516. doi: 10.1016/j.gloplacha.2021.103516
Dardel, C., Kergoat, L., Hiernaux, P., Mougin, E., Grippa, M., and Tucker, C. J. (2014). Re-greening Sahel: 30 years of remote sensing data and field observations (Mali, Niger). Remote Sens. Environ. 140, 350–364. doi: 10.1016/j.rse.2013.09.011
de Jong, R., and de Bruin, S. (2012). Linear trends in seasonal vegetation time series and the modifiable temporal unit problem. Biogeosciences 9, 71–77. doi: 10.5194/bg-9-71-2012
de Jong, R., Verbesselt, J., Schaepman, M. E., and de Bruin, S. (2012). Trend changes in global greening and browning: contribution of short-term trends to longer-term change. Glob. Change Biol. 18, 642–655. doi: 10.1111/j.1365-2486.2011.02578.x
Devine, A. P., McDonald, R. A., Quaife, T., and Maclean, I. M. (2017). Determinants of woody encroachment and cover in African savannas. Oecologia 183, 939–951. doi: 10.1007/s00442-017-3807-6
Endris, H. S., Lennard, C., Hewitson, B., Dosio, A., Nikulin, G., and Artan, G. A. (2019). Future changes in rainfall associated with ENSO, IOD and changes in the mean state over eastern Africa. Clim Dynam 52, 2029–2053. doi: 10.1007/s00382-018-4239-7
Epule, E. T., Peng, C., Lepage, L., and Chen, Z. (2014). The causes, effects and challenges of Sahelian droughts: a critical review. Reg. Envir. Chang. 14, 145–156. doi: 10.1007/s10113-013-0473-z
Feng, X., Fu, B., Zhang, Y., Pan, N., Zeng, Z., Tian, H., et al. (2021). Recent leveling off of vegetation greenness and primary production reveals the increasing soil water limitations on the greening earth. Sci. Bull. 66, 1462–1471. doi: 10.1016/j.scib.2021.02.023
Fensholt, R., Mbow, C., Brandt, M., and Rasmussen, K. (2017). Desertification and Re-Greening of the Sahel. Oxford: Oxford University, Oxford Research Encyclopedia of Climate Science.
Fensholt, R., and Rasmussen, K. (2011). Analysis of trends in the Sahelian 'rain-use efficiency' using GIMMS NDVI, RFE and GPCP rainfall data. Remote Sens. Environ. 115, 438–451. doi: 10.1016/j.rse.2010.09.014
Flexas, J., Escalona, J. M., Evain, S., Gulias, J., Moya, I., Osmond, C. B., et al. (2002). Steady-state chlorophyll fluorescence (fs) measurements as a tool to follow variations of net CO2 assimilation and stomatal conductance during water-stress in C3 plants. Physiol. Plant. 114, 231–240. doi: 10.1034/j.1399-3054.2002.1140209.x
Fu, Z., Ciais, P., Prentice, I. C., Gentine, P., Makowski, D., Bastos, A., et al. (2022). Atmospheric dryness reduces photosynthesis along a large range of soil water deficits. Nat. Commun. 13:989. doi: 10.1038/s41467-022-28652-7
Fu, B., Stafford-Smith, M., Wang, Y., Wu, B., Yu, X., Lv, N., et al. (2021). The global-DEP conceptual framework-research on dryland ecosystems to promote sustainability. Curr. Opin. Environ. Sustain. 48, 17–28. doi: 10.1016/j.cosust.2020.08.009
Green, J. K., Ballantyne, A., Abramoff, R., Gentine, P., Makowski, D., and Ciais, P. (2022). Surface temperatures reveal the patterns of vegetation water stress and their environmental drivers across the tropical Americas. Glob. Change Biol 28, 2940–2955. doi: 10.1111/gcb.16139
Green, J. K., Berry, J., Ciais, P., Zhang, Y., and Gentine, P. (2020). Amazon rainforest photosynthesis increases in response to atmospheric dryness. Sci. Adv. 6:eabb7232. doi: 10.1126/sciadv.abb7232
Ham, Y.-G., Kim, J.-H., Min, S.-K., Kim, D., Li, T., Timmermann, A., et al. (2023). Anthropogenic fingerprints in daily precipitation revealed by deep learning. Nature 622, 301–307. doi: 10.1038/s41586-023-06474-x
Hasan, M. M., Young, G. J., Shi, J., Mohite, P., Young, L. D., Weiner, S. G., et al. (2021). A machine learning based two-stage clinical decision support system for predicting patients’ discontinuation from opioid use disorder treatment: retrospective observational study. BMC Med Inform Decis Mak 21, 1–21. doi: 10.1186/s12911-021-01692-7
Hawinkel, P., Swinnen, E., Lhermitte, S., Verbist, B., Van Orshoven, J., and Muys, B. (2015). A time series processing tool to extract climate-driven interannual vegetation dynamics using ensemble empirical mode decomposition (EEMD). Remote Sens. Environ. 169, 375–389. doi: 10.1016/j.rse.2015.08.024
Herrmann, S. M., Anyamba, A., and Tucker, C. J. (2005). Recent trends in vegetation dynamics in the African Sahel and their relationship to climate. Glob. Environ. Change-Human Policy Dimens. 15, 394–404. doi: 10.1016/j.gloenvcha.2005.08.004
Herrmann, S. M., Brandt, M., Rasmussen, K., and Fensholt, R. (2020). Accelerating land cover change in West Africa over four decades as population pressure increased. Commun. Earth Environ. 1:53. doi: 10.1038/s43247-020-00053-y
Hoscilo, A., Balzter, H., Bartholomé, E., Boschetti, M., Brivio, P. A., Brink, A., et al. (2015). A conceptual model for assessing rainfall and vegetation trends in sub-Saharan Africa from satellite data. Int. J. Climatol. 35, 3582–3592. doi: 10.1002/joc.4231
Huang, M., Piao, S., Ciais, P., Peñuelas, J., Wang, X., Keenan, T. F., et al. (2019). Air temperature optima of vegetation productivity across global biomes. Nat. Ecol. Evol. 3, 772–779. doi: 10.1038/s41559-019-0838-x
Huang, N. E., Shen, Z., and Long, S. R. (1999). A new view of nonlinear water waves: the Hilbert spectrum. Annu. Rev. Fluid Mech. 31, 417–457. doi: 10.1146/annurev.fluid.31.1.417
Huang, N. E., Shen, Z., Long, S. R., Wu, M. C., Shih, H. H., Zheng, Q., et al. (1998). The empirical mode decomposition and the Hilbert spectrum for nonlinear and non-stationary time series analysis. Proc. R. Soc. A-Math. Phys. Eng. Sci. 454, 903–995. doi: 10.1098/rspa.1998.0193
Huang, N. E., Wu, M.-L. C., Long, S. R., Shen, S. S. P., Qu, W., Gloersen, P., et al. (2003). A confidence limit for the empirical mode decomposition and Hilbert spectral analysis. Proc. R. Soc. A-Math. Phys. Eng. Sci. 459, 2317–2345. doi: 10.1098/rspa.2003.1123
Huang, F., Zhang, Y., Zhang, Y., Nourani, V., Li, Q., Li, L., et al. (2023). Towards interpreting machine learning models for predicting soil moisture droughts. Environ. Res. Lett. 18:074002. doi: 10.1088/1748-9326/acdbe0
Ji, F., Wu, Z., Huang, J., and Chassignet, E. P. (2014). Evolution of land surface air temperature trend. Nat. Clim. Chang. 4, 462–466. doi: 10.1038/nclimate2223
Jiang, M., Jia, L., Menenti, M., and Zeng, Y. (2022). Understanding spatial patterns in the drivers of greenness trends in the Sahel-Sudano-Guinean region. Big Earth Data 7, 298–317. doi: 10.1080/20964471.2022.2146632
Kaptué, A. T., Prihodko, L., and Hanan, N. P. (2015). On regreening and degradation in Sahelian watersheds. Proc. Natl. Acad. Sci. USA 112, 12133–12138. doi: 10.1073/pnas.1509645112
Kennedy, C. M., Oakleaf, J. R., Theobald, D. M., Baruch-Mordo, S., and Kiesecker, J. (2019). Managing the middle: a shift in conservation priorities based on the global human modification gradient. Glob. Change Biol 25, 811–826. doi: 10.1111/gcb.14549
Kennedy, C. M., Oakleaf, J. R., Theobald, D. M., Baruch-Mordo, S., and Kiesecker, J. (2020). Global Human Modification of Terrestrial Systems. Palisades, New York: NASA Socioeconomic Data and Applications Center (SEDAC).
Keys, R. (1981). Cubic convolution interpolation for digital image processing. IEEE Trans. Acoust. Speech Signal Process. 29, 1153–1160. doi: 10.1109/TASSP.1981.1163711
Kusserow, H. (2017). Desertification, resilience, and re-greening in the African Sahel - a matter of the observation period? Earth Syst. Dynam. 8, 1141–1170. doi: 10.5194/esd-8-1141-2017
Leroux, L., Bégué, A., Lo Seen, D., Jolivot, A., and Kayitakire, F. (2017). Driving forces of recent vegetation changes in the Sahel: lessons learned from regional and local level analyses. Remote Sens. Environ. 191, 38–54. doi: 10.1016/j.rse.2017.01.014
Li, W., Migliavacca, M., Forkel, M., Denissen, J. M. C., Reichstein, M., Yang, H., et al. (2022). Widespread increasing vegetation sensitivity to soil moisture. Nat. Commun. 13:3959. doi: 10.1038/s41467-022-31667-9
Lloyd, J., and Farquhar, G. D. (2008). Effects of rising temperatures and [CO2] on the physiology of tropical forest trees. Philos. Trans. R. Soc. B-Biol. Sci. 363, 1811–1817. doi: 10.1098/rstb.2007.0032
Lu, X., Wang, L., and McCabe, M. F. (2016). Elevated CO2 as a driver of global dryland greening. Sci. Rep. 6:20716. doi: 10.1038/srep20716
Lundberg, S. M., and Lee, S.-I. (2017). “A unified approach to interpreting model predictions” in Advances in Neural Information Processing Systems 30 (NIPS 2017), eds. U. von Luxburg, I. Guyon, S. Bengio, H. Wallach, and R. Fergus (Red Hook, NY, USA: Curran Associates Inc.), 4768–4777.
Luukko, P. J. J., Helske, J., and Räsänen, E. (2016). Introducing libeemd: a program package for performing the ensemble empirical mode decomposition. Comput. Stat. 31, 545–557. doi: 10.1007/s00180-015-0603-9
Medlyn, B. E., Dreyer, E., Ellsworth, D., Forstreuter, M., Harley, P. C., Kirschbaum, M. U. F., et al. (2002). Temperature response of parameters of a biochemically based model of photosynthesis. II. A review of experimental data. Plant Cell Environ. 25, 1167–1179. doi: 10.1046/j.1365-3040.2002.00891.x
Menenti, M., Azzali, S., Verhoef, W., and Vanswol, R. (1993). Mapping agroecological zones and time lag in vegetation growth by means of fourier analysis of time series of NDVI images. Adv. Space Res. 13, 233–237. doi: 10.1016/0273-1177(93)90550-U
Mercado, L. M., Bellouin, N., Sitch, S., Boucher, O., Huntingford, C., Wild, M., et al. (2009). Impact of changes in diffuse radiation on the global land carbon sink. Nature 458, 1014–1017. doi: 10.1038/nature07949
Milas, S. (1984). Population crisis and desertification in the Sudano-Sahelian region. Environ. Conserv. 11, 167–169. doi: 10.1017/S0376892900013850
Nicholson, S. E. (2009). A revised picture of the structure of the "monsoon" and land ITCZ over West Africa. Clim Dynam 32, 1155–1171. doi: 10.1007/s00382-008-0514-3
Nicholson, S. E. (2013). The west African Sahel: a review of recent studies on the rainfall regime and its interannual variability. Int. Sch. Res. Notices 2013, 1–32. doi: 10.1155/2013/453521
Nicholson, S. E. (2017). Climate and climatic variability of rainfall over eastern Africa. Rev. Geophys. 55, 590–635. doi: 10.1002/2016RG000544
Niu, S., Luo, Y., Fei, S., Yuan, W., Schimel, D., Law, B. E., et al. (2012). Thermal optimality of net ecosystem exchange of carbon dioxide and underlying mechanisms. New Phytol. 194, 775–783. doi: 10.1111/j.1469-8137.2012.04095.x
Ogutu, B. O., D'Adamo, F., and Dash, J. (2021). Impact of vegetation greening on carbon and water cycle in the African Sahel-Sudano-Guinean region. Glob. Planet. Change 202:103524. doi: 10.1016/j.gloplacha.2021.103524
Palmer, P. I., Wainwright, C. M., Dong, B., Maidment, R. I., Wheeler, K. G., Gedney, N., et al. (2023). Drivers and impacts of eastern African rainfall variability. Nat. Rev. Earth Environ. 4, 254–270. doi: 10.1038/s43017-023-00397-x
Pan, N. Q., Feng, X. M., Fu, B. J., Wang, S., Ji, F., and Pan, S. F. (2018). Increasing global vegetation browning hidden in overall vegetation greening: insights from time-varying trends. Remote Sens. Environ. 214, 59–72. doi: 10.1016/j.rse.2018.05.018
Piao, S., Wang, X., Park, T., Chen, C., Lian, X., He, Y., et al. (2020). Characteristics, drivers and feedbacks of global greening. Nat. Rev. Earth Environ. 1, 14–27. doi: 10.1038/s43017-019-0001-x
Ramel, R., Gallée, H., and Messager, C. (2006). On the northward shift of the west African monsoon. Clim. Dyn. 26, 429–440. doi: 10.1007/s00382-005-0093-5
Rasmussen, K., D'Haen, S., Fensholt, R., Fog, B., Horion, S., Ostergaard Nielsen, J., et al. (2016). Environmental change in the Sahel: reconciling contrasting evidence and interpretations. Reg. Envir. Chang. 16, 673–680. doi: 10.1007/s10113-015-0778-1
Rishmawi, K., and Prince, S. D. (2016). Environmental and anthropogenic degradation of vegetation in the Sahel from 1982 to 2006. Remote Sens. 8:948. doi: 10.3390/rs8110948
Rodríguez-Fonseca, B., Mohino, E., Mechoso, C. R., Caminade, C., Biasutti, M., Gaetani, M., et al. (2015). Variability and predictability of west African droughts: a review on the role of sea surface temperature anomalies. J. Clim. 28, 4034–4060. doi: 10.1175/JCLI-D-14-00130.1
Shapley, L. S. (1953). “A value for n-person games” in Contributions to the Theory of Games II (AM-28), Volume II. eds. H. W. Kuhn and A. W. Tucker (Princeton: Princeton University Press), 307–317.
Song, X., Hansen, M. C., Stehman, S. V., Potapov, P. V., Tyukavina, A., Vermote, E. F., et al. (2018). Global land change from 1982 to 2016. Nature 560, 639–643. doi: 10.1038/s41586-018-0411-9
Tagesson, T., Tian, F., Schurgers, G., Horion, S., Scholes, R., Ahlström, A., et al. (2021). A physiology-based earth observation model indicates stagnation in the global gross primary production during recent decades. Glob. Change Biol. 27, 836–854. doi: 10.1111/gcb.15424
Tian, F., Brandt, M., Liu, Y. Y., Verger, A., Tagesson, T., Diouf, A. A., et al. (2016). Remote sensing of vegetation dynamics in drylands: evaluating vegetation optical depth (VOD) using AVHRR NDVI and in situ green biomass data over west African Sahel. Remote Sens. Environ. 177, 265–276. doi: 10.1016/j.rse.2016.02.056
Venter, Z. S., Cramer, M. D., and Hawkins, H. J. (2018). Drivers of woody plant encroachment over Africa. Nat. Commun. 9:2272. doi: 10.1038/s41467-018-04616-8
Verbesselt, J., Hyndman, R., Zeileis, A., and Culvenor, D. (2010). Phenological change detection while accounting for abrupt and gradual trends in satellite image time series. Remote Sens. Environ. 114, 2970–2980. doi: 10.1016/j.rse.2010.08.003
Verhoef, W., Menenti, M., and Azzali, S. (1996). Cover a colour composite of NOAA-AVHRR-NDVI based on time series analysis (1981–1992). Int. J. Remote Sens 17, 231–235. doi: 10.1080/01431169608949001
Wainwright, C. M., Finney, D. L., Kilavi, M., Black, E., and Marsham, J. H. (2021). Extreme rainfall in East Africa, October 2019–January 2020 and context under future climate change. Weather 76, 26–31. doi: 10.1002/wea.3824
Wang, H., Yan, S., Ciais, P., Wigneron, J. P., Liu, L., Li, Y., et al. (2022). Exploring complex water stress–gross primary production relationships: impact of climatic drivers, main effects, and interactive effects. Glob. Change Biol. 28, 4110–4123. doi: 10.1111/gcb.16201
Wang'ati, F. J. (1996). “The impact of climate variation and sustainable development in the Sudano-Sahelian region” in Climate Variability, Climate Change and Social Vulnerability in the Semi-arid Tropics. eds. J. C. Ribot, A. M. Magalhaes, and S. S. Panagides (Cambridge, UK: Cambridge University Press), 71–91.
Weltzien, E., Rattunde, H., Clerget, B., Siart, S., Toure, A., and Sagnard, F. (2006). "Sorghum Diversity and Adaptation to Drought in West Africa", in: Enhancing the Use of Crop Genetic Diversity to Manage Abiotic Stress in Agricultural Production Systems. Rome: International Plant Genetic Resources Institute.
Wild, M. (2009). Global dimming and brightening: a review. J. Geophys. Res.-Atmos. 114:11470. doi: 10.1029/2008JD011470
Wright, M. N., and Ziegler, A. (2015). Ranger: a fast implementation of random forests for high dimensional data in C++ and R. J. Stat. Softw. 77, 1–17. doi: 10.18637/jss.v077.i01
Wu, Z., and Huang, N. E. (2009). Ensemble empirical mode decomposition: a noise-assisted data analysis method. Adv. Adapt. Data Anal. 1, 1–41. doi: 10.1142/S1793536909000047
Wu, Z., Huang, N. E., Long, S. R., and Peng, C.-K. (2007). On the trend, detrending, and variability of nonlinear and nonstationary time series. Proc. Natl. Acad. Sci. USA 104, 14889–14894. doi: 10.1073/pnas.0701020104
Yang, L., Guan, Q., Lin, J., Tian, J., Tan, Z., and Li, H. (2021). Evolution of NDVI secular trends and responses to climate change: a perspective from nonlinearity and nonstationarity characteristics. Remote Sens. Environ. 254:112247. doi: 10.1016/j.rse.2020.112247
Yang, Y., Roderick, M. L., Guo, H., Miralles, D. G., Zhang, L., Fatichi, S., et al. (2023). Evapotranspiration on a greening earth. Nat. Rev. Earth Environ. 4, 626–641. doi: 10.1038/s43017-023-00464-3
Yin, Y., Ma, D., Wu, S., Dai, E., Zhu, Z., and Myneni, R. B. (2017). Nonlinear variations of forest leaf area index over China during 1982-2010 based on EEMD method. Int. J. Biometeorol. 61, 977–988. doi: 10.1007/s00484-016-1277-x
Yuan, W., Zheng, Y., Piao, S., Ciais, P., Lombardozzi, D., Wang, Y., et al. (2019). Increased atmospheric vapor pressure deficit reduces global vegetation growth. Sci. Adv. 5:eaax1396. doi: 10.1126/sciadv.aax1396
Yue, S., Pilon, P., Phinney, B., and Cavadias, G. (2002). The influence of autocorrelation on the ability to detect trend in hydrological series. Hydrol. Process. 16, 1807–1829. doi: 10.1002/hyp.1095
Zaitchik, B. F. (2017). Madden-Julian oscillation impacts on tropical African precipitation. Atmos. Res. 184, 88–102. doi: 10.1016/j.atmosres.2016.10.002
Zeng, Y., Jia, L., Menenti, M., Jiang, M., Barnieh, B. A., Bennour, A., et al. (2023). Changes in vegetation greenness related to climatic and non-climatic factors in the Sudano-Sahelian region. Reg. Envir. Chang. 23:92. doi: 10.1007/s10113-023-02084-5
Zhang, Z., Ju, W., Zhou, Y., and Li, X. (2022). Revisiting the cumulative effects of drought on global gross primary productivity based on new long-term series data (1982-2018). Glob. Change Biol. 28, 3620–3635. doi: 10.1111/gcb.16178
Zhou, J., Jia, L., Menenti, M., and Liu, X. (2021b). Optimal estimate of global biome-specific parameter settings to reconstruct NDVI time series with the harmonic analysis of time series (HANTS) method. Remote Sens. 13:4251. doi: 10.3390/rs13214251
Zhou, J., Jia, L., Menenti, M., van Hoek, M., Lu, J., Zheng, C., et al. (2021a). Characterizing vegetation response to rainfall at multiple temporal scales in the Sahel-Sudano-Guinean region using transfer function analysis. Remote Sens. Environ. 252:112108. doi: 10.1016/j.rse.2020.112108
Zhou, J., Jia, L., van Hoek, M., Menenti, M., Lu, J., and Hu, G. (2016). "An Optimization of Parameter Settings in HANTS for Global NDVI Time Series Reconstruction", 2016 IEEE International Geoscience and Remote Sensing Symposium (IGARRS), Beijing, China.
Keywords: NDVI, Sahel-Sudan-Guinea region, trend reversal, SHAP, climate change, driver analysis
Citation: Zeng Y, Jia L, Menenti M, Jiang M, Zheng C, Bennour A and Lv Y (2024) Regional divergent evolution of vegetation greenness and climatic drivers in the Sahel-Sudan-Guinea region: nonlinearity and explainable machine learning. Front. For. Glob. Change. 7:1416373. doi: 10.3389/ffgc.2024.1416373
Edited by:
Nan Cong, Institute of Geographic Sciences and Natural Resources Research (CAS), ChinaCopyright © 2024 Zeng, Jia, Menenti, Jiang, Zheng, Bennour and Lv. This is an open-access article distributed under the terms of the Creative Commons Attribution License (CC BY). The use, distribution or reproduction in other forums is permitted, provided the original author(s) and the copyright owner(s) are credited and that the original publication in this journal is cited, in accordance with accepted academic practice. No use, distribution or reproduction is permitted which does not comply with these terms.
*Correspondence: Li Jia, amlhbGlAYWlyY2FzLmFjLmNu
Disclaimer: All claims expressed in this article are solely those of the authors and do not necessarily represent those of their affiliated organizations, or those of the publisher, the editors and the reviewers. Any product that may be evaluated in this article or claim that may be made by its manufacturer is not guaranteed or endorsed by the publisher.
Research integrity at Frontiers
Learn more about the work of our research integrity team to safeguard the quality of each article we publish.