 Haiqin Qin1,2,3,4Yingying Tan1,2,3,4
 Ting Shen1,2,3*
 Doug Allen Schaefer1,2,3Huafang Chen1,2,3Shaoqi Zhou1,2,3Qiang Xu1,2,3Yingmo Zhu5Jinxin Cheng6
 Gaojuan Zhao7Jianchu Xu1,2,3*
- 1Department of Economic Plants and Biotechnology, Yunnan Key Laboratory for Wild Plant Resources, Kunming Institute of Botany, Chinese Academy of Sciences, Kunming, China
- 2Centre for Mountain Futures, Kunming Institute of Botany, Chinese Academy of Sciences, Kunming, China
- 3Honghe Center for Mountain Futures, Kunming Institute of Botany, Chinese Academy of Sciences, Honghe, China
- 4University of Chinese Academy of Sciences, Beijing, China
- 5Faculty of Civil Aviation and Aeronautics, Kunming University of Science and Technology, Kunming, China
- 6Yunnan Climate Center, Kunming, China
- 7Key Laboratory of Tropical Forest Ecology, Xishuangbanna Tropical Botanical Garden, Chinese Academy of Sciences, Menglun, China
Understanding the spatiotemporal patterns and variations in vapor pressure deficit (VPD) is essential for effective water resource management in the face of climate change. VPD serves as a fundamental indicator of atmospheric dryness, directly impacting plant evapotranspiration rates, thereby affecting overall ecosystem functioning. In this study, VPD changes in five subregions and four ecological types of land in Yunnan from 1980 to 2021 were investigated using data from 108 meteorological stations. We found increasing trends in annual VPD that were larger during warmer spring and summer seasons. Among the subregions, the highland subtropical southern broadleaved evergreen forest ecoregion exhibited the largest drying trend (0.04 kPa / decade), while the subtropical (eastern) humid broadleaved evergreen forest ecoregion had the smallest drying trend (0.01 kPa / decade). Among the ecological barriers, the dry-hot valleys had significantly higher increases in VPD compared to other Yunnan regions. Increases in VPD from 1990s to 2000s in several regions of Yunnan exceeded atmospheric drying trends reported elsewhere. Additionally, we documented smaller VPD declines at higher elevations. Across different ecological land types, Shrubland exhibited the largest VPD trend (0.07 kPa / decade), while Forest displayed the smallest (0.03 kPa / decade). Decreased relative humidity through time explained 65% of the increase in VPD in Yunnan, while increasing temperatures accounted for 25%. These findings provide valuable insights into climatic dynamics of Yunnan, with implications for ecological, hydrological, and atmospheric studies.
1 Introduction
Drought, commonly depicted as a widespread weather-related phenomenon caused by insufficient rainfall and subsequent disruptions in the water balance (Zheng et al., 2023), has intensifying impacts on global terrestrial ecosystems according to the Intergovernmental Panel on Climate Change (IPCC; Qiu et al., 2023). Atmospheric dryness, characterized by vapor pressure deficit (VPD), is a type of drought and is defined as the difference between saturation water vapor pressure (es) and actual water vapor pressure (ea) at a particular temperature. VPD, as a key indicator of atmospheric aridity (Fu et al., 2022; He et al., 2023; Mirabel et al., 2023), is widely recognized as a principal factor driving drought stress within terrestrial ecosystems (Rashid et al., 2018; Yuan et al., 2019; Fu et al., 2022; Zheng et al., 2023; Zhong et al., 2023).
High VPDs are associated with droughts (Behrangi et al., 2015; Li et al., 2023; Yao et al., 2023). VPD has primarily been used in plant productivity, stomatal conductance measurements, plant carbon uptake, and plant water-use efficiency research, as well as being associated with forest fire risk (Grossiord et al., 2020; Mueller et al., 2020; Li et al., 2023; Yang et al., 2023; Zheng et al., 2023). The significance of VPD in terrestrial ecosystems has also been broadly confirmed for drought and hydrological cycles (Barkhordarian et al., 2019; He et al., 2022; Fan et al., 2023; Noguera et al., 2023).
Global and regional climate datasets have been utilized to assess the changes of atmospheric dryness in terms of VPD. Some studies indicated that VPD shows an overall increasing trend across different spatiotemporal scales. Yuan et al. showed a significant increase in global VPD since 2000, with projections indicating this trend will continue by analyzing four grid datasets (CRU, EAR-Interim, MERRA, and HadISDH; Yuan et al., 2019). Jain et al. calculated the VPD from 1979 to 2020 by using the ERA5 reanalysis dataset, revealing a 12% increase in extreme VPD values globally over the past three decades, coinciding with a rapid expansion in global land area at risk of fire (Jain et al., 2022). Xu et al. observed a substantial increase in global VPD over a 20-year period (Xu et al., 2024). Between 1980 and 2020, over 90% of the western United States exhibited an increasing trend in VPD with an average annual increase of 0.5 kPa (Rao et al., 2022). The same study suggested that this trend significantly contributed to the occurrence of forest fires. Between 1993 and 2013, rapid increases in VPD occurred across Europe, leading to frequent drought events and extensive forest mortality due to the stressful conditions (Liu et al., 2023). Dong et al. conducted an analysis of temporal and spatial trends across different climatic zones in China, uncovering a significant upward trajectory in VPD between 1961 and 2020, with rates of increase averaging 0.0178 kPa / decade (Dong et al., 2024). Here, we compiled published VPD changes in different regions (Table 1). We found that different atmospheric aridity trends occurred in different ecosystems, for example, the drought intensity of grassland was higher than that of cultivated land and forest, and the corresponding drought recovery time was longer in Yellow River Basin, higher resistance of forests to atmospheric drought (Fan et al., 2023). Recent research has illustrated relationships between VPD and elevation (Chang et al., 2023). Wang et al. found significant increases in VPD in select high-altitude areas of Yunnan and Xinjiang (Wang et al., 2022). However, it is challenging to apply such results in areas with complex ecosystems.
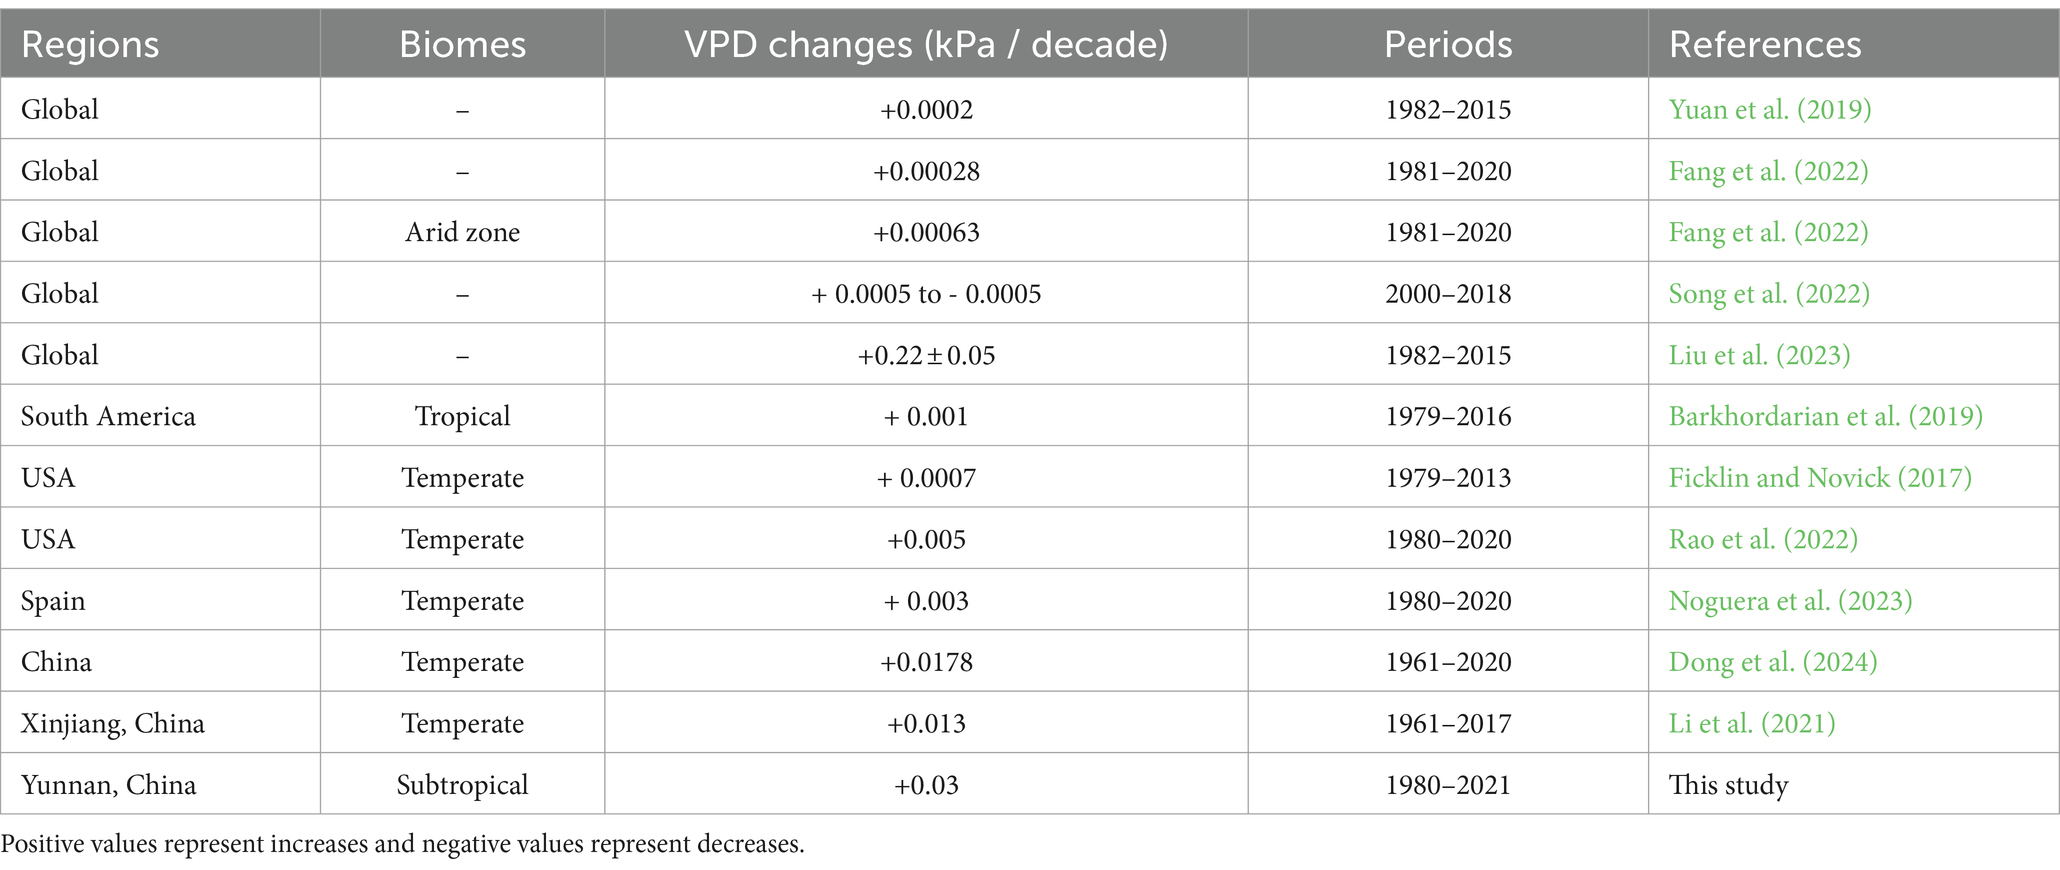
Table 1. Characteristics of VPD change at global and regional scales.
Yunnan Province in southwestern China has diverse climates due to its complex topography and large altitudinal differences. In addition to Asian monsoon influences, Yunnan is highly sensitive to climate change (Shi and Chen, 2018). Several major international rivers flow through the Yunnan, such as the Mekong and Red River, so there are large impacts of changing climate patterns on hydrological cycles. Furthermore, due to its climatic gradients, Yunnan hosts high biodiversity and ecosystem variety (Wang et al., 2018). While there has been considerable research on VPD, there is still a need for more fine-scale investigations of VPD, especially in complex ecosystems sensitive to global change, such as those found in Yunnan. Therefore, understanding the atmospheric drought characteristics of these ecosystems is of high importance for addressing climate change. Our objective is to examine the spatiotemporal patterns and underlying causes of VPD changes in Yunnan from 1980 to 2021.
Here, we presented changes in VPD and related variables across different ecological subregions, key ecological barriers and four ecological land types in Yunnan from 1980 to 2021, and analyzed the relationship between VPD changes along altitudinal gradients. Finally, our objective is to elucidate the trends in VPD within the complex ecosystem and explore the influence of elevation on VPD changes in Yunnan from 1980 to 2021.
2 Materials and methods
2.1 Study area
Yunnan is a low-latitude inland province with mountainous terrain ranging from high elevations of 5,620 m in the northwest to 79 m in the southeast. It extends from 21°8′ N to 29°15′ N and from 97°31′ E to 106°11′ E (Figure 1A), with the Tropic of Cancer crossing its southern region. The total area is approximately 383,210 km2, of which 84% is mountains, 10% is plateau and 6% is basin. Yunnan predominantly experiences subtropical and tropical monsoon climates, though the northwestern area exhibits a plateau mountain climate. The province encompasses tropical, subtropical, and temperate climate zones, resulting in notable climatic variations. Precipitation has a distinct seasonality, with a dry season from November to April and a rainy season from May to October. The average annual precipitation in Yunnan is approximately 1,100 mm, with approximately 85% occurring during the rainy seasons (Rao et al., 2023).
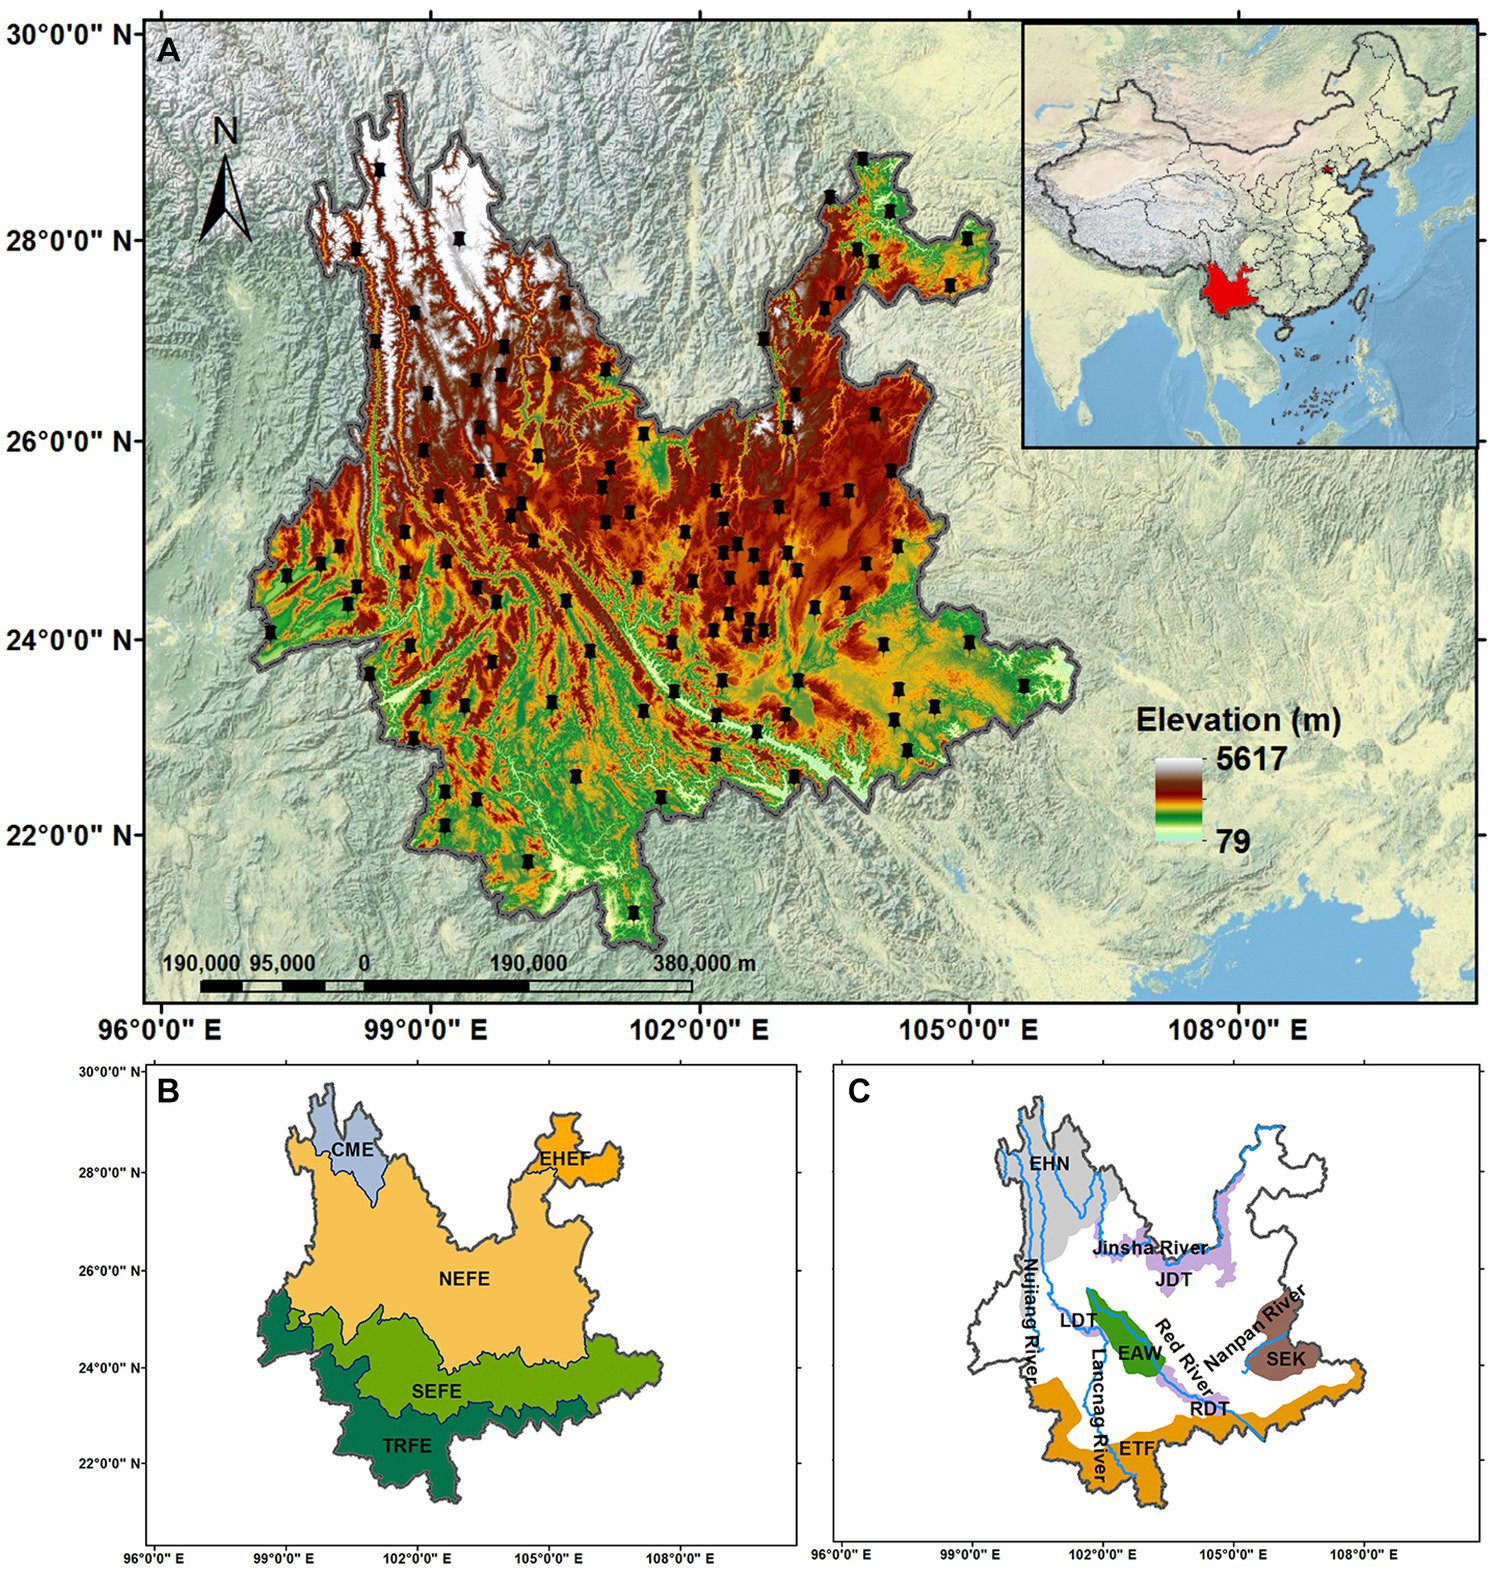
Figure 1. (A) Distribution of 108 meteorological stations (black symbols) and topographic features in Yunnan, China; (B) Five ecological subregions in Yunnan (TRFE, tropical rain forest ecoregion on the northern edge of the monsoon tropics; SEFE, highland subtropical southern broadleaved evergreen forest ecoregion; NEFE, highland subtropical northern broadleaved evergreen forest ecoregion; EHEF, subtropical (eastern) humid broadleaved evergreen forest ecoregion; CME, cold-temperate coniferous forests and meadows ecoregion on the southeastern margin of the Qinghai-Tibet Plateau); (C) Ecological barriers in Yunnan (EAW, Ailao-Wuliang mountains; EHN, the southern edge of the Qinghai-Tibet Plateau; SEK, the karst regions in the southeastern part of Yunnan; ETF, tropical forest regions along the southern border; ETF, the tropical forest regions along the southern border; LDT, dry-hot valley of Lancang River; JDT, dry-hot valley of Jinsha River; RDT, dry-hot valley of Red River).
Due to its proximity to the southeastern edge of the Tibetan Plateau, Yunnan includes a transitional region between tropical and temperate zones. Consequently, its vegetation exhibits transitional characteristics, ranging from coniferous forests in the north to tropical rainforests in the south, and from high-altitude shrub grasslands to low-altitude sparsely forested grasslands. Here, we divided it into five ecological zones from the south to the north based on the integrated geographic features (Figure 1B): tropical Rainforest on the northern edge of the monsoon tropics (TRFE), highland subtropical southern broadleaved evergreen forest ecoregion (SEFE), highland subtropical northern broadleaved evergreen forest ecoregion (NEFE), subtropical (eastern) humid broadleaved evergreen forest ecoregion (EHEF), cold-temperate coniferous forests and meadows ecoregion on the southeastern margin of the Qinghai-Tibet Plateau (CME).1
In Yunnan, the total area designated for ecological protection is 118,400 km2, accounting for 30.90% of the provincial land area (Figure 1C). These areas are ecological barriers and primarily located in the biodiversity-rich and water-conserving regions including the northwestern mountainous canyons on the southern edge of the Qinghai-Tibet Plateau (EHN), the Ailao-Wuliang mountains (EAW), and the tropical forest regions along the southern border (ETF). Four important regions of soil and water conservation are dry-hot valley of Jinsha River (JDT), dry-hot valley of Lancang River (LDT), and dry-hot valley of Red River (RDT), as well as the karst regions in the southeastern part of the province (SEK). This distribution pattern of the ecological protection red line areas forms the spatial framework of the “Three Zones and Two Belts” in Yunnan.2
2.2 Data sources
The monthly T, RH, maximum T (Tmax), maximum T (Tmax), minimum T (Tmin), and Precipitation (Precip) data used in this study from 1980 to 2021 were obtained from the National Meteorological Information Center-China Meteorological Data Network.3 Incomplete meteorological station records were filtered out, resulting in a final dataset including 108 meteorological stations in Yunnan (Figure 1A). The average elevation of the 108 meteorological stations is 1,537 m. Among these weather stations, 16 stations are located in TRFE, at an average altitude of 1,295 m; 23 stations are located in SEFE, at an average altitude of 1,485 m; 60 stations are located in NEFE, at an average altitude of 2,087 m; 7 stations are located in EHEF, at an average altitude of 1,486 m; 2 stations are located in CME, at an average altitude of 3,458 m.
The land cover of Yunnan from 1990 to 2021 is sourced from Wuhan University,4 with spatial resolutions of 30 m (Yang and Huang, 2021). Representative ecological land types in the study area were identified as croplands, forests, shrublands and grasslands. For this study, land-cover data was resampled to a 90 m resolution.
The Digital Elevation Model (DEM) of Yunnan was obtained from the Chinese Academy of Sciences Resource and Environment Science Data Center,5 with a spatial resolution of with 90 m (Figure 1A).
To examine drought variation characteristics across different time periods, this study divided 1980 to 2021 into distinct stages: 1980–2021, 1981–2000 (1980s–1990s), 1991–2010 (1990s–2000s), and 2001–2020 (2000s–2010s). The period from 1980 to 2021 represents the overall 42-year period. For other periods: 1981–2000 denotes the difference between the average values of 1991–2000 and 1981–1990, 1991–2000 represents the disparity between the average values of 2001–2010 and 1991–2000, and 2001–2020 illustrates the distinction between the average values of 2011–2020 and 2001–2010.
2.3 Methods
2.3.1 Estimating the VPD
Climatic variables include air temperature (T), relative humidity (RH), and VPD. VPD is calculated by using the myclim package (Man et al., 2023) in R Studio version 4.3.2 (R Core Team, 2023) and is determined the following equations [1]–[4].
ANUSPLIN version 4.4 is a spatial interpolation program developed by the Australian National University for generating meteorological datasets. Its main feature is the ability to incorporate linear covariates such as topographical variables, making it widely applicable in regions with highly variable terrain (Simeng et al., 2019). Datasets generated by ANUSPLIN 4.4 exhibit high precision and reliability (Zhang et al., 2010). This study leveraged ANUSPLIN 4.4 to perform spatial interpolation of the VPD data, which was initially calculated based on 108 stations. Through integration with the Digital Elevation Model (DEM) of the study area, this process generated final VPD surfaces with 90 m spatial resolution.
Due to the non-uniform spatial distribution of stations in Yunnan, a grid of points that evenly covered the study area was created using the Fishnet tool in ArcGIS 10.8. This approach was adopted to facilitate a more detailed and realistic evaluation of the VPD within the subregions. Within the study area, 1,528 usable points were generated and values were extracted from the interpolated VPD dataset to the points using the Extract Multiple Values to Points tool in ArcGIS 10.8. Among these points, 283 points are located in TRFE; 366 points are located in SEFE; 754 points are located in NEFE; 62 points are located in EHEF; and 63 points are located in CME.
To analyze seasonal variations, the VPD datasets were divided into four seasons including spring (March to May), summer (June to August), autumn (September to November), and winter (December to February). Yunnan’s climatic diversity is remarkable, spanning from alpine meadows in the northwest to subtropical monsoon rainforests in the southwest. Recognizing this, the study proposes dividing the region into four seasons to more accurately capture the climatic nuances across the entire study area. This approach allows for a comprehensive understanding of the climatic variations and patterns prevalent throughout Yunnan.
2.3.2 Trend changes and statistical analyses of climatic factors
Linear trends in VPD were assessed using the non-parametric Sen’s slope estimator (Mann, 1945; Sen, 1968). As the climatic variables did not follow normal distributions, the Mann–Kendall and Sen’s slope estimator were used to detect slopes and discontinuities. The Sen’s slope estimator is a non-parametric method used to describe hydro-meteorological and extreme indices (Li et al., 2021). The MK test is employed for detecting non-parametric trends (Mann, 1945; N. L. J., 1949; Sen, 1968; Sadeqi et al., 2022). The significance of trends was determined employing the original MK test. The significance assessment criteria for MK test can be found in Supplementary Table S1. Sen’s slope was calculated using the equation [5]. In this study, trends were considered to be statistically significant at the p < 0.05 level.
To assess the potential influence of climatic factors on changes in VPD, we employed partial correlation analysis. This statistical method evaluates linear relationships between climatic variables while controlling for the effects of one or more additional variables (Han et al., 2023). The partial correlation coefficients were calculated using equation [6].
3 Results
3.1 Changes in VPD in different subregions and ecological barriers
3.1.1 Changes in VPD in different subregions
An overall increase in VPD across various spatial and temporal scales from 1980 to 2021 was observed across Yunnan, with the fastest rise in SEFE and the slowest in EHEF (Figure 2; Table 2). Over the four-decade span, the average VPD increase rate in Yunnan was 0.03 kPa per decade, with 94% of meteorological stations (and 76% significantly) recording this trend. Across ecological subregions, the largest increase in VPD was in SEFE at 0.04 kPa per decade, while EHEF had the smallest increase in VPD at 0.01 kPa per decade (Table 2). For the seasonal variation in VPD, we found 0.03 kPa per decade in spring and summer seasons (p < 0.05), compared with 0.02 kPa per decade in fall and winter seasons (p < 0.05), showed a faster upward trend (Table 2). A similar trend was also found in different subregions.
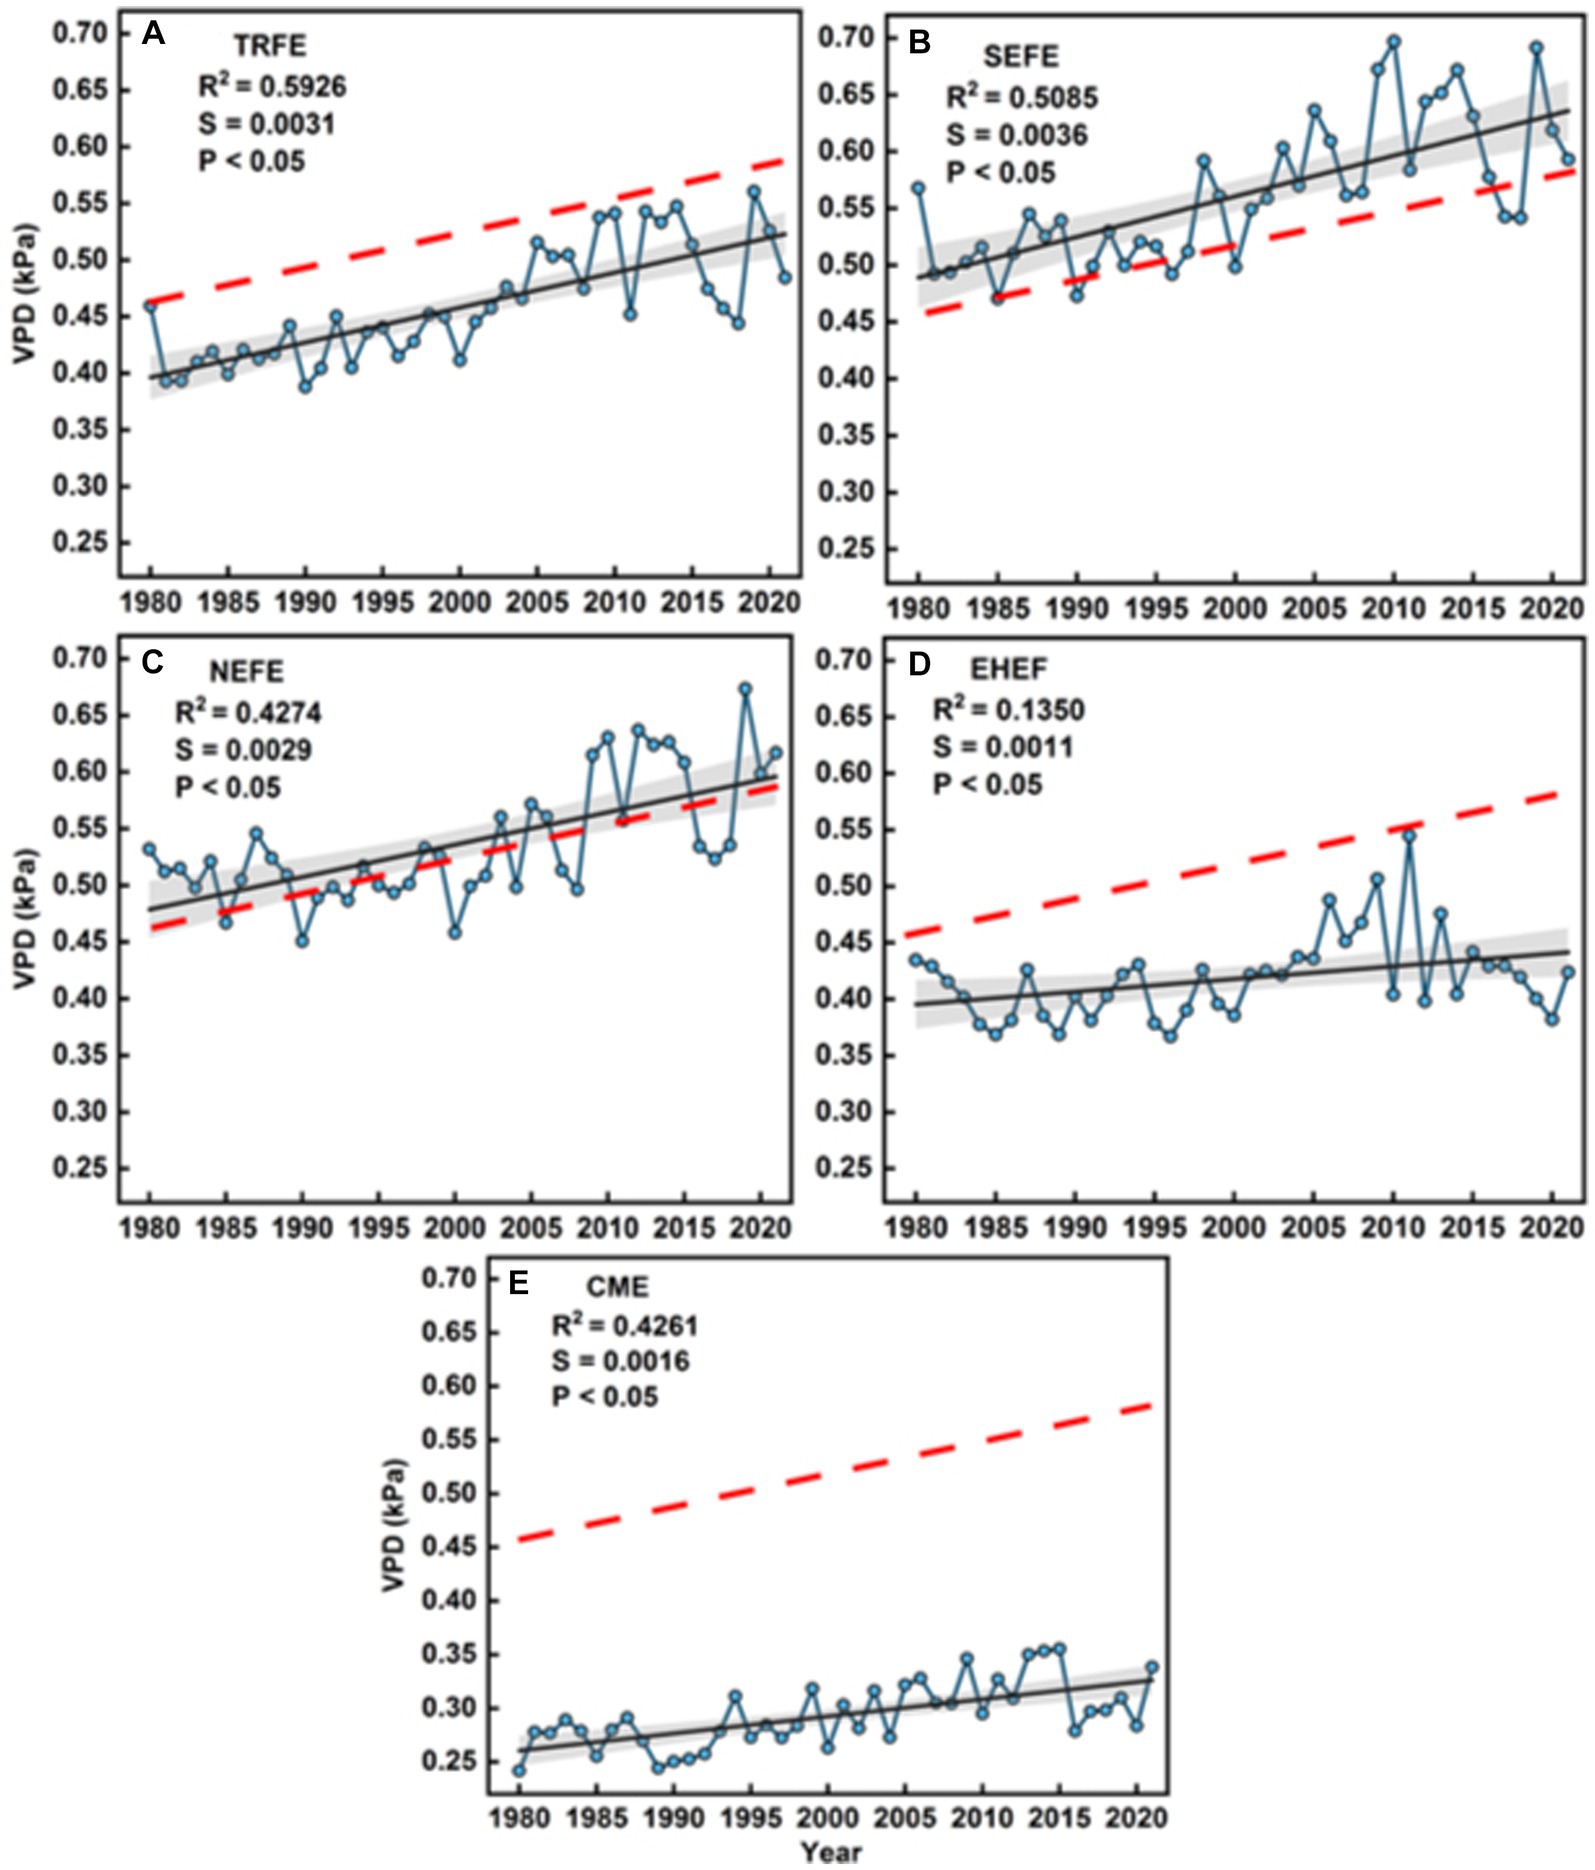
Figure 2. Mean annual VPD (kPa) in five subregions (A–E) from 1980 to 2021 in Yunnan. The red dashed lines represent the slope of VPD over time for Yunnan overall (S = 0.0032), the black solid lines represent slopes in the subregions, and the gray shaded area represents the confidence interval, S in the subplots represent the slope of each ecological subregions, respectively (TRFE, tropical rain forest ecoregion on the northern edge of the monsoon tropics; SEFE, highland subtropical southern broadleaved evergreen forest ecoregion; NEFE, highland subtropical northern broadleaved evergreen forest ecoregion; EHEF, subtropical (eastern) humid broadleaved evergreen forest ecoregion; CME, cold-temperate coniferous forests and meadows ecoregion on the southeastern margin of the Qinghai-Tibet Plateau).
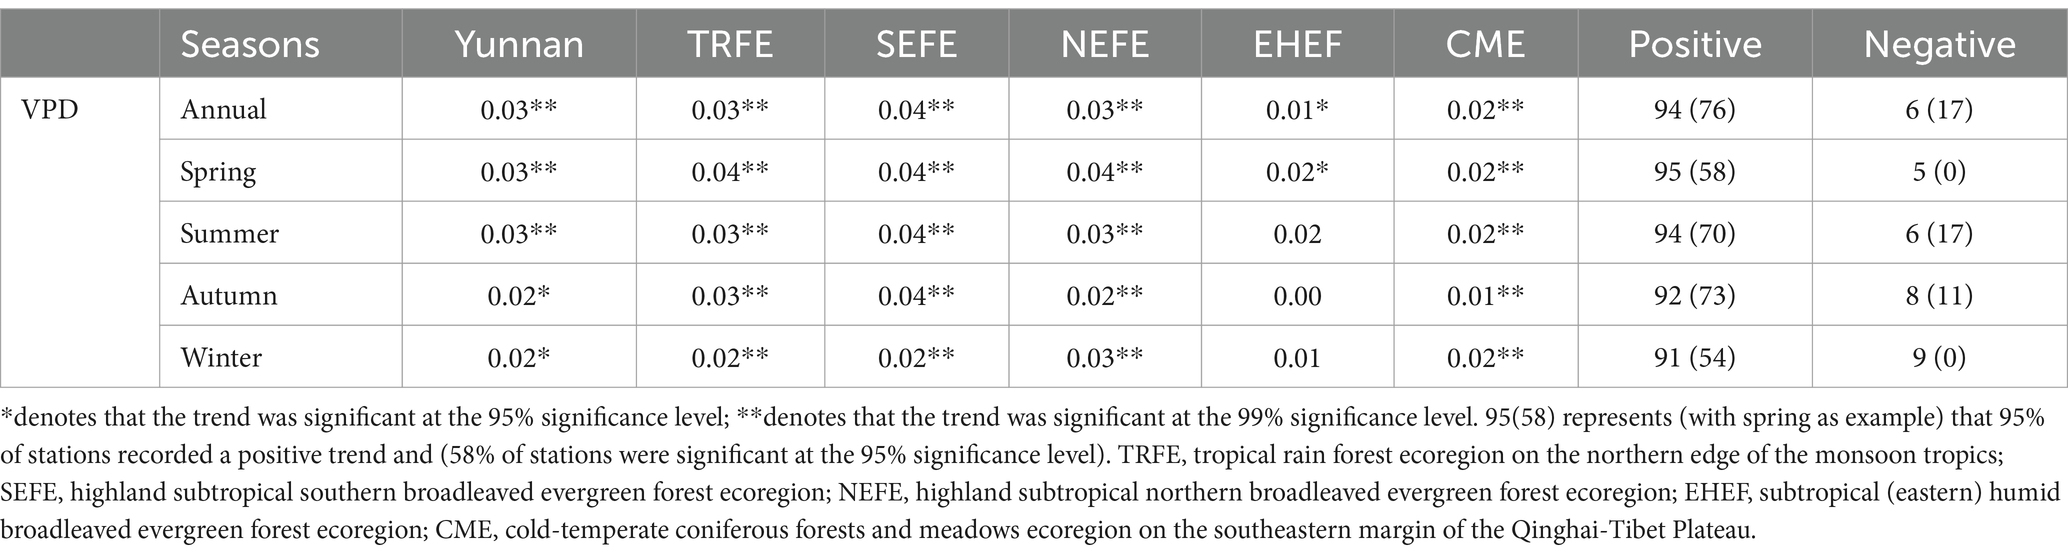
Table 2. Annual and seasonal VPD (kPa / decade) trends in Yunnan and its five subregions, over the period 1980 to 2021.
Over a 42-year period, this whole region showed a drying trend and significant spatial disparities. The four major river watersheds of Yunnan (Jinsha, Nujiang, Lancang and Red Rivers) in all seasons consistently have higher VPD than other areas, while the high altitude of northwest regions (CME) was lowest (Figure 3). VPD values in spring were markedly higher than the annual average and those of autumn and winter, peaking at 1.6 kPa. EHEF has a lowest VPD in winter (Table 2).
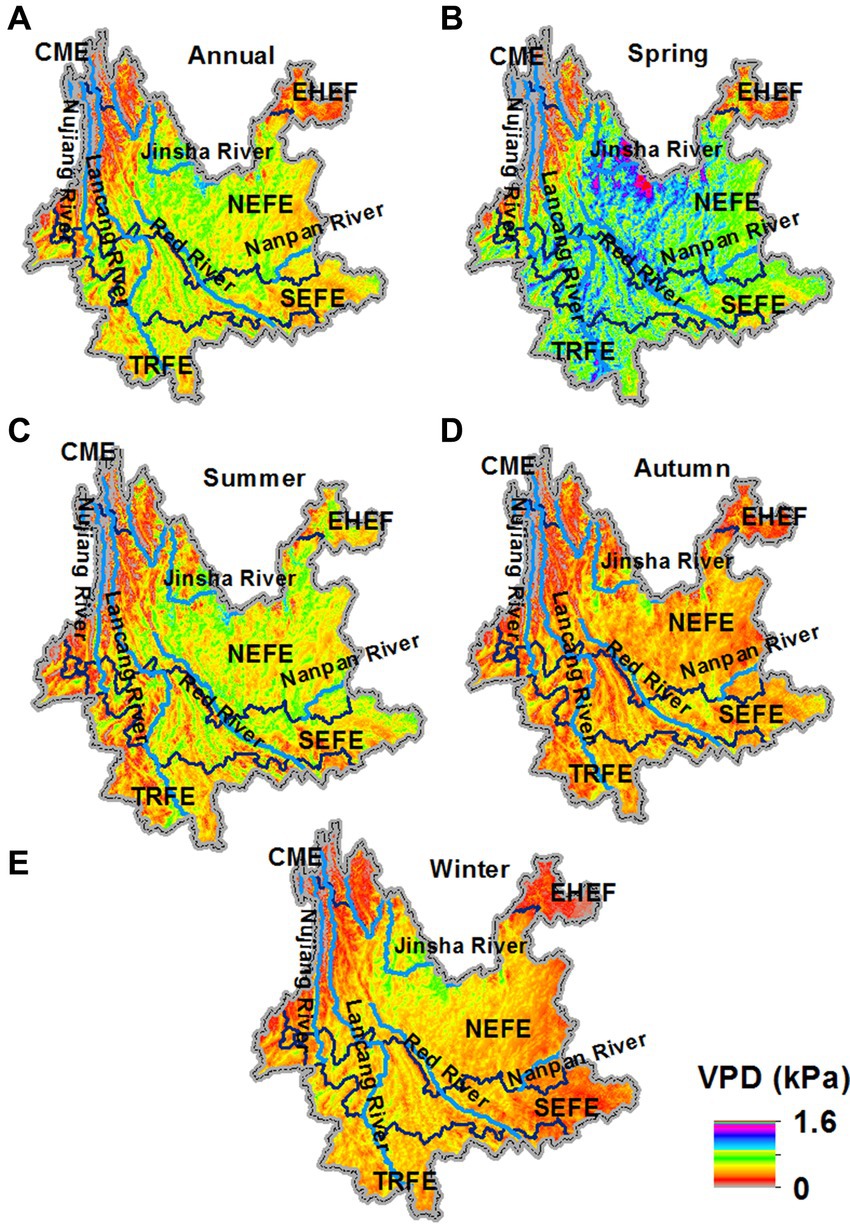
Figure 3. Averaged annual (A) and seasonal (B–E) VPD (kPa) from 1980 to 2021 in Yunnan. Light blue lines are the main rivers in Yunnan. (TRFE, tropical rain forest ecoregion on the northern edge of the monsoon tropics; SEFE, highland subtropical southern broadleaved evergreen forest ecoregion; NEFE, highland subtropical northern broadleaved evergreen forest ecoregion; EHEF, subtropical (eastern) humid broadleaved evergreen forest ecoregion; CME, cold-temperate coniferous forests and meadows ecoregion on the southeastern margin of the Qinghai-Tibet Plateau).
Over the past 42 years, Yunnan has shown a significant increase in drought, with extreme drought areas distributed in the central and northern regions of Yunnan (Figure 4A). There are differences in drought trends across different periods. From 1980s to 1990s, northern parts of Yunnan showed a slight wetting trend, with a small part of significant wetter zone (Figure 4B). From 1990s to 2000s, the majority of Yunnan, excepting northern of Yunnan, showed severe to very severe drying trends, with parts of central and northeastern Yunnan, and even southern and western Yunnan experiencing the high significant drying (Figure 4C). In the period 2000s to 2010s, the northern Yunnan showed a slight drying trend, while parts of southern and southeastern Yunnan displayed significant wetting trends, with the area of significant wetting exceeding that of significant drying (Figure 4D).
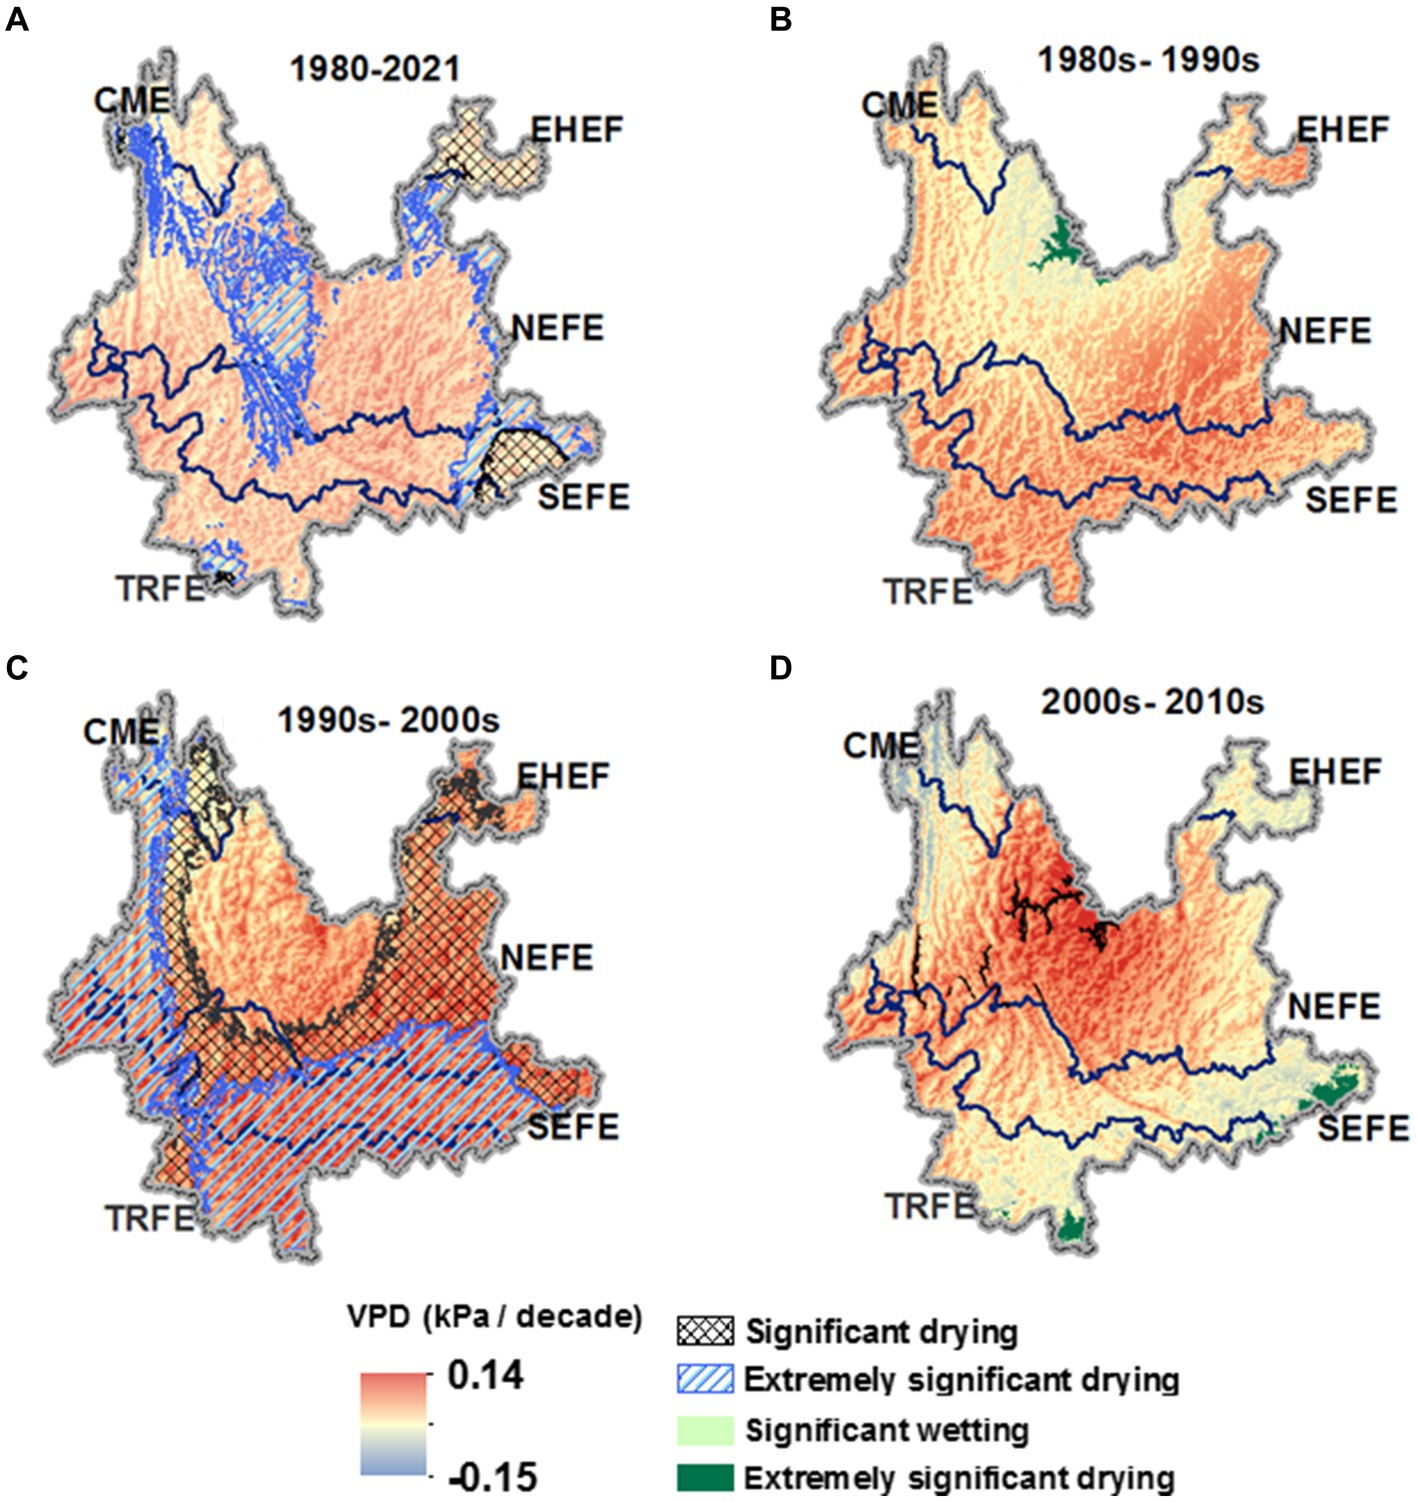
Figure 4. Spatial and temporal changes in VPD (kPa / decade) in Yunnan for four time periods (A–D) with Significance determined by the MK test (TRFE, tropical rain forest ecoregion on the northern edge of the monsoon tropics; SEFE, highland subtropical southern broadleaved evergreen forest ecoregion; NEFE, highland subtropical northern broadleaved evergreen forest ecoregion; EHEF, subtropical (eastern) humid broadleaved evergreen forest ecoregion; CME, cold-temperate coniferous forests and meadows ecoregion on the southeastern margin of the Qinghai-Tibet Plateau).
3.1.2 VPD trends in the ecological barriers
We observed that VPD not only varied among different ecological subregions, but also exhibited distinct changing patterns in the ecological barriers (Figure 5; Table 3). Among these ecological barriers, JDT had the highest VPD values, followed by RDT. EHN had the lowest VPD, followed by SEK. There was a significant disparity in VPD among different ecological barriers, with a difference of up to 0.38 kPa between JDT and EHN.
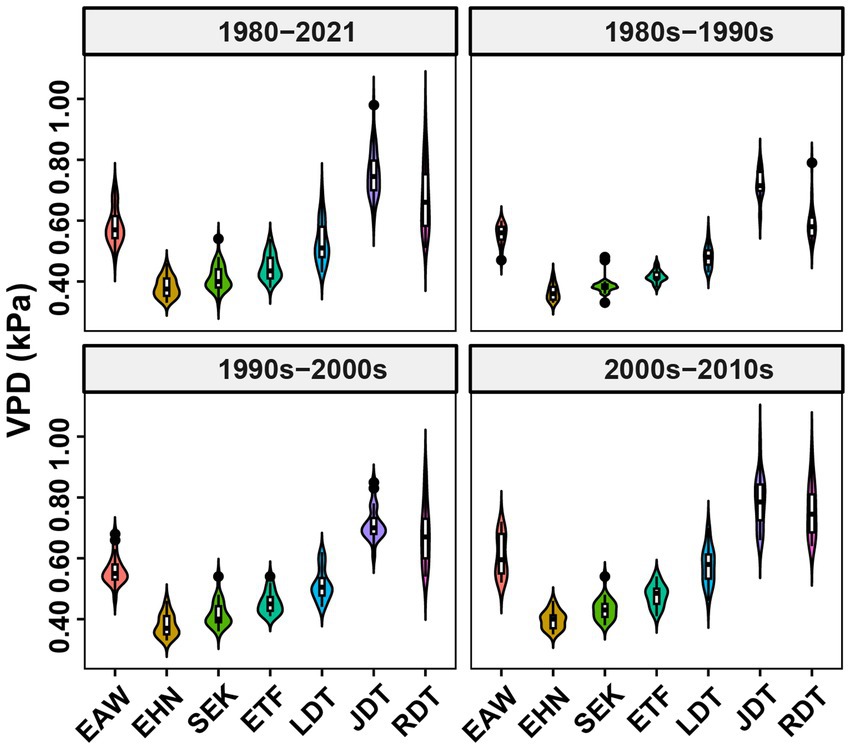
Figure 5. VPD values (kPa) of the seven ecological barriers across different time scales (EAW, Ailao-Wuliang mountains; EHN, southern edge of the Qinghai-Tibet Plateau; SEK, karst regions in the southeastern part of the province; ETF, the tropical forest regions along the southern border; ETF, tropical forest regions along the southern border; LDT, dry-hot valley of Lancang River; JDT, dry-hot valley of Jinsha River; RDT, dry-hot valley of Red River).
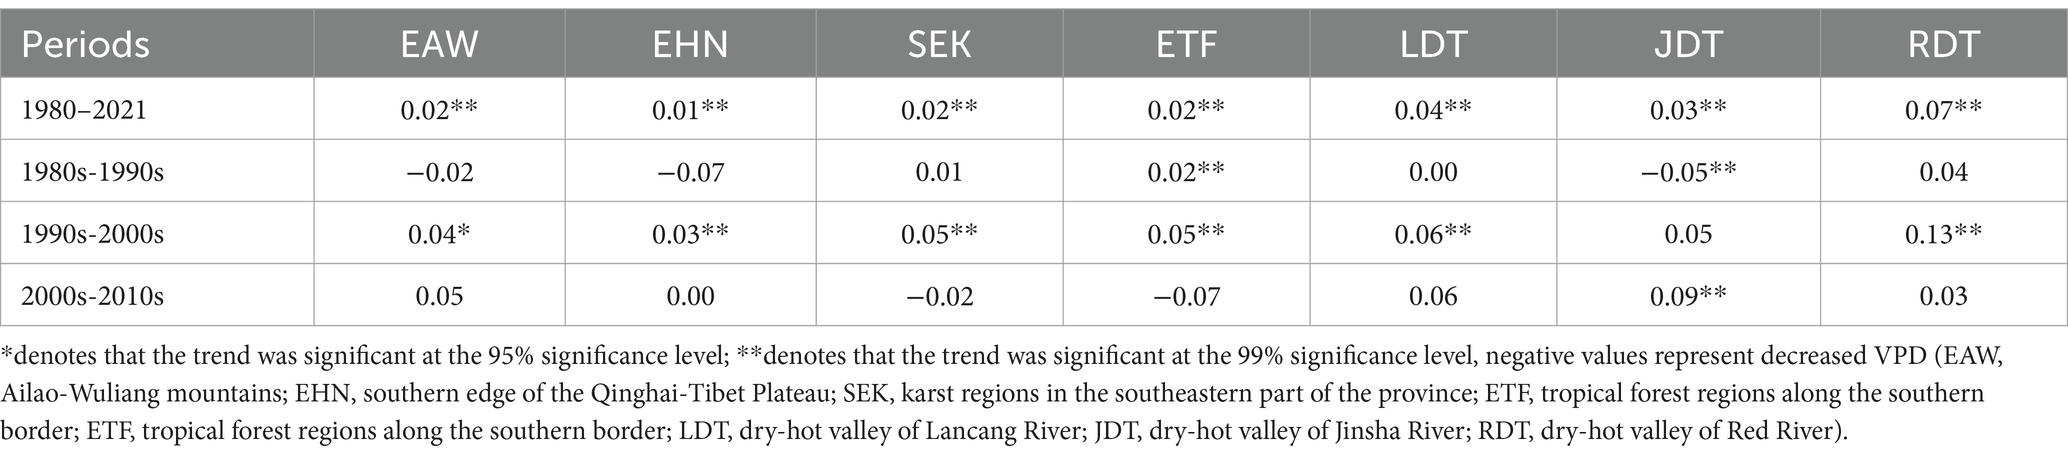
Table 3. The VPD trends (kPa / decade) in the ecological barriers over the periods 1981 to 2021.
It was evident that among these ecological barriers, the fastest average VPD increase over multiple years was in HDT, at 0.07 kPa per decade (p < 0.05), followed by LDT and JDT at 0.04 kPa per decade (p < 0.05), and 0.03 kPa per decade (p < 0.05), respectively. The lowest increase was observed in EHN at 0.01 kPa per decade (p < 0.05), while the remaining ecological barriers showed a VPD increase of 0.02 kPa per decade (p < 0.05). Analysis of different time scales revealed that VPD had a negative trend from 1980s to 1990s, with an average of −0.01 kPa per decade, with a minimum of −0.07 kPa per decade in EHN. Apart from this, EAW and JDT also showed a negative trends. From 1990s to 2000s, VPD had the fastest increase averaging 0.06 kPa per decade (p < 0.05). From 2000s to 2010s, the average increase in VPD was 0.02 kPa per decade.
3.2 Trends in VPD along an altitudinal gradient
Overall, VPD showed a negative linear correlation with altitude among five ecological zones, decreasing as altitude increases (Figure 6). The highest correlation was found in CME (R2 = 0.74, S = −0.0002, p < 0.05) with an average altitude exceeding 3,000 m, followed by TRFE (R2 = 0.71, S = −0.0002, p < 0.05 with an average altitude over 1,200 m. R2 values in other regions ranges between 0.50 and 0.58, with an average altitude of between 1,295 and 3,458 m.
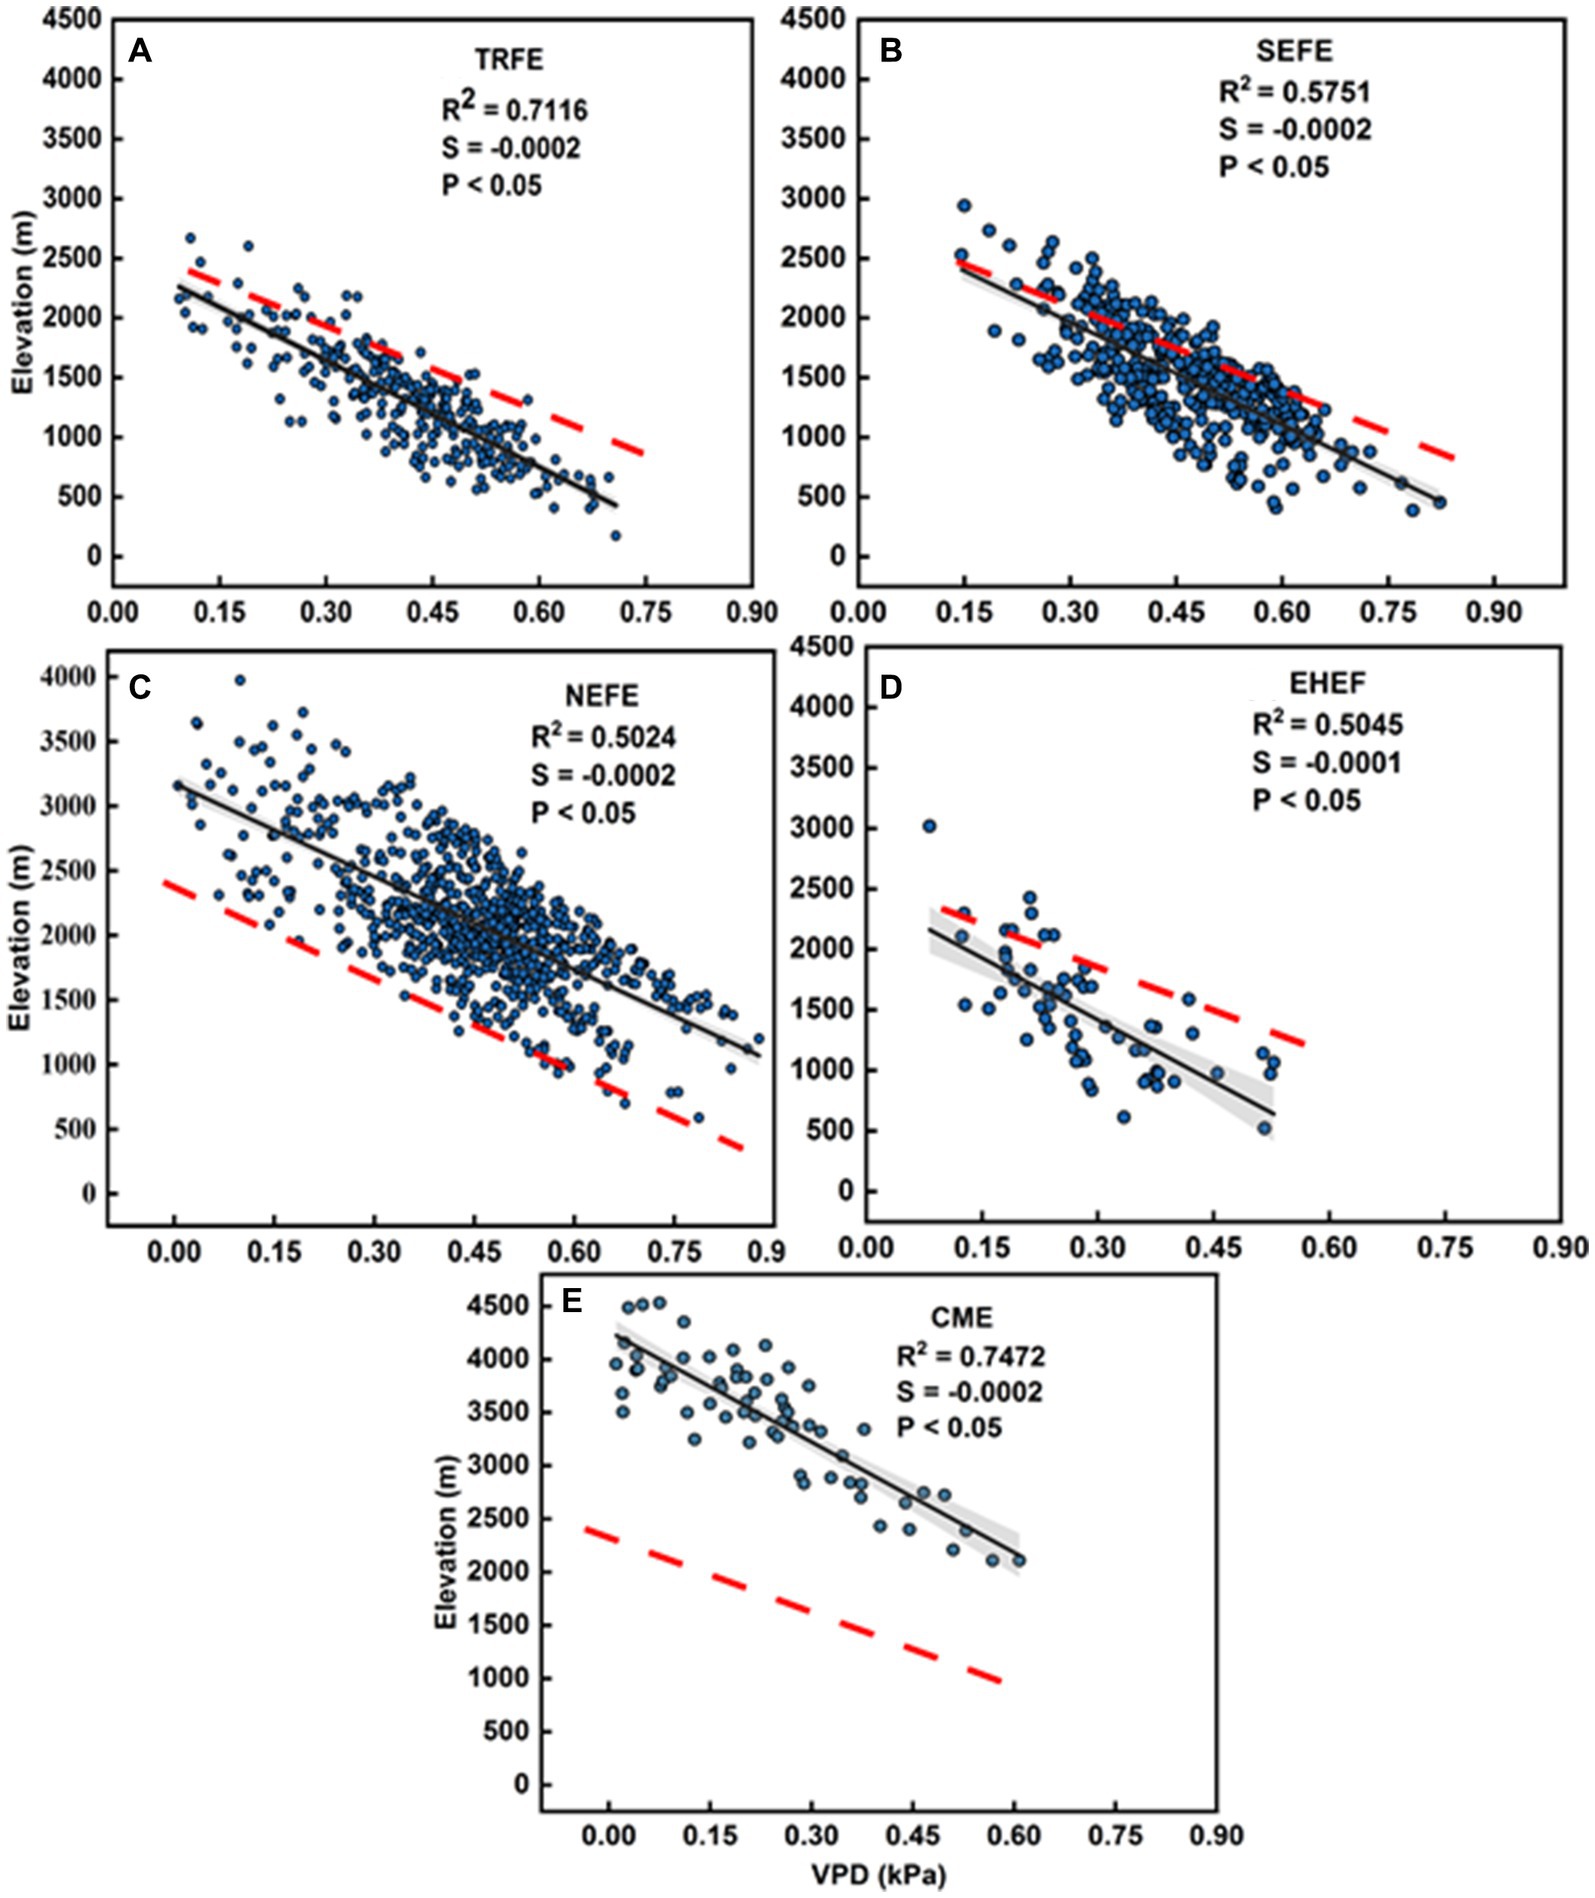
Figure 6. Trends in VPD (kPa) along an elevational gradient in five subregions of Yunnan (A–E). The red dotted lines represent the slope in Yunnan (S = −0.0013), and the gray shaded area represents the confidence interval, S in the subplots represent the slope of each ecological subregions, respectively (TRFE, tropical rain forest ecoregion on the northern edge of the monsoon tropics; SEFE, highland subtropical southern broadleaved evergreen forest ecoregion; NEFE, highland subtropical northern broadleaved evergreen forest ecoregion; EHEF, subtropical (eastern) humid broadleaved evergreen forest ecoregion; CME, cold-temperate coniferous forests and meadows ecoregion on the southeastern margin of the Qinghai-Tibet Plateau).
3.3 The changes of VPD in four ecological land types
Over the past four decades, we found that VPD in the Shrubland showed the largest increase (S = 0.0071, Trend = 0.07 kPa / decade, p < 0.05), followed by the Grassland (S = 0.0048, Trend = 0.06 kPa / decade, p < 0.05) and Cropland (S = 0.0046, Trend = 0.05 kPa / decade, p < 0.05; Figures 7, 8), while VPD in the Forest showed the least increase (S = 0.0022, Trend = 0.03 kPa / decade, p < 0.05). The slope of the change in Cropland is higher than the averaged VPD trend in Yunnan, so Cropland makes a large contribution to overall VPD increases.
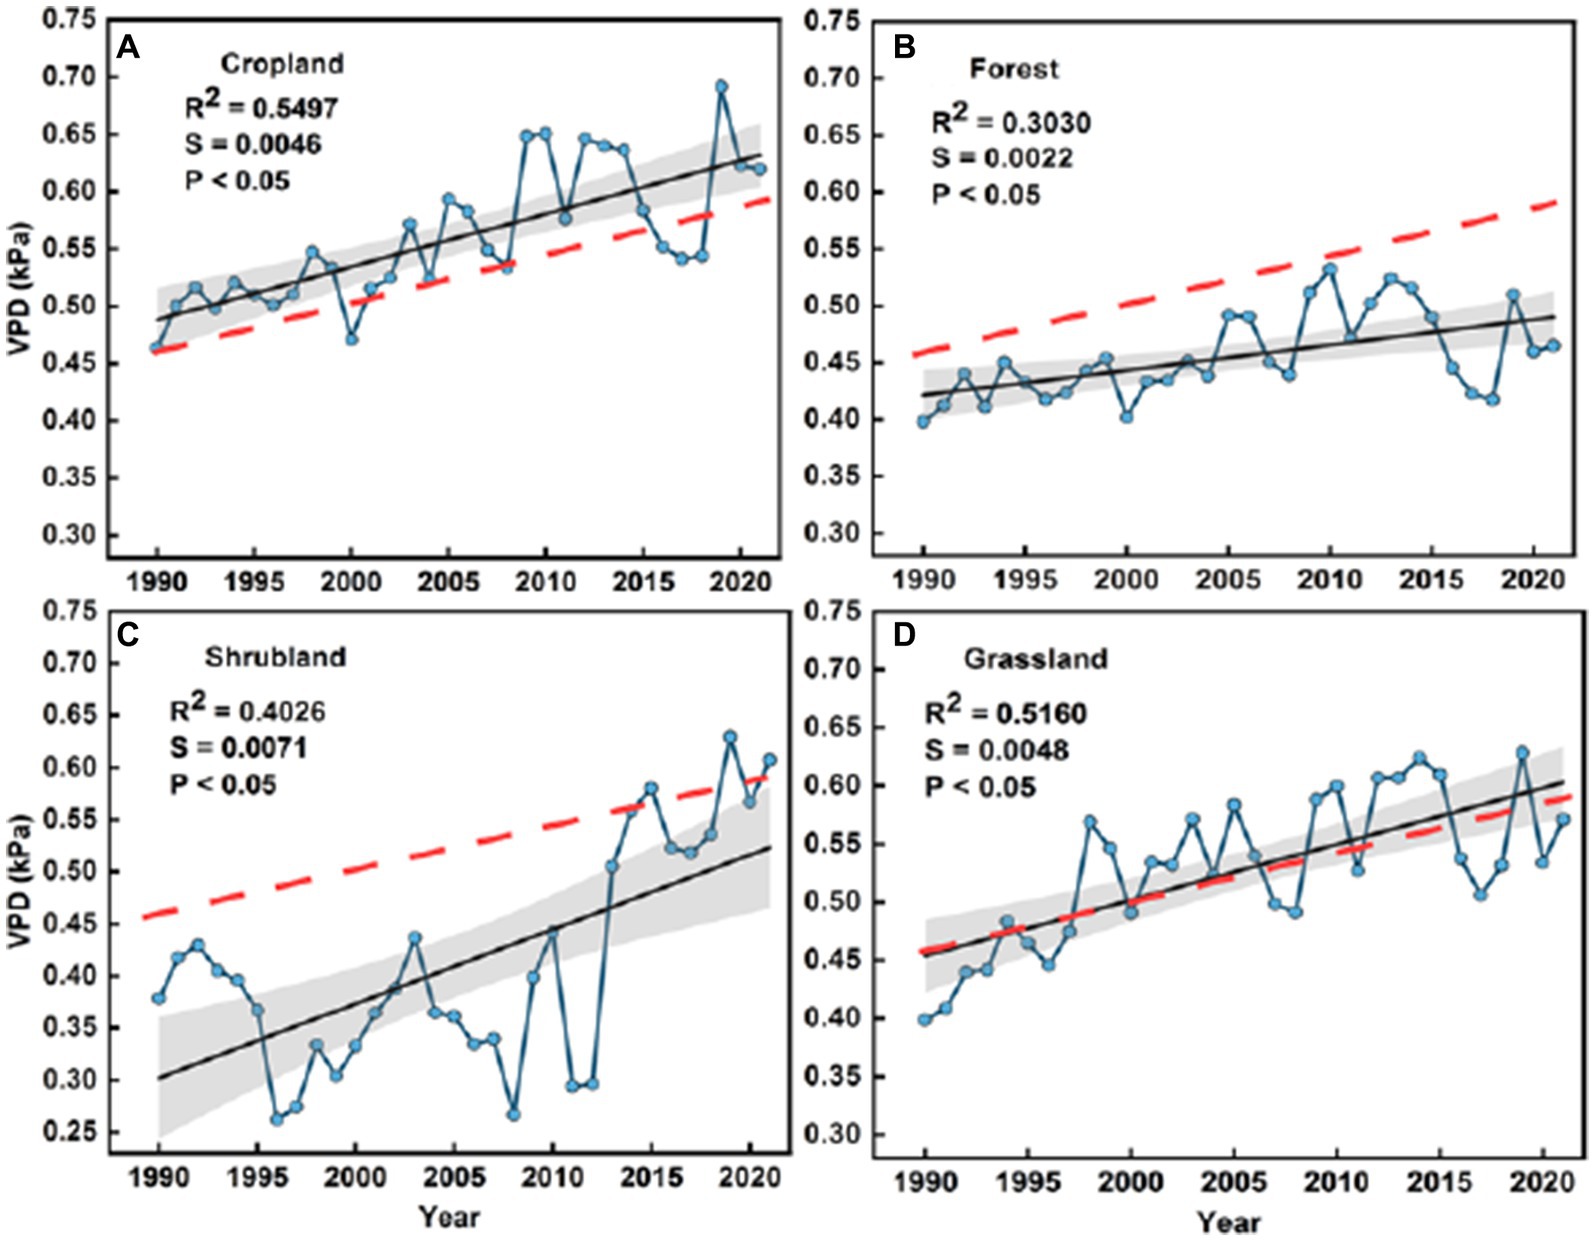
Figure 7. Time series of VPD for four ecological land types (A–D) of Yunnan during 1990 to 2021. The red dotted lines represent the slope of ecological land types (S = 0.0042), and the gray shaded area represents the confidence interval, S in the subplots represent the slope of each ecological land type, respectively.
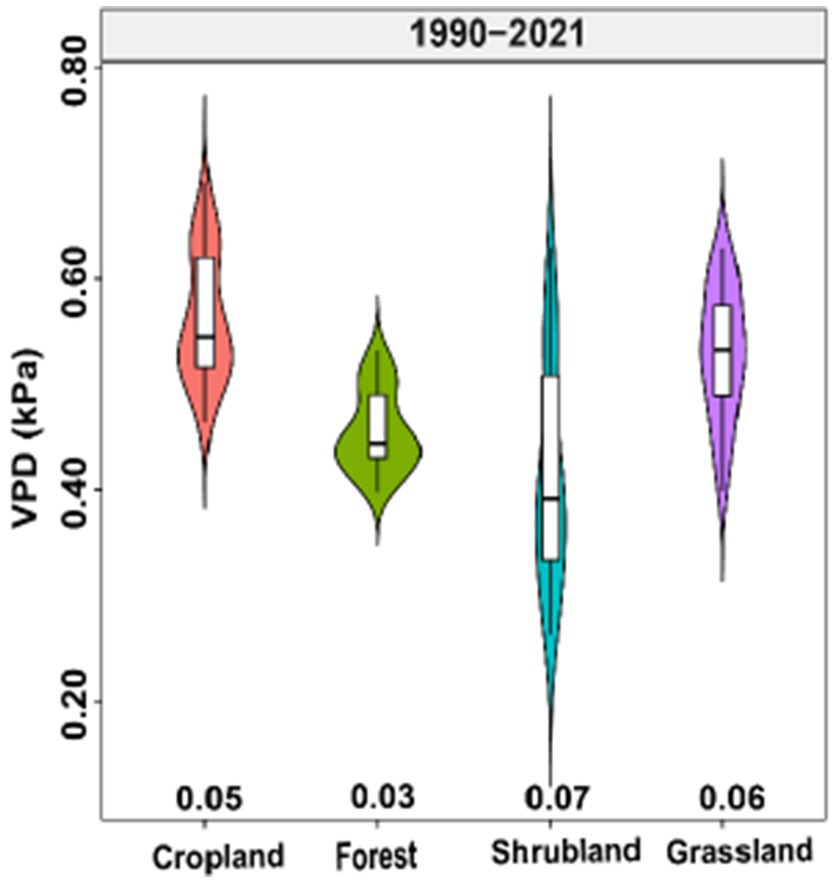
Figure 8. VPD trends (kPa) in four ecological land types during 1990 to 2021, the values in x-axis represent VPD trends from 1990 to 2021 (kPa / decade).
3.4 Relationship between VPD and climatic factors
We used partial correlation analysis to study the relationship between VPD and climatic factors (T, RH, Tmax, Tmin, Precip). Before conducting the partial correlation analysis, we initially performed a bivariate correlation analysis to examine the associations between VPD and the climatic factors. The results of the study indicated that across all subregions in Yunnan, the influence of VPD is significantly positive, while RH exerts a significant negative impact on VPD (Figure 9). The effect of Tmax on VPD is not particularly significant, and Tmin negatively affects VPD but is not significant. Precip has a significant negative impact on VPD. The variance explained by the independent variables revealed that in the study area, RH accounts for 65% of the variability in VPD, T contributes to 25%, while the explanatory power of other variables is relatively low.
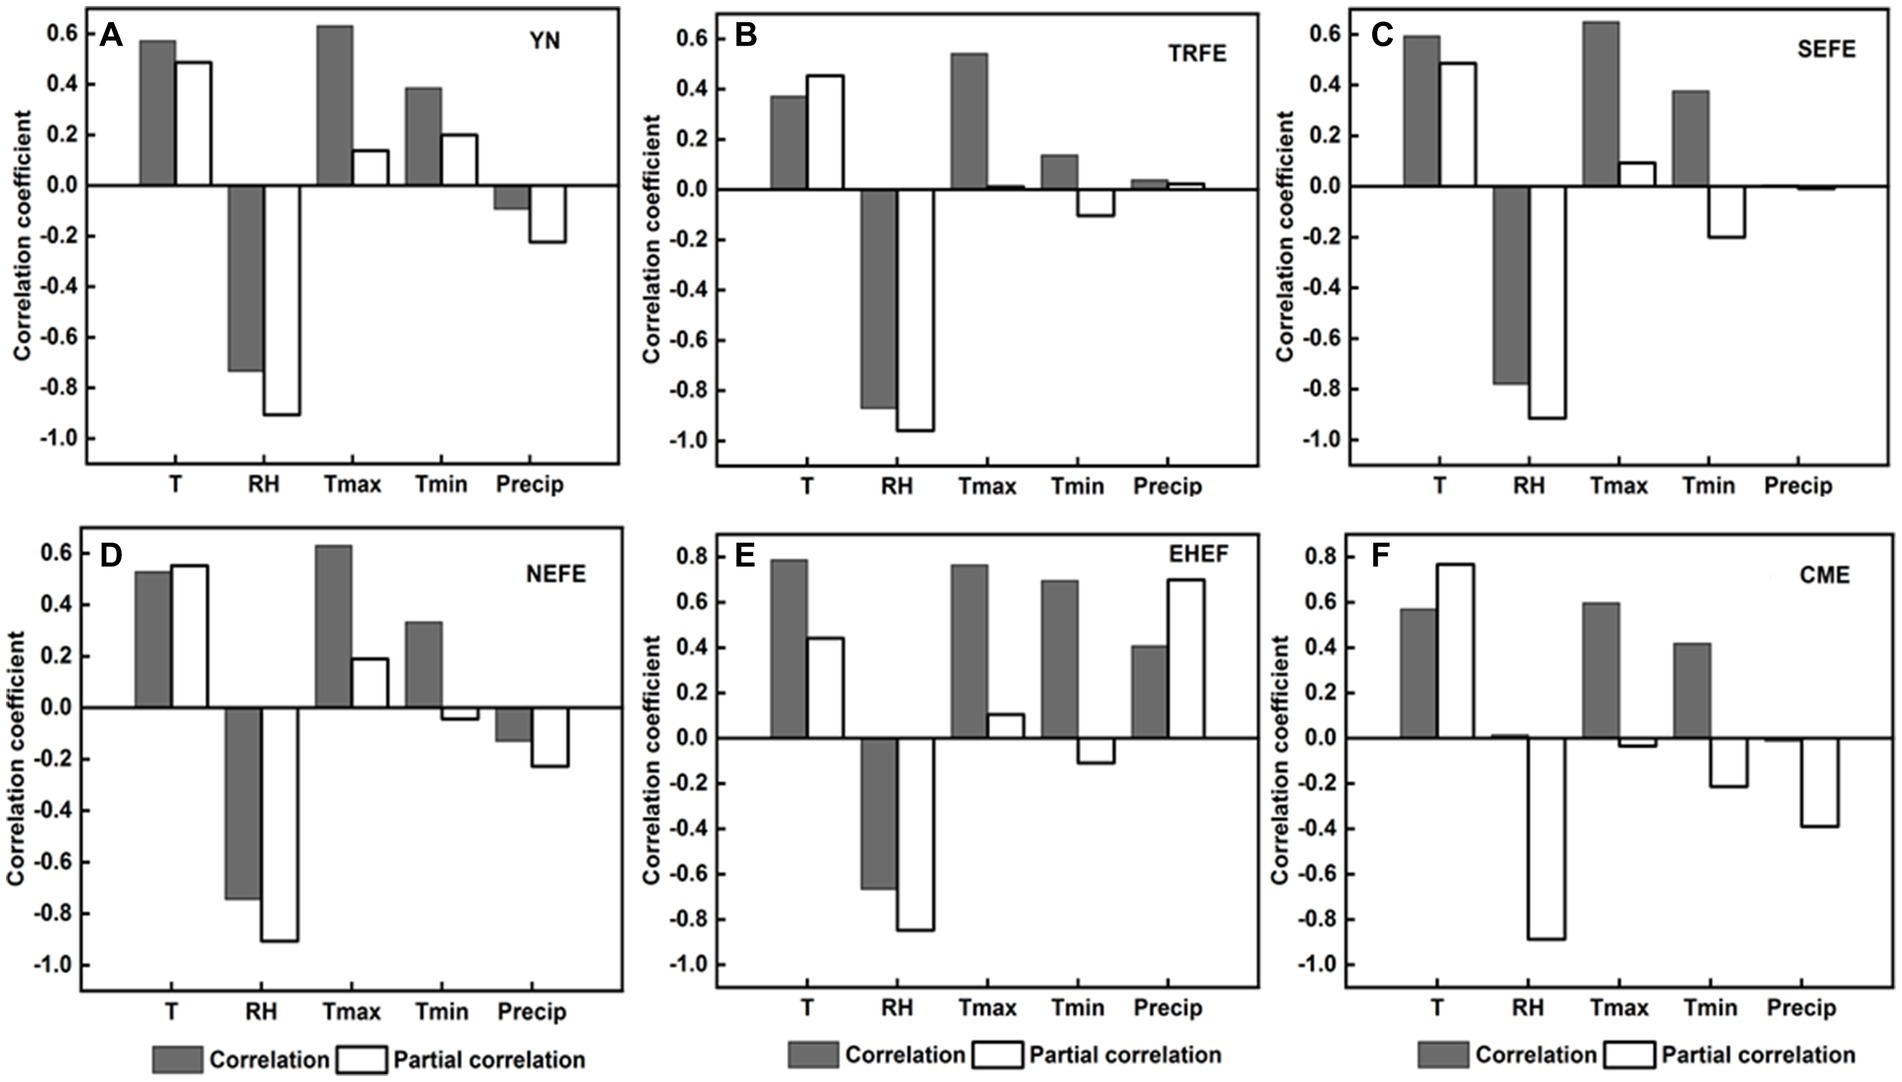
Figure 9. Partial correlation analysis between VPD and climate factors in Yunnan (A) and its ecological subregions (B–F). T, RH, Tmax, Tmin and Precip represent temperature, relative humidity, maximum temperature, minimum temperature, and precipitation, respectively.
Among different subregions (Figure 9), the correlation between CME and T is the highest (0.767, p < 0.05), the correlation between NEFE and RH is the highest (−0.907, p < 0.05). Additionally, it is noteworthy that Tmax exhibits a significant positive correlation with VPD changes in both the SEFE (0.093, p < 0.05) and NEFE (0.19, p < 0.05) regions. Tmin shows a significant negative correlation with VPD changes in the TRFE (−0.104, p < 0.05) and SEFE (−0.2, p < 0.05) regions, while Precip displays a significant negative correlation with VPD changes in the NEFE (−0.228, p < 0.05) and CME (−0.224, p < 0.05) regions. The analysis results indicated that, apart from T and RH, there are differences in the influencing factors of VPD among the subregions.
4 Discussion
4.1 Trends in VPD at multiple scales
As global temperatures increase, several studies suggested that warming is associated with atmospheric drying (Held and Soden, 2006; Cook et al., 2014). Since the 1980s, temperatures in Yunnan have been increasing, marking a shift from a wetter to a drier climate (Zhou et al., 2018). By the 1990s, the significance level of the warming trend notably increased, with some stations even surpassing a significance level of p < 0.001 (Zhou et al., 2018). This supports patterns presented in Figure 4C, indicating pronounced intensification and persistence of drought conditions during this period. The changes in VPD in regions of higher significance levels are likely primarily influenced by temperature shifts (Huang, 2011; Zhou et al., 2018). At a larger regional scales, increases in VPD are always accompanied by heatwaves or drought events, and rising VPD is responsive to the global warming trend (Grossiord et al., 2020; Li et al., 2021). In regions like China where extreme events occur frequently, the spatiotemporal characteristics of VPD are also affected, as seen in the correspondence between extreme VPD days and extreme events in Northwest China (Dong et al., 2024). Atmospheric circulation anomalies were found to play significant roles in drought occurrences in Yunnan Province, indicating that changes in local VPD are influenced to some extent by large-scale regional climate changes or climate events (Lü et al., 2012). This was supported by this study, where changes of VPD in Yunnan were correlated with mean surface temperature in China, as shown in the Supplementary Figure S1.
Agreeing with results from other global regions (Xie et al., 2010; Li et al., 2021; Zhuang et al., 2021; Fang et al., 2022), an increasing trend in VPD were shown in Yunnan and its different subregions, and varied by subregions and seasons. In particular, the VPD increases in northeastern Yunnan (EHEF) and in the northwest (CME) were lower than in other subregions. Under different climate scenarios, the climate characteristics in northeastern Yunnan are warming and humid, with both precipitation and temperature increasing. Therefore, VPD increases were slower in these subregions compared to other areas, suggesting that increased VPD there may be attributable to increased moisture (Zomer et al., 2015). Additionally, current and future climate characteristics in northwestern Yunnan are cold and humid, with both temperature and precipitation increasing simultaneously (Zomer et al., 2015). For this region increasing VPD may be more influenced by changes in temperature, with less influence from moisture. This study also revealed that spring and summer experienced a rapid increase in VPD, which is consistent with results of VPD studies conducted in Spain and Xinjiang, China. It is widely acknowledged that the rate of VPD increase during the warmer seasons is notably greater than during the colder seasons (Li et al., 2021; Noguera et al., 2023), as we found. However, unlike other regions, the transition of atmospheric drought from summer to autumn in Yunnan is very rapid, with the maximum VPD dropping quickly from 1.10 to 0.79 kPa (Figure 3), which indicates that the onset of the wet season significantly alleviates seasonal drought, but this alleviation effect has a certain lag (Abbas et al., 2014; Ding and Gao, 2020).
In comparing VPD among the ecological barriers, we found the VPD in the dry-hot valley regions significantly exceeded that of other areas (Sun et al., 2019). An in-depth analysis of a decade of drought characterization in these dry and hot valleys revealed a consistent trend of increasing drought corresponding to changes in VPD. This result not only indicates an exacerbation of drought severity in the area, but also underscores the applicability of VPD as a drying indicator within such dry-hot valleys. Under future climate scenarios, the dry-hot valleys are predicted to experience more drought (Zomer et al., 2015). Ecosystems in dry-hot valleys are extremely fragile, prone to severe soil erosion, subject to significant land use changes and vegetation restoration is challenging in these areas due to these factors, collectively exacerbating the drought conditions in day and hot river valleys (Dong et al., 2013; Pei et al., 2018). These findings highlight the sensitivity and fragility of the dry-hot valleys in the context of global warming, illustrating the persistent drought and ecological stress this region faces in warming conditions.
4.2 Increasing VPD and regional ecological dynamics
Increased VPD closes plant stomata, restricting transpiration by the vegetation community and consequently suppressing plant growth (Grossiord et al., 2020; Madani et al., 2020). Some studies even suggest that VPD is the dominant factor controlling global Gross Primary Productivity (Madani et al., 2020; He et al., 2022). Climate and emissions modeling has projected that VPD will increase further in the future (Yuan et al., 2019). This implies that the impact of VPD on plant will persist or increase. Given the significant spatiotemporal variations in VPD observed in Yunnan, coupled with the trends identified in this study, it is anticipated that high-altitude (CME) and specific (EHEF) regions will emerge as new focal points for plant ecosystems. Contrarily, plant water stress within dry-hot valleys is anticipated to more rapidly intensify.
There were also distinct variations in drought tolerance across different ecological land types (Li et al., 2021). Our study found that increasing trends in VPD are larger in Shrublands and Grasslands compared to the other two ecological land types. Research across six major continents has also confirmed that the impact of drought on global grassland and shrubland ecosystems has been significantly underestimated (Simeng et al., 2019). Additionally, researchers have found that the extent of drought stress on shrubs is most susceptible to human activities, followed by forest, cropland, and grasslands (Cao et al., 2022). The research outcomes mentioned above bear resemblance to our study, as both suggest that shrubland are more prone to drought or, in other words, more sensitive to drought conditions. Therefore, closely monitoring the variations shrublands within Yunnan will be essential for understanding the drought conditions in the region.
5 Conclusion
This study examined the changes in VPD and two related climate variables (T, RH) in Yunnan from 1980 to 2021. Additionally, we evaluated VPD changes in five subregions (TRFE, SEFE, NEFE, EHEF, CME), seven ecological barriers (EAW, SEK, ETF, ETF, LDT, JDT, RDT) and four ecological land types (Cropland, Forest, Shrubland, and Grassland), along with exploring correlations between VPD and elevation. Our main findings are summarized as follows:
1. From 1980 to 2021, VPD increased across all regions in Yunnan, as evidenced by 94% (74% significant) of observation stations, illustrating a general trend of atmospheric drying in Yunnan. The drying trend was particularly notable during the warm seasons (spring and summer) between 1980 and 2021, as supported by 95% (58% significant) and 95% (70% significant) of the observation stations, respectively. For different subregions, the most significant drying occurred in the SEFE (0.04 kPa / decade), while the EHEF (0.01 kPa / decade) region showed the lowest drying trend.
2. For different ecological barriers, increasing trends in VPD were highest in the dry-hot valleys. This suggests that the dry-hot valleys are more sensitive to climate change and are a priority area for ecological research. In addition, we found that VPD across Yunnan increased most rapidly between 1991 and 2010.
3. The changes in VPD had strong and decreasing elevation relationship. This dependence was found to be stronger at higher elevations.
4. In the different ecological land types, the change in VPD was greatest in the Shrubland (0.07 kPa / decade), followed by the Grassland and Cropland. VPD in the Forest (0.03 kPa / decade) showed the least increase. This suggests that forests can effectively mitigate drought due to climate change.
5. The increase of VPD in Yunnan was attributed to the decrease in RH and the increase in T, with RH explaining 65% and T explaining 25% of the change. The increase in Pre had a significant negative impact on VPD, while the effects of Tmax and Tmin on VPD were not significant.
6 Equations and figures
6.1 Equations
Where i and j represent different pairs of data points with i < j, and (xi, yi) and (xj, yj) are the coordinates of these data points. S represents the slope. Positive values of S denote increasing trends in the data, while negative values are decreasing trends. A value of zero indicates the absence of a significant trend in. This interpretation of slope is commonly used in change point analysis and trend detection to assess the direction and magnitude of trends in time-series data. In this study, trends were considered to be statistically significant at the p < 0.05 level.
Where, Y represents VPD, and x1 to x5, respectively, refer to T, RH, Tmax, Tmin, and Precip, R represents the partial correlation coefficient.
Data availability statement
The datasets presented in this study can be found in online repositories. The names of the repository/repositories and accession number(s) can be found at the following URLs: (1) the data from 108 meteorological stations in Yunnan are available from the National Meteorological Information Center of the China Meteorological Administration at http://data.cma.cn/; (2) the land cover of Yunnan is available from 1990 to 2021 from Wuhan University at https://zenodo.org/records/8176941; (3) the Digital Elevation Model (DEM) in Yunnan is available from the Chinese Academy of Sciences Resource and Environment Science Data Center at https://www.resdc.cn.
Author contributions
HQ: Writing – original draft, Writing – review & editing. YT: Data curation, Formal analysis, Writing – review & editing. TS: Data curation, Formal analysis, Writing – review & editing. DS: Writing – review & editing. HC: Conceptualization, Data curation, Writing – review & editing. SZ: Data curation, Visualization, Writing – review & editing. QX: Data curation, Visualization, Writing – review & editing. YZ: Methodology, Resources, Writing – review & editing. JC: Methodology, Resources, Writing – review & editing. GZ: Software, Writing – review & editing. JX: Funding acquisition, Writing – review & editing.
Funding
The author(s) declare financial support was received for the research, authorship, and/or publication of this article. This research was supported by Yunnan Department of Sciences and Technology of China (grant nos.: 202101AS070045, 202205 AM070007, 202302AE090023 and 202303AP140001).
Acknowledgments
We thank all the authors and reviewers who participated in this Research Topic.
Conflict of interest
The authors declare that the research was conducted in the absence of any commercial or financial relationships that could be construed as a potential conflict of interest.
Publisher’s note
All claims expressed in this article are solely those of the authors and do not necessarily represent those of their affiliated organizations, or those of the publisher, the editors and the reviewers. Any product that may be evaluated in this article, or claim that may be made by its manufacturer, is not guaranteed or endorsed by the publisher.
Supplementary material
The Supplementary material for this article can be found online at: https://www.frontiersin.org/articles/10.3389/ffgc.2024.1397028/full#supplementary-material
Footnotes
1. ^https://sthjt.yn.gov.cn/zrst/swdyxbh/200911/t20091109_11143_wap.html
2. ^https://www.yn.gov.cn/zwgk/zcwj/zxwj/201911/t20191101_184159.html
References
Abbas, S., Nichol, J., Qamer, F., and Xu, J. (2014). Characterization of drought development through remote sensing: a case study in Central Yunnan, China. Remote Sens. 6, 4998–5018. doi: 10.3390/rs6064998
Barkhordarian, A., Saatchi, S. S., Behrangi, A., Loikith, P. C., and Mechoso, C. R. (2019). A recent systematic increase in vapor pressure deficit over tropical South America. Sci. Rep. 9:15331. doi: 10.1038/s41598-019-51857-8
Behrangi, A., Loikith, P., Fetzer, E., Nguyen, H., and Granger, S. (2015). Utilizing humidity and temperature data to advance monitoring and prediction of meteorological drought. Climate. 3, 999–1017. doi: 10.3390/cli3040999
Cao, S., Zhang, L., He, Y., Zhang, Y., Chen, Y., Yao, S., et al. (2022). Effects and contributions of meteorological drought on agricultural drought under different climatic zones and vegetation types in Northwest China. Sci. Total Environ. 821:153270. doi: 10.1016/j.scitotenv.2022.153270
Chang, Y., Ding, Y., Zhao, Q., Qin, J., and Zhang, S. (2023). Elevation-dependent changes in the trend of reference evapotranspiration in the Tibetan plateau during 1960–2017. Int. J. Climatol. 43, 2077–2095. doi: 10.1002/joc.7964
Cook, B. I., Smerdon, J. E., Seager, R., and Coats, S. (2014). Global warming and 21st century drying. Clim. Dyn. 43, 2607–2627. doi: 10.1007/s00382-014-2075-y
Ding, T., and Gao, H. (2020). The record-breaking extreme drought in Yunnan Province, Southwest China during spring-early summer of 2019 and possible causes. J. Meteorol. Res. 34, 997–1012. doi: 10.1007/s13351-020-0032-8
Dong, J., Wu, L., Zeng, W., Xiao, X., and He, J. (2024). Analysis of spatial-temporal trends and causes of vapor pressure deficit in China from 1961 to 2020. Atmos. Res. 299:107199. doi: 10.1016/j.atmosres.2023.107199
Dong, Y., Xiong, D., Su, Z., Li, J., Yang, D., Zhai, J., et al. (2013). Critical topographic threshold of gully erosion in Yuanmou Dry-Hot Valley in southwestern China. Phys. Geogr. 34, 50–59. doi: 10.1080/02723646.2013.778691
Fan, D., Liu, Y., Yao, Y., Cai, L., and Wang, S. (2023). Changes in the relationship between vapour pressure deficit and water use efficiency with the drought recovery time: a case study of the Yellow River Basin. J. Environ. Manag. 326:116756. doi: 10.1016/j.jenvman.2022.116756
Fang, Z., Zhang, W., Brandt, M., Abdi, A. M., and Fensholt, R. (2022). Globally increasing atmospheric aridity over the 21st century. Earth’s Future 10:e2022EF003019. doi: 10.1029/2022EF003019
Ficklin, D. L., and Novick, K. A. (2017). Historic and projected changes in vapor pressure deficit suggest a continental-scale drying of the United States atmosphere. JGR-Atmos. 122, 2061–2079. doi: 10.1002/2016JD025855
Fu, Z., Ciais, P., Prentice, I. C., Gentine, P., Makowski, D., Bastos, A., et al. (2022). Atmospheric dryness reduces photosynthesis along a large range of soil water deficits. Nat. Commun. 13:989. doi: 10.1038/s41467-022-28652-7
Grossiord, C., Buckley, T. N., Cernusak, L. A., Novick, K. A., Poulter, B., Siegwolf, R. T. W., et al. (2020). Plant responses to rising vapor pressure deficit. New Phytol. 226, 1550–1566. doi: 10.1111/nph.16485
Han, Y., Lin, Y., Zhou, P., Duan, J., and Cao, Z. (2023). Dynamic change, driving mechanism and spatiotemporal prediction of the normalized vegetation index: a case study from Yunnan Province, China. Front. Ecol. Evol. 11:1177849. doi: 10.3389/fevo.2023.1177849
He, B., Chen, C., Lin, S., Yuan, W., Chen, H. W., Chen, D., et al. (2022). Worldwide impacts of atmospheric vapor pressure deficit on the interannual variability of terrestrial carbon sinks. Natl. Sci. Rev. 9:nwab150. doi: 10.1093/nsr/nwab150
He, P., Han, Z., He, M., Meng, X., Ma, X., Liu, H., et al. (2023). Atmospheric dryness thresholds of grassland productivity decline in China. J. Environ. Manag. 338:117780. doi: 10.1016/j.jenvman.2023.117780
Held, I. M., and Soden, B. J. (2006). Robust responses of the hydrological cycle to global warming. J. Clim. 19, 5686–5699. doi: 10.1175/JCLI3990.1
Huang, Z. (2011). Changes of dry-wet climate in the dry season in Yunnan (1961–2007). Adv. Clim. Chang. Res. 2, 49–54. doi: 10.3724/SP.J.1248.2011.00049
Jain, P., Castellanos-Acuna, D., Coogan, S. C. P., Abatzoglou, J. T., and Flannigan, M. D. (2022). Observed increases in extreme fire weather driven by atmospheric humidity and temperature. Nat. Clim. Chang. 12, 63–70. doi: 10.1038/s41558-021-01224-1
Li, S., Wang, G., Chai, Y., Miao, L., Fiifi Tawia Hagan, D., Sun, S., et al. (2023). Increasing vapor pressure deficit accelerates land drying. J. Hydrol. 625:130062. doi: 10.1016/j.jhydrol.2023.130062
Li, S., Wang, G., Zhu, C., Lu, J., Ullah, W., Fiifi Tawia Hagan, D., et al. (2023). Vegetation growth due to CO2 fertilization is threatened by increasing vapor pressure deficit. J. Hydrol. 619:129292. doi: 10.1016/j.jhydrol.2023.129292
Li, M., Yao, J., Guan, J., and Zheng, J. (2021). Observed changes in vapor pressure deficit suggest a systematic drying of the atmosphere in Xinjiang of China. Atmos. Res. 248:105199. doi: 10.1016/j.atmosres.2020.105199
Liu, X., Sun, G., Fu, Z., Ciais, P., Feng, X., Li, J., et al. (2023). Compound droughts slow down the greening of the earth. Glob. Chang. Biol. 29, 3072–3084. doi: 10.1111/gcb.16657
Lü, J., Ju, J., Ren, J., and Gan, W. (2012). The influence of the madden-Julian oscillation activity anomalies on Yunnan’s extreme drought of 2009–2010. Sci. China Earth Sci. 55, 98–112. doi: 10.1007/s11430-011-4348-1
Madani, N., Parazoo, N. C., Kimball, J. S., Ballantyne, A. P., Reichle, R. H., Maneta, M., et al. (2020). Recent amplified global gross primary productivity due to temperature increase is offset by reduced productivity due to water constraints. AGU Adv. 1:e2020AV000180. doi: 10.1029/2020AV000180
Man, M., Kalčík, V., Macek, M., Brůna, J., Hederová, L., Wild, J., et al. (2023). MYCLIM: microclimate data handling and standardised analyses in R. Methods Ecol. Evol. 14, 2308–2320. doi: 10.1111/2041-210X.14192
Mirabel, A., Girardin, M. P., Metsaranta, J., Way, D., and Reich, P. B. (2023). Increasing atmospheric dryness reduces boreal forest tree growth. Nat. Commun. 14:6901. doi: 10.1038/s41467-023-42466-1
Mueller, S. E., Thode, A. E., Margolis, E. Q., Yocom, L. L., Young, J. D., and Iniguez, J. M. (2020). Climate relationships with increasing wildfire in the southwestern US from 1984 to 2015. For. Ecol. Manag. 460:117861. doi: 10.1016/j.foreco.2019.117861
N. L. J. (1949). Rank Correlation Methods. By Maurice G. Kendall, M.A. [Pp. vii + 160. London: Charles Griffin and Co. Ltd., 42 Drury Lane, 1948. 18s.]. Journal of the Institute of Actuaries. 75, 140–141. doi: 10.1017/S0020268100013019
Noguera, I., Vicente-Serrano, S. M., Peña-Angulo, D., Domínguez-Castro, F., Juez, C., Tomás-Burguera, M., et al. (2023). Assessment of vapor pressure deficit variability and trends in Spain and possible connections with soil moisture. Atmos. Res. 285:106666. doi: 10.1016/j.atmosres.2023.106666
Pei, J., Yang, W., Cai, Y., Yi, Y., and Li, X. (2018). Relationship between vegetation and environment in an arid-Hot Valley in southwestern China. Sustain. For. 10:4774. doi: 10.3390/su10124774
Qiu, J., Shen, Z., and Xie, H. (2023). Drought impacts on hydrology and water quality under climate change. Sci. Total Environ. 858:159854. doi: 10.1016/j.scitotenv.2022.159854
Rao, W., Shen, Z., and Duan, X. (2023). Spatiotemporal patterns and drivers of soil erosion in Yunnan, Southwest China: RULSE assessments for recent 30 years and future predictions based on CMIP6. Catena 220:106703. doi: 10.1016/j.catena.2022.106703
Rao, K., Williams, A. P., Diffenbaugh, N. S., Yebra, M., and Konings, A. G. (2022). Plant-water sensitivity regulates wildfire vulnerability. Nat Ecol Evol. 6, 332–339. doi: 10.1038/s41559-021-01654-2
Rashid, M. A., Andersen, M. N., Wollenweber, B., Zhang, X., and Olesen, J. E. (2018). Acclimation to higher VPD and temperature minimized negative effects on assimilation and grain yield of wheat. Agric. For. Meteorol. 248, 119–129. doi: 10.1016/j.agrformet.2017.09.018
R Core Team (2023). R: A Language and environment for statistical computing. Vienna, Austria: R Foundation for Statistical Computing. Available at: https://www.R-project.org/.
Sadeqi, A., Tabari, H., and Dinpashoh, Y. (2022). Spatio-temporal analysis of heating and cooling degree-days over Iran. Stoch. Env. Res. Risk A. 36, 869–891. doi: 10.1007/s00477-021-02064-3
Sen, P. K. (1968). Estimates of the regression coefficient based on Kendall’s tau. J. Am. Stat. Assoc. 63, 1379–1389. doi: 10.1080/01621459.1968.10480934
Shi, H., and Chen, J. (2018). Characteristics of climate change and its relationship with land use/cover change in Yunnan Province, China. Int. J. Climatol. 38, 2520–2537. doi: 10.1002/joc.5404
Simeng, W, Dazhao, W, and Chang, H. A comparative study of using ANUSPLIN and GWR models for downscaled GPM precipitation. In: 2019 8th International Conference on Agro-Geoinformatics (Agro-Geoinformatics). Istanbul, Turkey: IEEE; (2019). p. 1–5.
Song, Y., Jiao, W., Wang, J., and Wang, L. (2022). Increased global vegetation productivity despite rising atmospheric dryness over the last two decades. Earth’s Future 10:e2021EF002634. doi: 10.1029/2021EF002634
Sun, L., Cai, Y., Yang, W., Yi, Y., and Yang, Z. (2019). Climatic variations within the dry valleys in southwestern China and the influences of artificial reservoirs. Clim. Chang. 155, 111–125. doi: 10.1007/s10584-019-02457-y
Wang, P., Tong, X., Qiu, J., Chen, Y., Wu, S., Chan, T. O., et al. (2022). Amplification effect of urbanization on atmospheric aridity over China under past global warming. Earth’s Future 10:e2021EF002335. doi: 10.1029/2021EF002335
Wang, J., Wu, R., He, D., Yang, F., Hu, P., Lin, S., et al. (2018). Spatial relationship between climatic diversity and biodiversity conservation value. Conserv. Biol. 32, 1266–1277. doi: 10.1111/cobi.13147
Xie, H., Ye, J., and Liu, X. (2010). Warming and drying trends on the Tibetan plateau (1971–2005). Theor. Appl. Climatol. 101, 241–253. doi: 10.1007/s00704-009-0215-9
Xu, W., Xia, X., Piao, S., Wu, D., Li, W., Yang, S., et al. (2024). Weakened increase in global near-surface water vapor pressure during the last 20 years. Geophys. Res. Lett. 51:e2023GL107909. doi: 10.1029/2023GL107909
Yang, J., and Huang, X. (2021). The 30 m annual land cover dataset and its dynamics in China from 1990 to 2019. Earth Syst Sci Data. 13, 3907–3925. doi: 10.5194/essd-13-3907-2021
Yang, D., Wang, Y. S. D., Wang, Q., Ke, Y., Zhang, Y. B., Zhang, S. B., et al. (2023). Physiological response and photosynthetic recovery to an extreme drought: evidence from plants in a dry-hot valley savanna of Southwest China. Sci. Total Environ. 868:161711. doi: 10.1016/j.scitotenv.2023.161711
Yao, Y., Liao, X., Xiao, J., He, Q., and Shi, W. (2023). The sensitivity of maize evapotranspiration to vapor pressure deficit and soil moisture with lagged effects under extreme drought in Southwest China. Agric. Water Manag. 277:108101. doi: 10.1016/j.agwat.2022.108101
Yuan, W., Zheng, Y., Piao, S., Ciais, P., Lombardozzi, D., Wang, Y., et al. (2019). Increased atmospheric vapor pressure deficit reduces global vegetation growth. Sci. Adv. 5:eaax1396. doi: 10.1126/sciadv.aax1396
Zhang, X., Kang, S., Zhang, L., and Liu, J. (2010). Spatial variation of climatology monthly crop reference evapotranspiration and sensitivity coefficients in Shiyang river basin of Northwest China. Agric. Water Manag. 97, 1506–1516. doi: 10.1016/j.agwat.2010.05.004
Zheng, C., Wang, S., Chen, J., Xiang, N., Sun, L., Chen, B., et al. (2023). Divergent impacts of VPD and SWC on ecosystem carbon-water coupling under different dryness conditions. Sci. Total Environ. 905:167007. doi: 10.1016/j.scitotenv.2023.167007
Zhong, Z., He, B., Wang, Y. P., Chen, H. W., Chen, D., Fu, Y. H., et al. (2023). Disentangling the effects of vapor pressure deficit on northern terrestrial vegetation productivity. Sci. Adv. 9:eadf3166. doi: 10.1126/sciadv.adf3166
Zhou, J. Q., Huang, W., Yong, Z., Meng, Z., Meng, L., and Bo-Tao, Z. (2018). Climate comfort distribution, change and projection in Yunnan province. Climate Change Res. 14, 144–154. doi: 10.12006/j.issn.1673-1719.2017.065
Zhuang, Y., Fu, R., Santer, B. D., Dickinson, R. E., and Hall, A. (2021). Quantifying contributions of natural variability and anthropogenic forcings on increased fire weather risk over the western United States. Proc. Natl. Acad. Sci. USA 118:e2111875118. doi: 10.1073/pnas.2111875118
Keywords: atmospheric dryness, VPD, spatiotemporal trends, Yunnan, ecological land types
Citation: Qin H, Tan Y, Shen T, Schaefer DA, Chen H, Zhou S, Xu Q, Zhu Y, Cheng J, Zhao G and Xu J (2024) Spatiotemporal trends of atmospheric dryness during 1980–2021 in Yunnan, China. Front. For. Glob. Change. 7:1397028. doi: 10.3389/ffgc.2024.1397028
Edited by:
Fenghui Yuan, University of Minnesota Twin Cities, United StatesReviewed by:
Amin Sadeqi, University of Turku, FinlandNing Chen, Chinese Academy of Sciences (CAS), China
Copyright © 2024 Qin, Tan, Shen, Schaefer, Chen, Zhou, Xu, Zhu, Cheng, Zhao and Xu. This is an open-access article distributed under the terms of the Creative Commons Attribution License (CC BY). The use, distribution or reproduction in other forums is permitted, provided the original author(s) and the copyright owner(s) are credited and that the original publication in this journal is cited, in accordance with accepted academic practice. No use, distribution or reproduction is permitted which does not comply with these terms.
*Correspondence: Ting Shen, c2hlbnRpbmdAbWFpbC5raWIuYWMuY24=; Jianchu Xu, anh1QG1haWwua2liLmFjLmNu