- 1Faculty of Geographical Science, Institute of Disaster Risk Science, Beijing Normal University, Beijing, China
- 2Southern Marine Science and Engineering Guangdong Laboratory (Zhuhai), Zhuhai, China
Forest carrying capacity is a key factor related to resources, environment, and socio-economic development, and is also an important indicator for measuring the sustainable development capacity of regional society. Previous research has focused more on the management, protection, and utilization of forest resources by sovereign states, and regional assessments of sustainable development management between countries are not common. This study aims to explore the spatial–temporal distribution pattern of regional forest carrying capacity in Northeast Asia, and quantitatively evaluate the forest carrying capacity levels of China, Japan, and South Korea by establishing a comprehensive evaluation framework based on the Pressure-State-Response (PSR) model. We analyzed 16 evaluation indicators from 2010 to 2020 and compared the spatiotemporal distribution of forest carrying capacity in the three countries. The research results indicate that Japan and South Korea maintain a high-pressure and high carrying capacity state, while China exhibits a spatial pattern of high in the west and low in the east. The region with the lowest carrying capacity is Tianjin (with a score of 1.28 in 2010 and 1.44 in 2020). The carrying capacity of forests in China shows a positive spatial correlation, and there is a high concentration of carrying capacity in the northwest region. Therefore, it is necessary to develop targeted forestry management policies to address regional imbalances and strengthen the practice of sustainable forest management in Northeast Asia.
1 Introduction
The concept of carrying capacity has received increasing attention with the sharp increase in population, rapid economic development and the serious problems of resource crisis and environmental degradation (MacLeod and Cooper, 2019). Carrying capacity, derived from ecology, refers to the maximum number of individuals that can sustain a certain species within a certain time, space, and environmental conditions (Del Monte-Luna et al., 2004). With the unprecedented pressure brought to ecosystems by human predatory exploitation, the concept of carrying capacity has gradually developed and applied to human ecology. The study of ecosystem carrying capacity, as one of the tools for evaluating sustainable development, and its theory and methods as one of the means to measure sustainable development, has received widespread attention from scholars and is still at the forefront of ecology, geography, and environmental science (OECD, 2009; Oborne, 2010; Feng et al., 2017; Li et al., 2020). The academic community has made persisting explorations for this, and has successively proposed related concepts such as Limits to Growth (Robinson, 1973), Safety Minimum Standard (Bishop, 1978), Ecological Footprint (Bazan, 1997), Tolerable Windows (Bruckner et al., 2003), and Critical loads (Linder et al., 2013). The accurate calculation of the Earth’s carrying capacity and the Earth’s resilience to human social and economic activities is a fundamental issue in sustainable development strategies (Xue et al., 2017).
As the largest terrestrial ecosystem, forests play an irreplaceable role in the survival and development of humankind and are a necessary safeguard for the sustainable development of society. As the mainstay of terrestrial ecosystems, forests have important ecological and environmental functions, such as maintaining soil and water, preventing winds and fixing sands, conserving water, regulating the climate, and promoting the global carbon cycle and biogeochemical cycle (Lamarque et al., 2011). Changes in forests can profoundly affect the global climate, as well as the health and stability of the Earth’s ecosystem. However, within a certain time scale, there is a certain finiteness of forest resources, which is specifically reflected in the fact that the total amount of forest resources within a region is limited, while the amount and rate of output of forests are limited. At the same time, the renewal capacity and self-regulation capacity of the forest are also limited, and its ability to restore ecological balance is also limited, when the external interference exceeds the limit, the regulatory function of the forest will no longer work, and the ecological balance of the ecosystem will be very difficult to restore, and even lead to the disintegration of the ecosystem. Therefore, under certain spatial and temporal conditions, the ability of forests to satisfy human demand for forest products and environmental services is also limited. Within a certain spatial and temporal range, there exists a limit to the capacity of forests to withstand human activities and to be utilized by human society, and the threshold value is the carrying capacity of forests. The carrying capacity of forests consists of two parts. One is the maximum utilization limit of the forest resource system, mainly composed of animal and plant resources and forest land. Human society can bear and utilize these resources to maintain its own survival and development. Another is the maximum amount of production and commercial activities, that human society can carry out, from various types of land suitable for forests. Human beings can only develop and utilize forests within the carrying capacity of forests, and determine the direction, scale and speed of human activities according to the size of the regional carrying capacity of forests, and coordinate the relationship between human development and the distribution of forests. Therefore, the evaluation of the carrying capacity of forests at different spatial and temporal scales and how to increase the carrying capacity of forests to meet the increasing demand for forest products and environmental services from the growing population, economy and social development have become key issues that need to be resolved urgently.
Throughout the formation and practice of forest management theories in the world, from the early “Normal forest” theory to the theory of sustainable development, the idea of forest management has changed from emphasizing the economic benefits of forests to focusing on ecological and social benefits (Yuanchang et al., 2010). Until now, achieving sustainable development of forests has become a goal for countries and the basis for formulating national forest plans. Most countries in the world have a profound understanding of the multi benefits of forest resources and have formulated or revised laws and policies related to forest resource management, generally moving toward balancing the environmental, economic, and social benefits of forest management. Many researchers have conducted studies on the spatial and temporal distribution of forest carrying capacity. Song et al. proposed a forest environmental carrying capacity evaluation system from multiple aspects, and used the proposed deep learning based model to comprehensively evaluate and predict the forest environmental carrying capacity of 40 cities in the Yangtze River Delta region. At the same time, they dynamically evaluated the comprehensive scores of forest environmental carrying capacity in 34 provinces and cities in China from 2015 to 2020 (Song et al., 2022). Yu et al. evaluated the carrying capacity for vegetation (CCV) of Chinese forests using the Leaf Area Index (LAI) dataset and explored the contribution of environmental factors (Yu et al., 2024). Zhang et al. used three machine learning classification algorithms, namely support vector machine, random forest, and artificial neural network, and employed the PLUS model to analyze the spatiotemporal changes and future trends of China’s ecological carrying capacity from 1990 to 2040 (Zhang et al., 2023). However, previous research has focused more on the management, protection, and utilization of forest resources by sovereign countries. Regional cooperation at the national level has focused on controlling forest fires, pests and diseases, and other disasters (Poland and Rassati, 2019), while joint implementation of regional assessments for sustainable development management at the regional level is not common (Xuan, 2009).
China, Japan, and South Korea are the core countries with strong economic strength in Northeast Asia. They share a common and indivisible living space in terms of geography, environment, and ecosystem, maintaining the world’s average economic development speed, and are regarded as emerging economic centers in the world (Li et al., 2015). Japan and South Korea only took about 30 years to realize the industrialization and industrialization upgrading process that took developed countries 100–200 years to complete, creating the “East Asian Miracle,” which is the two successful cases of smooth entry into the developed economies since the middle of the 20th century (Zhang, 2013; IEA and KEEI, 2021). At the same time of rapid economic development, countries have joined the international conventions, in order to solve the increasingly serious problem of global environmental pollution and actively carry out international cooperation. The 9th Ministerial Declaration of the United Nations Forum on Forests in 2011 pointed out that efforts should be made to promote the synergy between climate change and sustainable forest management activities, and to promote the implementation of sustainable forest management and the achievement of global forest goals. In 2010, the Fifth China-Japan-South Korea Leaders Meeting emphasized the renewable, diverse, and multifunctional nature of forests, highlighting their multiple economic, social, and environmental benefits, as well as their importance in achieving the United Nations Millennium Development Goals.
Since the 1970s, the research on carrying capacity has been gradually expanded from land carrying capacity to more diversified concepts, and the research methods have also been further expanded, with more used methods such as Agro-Ecological Zones (FAO, 1996), System Dynamics (Karnopp et al., 1976), Ecological footprint analysis (Rees, 1992), Energy Analysis (Odum, 1995), and so on. Criteria and indicators have certain advantages in evaluating sustainable forest management and are often considered appropriate tools for determining, evaluating, and monitoring the long-term effects of forest management interventions. In our study, we chose the Index system method (ISM) to evaluate the carrying capacity of forest ecosystems in China, Japan, and South Korea (Gough et al., 2008).
2 Study area and data sources
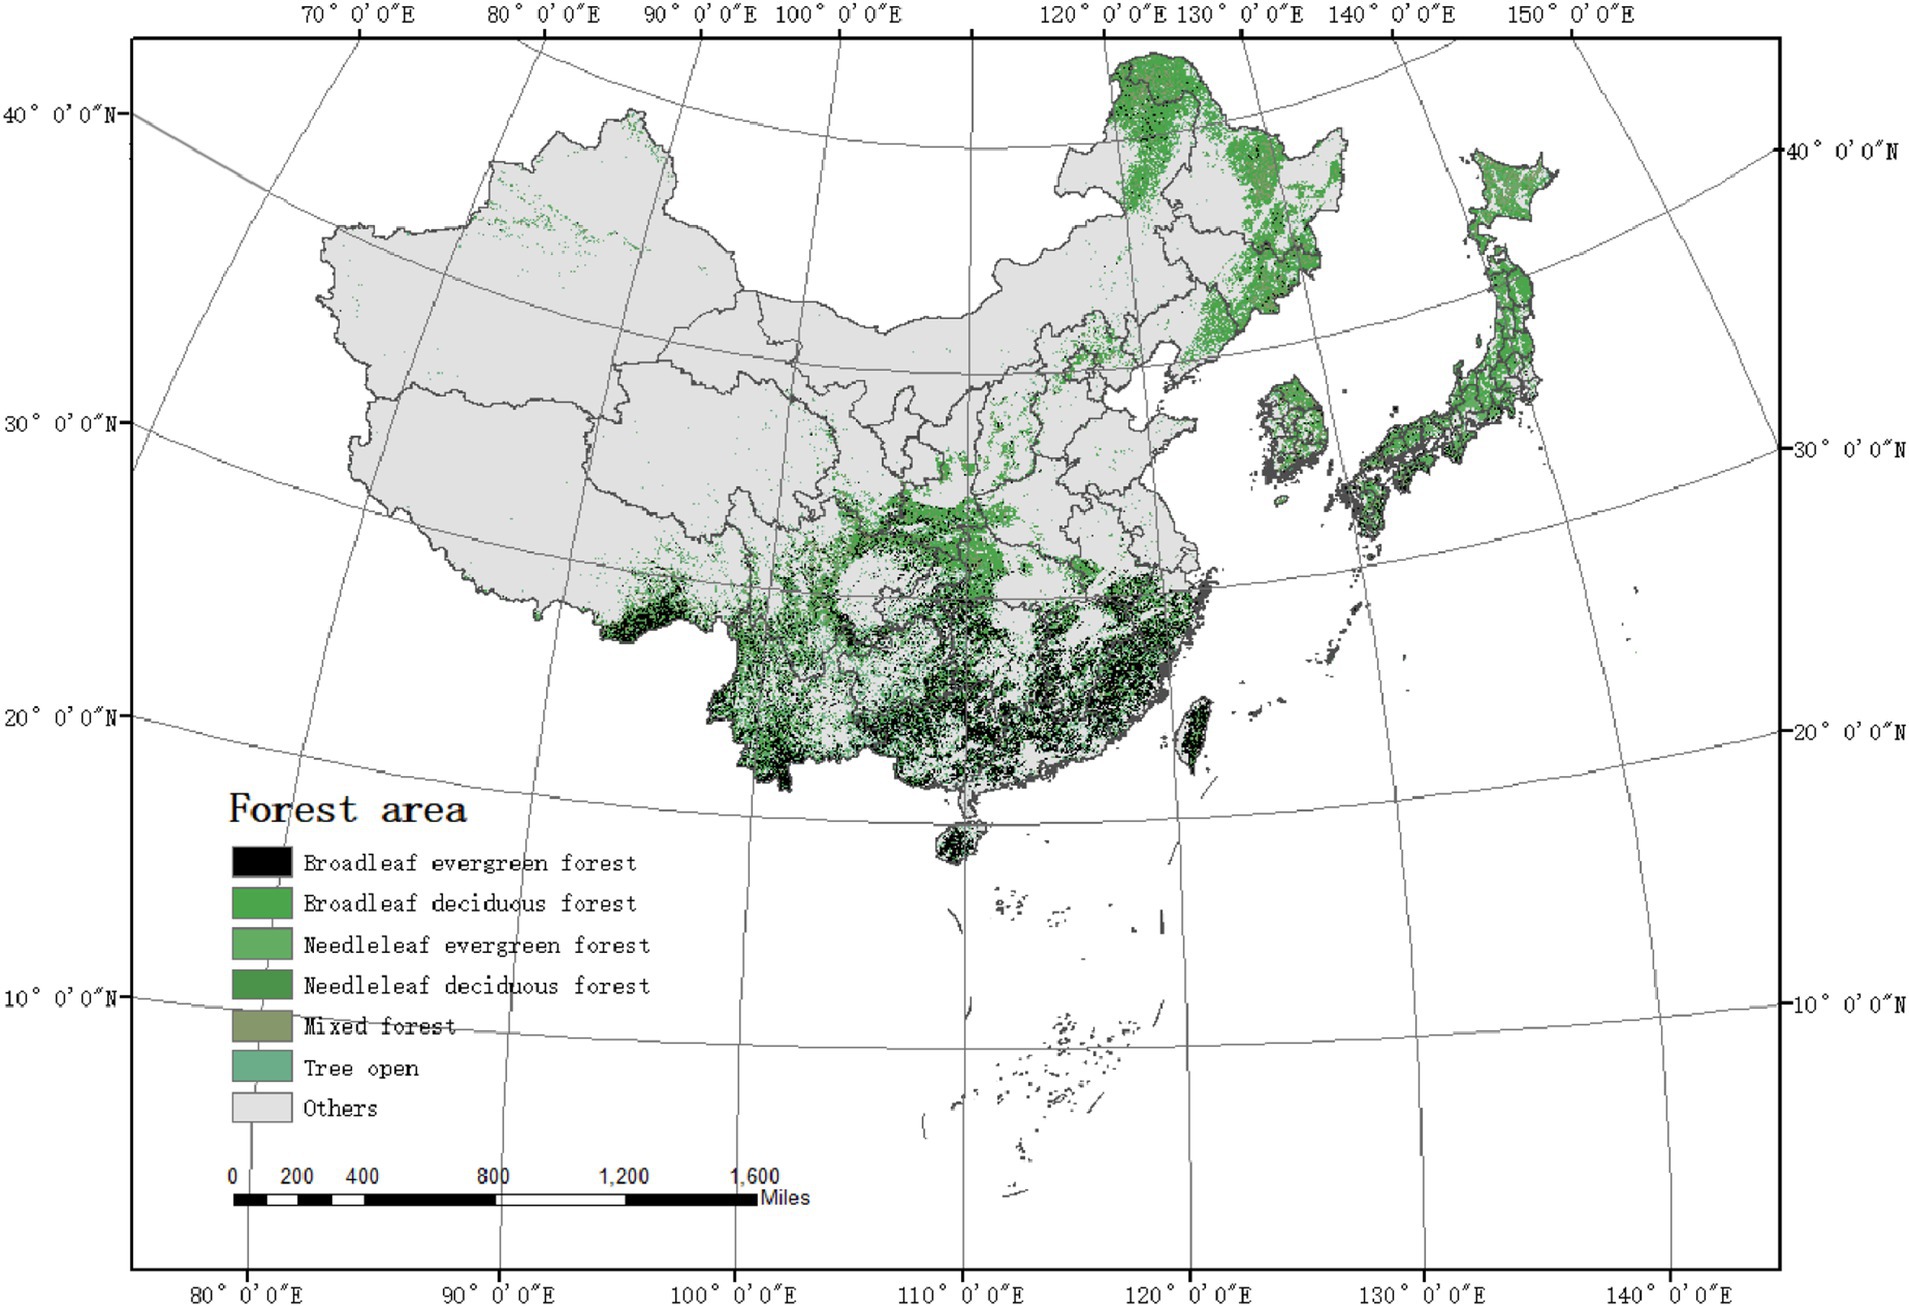
China, Japan, and ROK are located in Northeast Asia and have abundant resources such as forests, human resources, land, energy, and minerals, its longitude and latitude range from 73°33′E to 153°59′E and from 3°51′N to 53°33′N (Figure 1). There is a huge difference in altitude between different regions of China, with an average altitude of 4,500 m in the southwestern Qinghai Tibet Plateau and between 50 and 200 m in the eastern plains. The terrain in Japan is high in the middle and low in the surrounding areas, with many mountains and hills, with an average elevation of 438 m. The northern part of South Korea is mountainous with an average elevation of 1,000 m, while the plain areas in the west and south have an average elevation of less than 200 m. According to data from the Food and Agriculture Organization of the United Nations, 36% of artificial forests in the world are distributed in East Asia (39% in China, 41% in Japan, and 36% in ROK), while other regions such as Africa, Europe, and the United States are far below 20% (FAO, 2020; Abbasi et al., 2023). Plantation forests have contributed 40–76% of carbon sequestration in the past 20 years, with reforestation and forest protection effectively increasing the carbon sink size in the region and playing an important role in mitigating climate change (Luo et al., 2020). In the international environment of widespread destruction of global forest resources, significant reduction in resource accumulation, climate change, and protection of forest resources, Northeast Asia has enormous potential for forest resource development due to its high timber accumulation and low yield.
The land use data is sourced from the global land cover data of the Global Land Cover by National Mapping Organizations (GLCNMO), which is based on the Land Cover Classification System (LCCS) developed by the Food and Agriculture Organization of China (Kobayashi et al., 2017). In GLCNMO’s classification, Broadleaf Deciduous Forest represents Broadleaf Evergreen Closed to Open (100–40%) Trees in LCCS label. Broadleaf Deciduous Forest represents Broadleaved Deciduous Closed to Open (100–40%) Trees. Needleleaf Evergreen Forest represents Needleleaved Evergreen Closed to Open (100–40%) Trees. Needleleaf Deciduous Forest represents Needleleaved Deciduous Closed to Open (100–40%) Trees. Mixed Forest Broadleaved Closed to Open Trees and Needleleaved Closed to Open (100–40%) Trees and Tree Open represents Open [40-(20–10)%] Trees (Woodland) in LCCS label (Kobayashi et al., 2017).
Forest data is sourced from FAO Global Forest Resources Assessments (FAOFRA,1 China Forestry and Grassland Yearbook, China Environmental Statistics Yearbook, ROK national forest inventory data, and Japan Statistical Yearbook. Korean NFI data is based on sampling statistics (Luo et al., 2020). The FAO Global Forest Resources Assessment provides important information for understanding the scope, condition, management, and use of forest resources. Socio economic data is sourced from the World Bank (Data Bank)2 and the United Nations Food and Agriculture Organization (FAOFRA).3 The meteorological data from 2000 to 2020 comes from the World Bank (Table 1).4
3 Materials and methods
3.1 Construction of evaluation index system for forest ecosystem carrying capacity
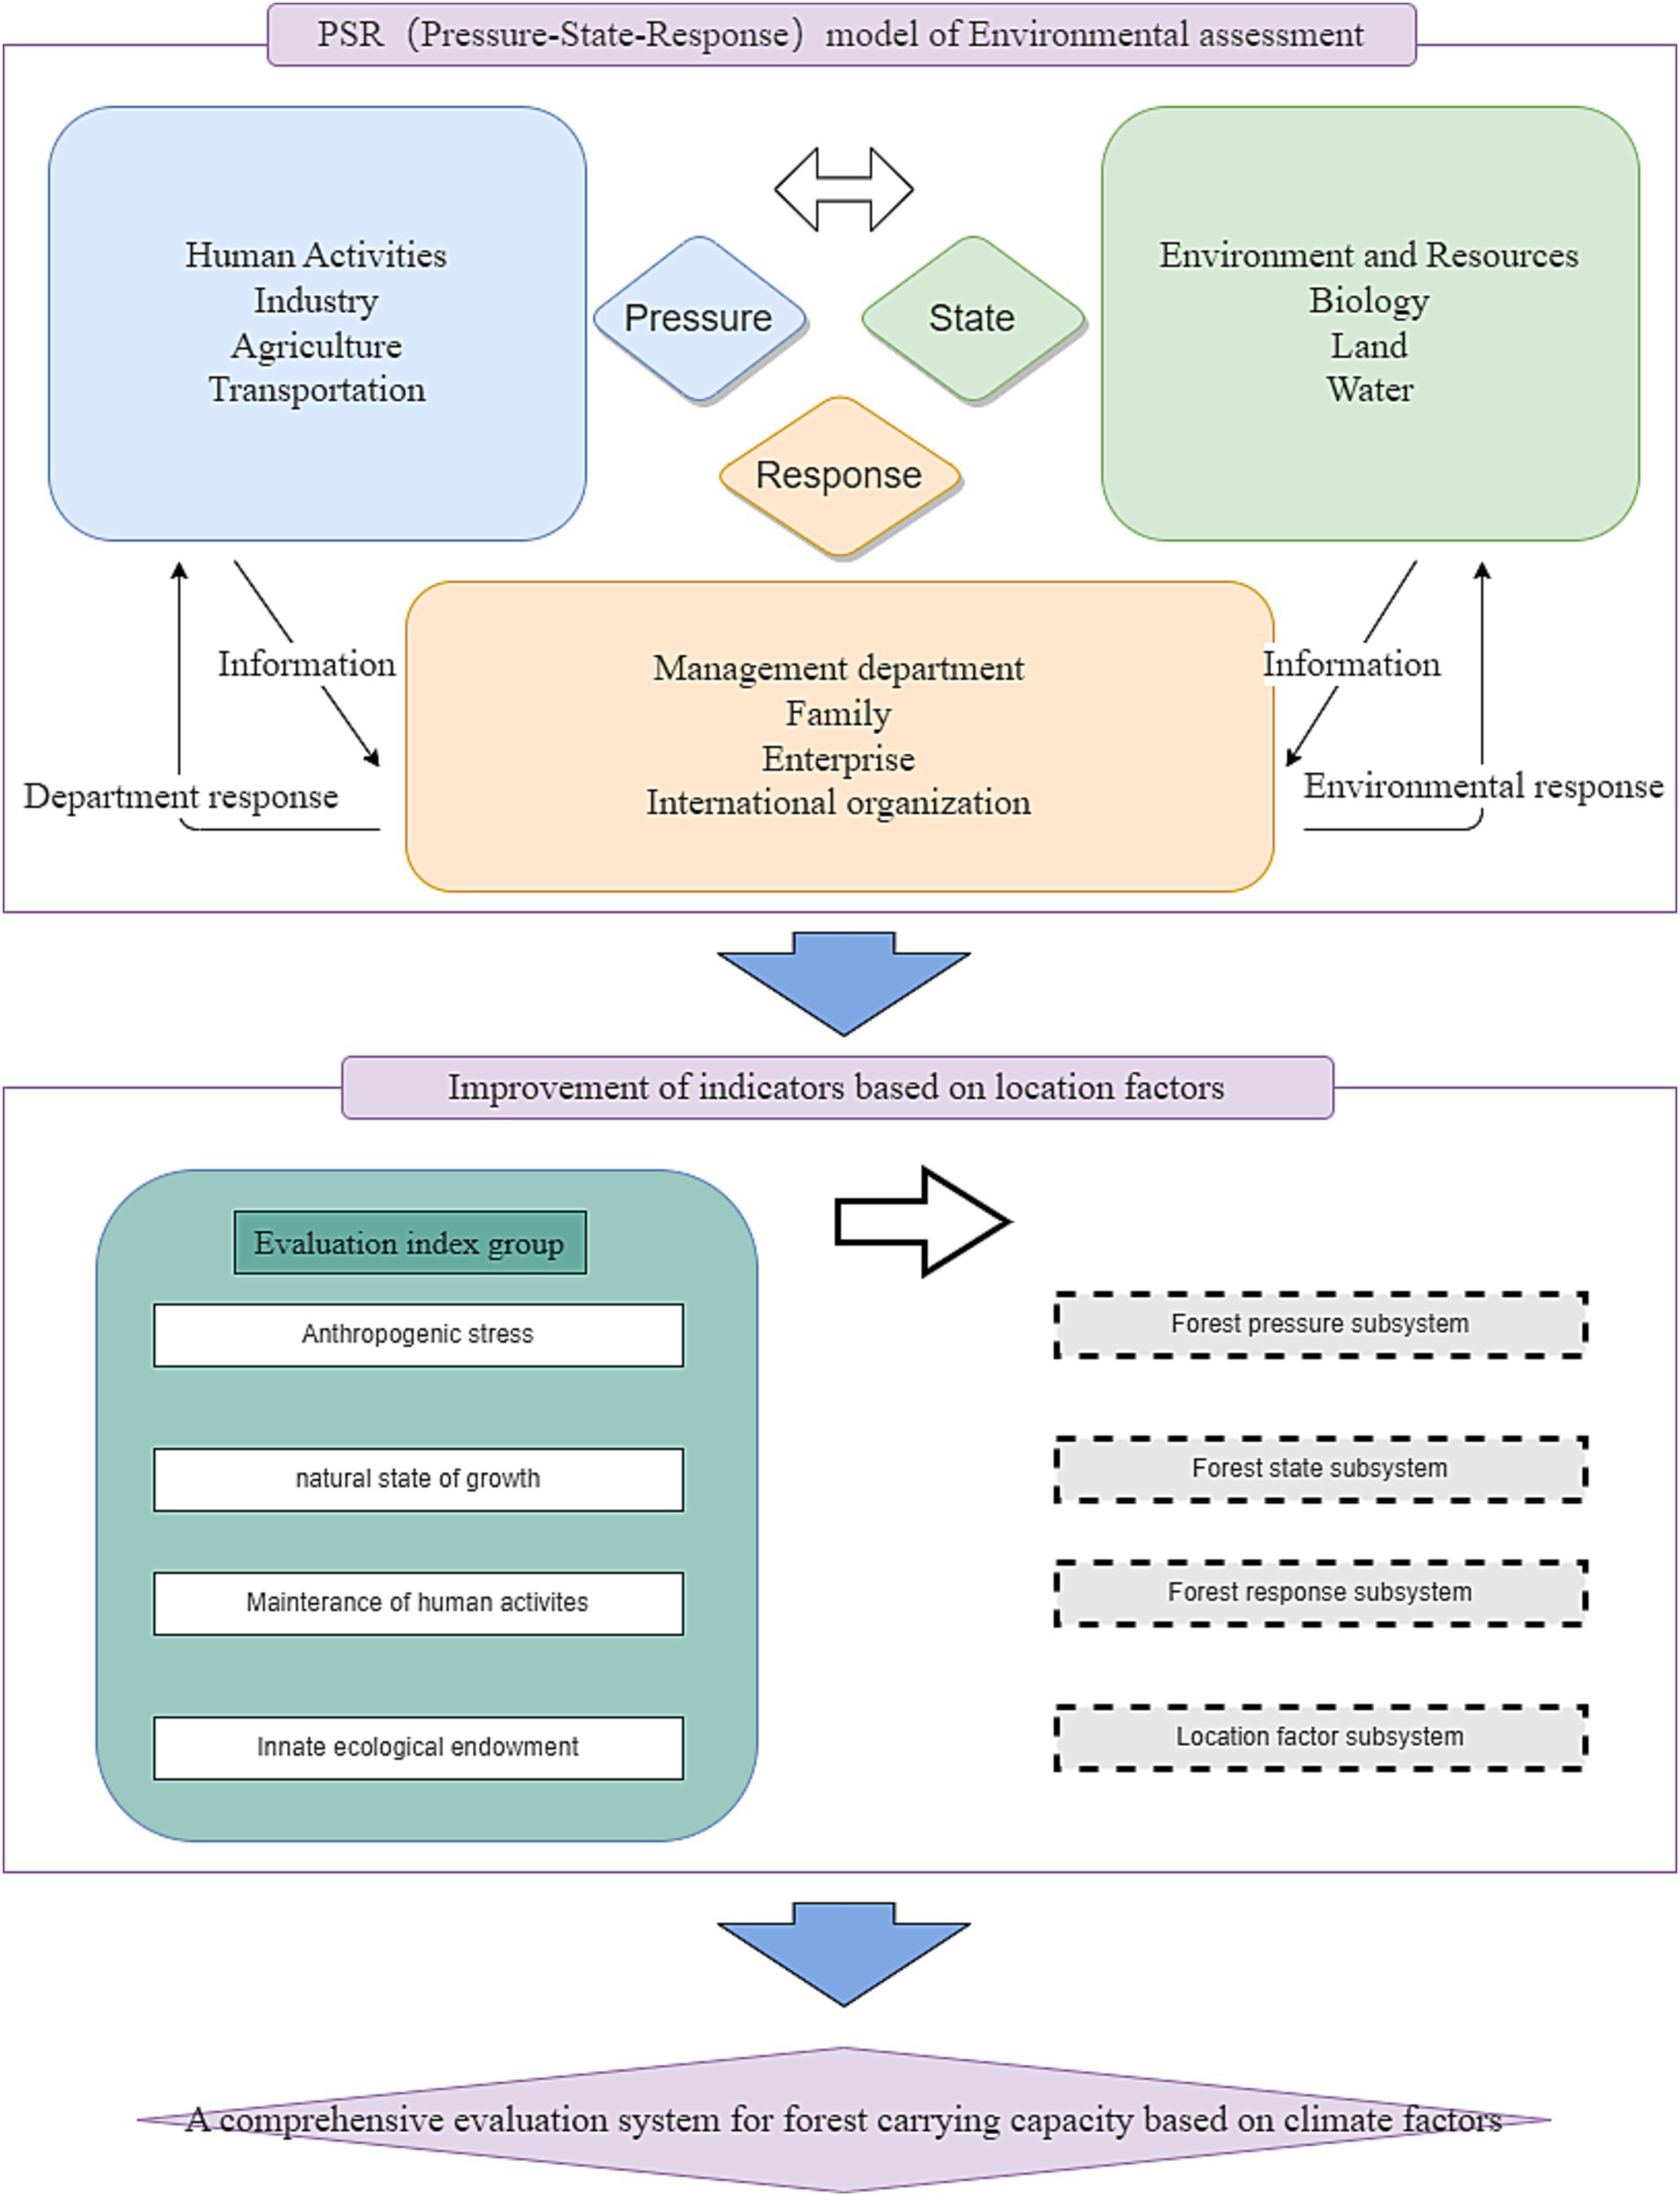
The forest ecosystem is a complex and dynamically changing composite system, which determines the size of its ecological service functions not only due to internal factors of the forest itself, but also related to external pressures caused by human activities. Due to the uncertainty, openness, and dynamism of forest resources and socio-economic factors, as well as the numerous and complex number of related indicators, and the regional differences in resource environment, it is impossible to establish a unified quantitative indicator system. Otherwise, it is easy to encounter problems such as the indicator system being too large and difficult to calculate, the indicator system being too macroscopic and vague, and the indicator system not fully reflecting the connotation and attribute characteristics of the system, resulting in inaccurate conclusions or weak scientific validity. The establishment of an indicator system is the core part of evaluating the carrying capacity of resources and environment, and is a key factor related to the credibility of the evaluation results. This article follows the basic principles of scientificity, systematicity, regionalism, hierarchy, openness, and dynamism, starting from the connotation of forest ecological carrying capacity. Based on existing research, the “Pressure State Response” (PSR) theoretical model is adopted to divide the comprehensive evaluation index system of forest ecological carrying capacity into four dimensions: forest ecological pressure, forest resource status, forest system response, and climate factors (Figure 2).
The PSR model is a widely recognized and used framework model designed by Organization for Economic Co-operation and Development (OECD) to meet the needs of ecological environment management and decision-making (FAO, 1997). This framework model has the characteristics of comprehensiveness and flexibility, which can be applied to a wide range of environmental phenomena, while emphasizing the connection between economic operation and its impact on the environment (Zuo et al., 2003).
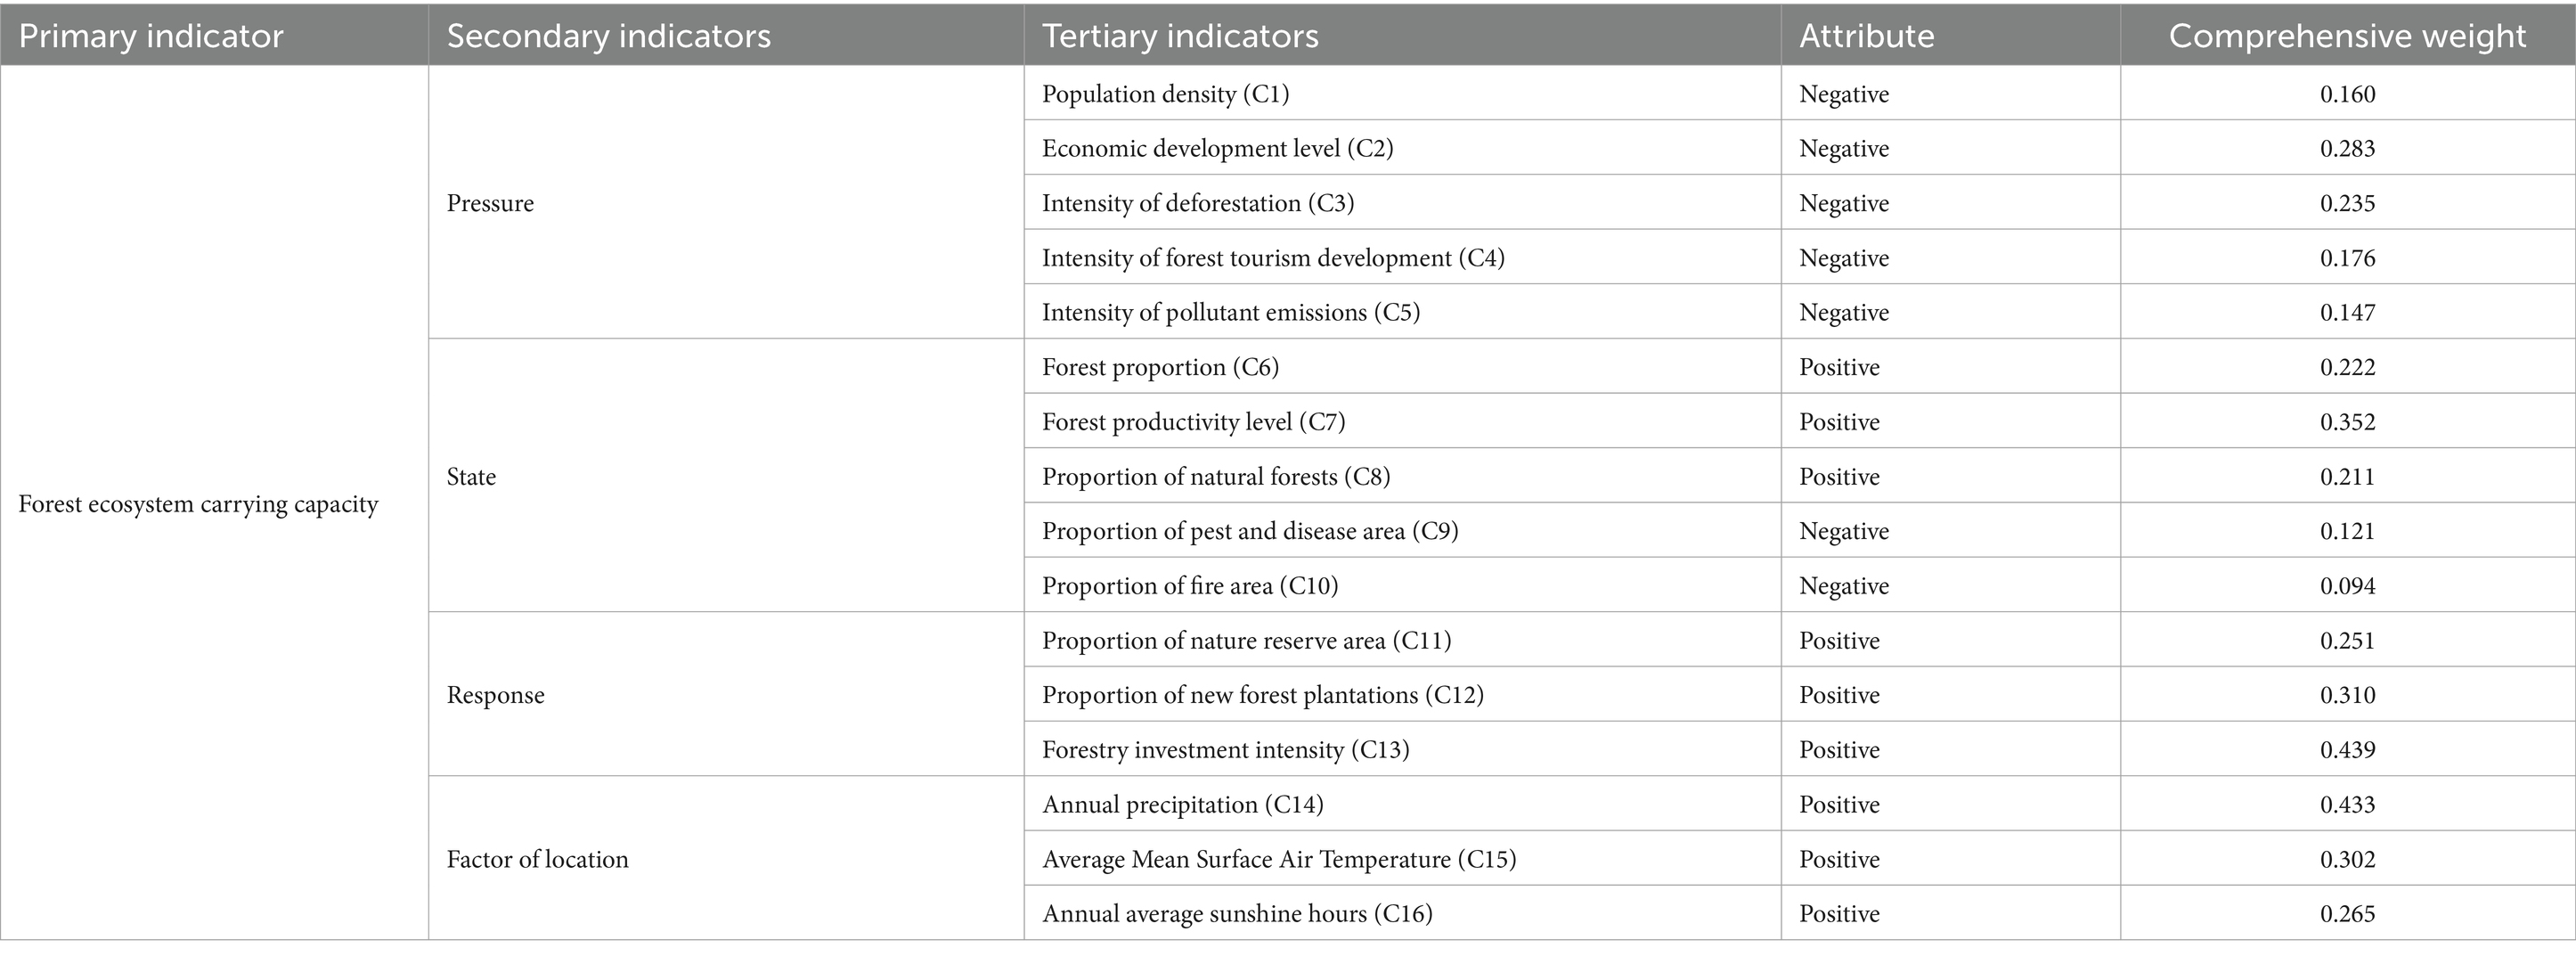
Forest ecological pressure refers to the negative impacts caused by human activities, such as harmful disturbances caused by resource consumption and environmental pollution. The status of forest resources reflects the ecological location and resource status of the entire forest ecosystem, maintaining the stability of its ecological environment, and the quantity and quality of ecosystem service functions. Forest system response refers to the fact that human society, based on basic safety needs, will reduce or exempt the ecological value reduction caused by natural ecosystems exceeding human adaptation range. To a certain extent, humans will take some environmental measures to alleviate the pressure of human society on forest ecological carrying capacity. Climate conditions are the main factor affecting the ecological carrying capacity of forests. Different natural climate conditions cause differences in forest biodiversity between regions, resulting in differences in forest ecological carrying capacity between regions. Specific indicators include annual precipitation, average temperature, and annual sunshine hours.
The internal composition of the forest ecosystem indicator system is divided into three parts: state indicator subsystem, pressure indicator subsystem, and response indicator subsystem, which are evaluated from three aspects: the self-condition of the forest ecosystem, the pressure it carries, and human regulatory factors. In the research of state indicator system, establish an “ecological physical structure” based on forestry and ecology. In the study of stress and response indicator systems, establish “human behavior factors” based on statistical analysis. This article combines actual statistical data on forest area, pests and diseases, fires, etc. obtained from China, Japan, and South Korea, and adjusts the indicators that are not available in the original indicator system. A suitable indicator system for evaluating the ecological carrying capacity of forests in Changbai County is obtained (Table 2).
For forest ecological carrying capacity data, due to different dimensions, it is necessary to unify the data of different indicators during calculation. For positive indicators, formula (1) needs to be used for calculation, while for negative indicators, formula (2) needs to be used for calculation:
where aij is the normalized indicator data, Xij is the original data of the jth index of the ith province, Xmax and is Xmin represent the maximum and minimum values of the jth index, respectively.
To avoid or reduce the influence of personal subjective judgment on indicator selection, we conducted a reliability analysis on the selected indicator system. Reliability refers to the degree of consistency in the results obtained when using an indicator system as a measurement tool. The higher the reliability coefficient, the higher the reliability of the indicator system. This article uses the commonly used Cronbach’s alpha to evaluate the internal consistency of indicator systems based on standardized terms:
where is the reliability coefficient; n is the number of indicator variables; is the sum of variances within each variable group; is the overall variance of the indicator variable; is the variable value in the m-th indicator system; is the mean variable of the m-th indicator system.
Based on the comparison of completeness and availability of raw data, our study selected the raw data of various component indicator systems of resource and environmental carrying capacity in China, Japan, and South Korea from 2008 to 2010, and standardized them using the min max method. The results indicate that the reliability coefficients are all above 0.90, indicating that the selected indicator system has a high level of reliability and can objectively evaluate the forest carrying capacity of China, Japan, and South Korea.
3.2 Estimation of carrying capacity
According to different data sources and calculation processes, the methods for determining indicator weights can be divided into three categories: subjective weighting method, objective weighting method, and comprehensive weighting method. The subjective weighting method has greater advantages over the objective weighting method in determining weights based on the decision-maker’s intention, but the objectivity is relatively poor and the subjectivity is strong; The objective weighting method has objective advantages, but it cannot reflect the degree of importance that decision-makers attach to different indicators, and there may be a certain degree of weight that is opposite to the actual indicators (Xu et al., 2024). Therefore, in our study, in order to consider the inherent statistical patterns and authoritative values between indicator data, a combination weighting method combining subjective weighting (AHP) and objective weighting (TOPSIS) was adopted to compensate for the shortcomings brought by single weighting. The calculation method for combination weights is:
where is the weight obtained by the AHP, and is the weight obtained by the TOPSIS.
Based on normalized data and a combination indicator system, the calculation method for forest state/pressure/response index in China, Japan, and South Korea is as follows:
where WF represents the indicator results of the subsystem. ωij represents the weight corresponding to the state/pressure/response indicators, i is the number of subsystems, and j represents the number of corresponding indicators in the subsystems. The final result of forest carrying capacity is calculated as the sum of scores for all three dimensions, using the formula:
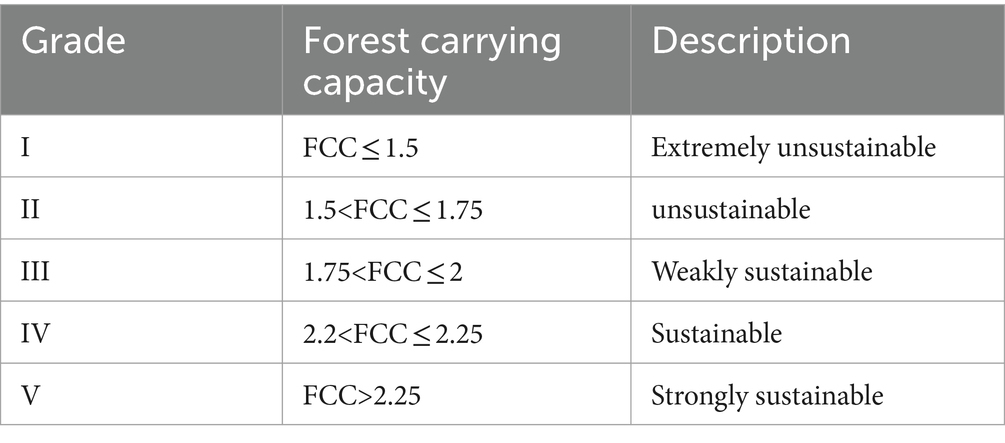
The carrying capacity of regional forests is not only influenced by the state of forest resources themselves, but also reflects external factors such as population and development intensity in the region. The urbanization process is the fundamental driving force behind the continuous changes in regional carrying capacity. Within a certain range, the higher the level of urbanization, the stronger the regional carrying capacity. When the level of urbanization is too high, it causes damage to the regional carrying capacity. Therefore, our study drew on the evaluation standards of resource and environmental carrying capacity and urbanization from previous studies (Wang and Liu, 2019; He, 2020), combined with the actual situation of regional carrying capacity, and used the Delphi method and equidistant method to determine the bearing capacity interval and sustainable state (Table 3).
3.3 Spatial autocorrelation analysis
The overall trend of spatial correlation of attribute values within the study area is usually evaluated using the global spatial correlation statistic Moran’s I. When Moran’s I > 0, it indicates that the forest ecological carrying capacity index tends to aggregate in space; When Moran’s I < 0, it indicates that the forest ecological carrying capacity index tends to disperse in space; When Moran’s I = 0, it indicates that there is no significant spatial correlation in the forest ecological carrying capacity index. The calculation formula for Moran’s I is:
where wij is the element value of the spatial weight matrix; Xi is the x variable value of regional unit i; Yi is the value of the y variable in regional unit i; n is the total number of regional units within the study area.
The correlation between attribute values and their surrounding geographical units is usually measured using the local spatial autocorrelation statistic Local Moran’s I. A low value of the local Moran index indicates that the area units of dissimilar variable values are clustered in space, while a high value indicates that the area units of similar variable values are clustered in space. The calculation formula for Local Moran’s I is:
where Ii > 0 indicates that a low value is surrounded by a low value (L-L), or a high value is surrounded by a high value (H-H). Ii < 0 indicates that a high value is surrounded by a low value (H-L), or a low value is surrounded by a high value (L-H).
4 Results
4.1 The spatiotemporal distribution of pressure/state/response index
We mainly discussed the changes in pressure/state/response indices in 2010 and 2020 (Figure 3). The indicators involved in the location factor subsystem mainly reflect precipitation and temperature of the region, and are only related to objective factors. Therefore, we did not compare the results with the index results of other subsystems in the results section.
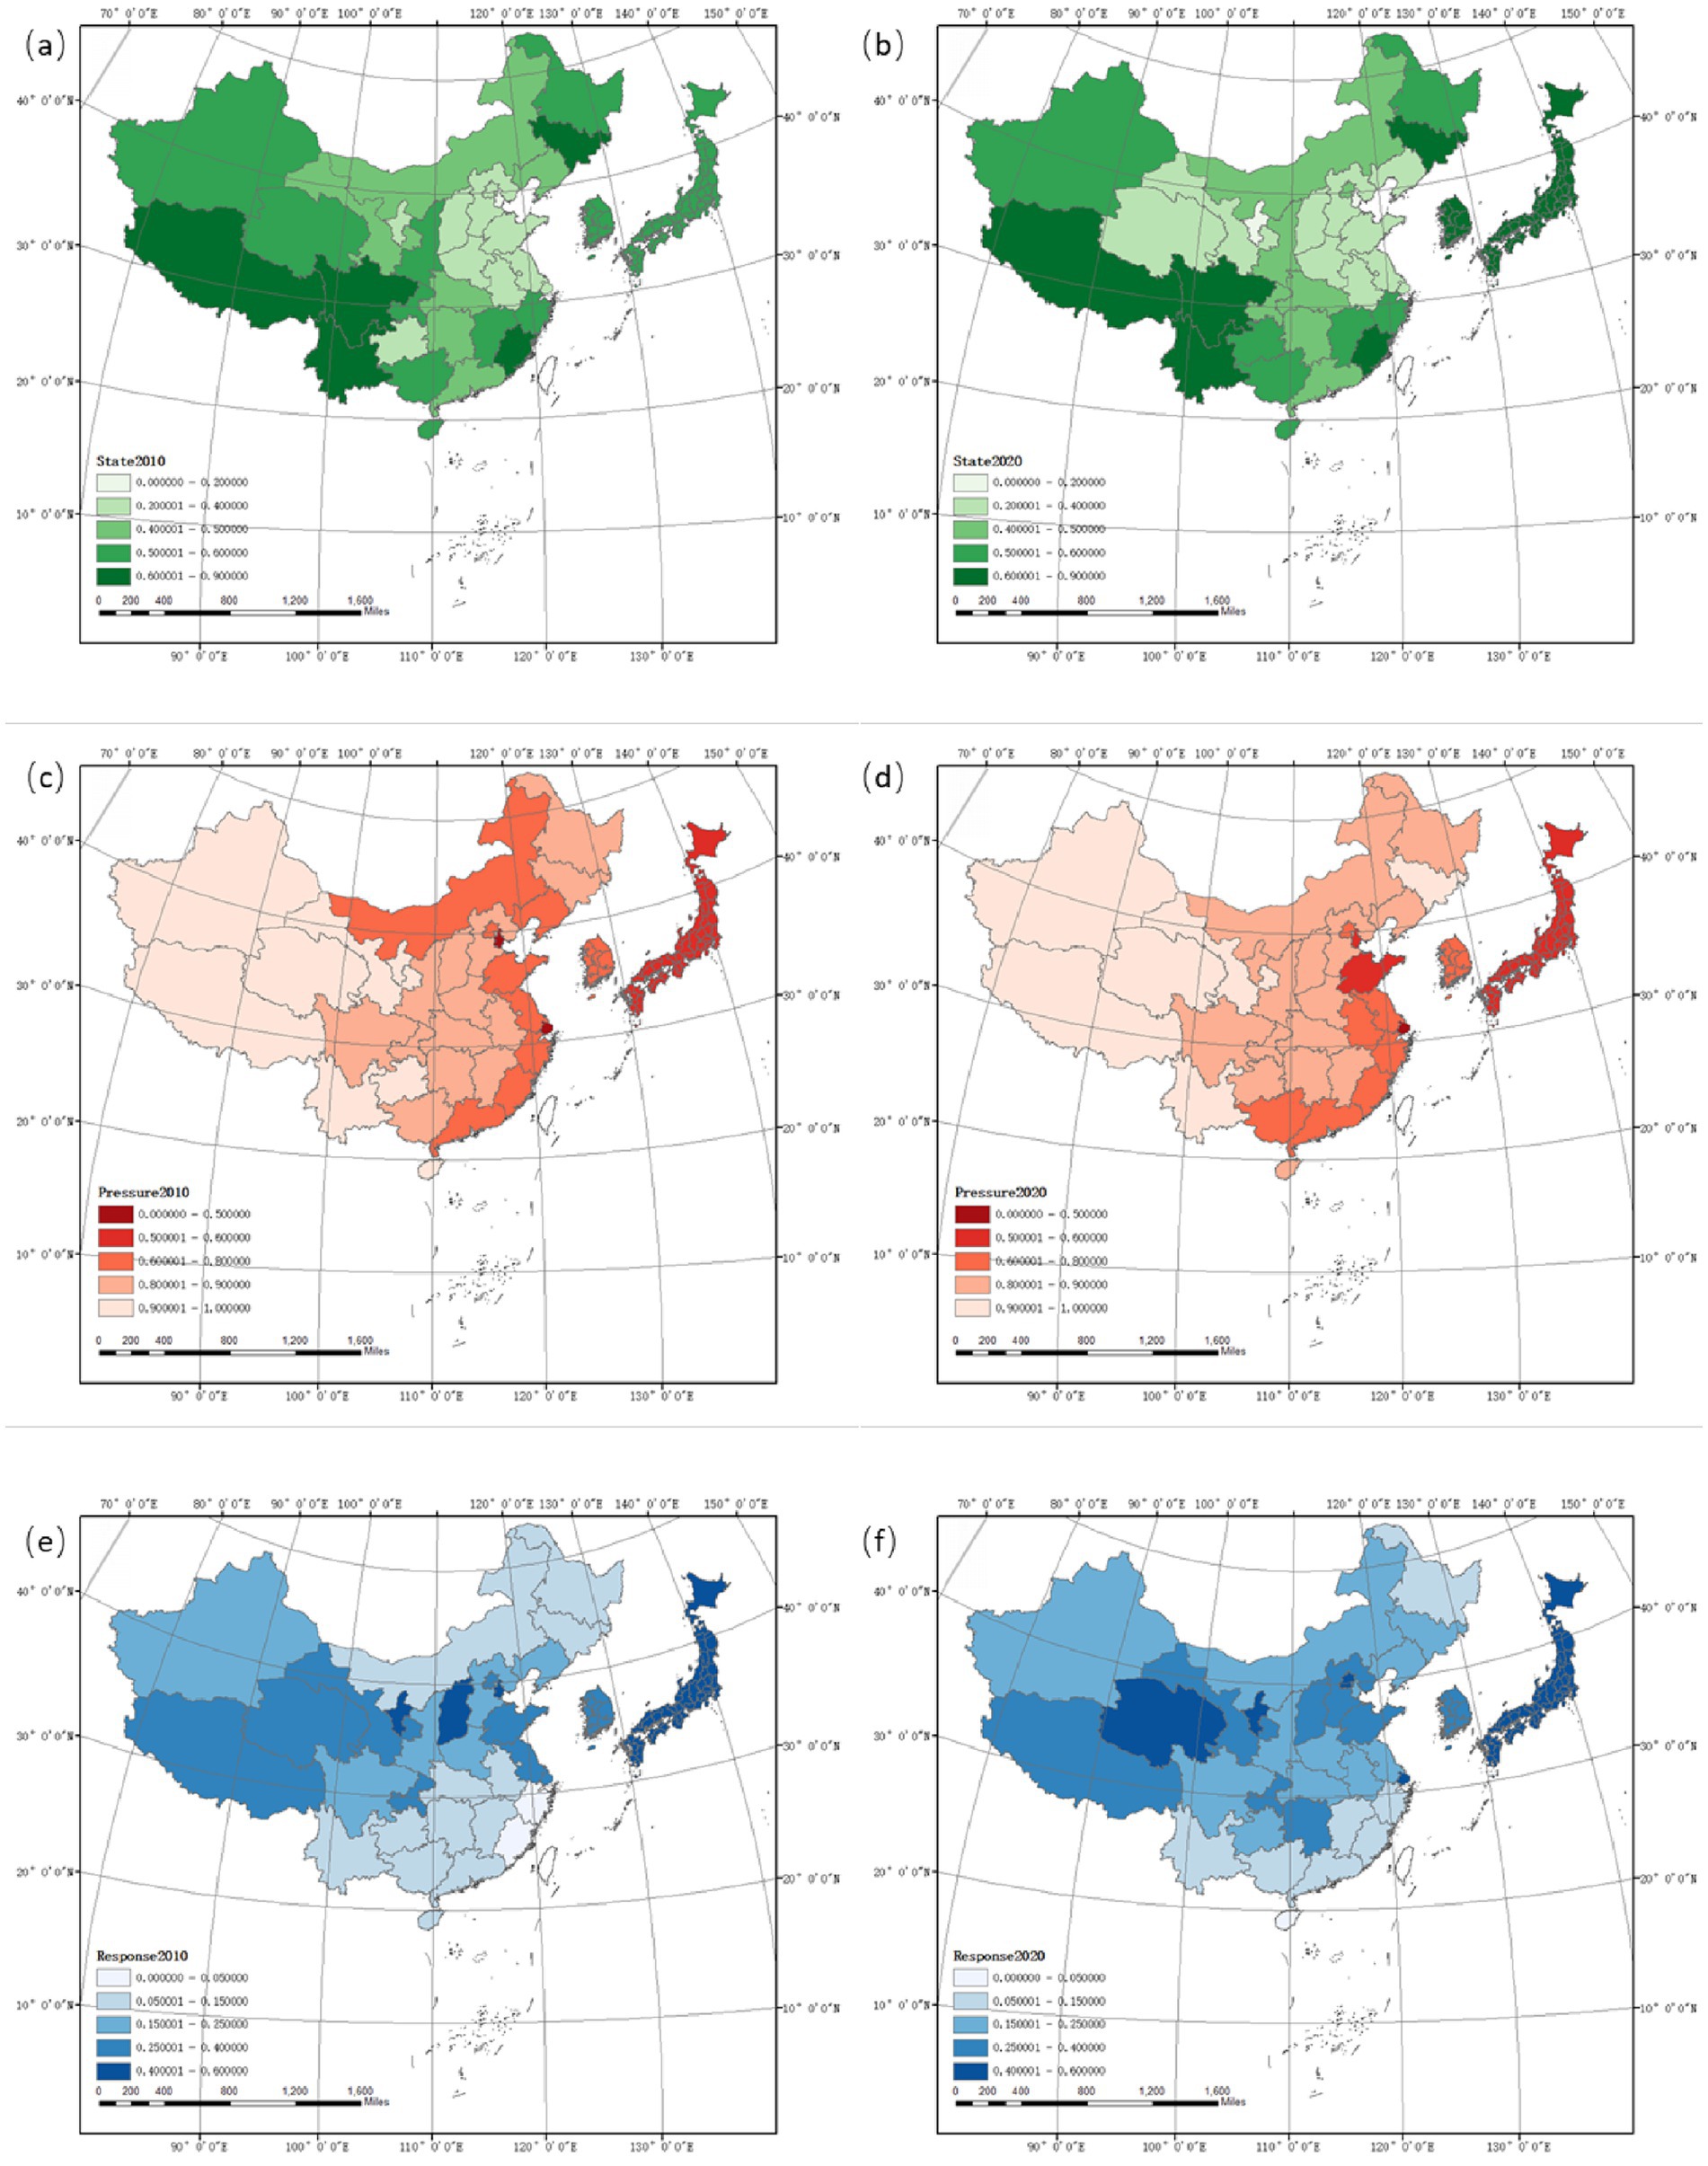
Figure 3. The spatiotemporal distribution of subsystems. (a) Spatial distribution of state index in 2010 (b) Spatial distribution of state index in 2020. (c) Spatial distribution of pressure index in 2010. (d) Spatial distribution of pressure index in 2020. (e) Response distribution of state index in 2010. (f) Spatial distribution of response index in 2020.
The pressure caused by external factors shows an increasing trend over time in some regions, and the forest pressure across the country shows a spatial pattern of high in the east and low in the west. In 2020, the forest pressure in Northeast China, especially Inner Mongolia, Liaoning, and Jilin, has significantly improved, but the pressure in the eastern coastal areas, especially Shandong, Jiangsu, Zhejiang, and Fujian, has gradually increased; Japan and South Korea have higher pressure indices, which are related to social factors such as economic development and high population density.
The state indicators show a gradually improving trend over time, mainly reflected in the central and western regions, such as Qinghai, Gansu, Shaanxi, Guizhou, Chongqing, etc. The overall distribution shows a trend of high in the west and low in the east of the province. The forest status of Fujian and Jilin is significantly higher than that of surrounding provinces. The forest state in Japan and South Korea gradually improves over time and consistently shows a high level.
Human factors have different corresponding indicators, pressures, and states on forests, showing significant policy differences. The central region is higher than the southern and northern regions, with Shanxi, Ningxia, Beijing, and Tianjin being the highest values, showing an overall trend of increasing over time; the forest response index of Japan and South Korea is significantly higher than that of most provinces in China, similar to areas such as Beijing and Shanghai.
4.2 The spatiotemporal distribution of forest carrying capacity
The forest carrying capacity shows a trend of increasing over time (Figure 4). The overall spatial pattern presents a pattern of high in the west and low in the east. In China, only Tianjin, and Shanghai have experienced a strong unsustainable state, and Beijing has transitioned from unsustainable state in 2010 to sustainable state in 2020. Except for Jiangsu, some regions such as Inner Mongolia, Liaoning, and Shanxi are developing toward improving their carrying capacity; Inner Mongolia, Liaoning, and Shandong are partially overloaded, while most areas maintain balance or surplus. Xizang and Chongqing are the regions with the best bearing status. The carrying capacity of 11 provinces has decreased, while the remaining 22 provinces are changing in a positive direction. However, compared to Japan and South Korea, China still has a certain gap in carrying capacity. Japan and South Korea maintained good carrying capacity levels in 2010 and 2020. Despite their extremely high population and economic pressures, they still maintain high forest coverage and carrying capacity.
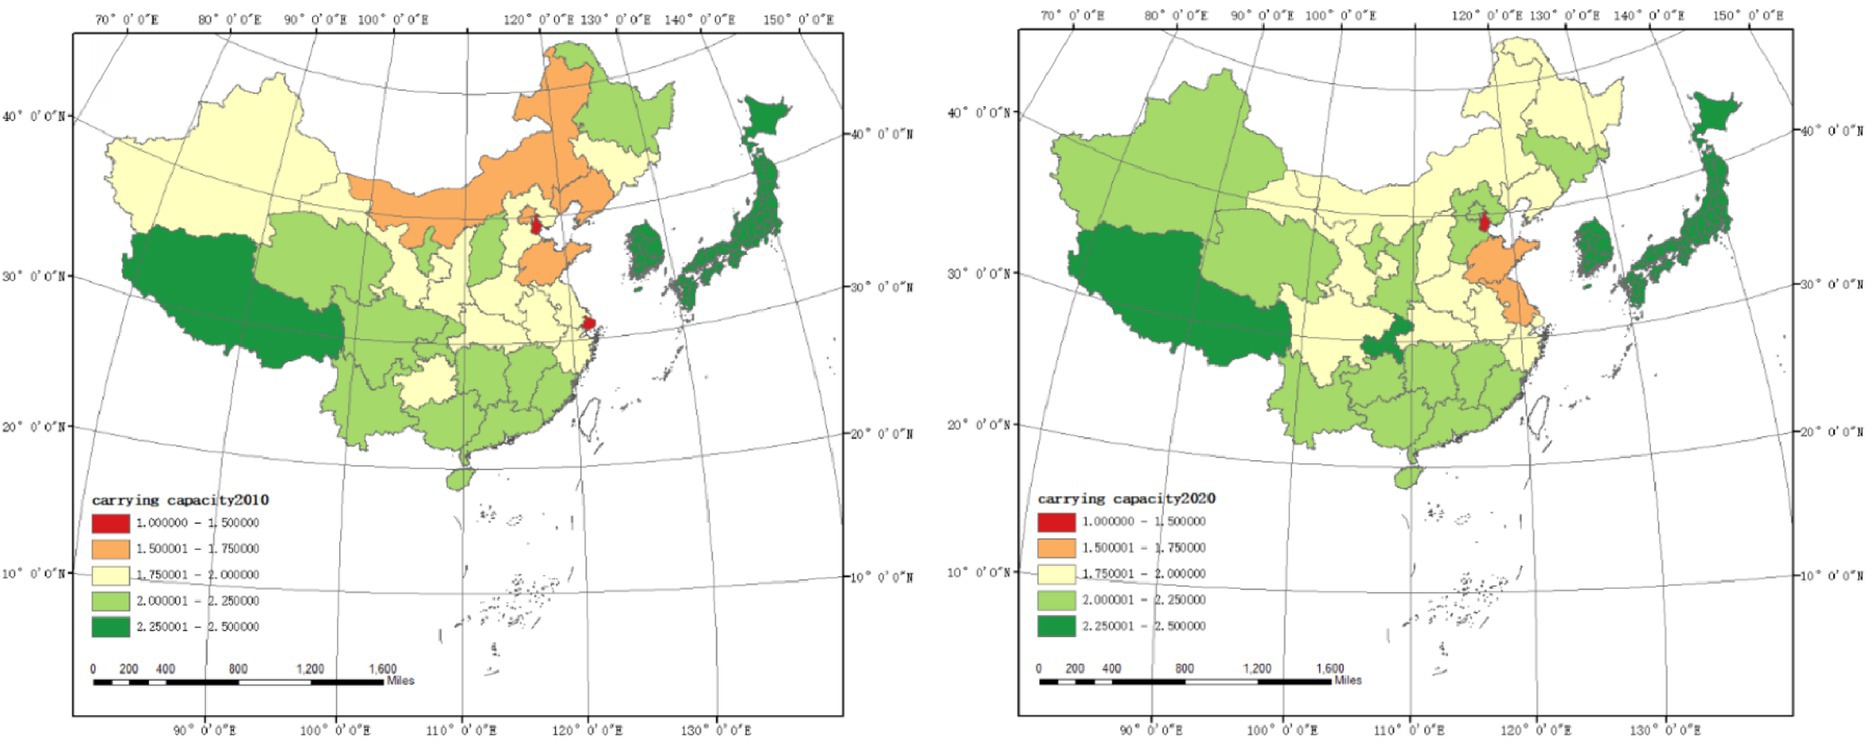
Figure 4. Spatial distribution of forest ecosystem carrying capacity in China, Japan, and South Korea in 2010 and 2020.
4.3 Results of spatial autocorrelation analysis
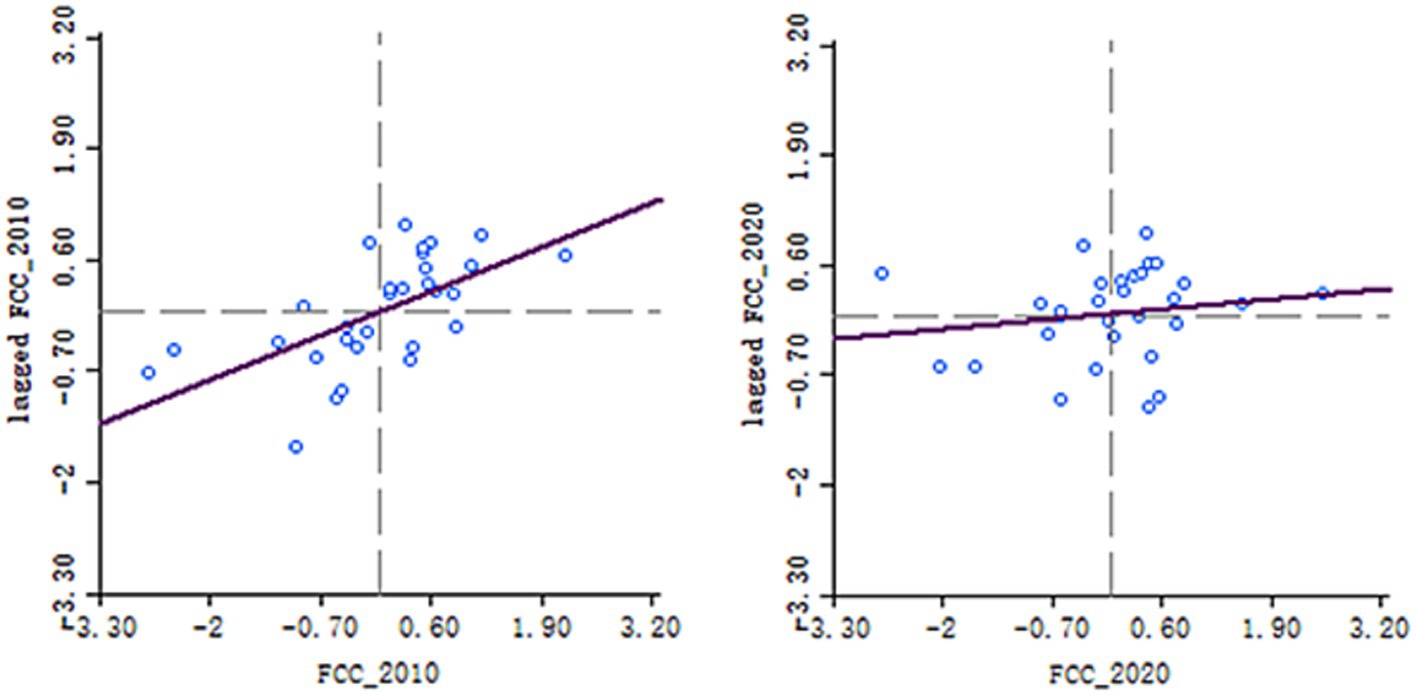
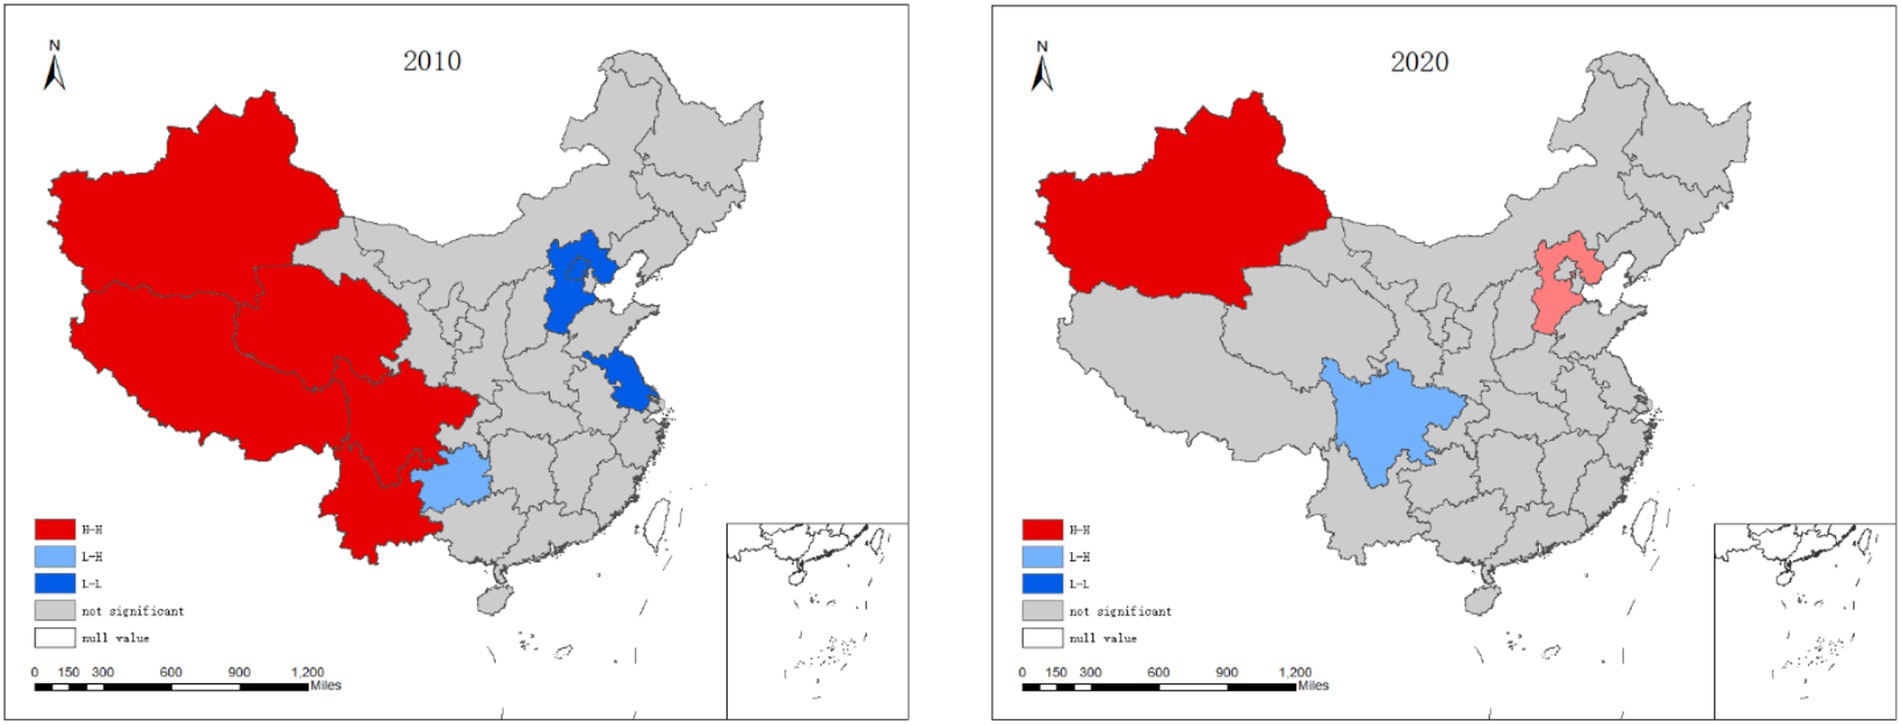
The results of the Moran’s I test in 2010 showed a significant positive spatial autocorrelation characteristic in the forest carrying capacity of Chinese provinces (Figure 5.) indicating that in provinces with better carrying levels, the carrying status of their surrounding areas is also better, and vice versa (p ≤ 0.05). Therefore, the larger spatial positive correlation indicates the existence of spatial differences. Among them, the H-H region is concentrated in the northwest, while the L-L region is manifested in areas such as Hebei and Jiangsu (Figure 6). The spatial correlation of the carrying status of various provinces in China has weakened in 2020, indicating that the overall pattern of regional forest development in China has changed from 2010 to 2020, and the differences in forestry policies among provinces have led to changes in the status of different provinces.
5 Conclusion and discussion
This study mainly constructs a comprehensive evaluation system based on PSR, combined with subjective and objective weight calculation methods, to evaluate the forest carrying capacity of China, Japan, and South Korea from the perspectives of state/pressure/response and comprehensive evaluation, and quantitatively evaluate the level of regional forest sustainable development. The main conclusions are as follows:
(1) The forest carrying capacity in 2020 was to some extent better than in 2010, showing an overall trend of higher in the west and lower in the east. Only Shanghai and Tianjin are in a strong unsustainable state, which is positively correlated with the socio-economic pressure in the region.
(2) Japan and South Korea have a high population density and economic development level, while forests still maintain a good sustainable development situation. Regions such as Shanghai and Beijing, which have similar levels of population and economic pressure to Japan and South Korea, have poor forest sustainability, while provinces that exhibit high pressure low carrying capacity have not appeared in China.
(3) In 2010, China’s FCC exhibited positive spatial autocorrelation characteristics, with regions with better forest carrying capacity concentrated in the northwest. However, starting from 2020, due to differences in policy factors among different regions, there was a significant differentiation in forest carrying status.
The FCC indicator system constructed in our study is highly consistent with existing forest carrying capacity and sustainable development indicator systems, demonstrating the feasibility of our evaluation model (Chen, 2009; Liu, 2012). In constructing a comprehensive evaluation system based on the Pressure-State-Response (PSR) model, this study has not only maintained the model’s well-established framework in ecosystem assessment but also significantly enhanced the scientific rigor and precision of the evaluation system through meticulous indicator selection and weight allocation. In contrast to previous research, a key innovation of this study lies in the adoption of a multi-source data fusion approach, incorporating remote sensing data, ground-based field survey data, and socio-economic statistics, thereby ensuring the comprehensiveness and accuracy of the evaluation outcomes. Furthermore, in determining weights, this study harmoniously integrates both subjective and objective weighting methods, effectively mitigating biases that may arise from relying solely on either approach. Of particular emphasis in this study is its focus on inter-regional and international comparisons. Through these comparisons, it becomes evident that despite similarities in population density and economic development levels between Japan, South Korea, and select regions of China (such as Shanghai and Beijing), the former two nations exhibit greater resilience in terms of forest sustainability. This observation underscores the marked differences in forest resource management and conservation policies among countries and their tangible impacts on forest carrying capacity. By facilitating such regional and national comparisons, our study provides a valuable perspective on the current state of forest ecosystems in Northeast Asia and offers robust data support for the formulation of more scientific and rational forest resource management policies. This transnational comparative analysis not only aids in identifying successful experiences and potential challenges in forest conservation across nations but also fosters international cooperation and exchanges, thereby contributing to the joint addressal of global environmental issues.
In Northeast Asia, the proportion of artificial forests is much higher than the world average, which is related to the large-scale artificial afforestation in China in recent years. However, multiple studies have shown that evaluating forest quality cannot solely rely on the size of forest area, and additional indicators are needed to reflect changes in forest conditions (Dudley et al., 2012). Forest carrying capacity, as an important indicator for evaluating forest sustainability, is a prerequisite for formulating and implementing regional sustainable forestry development plans and strategies, the basis for regional forest management decisions, and an important component of sustainable forestry theory. Among the various evaluation indicators in this study, forestry investment intensity, annual precipitation, and forest productivity level have a significant impact on forest carrying capacity. The support of human factors is crucial in forest restoration and sustainable development management. At the same time, annual precipitation, as a natural environmental factor, has a decisive impact on forest growth and ecosystem health. However, due to their primitive characteristics, human activities can to some extent change the absolute quantity of forestry resources, but ultimately are constrained by objective conditions (Gu, 2007).
Effective government efforts play a decisive role in developing countries, from arbitrary deforestation to reforestation. According to research by Korean scholars, even if the governance level is not perfect and economic development is slow, achieving results in a short period of time with clear government goals and incentive measures is still feasible (Bae et al., 2012). Affected by factors such as global warming and an increase in extreme weather events, forest fires and other catastrophic disasters occur frequently in many countries around the world, causing significant losses and impacts; The Northeast Asia region also faces severe challenges posed by the combination of natural and social factors (Wang et al., 2022). Strengthening forest disaster response, achieving sustainable forest management, and digitizing forest management will be important topics in forest research in Northeast Asia. In addition, linking the environmental, social, and corporate governance needs of enterprises with cooperation in the forest field, and promoting active participation of the public in forest management through forest carbon offsetting systems, among others, will be an important topic. It is also the development direction of sustainable forest development in the future.
Data availability statement
The original contributions presented in the study are included in the article/supplementary material, further inquiries can be directed to the corresponding author.
Author contributions
YH: Conceptualization, Data curation, Formal analysis, Investigation, Methodology, Project administration, Resources, Software, Validation, Visualization, Writing – original draft, Writing – review & editing. JC: Funding acquisition, Investigation, Methodology, Supervision, Writing – review & editing. WZ: Investigation, Project administration, Software, Supervision, Validation, Writing – review & editing. YL: Project administration, Supervision, Validation, Writing – review & editing. HJ: Supervision, Validation, Writing – review & editing.
Funding
The author(s) declare that financial support was received for the research, authorship, and/or publication of this article. This research was supported by the Projects of International Cooperation and Exchanges NSFC (42261144687) and the National Natural Science Foundation of China (42075167).
Acknowledgments
The authors would like to thank there viewers and editors for the beneficial and helpful suggestions for this article.
Conflict of interest
The authors declare that the research was conducted in the absence of any commercial or financial relationships that could be construed as a potential conflict of interest.
Publisher’s note
All claims expressed in this article are solely those of the authors and do not necessarily represent those of their affiliated organizations, or those of the publisher, the editors and the reviewers. Any product that may be evaluated in this article, or claim that may be made by its manufacturer, is not guaranteed or endorsed by the publisher.
Footnotes
References
Abbasi, A. O., Tang, X., Harris, N. L., Goldman, E. D., Gamarra, J. G. P., Herold, M., et al. (2023). Spatial database of planted forests in East Asia. Sci. Data 10:480. doi: 10.1038/s41597-023-02383-w
Bae, J. S., Joo, R. W., and Kim, Y.-S. (2012). Forest transition in South Korea: reality, path and drivers. Land Use Policy 29, 198–207. doi: 10.1016/j.landusepol.2011.06.007
Bazan, G. (1997). Our ecological footprint: reducing human impact on the earth. Electron. Green J. doi: 10.5070/G31710273
Bishop, R. C. (1978). Endangered species and uncertainty: the economics of a safe minimum standard. Am. J. Agric. Econ. 60, 10–18. doi: 10.2307/1240156
Bruckner, T., Petschel-Held, G., Leimbach, M., and Toth, F. L. (2003). Methodological aspects of the tolerable windows approach. Clim. Chang. 56, 73–89. doi: 10.1023/A:1021388429866
Chen, C. (2009). Research on population carrying capacity of Forest resources. M.S. thesis: Beijing Forestry University.
Del Monte-Luna, P., Brook, B. W., Zetina-Rejón, M. J., and Cruz-Escalona, V. H. (2004). The carrying capacity of ecosystems. Glob. Ecol. Biogeogr. 13, 485–495. doi: 10.1111/j.1466-822X.2004.00131.x
Dudley, N., Schlaepfer, R., Jackson, W., Jeanrenaud, J.-P., and Stolton, S. (2012). Forest quality: assessing forests at a landscape scale. doi: 10.4324/9781849771375
FAO (1996). Agro-ecological zoning guidelines. Rome: Food and Agriculture Organization of the United Nations.
FAO (1997). Land quality indicators and their use in sustainable agriculture and rural development: proceedings of the workshop. Rome: Food and Agriculture Organization of the United Naitons.
FAO (2020). Global forest resources assessment 2020: main report. Rome: Food and Agriculture Organization of the United Naitons.
Feng, Z., Yang, Y., Yan, H., Pan, T., and Li, P. (2017). A review of resources and environment carrying capacity research since the 20th century: from theory to practice. Resour. Sci. 39, 379–395. doi: 10.18402/resci.2017.03.01
Gough, A. D., Innes, J. L., and Allen, S. D. (2008). Development of common indicators of sustainable forest management. Ecol. Indic. 8, 425–430. doi: 10.1016/j.ecolind.2007.03.001
Gu, Z. B. (2007). Study on the Relationship between Amount Change of Forest Resources and Economic Growth in China. Ph.D. Thesis: Beijing Foresty University, China.
He, X. (2020). ASSESSINGTHE sustainable development of the AGROECOLOGICAL environment in terms of ecological carrying capacity in the HETAO area. J. China Agric. Resour. Reg. Plann. 41, 130–137. doi: 10.7621/cjarrp.1005-9121.20200615
IEA and KEEI (2021). Korea electricity security review. Paris: IEA Available at: https://www.iea.org/reports/korea-electricity-security-review. (Accessed November 31, 2023)
Karnopp, D., Rosenberg, R., and Perelson, A. S. (1976). System dynamics: a unified approach. IEEE Trans. Syst. Man Cybern. 6:724. doi: 10.1109/TSMC.1976.4309434
Kobayashi, T., Tateishi, R., Alsaaideh, B., Sharma, R., Wakaizumi, T., Miyamoto, D., et al. (2017). Production of global land cover data – GLCNMO2013. J. Geogr. Geol. 9, 1–15. doi: 10.5539/jgg.v9n3p1
Lamarque, P., Quétier, F., and Lavorel, S. (2011). The diversity of the ecosystem services concept and its implications for their assessment and management. C. R. Biol. 334, 441–449. doi: 10.1016/j.crvi.2010.11.007
Li, F., Li, D., Zhang, L., Hou, C., and Zhu, F. (2015). Comparative study on urbanization process and changes of resource and environment in China, Japan and Korea. China Popul. Resour. Environ. 25, 125–131. doi: 10.3969/j.issn.1002-2104.2015.04.016
Li, Y., Yan, H., Dong, Y., and Pan, L. (2020). Design and implementation of ecological carrying capacity evaluation system for the belt and road initiative based on block storage and analysis. Geogr. Geoinform. Sci. 36, 47–53. doi: 10.3969/j.issn.1672-0504.2020.02.008
Linder, G. L., Brumbaugh, W. G., Neitlich, P. N., and Little, E. E. (2013). Atmospheric deposition and critical loads for nitrogen and metals in Arctic Alaska: review and current status. Open J. Air Pollut. 2, 76–99. doi: 10.4236/ojap.2013.24010
Liu, W. (2012). Ecological security evaluation of Northeast Asia based on GIS and ecological footprint method. Graduate School of Chinese Academy of Sciences (Northeast Institute of Geography and Agroecology): Ph.D dissertation.
Luo, W., Kim, H. S., Zhao, X., Ryu, D., Jung, I., Cho, H., et al. (2020). New forest biomass carbon stock estimates in Northeast Asia based on multisource data. Glob. Chang. Biol. 26, 7045–7066. doi: 10.1111/gcb.15376
MacLeod, M., and Cooper, A. (2019). Carrying capacity in coastal areas. Encycl. Earth Sci. Series. 368–370. doi: 10.1007/978-3-319-93806-6_62
Odum, H. T. (1995). Environmental accounting: emergy and environmental decision making. New York: Wiley.
Poland, T. M., and Rassati, D. (2019). Improved biosecurity surveillance of non-native forest insects: a review of current methods. J. Pest. Sci. 92, 37–49. doi: 10.1007/s10340-018-1004-y
Rees, W. E. (1992). Ecological footprints and appropriated carrying capacity: what urban economics leaves out. Environ. Urban. 4, 121–130. doi: 10.1177/095624789200400212
Robinson, W. C. (1973). The limits to growth: a report for the club of Rome’s project on the predicament of mankind Donella H. Meadows, Dennis L. meadows, Jergen Randers, and William W. Behrens, III. Demography 10, 289–299. doi: 10.2307/2060819
Song, L., Hao, W., Chao, Y., Weiming, S., Siyi, W., and Shen, W. (2022). Forest environmental carrying capacity based on deep learning. Comput. Intell. Neurosci. 2022:7547645. doi: 10.1155/2022/7547645
Wang, Z., Fang, K., and Yao, Q. (2022). Fire history and its forcing in northeastern Asia boreal forests. Nat. Haz. Res. 2, 166–171. doi: 10.1016/j.nhres.2022.07.001
Wang, L., and Liu, H. (2019). The comprehensive evaluation of regional resources and environmental carrying capacity based on PS-DR-DP theoretical model. Acta Geograph. Sin. 74, 340–352. doi: 10.11821/dlxb201902010
Xu, Y., Chou, J., Wang, Z., and Dong, W. (2024). Predicting the differences in food security with and without the Russia–Ukraine conflict scenarios over different regions of the world. Agric. Food Econ. 12, 1–20. doi: 10.1186/s40100-024-00296-9
Xuan, L. (2009). A study on the multi center management system of Forest resources in Northeast Asia. Ph.D dissertation, China: Northeast Forestry University.
Xue, Q., Song, W., Zhang, Y., and Mou, F. (2017). Research Progress in ecological carrying capacity: implications, assessment methods and current focus. J. Resour. Ecol. 8, 514–525. doi: 10.5814/j.issn.1674-764x.2017.05.009
Yu, H., Lu, N., Fu, B., Zhang, L., and Pan, S. (2024). The carrying capacity for vegetation of forest land across China: near real-time monitoring and short-term forecasting based on satellite observation. Geogr. Sustain. 5, 415–429. doi: 10.1016/j.geosus.2024.04.005
Yuanchang, L., ShenQiang, L., Shougong, Z., Heyde, B. D., Xiangdong, L., and Yuan, B. (2010). From normal forest to close-to-nature forest: multi-functional forestry and its practice at national, regional and forest management unit levels in Germany. World Forestry Res. 23, 1–11.
Zhang, W. (2013). Research on the influence of GDP, Population, and industrial structure on energy consumption among China, Japan and Korea. China Popul. Resour. Environ.
Zhang, Z., Hu, B., Jiang, W., and Qiu, H. (2023). Spatial and temporal variation and prediction of ecological carrying capacity based on machine learning and PLUS model. Ecol. Indic. 154:110611. doi: 10.1016/j.ecolind.2023.110611
Keywords: carrying capacity, Northeast Asia, Forest indicators, pressure-state-response model, climate change
Citation: Hao Y, Chou J, Zhao W, Li Y and Jin H (2024) Spatial and temporal pattern of forest carrying capacity and its influencing factors in China, Japan, and Korea based on climate change. Front. For. Glob. Change. 7:1396430. doi: 10.3389/ffgc.2024.1396430
Edited by:
Nan Cong, Chinese Academy of Sciences (CAS), ChinaReviewed by:
Prashant Sharma, Dr. Yashwant Singh Parmar University of Horticulture and Forestry, IndiaDajun Shen, Renmin University of China, China
Copyright © 2024 Hao, Chou, Zhao, Li and Jin. This is an open-access article distributed under the terms of the Creative Commons Attribution License (CC BY). The use, distribution or reproduction in other forums is permitted, provided the original author(s) and the copyright owner(s) are credited and that the original publication in this journal is cited, in accordance with accepted academic practice. No use, distribution or reproduction is permitted which does not comply with these terms.
*Correspondence: Jieming Chou, Q2hvdWptQGJudS5lZHUuY24=
 Yidan Hao
 Jieming Chou1,2*
 Weixing Zhao
 Yuanmeng Li
 Haofeng Jin