
95% of researchers rate our articles as excellent or good
Learn more about the work of our research integrity team to safeguard the quality of each article we publish.
Find out more
ORIGINAL RESEARCH article
Front. For. Glob. Change , 11 June 2024
Sec. Pests, Pathogens and Invasions
Volume 7 - 2024 | https://doi.org/10.3389/ffgc.2024.1385687
 Aurora Bozzini1*
 Stefano Brugnaro2Giuseppe Morgante1
 Giacomo Santoiemma1Luca Deganutti1
 Valerio Finozzi3
 Andrea Battisti1
 Massimo Faccoli1
Introduction: European forests face increasing threats due to climate change-induced stressors, which create the perfect conditions for bark beetle outbreaks. The most important spruce forest pest in Europe is the European Spruce Bark Beetle (Ips typographus L.). Effective management of I. typographus outbreaks necessitates the timely detection of recently attacked spruce trees, which is challenging given the difficulty in spotting symptoms on infested tree crowns. Bark beetle population density is one of many factors that can affect infestation rate and symptoms development. This study compares the appearance of early symptoms in endemic and epidemic bark beetle populations using highresolution Unmanned Aerial Vehicles (UAV) multispectral imagery.
Methods: In spring of 2022, host colonization by bark beetles was induced on groups of spruce trees growing in 10 sites in the Southern Alps, characterized by different population density (5 epidemic and 5 endemic). A multispectral sensor mounted on a drone captured images once every 2 weeks, from May to August 2022. The analyses of a set of vegetational indices allowed the actual infested trees’ reflectance features and symptoms appearance to be observed at each site, comparing them with those of unattacked trees.
Results: Results show that high bark beetles population density triggers a more rapid and intense response regarding the emergence of symptoms. Infested trees were detected at least 1 month before symptoms became evident to the human eye (red phase) in epidemic sites, while this was not possible in endemic sites. Key performing vegetation indices included NDVI (Normalized Difference Vegetation Index), SAVI (Soil Adjust Vegetation Index, with a correction factor of 0.44), and NDRE (Normalized Difference Red Edge index).
Discussion: This early-detection approach could allow automatic diagnosis of bark beetles’ infestations and provide useful guidance for the management of areas suffering pest outbreaks.
European forests are facing increasing threats and vulnerabilities due to climate change-driven stress factors, from high temperatures and droughts to violent storms (Fischer and Knutti, 2015). These disturbances create favorable conditions for forest pest outbreaks (Marini et al., 2012; Yu et al., 2021), particularly bark beetles that depend on weakened trees to feed and breed. The most important forest pest in Europe, which can be fostered by these forest disturbances, is the European spruce bark beetle Ips typographus L. (Wermelinger, 2004; Mezei et al., 2017; Candotti et al., 2022). In the Southern Alps, the violent windstorm that occurred at the end of 2018 (Vaia) elicited an epidemic outbreak of I. typographus starting in windthrown spruces, and then extending to nearby healthy ones (Faccoli et al., 2022; Nardi et al., 2022a). Prompt detection of bark beetle infestations in the regions affected by the disturbances is vital for effective management (Faccoli and Bernardinelli, 2014; Dalponte et al., 2020). However, identifying early infestation symptoms is challenging for ground monitoring, especially on large and poorly accessible areas (Iordache et al., 2020; Luo et al., 2022), since the first signs of the infestation (i.e., entrance holes, resin flows, and boring dust on the trunk) are only detectable when very near to the trees’ trunks. New early detection approaches in the field involve sniffer dogs trained to follow the scent of the I. typographus aggregation pheromone. Dog-handler pairs showed an overall higher efficiency in locating the recently attacked and colonized spruce trees compared to the expert humans alone (Vošvrdová et al., 2023), with the possibility to detect attacked trees over 100 m away (Johansson et al., 2019). This new bio-detection approach has proved very efficient for an immediate or very early detection time scale. Nonetheless, it has still limitations regarding the spatial scale (i.e., the limited area that can be covered), possible difficulties for the access of dog-handler pairs in steep or inaccessible areas that are often present in the alpine and pre-alpine environments, and time needed to verify the attacks on each tree detected by the dogs.
Bark colonization by insects affects host health, producing changes in the canopy reflectance in some bands of the light spectrum (especially in the infrared spectrum) (Abdullah et al., 2019). These changes occur a few months after the onset of colonization, when the spruce crown still appears green (the so-called green phase), up to the late infestation stages, when the crown becomes first red (red phase) and then loses the needles (gray phase, as shown in Figure 1). Remote sensing methods have a great potential to obtain useful information about damage due to pests’ infestations, over a range of spatial extension and resolution (Näsi et al., 2015). Examples of remote sensing methods used for this purpose are time-series analysis of multispectral or hyperspectral imagery acquired by satellites, airplanes, or Unmanned Aerial Vehicles (UAV), i.e., drones. These methods are particularly effective to map the damages caused by pests when infestations are in their late stages, i.e., when symptoms are fully visible (Fassnacht et al., 2014; Gomez et al., 2020). This is useful to quantify damages but not to detect infestations at their early stages (green phase), which would be needed in order to promptly map new infestation spots and take effective actions to contain the outbreak by removing infested trees before offspring emergence (Abdullah et al., 2019; Fernandez-Carrillo et al., 2020; Huo et al., 2021; Bárta et al., 2022). Previous works investigated the effectiveness of combining remote sensing technology with machine learning models to detect early vegetation stress symptoms, using images acquired both by satellites (Meddens et al., 2011; Abdullah et al., 2018; Huo et al., 2020, 2021), airplanes (Hellwig et al., 2021) and drones (Näsi et al., 2015; Otsu et al., 2019; Honkavaara et al., 2020; Yu et al., 2021; Huo et al., 2023).
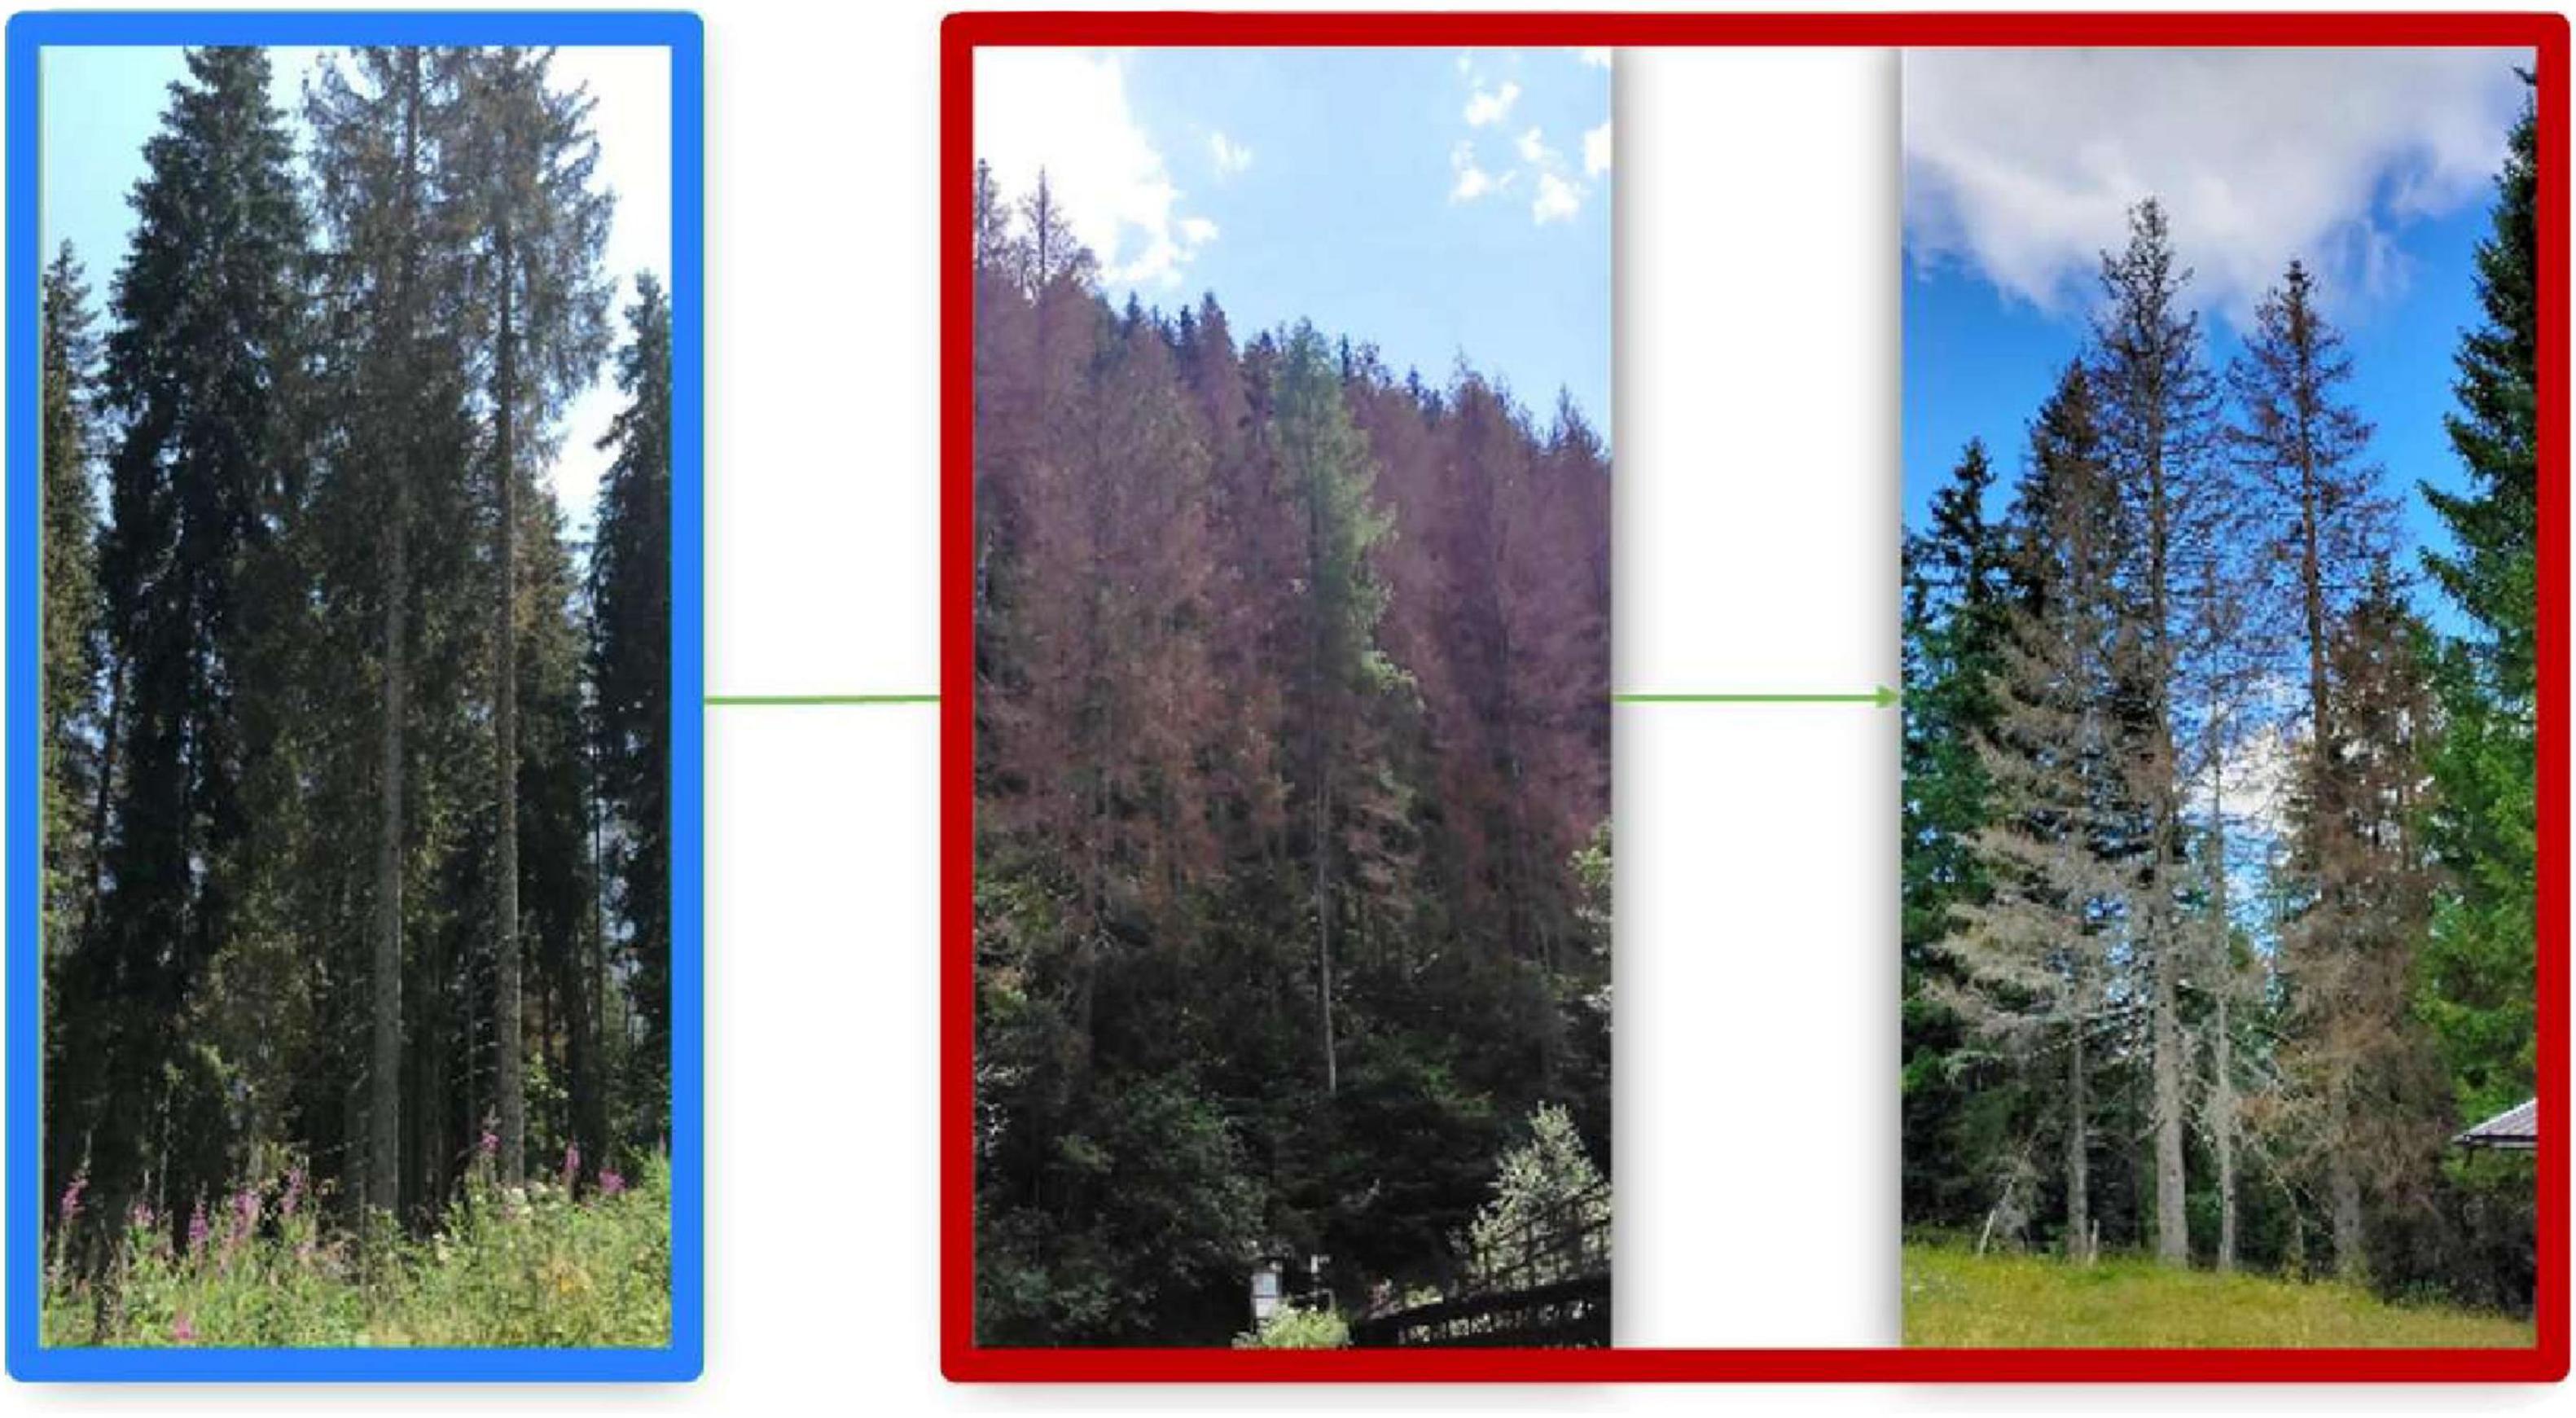
Figure 1. The three phases of spruce trees infested by Ips typographus: green phase (left), red phase (middle), gray phase (right). Remote detection of red and gray phases (red frame) is useful for damage quantification and the monitoring of outbreaks’ expansion, while remote detection of the green phase (blue frame) is necessary for an effective outbreak management and damage limitation.
Satellite imagery, while very useful to monitor outbreaks over very large areas, has some limits for detection of the early stages of infestation, mainly because of the coarse resolution of the most accessible imagery (e.g., Sentinel-2) (Bárta et al., 2021; Minařík et al., 2021; Bozzini et al., 2023). Even imagery with higher spatial resolution, such as PlanetScope (Planet Labs PBC, USA), Pléiades (CNES, France), or WorldView (Maxar, USA) may not be available for certain areas, especially on mountains, and can be affected by local issues such as shadows or clouds. The use of imagery acquired by UAVs offer promising solutions for early detection. Indeed, the higher spatial resolution (i.e., the possibility to analyze the reflectance of single trees instead of groups of trees or wider areas) could help to overcome some of the issues of the use of satellite imagery alone (like the mixed signal caused by different conditions within the same area/pixel) (Mandl and Lang, 2023). Näsi et al. (2015) pioneered the use of UAV-based hyperspectral imagery to distinguish various stages of I. typographus infestations, obtaining an overall accuracy of 76% when using three color classes (healthy, infested, and dead). Honkavaara et al. (2020) applied Random Forest classification on hyperspectral and multispectral UAV images to classify the categories “bark beetle green attack,” “root-rot,” and “healthy,” while Klouček et al. (2019) tested the detection ability of UAV images over different time points. They calculated a set of vegetational indices (VIs) and analyzed their variation in time, applying a Maximum Likelihood Classifier to distinguish infested from healthy trees, obtaining increased accuracies with later time of image acquisition for all indices. Turkulainen et al. (2023) combined machine learning algorithms with UAV multispectral and hyperspectral images, finding overall high classification accuracies for the healthy (green and faded green trees) and dead (reddish/brown and gray) spruce classes, but poorer accuracies for the infested class (yellow-yellowish trees). Finally, Huo et al. (2023) employed UAV multispectral images in spruce forests in Sweden to follow I. typographus infestation development over time. They observed large variances between individual trees within the same infestation stage, and they were able to georefer 90% of the infested trees after 10 weeks of infestation, and proposed weeks 5–10 of the infestation as a key period for detection.
The success, often limited, in detecting and classifying recently attacked trees is due to the variability and inhomogeneity of symptoms emergence on tree crowns (Cessna et al., 2021). In fact, symptoms emergence may vary in time and space, depending on factors such as, for instance, water availability and bark beetles’ population density (Kautz et al., 2023). The effects of water availability (i.e., drought stress) on the vitality of trees and the susceptibility to pest attacks have been investigated, also using remote sensing methods (Anderegg et al., 2015; Müller et al., 2022; Nardi et al., 2022b; Le et al., 2023). The effects that population abundance may have on symptoms’ emergence and severity are also interesting factors to be addressed. Boone et al. (2011) observed that the effects of host defense mechanisms at the tree level on contrasting bark beetles (mountain pine beetle) attacks and reproductive success can change depending on beetle population density at the stand level. Weslien and Regnander (1990) stated that, although the density of I. typographus galleries within the attacked parts of the trees’ stems were similar in both the non-outbreak (endemic phase) and outbreak (epidemic phase) conditions, trees had higher proportions of their stem length colonized during the epidemic phase than trees killed under endemic conditions. According to these observations, symptoms occurrence and severity and hence their detectability may differ in trees attacked by I. typographus in endemic or epidemic populations. Nevertheless, we do not know either if infestations can be detected equally in all population density conditions, or if the symptoms of infestation develop in the same way in trees colonized by I. typographus in endemic and epidemic populations.
In this respect, utilizing high-resolution UAV multispectral imagery on spruce-covered areas with endemic and epidemic bark beetles’ populations, we tested if the detectability of the infestations’ early symptoms would be affected by the different local population abundance. We induced host colonization by bark beetles on groups of spruce trees growing in sites with endemic and epidemic populations in the Southern Alps. We then used revisiting multispectral UAV imagery to check for differences in the infested trees’ reflectance features and symptoms emergence in time from the infestation onset. Meteorological data (temperature and precipitation) and tree growth performance parameters (mean DBH, i.e., diameter at breast height, average height, number of tree rings occurring in the outer 5 cm of the trunks) were also taken into account, to check possible effects on symptoms emergence.
The study was conducted in 2022 in two localities of North-Eastern Italy (northern part of the Veneto region) (Figure 2). Both localities (municipality of Canale d’Agordo, 46.3280°N 11.8970°E, thereafter called “epidemic”; municipality of Limana, 46.0405°N 12.2345°E, thereafter called “endemic”) are characterized by alpine and pre-alpine ecoregions, as defined by Blasi et al. (2014). These ecoregions are dominated by conifer forests with a strong prevalence of Norway spruce [Picea abies (L.) H. Karst.] followed by larch (Larix decidua Miller) and silver fir (Abies alba Miller). At lower elevations, spruce stands are often mixed with beech (Fagus sylvatica L.). In general, the Southern Alps I. typographus populations are bivoltine at low altitude (Faccoli and Stergulc, 2006). According to the captures gathered from pheromone traps set up in 2021 in the experimental area (deployed by the phytosanitary service of the Veneto Region), the epidemic locality was characterized by high population abundance (46,608 mean captures per trap for n = 7 traps, SE = 1,824). This was about twice the abundance of the endemic locality (28,936 mean captures per trap for n = 4 traps, SE = 1,601). Both capture values were much higher than the threshold-risk for I. typographus outbreaks (8,000–10,000 captures per trap) (Faccoli and Stergulc, 2004), due to the regional increase of the population density after the storm event. However, the ratio between summer (July–August period) and spring captures (May–June period) were 1.51 in the epidemic localities indicating an increasing trend, and only 0.17 in the endemic sites indicating decreasing populations (Faccoli and Stergulc, 2006). An overview of the captures per trap gathered in 2021 (mean and SE) is presented in Supplementary Table 1. We set up 10 experimental sites, 5 in epidemic localities (site 1–5, average size of 1.69 ha) and 5 in endemic localities (site 6–10, average size of 1.72 ha) (Supplementary Figure 1). Epidemic sites 1–5 were placed on an elevation ranging from 1,150 to 1,270 m asl, while endemic sites 6–10 were placed on a lower elevation, ranging from 875 to 1,050 m asl. The experimental sites were characterized by not steep slope, mature spruce stands and vicinity to previous I. typographus infestations. The characteristics of the 10 sites are summarized in Supplementary Table 2.
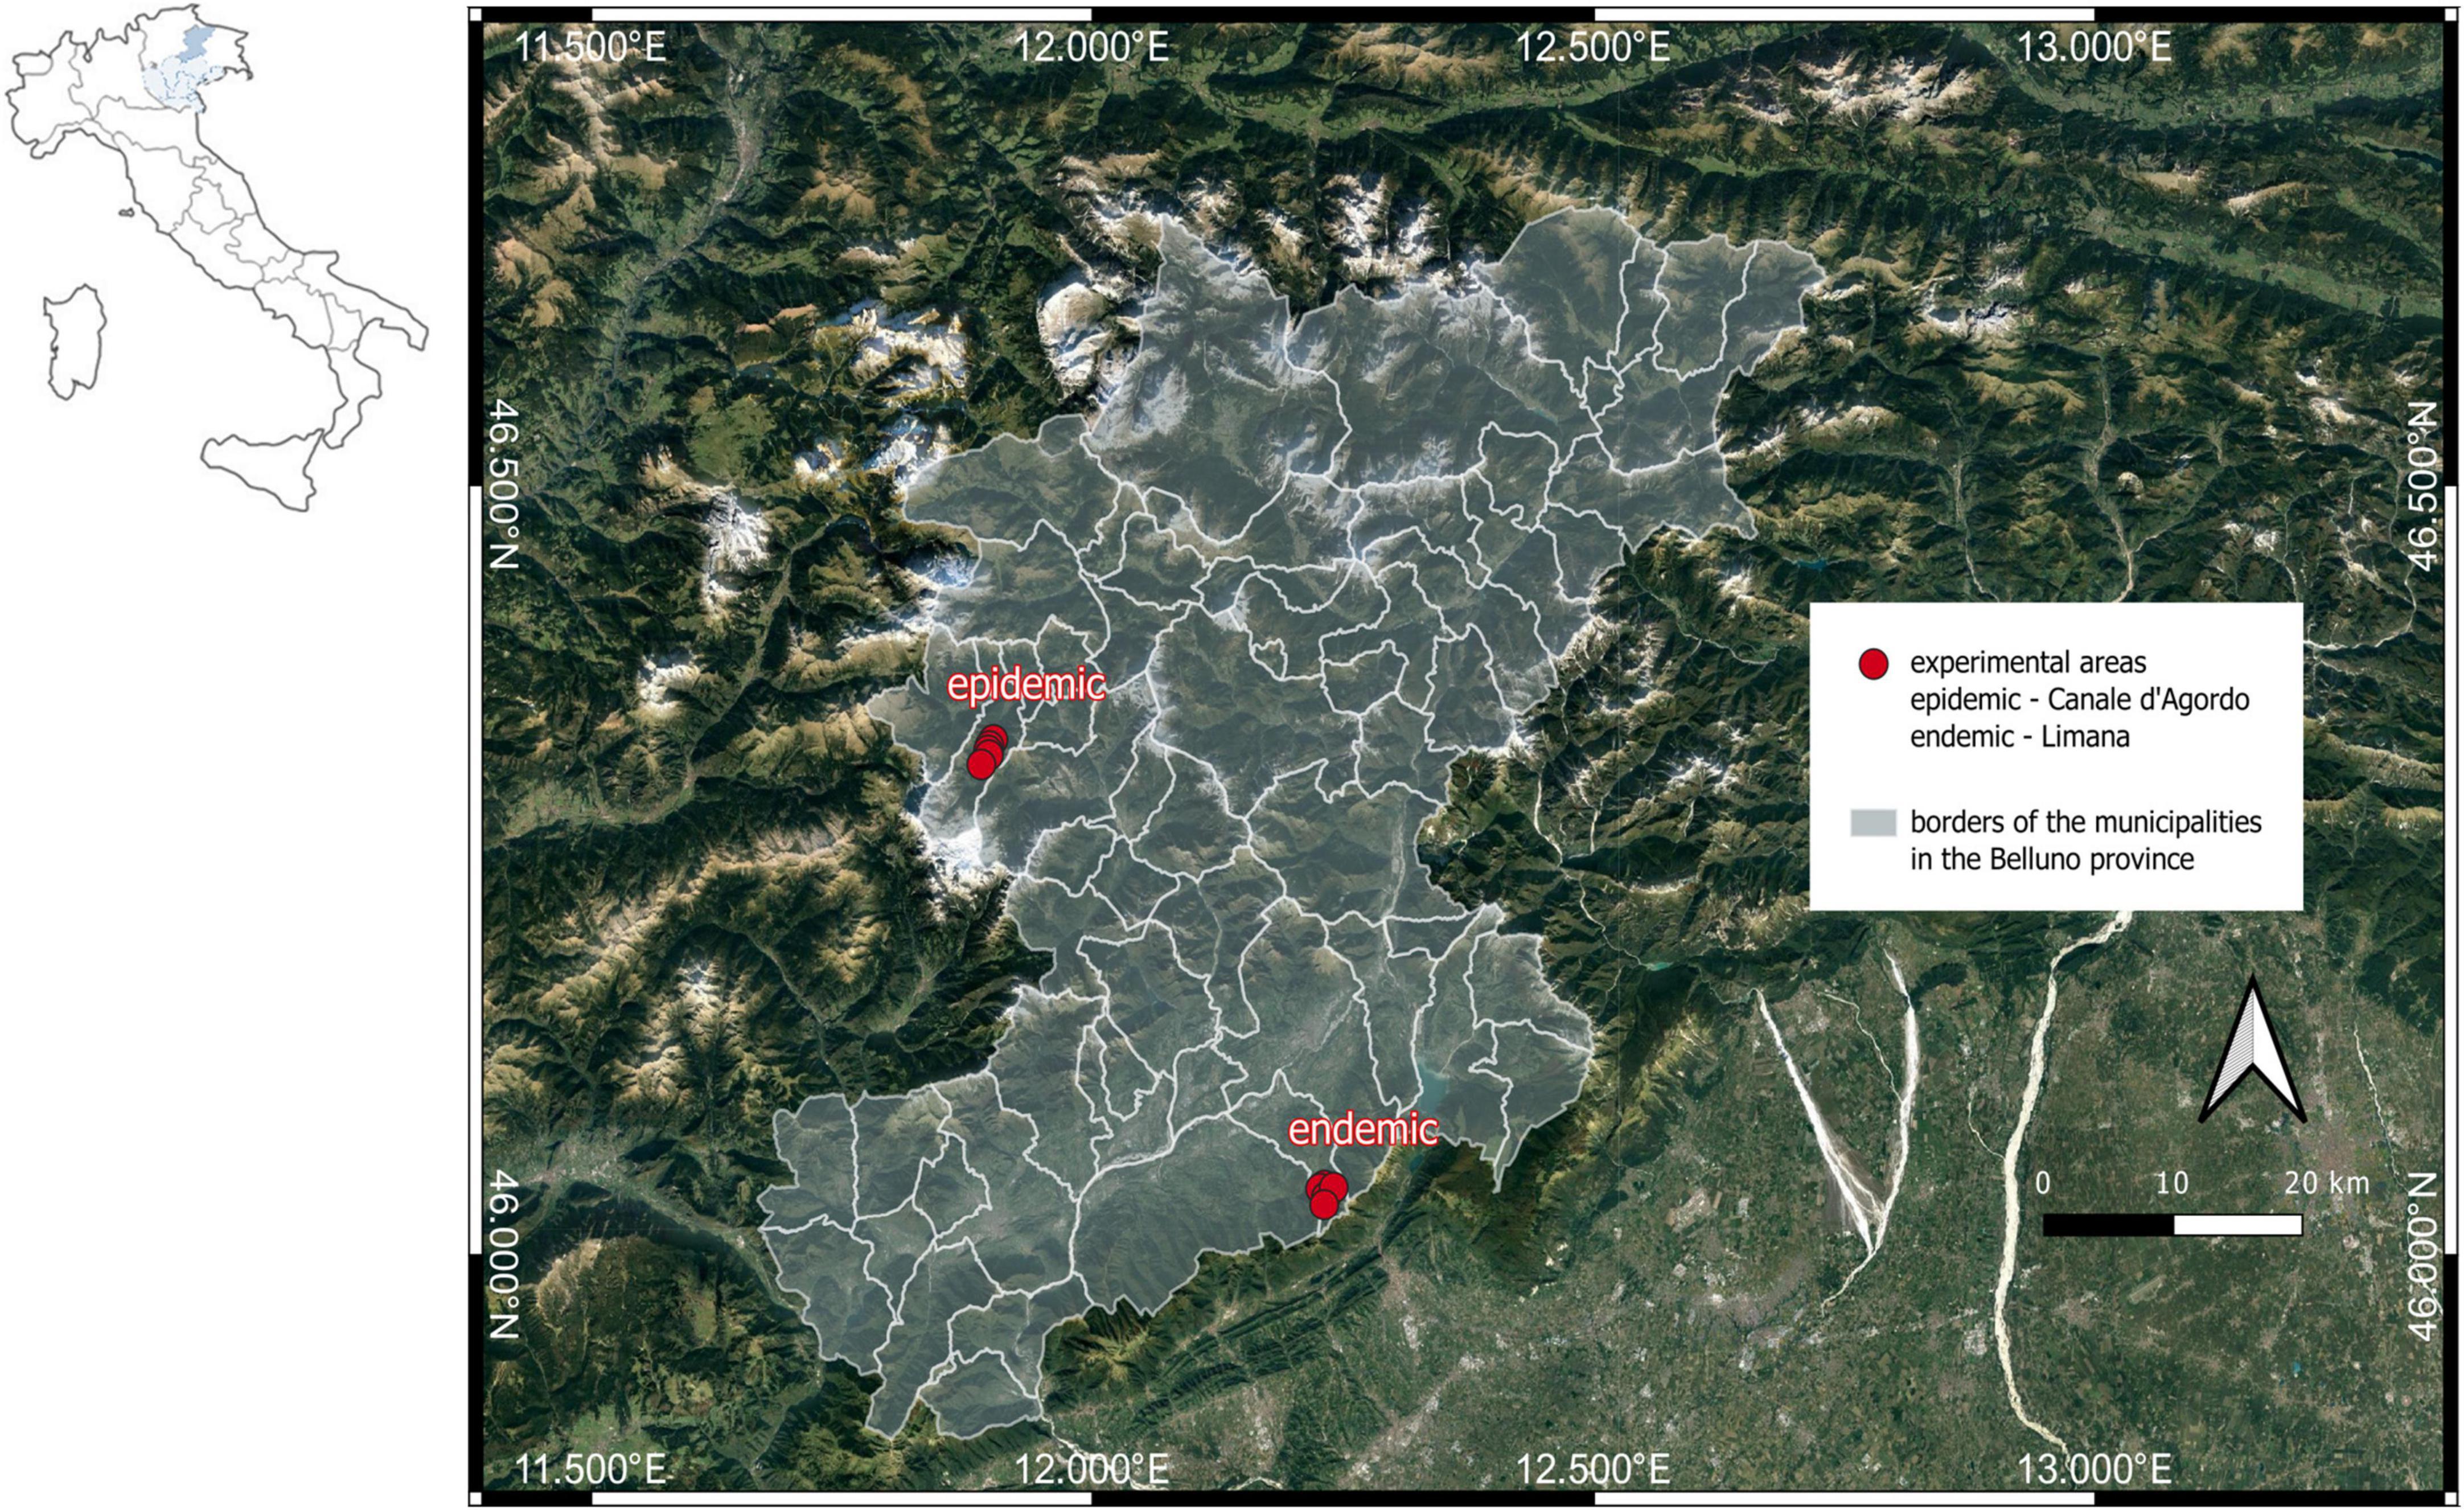
Figure 2. Location of the two types of sites affected by Ips typographus infestations (endemic, i.e., non-outbreak, and epidemic, i.e., outbreak conditions) in the northern part of the Veneto Region, NE Italy.
In each experimental site, five healthy spruces (test trees) were baited by sticking an I. typographus aggregation pheromone dispenser on the trunk [Superwood, Serbios, composed by 2-Methyl-3-buten-2-ol (98%) and cis-Verbenol (97%) with mean release rate of 40 and 3 mg/day, respectively], at approximately 2 m above ground to elicit the bark beetles’ colonization. The effect of these pheromone dispensers last up to 2 months, and the dispensers were removed from the trees at the end of the study period. All test trees were baited between the 21st of April and 4th of May, before the beginning of post-winter beetle emergence. For every experimental site five control unbaited trees were also identified among the trees that remained green and unattacked at the end of the study period (2 August 2022). Only in site 2 (epidemic) it was not possible to identify control trees because all trees were attacked by bark beetles at the end of the study period. The set of all the test trees and the control trees constituted the “experimental” dataset, both for the endemic and the epidemic sites. A stylized scheme of the experimental design is represented in Figure 3.
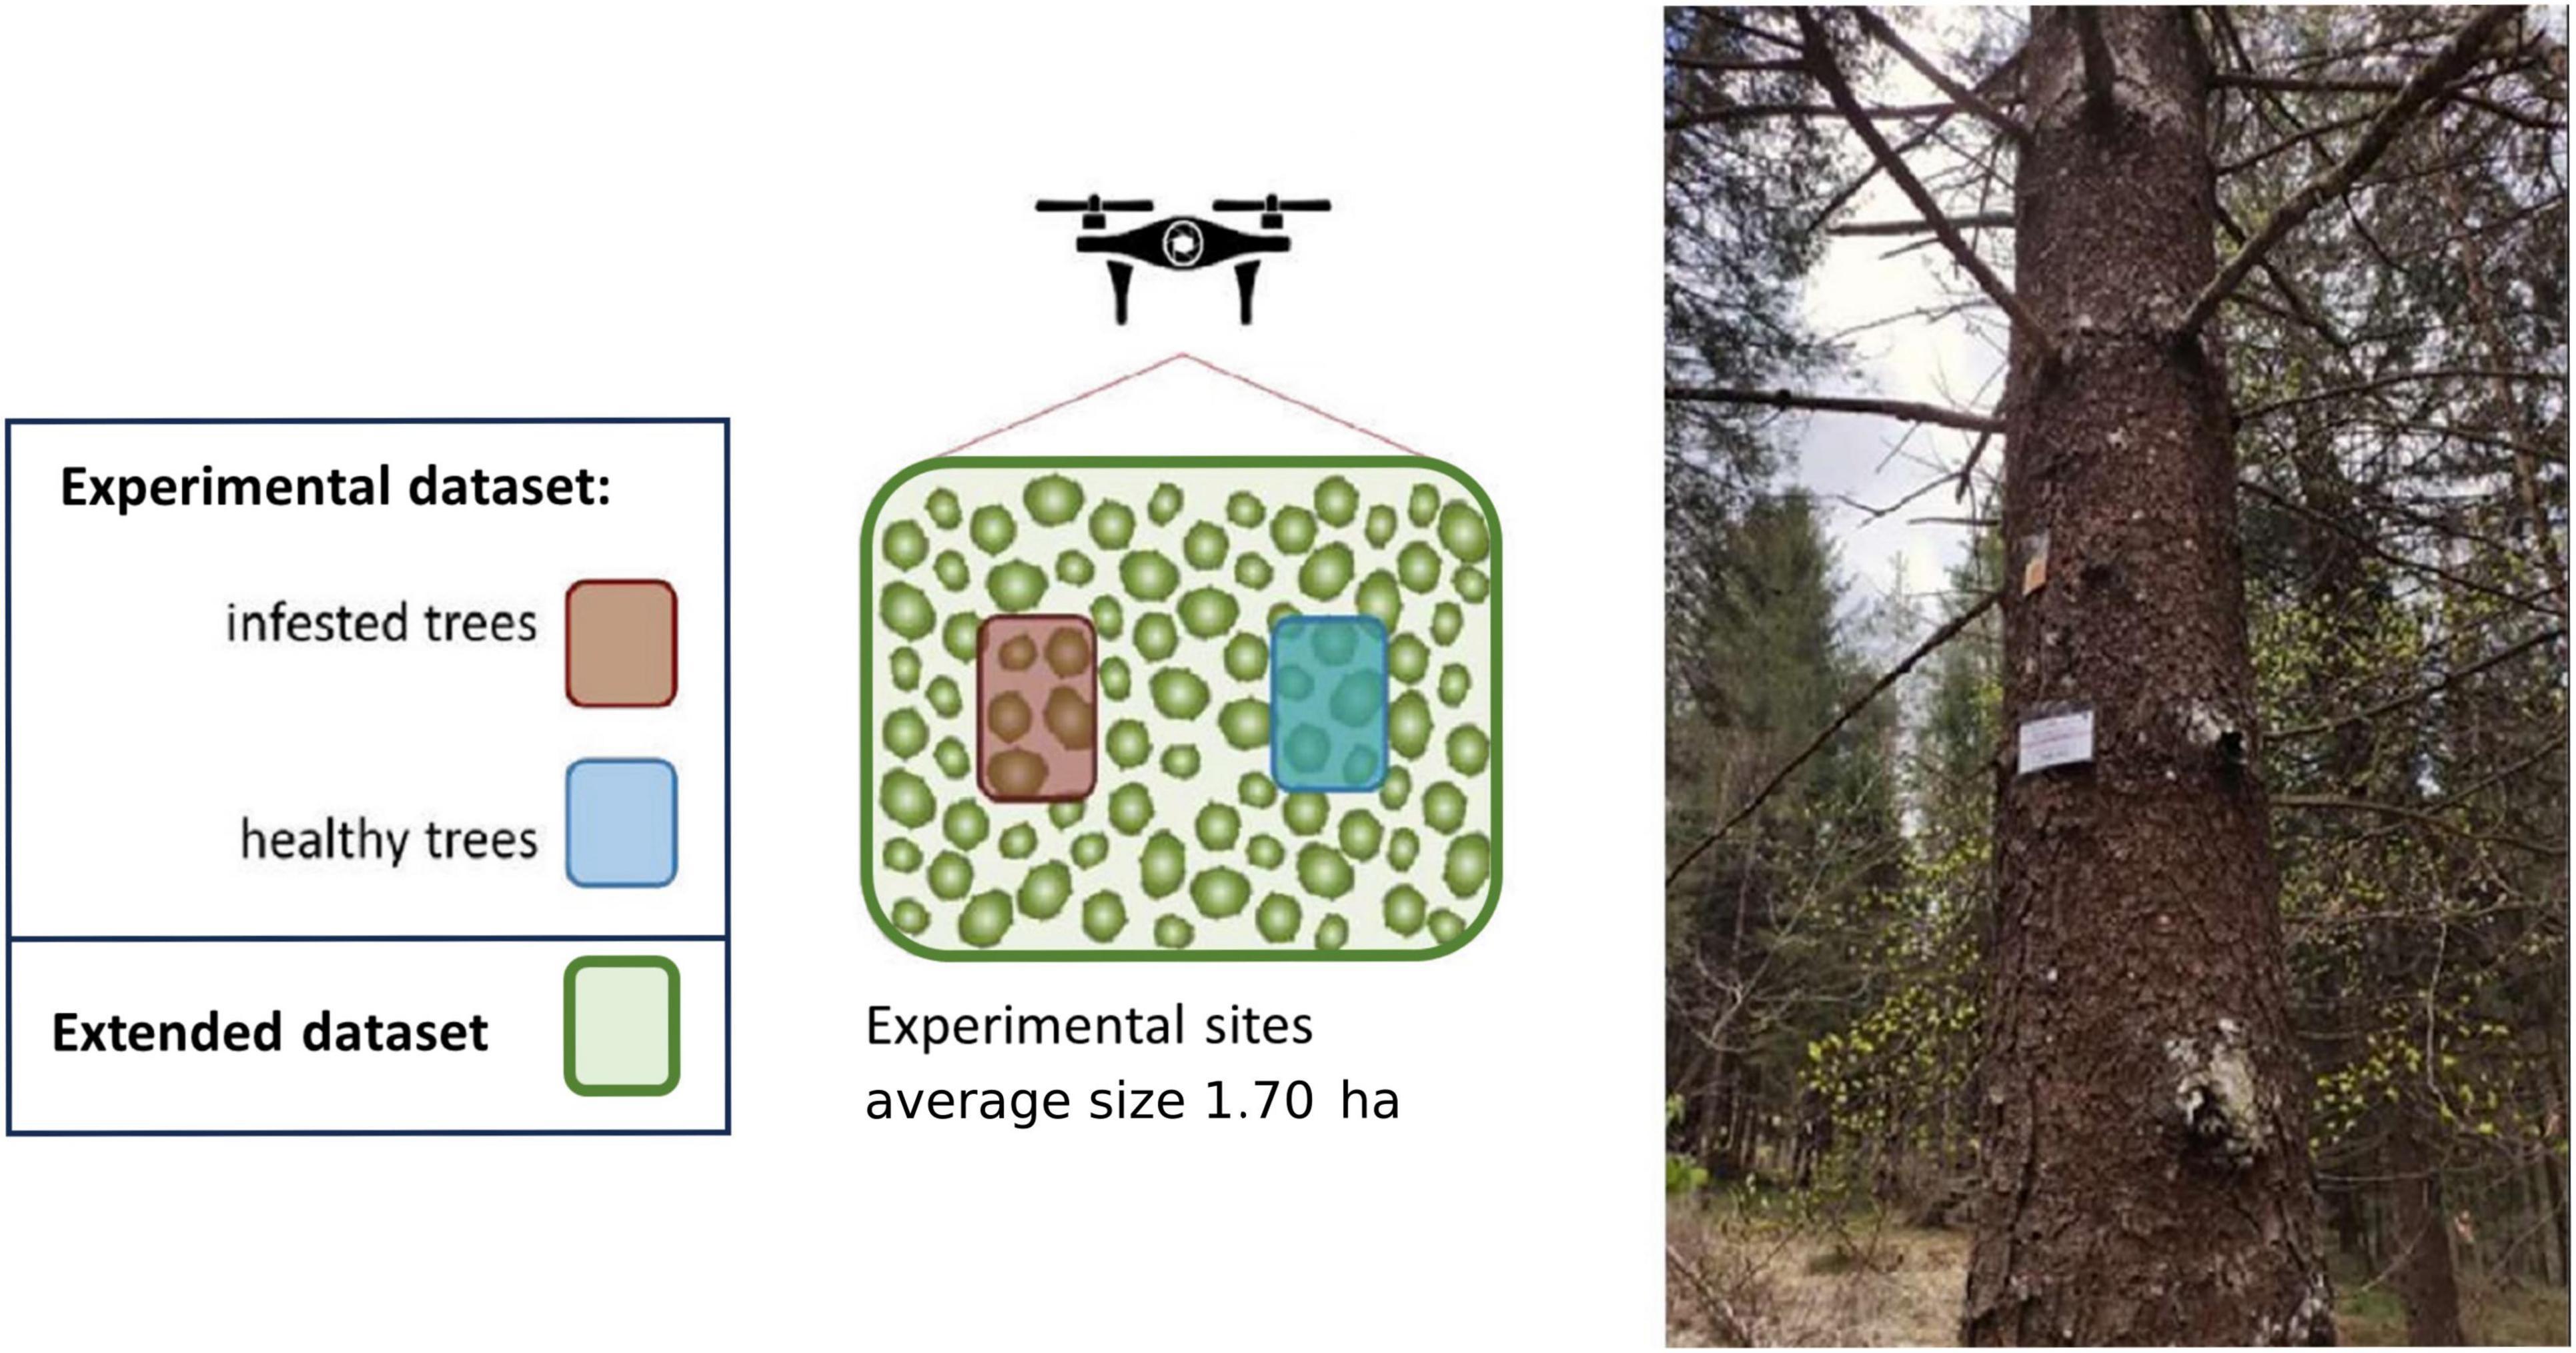
Figure 3. Scheme of the experimental design for one experimental site. In each experimental site, five healthy spruces (test trees, “experimental” dataset) were baited by sticking an Ips typographus aggregation pheromone dispenser on the trunk (Superwood, Serbios) to elicit the bark beetles’ colonization. Five control unbaited trees were also identified among the trees that remained green and unattacked at the end of the study period, and were included in the “experimental” dataset. In each experimental site, all the detected trees (in addition to the ones belonging in the “experimental” dataset) were included in the “extended” dataset. Photo: a spruce tree baited with the aggregation pheromone (dispenser visible as an orange bag) attached 2 m above ground.
In total, 50 test trees and 45 control trees were selected and monitored. Insect development within the infested trees was monitored regularly in the field by periodically removing portions of bark (c. 10 × 15 cm, sampled under 2 m of height) on the test trees and checking presence and developmental stage of the insects (eggs, larvae, pupae, and callow adults). The monitoring was conducted twice per month, approximatively every 15 days, until the end of the study period, on 11th and 31st of May, 15th of June, 1st and 22nd of July, and 2nd of August 2022. The time of the infestation symptoms’ appearance on the tree crowns was also noted. The sample of infested and healthy trees was extended from the experimental set of trees (95 trees, “experimental dataset”) by including, for each experimental site, all the spruce trees occurring in the whole experimental area (Figure 3). The extended set of trees (“extended dataset”) included 742 spruce trees, of which 202 resulted infested at the end of the period (“infested”) and 540 remained unattacked and healthy until the end of the study period (“healthy”). The procedure for the selection of the extended set of trees is described in detail in section “2.5 Brightest pixels extraction.”
To monitor the population abundance, eight black Theysohn traps (four in the epidemic sites and four in the endemic sites) were set up in the vicinity of the experimental sites but far enough away to not affect the process of tree colonization by I. typographus, and baited at the end of April with the same aggregation pheromone blend used on the test trees. The position of the traps in relation to the experimental sites can be seen in Supplementary Figure 2.
For the whole 2022 and for the period of study (11th of May – 2nd of August 2022) the meteorological data (temperature and precipitations) were provided by two meteorological stations of the local agency for environmental protection (ARPAV).1 The station located near to the epidemic sites (station “Gares,” 46.3131°N 11.8827°E) was 840 m from the nearest epidemic site (3) and 2,843 m from the farthest epidemic site (4). The station located near to the endemic sites (station “Sant’Antonio Tortal,” 46.0480°N 12.1540°E) was 5,658 m from the nearest epidemic site (7), and 6,705 m from the farthest epidemic site (9). Temperatures were also measured locally using temperature data-loggers (HOBO U23 Pro v2, HOBO®) placed in two experimental sites (epidemic site 3 and endemic site 1). The data-loggers were hung on a tree at 2 m above ground, and registered the air temperature (°C) every hour through two probes, positioned on the north and south faces of the tree. Because of technical issues with one of the two data-loggers, only the data for the month of July are reported. For precipitations, only the number of rainy days from May to August was considered. The amount of daily rainfall (mm) was considered to be not representative for the areas of study, in particular for the endemic sites, because the meteorological station (“Sant’Antonio Tortal”) is not located within the valley where the experimental sites were located (about 5 km west of the experimental sites). Instead, the number of rainy days was considered to be less susceptible to local variations, and therefore more representative than the total quantity (mm) of rainfall. The same ARPAV meteorological stations were used to retrieve temperature and precipitation data for the year 2021, to compare the meteorological conditions of the experimental sites in the 2 years. Temperature data of 2021 refer to the average temperature of the whole year and the average temperature from May to August (from 1st of May to 31st of July), to have the comparison for the same time as the study period of 2022.
Growth performance of the trees occurring in the experimental sites was assessed on a set of spruce trees in the close proximity to the test and control trees (growth dataset), divided as follows. The mean DBH (diameter at breast height) and average height were measured with an altimeter (Altimeter BL7, Carl Leiss Berlin) on a total of 40 trees (20 in the epidemic and 20 in the endemic sites). The number of tree rings occurring in the outer 5 cm of the trunks was measured in 50 spruce stumps of recently cut trees growing in the experimental sites (25 in the epidemic and 25 in the endemic sites), for which also the diameter was measured.
Drone flights were performed on the same dates as sampling on bark of the test trees in every experimental site, for a total of six flights from May to August 2022. The drone (drone Phantom 4 RTK MS DJI) was equipped with a photocamera, to capture RGB images, and a multispectral sensor with a filter for five separate spectral bands (center wavelength ± bandwidth / 2): Blue (B): 450 nm ± 16 nm, Green (G): 560 nm ± 16 nm, Red (R): 650 nm ± 16 nm, Red-Edge (RE): 730 nm ± 16 nm, and Near Infrared (NIR): 840 nm ± 26 nm. The RTK (Real-Time Kinematic) module operates automatic georeferencing corrections when connected, through the internet, to the local GNSS network, allowing images to be collected with a high spatial precision, between 2.5 and 4 cm horizontally. When RTK cannot connect to internet, the georeferencing information can be retrieved through PPK (Post-Processed Kinematic), using georeferenced files of the nearest GNSS station. By these characteristics (RTK module and possible PPK correction) it was always possible to precisely identify the position of the test trees baited with pheromones. A specific flight plan was set for every experimental site to keep the same flight characteristics, such as heights and trajectories, through all dates and sites. The height of the drone above ground level (AGL) was set at 100 m, according to the average height of the trees (between 20 and 40 m), and the home point (the point where the drone takes off and lands) set when the drone was switched on. For the trajectories, the lateral overlap (overside), representing the percentage of image overlapping sideways to the flight direction, and the longitudinal overlap (overlap), representing the percentage of image overlapping along the flight direction, were set at 85% and 82%, respectively. The images acquired by the drone undergo an automatic radiometric correction through a white balancing function carried out at the beginning of every flight.
The single images collected by the drone were processed using a Structure from Motion (SfM) software [Agisoft Metashape Professional 1.7.1 (RRID:SCR_018119), Agisoft LLC] to obtain orthomosaics that represented, bidimensionally, the whole study areas. Orthomosaics are composite images obtained by the mosaicking and geometric correction of the single images, for every multispectral band and for the RGB images. The orthomosaics contain the georeferencing information obtained at the collection of the images, and therefore they also maintain the spatial precision.
Because during image acquisition the crowns of the trees were partially sunlit and partially shadowed, a supervised classification was carried out to extract from the drone photos taken on each date only the pixels corresponding to the brightest portion of every tree crown. The extraction and use of the brightest pixels instead of the whole tree crowns was also used in similar studies (Puttonen et al., 2010; Näsi et al., 2018; Cessna et al., 2021) with successful results. The supervised classification of the brightest pixels was done using the Semi-Automatic Classification Plugin in QGIS [QGIS 3.32.0 (RRID:SCR_018507)], identifying different regions of interest (ROI) in a multiband raster containing the information of all five spectral bands. The final result consists of polygons corresponding to different classes (e.g., sunlit part of the tree, shadowed part of the tree, soil, etc.), of which only those corresponding to the brightest pixels throughout all the period of study were extracted. If, on one or more dates, the supervised classification could not extract the pixels corresponding to the brightest portion of a tree crown, the polygon for that tree crown was not created. An example of the supervised classification product, with the highlight of the brightest pixels of the tree crowns throughout all the period of study, can be seen in Figure 4.
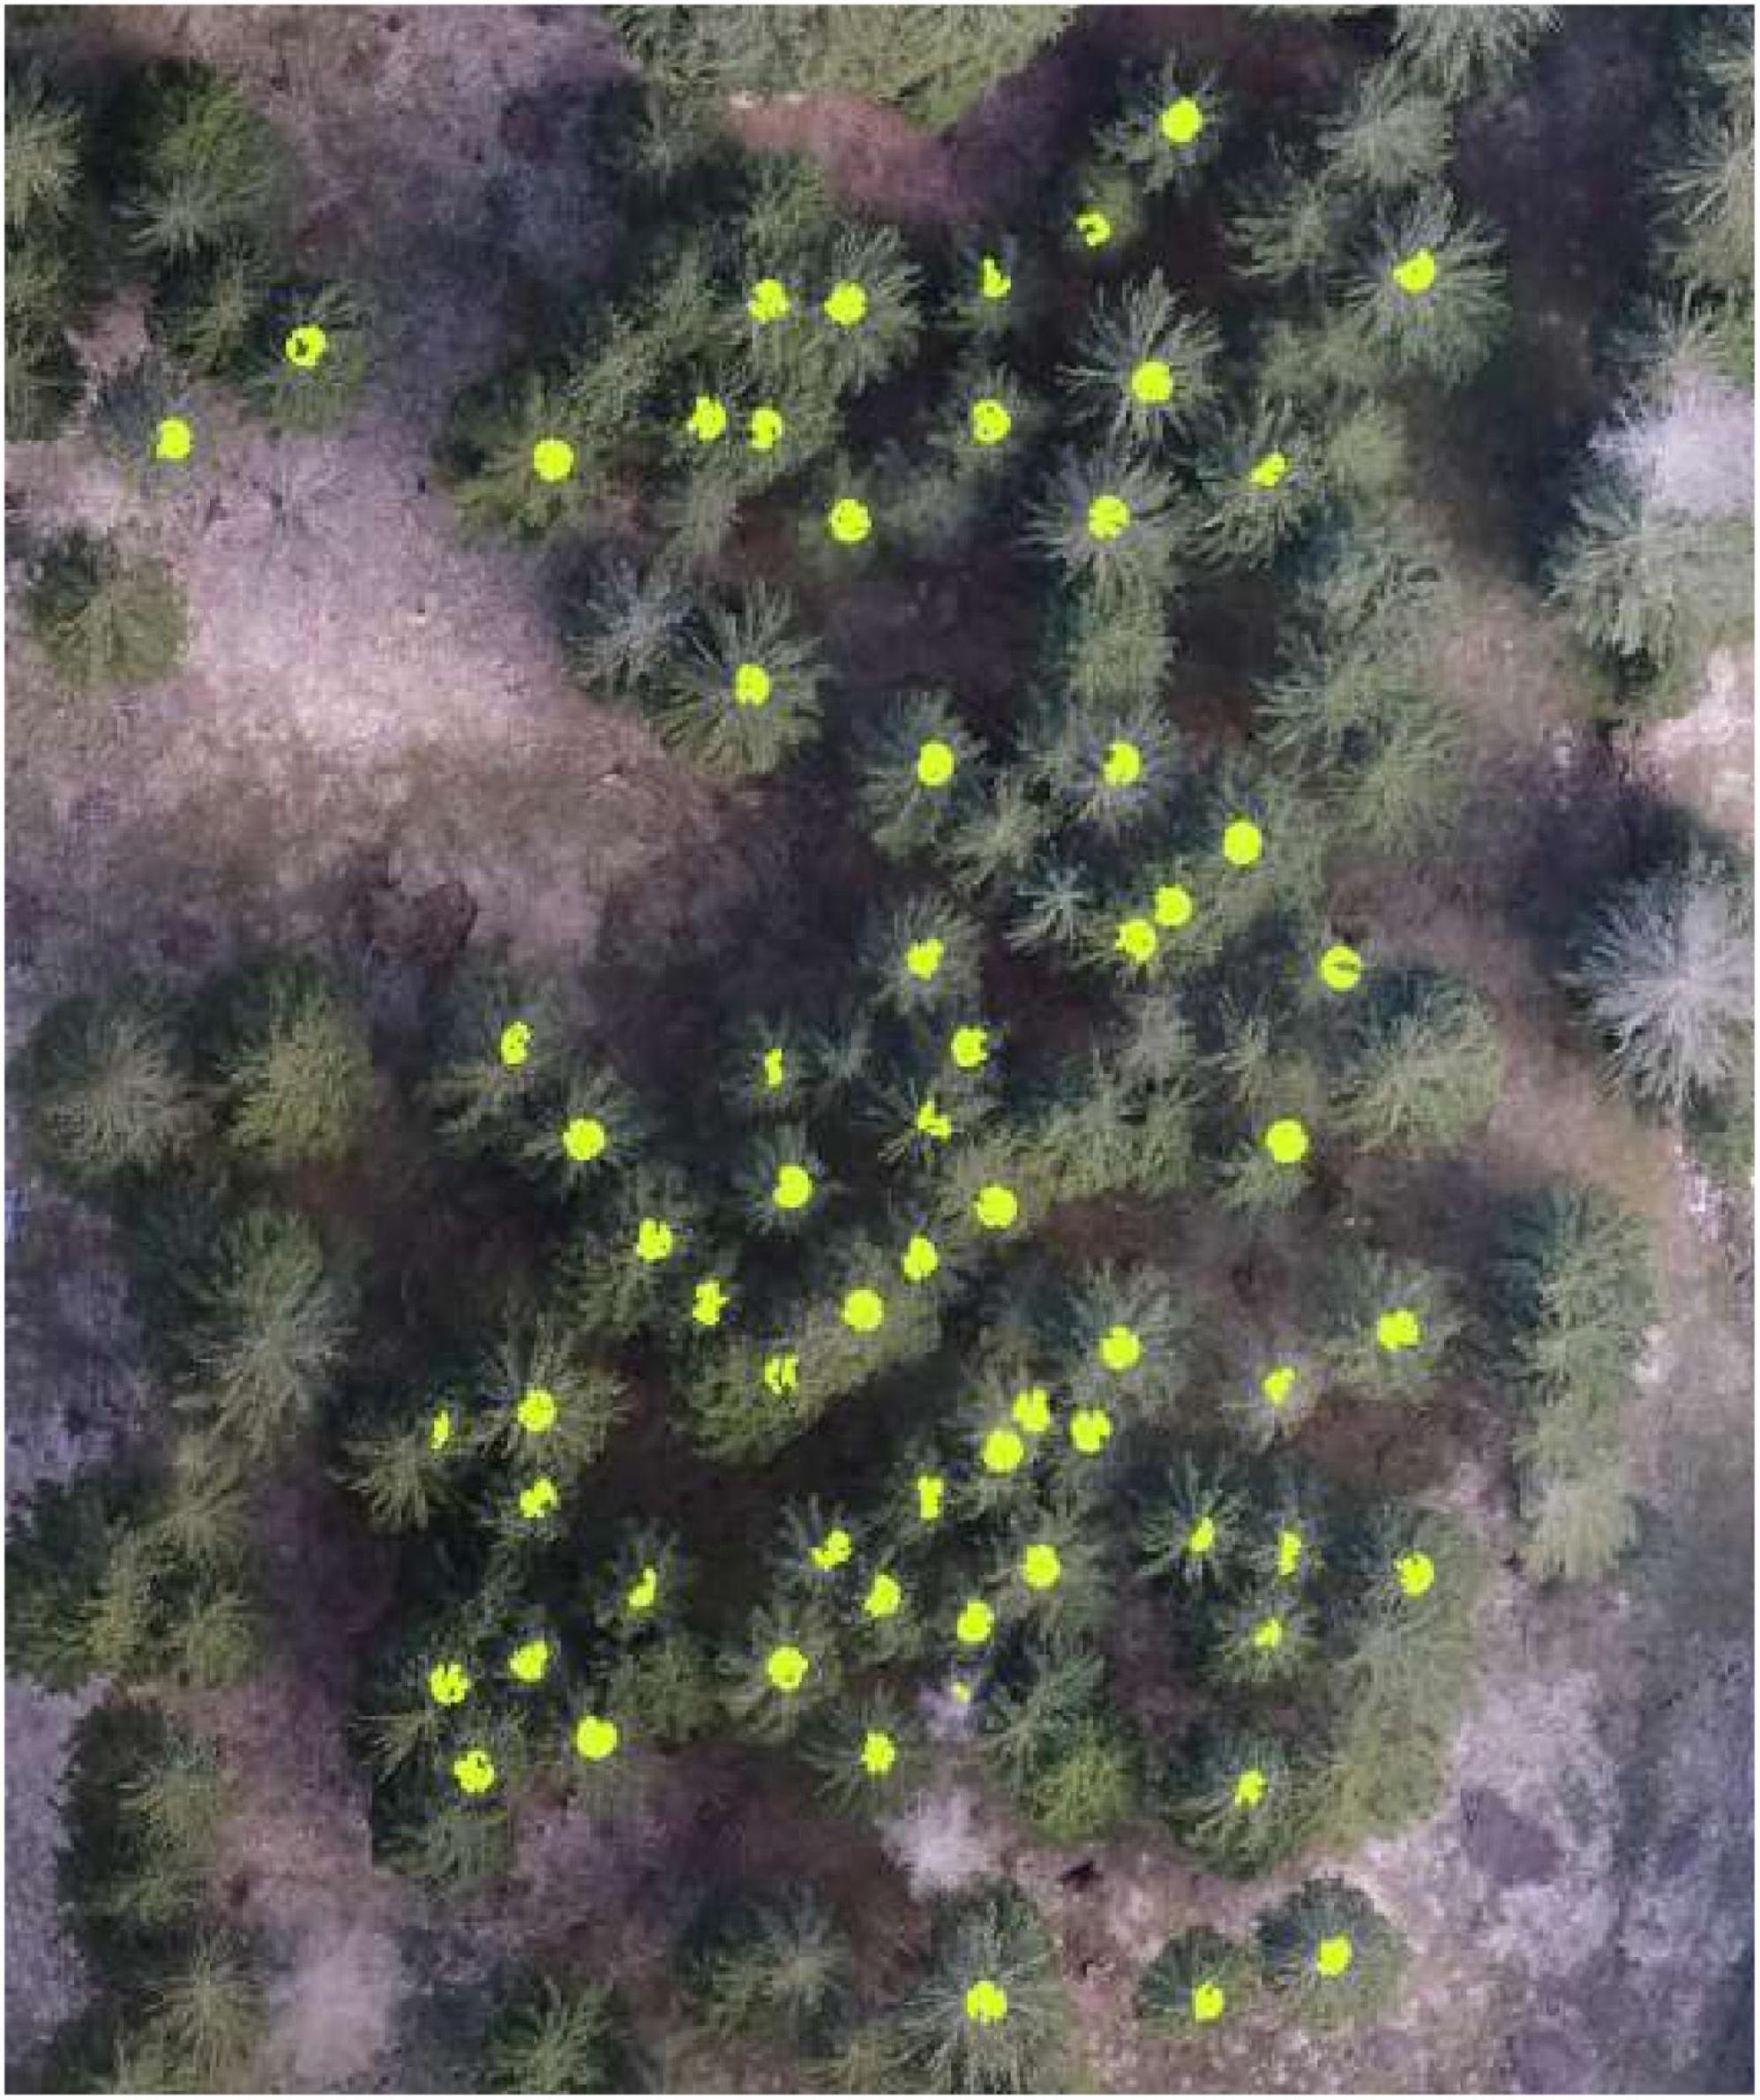
Figure 4. Detail from drone image of one experimental site (epidemic site 1). The greenish polygons correspond to the brightest pixels (visible light) of the tree crowns.
The centroids of every tree crown were also extracted from the supervised classification product to separate polygons of pixels belonging to different trees, using a circular buffer of 1.5 m. This way, every polygon corresponded only to a tree and therefore every tree in each site could be numbered (have a tree identity). Only polygons corresponding to spruce trees were kept, excluding polygons belonging to other classes, such as other tree species or trees dying or dead at the beginning of the study. After these steps, the final product consisted in polygons (an average of 357 pixels) of the brightest part of a total of 742 spruce tree crowns, which constituted the “extended” dataset for both the endemic and the epidemic sites and were used for the following analysis. Of the 742 spruce trees identified, 202 trees resulted infested at the end of the period (“infested,” 160 in the epidemic sites, 42 in the endemic sites) and 540 trees remained unattacked and healthy until the end of the study period (“healthy,” 249 in the epidemic sites, 291 in the endemic ones).
The temporal spectral variation of the test trees (i.e., infested) and control trees was assessed by a set of 10 vegetation indices (VIs) calculated from the brightest pixels of the tree crowns, using the Raster Calculator function in QGIS, and looking for the index or indices better describing such variability. The VIs used are listed in Table 1.
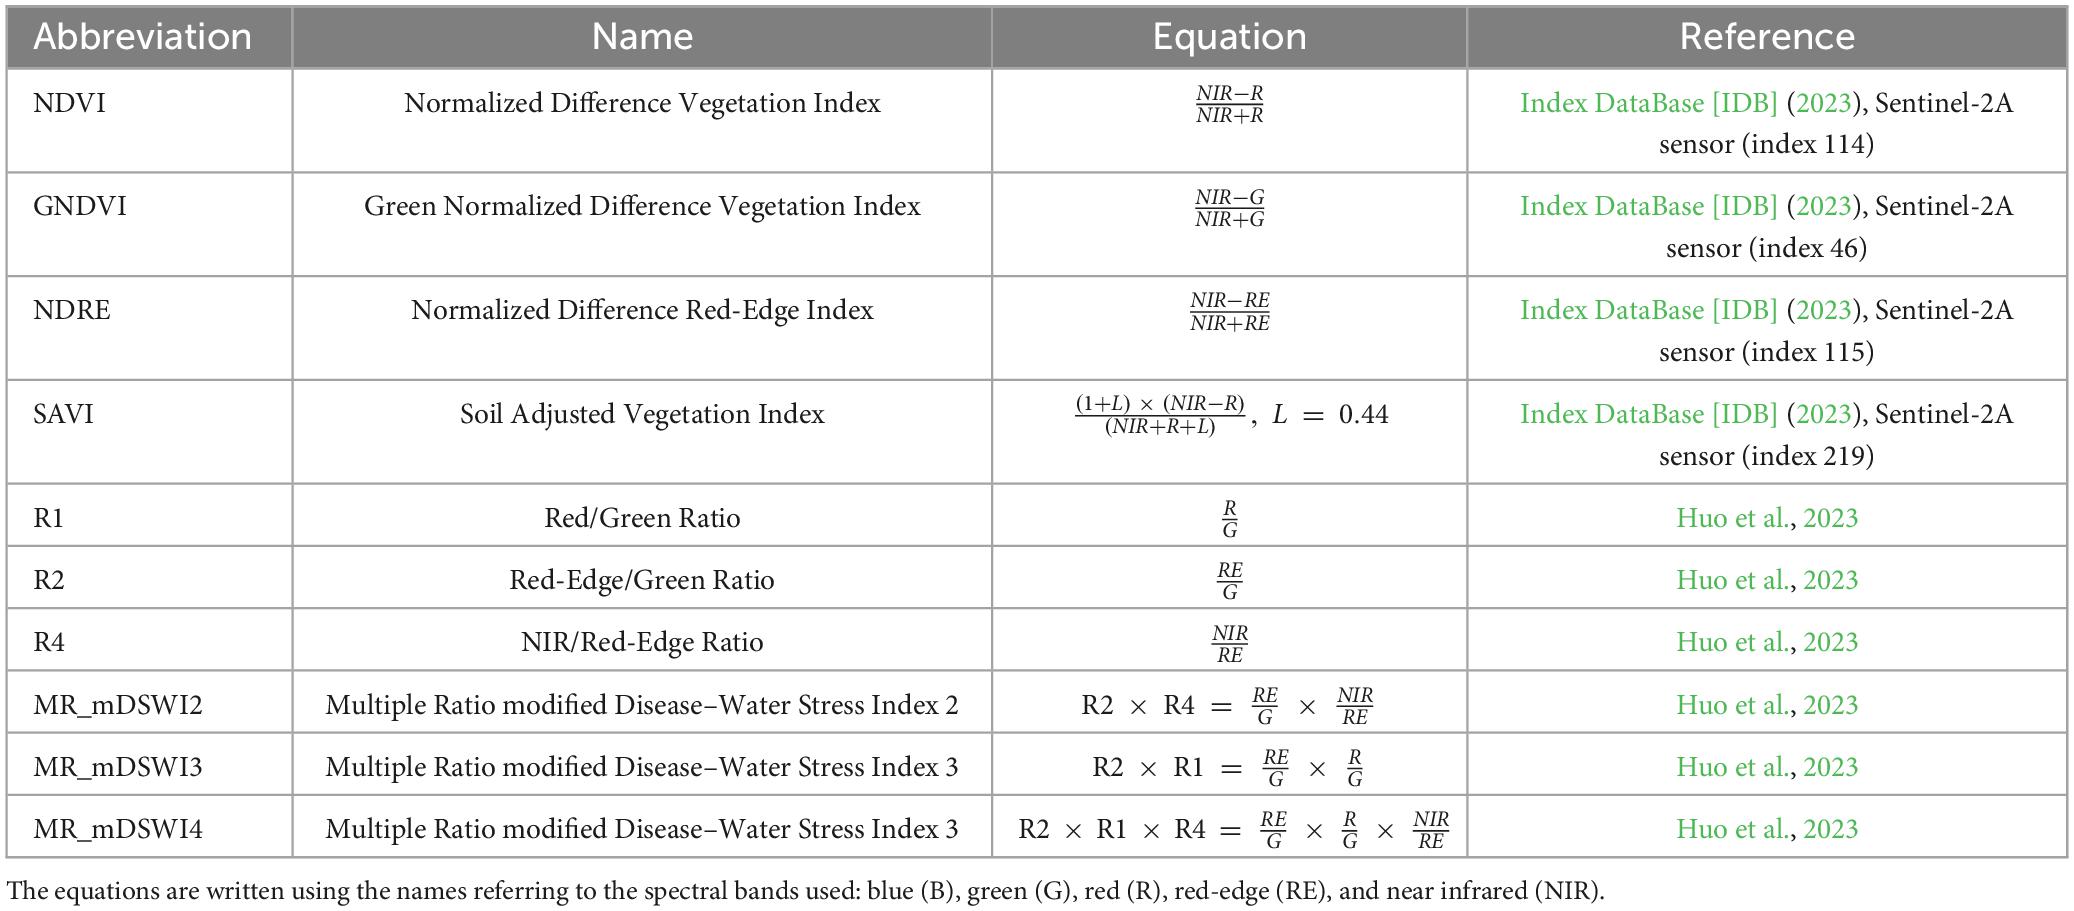
Table 1. List of vegetation indices (VIs) used in this study.
The vegetation indices NDVI (Normalized Difference Vegetation Index), GNDVI (Green Normalized Difference Vegetation Index), NDRE (Normalized Difference Red-Edge Index), and SAVI (Soil Adjust Vegetation Index) were chosen because they are commonly used to assess vegetation health and stress (Abdullah et al., 2019; Navarro et al., 2019; Dalponte et al., 2023; Trubin et al., 2023). The last six indices of Table 1 were used following Huo et al. (2023). The authors tested various ratios (R1, R2, and R4) that should increase under water-related stress, together with combinations of these ratios to try and magnify the effects of vegetation stress. Other vegetation indices (Huo et al., 2023) could not be applied in this study due to the different sensors used. Similarly, the multiple ratios indices used in this study (MR_mDSWI2, MR_mDSWI3, and MR_mDSWI4) were adapted from Huo et al. (2023) according to the available spectral bands.
Generalized linear mixed models with a Gaussian distribution were built and validated to identify the date corresponding to a significant deviation in VIs of infested trees from healthy ones, the response variables were the median values of the VIs, considered independently. Considering the response variable’s nature (Domain of Real numbers), we deemed the Gaussian distribution most appropriate. Other distributions, such as Poisson, negative binomial, and binomial, were deemed unsuitable due to the variable’s requirement to be an integer or a Rational number. The categorical explanatory variables were tree condition (infested vs. healthy), survey date and their interaction. Site identity (1–5 for epidemic sites, 6–10 for endemic sites) and tree identity within each site (number of the tree in each site, as explained in section “2.5 Brightest pixels extraction”) were included in the models as nested random factors. For each generalized linear mixed model, pairwise comparisons between infested and healthy trees for each survey date were run using Tukey correction of p-values. We used a contrasts comparison matrix to visualize all the differences between healthy and infested trees within each sampling date. However, with the aim of maintaining clarity while managing the presentation’s length, we chose to display only the values corresponding to the earliest detection date in Supplementary Table 3. The response variables were ln-transformed when necessary to improve linearity (i.e., a log-normal distribution was used). To assess possible statistical power improvements, the analyses were conducted both on the experimental dataset and on the extended dataset, consisting of the total set of trees extracted from the images as per the definitions stated in section “2.1 Study areas.” The experimental dataset consisted of 95 trees (the pheromone-baited test trees, 25 for the epidemic and 25 for the endemic sites, plus the control trees, 20 for the epidemic and 25 for the endemic sites), while the extended dataset consisted of 742 trees (the total infested trees observed at the end of the field experiment, 160 for the epidemic and 42 for the endemic sites, plus the respective healthy trees, 249 for the epidemic and 291 for the endemic sites, including the 95 trees of the experimental dataset). The analyses were conducted separately for epidemic and endemic sites. For the VIs that returned a statistically significant healthy-infested deviation (p-value < 0.05), the threshold for the detection of infested trees was identified as the VI value outside the VI range of healthy trees, as suggested by Huo et al. (2023), e.g., the lower or upper confidence limit of the healthy estimate. For each linear mixed model, an effect size analysis was carried out to compare healthy and infested trees at the earliest detection date, following the approach proposed by Nakagawa and Cuthill (2007). A power-size analysis was also carried out for each model, to assess the power of the models applied on the experimental and the extended datasets. The statistical analyses were carried out together with a statistician. All the analyses were performed in R software version 4.2.2 (R Core Team, 2022). Models were fitted using the “lme4” package [ Bates et al., 2021 (RRID:SCR_015654)], and checked for residual distribution and residual autocorrelation using the “DHARMa” package [ Hartig, 2022 (RRID:SCR_022136)]. Pairwise comparisons and effect size analyses were run using the “emmeans” package [ Lenth, 2022 (RRID:SCR_018734)]. Power-size analyses for each model were run using the “simr” package [Green and MacLeod, 2023 (RRID:SCR_019287)].
Every pheromone-baited test tree was successfully colonized by bark beetles. The developmental stages that were observed during the field surveys in every experimental site are summarized in Supplementary Table 2. In all sites, the color of the infested tree crowns started to change around the 22nd of July, almost 7 weeks after oviposition, appearing red on the 2nd of August 2022, 9 weeks after oviposition. Only in three sites (one epidemic and two endemic), the crown color changed before the 22nd of July. Despite all the test trees being successfully colonized by bark beetles, there were visible differences in the appearance of the infestation symptoms among the sites. The total test trees that had developed visible symptoms on their crowns at the end of the study period were 42 out of 50. In the epidemic experimental sites, 23 out of 25 test trees showed visible symptoms (red crowns) at the end of the study period on the 2nd of August, and the nearest spruce trees were also attacked and showed symptoms (in site 2 all trees in the area were attacked, so there were no healthy trees to be used as control). The endemic experimental sites were instead characterized by a minor symptoms appearance, often limited just to the test trees (in site 5 only two trees showed symptoms on the crown), for a total of 19 symptomatic test trees out of 25.
The bark beetles’ captures data from the traps during the study period (from May to August of 2022) show mean annual values per trap almost five times higher in the epidemic sites (23,243 captures per trap for n = 4 traps, SE = 2,299) than in the endemic ones (4,703 captures per trap for n = 4 traps, SE = 553). This confirms the trend of infestation found in 2021, with a higher population abundance in the epidemic sites that showed a population density well over the threshold-risk for outbreaks (8,000–10,000 captures per trap), and therefore persisting epidemic conditions. At the same time, the prediction of a strong decreasing population in the endemic sites (ratio between summer and spring captures of 0.17 indicates decreasing populations, Supplementary Table 1) passing from 2021 to 2022 was also confirmed, with a much lower population density and effectively reaching endemic conditions. An overview of the captures per trap gathered in 2022 (mean and SE) is presented in Supplementary Table 4, while flight activity of I. typographus according to the captures gathered from the pheromone traps during the study period (from May to August 2022) is shown in Supplementary Figure 3.
The epidemic sites were characterized by a lower average temperature (7.3°C during the whole year, 14.8°C during the period of study) than the endemic sites (11.7°C during the whole year, 19.7°C during the period of study) according to the ARPAV meteorological stations. This trend was also confirmed by the data-loggers, which registered an average temperature of 15.1°C in the epidemic sites and 17.5°C in the endemic ones from May to August (Supplementary Figure 4). As for precipitations, there were more rainy days in the epidemic sites (106 days) than the endemic ones (92) during the whole of 2022, but there were no substantial differences in the number of rainy days during the study period (32 vs. 31 days) (Supplementary Figure 4). A similar climatic trend was observed in 2021, when the epidemic sites were colder (5.9°C during the whole year, 12.4°C from May to August) than the endemic sites (10.3°C, 17.3°C from May to August). The epidemic sites were characterized by more rainy days (113 during the whole year, 43 from May to August) than the endemic sites (103 during the whole year, 36 from May to August). Comparisons of the meteorological data of the two types of sites for 2021 and 2022 are shown in Supplementary Figure 5.
The results of the analysis on the growth dataset showed that spruce trees in the endemic sites were on average characterized by greater diameters and heights (mean ± SD) (diameter 47.2 ± 2.5 cm, and height 24.4 ± 0.4 m for 20 trees) than those in the epidemic sites (diameter 32.9 ± 1.6 cm, and height 20.6 ± 1.2 m for 20 trees). Similarly, the stumps’ average diameter measured in the endemic sites were higher (53.9 ± 2.1 cm for 25 trees) than in epidemic sites (43.8 ± 2.5 cm for 25 trees), but there were no substantial differences in the number of rings in the outer 5 cm of the trunks (17 in the endemic and 18 in the epidemic sites). An overview of the meteorology and growth performance data is presented in Table 2.
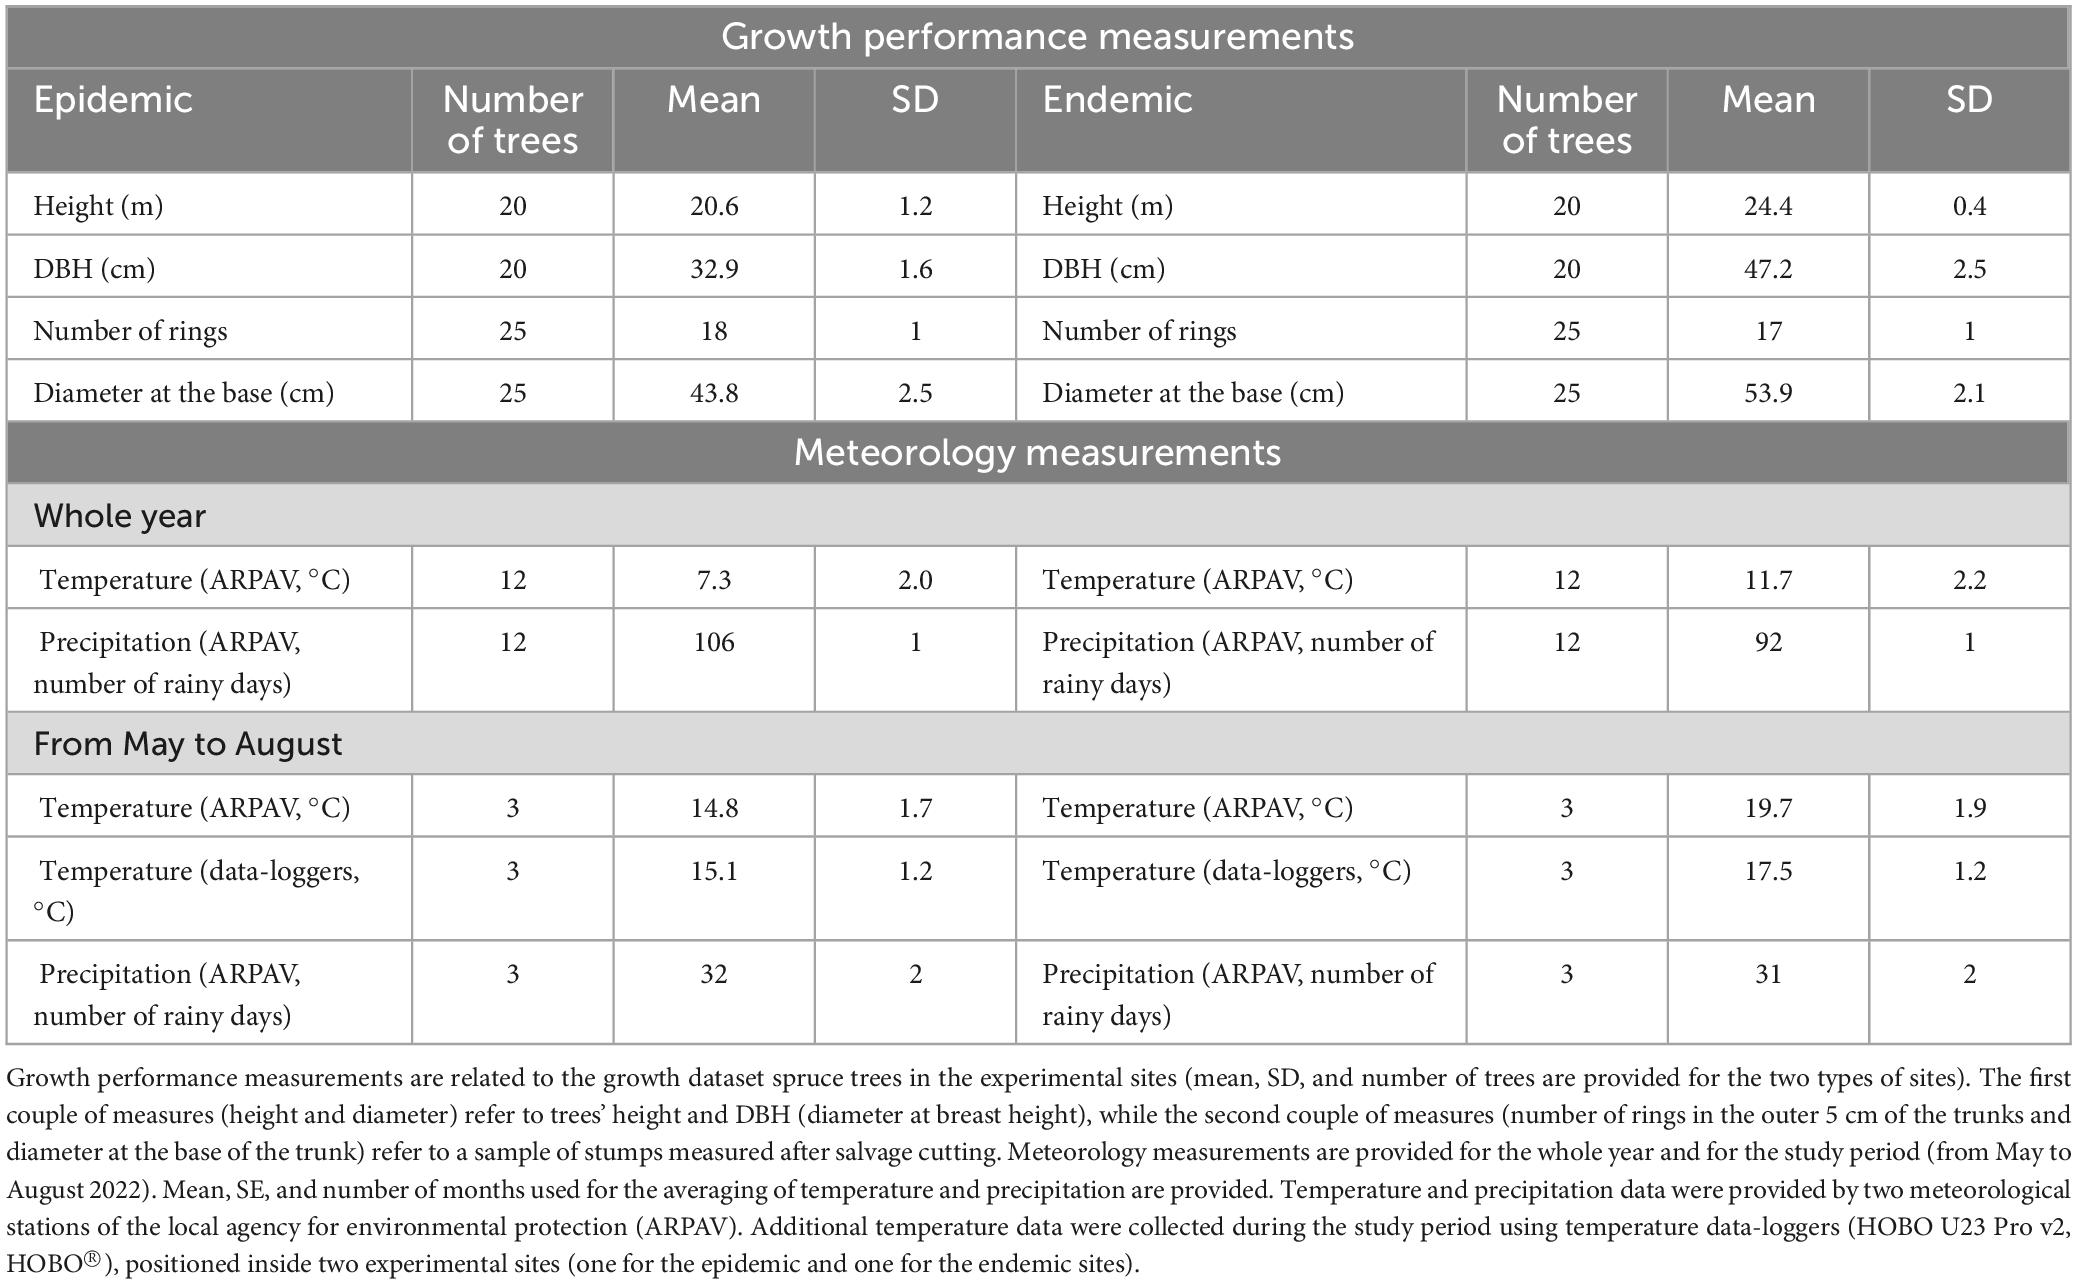
Table 2. Overview of the growth performance and meteorology measurements obtained in the experimental sites in 2022.
Analysis of the temporal spectral variations of the infested trees, and consequently the determination of early-detection timing (i.e., detection of the infested trees before the color change of the tree crowns, occurred around late July-beginning of August 2022), gave different results for the two types of sites, with an earlier detection in the epidemic sites (between 1 and 2 months before symptoms emergence) while no early detection was possible in the endemic sites. The results, referred to the earliest date of significant deviation in the tested VIs (listed in Table 1) of the infested trees from the healthy ones, are shown in Supplementary Table 3.
For the epidemic sites, the best results were obtained by the analysis on the dataset, with the earliest detection of infested trees on 31st of May 2022 (during the oviposition phase) by the NDVI and SAVI indices, with threshold values (lower healthy confidence limit, Table 3) of 0.079 and 0.114, respectively, almost 2 months before the visible symptoms appearance. The analysis on the experimental dataset was less performing, with the earliest detection date on 1st of July 2022 (first generation beetles’ emergence and sister brood larvae development), by the NDRE, GNDVI, and MR_mDSWI2 indices, with threshold values of 0.020, 0.014, and 1.018, respectively.
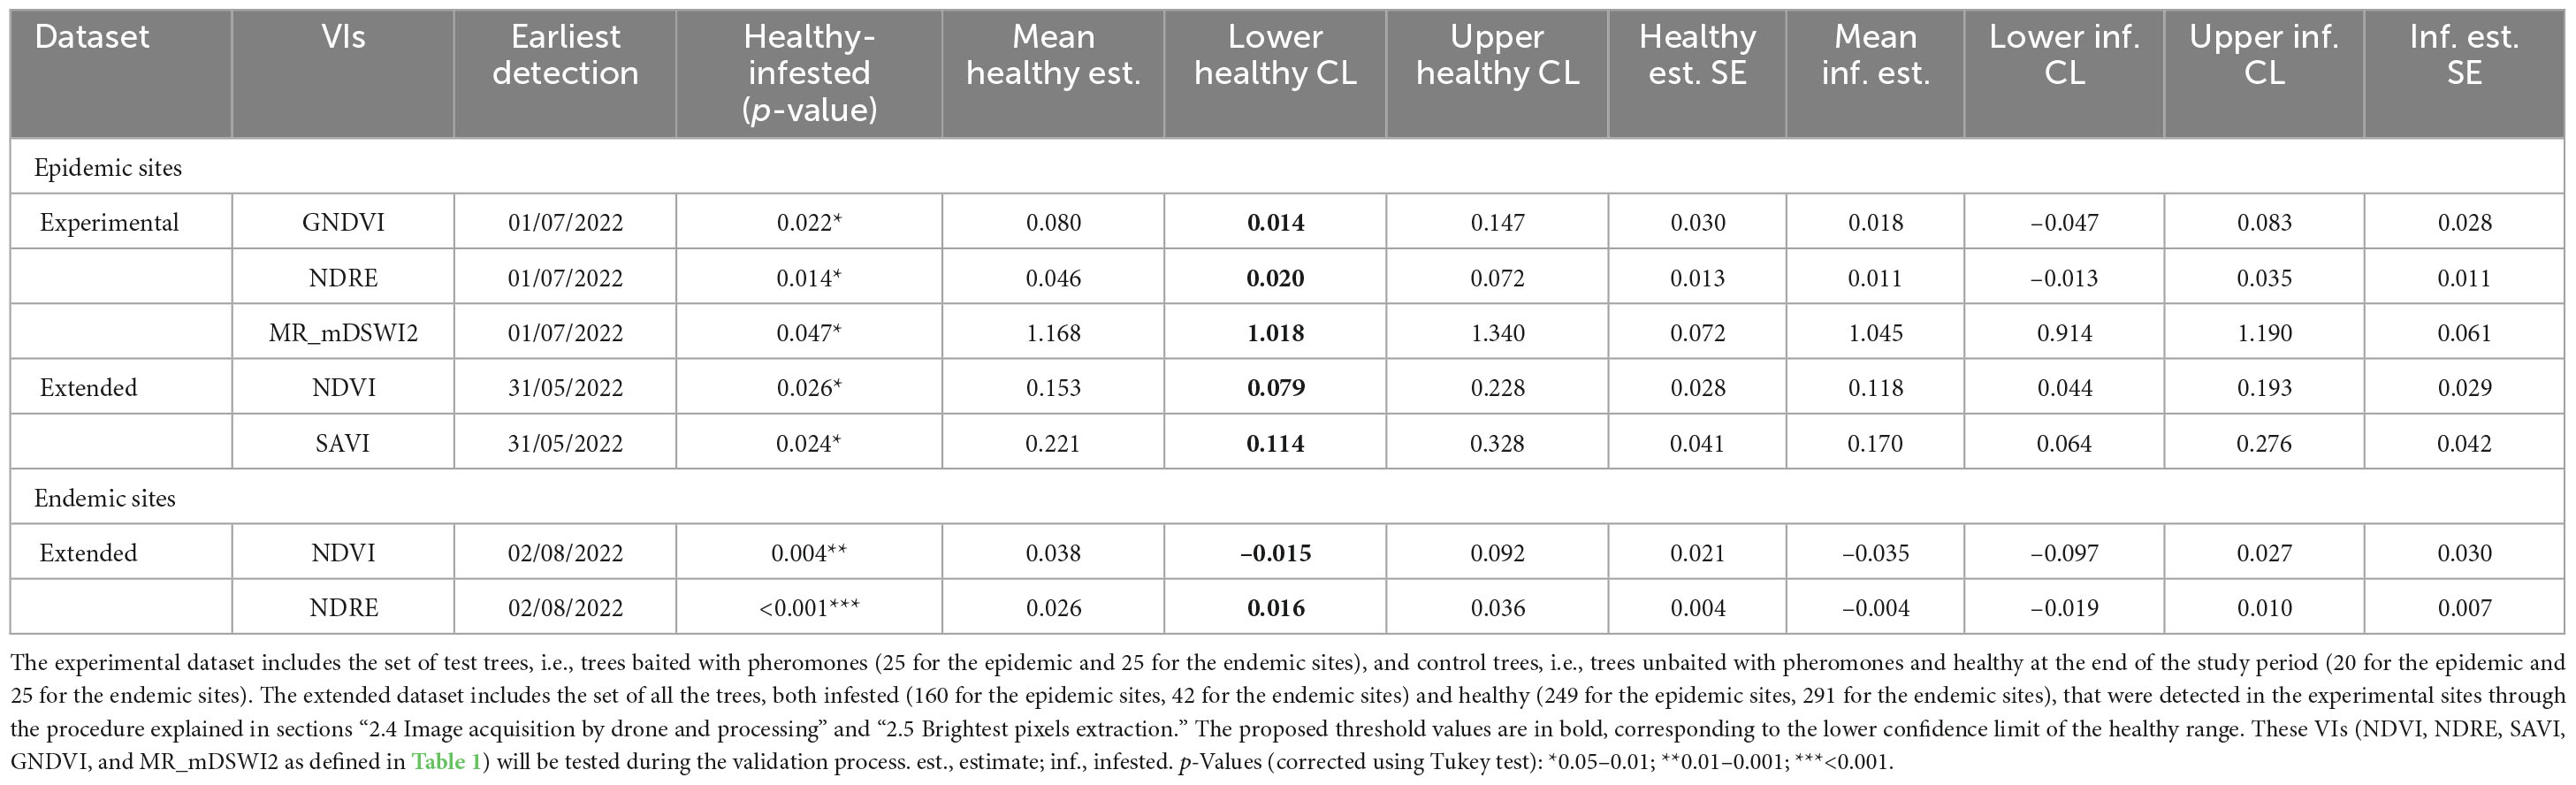
Table 3. Description of the healthy and infested ranges of the best performing VIs’ values, on the corresponding earliest detection date.
For the endemic sites, early detection of the infested trees was not possible, as only the differences of infested from healthy trees’ values of the indices NDVI and NDRE were statistically significant (threshold values of −0.015 and 0.016, respectively), but only on the last survey date (2nd of August 2022) when the tree crowns had already changed color. NDRE threshold value in the endemic sites (0.016) could also be used as a threshold value in epidemic sites, as it is more conservative [i.e., lower than NDRE value in epidemic sites (0.020) and could better discriminate infested from healthy trees]. We can hypothesize that the slight increase of the NDRE of the infested trees in that phase could be due to the reflectance features of the images on that date (01/07/2022). In fact, the difference between healthy and infested trees was not significant on that date (pupal phase), the date before (larval phase), and the date after (first generation emergence), and the spectral behavior was not consistent for other indices. The spectral variation of the best performing VIs, with the indication of the developmental stage of bark beetles corresponding to the survey dates, is shown in Figures 5, 6.
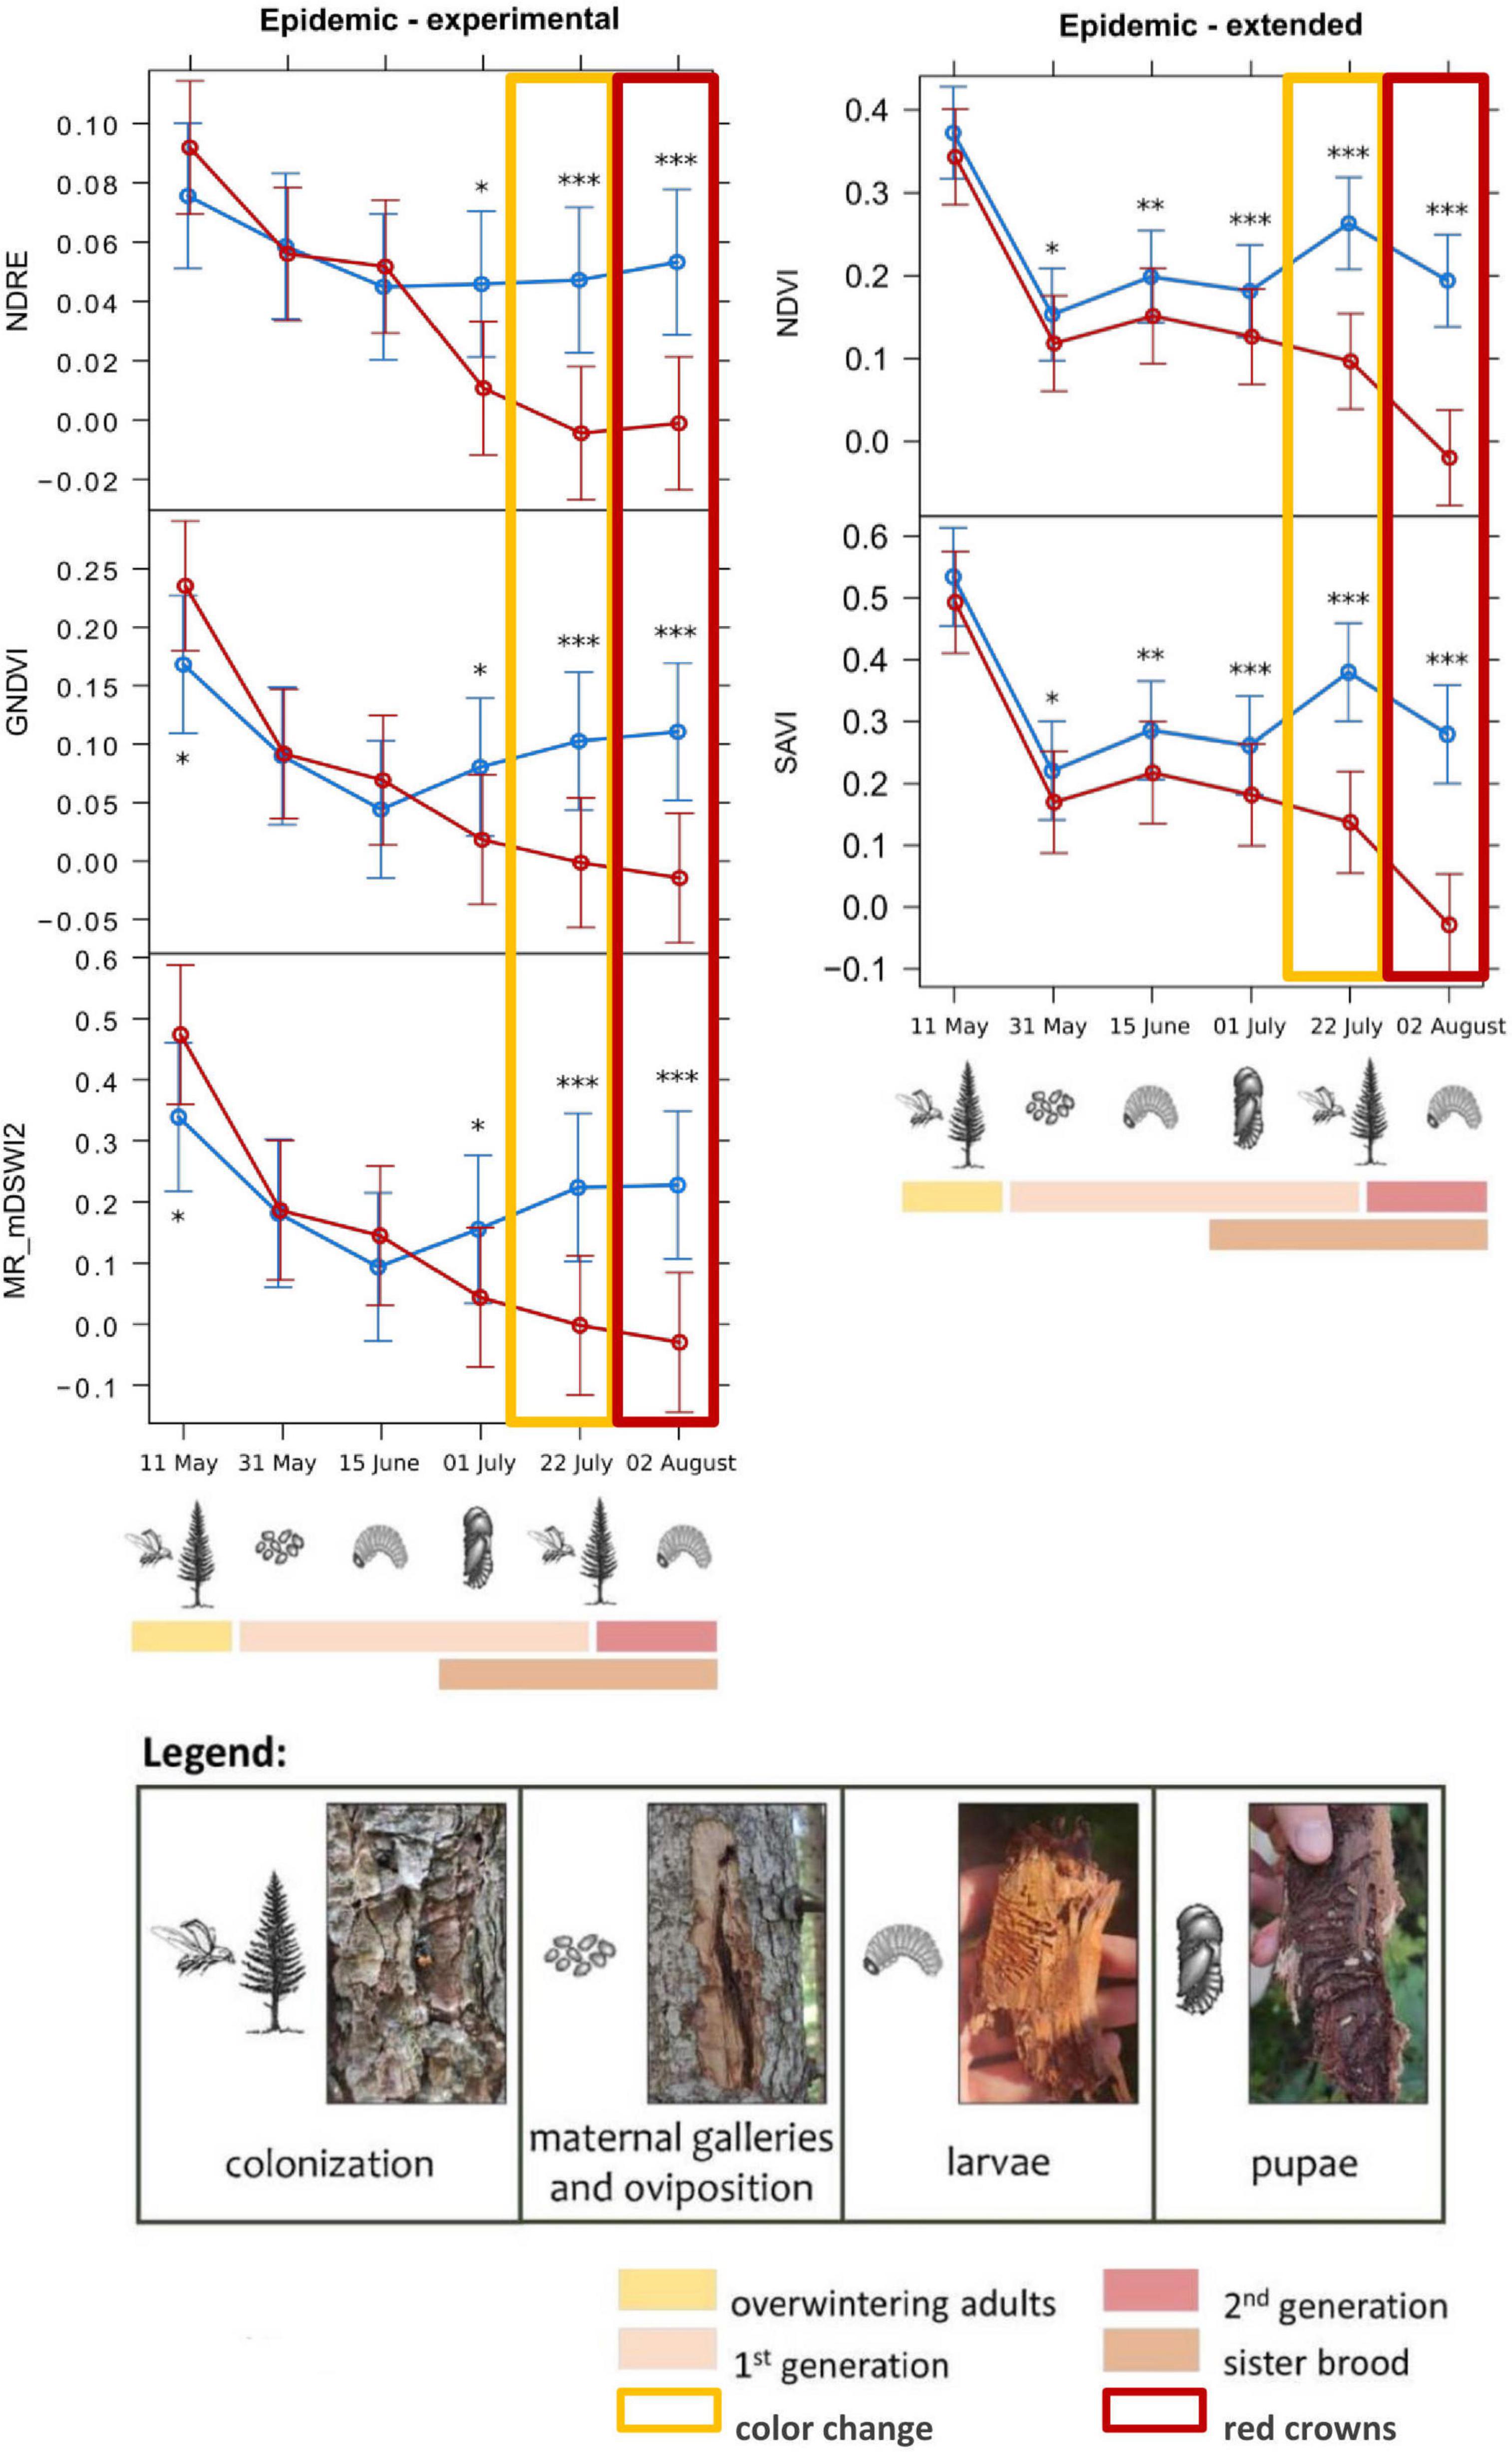
Figure 5. Means from the generalized linear mixed models testing the spectral variation of different vegetation indices across the study period, for infested (red) and healthy (blue) trees for the epidemic sites. The “Epidemic-experimental” group includes the variation of the NDRE (Normalized Difference Red-Edge Index), GNDVI (Green Normalized Difference Vegetation Index), and MR_nDSWI2 (Multiple Ratio modified Disease–Water Stress Index 2) indices on the infested and healthy trees of the experimental dataset, with the earliest detection on 1st of July 2022, almost 1 month before visible symptoms appearance. The “Epidemic-extended” group includes the variation of the NDVI (Normalized Difference Vegetation Index) and SAVI (Soil Adjusted Vegetation Index) indices for the extended dataset, with the earliest detection on 31st of May 2022, almost 2 months before visible symptoms appearance. For every graph, the development stages of bark beetles that were assessed during the field surveys are shown (as described in the legend). Symbols in the legend are modified by Biedermann et al. (2019). Statistical significance refers to p-values from Type II Wald χ2 test with 5 degrees of freedom. p-Values (corrected using Tukey test): *0.05–0.01; **0.01–0.001; ***<0.001.
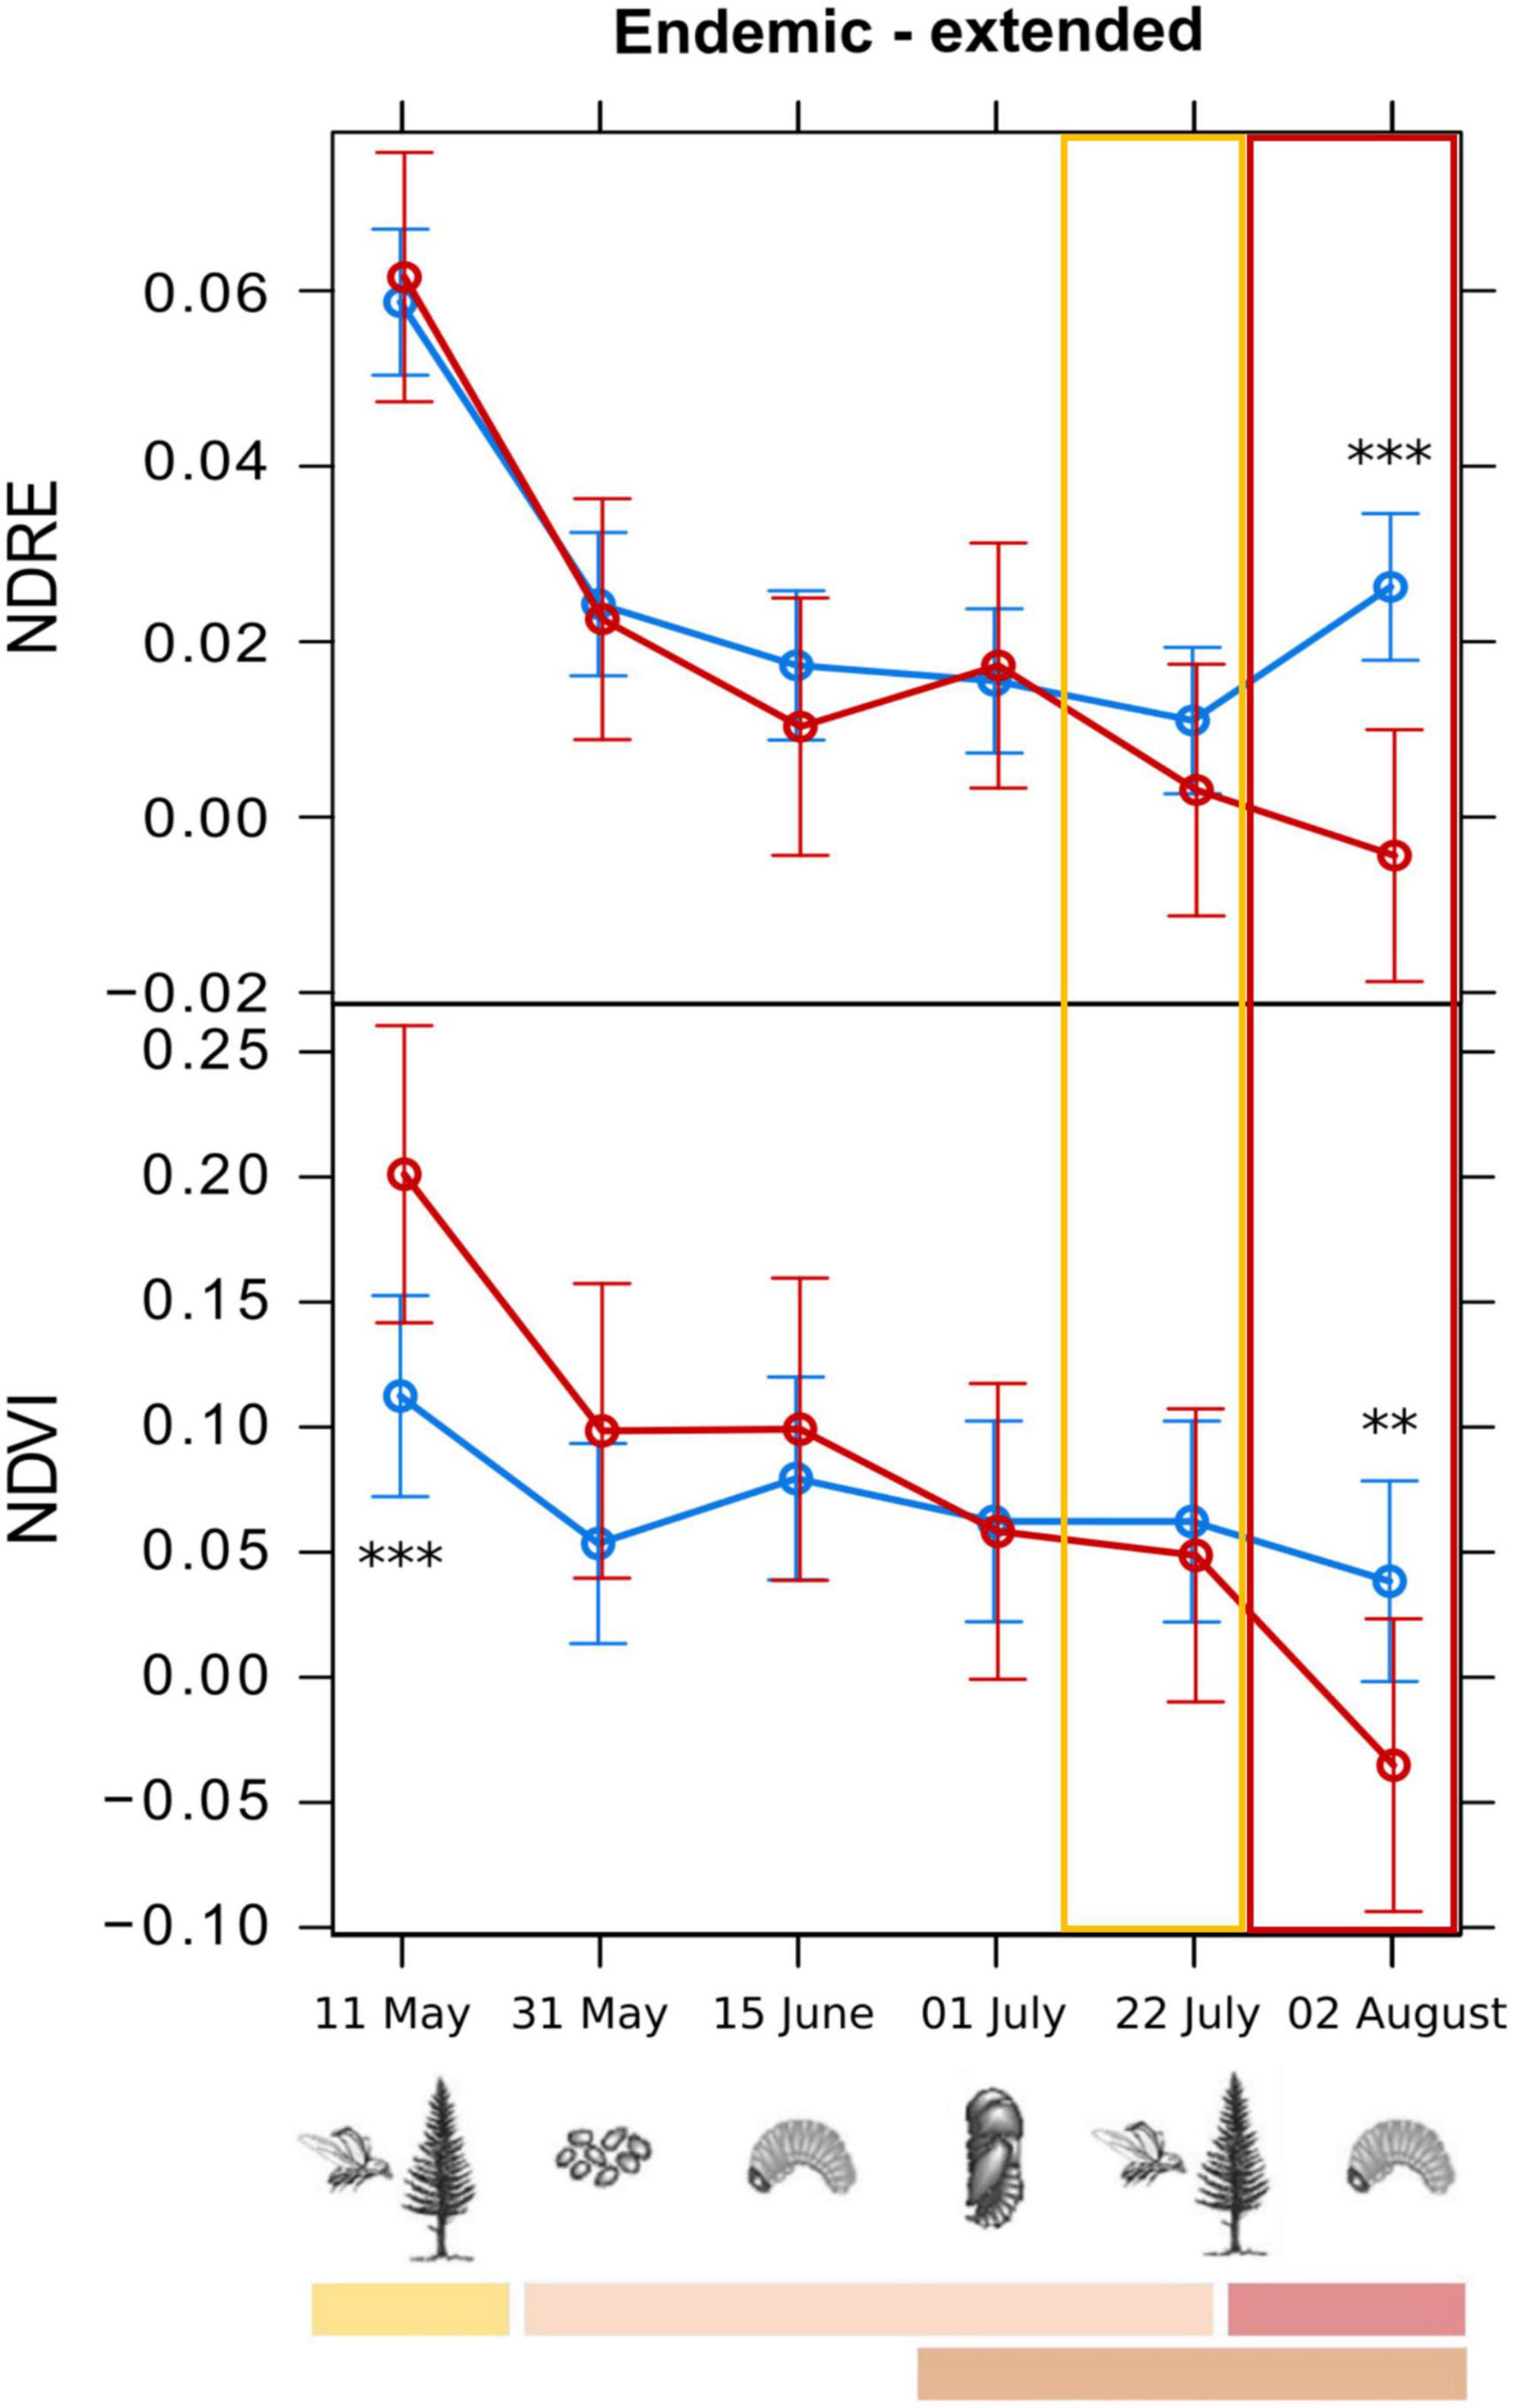
Figure 6. Means from the generalized linear mixed models testing the spectral variation of different vegetation indices across the study period, for infested (red) and healthy (blue) trees for the endemic sites. The “Endemic-extended” group refers to results on the extended dataset for the endemic sites, with NDVI (Normalized Difference Vegetation Index) and NDRE (Normalized Difference Red-Edge Index) indices. Early detection was not possible for the endemic sites. For every graph, the features refer to the legend of Figure 5. Symbols in the legend are modified by Biedermann et al. (2019). Statistical significance refers to p-values from Type II Wald χ2 test with 5 degrees of freedom. p-Values (corrected using Tukey test): **0.01–0.001; ***<0.001.
In this study, revisiting high-resolution UAV multispectral imagery allowed early-symptom detectability in endemic versus epidemic bark beetle populations to be assessed. Early detection was successful in the epidemic sites, where infested trees were identified 1–2 months prior to symptoms emergence, according to the VIs adopted. Differently, in the endemic sites, with a low population density, early detection of infested trees was not possible.
The hypothesis that the variability in the symptoms occurrence and detectability depends mainly on population abundance rather than other environmental factors is supported by meteorological data. In epidemic sites (where the symptoms occurred more frequently and severely) the average temperature was lower than in the endemic sites, and precipitation were higher, in both the year of the study and in the previous one. These features should lead to less stressed trees, with more favorable effects on the hosts and a later appearance of the colonization signs (Jakuš et al., 2011; Majdák et al., 2021; Marvasti-Zadeh et al., 2022; Müller et al., 2022), but the symptoms of infestation were not affected and they occurred clearly and quickly against what could be predicted with meteorological data. The effect of population density could also have been enhanced by the tree growth features. Boone et al. (2011) observed that larger trees are preferred by the beetles, but they are also better defended (higher constitutive and induced resin flow and higher induced monoterpenes). They therefore hypothesized there would be higher rates of abandonment of the beetles on large-diameter trees in endemic conditions rather than epidemic conditions. The variations in symptoms occurrence and development during the study period could therefore be explained by different levels of colonization in the two types of sites, where the generally larger trees in the endemic sites could have determined a lower colonization rate than in the epidemic sites.
As for the VIs reliability and the timing of early detection, our results are in accordance with previous studies that employed a temporal series of UAV imagery (Klouček et al., 2019; Honkavaara et al., 2020; Bijou et al., 2023; Huo et al., 2023), as the detectability of the infested trees grew during the study period toward the last survey date. In particular, at the end of the survey period the extended dataset (total of 202 infested and 540 healthy trees) provided significant results in both endemic and epidemic sites, while the experimental dataset (50 infested and 45 healthy trees) provided significant results only for the epidemic sites. Different datasets also produced differences in the VIs performance for the detection in epidemic sites. NDRE, GNDVI, and MR_mDSWI2 performed better using the experimental dataset, similarly to the results of Huo et al. (2023), who obtained the best detection rates using NDRE2 (Normalized Difference Red-Edge Index 2) and MR_DSWI2 (Multiple Ratio Disease–Water Stress Index 2). These authors followed an approach similar to this study, inducing attacks on samples of trees and following the development of the infestation over time using UAV multispectral images. As explained before, it was not possible to assess the same indices as Huo et al. (2023) due to differences in the sensors used, but the indices we used were adapted to be as similar as possible to those used by Huo et al. (2023).
Normalized Difference Red Edge index, GNDVI, and MR_mDSWI2 allowed an early detection of 1 month before symptom’s occurrence in the epidemic sites of all infested trees (first spectral detection of infestation on 1st of July, corresponding to first generation beetles’ emergence and sister brood larvae development), i.e., 4 weeks after complete oviposition and about 7 weeks after the beetles’ bark colonization. In northern Europe, Huo et al. (2023) found similar results, as in the first 5 weeks of bark infestation they detected only 15% of infested trees, while they detected 90% only after 10 weeks of infestation. However, at lower latitudes this timing could be too late for an early-detection because offspring swarming occurs earlier according to the warmer temperature.
When using the extended dataset, the best performing VIs in the epidemic sites were NDVI and SAVI, which provided a significant difference between infested and healthy trees on 31st of May (2 months before the symptoms occurrence, during development of the first generation), i.e., 3 weeks after colonization. This difference from the Huo et al. (2023) study could be due to the lower latitude and higher temperatures of our sites, which could lead to a quicker appearance and development of infestation symptoms on the tree crowns compared to the Swedish context. We obtained distinction between infested and healthy trees earlier than Bijou et al. (2023), who obtained accurate infestation detection only at the end of summer (between end of July and beginning of August) in the Czech Republic. In the endemic sites NDVI and NDRE performed better than the other VIs when using the extended dataset, but only for detection of the infestation on the last survey date (in accordance with Bijou et al., 2023), when the symptoms became visible (red crown) and the first generation beetles’ left the hosts. This could be due to the highly unbalanced sample of the infested trees (42 trees that manifested infestation symptoms) compared to the healthy trees (291), which could have led to misinterpretation between healthy and infested pixels in those sites, due to lack of information related to the infested trees. In this case, the consideration of the VIs values of the whole tree crown could be taken into account, to compensate for the small number of infested trees with a large sample of pixels per tree crown. In some cases, a significant but reversed difference between infested and healthy trees’ VIs values was obtained on the first survey date (11th of May). This could be due to some anomalies in the reflectance of the images for that date. Since the spectral behavior of the tree crowns was consistent for the infested and healthy trees on the later survey dates, i.e., after the colonization and oviposition (which are the phases that determine the trees’ weakening), we considered the results after 11th of May reliable. Beyond that, we conducted a power analysis for each model, both for experimental and extended datasets. Notably, the power analysis consistently yielded values close to 100% in both cases. This observation is attributed to the high levels of statistical significance achieved across our analyses. While it is acknowledged that power analyses ideally should be conducted a priori, the consistently high significance levels in our results underscore the robustness of the observed effects. Nevertheless, future research may benefit from pre-planned power analyses to provide additional insights into the adequacy of sample sizes for detecting effects of interest.
Our results suggest that the success of remote sensing-based early detection methods could be affected by the pest population density, decreasing the early detection ability in endemic conditions characterized by low population density. Instead, in the epidemic population sites, using revisiting high-resolution UAV multispectral imagery, we were able to obtain an early detection between 1 and 2 months before symptoms emergence (red phase) using five VIs (NDVI, NDRE, GNDVI, SAVI, and MR_mDSWI2), for which we provided threshold values to discriminate between healthy and infested trees. Another factor that could have influenced the symptoms development and slower emergence is the trees height. In fact, the endemic sites the trees were on average taller (4 m more) than the epidemic sites. Further work should be conducted to investigate the effect of tree size on symptoms development and emergence. These results highlight the need for further investigation on the early-symptoms features and timing of occurrence in trees attacked by different population densities, to improve the early-detection possibility by remote sensing-based approaches. In particular, further research should be conducted to assess the transferability of the detection methods and timing obtained in this work to other contexts and on larger scales, especially in epidemic conditions. This could be done, e.g., by employing airborne sensors or high-resolution satellite imagery. This would allow to assess the possibility to detect early infestation symptoms on larger regions and in other countries, provided that the information about flight activity and the other environmental factors considered in this study are available and considering all the required logistics and economics. Further research should be also conducted to integrate other detection methods to improve infested tree identification in endemic conditions, e.g., integrating spectral with structural data as suggested by Cessna et al. (2021). This would allow to examine the vertical gradient of symptoms development within the tree crown and to compare symptoms development in trees of different age or height, thus overcoming the limitations that spectral data alone could have. The proposed approach could also be further developed to take into account the effects of other environmental factors (e.g., water stress, soil variability, slope, etc.) on the reflectance features of tree crowns, improving the early detection ability. In fact, limitations of the presented study include the lack of information about abiotic variables, such as soil characteristics, and some biotic variables such as the colonisation level on the infested trees. Further studies should consider these factors for a more comprehensive understanding of the infestations symptoms development mechanisms. Lastly, further study should be conducted to assess the possibility to apply the proposed early-detection method to other pests that cause similar symptoms to the tree crowns, i.e., discoloration due to the interruption of the flux of water and nutrients within the tree, or defoliation.
Effective management of forest areas affected by bark beetle outbreaks faces various practical challenges, such as the timely identification of early infestation symptoms, but also the difficulties of felling scattered infested trees or trees in inaccessible areas and transport them out of the forest in time. The proposed remote sensing approach could be employed, possibly together with methods of semiochemical detection in the field, e.g., sniffer dogs as proposed by Johansson et al. (2019) and Vošvrdová et al. (2023), within a more efficient and integrated early detection approach. The latter method would allow a timely location of the recently infested trees, providing their position as valuable ground truth data to be used to validate remote sensed images, while remote detection would allow to detect stressed trees over larger areas. Ultimately, the proposed method could be a valuable tool for the monitoring and identification of outbreaks and areas more at risk, guiding operators in the management of outbreaks expansion and helping to plan more efficient management strategies. It would be also possible to integrate such approach with satellite imagery for a more comprehensive forest monitoring over large areas.
The datasets generated in this study can be found in the Figshare repository: https://figshare.com/s/e298bedb64ced9e090e8 (doi: 10.6084/m9.figshare.25152260).
The manuscript presents research on animals that do not require ethical approval for their study.
ABo: Conceptualization, Data curation, Formal analysis, Investigation, Methodology, Visualization, Writing – original draft, Writing – review & editing. SB: Conceptualization, Data curation, Investigation, Methodology, Software, Writing – review & editing. GM: Investigation, Writing – review & editing. GS: Data curation, Formal analysis, Writing – review & editing. LD: Investigation, Writing – review & editing. VF: Writing – review & editing. ABa: Funding acquisition, Supervision, Writing – review & editing. MF: Funding acquisition, Supervision, Writing – review & editing.
The author(s) declare financial support was received for the research, authorship, and/or publication of this article. This work was carried out within a grant of the Regione del Veneto decree 1691-29/11/2021 and a grant from DAFNAE DOR2344584 UNIPD. The work is framed within the Agritech National Research Center that received funding from the European Union Next-GenerationEU (PIANO NAZIONALE DI RIPRESA E RESILIENZA (PNRR) – MISSIONE 4 COMPONENTE 2, INVESTIMENTO 1.4 – D.D. 1032 17/06/2022, CN00000022). The funders had no role in the design of the study; in the collection, analyses, or interpretation of data; in the writing of the manuscript; or in the decision to publish the results.
We would like to thank the municipalities of Canale d’Agordo and Limana (Belluno, Veneto, Italy) for the cooperation and the concession to carry out the activities within their local jurisdiction, and Veneto Agricoltura for providing the pheromone trap surveillance. We would also like to thank Alison Garside for linguistic proofreading the manuscript.
The authors declare that the research was conducted in the absence of any commercial or financial relationships that could be construed as a potential conflict of interest.
All claims expressed in this article are solely those of the authors and do not necessarily represent those of their affiliated organizations, or those of the publisher, the editors and the reviewers. Any product that may be evaluated in this article, or claim that may be made by its manufacturer, is not guaranteed or endorsed by the publisher.
This manuscript reflects only the authors’ views and opinions, neither the European Union nor the European Commission can be considered responsible for them.
The Supplementary Material for this article can be found online at: https://www.frontiersin.org/articles/10.3389/ffgc.2024.1385687/full#supplementary-material
Abdullah, H., Skidmore, A. K., Darvishzadeh, R., and Heurich, M. (2018). Sentinel-2 accurately maps green-attack stage of European spruce bark beetle (Ips typographus. L.) compared with Landsat-8. Remote Sens. Ecol. Conserv. 5, 87–106. doi: 10.1002/rse2.93
Abdullah, H., Skidmore, A. K., Darvishzadeh, R., and Heurich, M. (2019). Timing of red-edge and shortwave infrared reflectance critical for early stress detection induced by bark beetle (Ips typographus, L.) attack. Int. J. Appl. Earth Obs. Geoinf. 82:101900. doi: 10.1016/J.JAG.2019.101900
Anderegg, W. R. L., Hicke, J. A., Fisher, R. A., Allen, C. D., Aukema, J., Bentz, B., et al. (2015). Tree mortality from drought, insects, and their interactions in a changing climate. New Phytol. 208, 674–683. doi: 10.1111/NPH.13477
Bárta, V., Hanuš, J., Dobrovolný, L., and Homolová, L. (2022). Comparison of field survey and remote sensing techniques for detection of bark beetle-infested trees. For. Ecol. Manag. 506:119984. doi: 10.1016/j.foreco.2021.119984
Bárta, V., Lukeš, P., and Homolová, L. (2021). Early detection of bark beetle infestation in Norway spruce forests of Central Europe using Sentinel-2. Int. J. Appl. Earth Obs. Geoinf. 100:102335. doi: 10.1016/j.jag.2021.102335
Bates, D., Maechler, M., Bolker, B., and Walker, S. (2021). Linear mixed-effects models using ‘Eigen’ and S4. R package ‘lme4’, version 1.1-27.1.
Biedermann, P. H. W., Müller, J., Grégoire, J. C., Gruppe, A., Hagge, J., Hammerbacher, A., et al. (2019). Bark beetle population dynamics in the anthropocene: Challenges and solutions. Trends Ecol. Evol. 34, 914–924. doi: 10.1016/j.tree.2019.06.002
Bijou, S., Kupková, L., Potůčková, M., Červená, L., and Lysák, J. (2023). Evaluation of the bark beetle green attack detectability in spruce forest from multitemporal multispectral UAV imagery. ISPRS Ann. Photogramm. Remote Sens. Spat. Inf. Sci. 2023, 1033–1040. doi: 10.5194/isprs-annals-X-1-W1-2023-1033-2023
Blasi, C., Capotorti, G., Copiz, R., Guida, D., Mollo, B., Smiraglia, D., et al. (2014). Classification and mapping of the ecoregions of Italy. Plant Biosyst. 148, 1255–1345. doi: 10.1080/11263504.2014.985756/SUPPL_FILE/TPLB_A_985756_SM6270.JPG
Boone, C. K., Aukema, B. H., Bohlmann, J., Carroll, A. L., and Raffa, K. F. (2011). Efficacy of tree defense physiology varies with bark beetle population density: A basis for positive feedback in eruptive species. Can. J. For. Res. 41, 1174–1188. doi: 10.1139/X11-041/SUPPL_FILE/X11-041SUPPLB.DOC
Bozzini, A., Francini, S., Chirici, G., Battisti, A., and Faccoli, M. (2023). Spruce bark beetle outbreak prediction through automatic classification of Sentinel-2 imagery. Forests 14:1116. doi: 10.3390/f14061116
Candotti, A., De Giglio, M., Dubbini, M., and Tomelleri, E. (2022). A Sentinel-2 based multi-temporal monitoring framework for wind and bark beetle detection and damage mapping. Remote Sens. 14:6105. doi: 10.3390/RS14236105
Cessna, J., Alonzo, M. G., Foster, A. C., and Cook, B. D. (2021). Mapping boreal forest spruce beetle health status at the individual crown scale using fused spectral and structural data. Forests 12:1145. doi: 10.3390/F12091145
Dalponte, M., Cetto, R., Marinelli, D., Andreatta, D., Salvadori, C., Pirotti, F., et al. (2023). Spectral separability of bark beetle infestation stages: A single-tree time-series analysis using Planet imagery. Ecol. Indic. 153:110349. doi: 10.1016/j.ecolind.2023.110349
Dalponte, M., Marzini, S., Solano-Correa, Y. T., Tonon, G., Vescovo, L., and Gianelle, D. (2020). Mapping forest windthrows using high spatial resolution multispectral satellite images. Int. J. Appl. Earth Obs. Geoinf. 93:102206. doi: 10.1016/j.jag.2020.102206
Faccoli, M., and Bernardinelli, I. (2014). Composition and elevation of spruce forests affect susceptibility to bark beetle attacks: Implications for forest management. Forests 5, 88–102. doi: 10.3390/f5010088
Faccoli, M., and Stergulc, F. (2004). Ips typographus (L.) pheromone trapping in south Alps: Spring catches determine damage thresholds. J. Appl. Entomol. 128, 307–311. doi: 10.1111/j.1439-0418.2004.00848.x
Faccoli, M., and Stergulc, F. (2006). A practical method for predicting the short-time trend of bivoltine populations of Ips typographus (L.) (Col., Scolytidae). J. Appl. Entomol. 130, 61–66. doi: 10.1111/j.1439-0418.2005.01019.x
Faccoli, M., Finozzi, V., Andriolo, A., Bernardinelli, I., Salvadori, C., Deganutti, L., et al. (2022). Il bostrico tipografo sulle Alpi orientali – Evoluzione, gestione e prospettive future dopo Vaia. Sherwood 257, 23–26.
Fassnacht, F. E., Latifi, H., Ghosh, A., Joshi, P. K., and Koch, B. (2014). Assessing the potential of hyperspectral imagery to map bark beetle-induced tree mortality. Remote Sens. Environ. 140, 533–548. doi: 10.1016/j.rse.2013.09.014
Fernandez-Carrillo, A., Patočka, Z., Dobrovolný, L., Franco-Nieto, A., and Revilla-Romero, B. (2020). Monitoring bark beetle forest damage in central Europe. A remote sensing approach validated with field data. Remote Sens. 12:3634. doi: 10.3390/rs12213634
Fischer, E. M., and Knutti, R. (2015). Anthropogenic contribution to global occurrence of heavy-precipitation and high-temperature extremes. Nat. Clim. Change 5, 560–564. doi: 10.1038/nclimate2617
Gomez, D. F., Ritger, H. M. W., Pearce, C., Eickwort, J., and Hulcr, J. (2020). Ability of remote sensing systems to detect bark beetle spots in the southeastern US. Forests 11, 1–10. doi: 10.3390/f11111167
Green, P., and MacLeod, C. J. (2023). Power analysis for generalised linear mixed models by simulation. R package ‘simr’, version 1.0.7. RRID:SCR_019287
Hartig, F. (2022). Residual diagnostics for hierarchical (multi-level/mixed) regression models. R package ‘DHARMa’, version 0.4.6. RRID:SCR_022136
Hellwig, F. M., Stelmaszczuk-Górska, M. A., Dubois, C., Wolsza, M., Truckenbrodt, S. C., Sagichewski, H., et al. (2021). Mapping European spruce bark beetle infestation at its early phase using gyrocopter-mounted hyperspectral data and field measurements. Remote Sens. 13:4659. doi: 10.3390/RS13224659
Honkavaara, E., Näsi, R., Oliveira, R., Viljanen, N., Suomalainen, J., Khoramshahi, E., et al. (2020). Using multitemporal hyper- and multispectral UAV imaging for detecting bark beetle infestation on Norway spruce. Int. Arch. Photogramm. Remote Sens. Spat. Inf. Sci. 2, 429–434. doi: 10.5194/isprs-archives-XLIII-B3-2020-429-2020
Huo, L., Lindberg, E., and Persson, H. J. (2020). Normalized projected red and SWIR (NPRS): A new vegetation index for forest health estimation and its application on spruce bark beetle attack detection. Int. Geosci. Remote Sens. Symp. 201, 4618–4621. doi: 10.1109/IGARSS39084.2020.9323611
Huo, L., Lindberg, E., Bohlin, J., and Persson, H. J. (2023). Assessing the detectability of European spruce bark beetle green attack in multispectral drone images with high spatial- and temporal resolutions. Remote Sens. Environ. 287:113484. doi: 10.1016/j.rse.2023.113484
Huo, L., Persson, H. J., and Lindberg, E. (2021). Early detection of forest stress from European spruce bark beetle attack, and a new vegetation index: Normalized distance red & SWIR (NDRS). Remote Sens. Environ. 255:112240. doi: 10.1016/j.rse.2020.112240
Index DataBase [IDB], (2023). Sensor: Sentinel-2A. Available online at: https://www.indexdatabase.de/db/s-single.php?id=96 (accessed April 14, 2023).
Iordache, M. D., Mantas, V., Baltazar, E., Pauly, K., and Lewyckyj, N. (2020). A machine learning approach to detecting pine wilt disease using airborne spectral imagery. Remote Sens. 12:2280. doi: 10.3390/rs12142280
Jakuš, R., Edwards-Jonášová, M., Cudlín, P., Blaženec, M., Ježík, M., Havlček, F., et al. (2011). Characteristics of Norway spruce trees (Picea abies) surviving a spruce bark beetle (Ips typographus L.) outbreak. Trees - Struct. Funct. 25, 965–973. doi: 10.1007/s00468-011-0571-9
Johansson, A., Birgersson, G., and Schlyter, F. (2019). Using synthetic semiochemicals to train canines to detect bark beetle–infested trees. Ann. For. Sci. 76:58. doi: 10.1007/s13595-019-0841-z
Kautz, M., Peter, F. J., Harms, L., Kammen, S., and Delb, H. (2023). Patterns, drivers and detectability of infestation symptoms following attacks by the European spruce bark beetle. J. Pest Sci. 96, 403–414. doi: 10.1007/s10340-022-01490-8
Klouček, T., Komárek, J., Surový, P., Hrach, K., Janata, P., and Vašíček, B. (2019). The use of UAV mounted sensors for precise detection of bark beetle infestation. Remote Sens. 11:1561. doi: 10.3390/RS11131561
Le, T. S., Harper, R., and Dell, B. (2023). Application of remote sensing in detecting and monitoring water stress in forests. Remote Sens. 15:3360. doi: 10.3390/RS15133360
Lenth, R. V. (2022). Estimated marginal means, aka least-squares means. R package ‘emmeans’, version 1.8.3. RRID:SCR_018734
Luo, Y., Huang, H., and Roques, A. (2022). Early monitoring of forest wood-boring pests with remote sensing. Annu. Rev. of Entomol. 68, 277–298. doi: 10.1146/annurev-ento-120220
Majdák, A., Jakuš, R., and Blaženec, M. (2021). Determination of differences in temperature regimes on healthy and bark-beetle colonised spruce trees using a handheld thermal camera. iForest Biogeosci. For. 14:203. doi: 10.3832/IFOR3531-014
Mandl, L., and Lang, S. (2023). Uncovering early traces of bark beetle induced forest stress via semantically enriched sentinel-2 data and spectral indices. J. Photogramm. Remote Sens. Geoinf. Sci. 91, 211–231. doi: 10.1007/S41064-023-00240-4/FIGURES/12
Marini, L., Ayres, M. P., Battisti, A., and Faccoli, M. (2012). Climate affects severity and altitudinal distribution of outbreaks in an eruptive bark beetle. Clim. Change 115, 327–341. doi: 10.1007/s10584-012-0463-z
Marvasti-Zadeh, S. M., Goodsman, D., Ray, N., and Erbilgin, N. (2022). Early detection of bark beetle attack using remote sensing and machine learning: A review. arXiv [Preprint]. doi: 10.48550/arXiv.2210.03829
Meddens, A. J. H., Hicke, J. A., and Vierling, L. A. (2011). Evaluating the potential of multispectral imagery to map multiple stages of tree mortality. Remote Sens. Environ. 115, 1632–1642. doi: 10.1016/J.RSE.2011.02.018
Mezei, P., Jakuš, R., Pennerstorfer, J., Havašová, M., Škvarenina, J., Ferenčík, J., et al. (2017). Storms, temperature maxima and the Eurasian spruce bark beetle Ips typographus – An infernal trio in Norway spruce forests of the central European high Tatra Mountains. Agric. For. Meteorol. 242, 85–95. doi: 10.1016/j.agrformet.2017.04.004
Minařík, R., Langhammer, J., and Lendzioch, T. (2021). Detection of bark beetle disturbance at tree level using UAS multispectral imagery and deep learning. Remote Sens. 13:4768. doi: 10.3390/RS13234768
Müller, M., Olsson, P. O., Eklundh, L., Jamali, S., and Ardö, J. (2022). Features predisposing forest to bark beetle outbreaks and their dynamics during drought. For. Ecol. Manag. 523:120480. doi: 10.1016/J.FORECO.2022.120480
Nakagawa, S., and Cuthill, I. C. (2007). Effect size, confidence interval and statistical significance: A practical guide for biologists. Biol. Rev. 82, 591–605. doi: 10.1111/j.1469-185X.2007.00027.x
Nardi, D., Finozzi, V., and Battisti, A. (2022a). Massive windfalls boost an ongoing spruce bark beetle outbreak in the Southern Alps. Ital. J. For. Mountain Environ. 77, 41–52. doi: 10.36253/ifm-1617
Nardi, D., Jactel, H., Pagot, E., Samalens, J. C., and Marini, L. (2022b). Drought and stand susceptibility to attacks by the European spruce bark beetle: A remote sensing approach. Agric. For. Entomol. 25, 119–129. doi: 10.1111/AFE.12536
Näsi, R., Honkavaara, E., Blomqvist, M., Lyytikäinen-Saarenmaa, P., Hakala, T., Viljanen, N., et al. (2018). Remote sensing of bark beetle damage in urban forests at individual tree level using a novel hyperspectral camera from UAV and aircraft. Urban For. Urban Green. 30, 72–83. doi: 10.1016/J.UFUG.2018.01.010
Näsi, R., Honkavaara, E., Lyytikäinen-Saarenmaa, P., Blomqvist, M., Litkey, P., Hakala, T., et al. (2015). Using UAV-based photogrammetry and hyperspectral imaging for mapping bark beetle damage at tree-level. Remote Sens. 7, 15467–15493. doi: 10.3390/rs71115467
Navarro, A., Catalao, J., and Calvao, J. (2019). Assessing the use of Sentinel-2 time series data for monitoring Cork Oak decline in Portugal. Remote Sens. 11:2515. doi: 10.3390/rs11212515
Otsu, K., Pla, M., Duane, A., Cardil, A., and Brotons, L. (2019). Estimating the threshold of detection on tree crown defoliation using vegetation indices from uas multispectral imagery. Drones 3, 1–23. doi: 10.3390/drones3040080
Puttonen, E., Litkey, P., and Hyyppä, J. (2010). Individual tree species classification by illuminated—shaded area separation. Remote Sens. 2, 19–35. doi: 10.3390/RS2010019
R Core Team (2022). R: A language and environment for statistical computing. Vienna: R Foundation for Statistical Computing.
Trubin, A., Kozhoridze, G., Zabihi, K., Modlinger, R., Singh, V. V., Surový, P., et al. (2023). Detection of susceptible Norway spruce to bark beetle attack using PlanetScope multispectral imagery. Front. For. Glob. Change 6:1130721. doi: 10.3389/FFGC.2023.1130721/BIBTEX
Turkulainen, E., Honkavaara, E., Näsi, R., Oliveira, R. A., Hakala, T., Junttila, S., et al. (2023). Comparison of deep neural networks in the classification of bark beetle-induced spruce damage using UAS images. Remote Sens. 15:4928. doi: 10.3390/RS15204928
Vošvrdová, N., Johansson, A., Turčáni, M., Jakuš, R., Tyšer, D., Schlyter, F., et al. (2023). Dogs trained to recognise a bark beetle pheromone locate recently attacked spruces better than human experts. For. Ecol. Manage. 528:120626. doi: 10.1016/j.foreco.2022.120626
Wermelinger, B. (2004). Ecology and management of the spruce bark beetle Ips typographus – A review of recent research. For. Ecol. Manage. 202, 67–82. doi: 10.1016/j.foreco.2004.07.018
Weslien, J., and Regnander, J. (1990). Colonization densities and offspring production in the bark beetle Ips typographus (L.) in standing spruce trees. J. Appl. Entomol. 109, 358–366. doi: 10.1111/J.1439-0418.1990.TB00064.X
Keywords: Ips typographus, remote sensing, early warning, UAV, early symptoms, epidemic population, endemic population
Citation: Bozzini A, Brugnaro S, Morgante G, Santoiemma G, Deganutti L, Finozzi V, Battisti A and Faccoli M (2024) Drone-based early detection of bark beetle infested spruce trees differs in endemic and epidemic populations. Front. For. Glob. Change 7:1385687. doi: 10.3389/ffgc.2024.1385687
Received: 13 February 2024; Accepted: 27 May 2024;
Published: 11 June 2024.
Edited by:
Sigrid Netherer, University of Natural Resources and Life Sciences, Vienna, AustriaReviewed by:
Palaiologos Palaiologou, Agricultural University of Athens, GreeceCopyright © 2024 Bozzini, Brugnaro, Morgante, Santoiemma, Deganutti, Finozzi, Battisti and Faccoli. This is an open-access article distributed under the terms of the Creative Commons Attribution License (CC BY). The use, distribution or reproduction in other forums is permitted, provided the original author(s) and the copyright owner(s) are credited and that the original publication in this journal is cited, in accordance with accepted academic practice. No use, distribution or reproduction is permitted which does not comply with these terms.
*Correspondence: Aurora Bozzini, YXVyb3JhLmJvenppbmlAcGhkLnVuaXBkLml0
Disclaimer: All claims expressed in this article are solely those of the authors and do not necessarily represent those of their affiliated organizations, or those of the publisher, the editors and the reviewers. Any product that may be evaluated in this article or claim that may be made by its manufacturer is not guaranteed or endorsed by the publisher.
Research integrity at Frontiers
Learn more about the work of our research integrity team to safeguard the quality of each article we publish.