 Jun Lu
 Hao Zhang
- 1Research Institute of Forest Resource Information Techniques, Chinese Academy of Forestry, Beijing, China
- 2Northeast Forestry University, Harbin, China
In recent years, global attention to forest ecological environment, carbon, wood yield, and biodiversity has been increasing, which requires forest managers to make reasonable forest planning in time and space to meet the needs of multi-objectives and multi-resources. In this study, the resources of business units in Northeast China were analyzed, and the FPS-ATLAS model was established. A multi-objective decision supporting spatial forest planning scheme for 16629.53 ha of forest in Jingouling forest farm of Wangqing Forestry Bureau in Jilin Province was proposed. In this paper, the volume growth model of six forest types was established, and the carbon storage model was introduced to show the total carbon, biomass carbon, dissolved organic carbon, and total soil carbon of the ecosystem. The dynamic change in carbon during the whole planning period has achieved good results. After 20 time periods, the total soil carbon increased to 7,627,208 Mg (+6.63%), the total ecosystem carbon increased to 14,889,876 Mg (+27.51%), the biomass carbon increased to 5,362,779 Mg (+59.70%), and the dissolved organic carbon increased to 9,531,906 Mg (+14.59%). The purpose of this article is to achieve dynamic management of forest resources, meet multiple constraint settings, achieve multiple management objectives, harvest wood products, and ensure the ecological and social functions of forests so that forests ultimately achieve the ideal state of sustainability.
1 Introduction
As an important basis of human existence, the forest’s rational management has received more and more attention. As an effective means to solve the complex combination optimization problem, the mathematical optimization method has been successfully applied in forest harvest planning. In the past 100 years, the theory of forest management has been continuously developed, and the important role of forests in sustainable development was fully affirmed at the 1992 United Nations Conference on Environment and Development.
Management decision-making is at the core of forest management, which is conducive to the implementation of efficient ways and methods of sustainable forest management. The development and combination of mathematics and computer science have been successfully applied to forest planning, and the optimal decision for sustainable forest management can be obtained by using the optimization method to establish the model. The logging unit planning problem to maximize wood yield or net present value is a combinatorial optimization problem. The biggest difficulty in solving these problems is that their solution space increases exponentially with the increase in determining variables. With the increase in the scale of the problem, the time of calculation and solution is extended infinitely, which is not easy to achieve. Therefore, many scholars have solved the combinatorial optimization problem of forest harvesting planning by finding suitable algorithms (Dong et al., 2017; Deng et al., 2023). Because forestry has the characteristics of a long-term production cycle, regeneration of forest resources, biological diversity, and diversity of forest benefits, it is necessary not only to carry out short-term pre-felling operation design but also to formulate long-term multi-objective management planning. It is very necessary to develop and use scientific and reasonable multi-objective management decision support software to determine the multi-objective management plan of different forest types and the length of cycle, cutting time, cutting mode, and cutting amount of each forest type in the management cycle.
In recent years, the importance of forest space harvesting plans has been increasing. This is reflected in the awareness of potential energy savings as well as in the development of harvesting and timber transport programs (Boston and Bettinger, 2001). Moreover, attention to spatial information is indispensable when considering the management of riparian or scenic road corridors and the management of vegetation corridors through which wildlife must pass (Weintraub and Bare, 1996). With increasing pressure to meet different ecological and environmental objectives, there are a number of ways we can protect the environment, such as reducing the fragmentation of over-mature forests, maintaining critical habitat margins without logging, establishing corridors between valuable habitats (Ohman, 2001), assessing the economic benefits of different management practices, and examining the spatial patterns and trends of forest ecosystems. In addition, the spatial approach of forest management activities must be integrated into temporal management decisions, which can greatly affect the quantity and quality of other forest resource utilization (Snyder and ReVelle, 1997). Therefore, socio-economic and environmental or ecological goals are distributed over time and space. The measurement, control, and maintenance of landscape patterns require that the harvesting scheme include these important factors. The spatial arrangement of harvesting has become a key factor in forest management planning, and the development direction of forest management models should also pay attention to the role of spatial information (Borges and Hoganson, 1999).
Forest ecosystems are increasingly seen as resources that are managed on a large scale from an ecological, economic, and social perspective. As a result, forest management projects in public land agencies have shifted from a dominant model of sustainable access to forest resources in forested areas to a model focused on maintaining ecosystem sustainability. In some literature it is called “ecosystem management” (Thomas, 1995; Rauscher et al., 2000), on the whole, which requires us to pay attention to the natural classification of forest ecosystems when formulating sustainable forest management strategies (O’Neill et al., 1986; Kangas et al., 2000). Moreover, the multi-resource nature of modern forestry requires managers to assess the potential impact of their operational decisions on forest biodiversity, wood production, carbon storage, re-employment, and other values in a wider area. It is a challenging task to describe the temporal and spatial relationships that exist in these properties the interaction between the absence of data and the natural state (Galindo-Leal and Bunnell, 1995).
With the promotion of overall forest resource-oriented or multi-objective management on a general, in-depth landscape scale, it is necessary to design new decision support systems (DSSs) to adapt to the spatiotemporal complexity of management scheme development and evaluation. Bunnell and Boyland (2002) proposed that DSSs need at least four broad purposes. The ultimate goal of DSS, as stated by Rauscher (1999), “is to empower decision makers without encroaching on their power to use human judgment and make choices.”
DSSs are effective in the development and application of sustainable forest management planning when implemented within an adaptive operating cycle (Walters, 1986; Rauscher, 1999), including in a range of indicators, monitoring systems, and feedback mechanisms for researchers, the forest industry, and the risk-bearing community. At the heart of DSSs is the model or modeling framework, which is designed to interpret the results of different business activities. DSSs are designed to deal with multiple spatial and temporal scales and gradually introduce the framework of hierarchical relational or network models (Li et al., 2000; McGregor Model Forest, 2001; Crowe et al., 2003; Kazana et al., 2003; Lamas and Eriksson, 2003). Hierarchical structures facilitate problem analysis at different planning levels by allowing for increased complexity where appropriate and necessary (Lamas and Eriksson, 2003; Nelson, 2003). Moreover, the modular approach enables DSS to increase adaptability when dealing with specific problems or ecosystem types (Li et al., 2000).
Many forest management problems are related to spatial location, such as the determination of felling sites and felled trees, the selection of biodiversity protection areas, and the spatial allocation of forest species and regeneration trees. Spatial structure analysis (or spatial analysis) is the basis for optimizing management. In recent years, the role of spatial structure analysis in forest management has been given more and more attention, and many indexes, methods, and optimization models of spatial structure analysis have been proposed (Lin and Wiegand, 2021).
Within the framework of forest spatial planning, this study analyzes the ways to achieve multiple goals in forest management, explores multiple solutions to forest spatial planning, and uses the Forest Planning Studio (FPS-ATLAS, UBC, Canada) to conduct a case study on the complex structure of age-different forests in the Jingouling forest farm of the Wangqing Forestry Bureau in Jilin Province. Based on the spatiotemporal analysis of the current management situation, a more reasonable cutting scheme was established, and a variety of space-based constraints related to forest cutting were set up to obtain the optimal solution in each cutting cycle. In FPS, the update of small class data, analysis of stand age and age class, calculation of stand carbon stock, calculation module of felled wood volume, graph browsing of the felling scheme, and prediction of future stand growth and harvest are realized.
2 General situation and method of study site
2.1 Overview of the study area
Jingouling forest farm is located in the east of Wangqing County, Jilin Province, with an east longitude of 130°5'–~130°20' and north latitude of 43°17'–~43°25', 59 km away from the county seat. It is located in the second of the three major tributaries of Wangling River, on the northwest slope of Changbai Mountain, the birthplace of Tumen River. Changbai Mountain is a branch of the Xueling mountain range of Laoyeling in the eastern mountainous area of Jilin Province. It borders Diyingou Forest Farm in the north, Huanggou Forest Farm in the east, Tazigou Forest Farm in the west, and Shajingou Forest Farm in the south. The landform is a low mountainous and hilly area with an altitude of 550–1,100 m. Generally, the positive slope is steeper and the negative slope is gentle, with an average slope of approximately 10 to 25°, and individual sections are above 35°. The general terrain is surrounded by mountains, and the middle of the valley is a flat low hilly basin. It is a monsoon climate, with the lowest temperature in January, the average is approximately minus 32°C, the highest temperature in July is approximately 32°C, and the annual average temperature is approximately 4°C. Early frosts begin in mid-September and late frosts extend to late May of the following year. The annual precipitation is 600–700 mm, mostly in July. The growth period is approximately 120 days. There are more than 500 species of plants in this area.
2.2 The data collection mainly includes
(1) Data of class II survey in 2007; (2) Forest map 2007; (3) Wang Qing Forestry Records (since 1990); and (4) Jingouling forest farm management history and other information (summary data can be seen in Table 1).
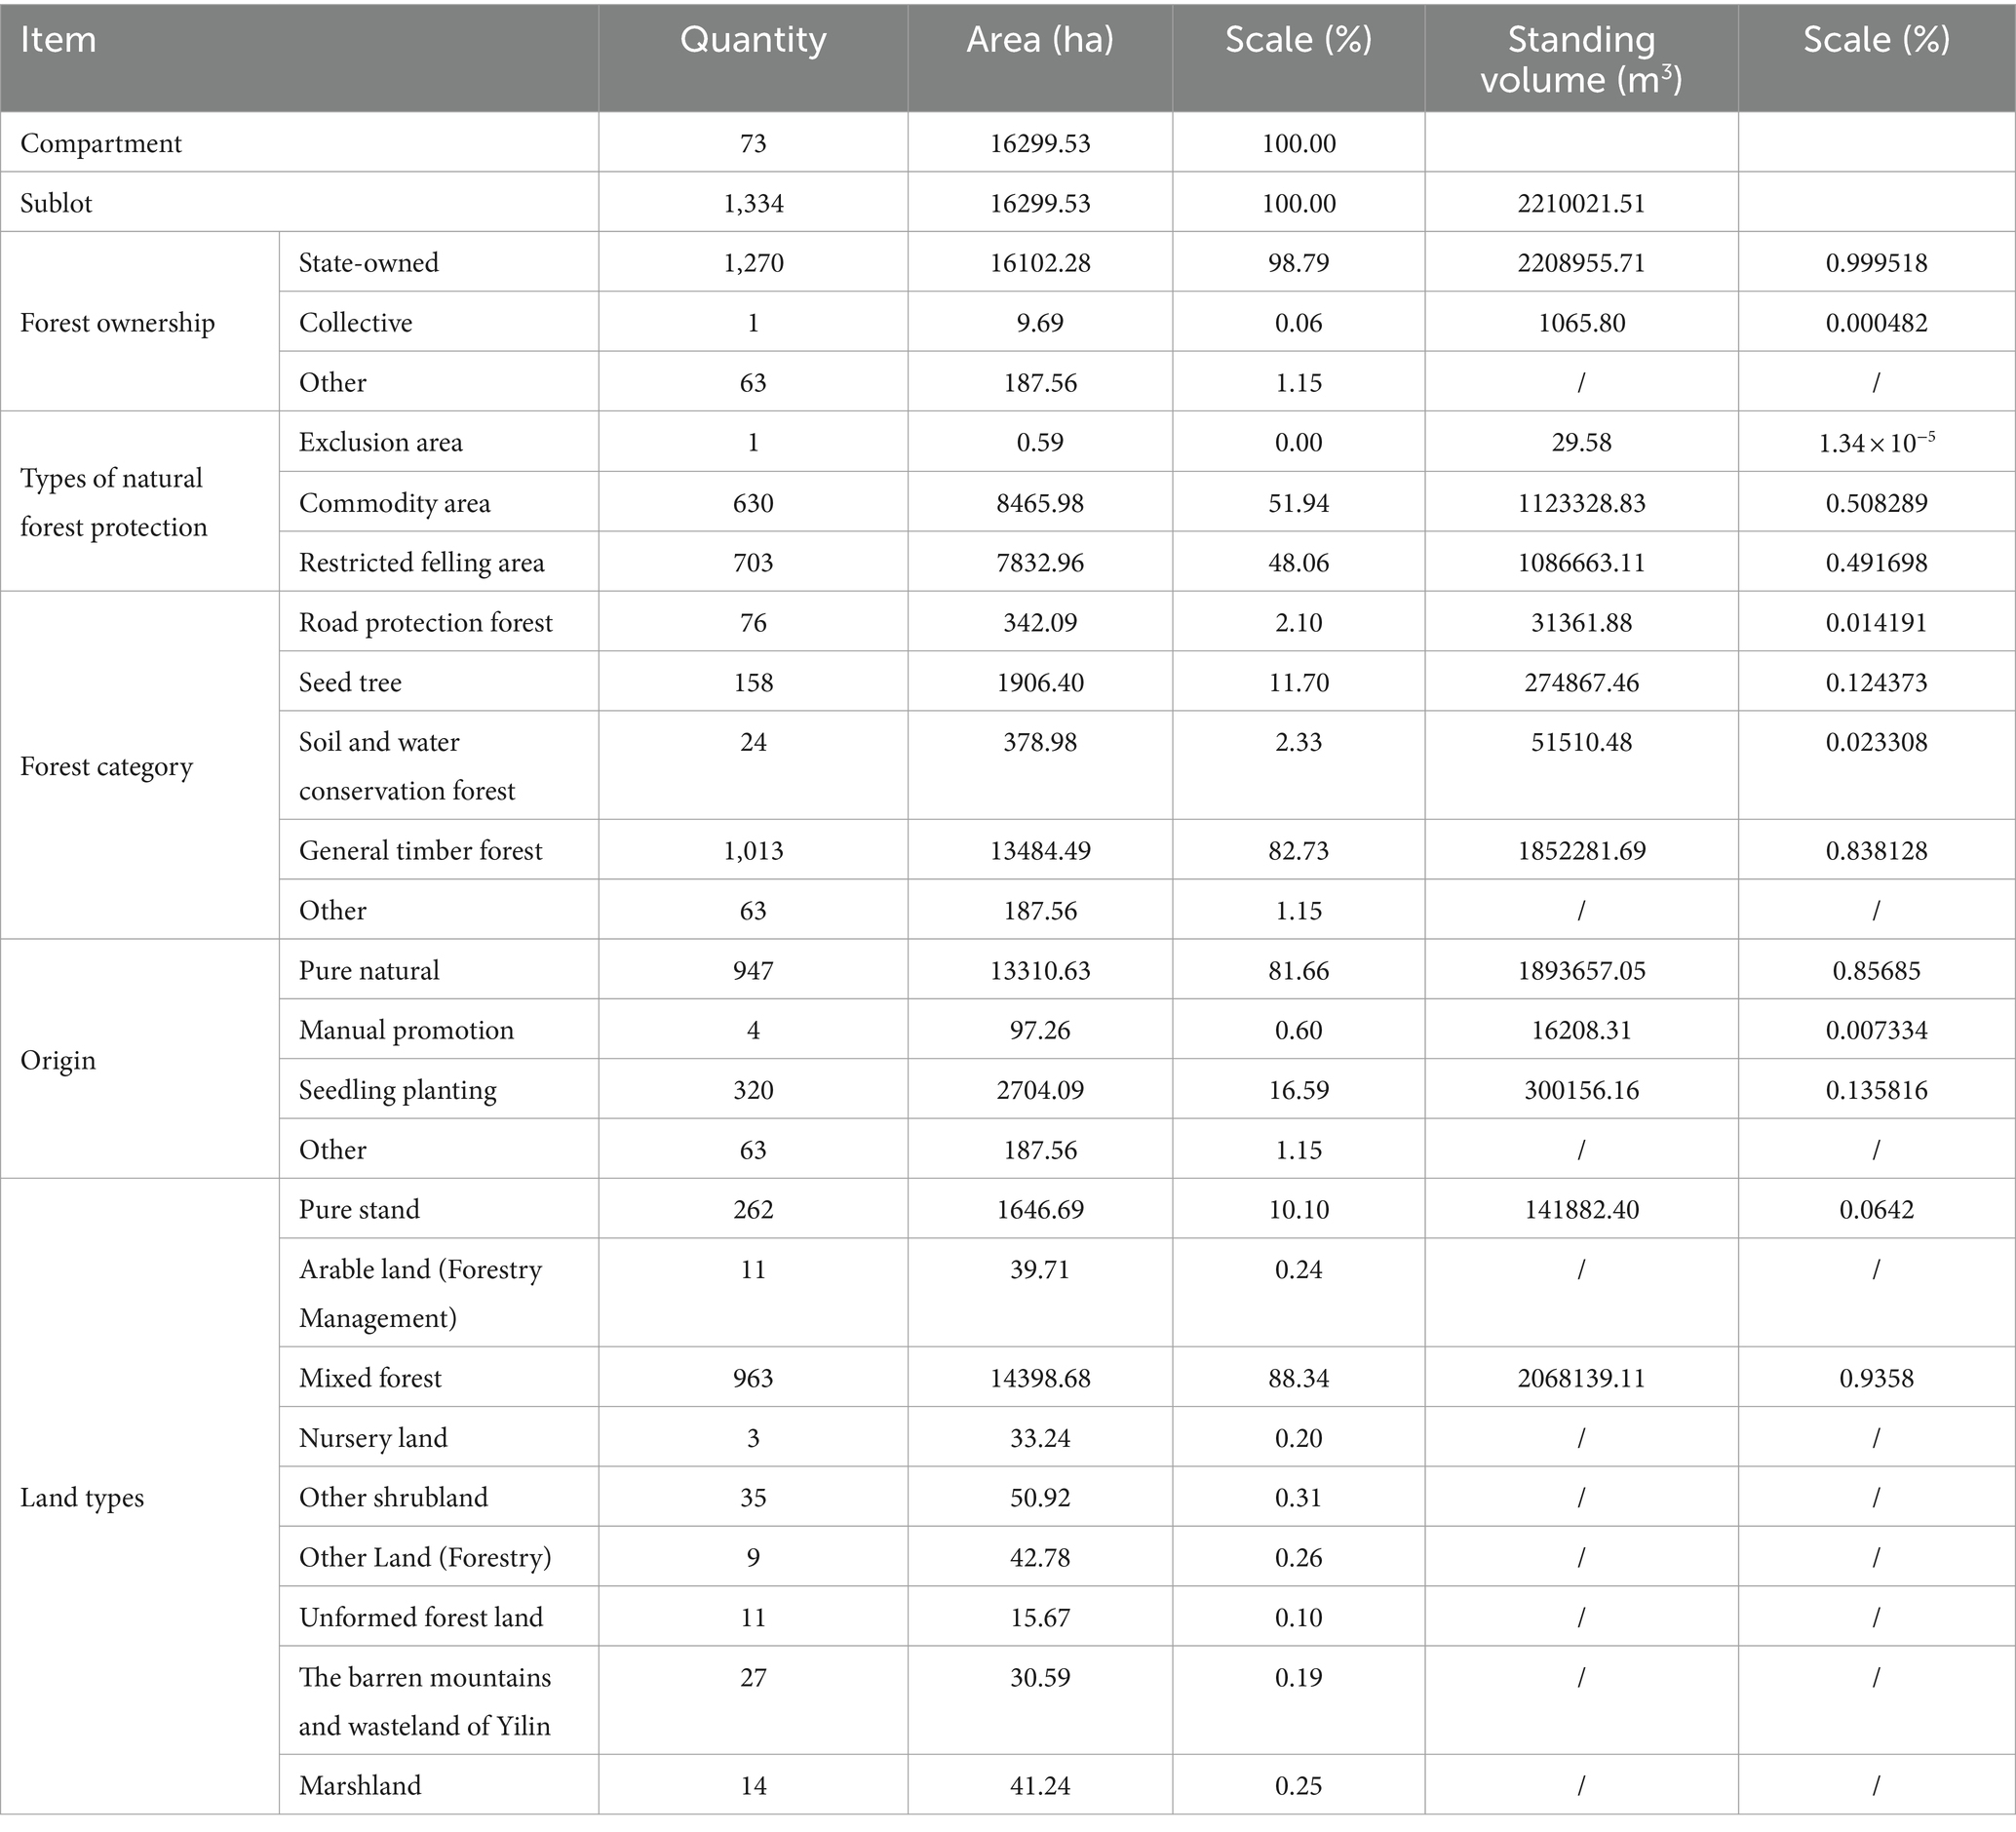
Table 1. Summary of inventory in Jingouling forest farm.
2.3 Division of dominant tree species groups
According to the actual tree species composition in Jingouling forest farm, this study was divided into the following six dominant tree species groups: birch, broadleaved mixed, larix plantation, conifer broadleaved mixed plantation, conifer broadleaved mixed, and conifer mixed plantation.
2.4 Establishment of the accumulation growth model of the dominant tree species group
It is feasible to use the inventory data of secondary forest resources to construct the accumulation growth model of different forest types. Compared with the data of fixed plots, the data of small-class surveys are easy to obtain. The established model of stock growth has reasonable statistical reliability, and the prediction accuracy of other forest types is above 90% except that of natural mixed forest and coniferous mixed forest, which is below 90%. The optimal growth model of each forest type is shown in Table 2.
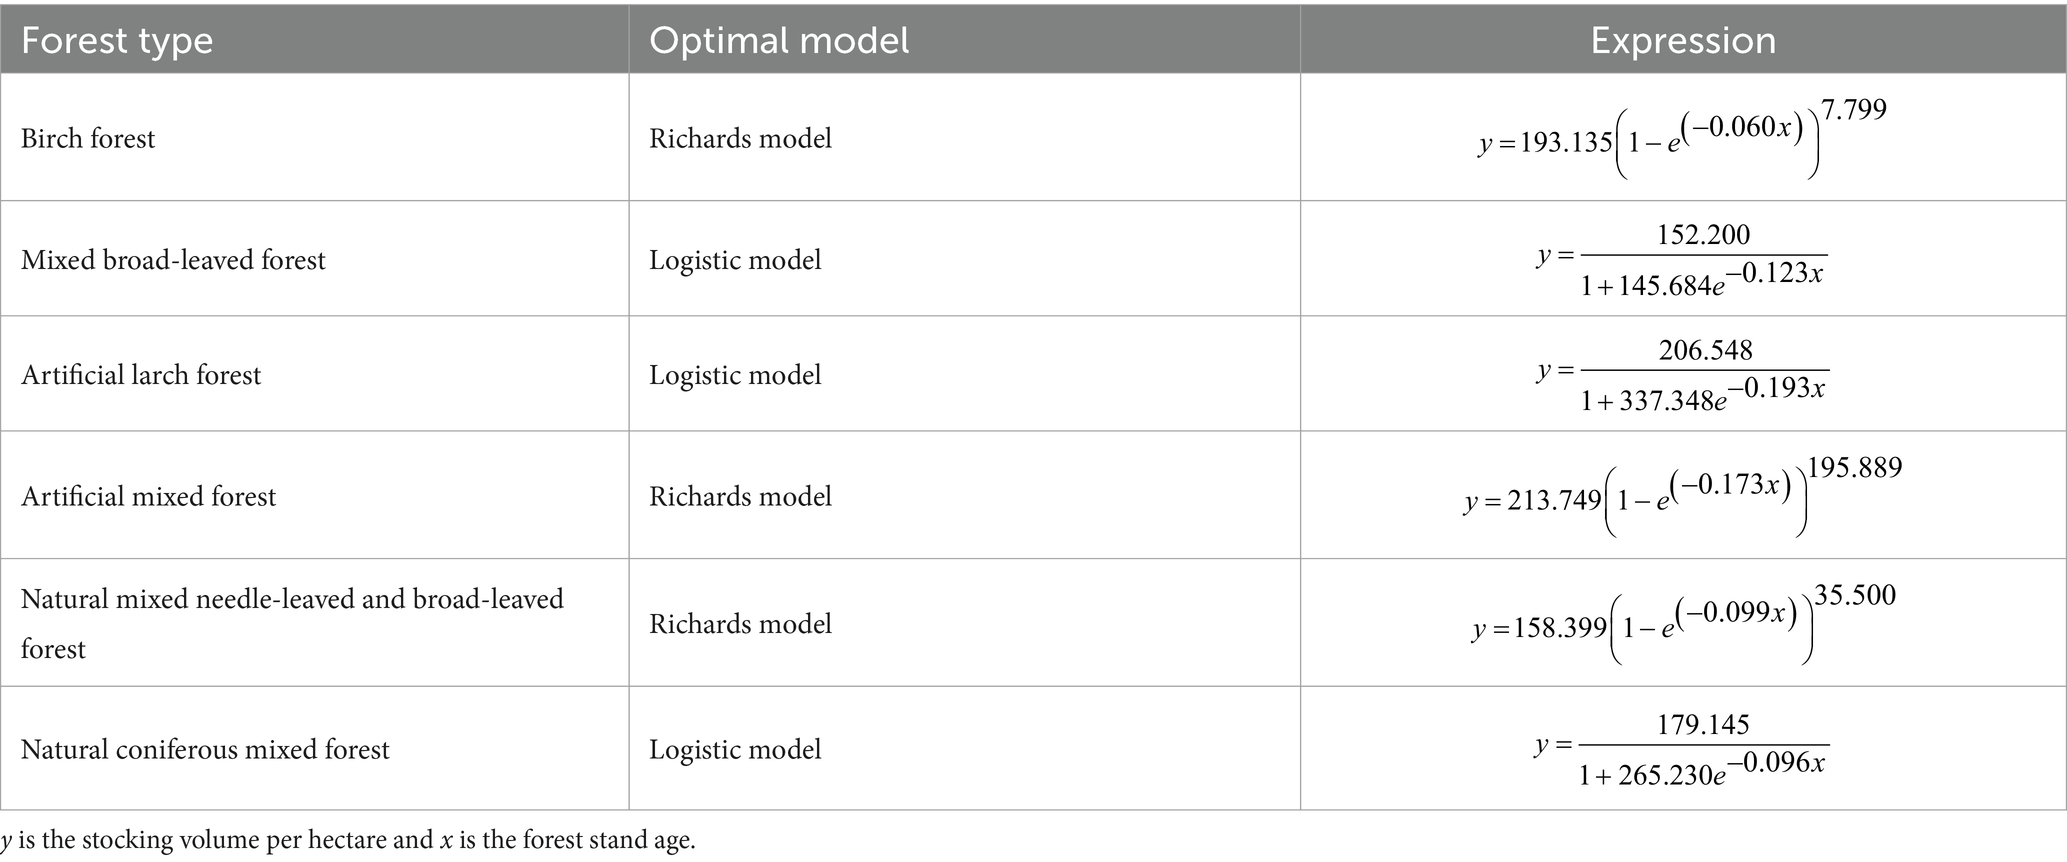
Table 2. Volume growth models of various forest types.
2.5 Establishment of forest multi-objective spatial planning
2.5.1 Objectives of forest spatial planning
The overall objectives of the forest management planning of Jingouling forest farm are as follows: proceeding from reality, following the laws of nature, taking the road of industrial development combining ecological construction, forest cultivation, and development and utilization, constantly improving the level of intensive forest management, realizing the double growth of forest area and storage, and maximizing economic benefits. The tree species composition should be adjusted, the stand structure should be improved, the forest stepped structure should be rationalized, the forest species composition should be optimized, the climax community system unique to Changbai Mountain forest area should be restored as soon as possible, and the ecological, social, and economic benefits of the forest should be brought into full play. To achieve the diversity and sustainable development of forest ecological species, improve the comprehensive output function of forests, establish a relatively complete forestry ecosystem and a relatively developed forestry industry system, and promote the harmonious development of man and nature.
Compared with forest spatial planning, specific targets should be set in terms of stock volume, forest area, carbon storage, ecological succession, cutting volume, and biodiversity conservation.
(1) Storage volume target.
According to the calculation, the current total forest stock of Jingouling Forest Farm is 1,887,750 m3, and it is necessary to ensure the continuous increase of the total stock after planning.
(2) Forest area target.
At present, the forest coverage rate of Jingouling Forest Farm has reached 98.68%, the potential for area increase is very small, and only some potential forestry production land has been transformed into forest land.
(3) Carbon storage target.
Factors used in the carbon storage model include:
Total soil carbon (TSC): the total amount of all carbon components collected in the soil;
Total ecosystem carbon (TEC): the total amount of carbon in which the entire ecosystem participates in the process of energy flow change;
Biomass (biomass carbon-BC): the total amount of carbon contained in organic organisms;
Soil dissolved organic carbon (DOC): it refers to the part of soil carbon that is strongly influenced by plants and microorganisms, has certain solubility, moves relatively fast in the soil, is unstable, easy to oxidize, decompose and mineralize, and has a high activity to plants and microorganisms in its form and spatial position under certain space–time conditions. Where: TEC=BC + DOC.
In this study, six different carbon storage prediction models were established for the forest types of six dominant tree species with ecological functions.
In this study, carbon storage models of six dominant tree species groups were used to analyze the changes in carbon storage during harvesting. According to the calculation, the current carbon storage status of Jingouling forest farm:
Soil total carbon storage: 7152779 Mg;
TEC storage: 11677806 Mg;
BC storage: 3357949 Mg;
Soil soluble carbon storage: 8318589 Mg.
The objective of the operation is to continuously increase the various carbon stocks and to be able to analyze the corresponding carbon increase and decrease for each dominant tree group. The carbon storage curve of the six dominant tree species groups is shown in Figure 1.
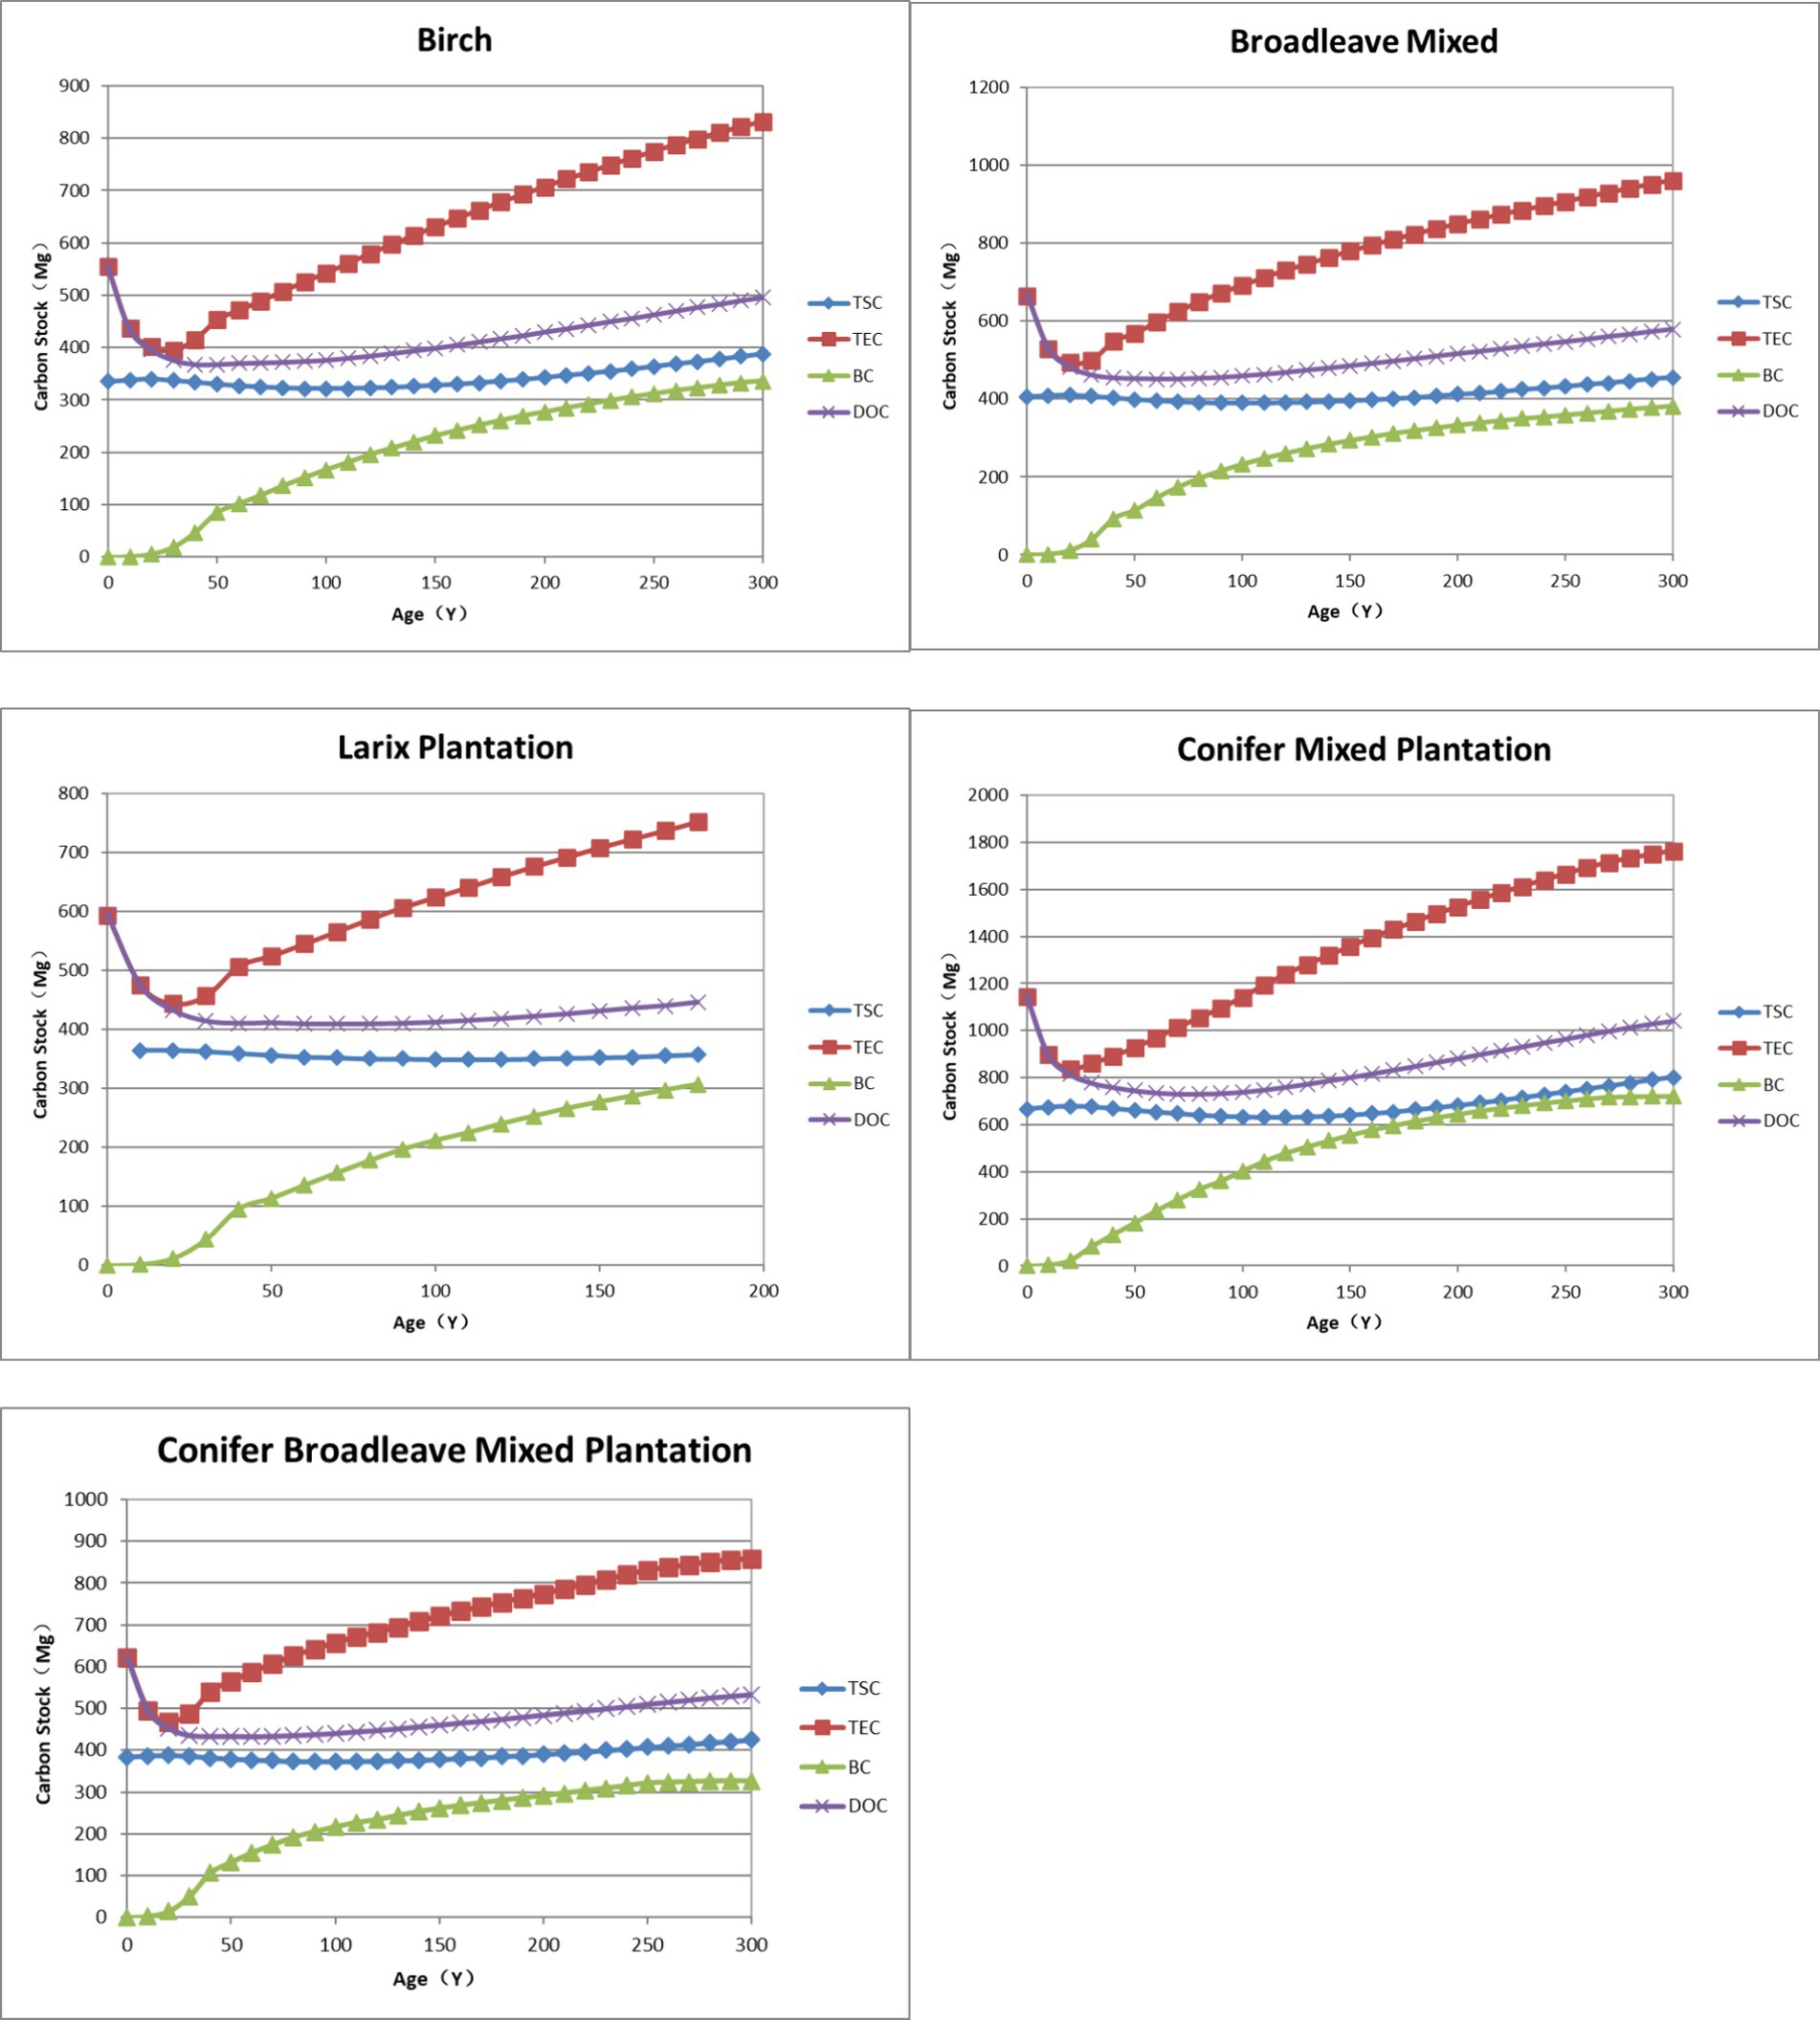
Figure 1. Carbon storage curves of six dominant tree species groups.
(4) Ecological succession objectives.
The unique ecological succession community in the Changbai Mountain area is a broad-leaved red pine forest. In the planning process, the mixed forest should be protected, and the natural regeneration ability should be protected based on promoting artificial regeneration. The natural regeneration ability of the birch forest is very strong, and the growth rate of birch as a pioneer tree is also very fast in a strong positive environment. Therefore, the dominant tree group of birch is dominated by natural regeneration, and birch is still the main tree species during the succession process. However, due to the difference in real stand conditions, the succession of birch is varied, and the direction of succession is uncertain. For the mixed broad-leaved forest, according to the regeneration status of the forest, the conifer seedlings are replanted, or the needle width is planted to protect some precious broad-leaved tree species, such as manchurian ash, and finally the mixed broad-leaved forest is replaced by the mixed conifer-broad. The management of larch is to maintain the status of plantation management. The succession direction of the natural mixed coniferous forest is artificial mixed coniferous forest due to human interference (cutting and skidding).
(5) Cutting quantity target.
The amount of cutting is determined by a variety of factors. First, according to the regulations of the State Forestry Administration, the total amount is determined by the quota. Second, to ensure economic and social benefits and maintain the stable succession of the ecosystem, the amount of harvesting must also be maintained in a certain proportion.
(6) Biodiversity conservation objectives.
This study set the age restriction of the canopy, no-logging area, and riverbank corridor to protect biodiversity.
2.5.2 Constraints enforced by FPS
According to the functions of FPS software, the following spatial and non-spatial constraints are mainly set:
No Harvest: If checked, logging is not allowed. In order to give full play to their ecological functions, non-commercial forest zones such as farmland shelter belts, road protection forests, and water conservation forests shall be prohibited from logging. There are many small rivers in the Jingouling Forest area, on both sides of the river and at the junction of the river, there are generally slender small classes, which can be treated as corridors to protect wildlife, and these riparian forests are also prohibited from logging.
Green Up Age: Used to set the canopy/adjacency constraint (year). For example, if the age of the forest is 20 years, the adjacent polygons will not be harvested until this polygon is 20 years old.
Early Seral: The upper age limit of early ecological succession and the maximum area percentage allowed for early succession were set. Min Harvest (m3): no logging until minimum logging stock is available (avoid thinning an area when 1 or 2 polygons can be felled). This constraint applies only to zones, access units, and regions.
Mature Seral\Late Seral\Old Seral: Set the minimum age of the succession stage and the minimum percentage of area in this succession stage. The succession stage includes all stands that are older than the specified minimum age. In the constraints set window, additional succession stage (age level) constraints can be added with Cover 1, 2, and 3 boxes. If all three coverage boxes are activated in all three labels, there are nine successional phase constraints.
Percent of Block Reserved: Set the percentage of retention blocks equivalent to the wildlife habitat tree. At felling time, the % is deducted from the polygon area when calculating the removal stock.
Closure age and adjacency constraint.
To apply the canopy age constraint, two assumptions are required:
Re-plant the operating units (polygons, small classes, etc.) immediately after logging;
The operating unit shall be felled at most once in a planning cycle;
According to the American Forest and Paper Association (2001), the definition of canopy closure age is the age at which the forest reaches 100% crown closure and interference from adjacent stand-around competition. In general, the trees planted in the harvested stand are not cut in the adjacent stand until they are 3 years old or 5 feet tall. Setting reasonable closing age and adjacent constraints can better promote the growth of new stands, which is of great practical significance to the management of plantations. The closing age was set for each dominant tree group, as shown in Table 3. This value is only empirical and has no experimental basis.
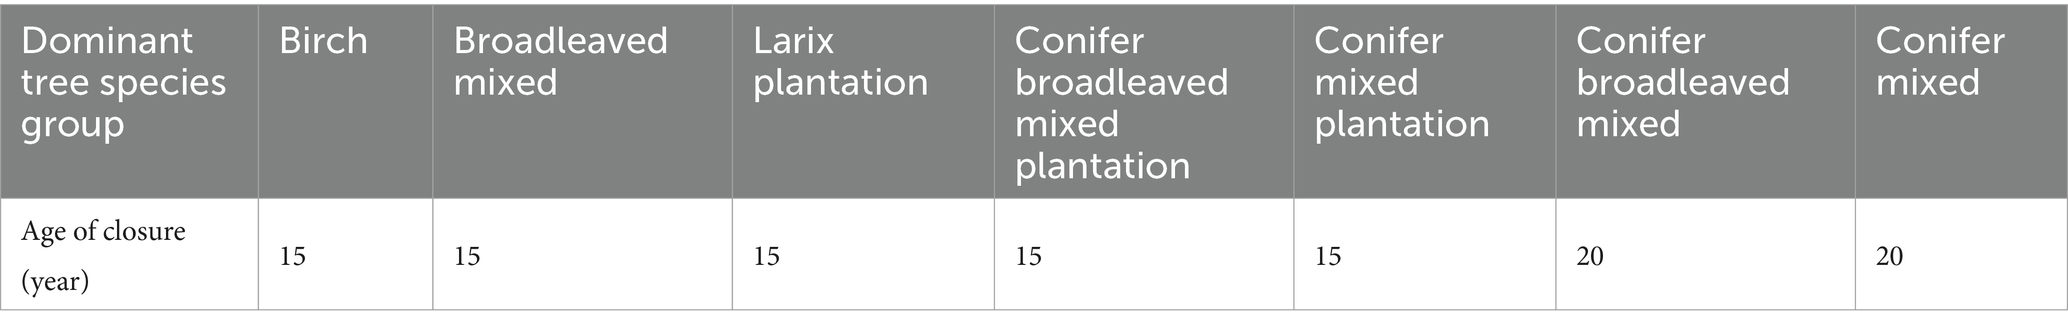
Table 3. Green up age of stand groups.
2.6 Adjustment of cutting mode, intensity, and growth curve
Different age groups and different tree species groups should adopt different cutting intensities for management. However, there are no precise regulations to follow for the standard of cutting intensity, which is generally formulated according to local production experience. The cutting intensity and methods of the dominant tree species groups are shown in Table 4.
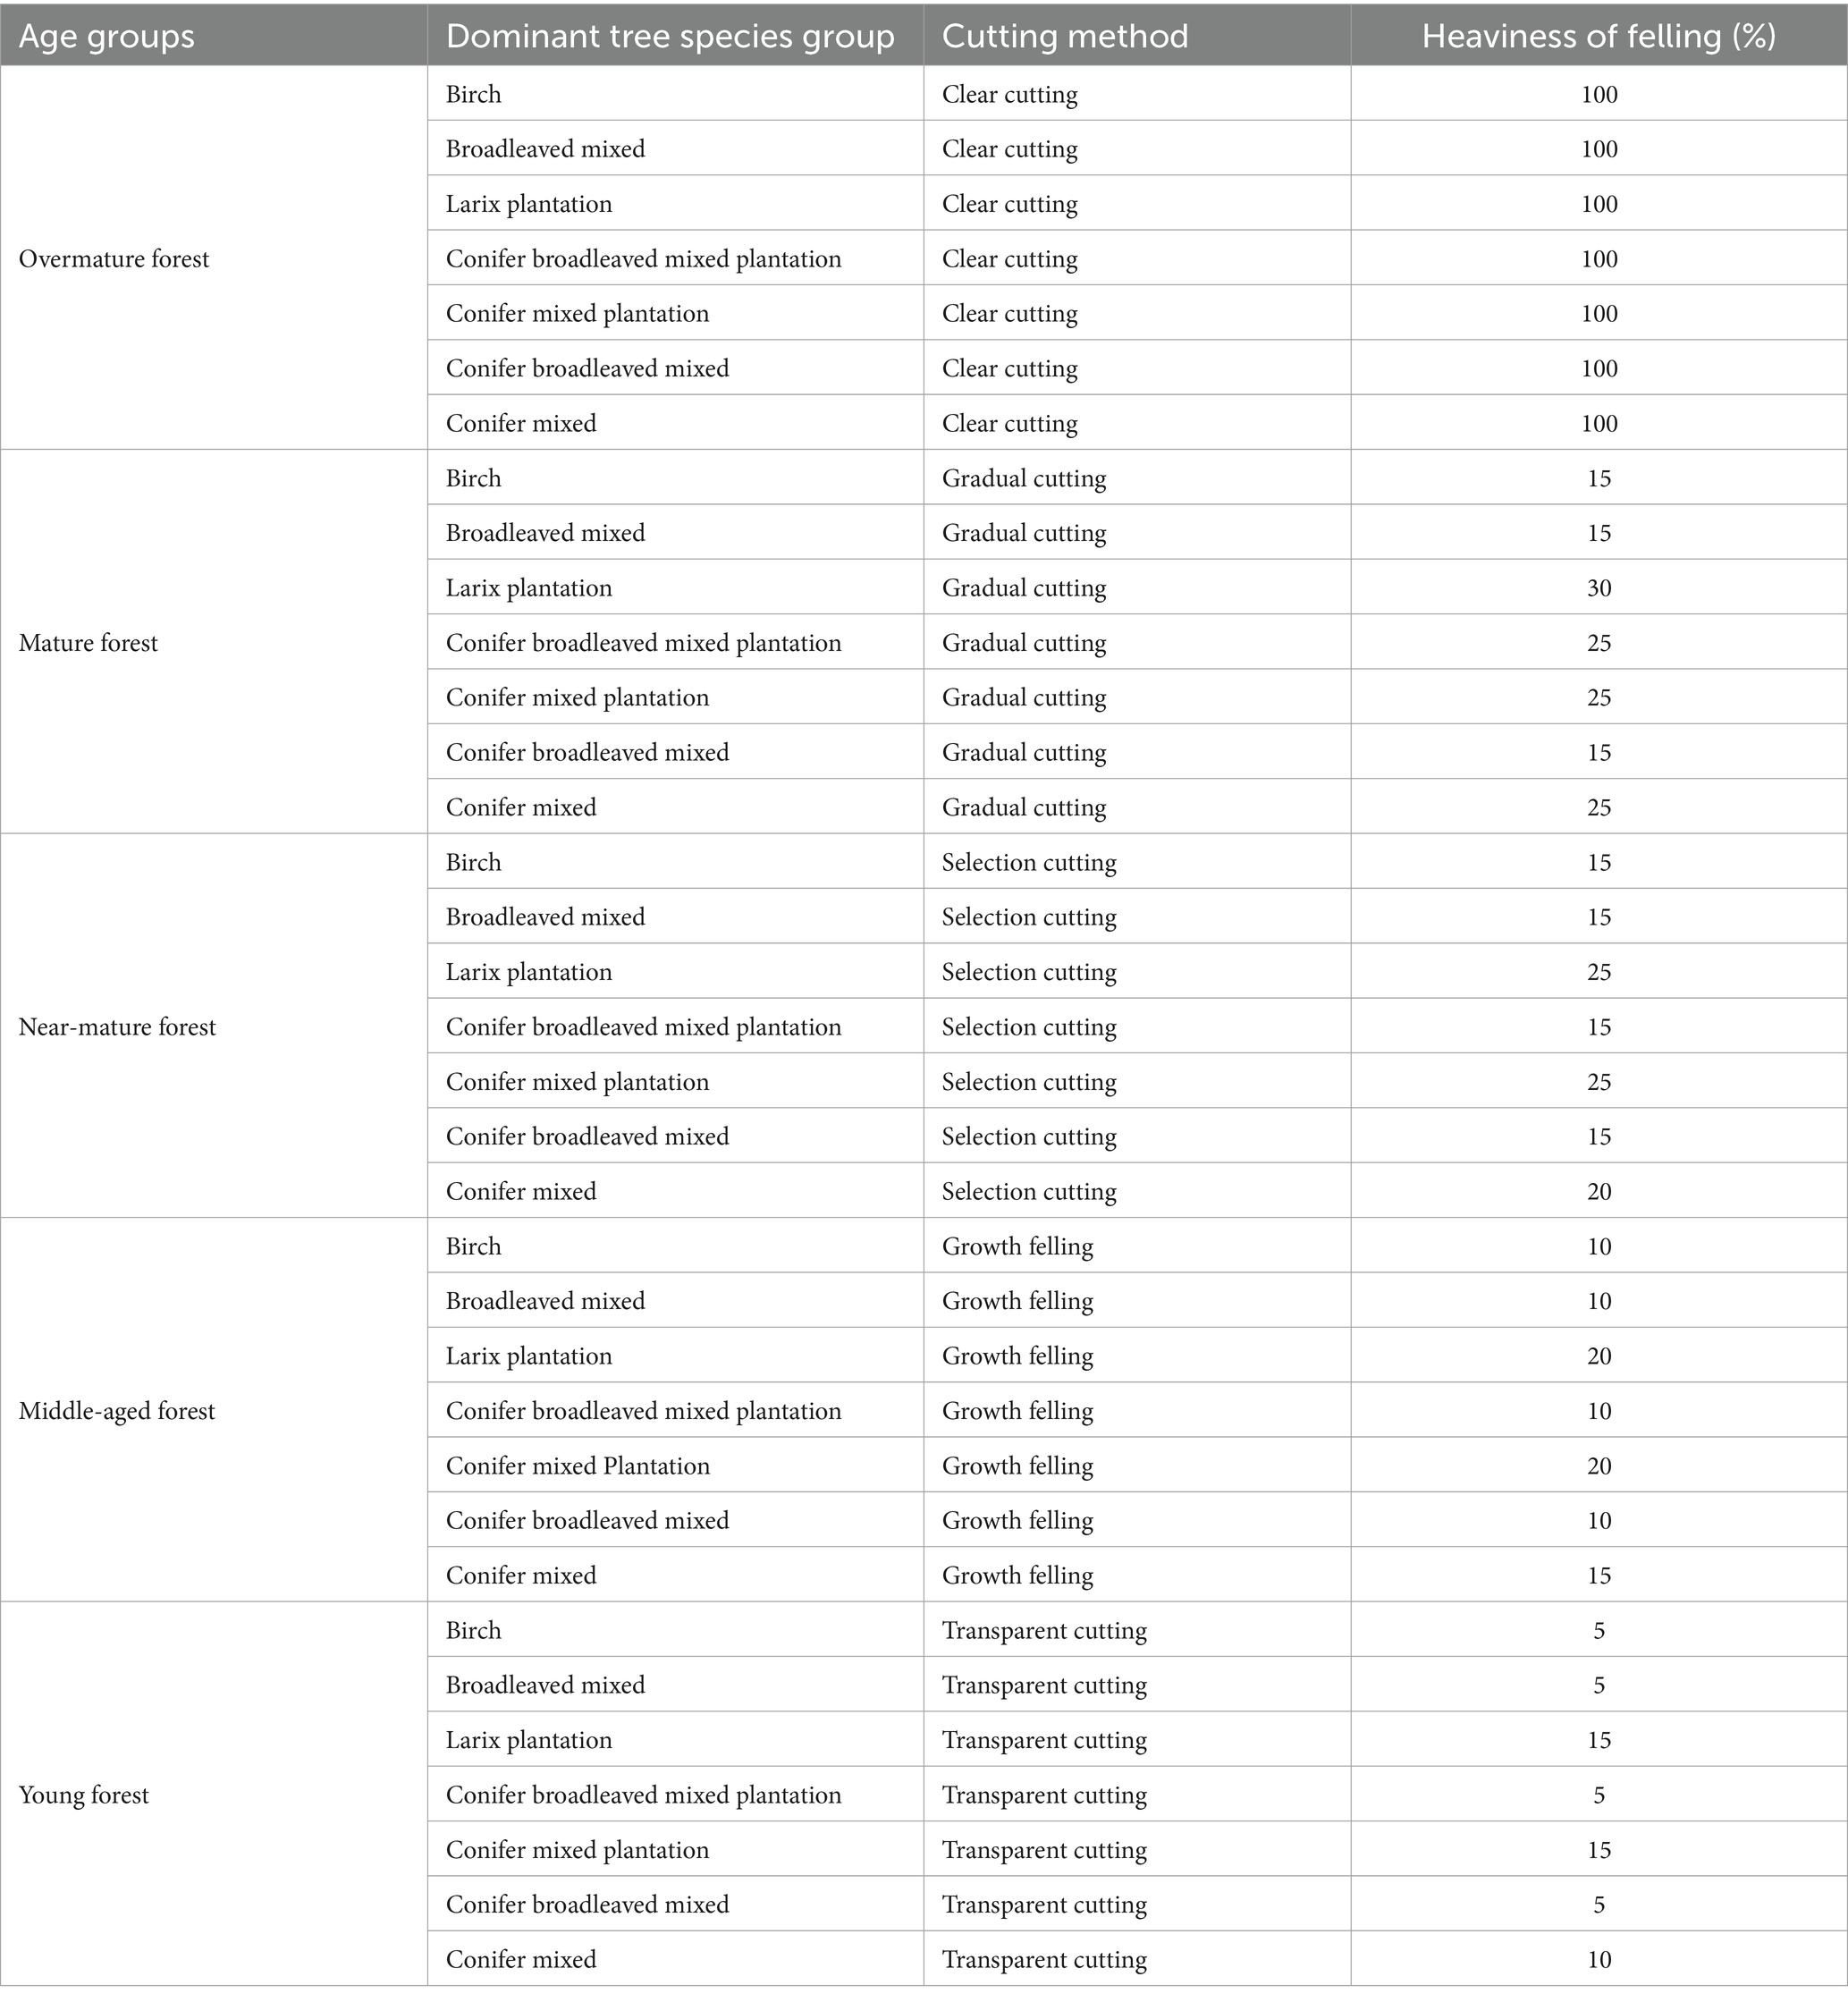
Table 4. Harvest system and harvest intensity.
2.7 Harvest flow
According to the Jilin Province, during the “Fourteenth Five-Year” period, annual forest cutting quota preparation technical regulations and “Forest cutting operation regulations” (State Forestry Administration, 2007) were developed to develop a scientific and reasonable cutting plan. The required design cutting amount should be set for FPS-ATLAS. According to the data from Jilin Province survey and planning (2007), the annual cutting quota of the Jingouling forest farm is approximately 100,000–130,000 m3. In the design of cutting flow, the actual cutting quota and wood yield should be taken into consideration comprehensively, and the ecological function of the reserved zone and the restricted felling area should be avoided to protect the reasonable development of biodiversity. FPS performs internal optimization calculations according to the designed cutting amount set and obtains the actual cutting amount and cutting area. It is necessary to carry out several tests on the designed cutting flow and adjust the plan by the curve between the designed material amount and the actual cutting amount in the FPS software, to make the stand reach a stable and sustainable management state in the shortest time.
2.8 The solving process of FPS
FPS-ATLAS uses its own internal stochastic heuristic algorithm to simulate harvesting schemes:
(1) Search in the range with the highest logging priority that meets the logging conditions. If there is no eligible area, go to step 7; otherwise, go to step 2;
(2) In this area, search for the highest logging priority access unit that meets the logging conditions. If there are no eligible access units, close the area and go to step 1; otherwise, go to step 3.
(3) In this access unit, search in the highest logging priority zone that meets the logging conditions. If there is no eligible zone, close the access unit and return to step 2; otherwise, go to step 4.
(4) Within this zone, to the polygon with the highest harvesting priority (can be age, age minus minimum harvesting age, random, minimum distance, or forest grouping), and to meet the harvesting conditions (non-reserved, meet the minimum age required, not excluded due to adjacency relations, etc.). If no polygons are eligible, close this strip and go to step 3; otherwise, go to step 5.
(5) Temporary logging polygons and check all constraints applied to the relevant clusters (Clinique), zones, access units, and regions. If satisfied, go to Step 6. If not satisfied, exclude this temporary logging and search for four possibilities.
If the polygon does not meet the constraints of the group, exclude the harvesting polygon and return to step 4.
If the polygon does not meet the constraints of the zone, close the zone and return to step 3.
If the polygon does not meet the constraints of the access unit, close the access unit and return to step 2.
If the polygon does not meet the constraints of the region, close the region and return to step 1.
(6) Permanently accept the harvesting of this polygon. Upgrade the attributes and logging applicability of polygons, zones, access units, and areas in this log. The harvesting volume is applied to the periodic harvesting target. If the harvesting target is met, go to step 7; otherwise, go back to step 4.
(7) Collect and report the harvesting statistics for this cycle. If the planning goal has been reached, stop; otherwise, add the forest to the age of the previous cycle, upgrade the attributes and constraints, and return to step 1.
The FPS-ATLAS model considers the forest polygon from a spatial perspective and allocates the forest management system, rotation period, and stand growth and harvest to each polygon. The hierarchical search algorithm is used to classify the polygons, form the sequence of harvesting, and arrange the harvesting plan according to priority. This model and algorithm are used to calculate the Jingouling forest farm with 10 years as a time period, and 20 cycles are run.
3 Planning results and analysis
In the case of closed age constraint, priority should be given to the growth of young stands, and the small classes adjacent to the newly planted young stands will not be cut until the target stand grows to the set closed age constraint value. This plays an important role in protecting the growth of young stands and protecting biological diversity.
3.1 Logging planning for 200 year operating cycle
With a 200 year operating period and a 10 year operating cycle, FPS-ATLAS is run, and the actual cutting volume and area allocated to each year are shown in Table 5.
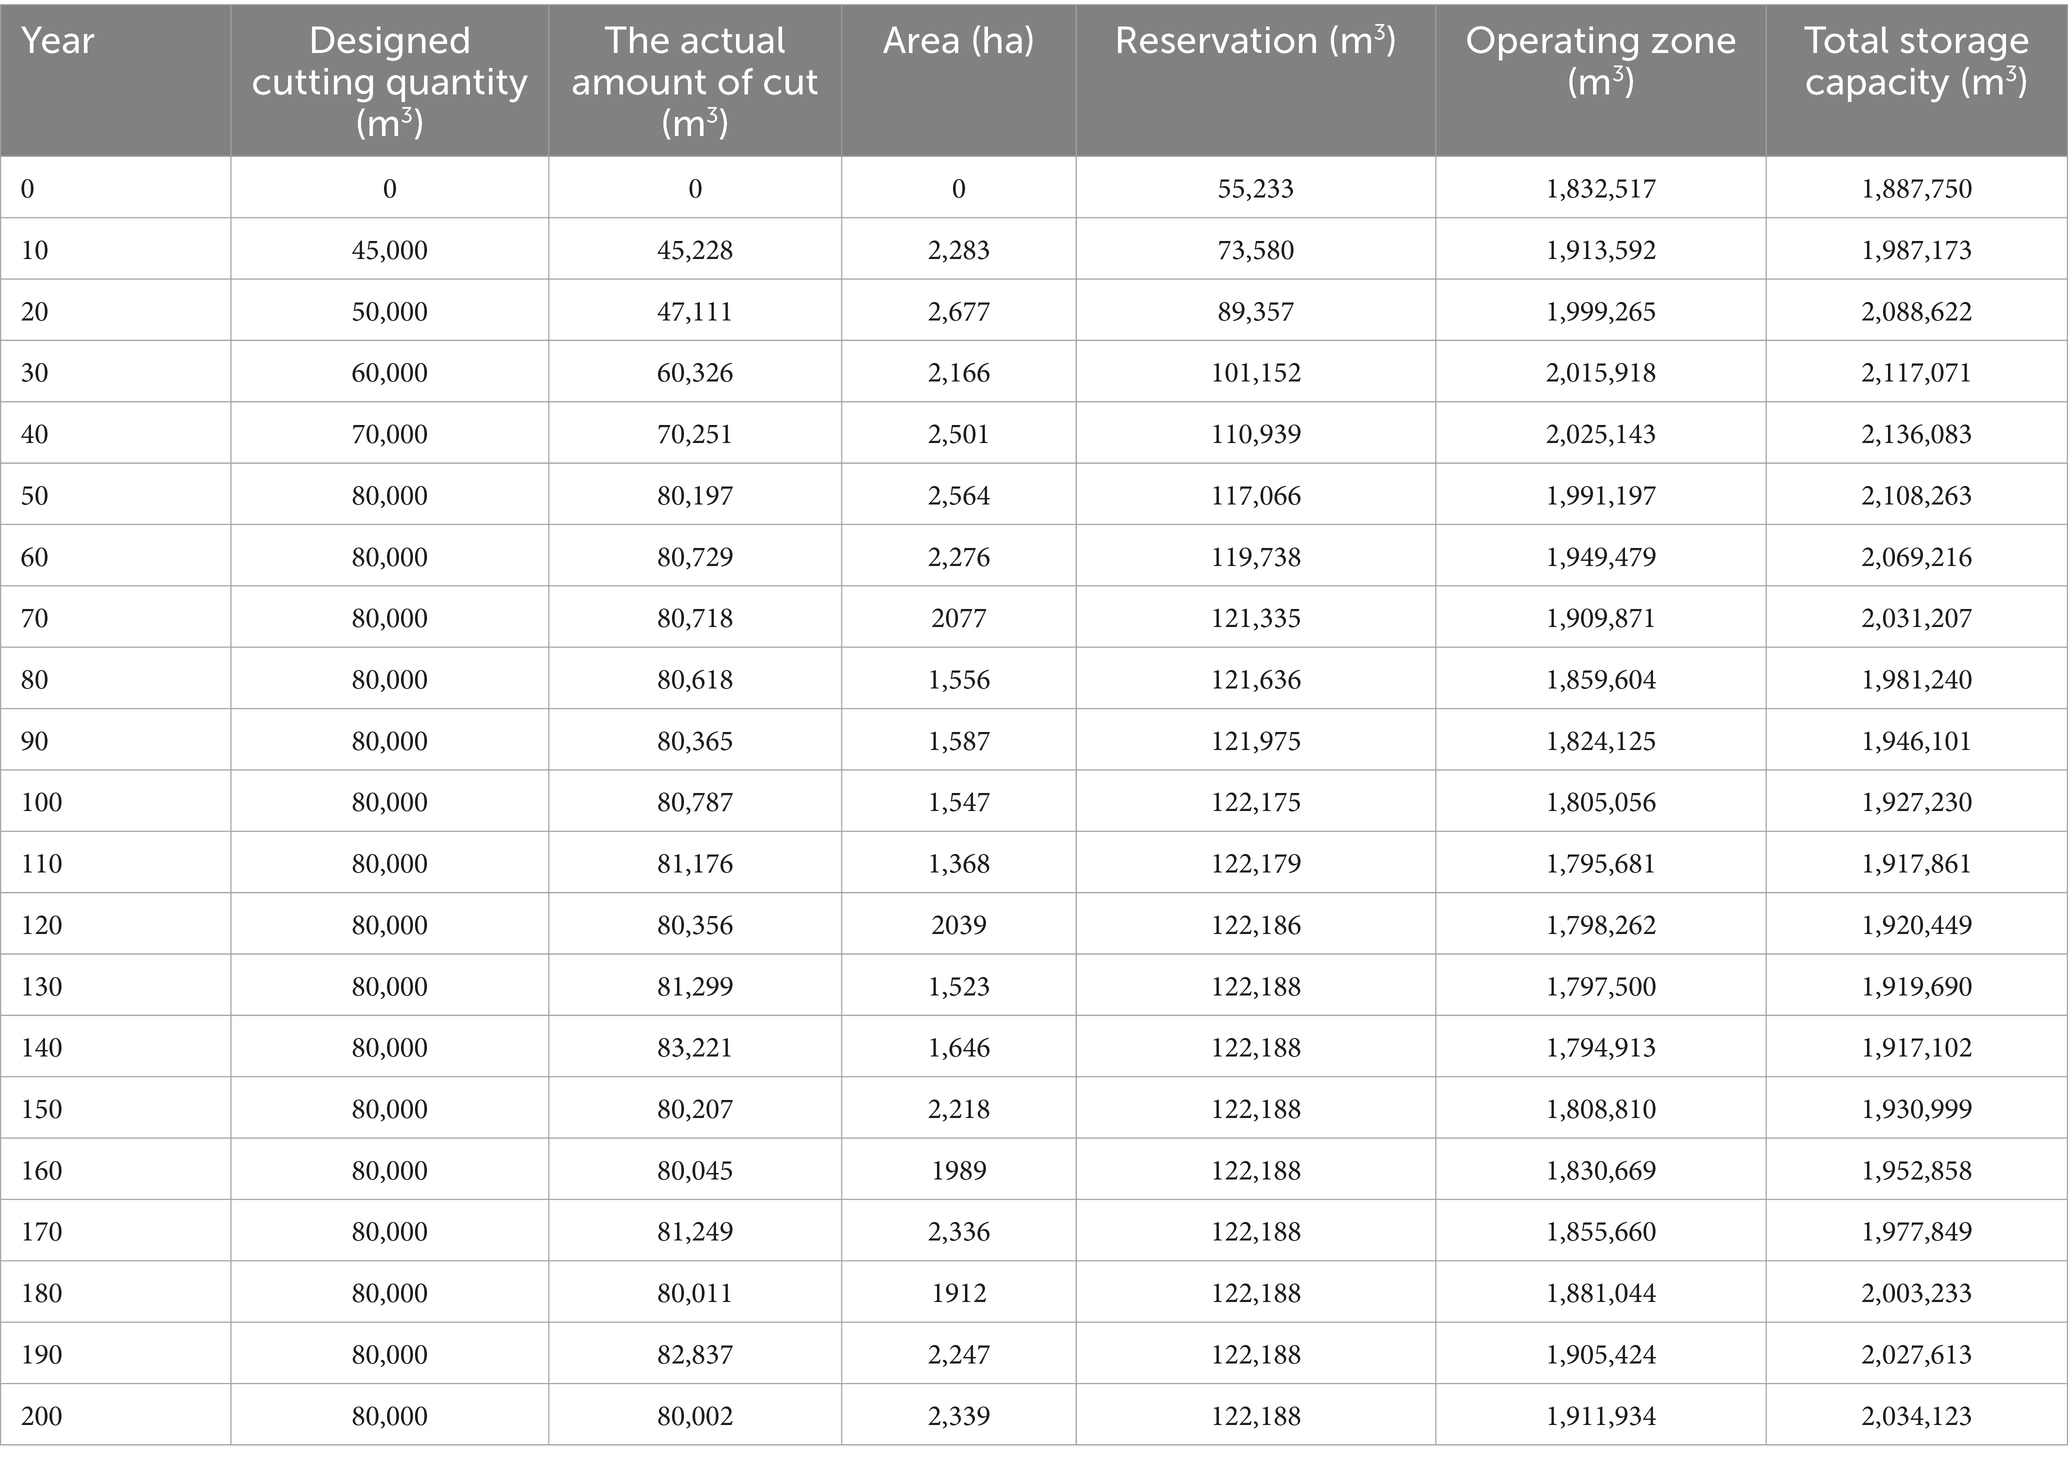
Table 5. Harvest and growing stock in planning horizon.
The total stand area harvested in each small class over 20 time periods can be counted. The arrangement of total area changes by age is shown in Table 6.
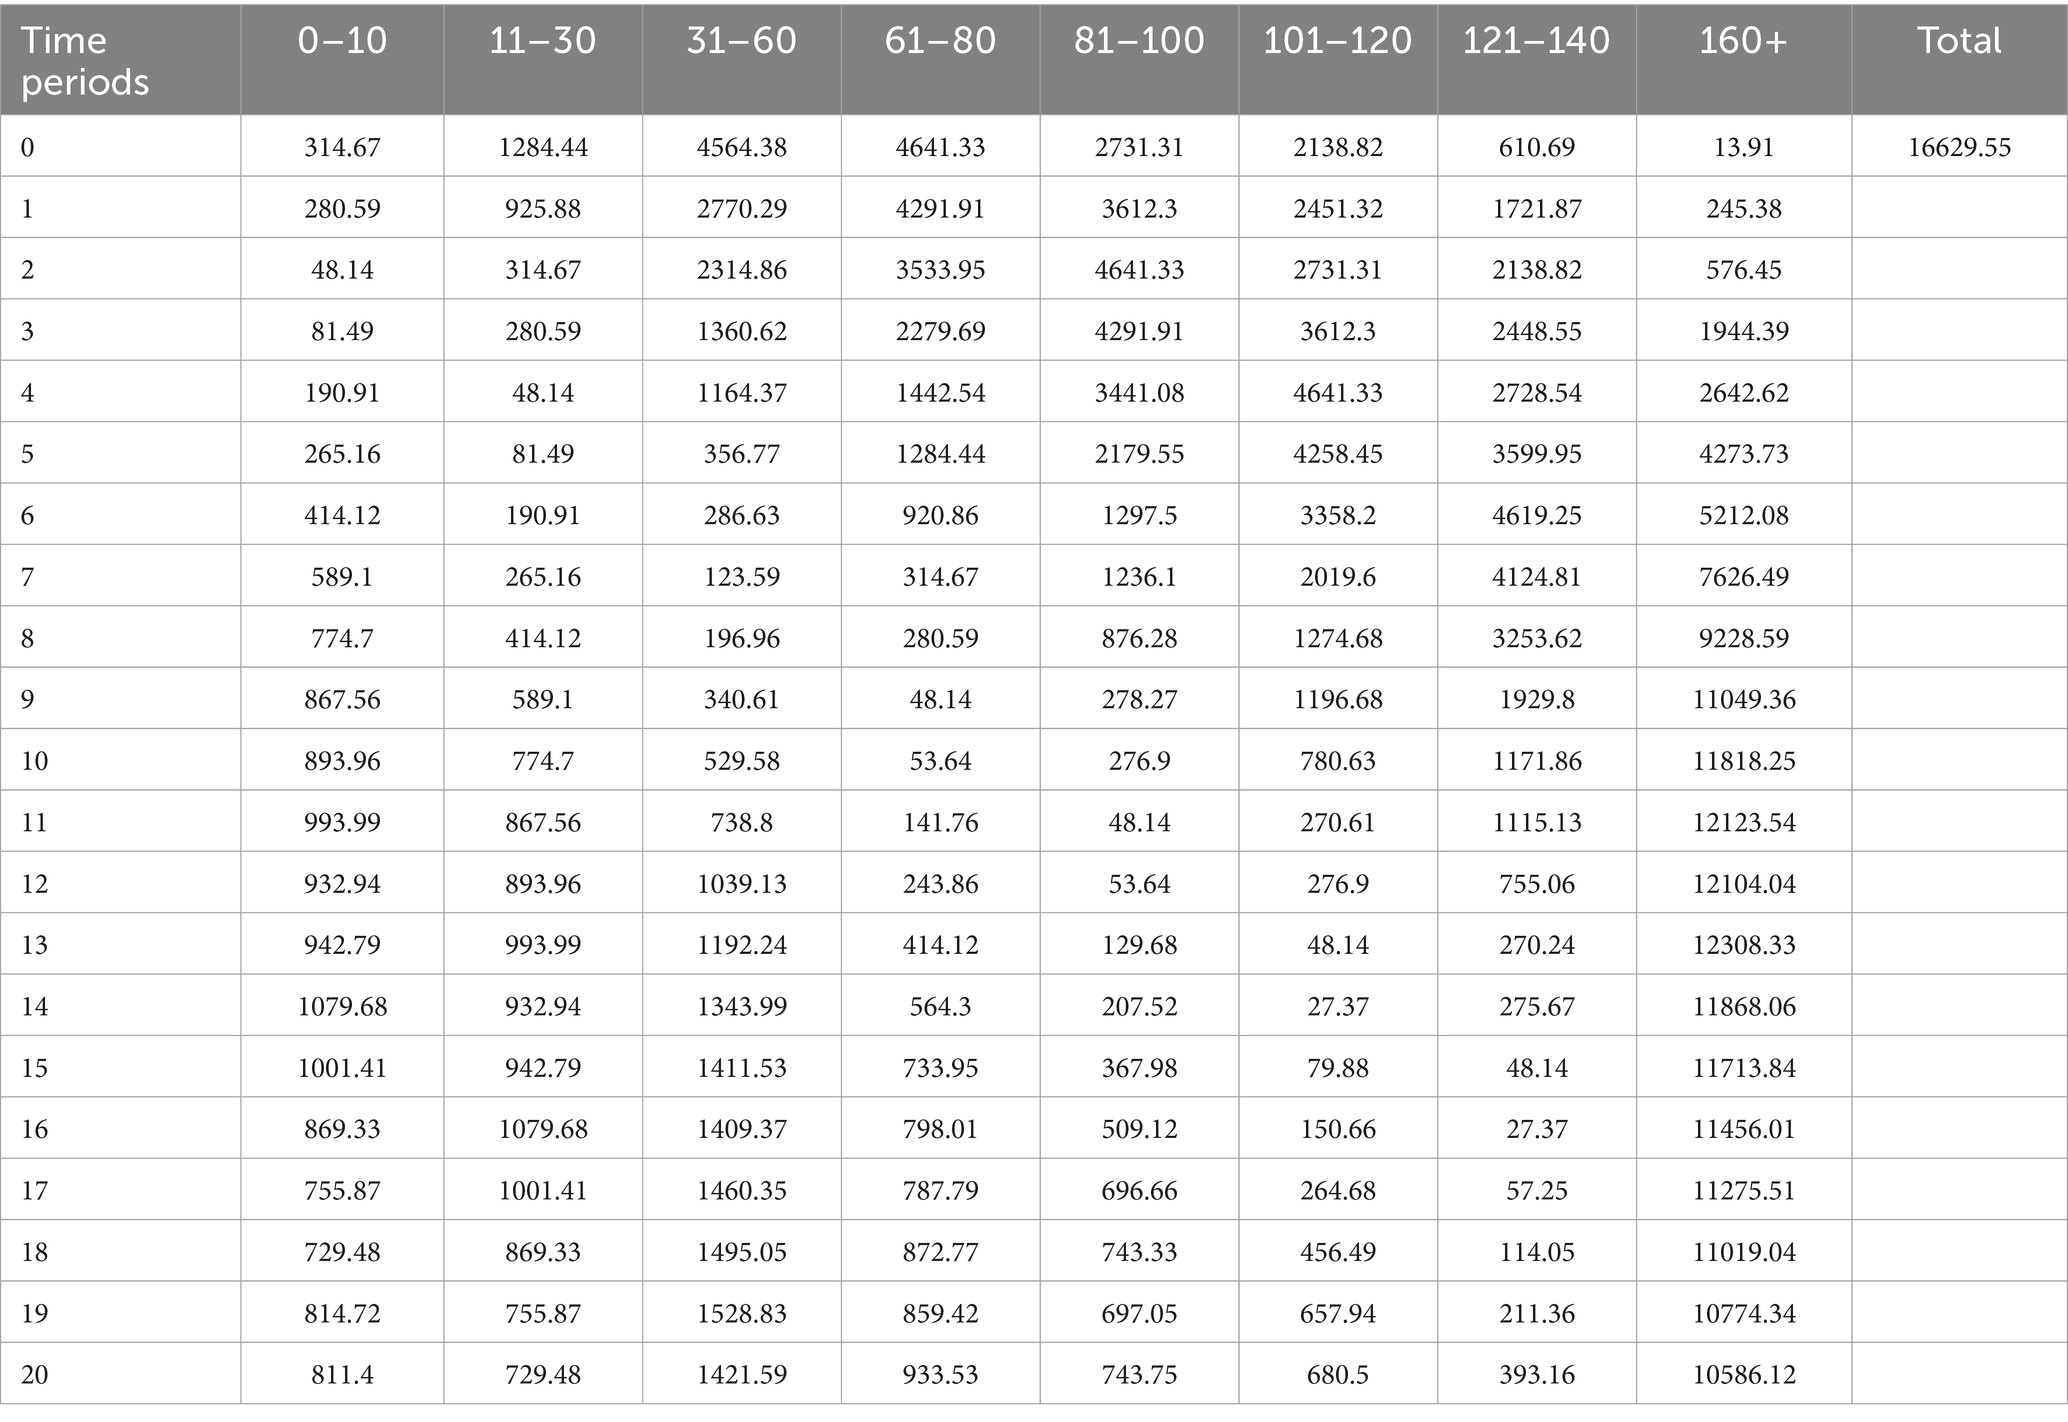
Table 6. Area removed with age in 20 time periods.
The area and stock of all stands from 61 to 80 years will decrease significantly in the first half of the whole 20 year time period, which is caused by the high cutting volume of trees of this age class. After that, there will be a small increase and gradually stabilize (see Table 7).
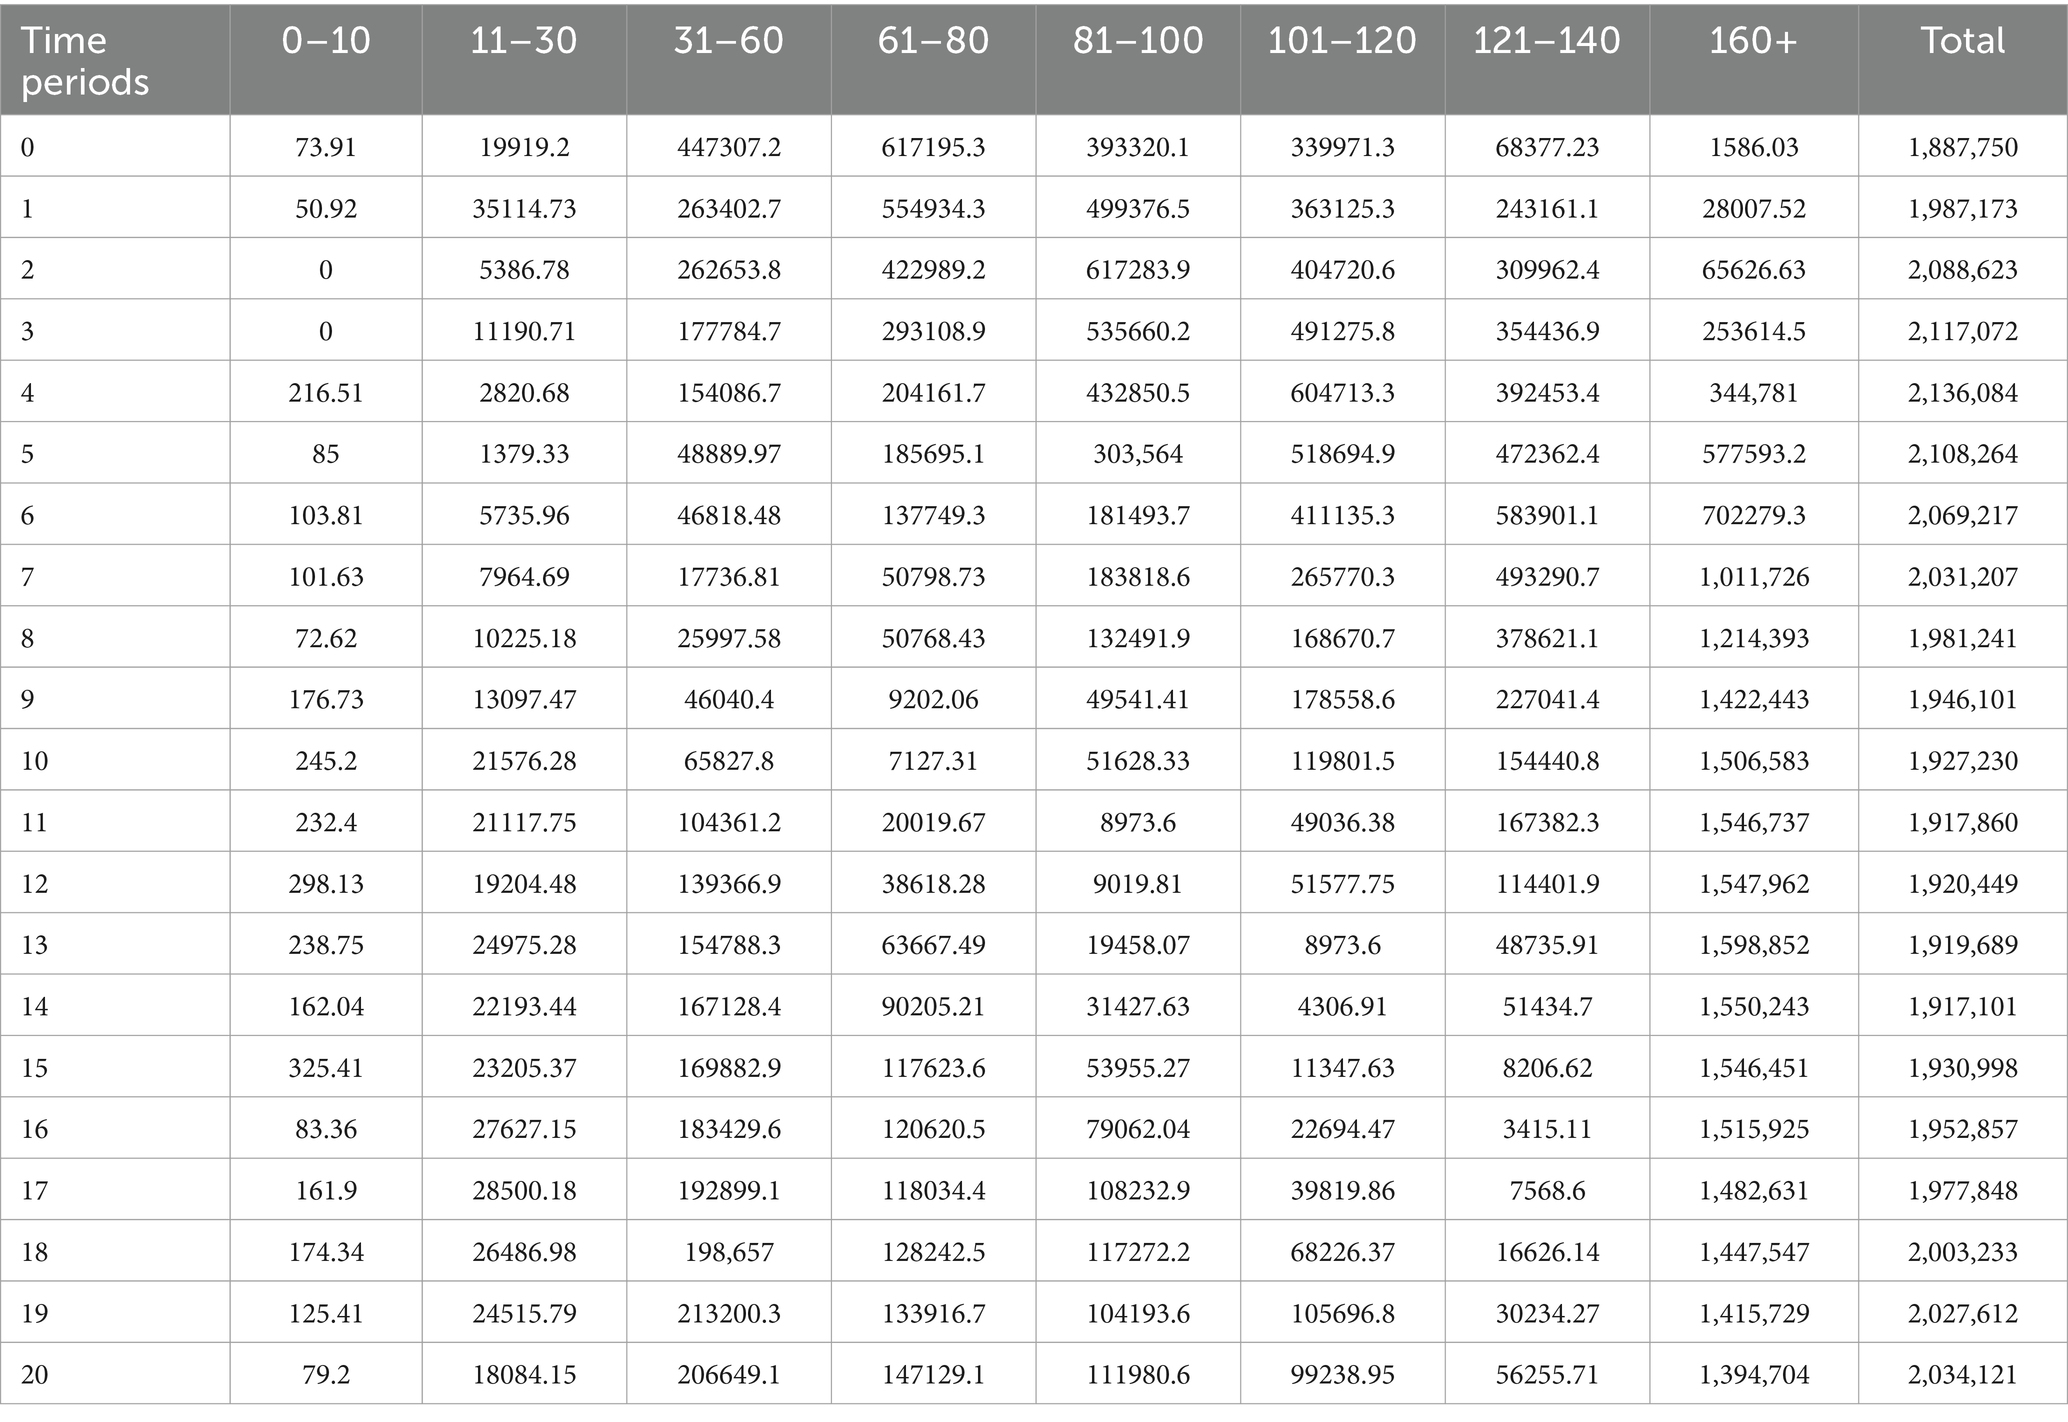
Table 7. Growing stock changed with age in 20 time periods.
3.2 Dynamic change of felling stock
In all 73 forest classes, 6 forest classes were randomly selected and analyzed as examples to illustrate the change in cutting yield. In the early stage, the cutting area of forest was small, less than 1,000 m3, reached 2702.21 m3 in the sixth time cycle, and gradually increased, reaching 4682.53 m3 in the 14th cycle, which was the highest value. Its changes are shown in Figure 2.
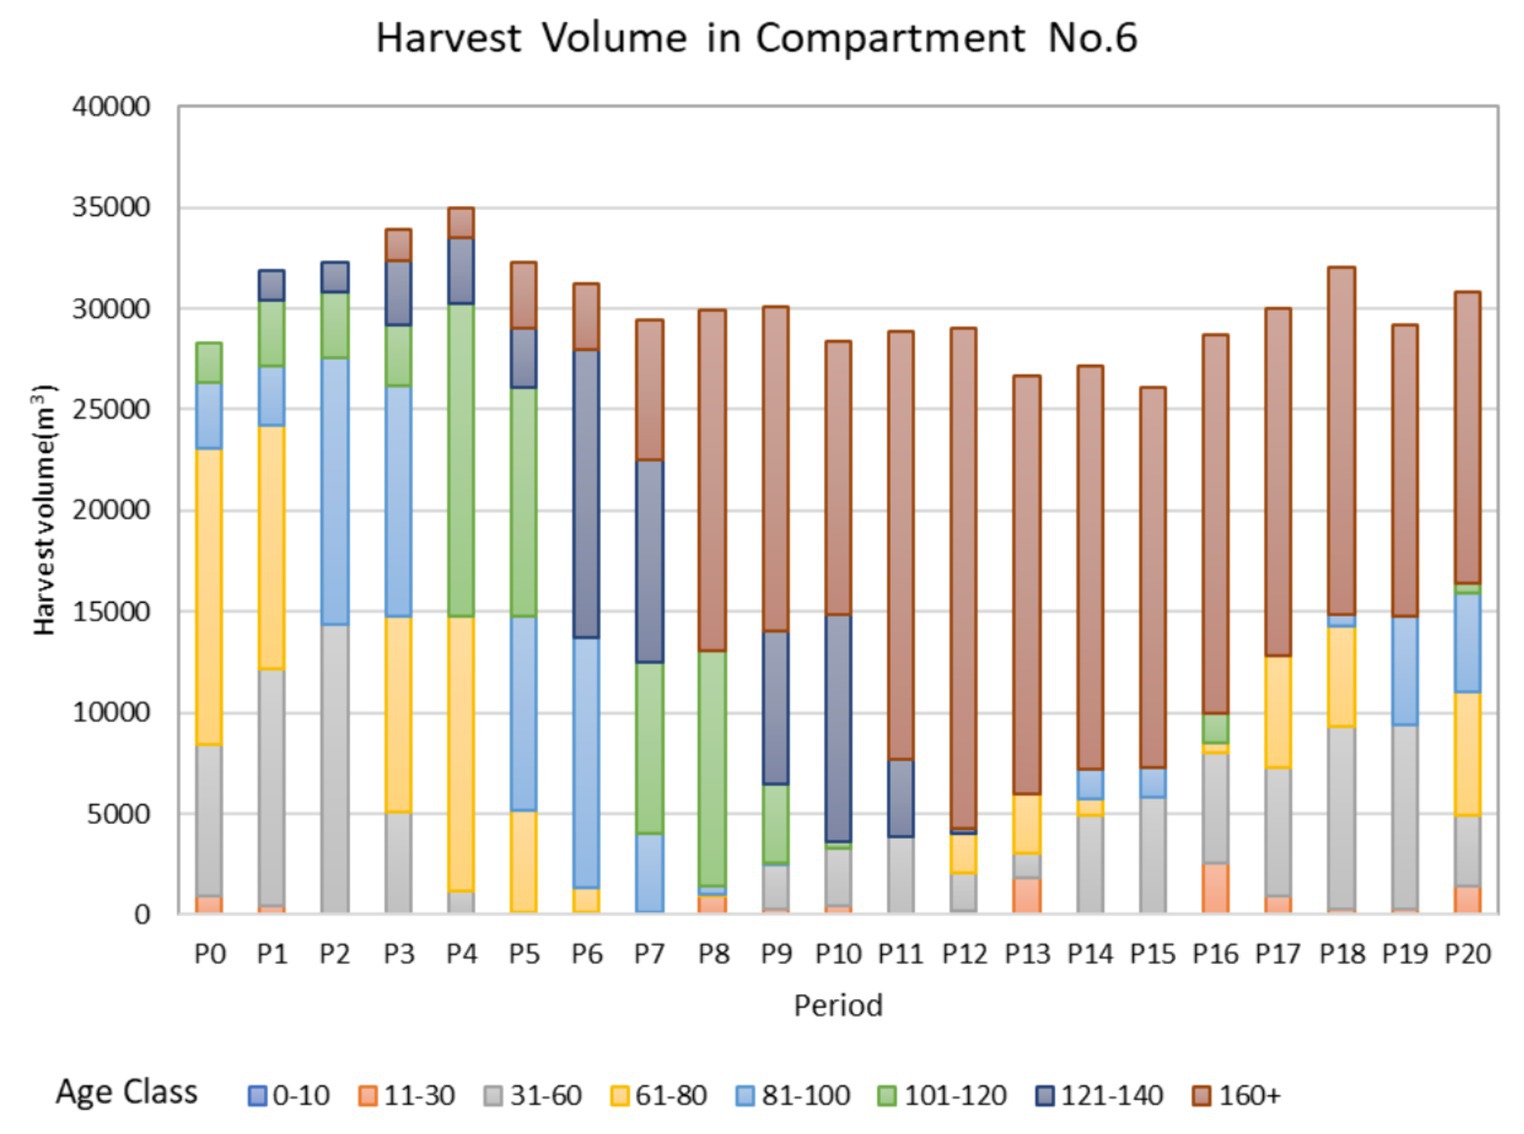
Figure 2. Harvest volume of no. 6 compartment.
3.3 Dynamic change in small class information
The change in cutting amount, area, stock per hectare, and dominant species group in each small class during the planning period can be calculated. Take 6 forest classes and 20 small classes as an example to illustrate this change; see Table 8.
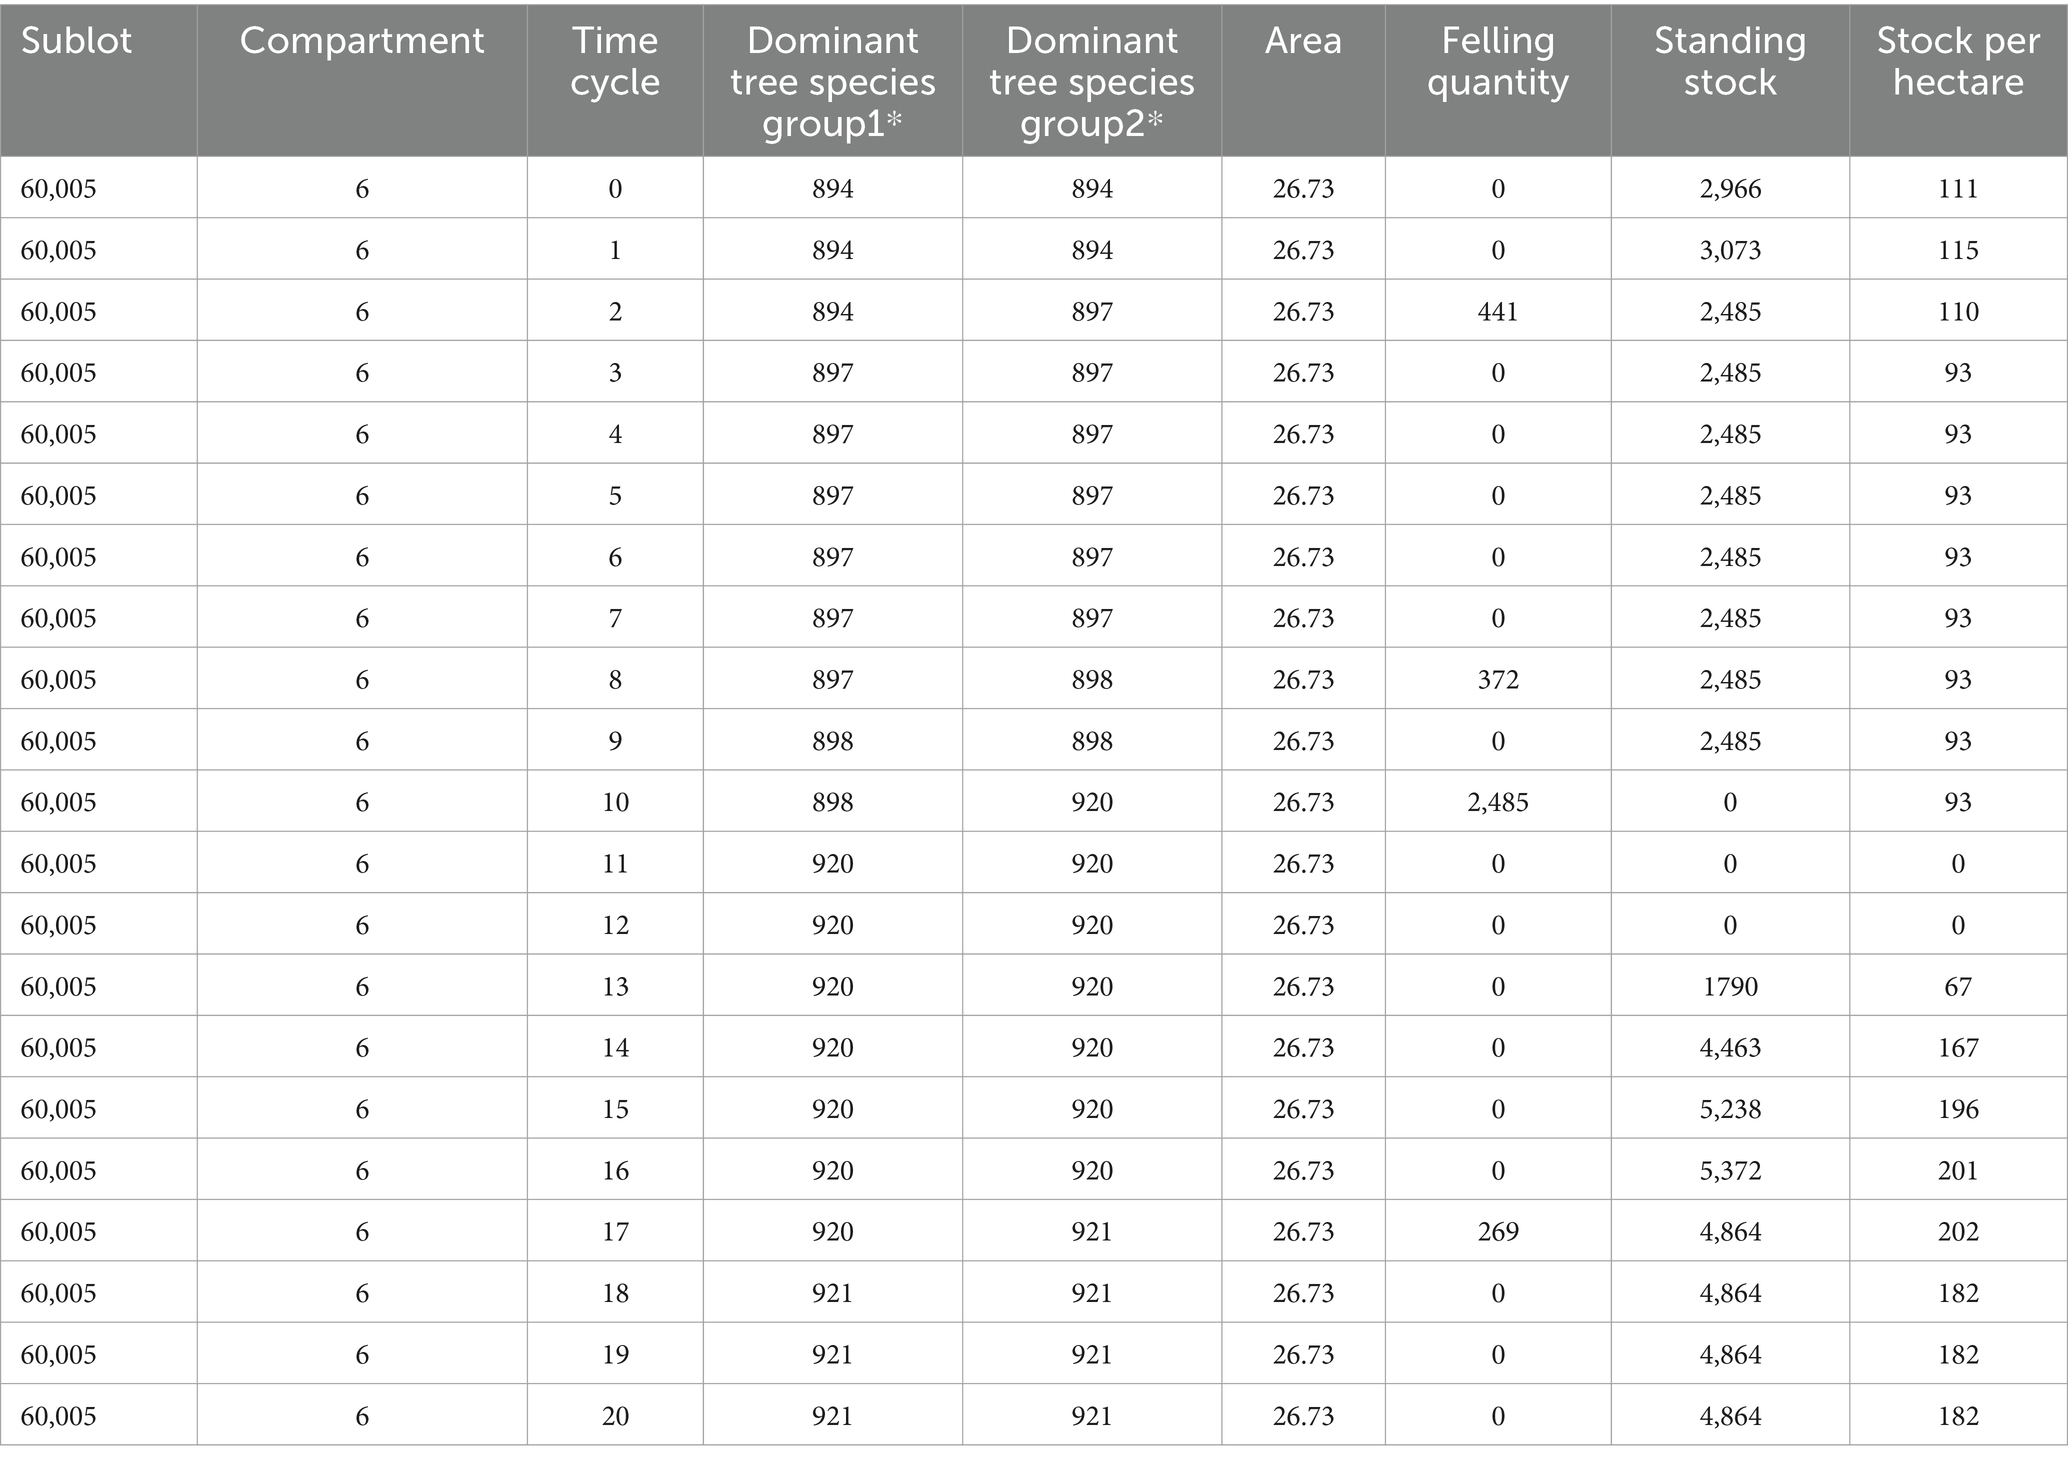
Table 8. Information of no. 20 sub-compartment in 20 time periods.
Figure 3 shows the rule of age change of 21 small classes in 6 forest classes during the planning period. For example, the middle five small classes changed from the initial state of near-mature broad-leaved mixed forest (895) to mature broad-leaved mixed forest (897) after five cycles and then evolved into over-mature broad-leaved mixed forest (898). This small class was cut, and artificial larch, spruce, or red pine was planted according to the characteristics of this small class so that it could be replaced by a broad-leaved mixed forest. It entered the young (920) stage of the mixed forest and finally succeeded to the middle (921) stage of the mixed forest.
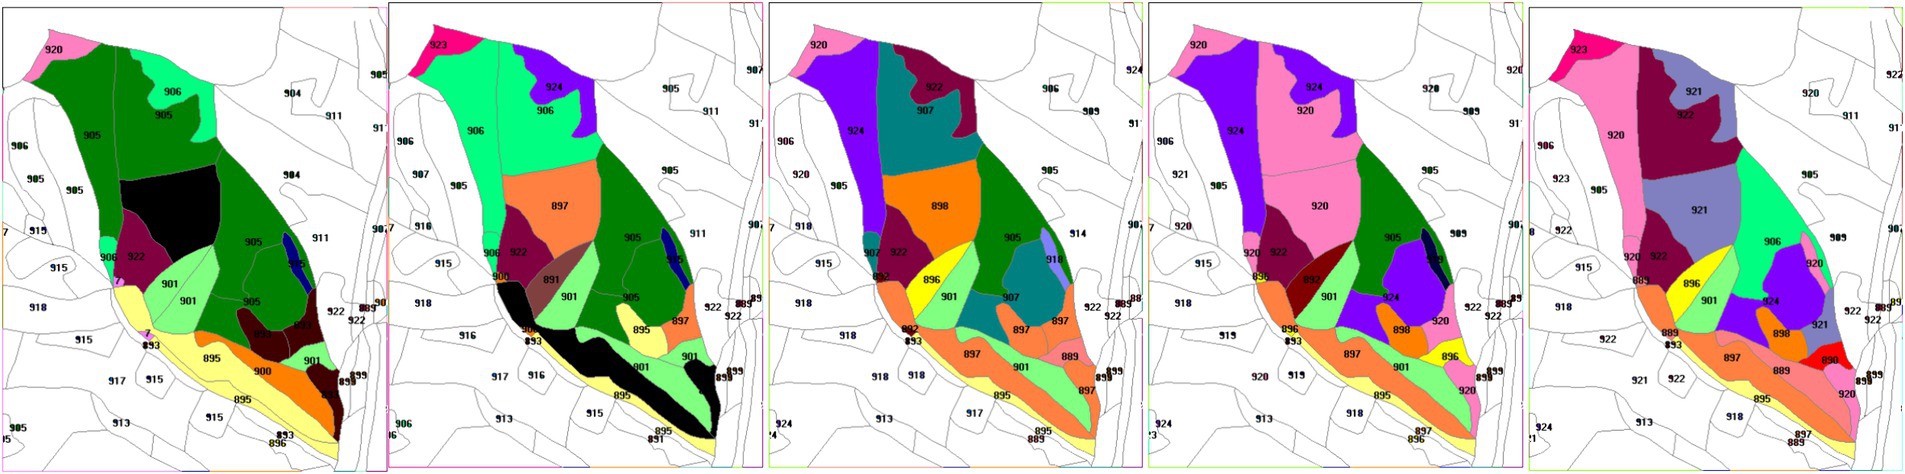
Figure 3. Seral stage of no. 6 compartment.
3.4 Dynamic change in carbon stocks
Carbon stocks of different tree species groups change differently with harvesting, and larch is taken as an example to illustrate this change (Figure 4). In the young forest stage, the carbon storage of larch will decrease due to transparent logging, and all the carbon storage will increase steadily after the fourth time cycle. The carbon storage of middle larch increases rapidly in the early stage, decreases rapidly in the fourth time cycle due to growth cutting, stabilizes in the seventh time cycle, and gradually increases. The carbon storage of larch in near-mature forests will decrease during the whole planning period due to thinning. The carbon storage of mature larch forest also decreased gradually due to the increase in cutting amount and remained relatively stable in the sixth time cycle. Larch in overripe forests will have increased carbon storage due to maximum growth before harvesting.
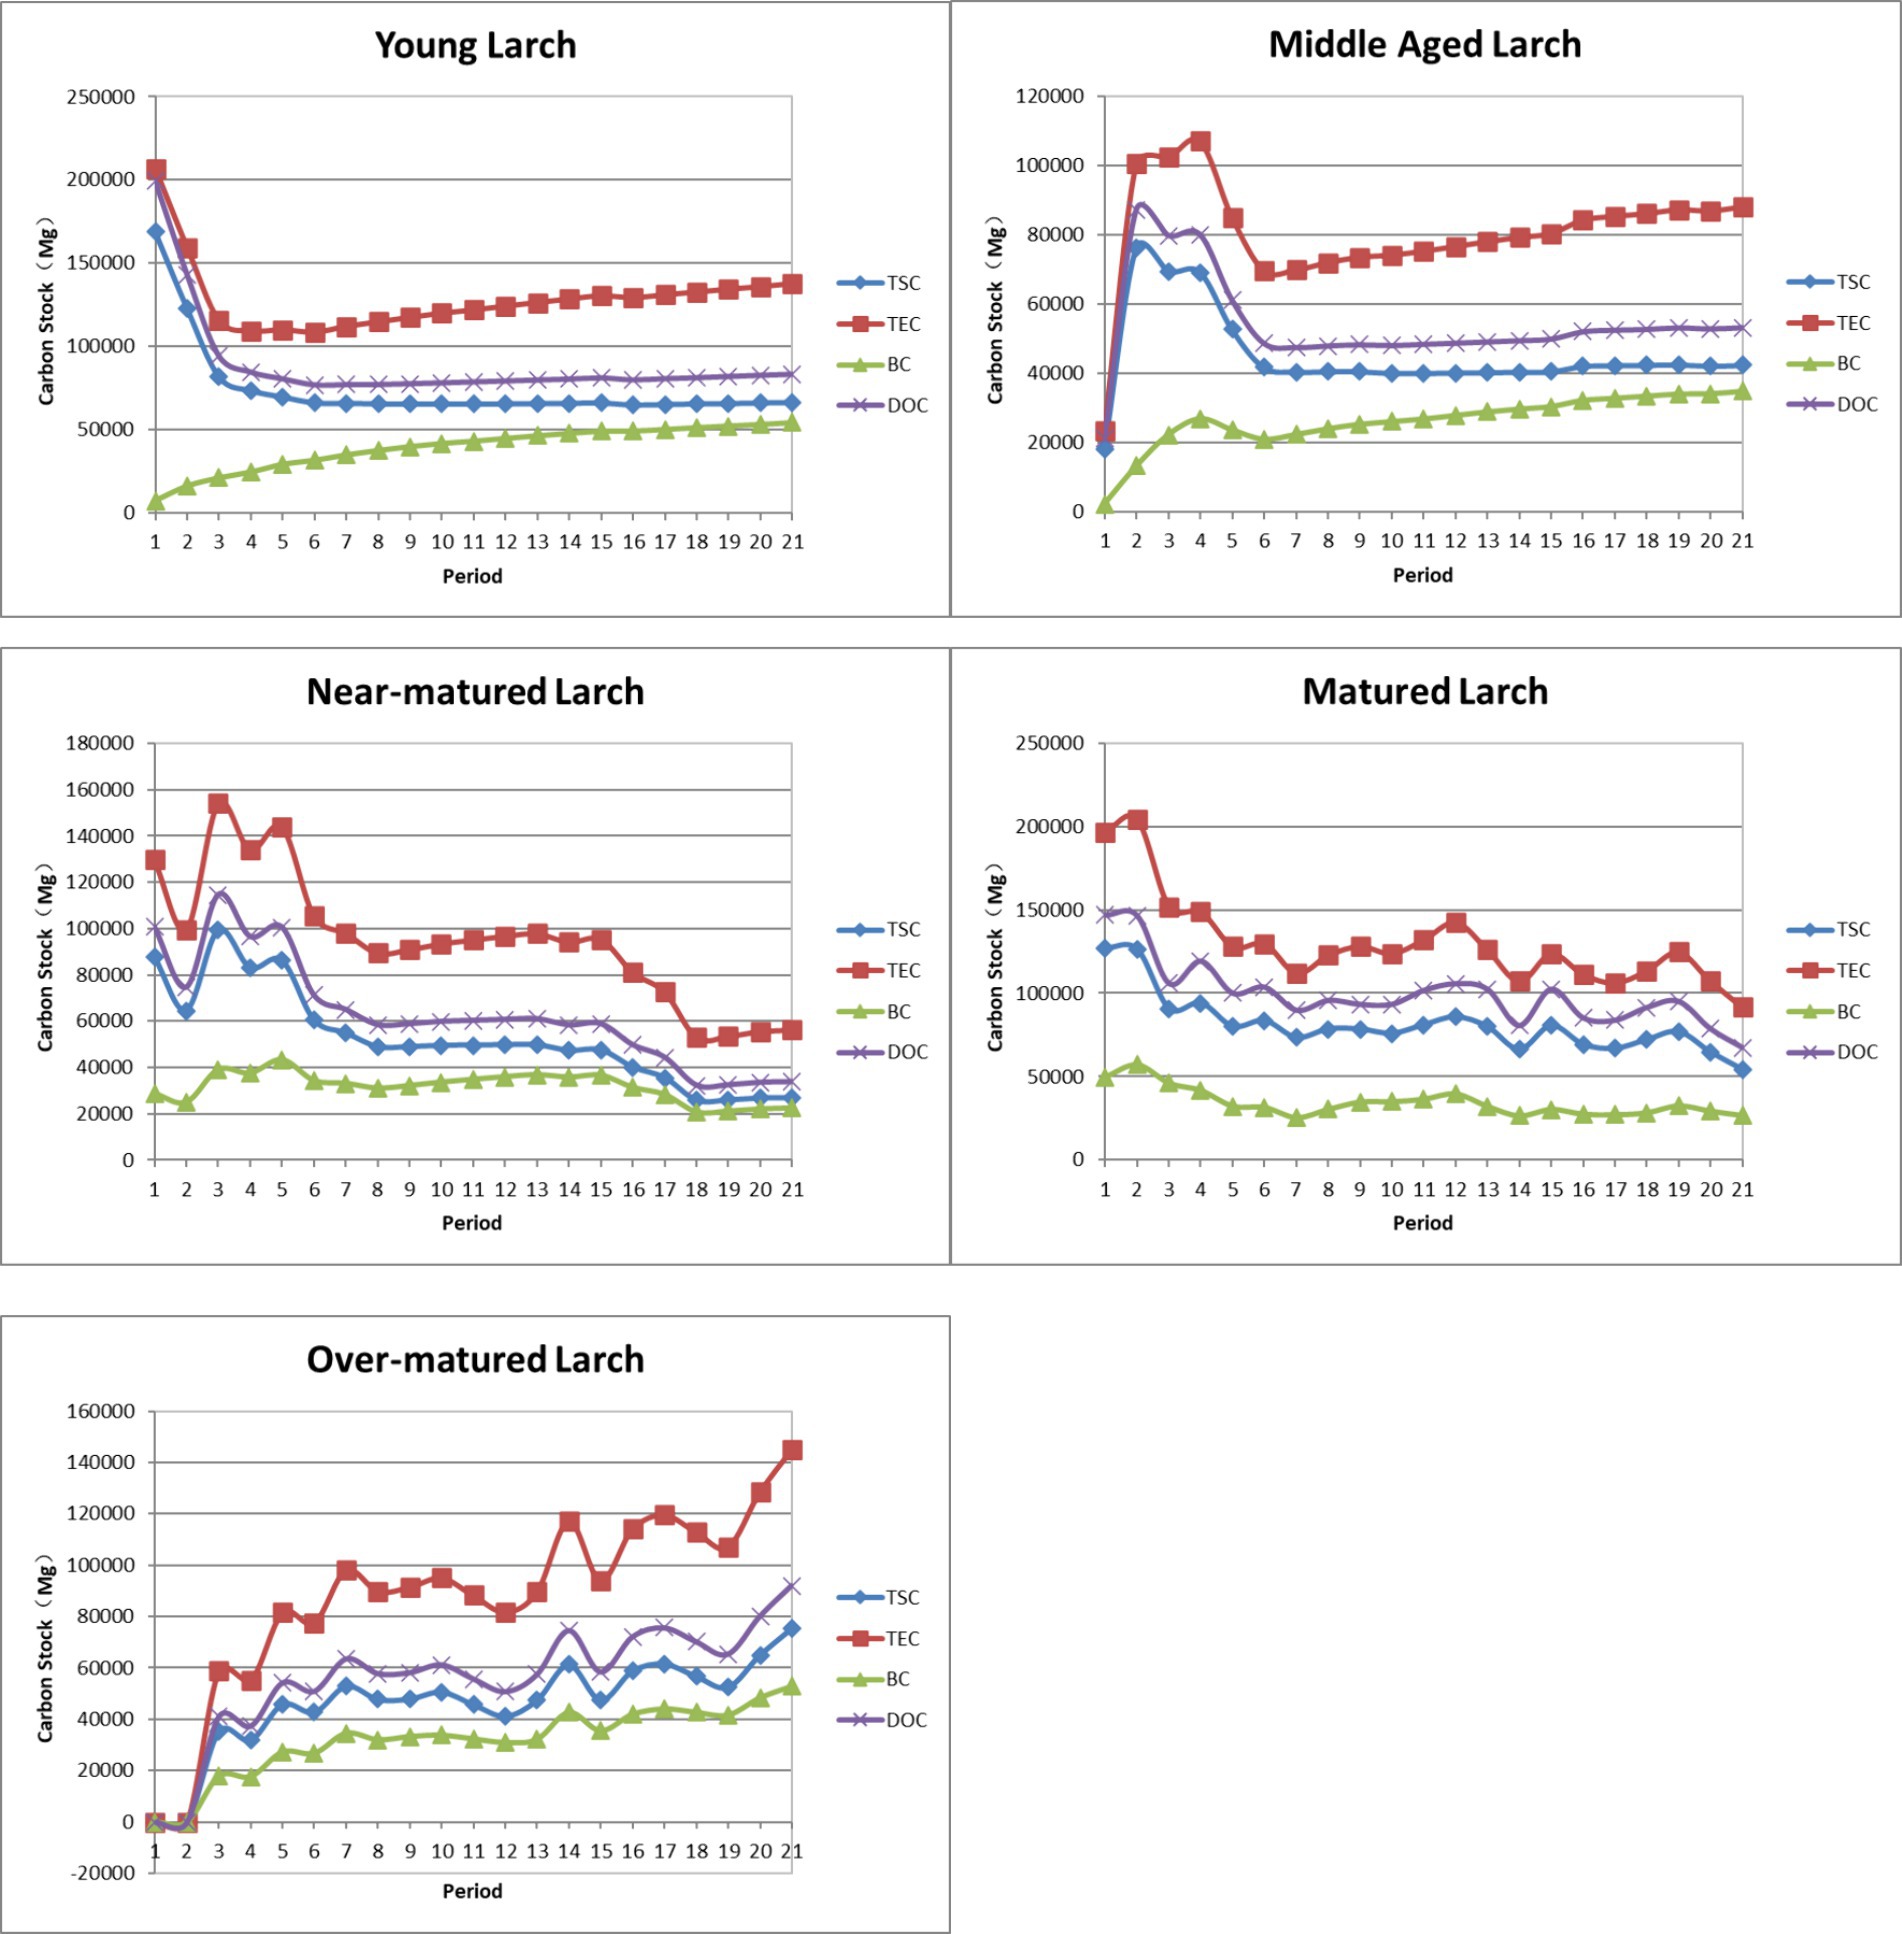
Figure 4. Carbon dynamics of larch in different age groups.
The change in total carbon storage dynamics of all small classes in forest class 6 is shown in Figure 5. The four kinds of carbon have similar change rules and are in a steady growth stage before the 10th time cycle. After that, the soil’s total carbon decreased slowly. In relative terms, the soil’s total carbon changed gently.
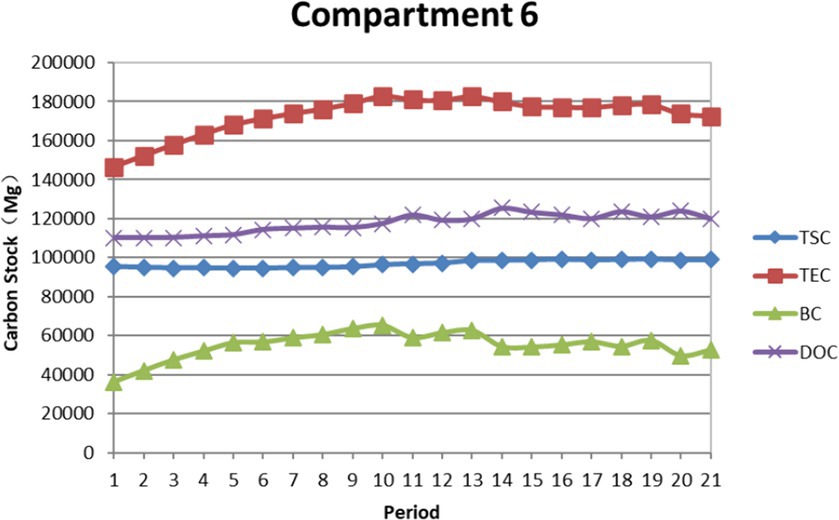
Figure 5. Carbon dynamics in no. 6 compartment.
3.5 Evaluation of planning objectives
The constraint of the age of closure affects the amount of stock, carbon storage, and cut, and the spatial relationship between adjacent management units restricts the optimal solution. The achievement of the objectives is shown in Table 9.
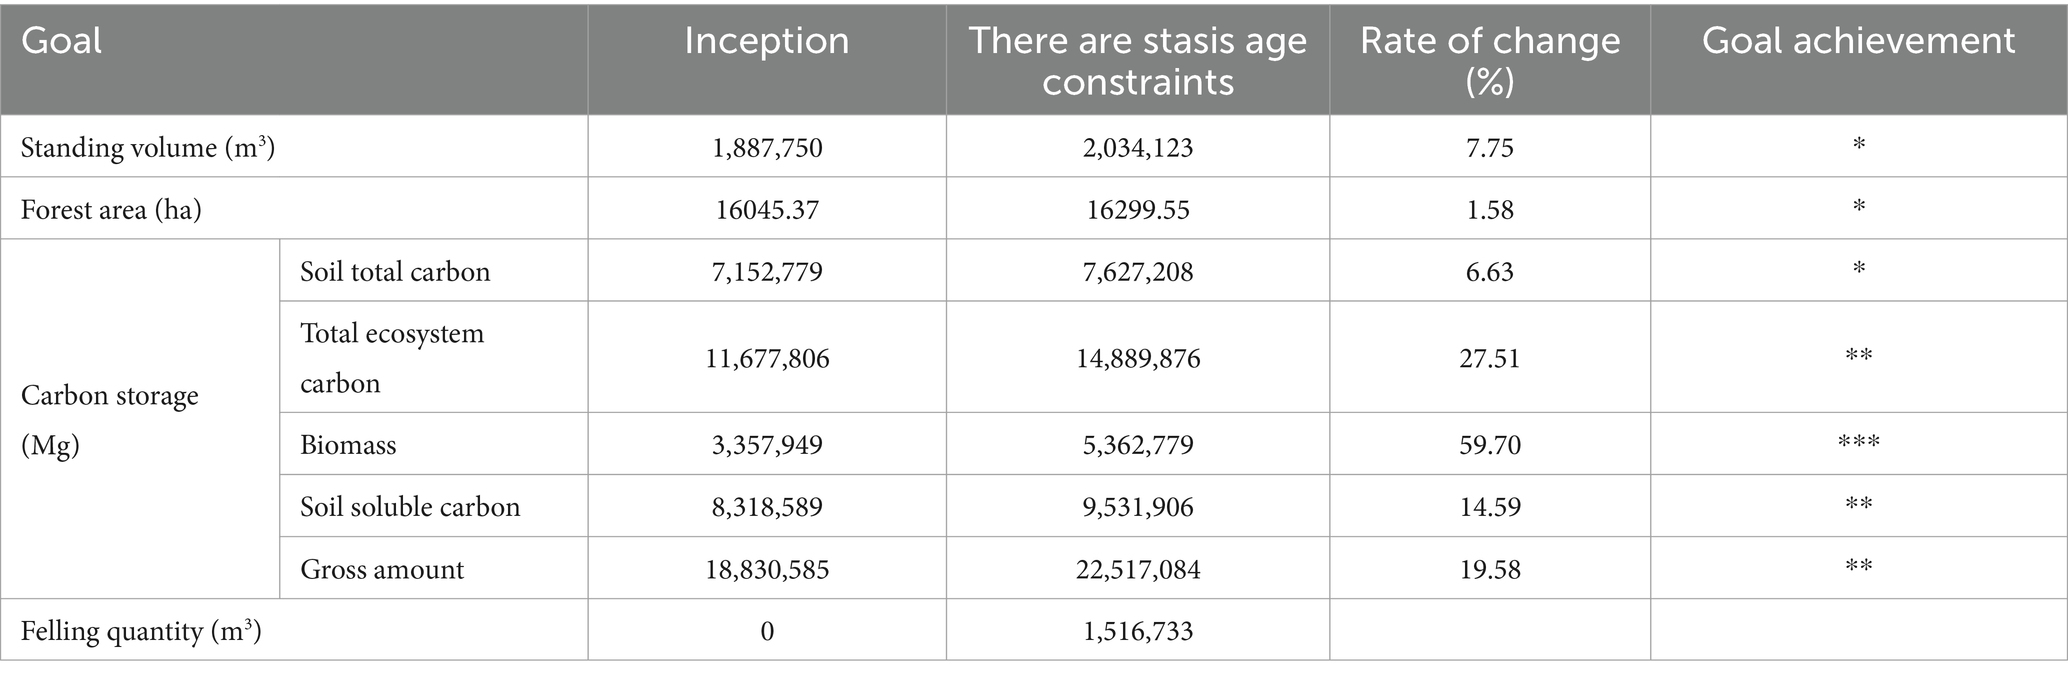
Table 9. Evaluation of objectives.
(1) Storage volume target.
After 20 business cycle planning with closure age constraint and adjacency constraint, the total stock volume becomes 2,034,123 m3, with a change rate of 7.75%, and the target is achieved.
(2) Forest area target.
The final area of Jingouling forest farm is 16299.55 ha, with a change rate of 1.58% after the transformation of unformed forest land and forest wasteland.
(3) Carbon storage target.
After 20 operation cycles, the TSC was 7,627,208 Mg, the TEC was 14,889,876 Mg, the biomass was 5,362,779 Mg, and the soil soluble carbon was 9,531,906 Mg. The TSC, TEC, biomass, and soil soluble carbon were 6.63, 27.51, 59.70, and 14.59% higher than the initial state, respectively, and the total amount increased by 19.58%.
(4) Ecological succession objectives.
All stand types are successional according to the design scheme; this succession is an idealized state, and there will be some changes in the actual stand.
(5) Cutting quantity target.
In the planning with closure age constraint, the total cutting amount was 1,516,733 m3.
(6) Biodiversity conservation objectives.
The ban on logging has been achieved, especially as strip corridors along the river play an important role in protecting wildlife habitats.
4 Discussion
In this study, we considered the effects of adjacency and green-up constraints of forest harvest and carbon management for every tree species group at a forest farm level, while other published literature often used a single land ownership model. As we found, younger forests were more influenced by the harvest flow constraints, and since the potential clear-cutting activities were inherently limited in the first few years of the planning, adding more constraints (adjacency and green-up age is 20 years) to the management situation affected this type of forest more than the other forests (middle-aged and matured forest), it is quite similar to the relative results (Zhu and Bettinger, 2008). In the Northeast of China, how to protect the needle trees beneath the tree canopy before or after the harvest is becoming more important; unfortunately, in most forest management planning, there are no constraints to achieve it. If the green-up age is 20, no adjacent sub-compartments will be harvested until this polygon is at least 20 years old. With different adjacency rules, the most restrictive green-up age is applied. For other constraints, such as seral stage constraints, the polygon needs to pass all constraints specified for each clique. In western U.S. research, typical green-up periods are 10 to 20 years (Barrett et al. (1998)). The relationship between spatial constraints and a variety of sizes and spatial arrangements of the potential adjacency and green-up rules for each sub-compartment.
There are many stand-level problems or growth models that are too complex to be solved by the existing optimization techniques within a reasonable timeframe. These types of problems are most often handled by using heuristic techniques in forestry (Yoshimoto et al., 2016). How to describe the complication of ecosystems in natural mixed forests was the impetus for this study; thus, we developed six types of stands with ecological functions that represent the majority of stand status in the Jingouling forest farm. The stock growth models were adjusted to become a series of growth models with variable cutting intensity, which can be better applied to the change of management measures. Growth model curves change with the management tragedy, but it is hard to write in the models. In this study, we approached to solve it.
In recent years in China, the multiple functions of forests have brought some new theories for forest decision-makers at both national and unit levels. Multi-resource and multi-objective modern forest management needs to assess the value of complex forests with temporal and spatial relationships. When dealing with multiple control variables, such as assessing the value of complex forests with temporal and spatial relationships, and making strategic and tactical forest management plans, decision-makers need to evaluate the ecological, economic, and social functions of sustainable forest management within a united level (Pukkala et al., 2014). In this study, we used FPS to perform a stochastic heuristic algorithm to achieve the multiple functions of every sub-compartment. If the ecological function and biodiversity of forests are to be adequately protected, a planning scheme with spatial constraints can be adopted. The operation results of the program can reflect the detailed changes in the area, wood stocking, harvest, carbon storage, and ecological succession of each sub-compartment in real-time and dynamically.
The constraint of the age of closure affects the amount of stock, carbon storage, and cut, and the spatial relationship between adjacent management units restricts the optimal solution. When using heuristic techniques, one cannot be certain that the global optimum solution to a planning problem will be found or that the resulting solutions are even close to the global optimum (Bettinger et al., 2002). To evaluate the quality of the solutions that are produced by heuristic techniques, we made some statistics to calculate the rate of variable changes and check the goal achievement.
National policymakers in China should achieve ecological, economic, and social functions. For researchers, it is a challenge to meet these planning requirements. In the literature, there are examples of the integration of complex quantitative models into forest planning processes, such as stream sediment (Hof and Beevers 2000), stream temperature (Bettinger et al., 2002), and wildlife models (Hof and Joyce 1993; Bettinger and Chuang 2004). The integration of alternative measures for economic, ecological, and social goals in this study meets the requirements of policy, such as sustainable development policy, benefit trade-offs, harmonious development between humans and nature, and the transformation of forest management approaches and social.
5 Conclusion
Using stand-level planning for a specific forest farm assists policymakers and treatment operators in the practice of forest management. In this study, we completed spatial planning for the Jingouling forest farm of Wangqing Forestry Bureau in Jilin Province to realize dynamic management of forest resources, meet various constraints, and achieving multiple management objectives. At the same time, harvesting wood products can also ensure the ecological and social functions of the forest, so that the forest ultimately reaches the ideal state of sustainability.
The models we presented in this study consider forest polygons from a spatial perspective and assign forest systems, rotation periods, stand growth, and harvest to each sub-compartment. A stochastic heuristic algorithm was used to search the classification, logging sequence and the harvest plan arrangement according tho the priority. With these models and algorithms to calculate the Jingouling forest farm in a time cycle of 10 years, we can reflect the changes of all small classes and forest classes in the planning period accurately and dynamically and display these data in the graph. This method is relatively practical the search speed is very fast, with the case of 1,334 small classes of the farm, the 200 year planning period for searching and calculating time is approximately 3–4 s.
Meanwhile, six goals such as volume stock, forest area, carbon storage, ecological succession harvest quantity, and biodiversity conservation are achieved. Moreover, the reasonable computational time for seeking a feasible and near-optimal solution is the main contributor to using a stochastic heuristic algorithm.
Due to the complexity of ecosystems and the limitations of understanding ecosystem dynamics, the information provided by the decision support system is limited, as is the expression ability of the growth model. However, this hierarchical search model framework can effectively solve the impact of uncertainty in forest ecosystem and natural disturbances related to climate change on forest management and propose the most effective forest spatial planning scheme.
Finally, national or local forestry organizations are considering heuristic techniques to provide management decisions. Therefore, a set of objectives and constraints associated with their management strategy, influenced either by regulations or policies, as demonstrated in our study, six objectives and some spatial and non-spatial constraints were set up for the forest farm, which can quantify unite-level forest management policies and strategies.
Data availability statement
The original contributions presented in the study are included in the article/supplementary material, further inquiries can be directed to the corresponding author/s.
Author contributions
JL: Conceptualization, Data curation, Formal analysis, Funding acquisition, Methodology, Project administration, Supervision, Writing – original draft, Writing – review & editing. HZ: Data curation, Formal analysis, Software, Writing – original draft.
Funding
The author(s) declare that financial support was received for the research, authorship, and/or publication of this article. This research was funded by National Key R&D Program of China (Grant no. 2022YFD2200502).
Acknowledgments
The authors thank Huiru Zhang from the Chinese Academy of Forestry for guiding topic selection.
Conflict of interest
The authors declare that the research was conducted in the absence of any commercial or financial relationships that could be construed as a potential conflict of interest.
Publisher’s note
All claims expressed in this article are solely those of the authors and do not necessarily represent those of their affiliated organizations, or those of the publisher, the editors and the reviewers. Any product that may be evaluated in this article, or claim that may be made by its manufacturer, is not guaranteed or endorsed by the publisher.
References
Barrett, T. M., Gilless, J. K., and Davis, L. S. (1998). Economic and fragmentation effects of clearcut restrictions. For. Sci. 44, 569–577. doi: 10.1093/forestscience/44.4.569
Bettinger, P., Boston, K., Siry, J. P., and Grebner, D. L. (2016). Forest management and planning : Academic press.
Bettinger, P., Graetz, D., Boston, K., Sessions, J., and Chung, W. (2002). Eight heuristic planning techniques applied to three increasingly difficult wildlife planning problems. Silva Fennica. 36, 561–584. doi: 10.1007/978-94-017-0307-9_24
Bettinger, P., and Sessions, J. (2003). Spatial forest planning: to adopt, or not to adopt? J. Forestry. 101, 24–29. doi: 10.1093/jof/101.2.24
Bettinger, P., and Chung, W. (2004). The key literature of, and trends in, forest-level management planning in north america, Int. For. Rev. 1950–2001.
Borges, J. G., and Hoganson, H. M. (1999). Assessing the impact of management unit design and adjacency constraints on forestwide spatial conditions and timber revenues. Can. J. For. Res. 29, 1764–1774. doi: 10.1139/x99-131
Boston, K., and Bettinger, P. (2001). The economic impact of green-up constraints in the southeastern United States. For. Ecol. Manag. 145, 191–202. doi: 10.1016/S0378-1127(00)00417-5
Bunnell, F. L., and Boyland, M. (2002). Decision support systems: it’s the question, not the model. J. Nat. Conserv. 10, 269–279. doi: 10.1078/1617-1381-00027
Crowe, K., Nelson, J., and Boyland, M., (2003). Solving the area-restricted harvest scheduling model using the branch and bound algorithm. Can. J. For. Res. 33, 1804–1814. doi: 10.1139/x03-101
Deng, D. Q., Ye, C. C., Tong, K. M., and Zhang, J. Y. (2023). Evaluation of the sustainable forest management performance in forestry enterprises based on a hybrid multi-criteria decision-making model: a case study in China. Forests 14:2267. doi: 10.3390/f14112267
Dong, L. B., Sun, Y. X., and Liu, Z. G. (2017). Evaluating neighborhood search techniques of simulated annealing based on forest spatial harvest scheduling problems. J. Beijing Forestr. Univ. 39, 24–32. doi: 10.13332/j.1000-1522.20170095
Du, X. H. (2023). Decision modelling and analysis of carbon sequestration for Forest management. Adv. Comput. Signals Syst. 7, 52–64. doi: 10.23977/acss.2023.07050
Eid, T. (2000). Use of uncertain inventory data in forestry scenario models and consequential incorrect harvesting decisions. Silva Fenn. 34, 89–100. doi: 10.14214/sf.633
Galindo-Leal, C., and Bunnell, F. L. (1995). Ecosystem management: implications and opportunities of a new paradigm. For. Chron. 71, 601–606. doi: 10.5558/tfc71601-5
Guisan, A., and Zimmermann, N. E. (2000). Predictive habitat distribution models in ecology. Ecol. Model. 135, 147–186. doi: 10.1016/S0304-3800(00)00354-9
Hof, J.G., and Joyce, L. A. (1993). A mixed-integer linear-programming approach for spatially optimizing wildlife and timber in managed forest ecosystems. For. Sci.
Hof, J., and Bevers, M., (2000). Optimal timber harvest scheduling with spatially defined sediment objectives. Can. J. For. Res. 30, 1494–1500. doi: 10.1139/x00-065
John, H., Michael, B., Linda, J., and Brian, K., (1994). An integer programming approach for spatially and temporally optimizing wildlife populations. For. Sci. 177–191.
Kangas, J., Store, R., Leskinen, P., and Mehtatalo, L. (2000). Improving the quality of landscape ecological forest planning by utilizing advanced decision support tools. For. Ecol. Manag. 132, 157–171. doi: 10.1016/S0378-1127(99)00221-2
Kazana, V., Fawcett, R. H., and Mutch, W. E. S. (2003). A decision support modelling framework for multiple use forest management: the queen Elizabeth Forest case study in Scotland. Eur. J. Operat. Res. 148, 102–115. doi: 10.1016/S0377-2217(02)00348-X
Lamas, T., and Eriksson, L. O. (2003). Analysis and planning systems for multiresource, sustainable forestry: the Huereka research programme at SLU. Can. J. For. Res. 33, 500–508. doi: 10.1139/x02-213
Li, H., Gartner, D. I., Mou, P., and Trettin, C. (2000). A landscape model (LEEMATH) to evaluate effects of management impacts on timber and wildlife habitat. Comput. Electron. Agric. 27, 263–292. doi: 10.1016/S0168-1699(00)00088-0
Lin, Y., and Wiegand, K. (2021). Towards 3D tree spatial pattern analysis: setting the cornerstone of LiDAR advancing 3D forest structural and spatial ecology. Int. J. Appl. Earth Obs. Geoinf. 103:102506. doi: 10.1016/j.jag.2021.102506
Martinez, D. J., Middleton, B. R., and Battles, J. J. (2023). Environmental justice in Forest management decision-making: challenges and opportunities in California. Soc. Nat. Res. 12, 1617–1641. doi: 10.1080/08941920.2023.2203103
Nelson, J. (2003). Forest-level models and challenges for their successful application. Can. J. For. Res. 33, 422–429. doi: 10.1139/x02-212
O’Neill, R. V., DeAngelis, D. L., Waide, J. B., and Allen, T. F. H. (1986). A hierarchical concept of ecosystems. Princeton: Princeton University Press.
Ohman, K. (2001). Forest planning with consideration to spatial relationships. Doctoral Thesis. Umea: Swedish University of Agricultural Sciences.
Pukkala, T., Lähde, E., and Laiho, O. (2014). Stand management optimization—the role of simplifications. Forest Ecosystems. 1, 1–11. doi: 10.1186/2197-5620-1-3
Rauscher, H. M. (1999). Ecosystem management decision support for federal forests in the United States: a review. For. Ecol. Manag. 114, 173–197. doi: 10.1016/S0378-1127(98)00350-8
Rauscher, H. M., Lloyd, T., Loftis, D. L., and Twery, M. J. (2000). A practical decision-analyses process for forest ecosystem management. Comput. Electron. Agric. 27, 195–226. doi: 10.1016/S0168-1699(00)00108-3
Snyder, S., and ReVelle, C. (1997). Dynamic selection of harvests with adjacency restrictions: the SHARe model. For. Sci. 43, 213–222. doi: 10.1093/forestscience/43.2.213
Thomas, J. W. (1995). The Forest Service program for Forest and rangeland resources: a long-term strategic plan. Recommended 1995 RPA program. Washington, DC: USDA Forest Service.
Walters, C. J. (1986). Adaptive Management of Renewable Resources. New York: MacMillan Publishing Company.
Weintraub, A., and Bare, B. B. (1996). New issues in forest land management from an operations research perspective. Interfaces 26, 9–25. doi: 10.1287/inte.26.5.9
Yoshimoto, A., Asante, P., and Konoshima, M. (2016). Stand-level forest management planning approaches. Curr. For. Rep. 41, 1–14. doi: 10.1007/s40725-016-0041-0
Zhang, W. T., Shao, H. Q., Sun, H. T., Zhang, W., and Yan, Q. L. (2023). Optimizing carbon sequestration in forest management plans using advanced algorithms: a case study of greater Khingan mountains. Forests 14:1785. doi: 10.3390/f14091785
Keywords: decision-support system, spatial forest planning, multi-objective forest management, carbon management, carbon storage
Citation: Lu J and Zhang H (2024) Carbon storage-driven multi-objective spatial planning: simulation and practice at the management unit level in Northeast China. Front. For. Glob. Change. 7:1385142. doi: 10.3389/ffgc.2024.1385142
Edited by:
Manfred J. Lexer, University of Natural Resources and Life Sciences Vienna, AustriaReviewed by:
Huilin Gao, Shenyang Agricultural University, ChinaRonal Watrianthos, Padang State University, Indonesia
Copyright © 2024 Lu and Zhang. This is an open-access article distributed under the terms of the Creative Commons Attribution License (CC BY). The use, distribution or reproduction in other forums is permitted, provided the original author(s) and the copyright owner(s) are credited and that the original publication in this journal is cited, in accordance with accepted academic practice. No use, distribution or reproduction is permitted which does not comply with these terms.
*Correspondence: Hao Zhang, 2310684669@qq.com