 Xiaomei Li1
 Chunping Xie
 Xuefeng Liu
- 1Zhanjiang University of Science and Technology, Zhanjiang, China
- 2Research Institute of Fast-growing Trees, Chinese Academy of Forestry, Zhanjiang, China
- 3Tropical Biodiversity and Bioresource Utilization Laboratory, Qiongtai Normal University, Haikou, China
Introduction: Jacaranda mimosifolia, native to South America, is a notable ornamental tree widely used in Chinese urban landscaping due to its aesthetic and environmental value. Despite its popularity, the cultivation of J. mimosifolia in China faces challenges, including intermittent failures in various regions. This study assesses the potential distribution of J. mimosifolia in China and its response to climate change, providing insights for its application and promotion.
Methods: Using MaxEnt software, we developed an ecological niche model from 218 distribution records and selected 10 environmental variables to predict the tree’s distribution under various climate scenarios (SSP126, SSP245, SSP370).
Results: Our model demonstrates high predictive accuracy (AUC > 0.90) across scenarios, identifying key factors such as the mean temperature of the coldest quarter (bio11), precipitation of the driest month (bio14), temperature annual range (bio7), and minimum temperature of the coldest month (bio6). Their relative contribution rates were 49.3%, 18.4%, 15.6%, and 2.0%, respectively. The average temperature of the coldest quarter was not lower than 5°C, with the ideal range being 7.38~14.88°C. Currently, J. mimosifolia predominantly thrives in Taiwan, Fujian, Guangdong, Hainan, Guangxi, Yunnan, and to a lesser extent in the Sichuan Basin, southern Guizhou, Tibet, Hunan, Jiangxi, and Zhejiang province, covering a total area of approximately 122.19 × 10⁴ km2. Future predictions indicate that under the SSP126 scenario, the most significant contraction occurs between the 2050s and 2070s, with a total change of −1.08 × 10⁴ km2. Conversely, under the SSP370 scenario, the greatest expansion is observed from the 2030s to the 2050s, amounting to a change of 2.08 × 10⁴ km2. Suitable area expansion is anticipated in most periods and scenarios, except for SSP126 in the 2070s, SSP245 in the 2050s, and SSP370 in the 2030s and 2070s. The distribution center shifts observed include movements northwestward, southwestward, and eastward with distances ranging from 5.12 km to 18.84 km. These shifts are likely driven by global warming, resulting in movements to higher elevations and latitudes.
Discussion: These predictions will provide a solid theoretical foundation for the future application of J. mimosifolia in urban landscaping and serve as a valuable reference for its introduction and cultivation.
1 Introduction
Climate is a critical factor that directly and indirectly influences biodiversity. Continuous climate changes alter species’ geographical distributions and ecological behaviors, impacting community compositions, ecosystem structures, and biodiversity (Noce et al., 2023; Pérez Navarro et al., 2024). It is crucial to understand and predict species’ responses to climate change, including their potential distribution and migration, for their development, utilization, and conservation (La Montagna et al., 2023). In particular, when introducing plants to unfamiliar regions, in order to perfectly replicate growth, flowering, and fruiting, and to leverage their landscape advantages, growers must understand their ecological characteristics to adapt to local climatic, soil, and moisture conditions. Public awareness of biodiversity conservation continues to grow in response to ecological changes. Ecological niche models are widely used in biodiversity conservation research. These models are used to study invasive pests’ threats to plants and to predict species distribution changes due to climate change (Xu et al., 2019). Research confirms that inevitable global warming will shift plant distributions toward higher altitudes and latitudes (Piao and Wang, 2023). The annual minimum temperature is now a primary factor limiting species’ suitable habitat distribution. With ongoing climate change, species’ distribution areas and the ranges of tender plants are continually adapting (Puchalka et al., 2021).
Species Distribution Models (SDMs) map habitats that fulfill the survival requirements of species based on data (Syphard and Franklin, 2009; Peng et al., 2024). These models determine the actual distribution of species by analyzing the relationship between observed distribution data and environmental factors. Additionally, they utilize this data to predict the potential future distribution of species within the study area. SDMs support biogeographical studies across past, present, and future timelines. Advances in geographic spatial technologies and ecological niche modeling have expanded the applications of various models. These models are widely used in habitat distribution modeling and include several applications across different studies: Ecological Niche Factor Analysis (ENFA) was applied to Passeriformes (Micaela Rosas et al., 2023). Genetic Algorithm for Rule-Set Production (GARP) was applied to infectious diseases, mosquito species, and Cryptosporidiosis (Lawrence et al., 2023; Lippi et al., 2023; Wang et al., 2023). Random Forest was used to model Nevada tree species distributions, Aphelocoma coerulescens, Icterine Warbler, Quercus brantii Lindl., and Ginkgo biloba L. (Freeman et al., 2012; Bucklin et al., 2015; Kosicki, 2017; Mirhashemi et al., 2023; Zhang et al., 2023). BIOCLIM was applied to Ixora, J. mimosifolia and Mimosa bimucronata (DC). Kuntze (Banag et al., 2015; Xie et al., 2021; Xie et al., 2023). DOMAIN was applied to Mimosa bimucronata (DC.) Kuntze (Xie et al., 2023). The MaxEnt model was applied to Pinus massoniana Lamb., groundfish, Emeia pseudosauteri, and other species (Chi et al., 2023; Harris et al., 2023; Li et al., 2023).
The MaxEnt model was specifically chosen for this study due to its robust performance with limited presence data and its capability to produce reliable projections under uncertain conditions. MaxEnt, an ecological niche model, simulates species’ potential geographic distributions by utilizing environmental variables, species records, machine learning, and the maximum entropy principle (Merow and Silander, 2014; He et al., 2023; Wen et al., 2024). It outperforms other models in terms of accuracy and computation speed and is effective even with limited data points (Fox et al., 2023). MaxEnt is particularly suitable for predicting species distributions when comprehensive environmental and species occurrence data are scarce because it efficiently handles incomplete datasets and can generate detailed probability distributions. Currently, MaxEnt is widely applied in research areas such as predicting animal habitats, pest control, conservation of endangered species, and management of invasive species.
Jacaranda mimosifolia D. Don, a deciduous tree from the Bignoniaceae family, is celebrated for its bluish-purple flowers and extensive use as an ornamental garden tree (Bittencourt, 2019; Ragsac et al., 2019). J. mimosifolia’s rising popularity in China has led many universities and city parks to feature it in their landscapes, resulting in various themed landscapes centered around this tree. The ecology of the Jacaranda has not been thoroughly studied in China, whereas in other parts of the world, it has been well researched (Kendal et al., 2012; Carón et al., 2018; Garcia-Rojas et al., 2022). Consequently, knowledge about how environmental factors influence the growth of Mimosa pudica remains limited. Furthermore, the ecological adaptability of this tree is poorly understood, intermittently resulting in its cultivation and promotion failures. While research has extensively covered the ecological functions, growth, reproduction, and medicinal properties of J. mimosifolia (Olowoyo et al., 2010; Mostafa et al., 2015; Bittencourt, 2019; Aguirre-Becerra et al., 2020; Farias et al., 2020; Fauerharmel et al., 2020; Cavalcante et al., 2021; Naz et al., 2021), studies on its growth adaptations and geographic distribution remain scarce. Only a few studies have used the BIOCLIM model to predict J. mimosifolia’s potential range in China’s current climate (Xie et al., 2021). Moreover, we used the MaxEnt model, which is noted to be more accurate than the BIOCLIM model, and the climate data we utilized were the Shared Socio-Economic Pathways (SSPs) introduced by the Intergovernmental Panel on Climate Change (IPCC) in 2022 (Kikstra et al., 2022). These data were developed based on the Representative Concentration Pathways (RCPs) scenarios to address their shortcomings. Therefore, the results of this study are expected to be more credible, and by building on the work of previous researchers, the potential geographic distribution and migration routes of J. mimosifolia under future climate conditions have been predicted. This analysis further refines the theory of the geographic distribution of J. mimosifolia.
Modeling projections are crucial for understanding how climate change will alter the geographic distribution of tree species within urban forestry, an essential factor for ensuring their sustainability (Deb et al., 2017). Gaining insights into the potential habitats of these species under future climatic conditions not only facilitates the development of adaptive management strategies but also provides a scientific basis for timing their flowering phases. These measures are aligned with the long-term objectives of urban forestry. This study employs the MaxEnt model, ENMTools R Language, and ArcGIS to predict potential distribution areas and identify key climatic limitations for J. mimosifolia. Additionally, it simulates and analyzes shifts in potential range, habitat changes, distribution centers, and migratory routes under various future climate scenarios. These efforts will enhance our understanding of J. mimosifolia distribution patterns, which is essential for advancing scientific knowledge on its spatial cultivation and maximizing its potential for development and utilization. The objectives of our research are: (1) To identify the principal environmental factors influencing the distribution of J. mimosifolia; (2) To predict the present and future distributional ranges of J. mimosifolia; (3) To elucidate shifts in the distribution centers of J. mimosifolia. Our study aims to contribute to the conservation and sustainable use of J. mimosifolia and to inform management strategies for this species.
2 Materials and methods
2.1 Study area
The study area is situated in South China and includes Guangdong, Sichuan, Jiangxi, Chongqing, Yunnan, Guangxi, Guizhou, Hainan, Fujian, and Taiwan. The climate ranges from subtropical to tropical. In coastal regions such as Guangdong, Fujian, and Taiwan, monsoonal influences predominantly result in high humidity. Sichuan Basin experiences subtropical monsoon climate, characterized by moist summers and dry winters. Additionally, Yunnan-Kweichow Plateau display a mountain climate with significant temperature variations and sporadic precipitation. The coastal areas of Guangdong and Fujian is sandy soils. The Sichuan Basin is characterized by its fertile purple soils. Conversely, the mountainous regions of Yunnan and Guizhou contain shallow, less fertile limestone soils.
2.2 Data sources
Several sources were used to compile distribution data for J. mimosifolia, including the FRPS (http://www.iplant.cn/frps), CVH (http://www.cvh.ac.cn/class), PPBC (http://ppbc.iplant.cn/), CFH (http://www.cfh.ac.cn/), NSII (http://www.iplant.cn/frps), relevant references, and years of field survey records. The distribution data were divided into three sections and filtered using ENMTools to eliminate duplicate and invalid distribution points. After filtering, the remaining 218 distribution points were converted to CSV format for further data analysis. These records were carefully selected from reliable databases and field observations, focusing on areas where the species thrives. Our study used 22 environmental variables (Table 1), including 19 meteorological and 3 topographical variables. We used the obtained distribution data to create distribution maps in ArcGIS 10.7 (Figure 1).

Table 1. Environmental variables used for the initial construction of the MaxEnt model.
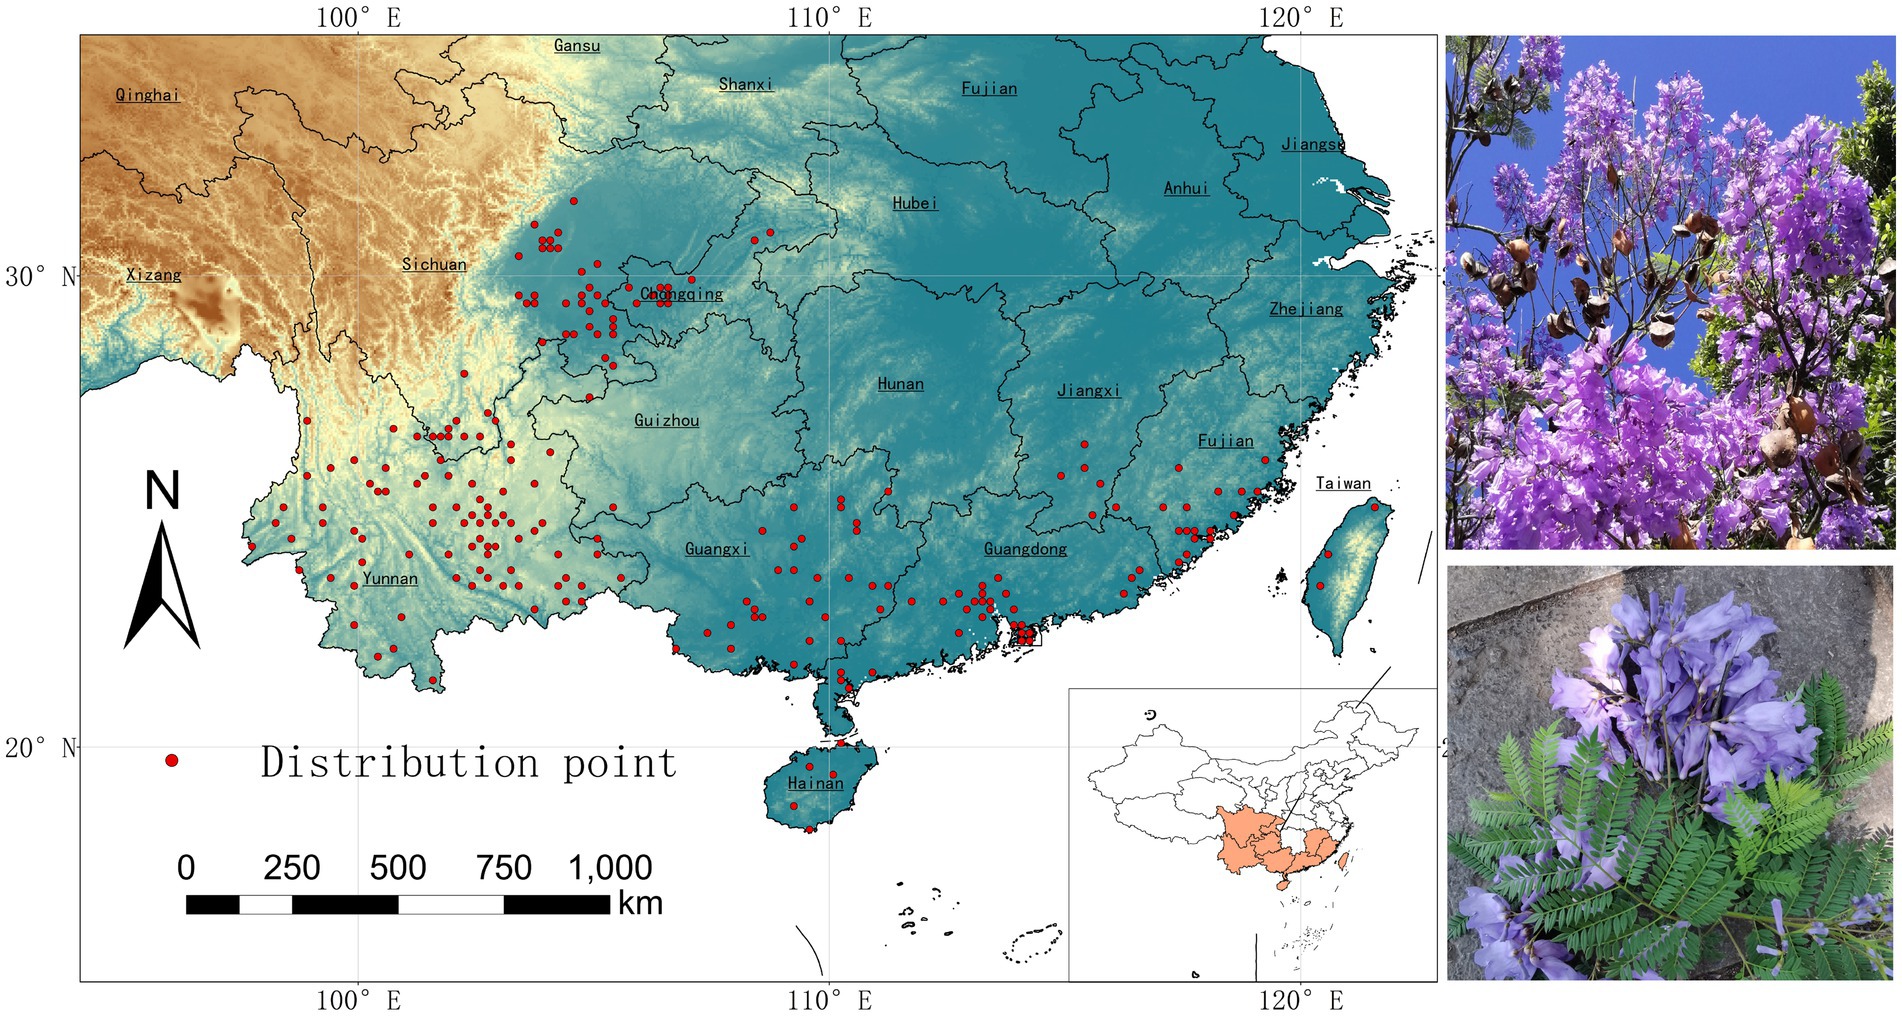
Figure 1. Locations of 218 selected occurrence records (shown by red circles) of J. mimosifolia in China. Images on the left show the species’ flowers, leaves and a small patch of the species.
Climate data were sourced from the World Climate Database (https://worldclim.org; Table 1), while topography data were acquired from the Computer Network Information Center of the Chinese Academy of Sciences (CNIC) and the International Scientific Data Website (http://www.gscloud.cn/). The future climate data for the periods 2021–2040 and 2061–2080 were generated using the Sixth International Coupled Model Comparison Program (CMIP6), based on the BCC-CSM2-MR climate model and the Shared Socioeconomic Pathways (SSPs). To better analyze the frequency and intensity of climate change, we used the CMIP6 dataset. These scenarios represent the lowest and highest limits of the Shared Socio-economic Pathways. This study focused on three of the four emission scenarios outlined in the IPCC 6th Assessment Report—SSP126, SSP245, and SSP370—excluding SSP585. The dataset included information from 218 distribution points of J. mimosifolia, which were imported into ArcGIS to extract data for 22 bioenvironmental variables. Variables such as temperature, rainfall, and seasonal variation were considered due to their frequent use in assessing the potential distribution of species and are crucial for understanding annual patterns, seasonality, and species tolerance to extremes in temperature and precipitation.
2.3 Selection of environmental variables and data processing
The high spatial correlation among environmental variables can introduce complexity and irrelevant information, potentially compromising the accuracy of model projections (Figure 2). To enhance precision, we used ENMTools 1.4.4 software and the ggcorrplot package in R to analyze and visualize the correlations between the 22 environmental variables (Figure 3). We excluded environmental variables with a correlation coefficient (r) > 0.8 and used the remaining ten variables in subsequent optimization simulations (Table 2).
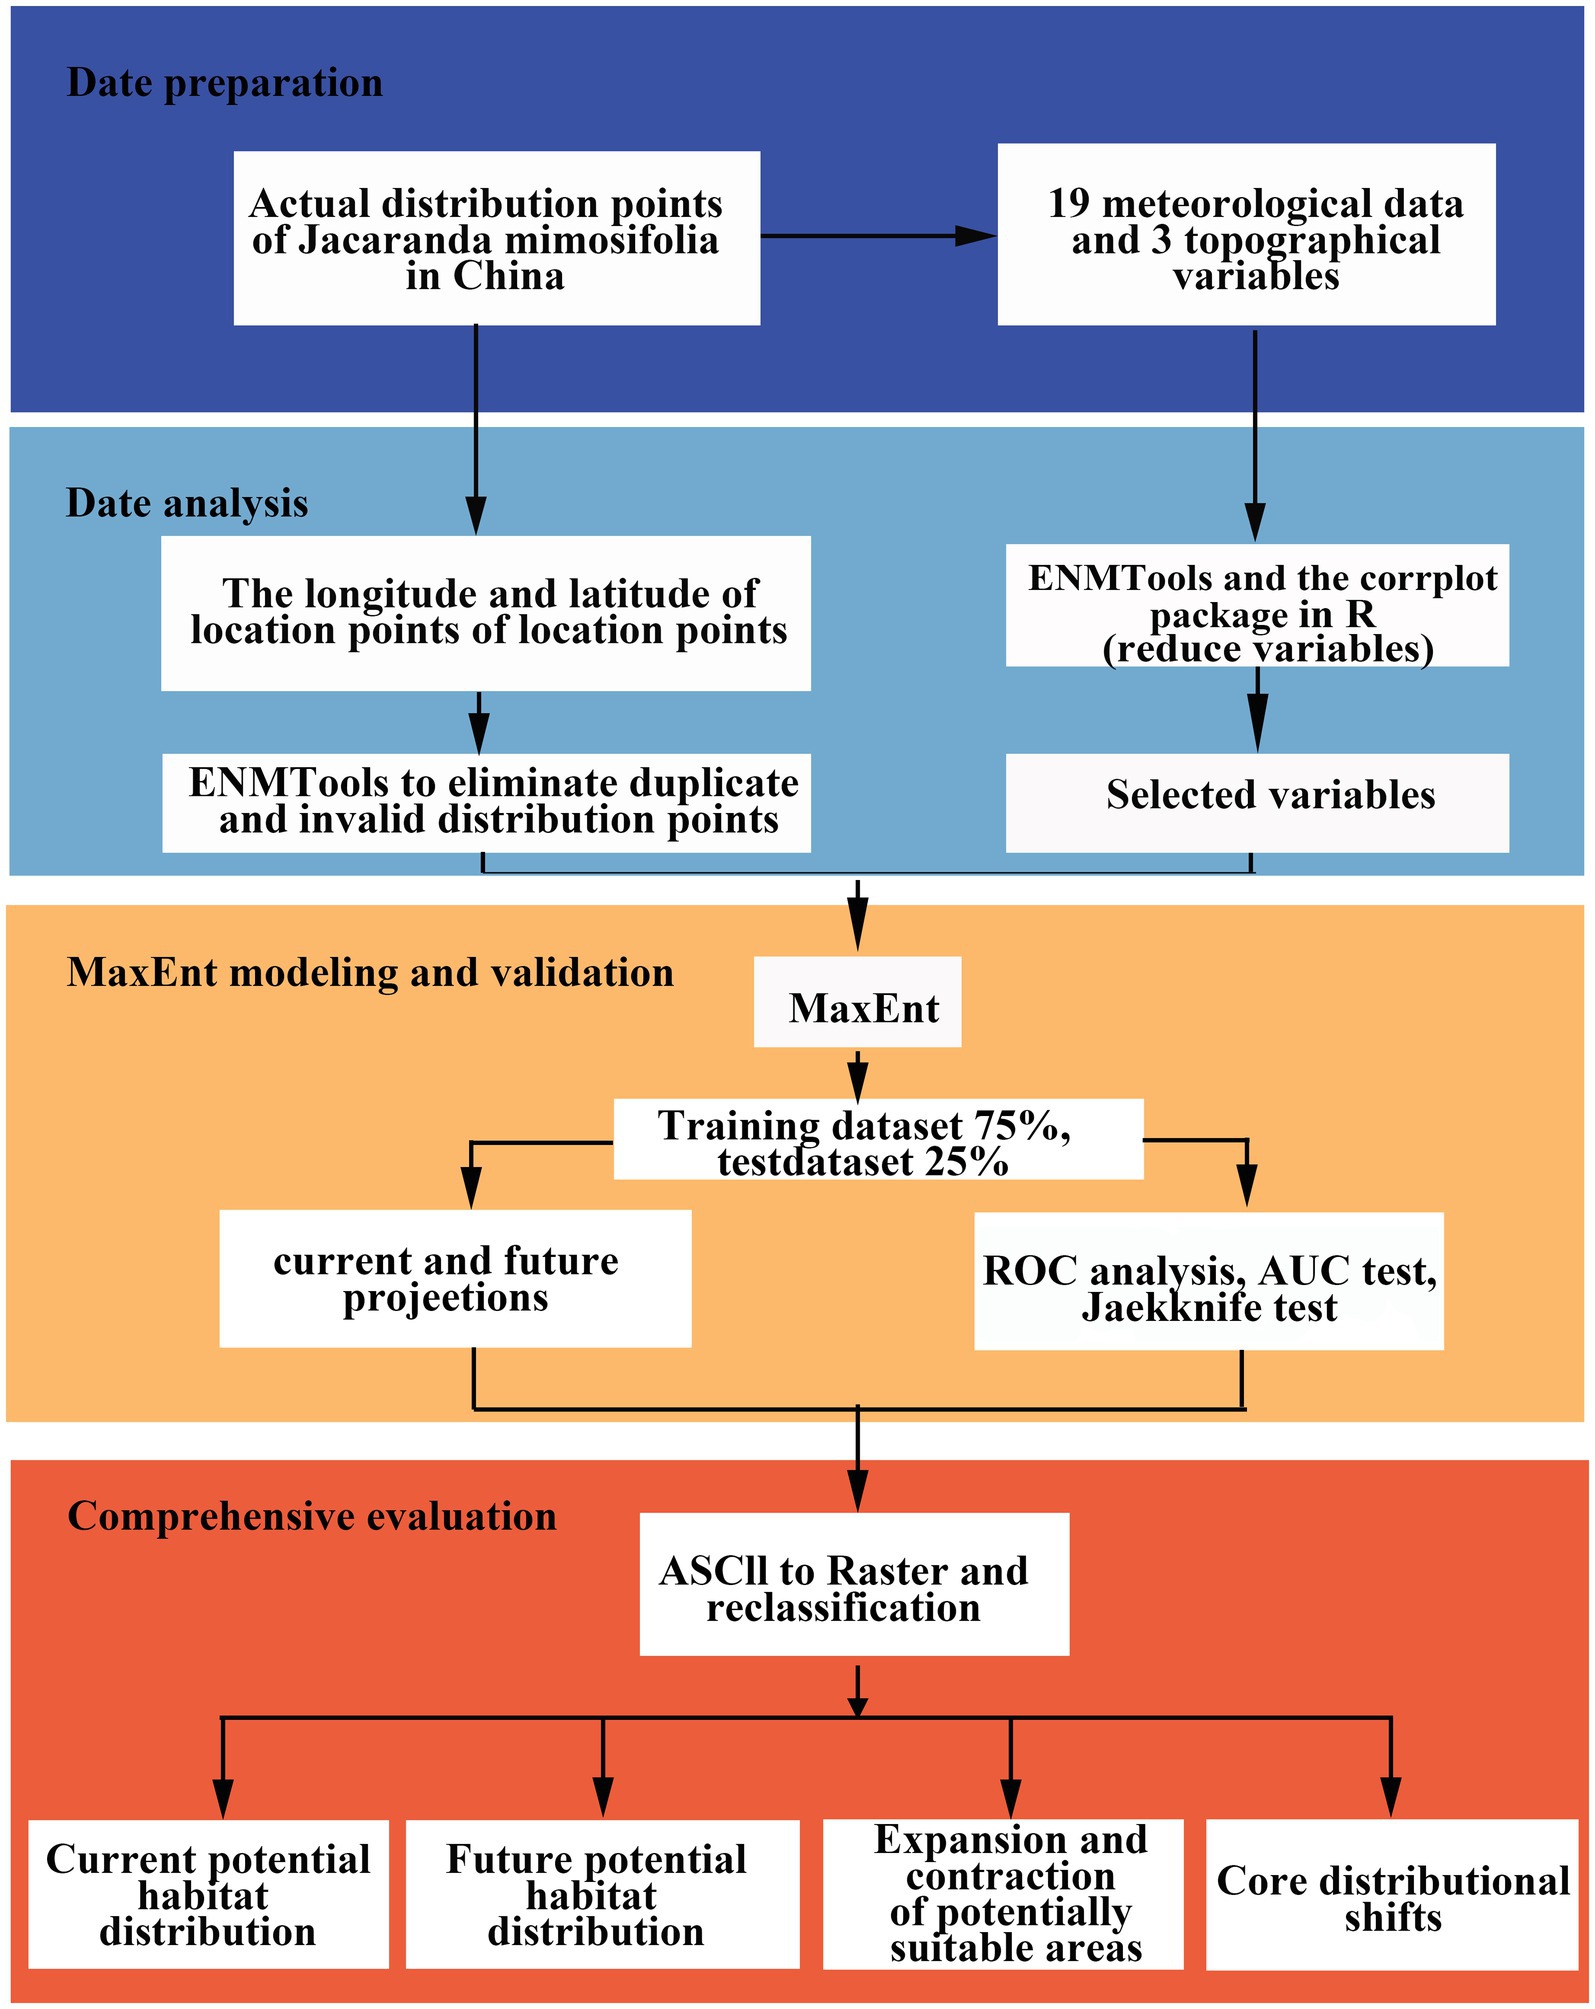
Figure 2. Processing methodology inflow diagram.
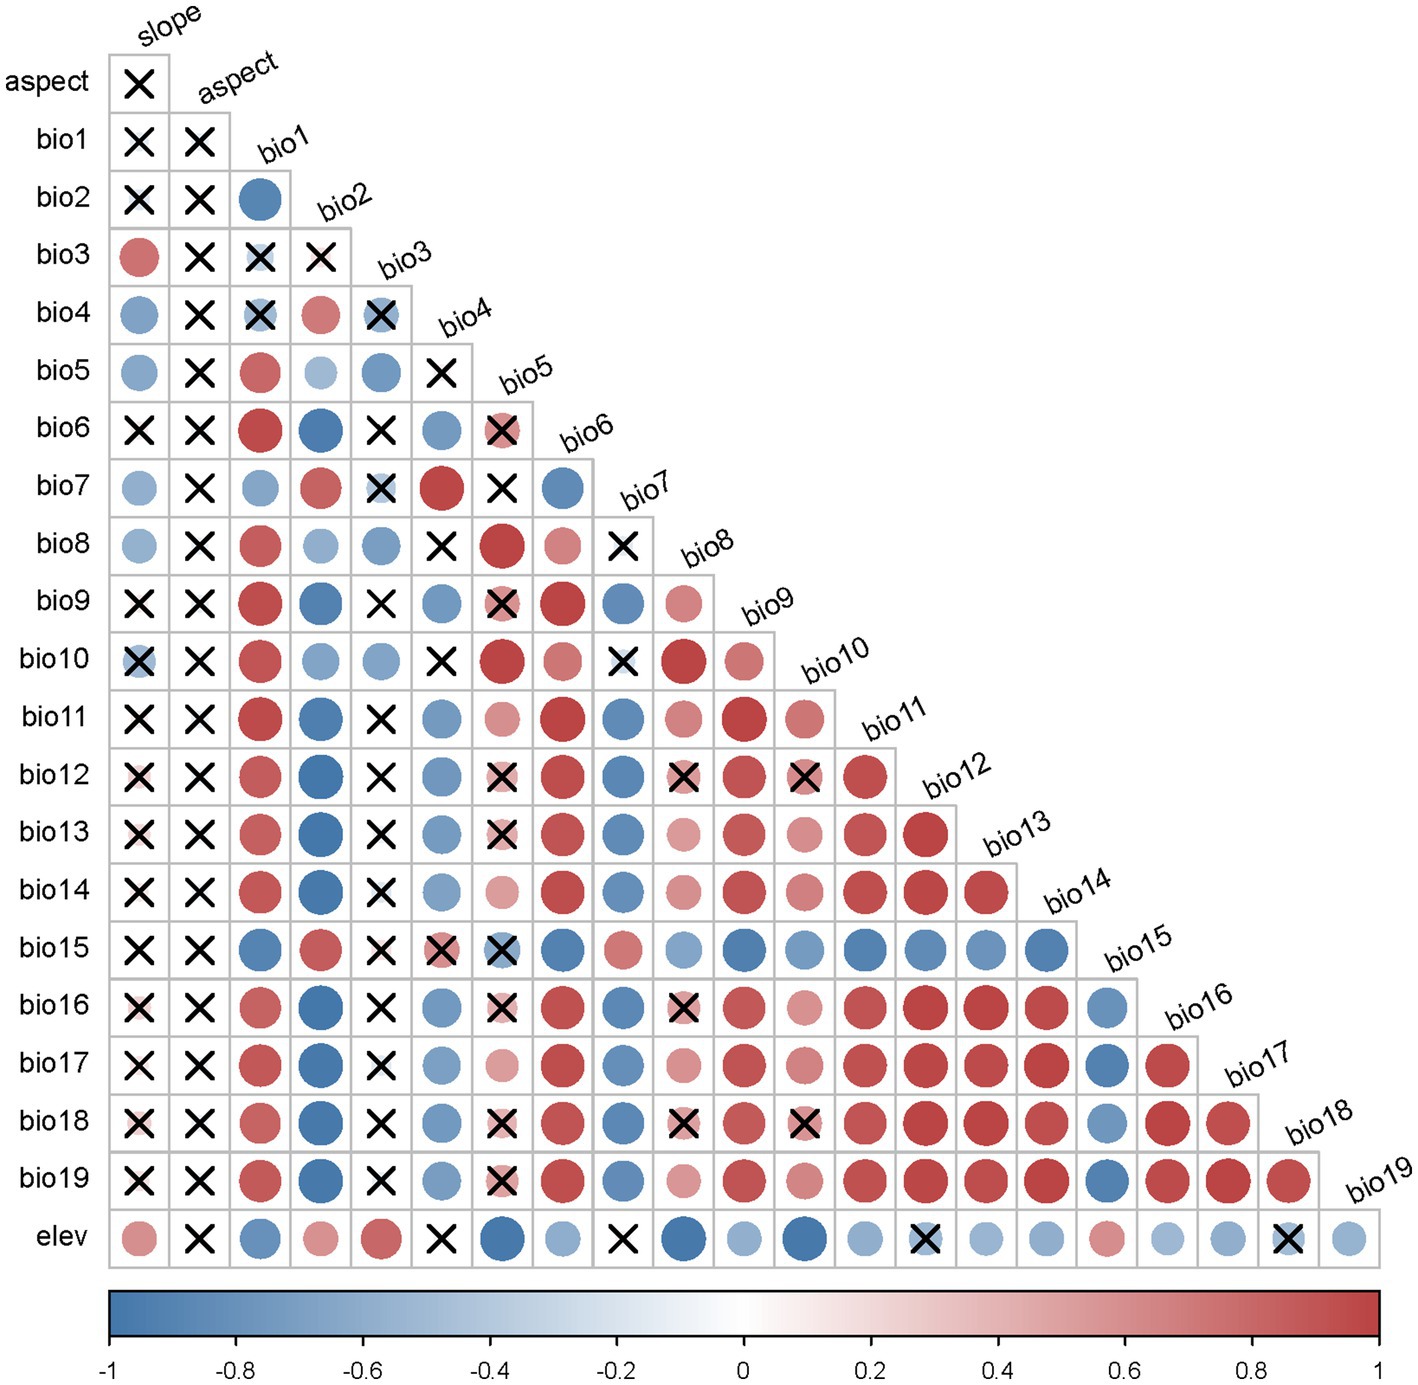
Figure 3. Heat map of the Pearson correlation of the nine environment variables involved in MaxEnt modeling. The explanations of these environmental variables are provided in Table 3.
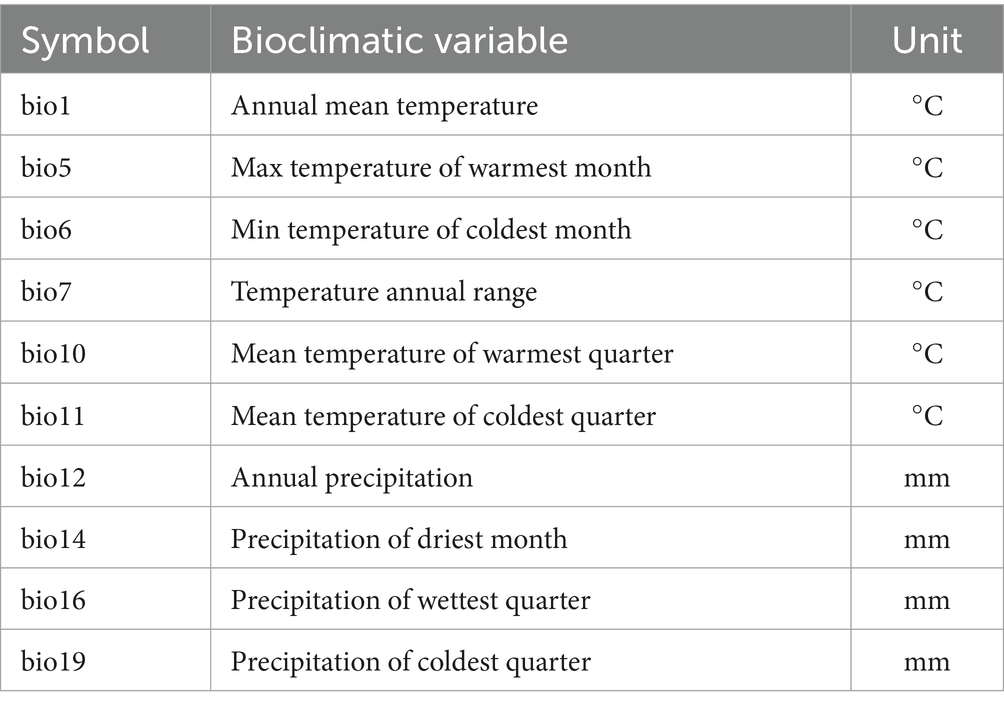
Table 2. Environmental variables considered for modeling the potentially suitable habitat of Jacaranda mimosifolia.
2.4 Model design, construction, and accuracy evaluation
We used the MaxEnt 3.4.1 program to simulate the potential habitat of J. mimosifolia in China for the current period (1970–2000) and future periods. The future periods considered were the 2030s (2021–2040), the 2050s (2041–2060), and the 2070s (2061–2080), each corresponding to the SSP126, SSP245, and SSP370 emission scenarios, totaling 10 periods. We assessed the model’s accuracy using the ROC curve and the associated area under the curve (AUC) value. The jackknife test was employed to evaluate the ecological factor weights within the model, with AUC values ranging from 0 to 1; larger values indicate more accurate predictions. Based on previous studies (Zhang et al., 2018), we classified the credibility of the predicted results as follows: an AUC value ≤0.6 indicates non-credible results; 0.6 < AUC value ≤0.7 indicates low credibility; 0.7 < AUC value ≤0.8 indicates credible results; 0.8 < AUC value ≤0.9 indicates high credibility; and 0.9 < AUC value ≤1 indicates extremely credible results (Reiss et al., 2011).
2.5 Delineation of suitable distribution areas
We used ArcGIS 10.7 to visualize the simulation results of the model. The predicted results were classified into four suitability classes: Habitat suitability between 0 and 0.1 denoted the unsuitable area, between 0.1 and 0.3 denoted the low suitability area, between 0.3 and 0.5 denoted the moderate suitability area, and between 0.5 and 1 corresponded to the high suitability area (Wu et al., 2022). The SDM toolbox in ArcGIS 10.7 was used to investigate potential changes in the spatial distribution of suitable habitats for J. mimosifolia in China across the ten periods studied, identifying the stabilized, expanded, and shrunken distribution areas of J. mimosifolia. Changes in suitable habitats were analyzed by examining their location and direction, with results quantified using vector analysis. Additionally, a migration map of the suitable areas under different climate scenarios was also constructed (Liao et al., 2020; Santini et al., 2021).
3 Results
3.1 Model accuracy test
The MaxEnt model software was used to simulate the current distribution of J. mimosifolia in China based on 218 data points and 10 environmental variables. The average AUC value was 0.956 in 10 repeats (Figure 4) and consistently above 0.90 in all periods, demonstrating the exceptional predictive accuracy of the MaxEnt model.
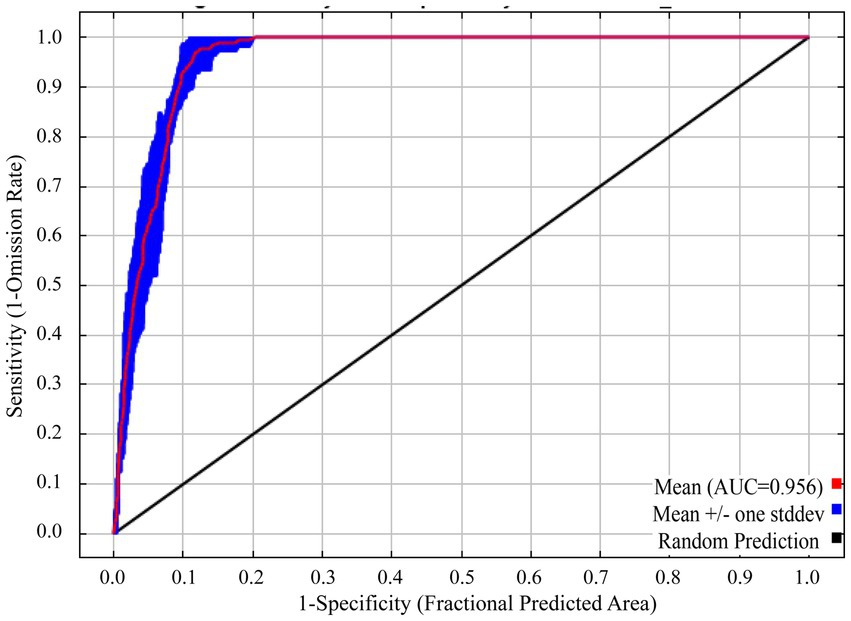
Figure 4. AUC curves in the developing Jacaranda mimosifolia distribution model. The red (training) line shows the fit of the model to the training data, while the blue (testing) line indicates the fit of the model to the testing data, serving as the real test of the model’s predictive power.
3.2 Limiting climatic factors affecting the distribution of Jacaranda mimosifolia
The MaxEnt model was used to calculate the relative contribution of environmental variables to species distribution and to perform correlation tests. The findings revealed that the primary environmental parameters influencing the geographic distribution of J. mimosifolia were mean temperature of coldest quarter (bio11), precipitation of driest month (bio14), temperature annual range (bio7), and annual precipitation (bio12). These variables accounted for 90.9% of the variance and had a high-ranking significance value of 94.4. The mean coldest quarterly temperature (bio11) had the highest contribution value of 49.3%, followed by 18.4% for precipitation of driest month (bio14) and 15.6% for temperature annual range (bio7). The mean coldest quarterly temperature (bio11) recorded the highest importance value of 68.0, followed by the temperature annual range (bio7) at 19.0 (Table 3).
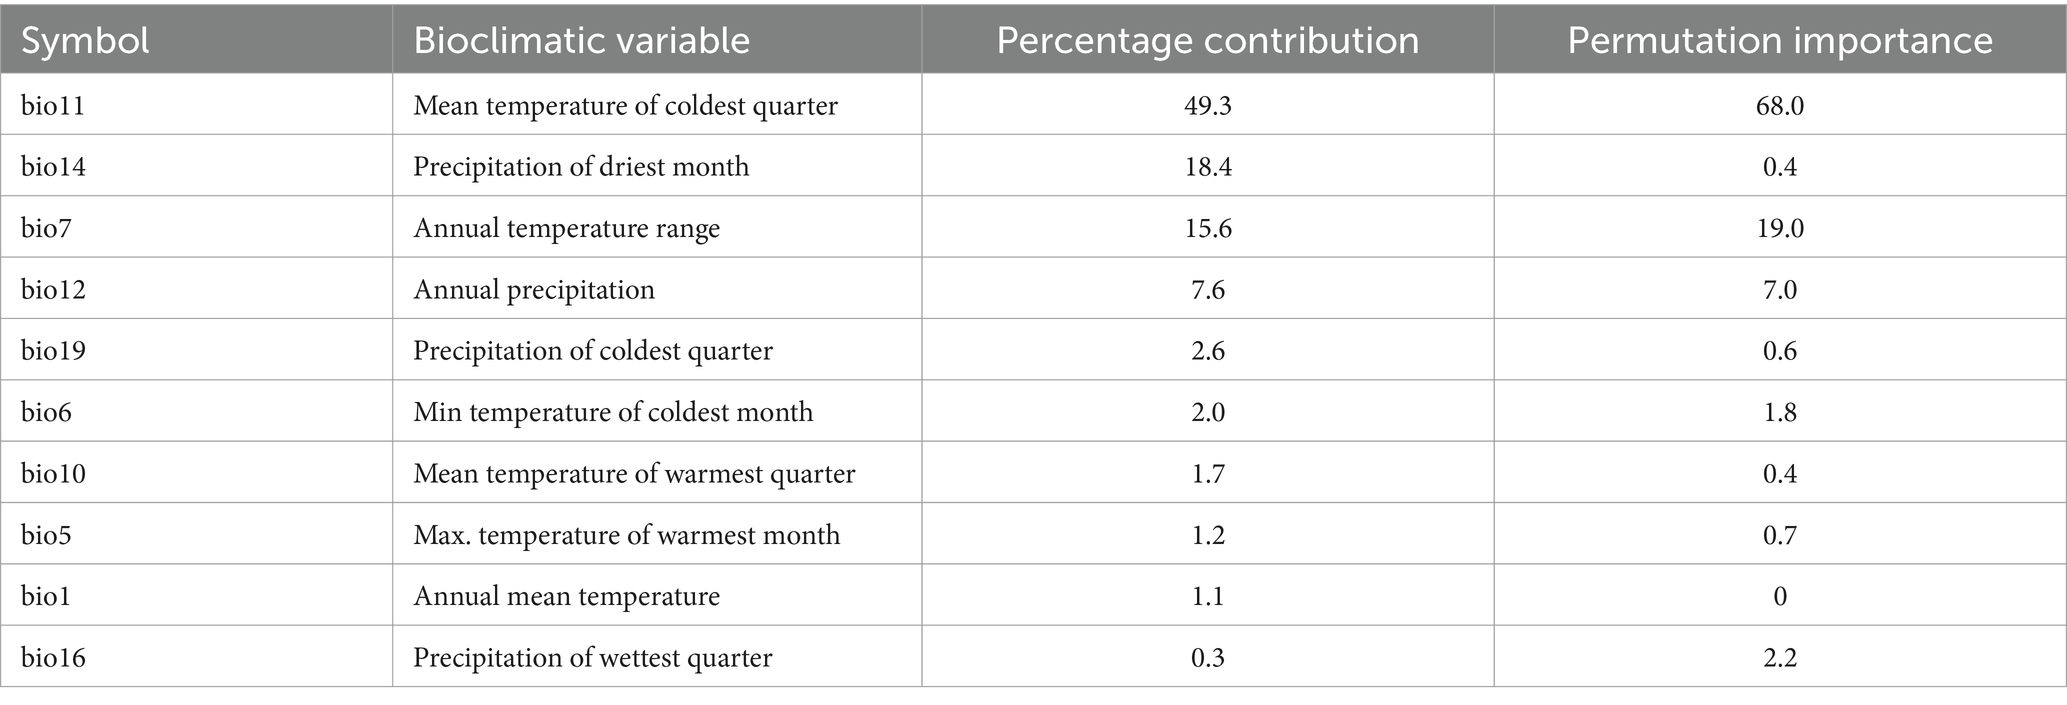
Table 3. The percentage contribution and permutaion importance of environmental variables of Jacaranda mimosifolia in the fitted MaxEnt model.
The jackknife test was used to analyze the 10 selected environmental variables (Figure 5). The results show that the mean temperature of coldest quarter (bio11) exhibited the highest score for a positive regularization training gain. Temperature annual range (bio7) and minimum temperature of coldest month (bio6) were close behind, demonstrating their influence on the distribution of J. mimosifolia. In summary, the primary environmental factors that exert influence on the distribution of J. mimosifolia can be delineated into four predominant variables. These variables encompass the following: Mean Temperature of the Coldest Quarter (bio11), Temperature Annual Range (bio7), Minimum Temperature of the Coldest Month (bio6), and Precipitation of the Driest Month (bio14). Notably, these factors encompass three temperature indicators and one moisture indicator.
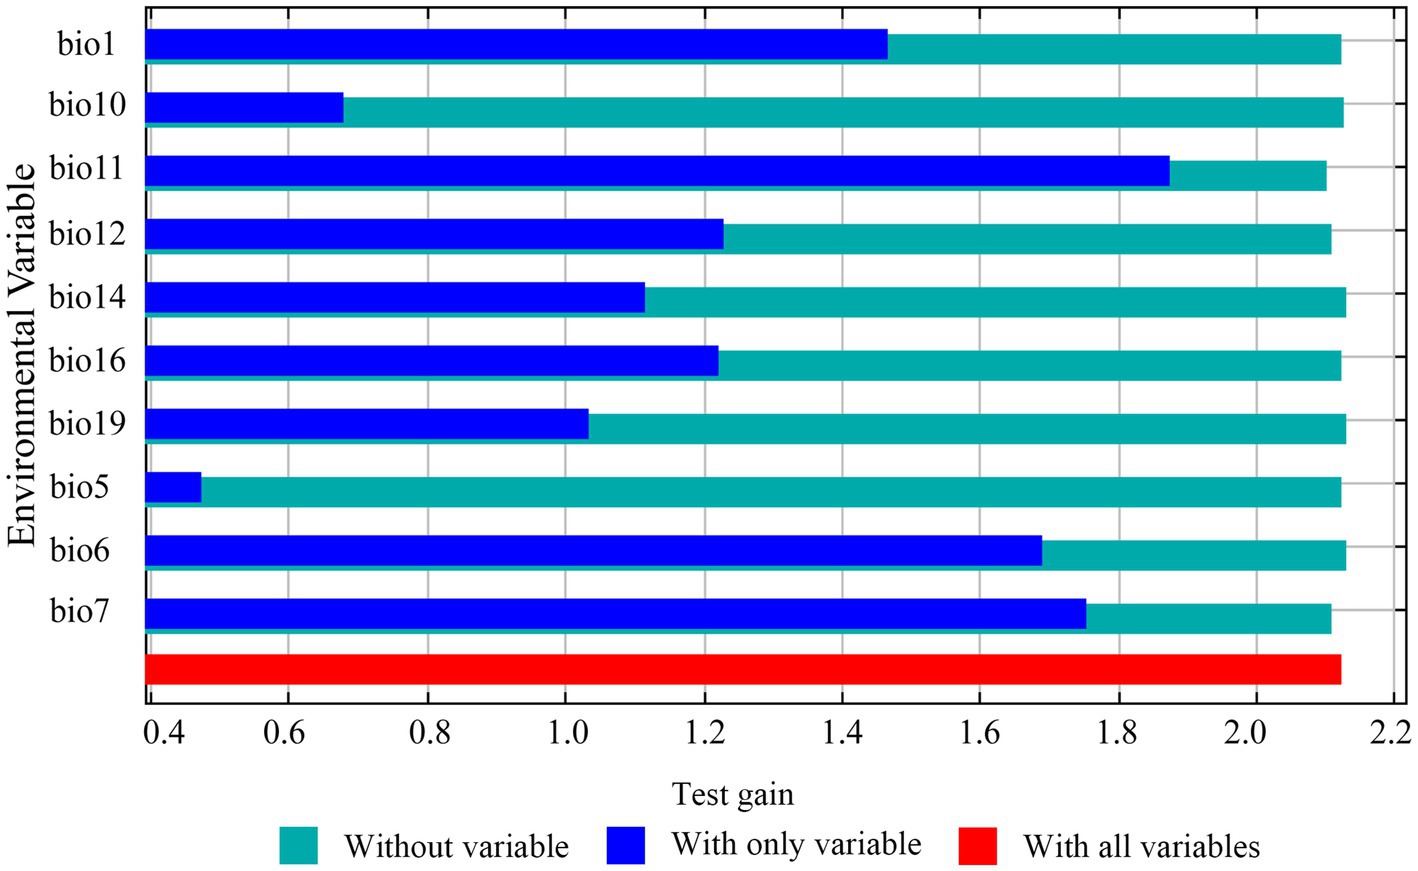
Figure 5. Jackknife test results for variable contributions in Jacaranda mimosifolia distribution modeling. (The regularized training gain measures the improvement of the MaxEnt distribution fit over a uniform distribution. Dark blue bars indicate the gain from using each variable in isolation, light blue bars indicate the gain lost when a single variable is removed from the full model, and the red bar indicates the gain when using all variables).
3.3 Main climatic parameters and suitable ranges
The MaxEnt model and correlation test identified four primary climatic factors influencing the distribution of J. mimosifolia (Figure 6): mean temperature of coldest quarter (bio11), temperature annual range (bio7), minimum temperature of coldest month (bio6), and precipitation of driest month (bio14). These factors included three temperature indicators and one moisture indicator. Temperature accounted for 75% of all parameters. The optimal ranges for bio11, bio7, and bio6 were 7.38–14.88°C, 20.96–26.89°C, and 1.25–9.68°C, respectively (Table 4). The data shows that while J. mimosifolia is cold-tolerant it thrives in warmer climates. The optimal range for bio14 was 3.61–38.39 mm, indicating that J. mimosifolia also requires moisture; however, temperature exerts a greater influence on moisture requirements.
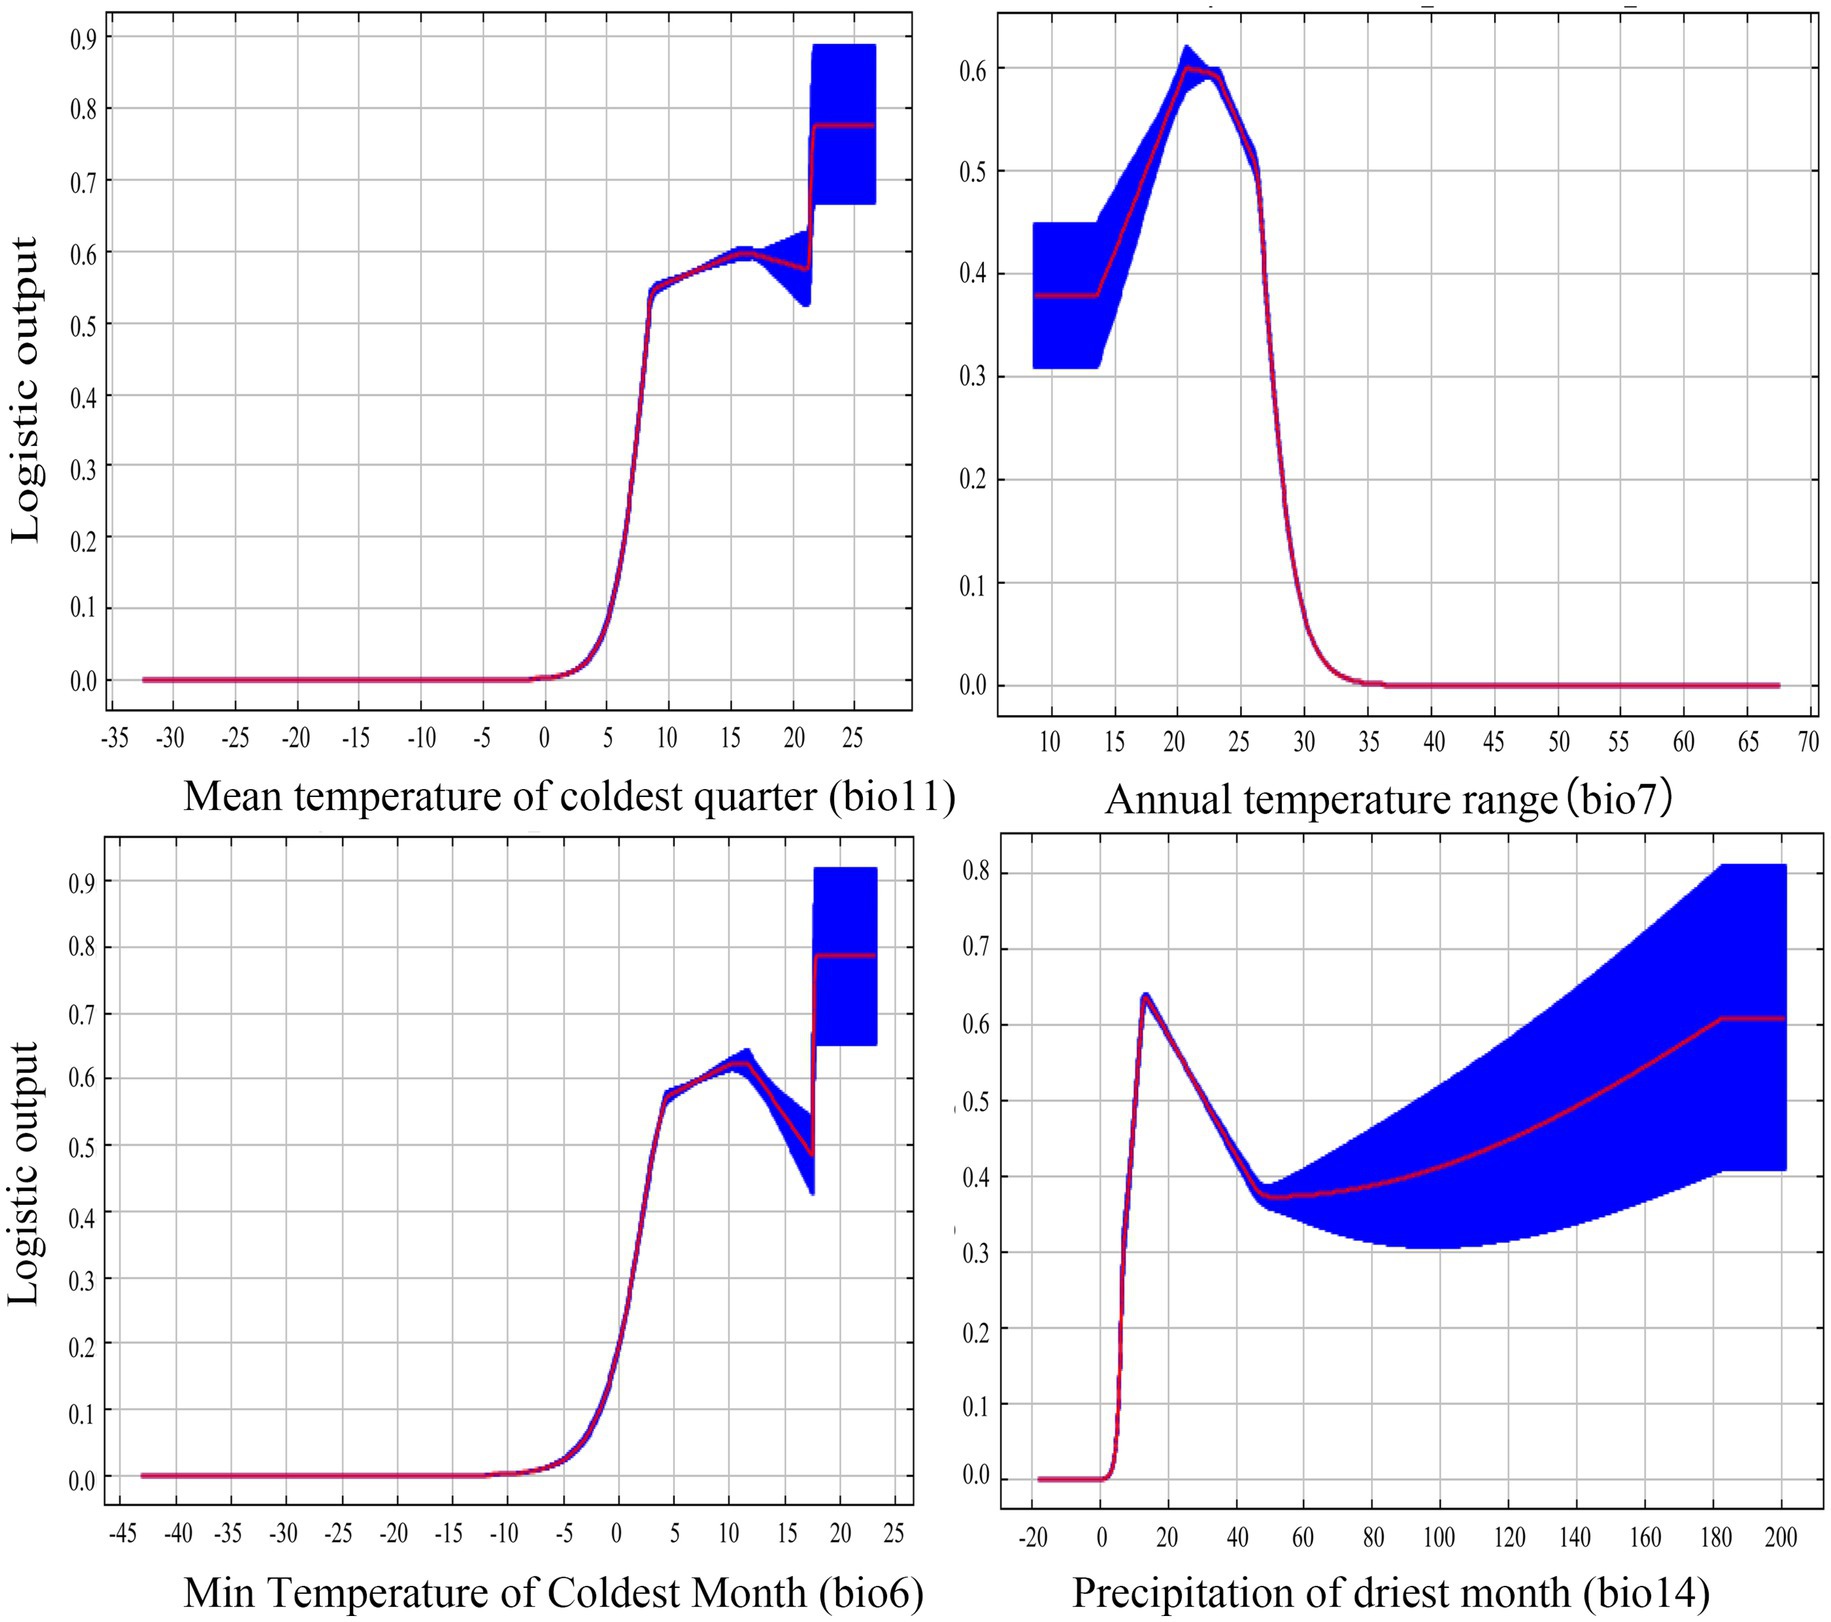
Figure 6. Response curves (Blue indicates standard deviation) for important environmental predictors in MaxEnt model for Jacaranda mimosifolia: mean temperature of coldest quarter (bio11), temperature annual range (bio7), minimum temperature of coldest month (bio6), and precipitation of driest month (bio14).
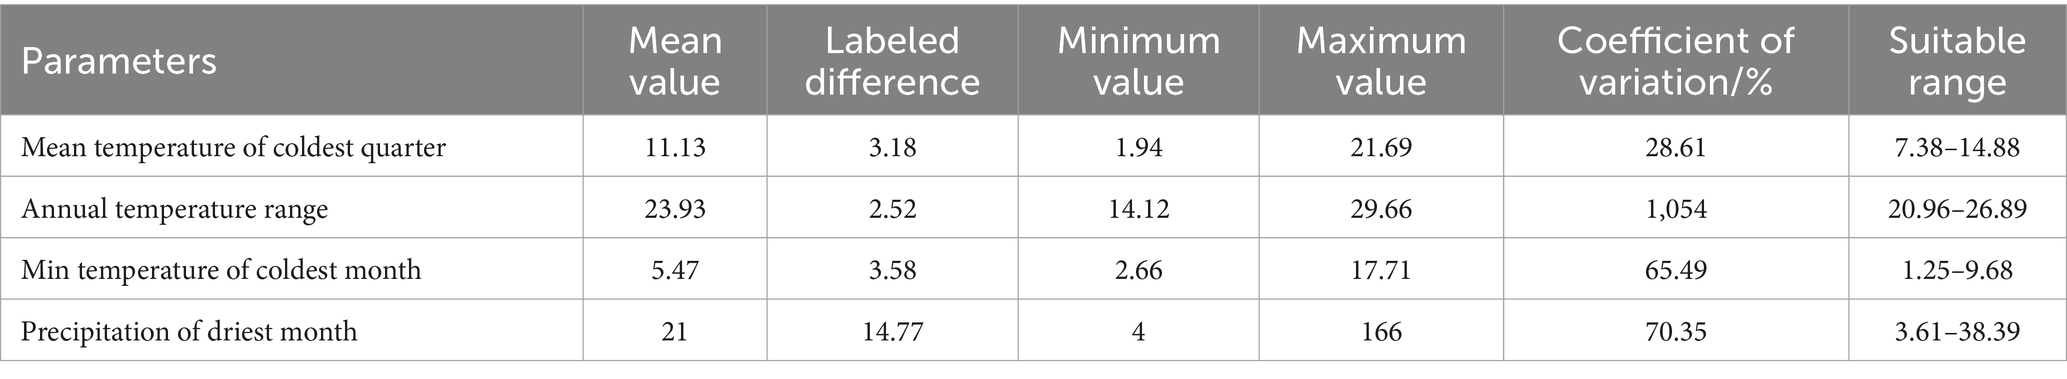
Table 4. Descriptive statistics of principal bioclimatic parameters of Jacaranda mimosifolia.
3.4 Potential distribution areas of Jacaranda mimosifolia in China under the current climate
The current suitable distribution range of J. mimosifolia in China spans approximately from18°N to 36°N and 93°E to 123°E. It is primarily found in Taiwan, Fujian, Guangdong, Hainan, Guangxi, Yunnan, Sichuan Basin, and southern Guizhou. Additionally, localized populations exist in Tibet, Hunan, Jiangxi, and Zhejiang. Currently, the potential habitable area of J. mimosifolia in China is roughly 122.19 × 10⁴ km2, representing approximately 12.73% of the total land area. The high, moderate, and low suitable areas account for 30.36, 34.68, and 34.95% of the total suitable area, respectively. The high suitable areas are primarily concentrated in the Sichuan Basin, central and eastern Yunnan, western, central, and eastern Guangxi, Pearl River Delta of Guangdong, eastern and western regions of Guangdong, northern and western parts of Hainan, southeastern coastal area of Zhejiang, and the narrow region in western Taiwan (Figure 7; Table 5).
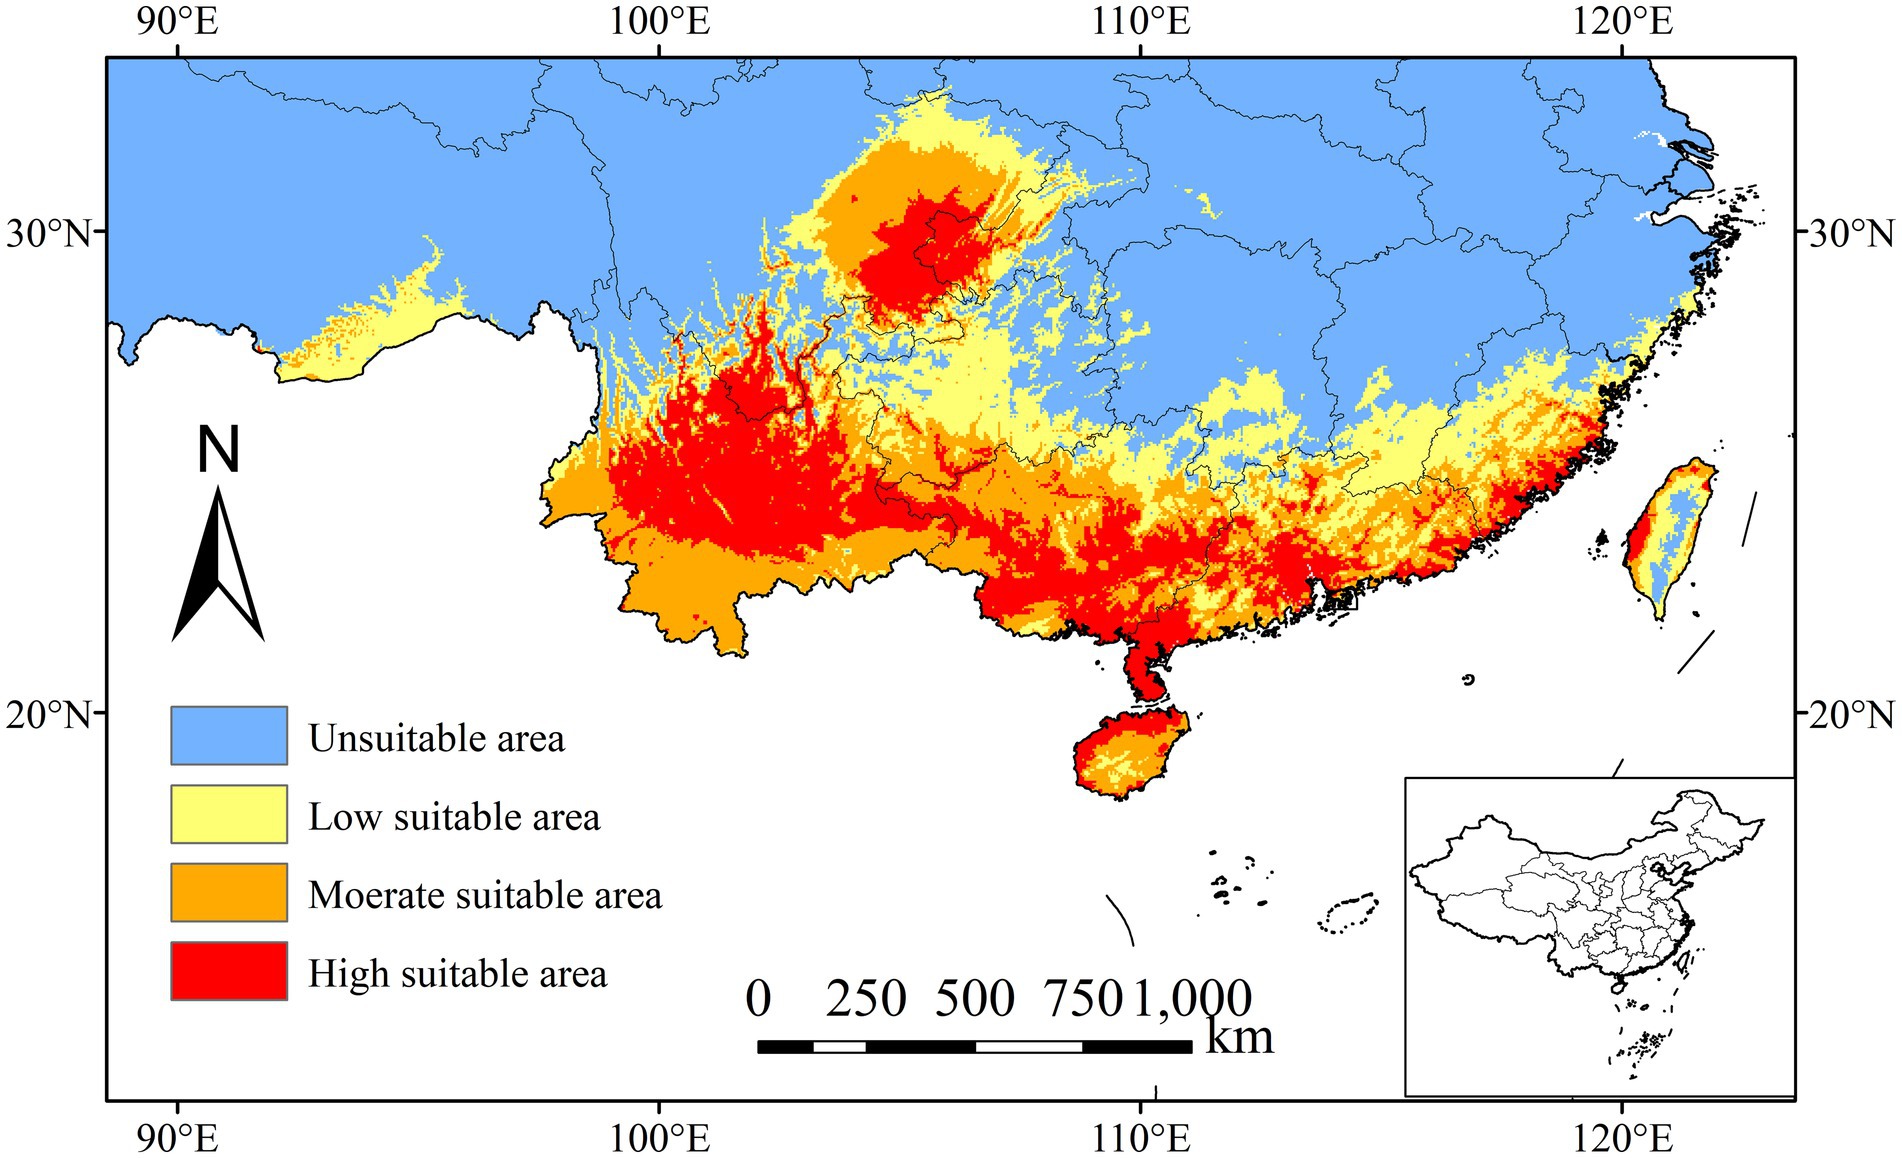
Figure 7. Potential suitability areas of Jacaranda mimosifolia under the current climate scenario in China (1970–2000) generated by the MaxEnt model. The areas are divided into four categories based on the calculated habitat suitability index: red denotes high suitability habitat, orange indicates moderate suitability, yellow represents low suitability, and blue shows unsuitable areas.
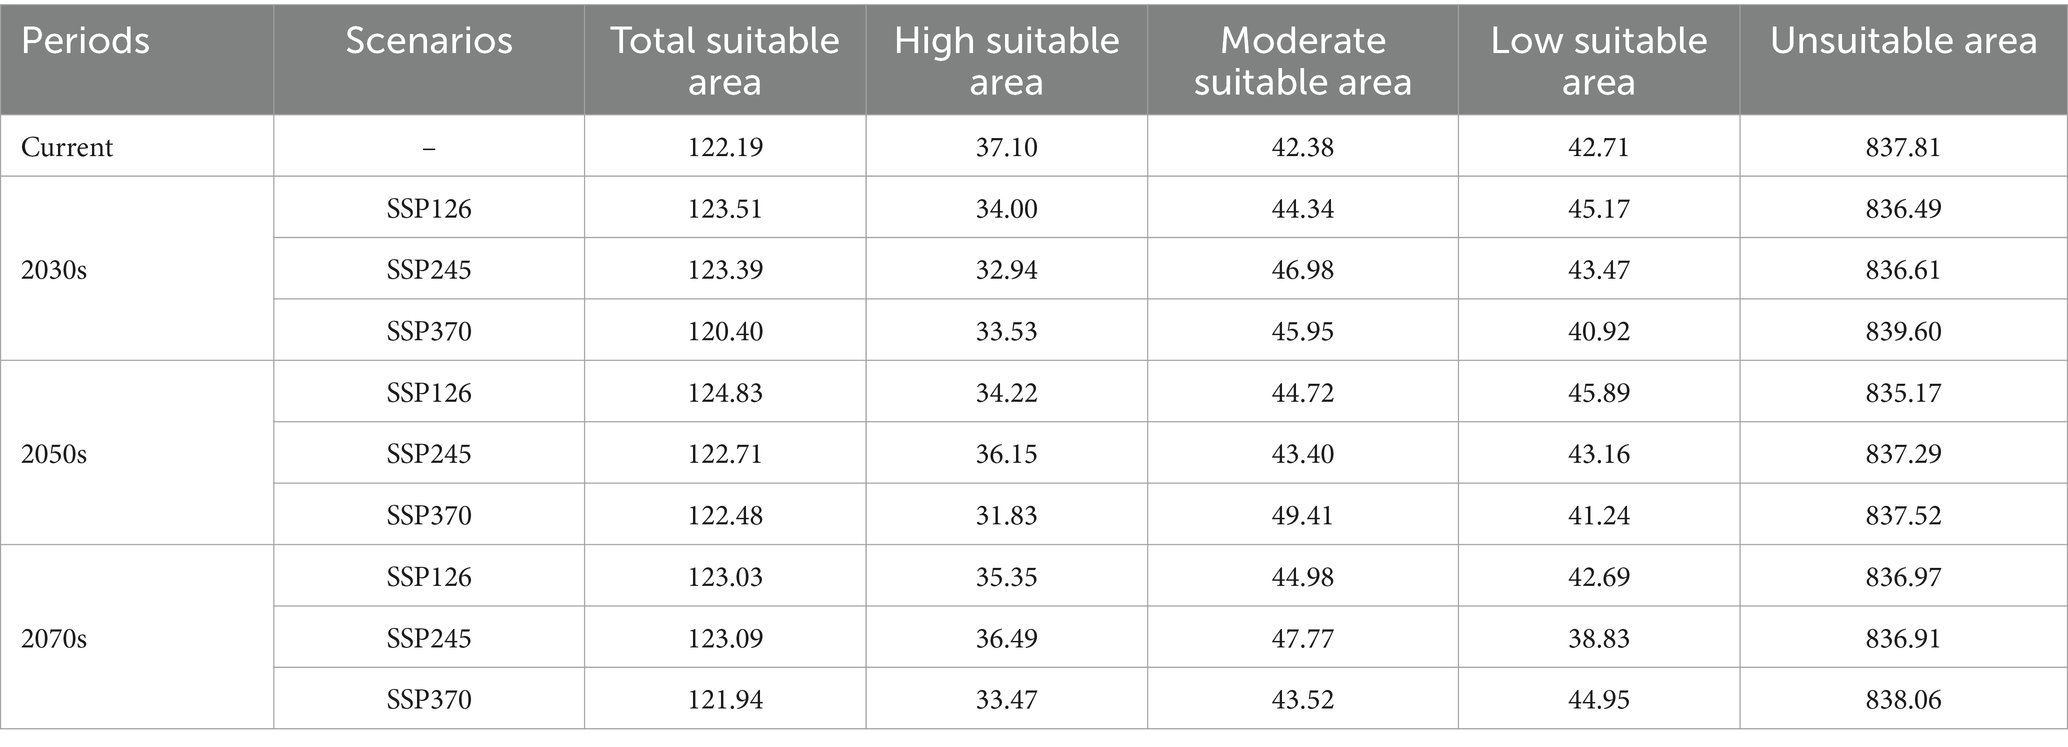
Table 5. Potential suitable area of Jacaranda mimosifolia in China in different periods/(×104 km2).
3.5 Changes in potential habitat areas of Jacaranda mimosifolia in China due to climate change
Based on the distribution of potential suitable areas for J. mimosifolia under different climate scenarios predicted by MaxEnt (Tables 5, 6; Figure 8), several trends emerge across the projection periods. In the 2030s, SSP126 (Figure 8A) witnessed an increase in the total suitable area to 123.51 × 10⁴ km2, reflecting a growth of 1.08%. This expansion was largely attributed to the growth in areas of moderate (44.34 × 10⁴ km2) and low suitability (45.17 × 10⁴ km2), even as regions of high suitability diminished to 34.00 × 10⁴ km2. At the same time, SSP245 (Figure 8B) experienced a modest increase, with the total suitable area reaching 123.39 × 10⁴ km2, a rise of 0.98%, particularly noted in moderate suitability areas, which expanded to 46.98 × 10⁴ km2. In contrast, SSP370 (Figure 8C) displayed a distinct decline, with the total suitable area decreasing to 120.40 × 10⁴ km2, a reduction of 1.46%, affecting all categories of suitability. By the 2050s, SSP126 (Figure 8D) demonstrated the most significant growth in suitable habitats, expanding to 124.83 × 10⁴ km2—an increase of 2.16%. This scenario saw consistent growth across all suitability categories. SSP245’s (Figure 8E) suitable area slightly increased to 122.71 × 10⁴ km2, although the rate of growth slowed to 0.43%. SSP370 (Figure 8F) exhibited minimal changes, with an increase to 122.48 × 10⁴ km2, marking a modest rise of 0.24%, indicative of limited habitat adaptability under this scenario. Entering the 2070s, the growth trend for SSP126 (Figure 8G) decelerated, achieving only a modest increase to 123.03 × 10⁴ km2 (a growth of 0.69%). Both moderate and low suitability areas exhibited moderate increases. SSP245 (Figure 8H) similarly showed slight improvements, with the suitable area growing to 123.09 × 10⁴ km2 (a 0.74% increase), primarily due to the expansion in moderate suitability regions to 47.77 × 10⁴ km2. Once again, SSP370 (Figure 8I) demonstrated a decline, with the total suitable area reducing to 121.94 × 10⁴ km2, a decrease of 0.20%, reflecting the potential long-term adverse impacts under severe climate scenarios.
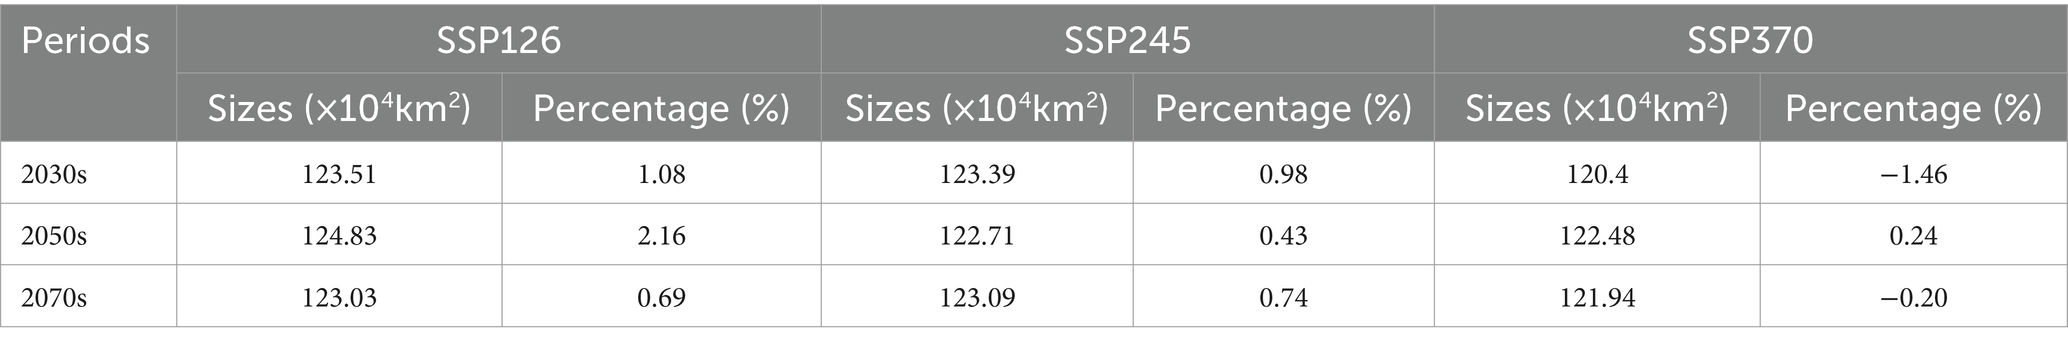
Table 6. Percentage change in suitable area for Jacaranda mimosifolia under future climate change scenarios versus the current climate.
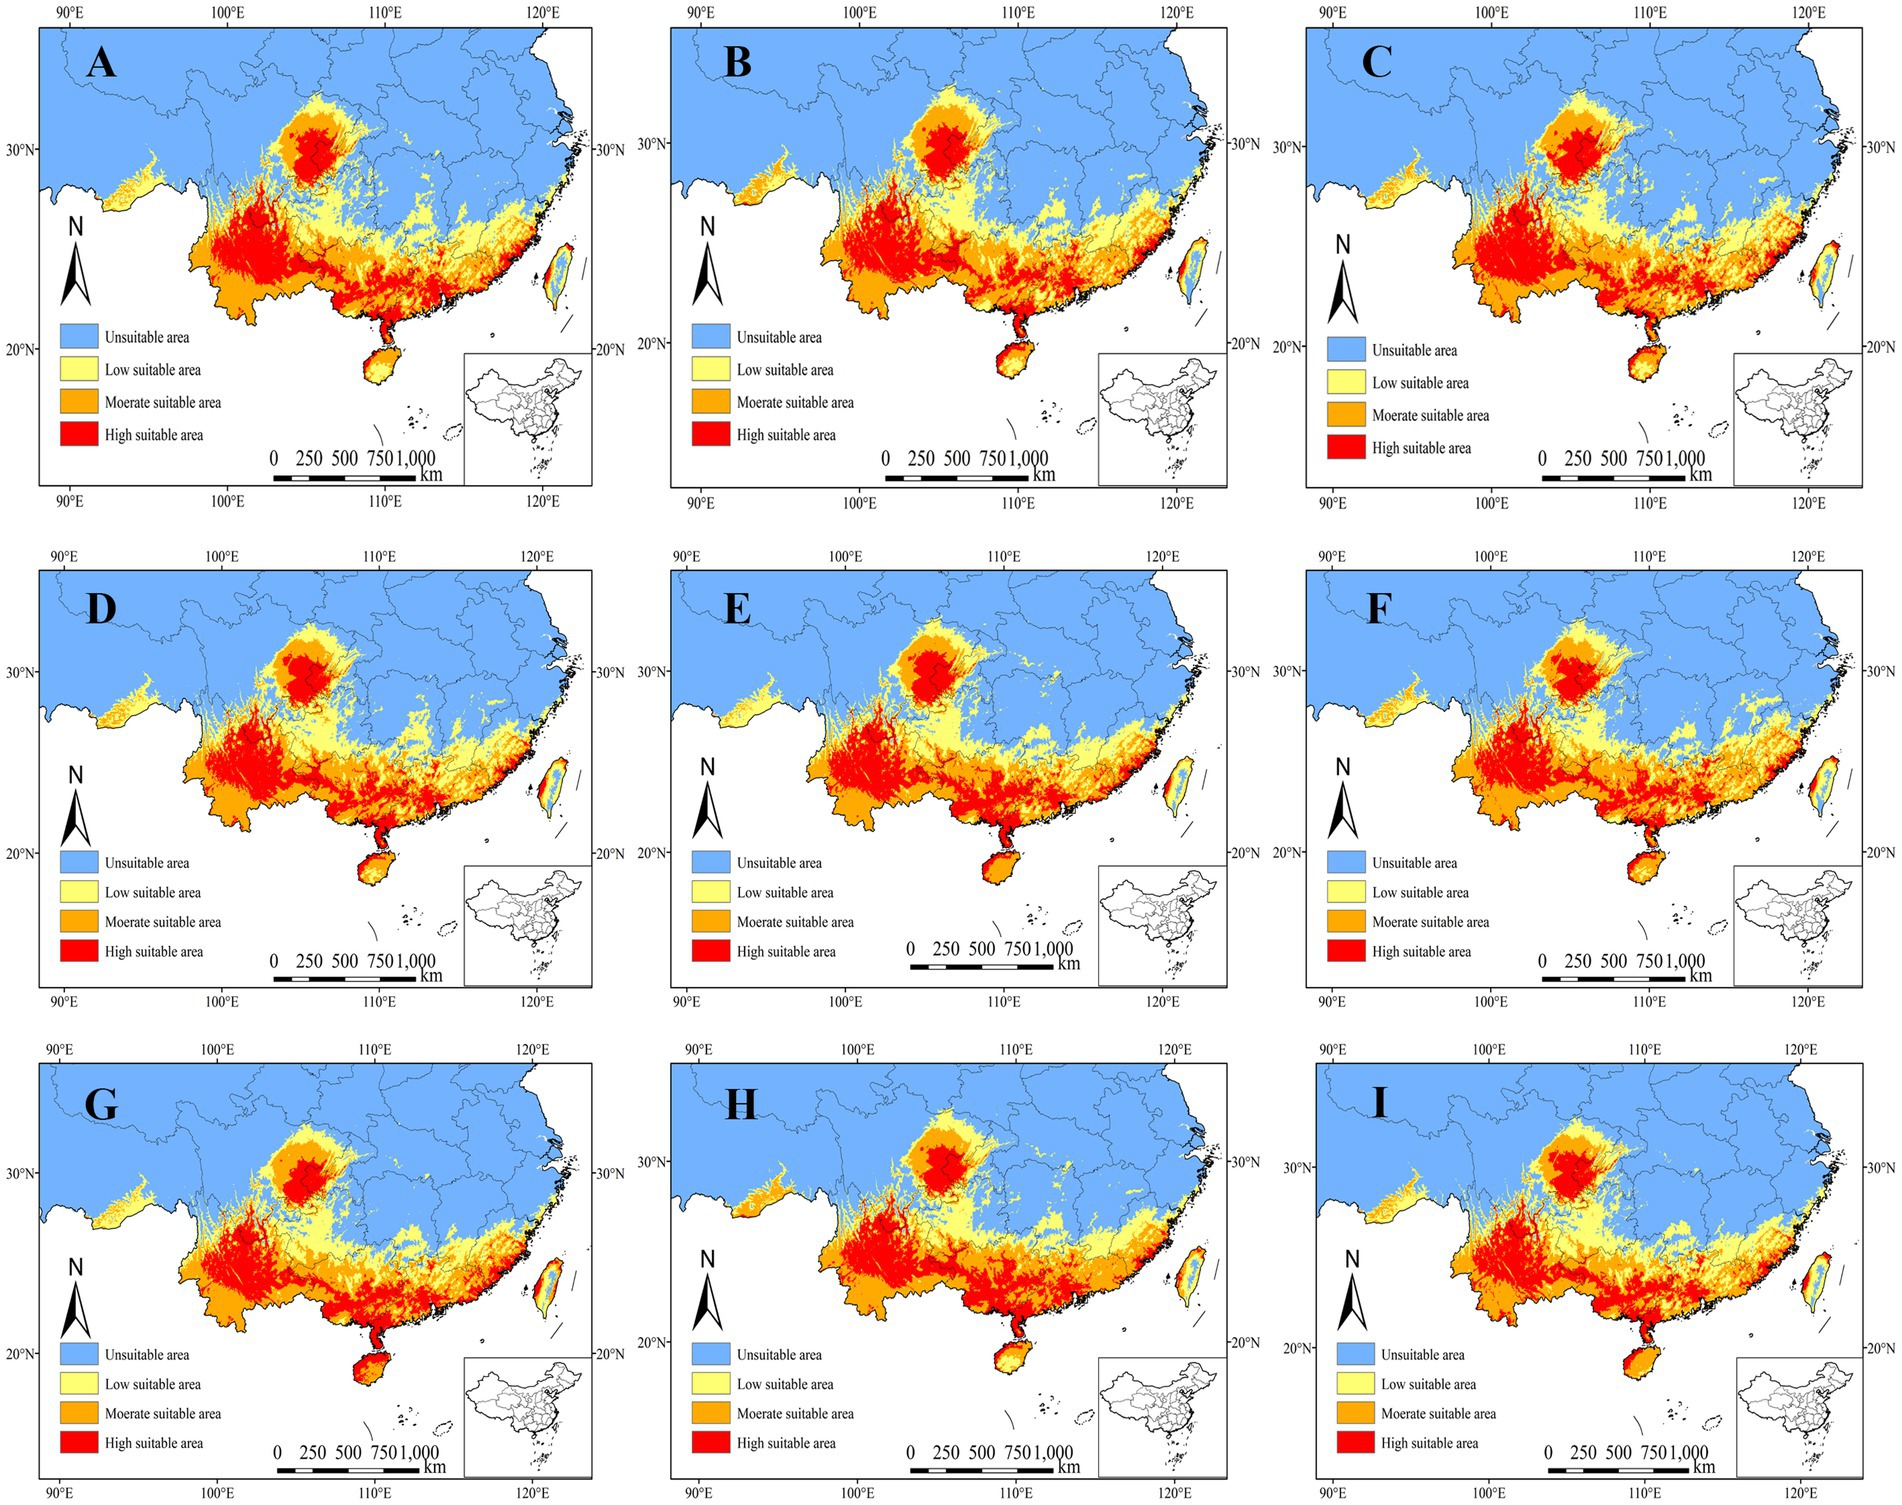
Figure 8. Potential geographic distribution changes of the Jacaranda mimosifolia under the future climate scenarios: (A:2030s SSP126), (B:2050s SSP126), (C:2070s SSP126), (D:2030s SSP245), (E:2050s SSP126), (F:2070s SSP126), (G:2030s SSP370), (H:2050s SSP370), (I:2070s SSP370).
The provinces comprising the potentially suitable areas for J. mimosifolia have shown relative stability compared to the present day, with only minor expansions observed at the periphery (Table 7; Figure 9). Under the SSP126 scenario in the 2030s, notable expansions were primarily observed in Hunan and Jiangxi, while contractions were concentrated in the central mountain range of Taiwan, Guizhou, and the outskirts of the Sichuan Basin (Figure 9A). Transitioning to the 2050s, the potential suitable area initially increased but then showed a decrease. During this period, the area expanded northward, notably in the central mountain range of Taiwan, the outskirts of the Sichuan Basin, and localized areas of Hunan and Jiangxi (Figure 9B). However, in the 2070s, there were indications of contraction within the areas that had expanded under the 2050s climate scenario (Figure 9C). Under the SSP245 scenario, the potential suitable area followed a pattern of initial increase, subsequent decrease, and yet another increase. The overall trend for areas of low suitability shows a decline, with expansions primarily in regions of high and medium suitability. In particular, during the 2030s, expansion was notable in localized areas of Jiangxi and Hunan, whereas contraction was focused on southeastern Taiwan, eastern Guizhou, and the outskirts of the Sichuan Basin (Figure 9D). In the 2050s, the suitable area significantly contracted, reaching its lowest point, mainly in Zhejiang, Fujian, Jiangxi, and Hunan (Figure 9E). Conversely, the 2070s saw a modest expansion, primarily in Fujian, Jiangxi, and Hunan (Figure 9F). Under the SSP370 scenario, the smallest suitable habitat area was expected in the 2030s, located primarily in the southern part of the country, observed in the southern Taiwan mountain range, the northeastern part of Guizhou, and the outskirts of the Sichuan Basin (Figure 9G). The projected expansion in the 2050s was focused on the northern part of Fujian and central Jiangxi (Figure 9H). However, by the 2070s, this specific area underwent a transition and became unsuitable for habitation, particularly in the northern part of Fujian and central Jiangxi (Figure 9I).
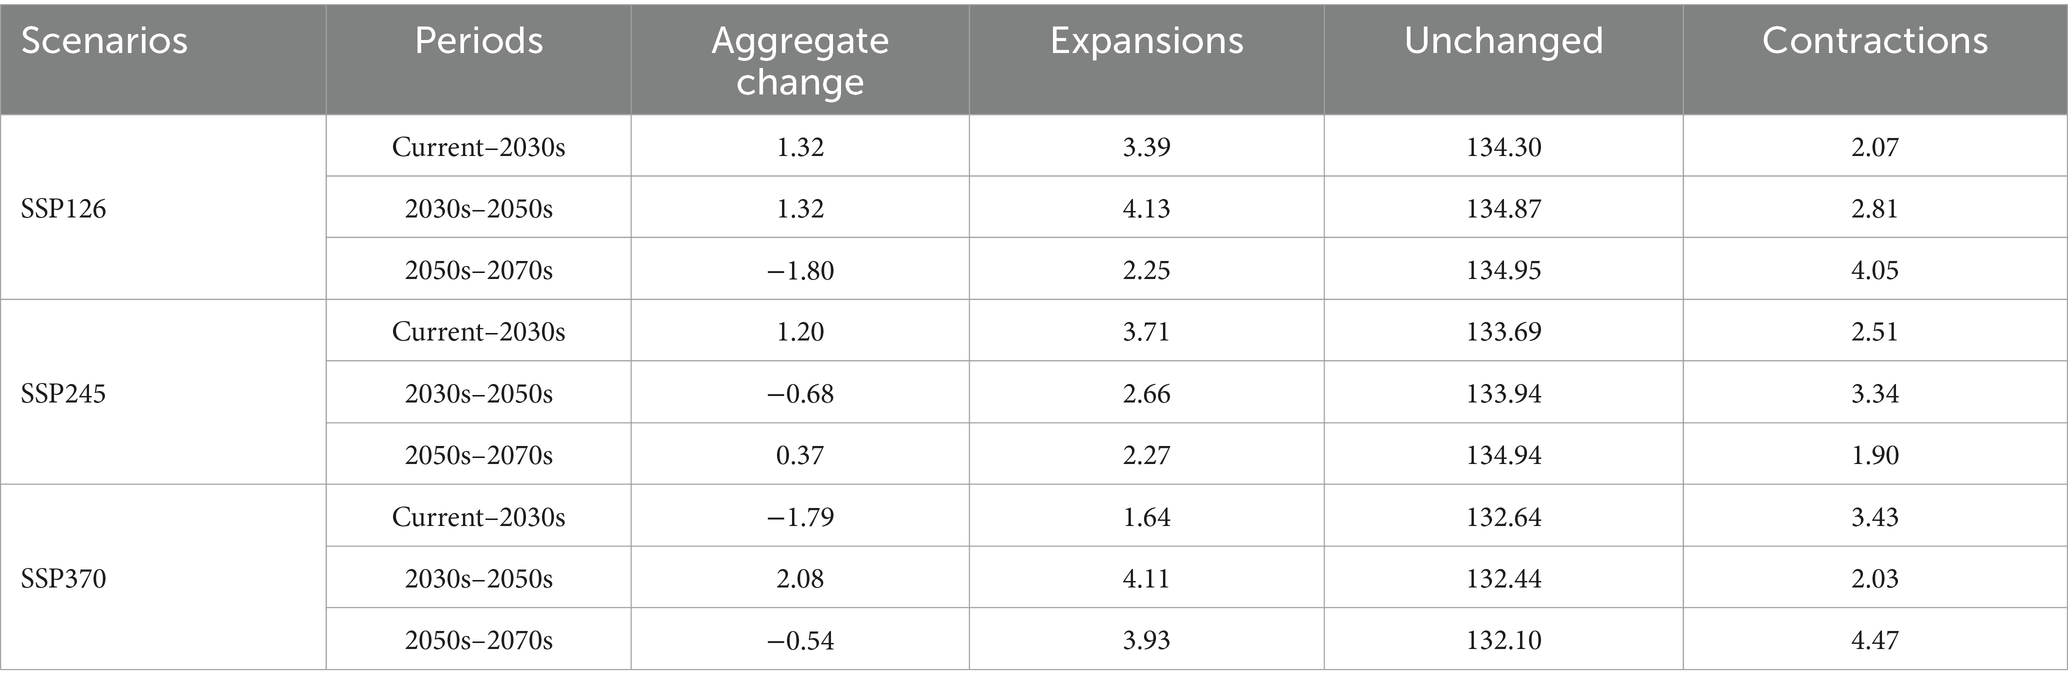
Table 7. Change of potential suitable area of Jacaranda mimosifolia in China in different periods (×104 km2).
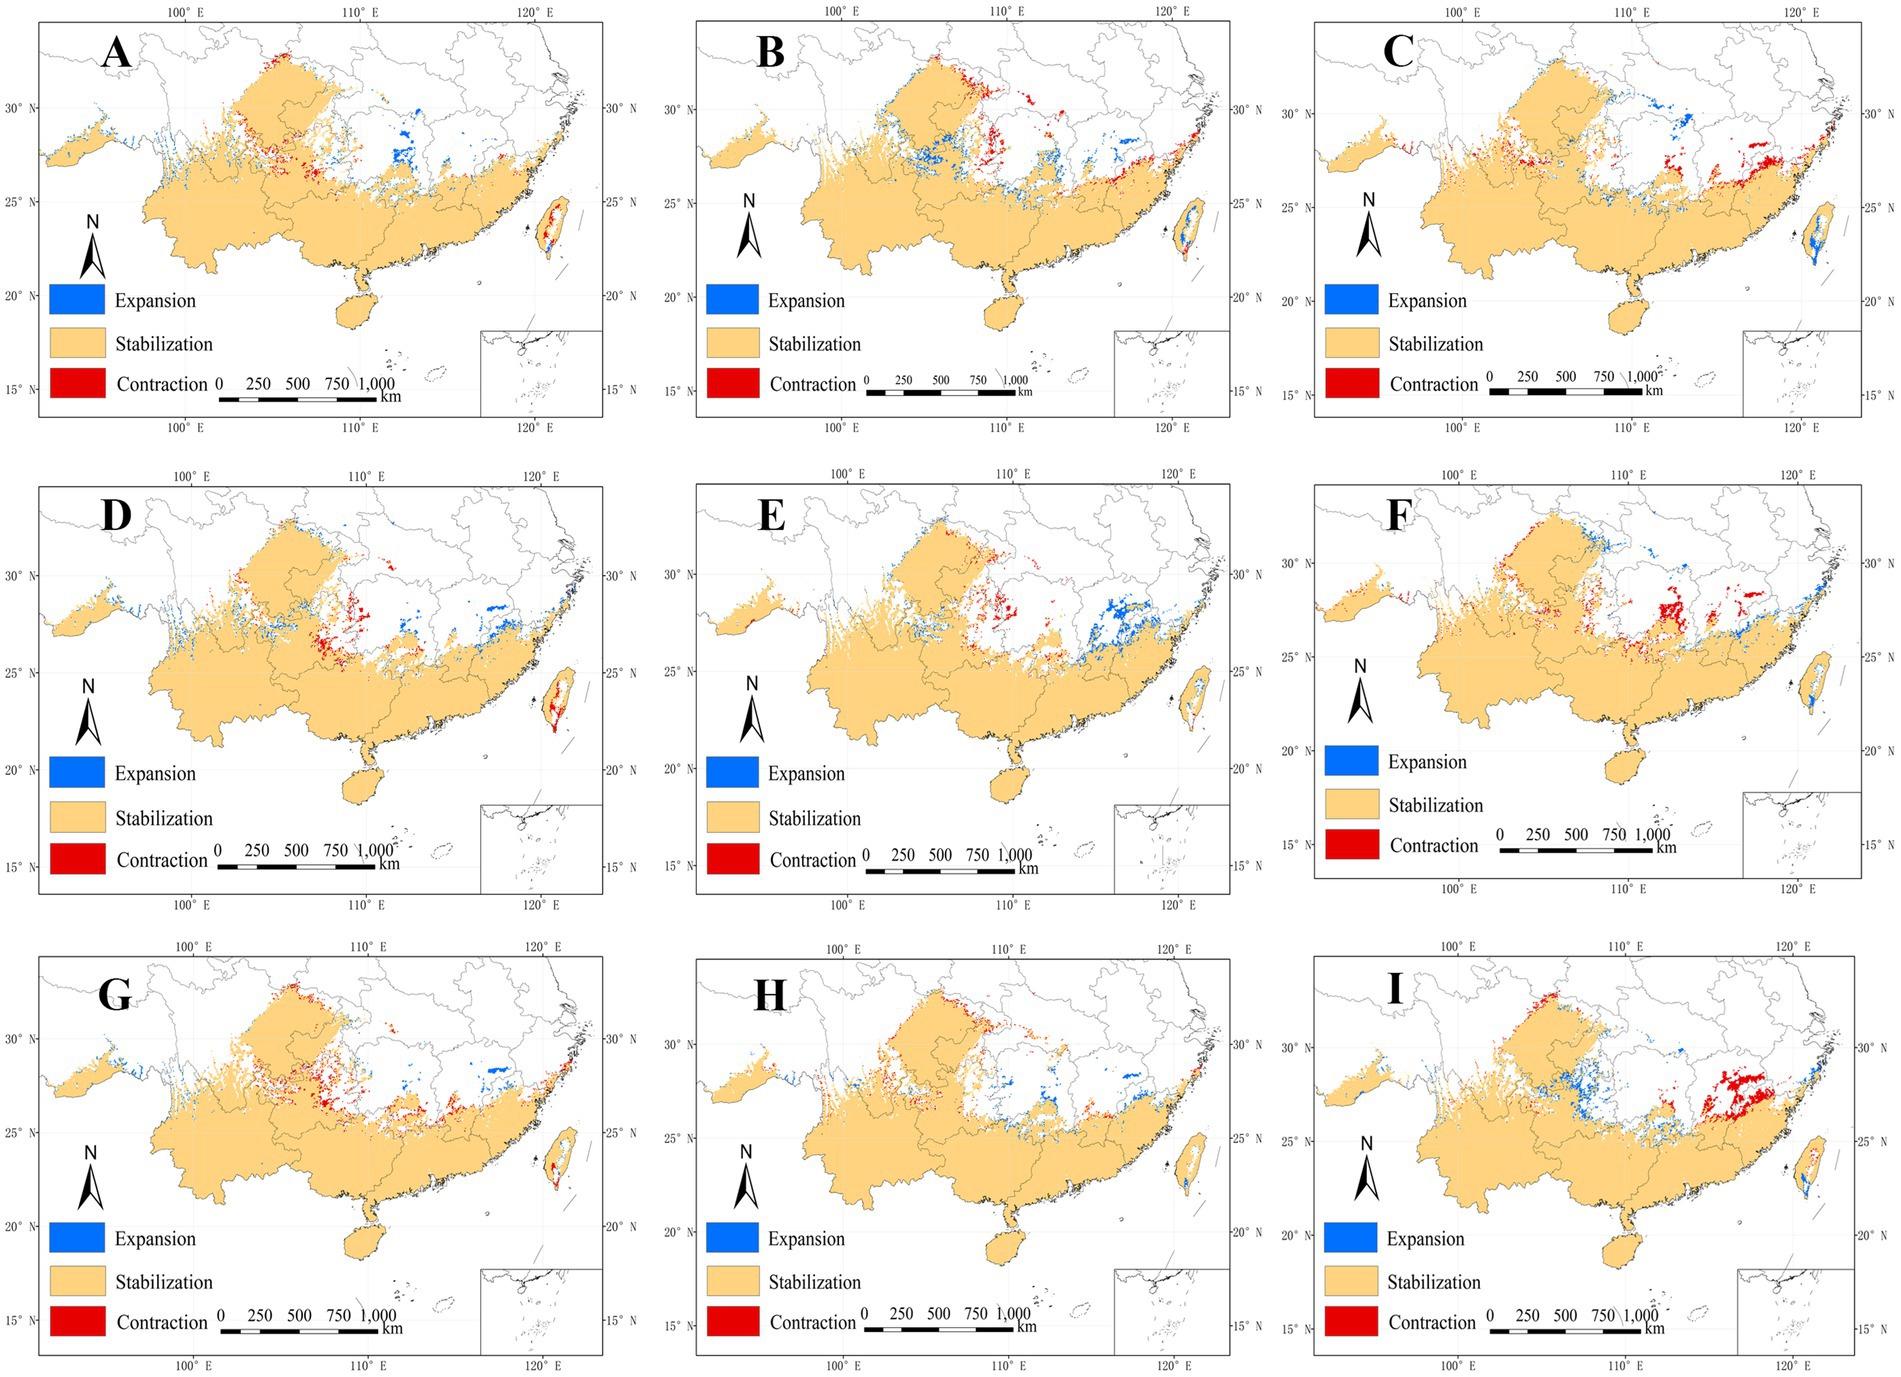
Figure 9. Potential habitat modification of Jacaranda mimosifolia under different climatic scenarios: (A:2030s SSP126), (B:2050s SSP126), (C:2070s SSP126), (D:2030s SP245), (E:2050s SSP126), (F:2070s SSP126), (G:2030s SSP370), (H:2050s SSP370), (I:2070s SSP370).
3.6 Changes in Jacaranda mimosifolia distribution centers in China under various climatic scenarios
When comparing current and future climate scenarios, MaxEnt model simulations demonstrated a shift in the distribution centers of J. mimosifolia to the west and northwest, accompanied by an elevation rise (Figure 10). Initially, the distribution center under the current climate scenario was located in Xiaji Town, Dushan County, Qiannan Buyi Miao Autonomous Prefecture, Guizhou Province, at coordinates 107.44°E and 25.52°N. Under the SSP126 scenario, by the 2030s, this center shifted northwestward to a new position within Dushan County at 107.40°E, 25.56°N, covering a migration distance of 6.29 km. In the 2050s, the center moved southwestward, settling in Pingtang County, Qiannan Buyi Miao Autonomous Prefecture, Guizhou Province, at 107.32°E, 25.51°N, with a migration distance of 8.70 km. By the 2070s, it relocated back to Dushan County at 107.39°E, 25.52°N, traveling an eastward direction over 6.47 km. In the SSP245 scenario, significant changes were observed. In the 2030s, the center moved northwest to Xiaosi Town, Dushan County at 107.41°E, 25.58°N, a distance of 7.84 km. By the 2050s, it had shifted southwest to Pingtang County at 107.36°E, 25.57°N, covering 5.12 km. In the 2070s, it relocated southeastward back to Dushan County at 107.46°E, 25.50°N, traveling 12.58 km. Under the SSP370 scenario, during the 2030s, the distribution center moved to Pingtang County at 107.33°E, 25.52°N, traversing a distance of 11.01 km. In the 2050s, it shifted eastward to Dushan County at the same coordinates, covering 12.58 km. In the 2070s, it continued east, finally positioning at 107.33°E, 25.52°N in Dushan County, traversing a total distance of 18.84 km. Subsequently, it returned to Pingtang County, maintaining the same coordinates.
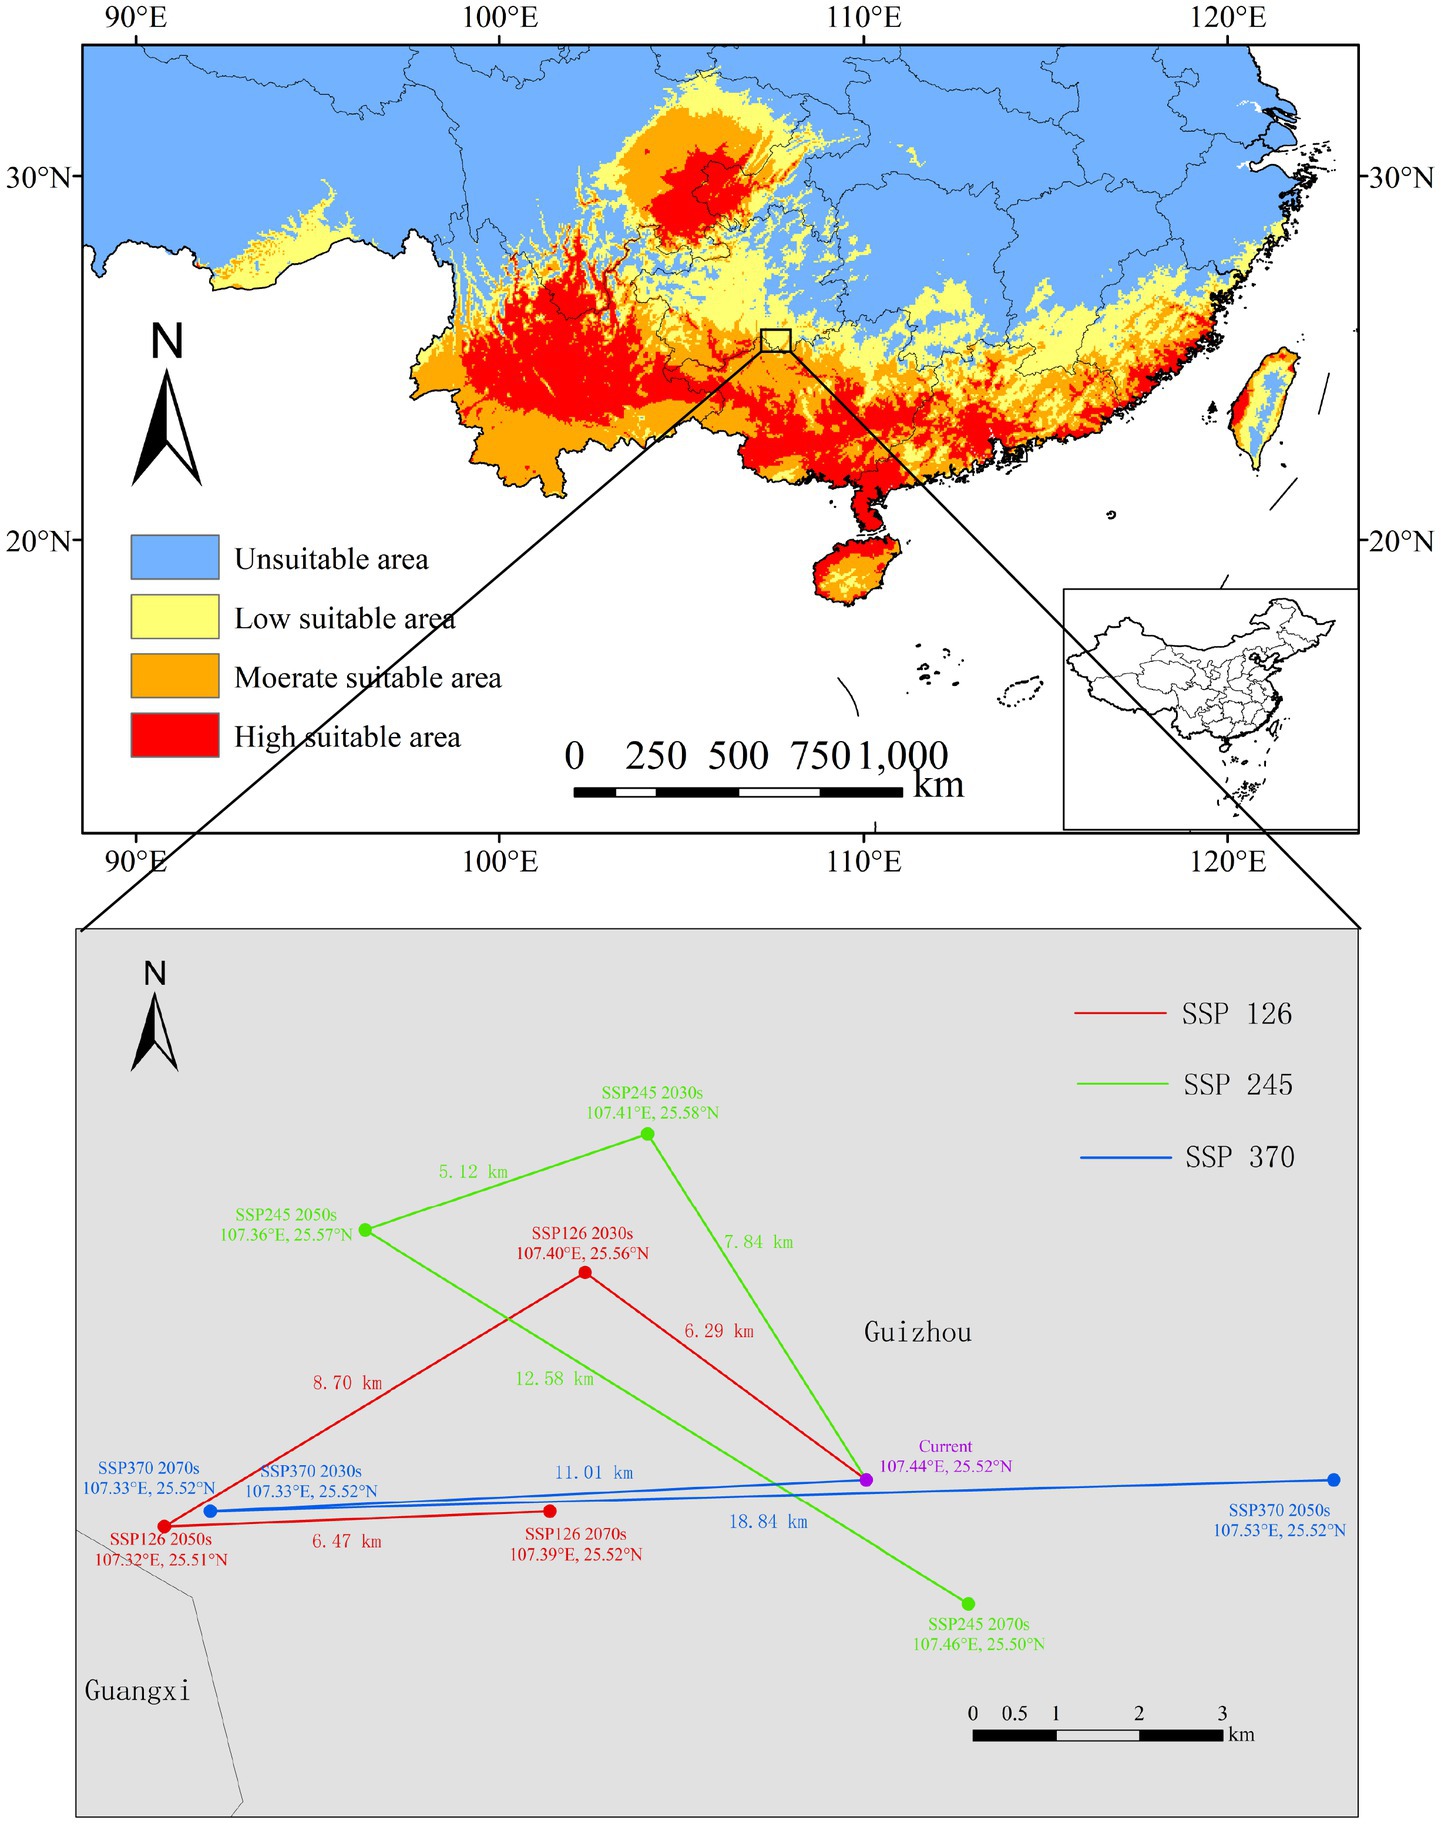
Figure 10. Change in the distribution centers of Jacaranda mimosifolia under different climatic scenarios.
4 Discussion
To effectively predict species responses to climate change, including potential shifts in phenology, distribution, and migration, it is imperative to deeply understand these mechanisms (Briscoe et al., 2023). This study conducts a detailed examination of the impacts of climate change on the distribution of J. mimosifolia and its influencing factors, utilizing the MaxEnt model and ArcGIS tools. It involves a principal component analysis of 19 climate factors, enhanced by the integration of three topographic factors, offering a more systematic and comprehensive analysis compared to previous efforts. By employing ENMTools and the ggcorrplot package in R for Pearson analysis, the study successfully minimized the interference of autocorrelated environmental factors, thereby improving the predictive accuracy of the MaxEnt model. Additionally, this research adopts the latest Shared Socio-economic Pathways (SSPs), providing more realistic climate projections than the traditional Representative Concentration Pathways (RCPs) (Kikstra et al., 2022; Pecchi et al., 2020; van der Geest and Warner, 2020). The findings significantly enhance our understanding of the distribution characteristics of J. mimosifolia, offering a robust scientific basis for its conservation and management. The exploration of key environmental factors influencing J. mimosifolia potential growth range has yielded invaluable insights for its introduction and cultivation.
While the 218 locations utilized in this study were selected to represent a wide range of Jacaranda mimosifolia habitats, it is possible that some suitable areas were not included. This could be due to gaps in survey data or limitations in herbarium records. To mitigate this issue, we incorporated cross-validation methods and tested the model with independent datasets. These steps aimed to evaluate the model’s robustness and reduce the impact of any potential biases resulting from incomplete habitat representation. The consistent performance across different validation datasets suggests that our model predictions are reliable, though future work should aim to include additional presence data to further enhance accuracy.
Predictions from the MaxEnt model, which boasts an AUC value of 0.956, confirm its high accuracy. The research indicates that the core habitats of J. mimosifolia are primarily found in Taiwan, Fujian, Guangdong, Hainan, Guangxi, Yunnan, the Sichuan Basin, and southern Guizhou, with additional localized areas in Tibet, Hunan, Jiangxi, and Zhejiang, China. These regions collectively cover a potential habitable area of approximately 122.19 × 10⁴ km2, representing 12.73% of China’s national area. While these predictions generally concur with prior research findings, there are noted variations in the levels of highly suitable areas in Tibet, Yunnan, Hainan, and Taiwan (Xie et al., 2021).
J. mimosifolia is primarily found in China’s tropical and subtropical monsoon regions. These regions’ climatic conditions—characterized by high temperatures and heavy rainfall during summers, and mild, frost-free winters—provide an ideal environment for the growth of J. mimosifolia (Sun et al., 2022). The jackknife method was used to analyze gain, contribution ratio, and single-factor response curves, identifying the primary environmental factors influencing the geographic distribution of J. mimosifolia as the minimum temperature of the coldest month (bio6), the annual temperature range (bio7), the mean temperature of the coldest quarter (bio11), and the precipitation of the driest month (bio14), with bio11, followed by bio7 and bio6, having the greatest impact. Utilizing the BIOCLIM model (Xie et al., 2021), researchers predicted the potential distribution of J. mimosifolia and identified the major limiting factors for its distribution. The results indicated that the lowest temperature of the coldest month (bio6) was a critical factor affecting the northward expansion of J. mimosifolia, consistent with this study’s findings. According to the response curves and descriptive statistics of the principal bioclimatic parameters of J. mimosifolia (Table 4), the average temperature of the coldest quarter does not fall below 5°C, ideally ranging from 7.38 to 14.88°C. Thus, low temperatures are a limiting factor for the northward expansion of J. mimosifolia, a scenario common among most woody plants (Ye et al., 2022; Shi et al., 2023). In contrast, moisture conditions have a comparatively lesser impact on its distribution. The tropical and subtropical monsoon regions offer diverse climatic and geographical conditions that support a broad range of plant species. Currently, numerous researchers are exploring the potential geographic distribution of species in this region under future climate scenarios. Apart from the SSP585 scenario in the 2050s, the highly suitable areas for palm plants in China are expected to expand under all future climate scenarios compared to the current climate scenario (Luo et al., 2023). Using the MaxEnt model, scholars predicted the potential geographic distribution of aromatic fruit trees in China under various climate scenarios, observing a slight increase in the suitable habitat area for these trees over the coming decades (Yan et al., 2018; Zhang et al., 2018). These results are fully consistent with our research, although the main difference is that a small portion of the previously unsuitable area has now been classified as an intermediate-low suitability area. Our research indicates that under current climate conditions, J. mimosifolia in China has a suitable distribution range approximately between 18°N and 36°N, and 93°E to 123°E. These findings corroborate those of Xie et al. (2021) but provide greater accuracy and detail regarding distribution areas, and exhibit stronger reliability in terms of expansion and contraction dynamics.
Researchers now believe that as temperatures rise under future climate change scenarios, species will migrate to higher latitudes and altitudes (Rubenstein et al., 2023; Ekberzade et al., 2024; Evans et al., 2024). Scholars predict that the optimal distribution of Arabica coffee (Zhang et al., 2021), Chinese fir (Zhao et al., 2021), and Pomatosace filicula (Chen et al., 2022) will likely shift northward to higher altitudes and latitudes. These studies confirm a potential shift in species distribution toward higher latitudes or altitudes amid future climate warming. Our research findings indicate that the future distribution center of J. mimosifolia will shift westward, northwestward, or to higher altitudes compared to the current period, aligning with the aforementioned conclusions. This study demonstrates the high simulation accuracy and performance of the MaxEnt model in modeling J. mimosifolia and predicting potential suitable areas under future climate conditions.
5 Conclusion
This study identifies the core suitable areas for J. mimosifolia, primarily located in Fujian, Guangdong, Hainan, Guangxi, Yunnan, Sichuan, Guizhou, Jiangxi, and most parts of Taiwan, with a limited presence in Tibet and Zhejiang. Under future climate scenarios, the suitable habitat for J. mimosifolia is expected to shrink overall but will shift westward and northwestward, resulting in a slight increase in area size in these new locations. The potential distribution of J. mimosifolia is influenced by four key environmental factors: the minimum temperature of the coldest month, annual temperature range, mean temperature of the coldest quarter, and precipitation of the driest month, with temperature as the critical determinant. We predicted the potential geographical patterns, distribution centers, and migration routes of J. mimosifolia under current and future climate scenarios. Additionally, we provided valuable insights for expanding cultivation areas, enhancing the plant’s development and utilization, and maximizing its role in urban landscaping and green space development. The distribution of J. mimosifolia is influenced by multiple factors, not just the climate, with its ornamental value as an urban landscape tree also dependent on the local city climate. While this study predicts the potential distribution of J. mimosifolia, its ornamental value varies significantly across regions, according to related research. Our study used 218 presence locations to model the suitable habitat of J. mimosifolia. These locations were chosen to be representative, but they might not encompass the full range of suitable habitats globally. We addressed this limitation by using rigorous cross-validation to ensure robust predictions. Despite these efforts, we recommend future studies should consider additional presence locations and environmental variables, utilize more refined models, and incorporate species interactions to further explore the geographical distribution of J. mimosifolia, especially in areas with superior ornamental effects. Implementing this strategy will enhance the foundation for applying J. mimosifolia in urban landscapes.
Data availability statement
The original contributions presented in the study are included in the article/Supplementary material, further inquiries can be directed to the corresponding authors.
Author contributions
XiL: Formal analysis, Methodology, Project administration, Writing – original draft, Writing – review & editing. GZ: Funding acquisition, Writing – review & editing, Investigation, Resources. CX: Validation, Writing – review & editing, Investigation. JQ: Conceptualization, Data curation, Software, Writing – original draft. XuL: Conceptualization, Data curation, Funding acquisition, Software, Writing – original draft, Writing – review & editing.
Funding
The author(s) declare that financial support was received for the research, authorship, and/or publication of this article. This research was funded by the Guangdong Forestry Science and Technology Innovation Project (2023KJCX014).
Acknowledgments
We would like to thank the staff members from the monitoring points in different parts of China who monitored the growth of the target plants for several years. We are also thankful to Linnan Ouyang who directly provided some data and method used in this modeling. Special thanks to the Chinese Virtual Herbarium, the National Specimen Information Infrastructure and WorldClim for their available data in making this simulation possible.
Conflict of interest
The authors declare that the research was conducted in the absence of any commercial or financial relationships that could be construed as a potential conflict of interest.
Publisher’s note
All claims expressed in this article are solely those of the authors and do not necessarily represent those of their affiliated organizations, or those of the publisher, the editors and the reviewers. Any product that may be evaluated in this article, or claim that may be made by its manufacturer, is not guaranteed or endorsed by the publisher.
References
Aguirre-Becerra, H., Pineda-Nieto, S. A., Garcia-Trejo, J. F., Guevara-Gonzalez, R. G., Feregrino-Perez, A. A., Alvarez-Mayorga, B. L., et al. (2020). Jacaranda flower (Jacaranda mimosifolia) as an alternative for antioxidant and antimicrobial use. Heliyon 6:e05802. doi: 10.1016/j.heliyon.2020.e05802
Banag, C., Thrippleton, T., Alejandro, G. J., Reineking, B., and Liede-Schumann, S. (2015). Bioclimatic niches of selected endemic ixora species on the Philippines: predicting habitat suitability due to climate change. Plant Ecol. 216, 1325–1340. doi: 10.1007/s11258-015-0512-6
Bittencourt, N. S. (2019). Reproductive systems and low outbreeding barriers between jacaranda cuspidifolia and J. mimosifolia (jacarandeae, bignoniaceae). Nord. J. Bot. 37. doi: 10.1111/njb.02558
Briscoe, N. J., Morris, S. D., Mathewson, P. D., Buckley, L. B., Jusup, M., Levy, O., et al. (2023). Mechanistic forecasts of species responses to climate change: the promise of biophysical ecology. Glob. Change Biol. 29, 1451–1470. doi: 10.1111/gcb.16557
Bucklin, D. N., Basille, M., Benscoter, A. M., Brandt, L. A., Mazzotti, F. J., Romañach, S. S., et al. (2015). Comparing species distribution models constructed with different subsets of environmental predictors. Divers. Distrib. 21, 23–35. doi: 10.1111/ddi.12247
Carón, M. M., De Frenne, P., Ortega-Baes, P., Quinteros, A., and Verheyen, K. (2018). Regeneration responses to climate and land-use change of four subtropical tree species of the southern Central Andes. For. Ecol. Manag. 417, 110–121. doi: 10.1016/j.foreco.2018.02.006
Cavalcante, H. S., Sousa, P. V. S. D., Santos, R. J. N. D., Cordeiro, K. V., Andrade, H. A. F. D., Machado, N. A. F., et al. (2021). Decomposed babassu biomass: new substrate for the production of jacaranda mimosifolia D. Don seedlings. Floresta Ambient. 28. doi: 10.1590/2179-8087-floram-2020-0045
Chen, K., Wang, B., Chen, C., and Zhou, G. (2022). Maxent modeling to predict the current and future distribution of pomatosace filicula under climate change scenarios on the Qinghai-Tibet plateau. Plants-Basel 11:670. doi: 10.3390/plants11050670
Chi, Y., Wang, G. G., Zhu, M., Jin, P., Hu, Y., Shu, P., et al. (2023). Potentially suitable habitat prediction of pinus massoniana lamb. In China under climate change using maxent model. Front. For. Glob. Change 6:1144401. doi: 10.3389/ffgc.2023.1144401
Deb, J. C., Phinn, S., Butt, N., and McAlpine, C. A. (2017). The impact of climate change on the distribution of two threatened dipterocarp trees. Ecol. Evol. 7, 2238–2248. doi: 10.1002/ece3.2846
Ekberzade, B., Yetemen, O., Ezber, Y., Sen, O. L., and Dalfes, H. N. (2024). Latitude or altitude as the future refugium? A case for the future of forests in Asia minor and its surroundings. Ecol. Evol. 14:e11131. doi: 10.1002/ece3.11131
Evans, A. E., Jarnevich, C. S., Beaury, E. M., Engelstad, P. S., Teich, N. B., LaRoe, J. M., et al. (2024). Shifting hotspots: climate change projected to drive contractions and expansions of invasive plant abundance habitats. Divers. Distrib. 30, 41–54. doi: 10.1111/ddi.13787
Farias, C. P., Alves, G. S., Oliveira, D. C., de Melo, E. I., and Azevedo, L. C. B. (2020). A consortium of fungal isolates and biochar improved the phytoremediation potential of jacaranda mimosifolia d. Don and reduced copper, manganese, and zinc leaching. J. Soils Sediments 20, 260–271. doi: 10.1007/s11368-019-02414-3
Fauerharmel, M., Bisognin, D. A., Lencina, K. H., Tonetto, T. D. S., Meltzer, J. M., and Maggioni, J. H. (2020). Production of jacaranda plantlets by minicutting. Semina, 41, 1951–1962. doi: 10.5433/1679-0359.2020v41n5supl1p1951
Fox, L., Peter, B. G., Frake, A. N., and Messina, J. P. (2023). A Bayesian maximum entropy model for predicting tsetse ecological distributions. Int. J. Health Geogr. 22:31. doi: 10.1186/s12942-023-00349-0
Freeman, E. A., Moisen, G. G., and Frescino, T. S. (2012). Evaluating effectiveness of down-sampling for stratified designs and unbalanced prevalence in random forest models of tree species distributions in nevada. Ecol. Model. 233, 1–10. doi: 10.1016/j.ecolmodel.2012.03.007
Garcia-Rojas, M. I., Keatley, M. R., and Roslan, N. (2022). Citizen science and expert opinion working together to understand the impacts of climate change. PLoS One 17:e0273822. doi: 10.1371/journal.pone.0273822
Harris, J., Pirtle, J. L., Laman, E. A., Siple, M. C., and Thorson, J. T. (2023). An ensemble approach to species distribution modelling reconciles systematic differences in estimates of habitat utilization and range area. J. Appl. Ecol. 61, 351–364. doi: 10.1111/1365-2664.14559
He, Y., Ma, J., and Chen, G. (2023). Potential geographical distribution and its multi-factor analysis of pinus massoniana in China based on the maxent model. Ecol. Indic. 154:110790. doi: 10.1016/j.ecolind.2023.110790
Kendal, D., Williams, N. S. G., and Williams, K. J. H. (2012). A cultivated environment: exploring the global distribution of plants in gardens, parks and streetscapes. Urban Ecosyst. 15, 637–652. doi: 10.1007/s11252-011-0215-2
Kikstra, J. S., Nicholls, Z. R. J., Smith, C. J., Lewis, J., Lamboll, R. D., Byers, E., et al. (2022). The IPCC sixth assessment report WGIII climate assessment of mitigation pathways: from emissions to global temperatures. Geosci. Model Dev. 15, 9075–9109. doi: 10.5194/gmd-15-9075-2022
Kosicki, J. Z. (2017). Should topographic metrics be considered when predicting species density of birds on a large geographical scale? A case of random forest approach. Ecol. Model. 349, 76–85. doi: 10.1016/j.ecolmodel.2017.01.024
La Montagna, D., Attorre, F., Hamdiah, S., Maděra, P., and Malatesta, L. (2023). Climate change effects on the potential distribution of the endemic commiphora species (burseraceae) on the island of Socotra. Front. For. Glob. Change 6:1183858. doi: 10.3389/ffgc.2023.1183858
Lawrence, T. J., Takenaka, B. P., Garg, A., Tao, D., Deem, S. L., Fèvre, E. M., et al. (2023). A global examination of ecological niche modeling to predict emerging infectious diseases: a systematic review. Front. Public Health 11:1244084. doi: 10.3389/fpubh.2023.1244084
Li, S., Wang, Z., Zhu, Z., Tao, Y., and Xiang, J. (2023). Predicting the potential suitable distribution area of emeia pseudosauteri in Zhejiang province based on the maxent model. Sci. Rep. 13:1806. doi: 10.1038/s41598-023-29009-w
Liao, Z., Zhang, L., Nobis, M. P., Wu, X., Pan, K., Wang, K., et al. (2020). Climate change jointly with migration ability affect future range shifts of dominant fir species in Southwest China. Divers. Distrib. 26, 352–367. doi: 10.1111/ddi.13018
Lippi, C. A., Mundis, S. J., Sippy, R., Flenniken, J. M., Chaudhary, A., Hecht, G., et al. (2023). Trends in mosquito species distribution modeling: insights for vector surveillance and disease control. Parasites Vectors 16:302. doi: 10.1186/s13071-023-05912-z
Luo, W., Han, S., Yu, T., Wang, P., Ma, Y., Wan, M., et al. (2023). Assessing the suitability and dynamics of three medicinal sambucus species in China under current and future climate scenarios. Front. Plant Sci. 14:1194444. doi: 10.3389/fpls.2023.1194444
Merow, C., and Silander, J. A. (2014). A comparison ofm axlike andm axent for modelling species distributions. Methods Ecol. Evol. 5, 215–225. doi: 10.1111/2041-210X.12152
Micaela Rosas, Y., Peri, P. L., Benítez, J., Vanessa Lencinas, M., Politi, N., and Martínez Pastur, G. (2023). Potential biodiversity map of bird species (passeriformes): analyses of ecological niche, environmental characterization and identification of priority conservation areas in southern Patagonia. J. Nat. Conserv. 73:126413. doi: 10.1016/j.jnc.2023.126413
Mirhashemi, H., Heydari, M., Ahmadi, K., Karami, O., Kavgaci, A., Matsui, T., et al. (2023). Species distribution models of brant's oak (quercus brantii lindl.): the impact of spatial database on predicting the impacts of climate change. Ecol. Eng. 194:107038. doi: 10.1016/j.ecoleng.2023.107038
Mostafa, N., Eldahshan, O., and Singab, A. (2015). Chemical composition and antimicrobial activity of flower essential oil of jacaranda acutifolia juss. Against food-borne pathogens. Eur. J. Med. Plants 6, 62–69. doi: 10.9734/EJMP/2015/4749
Naz, R., Bano, A., Nosheen, A., Yasmin, H., Keyani, R., Shah, S. T. A., et al. (2021). Induction of defense-related enzymes and enhanced disease resistance in maize against fusarium verticillioides by seed treatment with jacaranda mimosifolia formulations. Sci. Rep. 11:59. doi: 10.1038/s41598-020-79306-x
Noce, S., Cipriano, C., and Santini, M. (2023). Altitudinal shifting of major forest tree species in italian mountains under climate change. Front. For. Glob. Change 6, 1250651. doi: 10.3389/ffgc.2023.1250651
Olowoyo, J. O., van Heerden, E., and Fischer, J. L. (2010). Investigating jacaranda mimosifolia tree as biomonitor of atmospheric trace metals. Environ. Monit. Assess. 164, 435–443. doi: 10.1007/s10661-009-0904-y
Pecchi, M., Marchi, M., Moriondo, M., Forzieri, G., Ammoniaci, M., Bernetti, I., et al. (2020). Potential impact of climate change on the forest coverage and the spatial distribution of 19 key forest tree species in Italy under rcp4.5 ipcc trajectory for 2050s. Forests 11:934. doi: 10.3390/f11090934
Peng, S., Ramirez-Parada, T. H., Mazer, S. J., Record, S., Park, I., Ellison, A. M., et al. (2024). Incorporating plant phenological responses into species distribution models reduces estimates of future species loss and turnover. New Phytol. 242, 2338–2352. doi: 10.1111/nph.19698
Pérez Navarro, M. A., Lloret, F., Ogaya, R., Estiarte, M., and Peñuelas, J. (2024). Decrease in climatic disequilibrium associated with climate change and species abundance shifts in mediterranean plant communities. J. Ecol. 112, 291–304. doi: 10.1111/1365-2745.14233
Piao, S., and Wang, X. (2023). Biological systems under climate change: what do we learn from the ipcc ar6. Glob. Change Biol. 29, 5120–5121. doi: 10.1111/gcb.16857
Puchalka, R., Dyderski, M. K., Vitkova, M., Sadlo, J., Klisz, M., Netsvetov, M., et al. (2021). Black locust (robinia pseudoacacia l.) range contraction and expansion in europe under changing climate. Glob. Change Biol. 27, 1587–1600. doi: 10.1111/gcb.15486
Ragsac, A. C., Farias Singer, R., Freitas, L. B., Lohmann, L. G., and Olmstead, R. G. (2019). Phylogeny of the neotropical tribe jacarandeae (bignoniaceae). Am. J. Bot. 106, 1589–1601. doi: 10.1002/ajb2.1399
Reiss, H., Cunze, S., König, K., Neumann, H., and Kröncke, I. (2011). Species distribution modelling of marine benthos: a north sea case study. Mar. Ecol.-Prog. Ser. 442, 71–86. doi: 10.3354/meps09391
Rubenstein, M. A., Weiskopf, S. R., Bertrand, R., Carter, S. L., Comte, L., Eaton, M. J., et al. (2023). Climate change and the global redistribution of biodiversity: substantial variation in empirical support for expected range shifts. Environ. Evid. 12, 1–21. doi: 10.1186/s13750-023-00296-0
Santini, L., Benítez-López, A., Maiorano, L., Čengić, M., and Huijbregts, M. A. J. (2021). Assessing the reliability of species distribution projections in climate change research. Diver. Distribut. 27, 1035–1050. doi: 10.1111/ddi.13252
Shi, X., Yin, Q., Sang, Z., Zhu, Z., Jia, Z., and Ma, L. (2023). Habitat distribution pattern of rare and endangered plant magnolia wufengensis in China under climate change. Forests 14:1767. doi: 10.3390/f14091767
Sun, H., Wang, X., Fan, D., and Sun, O. J. (2022). Contrasting vegetation response to climate change between two monsoon regions in Southwest China: the roles of climate condition and vegetation height. Sci. Total Environ. 802:149643. doi: 10.1016/j.scitotenv.2021.149643
Syphard, A. D., and Franklin, J. (2009). Differences in spatial predictions among species distribution modeling methods vary with species traits and environmental predictors. Ecography 32, 907–918. doi: 10.1111/j.1600-0587.2009.05883.x
van der Geest, K., and Warner, K. (2020). Loss and damage in the ipcc fifth assessment report (working group ii): a text-mining analysis. Clim. Pol. 20, 729–742. doi: 10.1080/14693062.2019.1704678
Wang, X., Jiang, Y., Wu, W., He, X., Wang, Z., Guan, Y., et al. (2023). Cryptosporidiosis threat under climate change in China: prediction and validation of habitat suitability and outbreak risk for human-derived cryptosporidium based on ecological niche models. Infect. Dis. Poverty 12:35. doi: 10.1186/s40249-023-01085-0
Wen, X., Fang, G., Chai, S., He, C., Sun, S., Zhao, G., et al. (2024). Can ecological niche models be used to accurately predict the distribution of invasive insects? A case study ofhyphantria cunea in China. Ecol. Evol. 14:e11159. doi: 10.1002/ece3.11159
Wu, X., Wang, M., Li, X., Yan, Y., Dai, M., Xie, W., et al. (2022). Response of distribution patterns of two closely related species in taxus genus to climate change since last inter-glacial. Ecol. Evol. 12:e9302. doi: 10.1002/ece3.9302
Xie, C., Chen, L., Li, M., Jim, C. Y., and Liu, D. (2023). Bioclim modeling for predicting suitable habitat for endangered tree tapiscia sinensis (tapisciaceae) in China. Forests 14:2275. doi: 10.3390/f14112275
Xie, C., Li, M., Jim, C. Y., and Liu, D. (2023). Spatio-temporal patterns of an invasive species mimosa bimucronata (DC). Kuntze under different climate scenarios in China. Front. For. Glob. Change 6:1144829. doi: 10.3389/ffgc.2023.1144829
Xie, C., Zhang, G., Jim, C., Liu, X., Zhang, P., Qiu, J., et al. (2021). Bioclimatic suitability of actual and potential cultivation areas for jacaranda mimosifolia in chinese cities. Forests 12:951. doi: 10.3390/f12070951
Xu, D., Zhuo, Z., Wang, R., Ye, M., and Pu, B. (2019). Modeling the distribution of zanthoxylum armatum in China with maxent modeling. Glob. Ecol. Conserv. 19:e00691. doi: 10.1016/j.gecco.2019.e00691
Yan, D., Chen, W., Liu, L., Li, J., Liu, L., and Wang, Y. (2018). Change in current and future geographic distributions of ulmus lamellosa in China. J. For. Res. 29, 1147–1156. doi: 10.1007/s11676-017-0503-7
Ye, X., Zhang, M., Yang, Q., Ye, L., Liu, Y., Zhang, G., et al. (2022). Prediction of suitable distribution of a critically endangered plant glyptostrobus pensilis. Forests 13:257. doi: 10.3390/f13020257
Zhang, S., Liu, X., Li, R., Wang, X., Cheng, J., Yang, Q., et al. (2021). Ahp-gis and maxent for delineation of potential distribution of arabica coffee plantation under future climate in Yunnan, China. Ecol. Indic. 132:108339. doi: 10.1016/j.ecolind.2021.108339
Zhang, K., Yao, L., Meng, J., and Tao, J. (2018). Maxent modeling for predicting the potential geographical distribution of two peony species under climate change. Sci. Total Environ. 634, 1326–1334. doi: 10.1016/j.scitotenv.2018.04.112
Zhang, Y., Zhang, J., Tian, L., Huang, Y., and Shao, C. (2023). The ginkgo biloba l. in China: current distribution and possible future habitat. Forests 14:2284. doi: 10.3390/f14122284
Keywords: Jacaranda mimosifolia , bioclimatic variables, MaxEnt, climate change, species distribution modeling
Citation: Li X, Zhang G, Xie C, Qiu J and Liu X (2024) Prediction of the potential distribution area of Jacaranda mimosifolia in China under climate change using the MaxEnt model. Front. For. Glob. Change. 7:1377689. doi: 10.3389/ffgc.2024.1377689
Edited by:
Ke Huang, University of Copenhagen, DenmarkReviewed by:
Prashant Sharma, Yashwant Singh Parmar University of Horticulture and Forestry, IndiaMuhammad Waheed, University of Okara, Pakistan
Copyright © 2024 Li, Zhang, Xie, Qiu and Liu. This is an open-access article distributed under the terms of the Creative Commons Attribution License (CC BY). The use, distribution or reproduction in other forums is permitted, provided the original author(s) and the copyright owner(s) are credited and that the original publication in this journal is cited, in accordance with accepted academic practice. No use, distribution or reproduction is permitted which does not comply with these terms.
*Correspondence: Jianhuang Qiu, MTA3ODQxMTA3MnFpdUBzaW5hLmNvbQ==; Xuefeng Liu, Y2VyY2xpdXhmQGNhZi5hYy5jbg==