 Yonghui Yao
- State Key Laboratory of Resources and Environmental Information System, Institute of Geographic Sciences and Natural Resources Research, Beijing, China
Previous studies have shown that climate change and human activities play an important role in the vegetation dynamics in the Qinling-Daba Mountains of central China. However, which environmental factors including climate, topography, soil and human activities play an important role in the vegetation dynamics and its spatial pattern in the Qinling-Daba Mountains remains to be further clarified. Based on the normalized difference vegetation index (NDVI) data of the growing season from 1986 to 2019 synthesized by Landsat series satellite data on Google Earth Engine, this study aimed to further investigate the spatial pattern of NDVI and its dynamics, and clarify its environmental controlling factors in the Qinling-Daba Mountains using the methods of spatial analysis and Geodetector. The results showed that: (1) the spatial pattern of NDVI in the study area had a U-shaped NDVI distribution in latitude, anti-U-shaped patterns in longitude and with increasing altitude. (2) 2005 was the year of NDVI breakthrough increase, and the vegetation dynamics was divided into two periods according to the result of MK mutation test: the slow increasing period with an increasing rate of 0.25%/a from 1986 to 2004 (R2 0.74), and the rapid increasing period with an increasing rate of 0.30%/a from 2005 to 2019 (R2 0.92). (3) Topography regulating local hydrothermal conditions and soil enriching nutritions played more important influence on NDVI spatial pattern than climate factors (temperature and precipitation) at the regional scale. The effect of land use on NDVI change was stronger than that of climate warming (temperature), and the climate warming in recent decades played a more important role than precipitation on the NDVI dynamics. Research on vegetation patterns, changes and their environmental influencing factors will help the government and other related agencies to formulate plans or policies for infrastructure development and land management, ecological restoration.
1 Introduction
Vegetation as an important part of the terrestrial ecosystem (Piao et al., 2003), has a significant influence on global material and energy flows, carbon balance and climate stability at different temporal and spatial scales (Schimel et al., 2000; Albani et al., 2006; Liu and Lei, 2015; Ren and Li, 2003). Due to its high sensitivity to environmental changes, vegetation dynamics has been recognized as an important indicator for monitoring the climate change (Parmesan and Yohe, 2003; Zhang and Li, 2023). Many studies on vegetation dynamics have used Normalized Difference Vegetation Index (NDVI) as an indicator to analyze the characteristics, dynamics and driving factors of vegetation (Fang et al., 2003; Anyamba and Tucker, 2005; Jong et al., 2011; Wang J. et al., 2019; Wang W. et al., 2019). Earlier studies paid more attention to the relationship between climate change and vegetation change and found that climate change was the main driving factor of vegetation dynamics (Anyamba and Tucker, 2005; Liu et al., 2015; Phillips et al., 2008; Hussain et al., 2023). Recent studies have focused on the impacts of both human activities and climate change on vegetation dynamics, and the results suggest that human activities have both positive and negative impacts on vegetation change. The negative impacts of human activities on vegetation dynamics are mainly caused by the destruction and reduction in vegetation due to the infrastructure and commercial construction (Hussain et al., 2022; Deng et al., 2018) or urbanization (Yao and Cui, 2022). Some human activities such as land use management or ecological restoration projects, have positively contributed to the increase in NDVI (Chen et al., 2019a,b; Qu et al., 2020; Jiang et al., 2021; Xu et al., 2021; Yao and Cui, 2022).
Regional NDVI change and its response to climate warming and human activities are still hot topics in current studies of global environmental change (Xu et al., 2021; Ma et al., 2012). The Qinling-Daba Mountains known as the north–south transitional zone of China and a large east–west ecological corridor (Zhang, 2019; Yu et al., 2022), is a sensitive and important region for climate change (Luo, 2009) and human activities (Yao and Cui, 2022). And the vegetation of the Qinling-Daba Mountains has also undergone profound changes under the interaction of the climate warming and human activities (Yao and Cui, 2022; Li et al., 2022). Many studies analyzed the vegetation dynamics and its driving forces in the Qinling-Daba Mountains by NDVI and found that the NDVI showed a significant upward trend and the vegetation change was sensitive to temperature (Zhang et al., 2011; He et al., 2011; Ren et al., 2012; Cui et al., 2012; Chen et al., 2019a,b). However, some studies found that the NDVI change in the Qinling-Daba Mountains was due to the precipitation deficit (Liu et al., 2015). Some other studies found that the NDVI in the Qinling Mountains had a decreasing trend (Sun et al., 2010; Sun et al., 2009). The above studies, which used different source or temporal data and methods in different local study areas (covering parts of the Qinling-Daba Mountains such as Taibai Mountain or Micang Mountain), led to different conclusions. And they mainly focused on the trend of vegetation dynamics, and few of them discussed the spatial pattern of NDVI and its controlling factors at the regional scale.
Human activities have been shown to play an important role in climate and land surface changes (Stott et al., 2004; Wang et al., 2023). As an important composition of the land surface environment, vegetation dynamics is mainly related to topography, soil, climate conditions and human activities (Nemani et al., 2003; Xu, 2018). Recent studies have paid more attention to the effects of human activities and climate warming on vegetation dynamics. Cui et al. (2012) analyzed the response of vegetation to temperature and the distance from human aggregation areas in the Qinling Mountains from 2000 to 2009 based on MODIS NDVI data by linear regression and correlation analysis, and found that the temporal stability of vegetation was inversely distributed with the distance from human aggregation areas. Deng et al. (2018) pointed out that human activities had both positive (through the implementation of ecological restoration projects) and negative (through urbanization) effects on vegetation change. Yao and Cui (2022) analyzed the trend of NDVI change and its spatial variation with elevation, slope, and land use type based on annual growing season NDVI data from 1990 to 2019, and discussed the effects of climate warming and land use on vegetation dynamics. Although these studies discovered the increasing trend of NDVI values in Qinling-Daba Mountains in recent decades, and discussed the driving factors of climate change (temperature and precipitation) and human activities (land use), there is no further statement on which factor of them (climate change and human activities) plays more important roles on the vegetation dynamics in recent years. As we know, climate factors (temperature and precipitation) are the main controlling factors of vegetation distribution, while according to our field surveys and related studies, topography and soil in the Qinling-Daba Mountains have also significantly affected the NDVI pattern. But few studies have discussed the effects of topography and soils on regional NDVI patterns.
In a word, the spatial pattern of NDVI and its environmental influencing factors in the Qinling-Daba Mountains of central China need to be further investigated. Therefore, the objectives of this study are to further clarify: (1) the spatial pattern of NDVI and its environmental influencing factors in the study area; (2) which factor among these environmental factors plays a more important role in NDVI change in this region. Therefore, the environmental factors including climate, soil and topography are selected in this study to discover the influencing factor of NDVI pattern, and the factors including climate, population density, gross domestic product (GDP) and land use are selected as the influencing factors of NDVI change. The results of this study are of great significance for a comprehensive understanding of the impact of environmental factors, including climate warming and human activities, on the vegetation of the Qinling-Daba Mountains.
2 Datasets and methods
2.1 Study area
The Qinling-Daba Mountains, composed of the Qinling Mountains in the north, the Hanzhong Basin-Hanshui Valley in the middle, and the Daba Mountain in the south, is situated in central China (102°–114°E, 30°–36°N), covering a total area of about 30.60 × 10⁴ km2 (Qin et al., 2008), and is known as the transitional zone of China (Kou et al., 2020; Yao et al., 2020) (Figure 1). It extends 1,000 km in the east–west direction and 200–300 km in the south–north direction, covering 155 counties, 31 cities and 6 provinces in central China (Figure 1). As the north–south transitional zone in China, steep elevation gradients and complex climate make it a biodiversity hotspot, the vegetation in this region gradually changes from subtropical evergreen broadleaf forest to deciduous broadleaf forest from south to north, and has vertical zonality in the mountains (Liu and Lu, 1990); it is also an important habitat for rare animals, containing many nature reserves and national parks (Yu et al., 2022). Therefore, this area is one of the most important and concerned areas for biodiversity in China, and one of the most sensitive areas to climate change and human activities (Yao and Cui, 2022; Zhang et al., 2019).
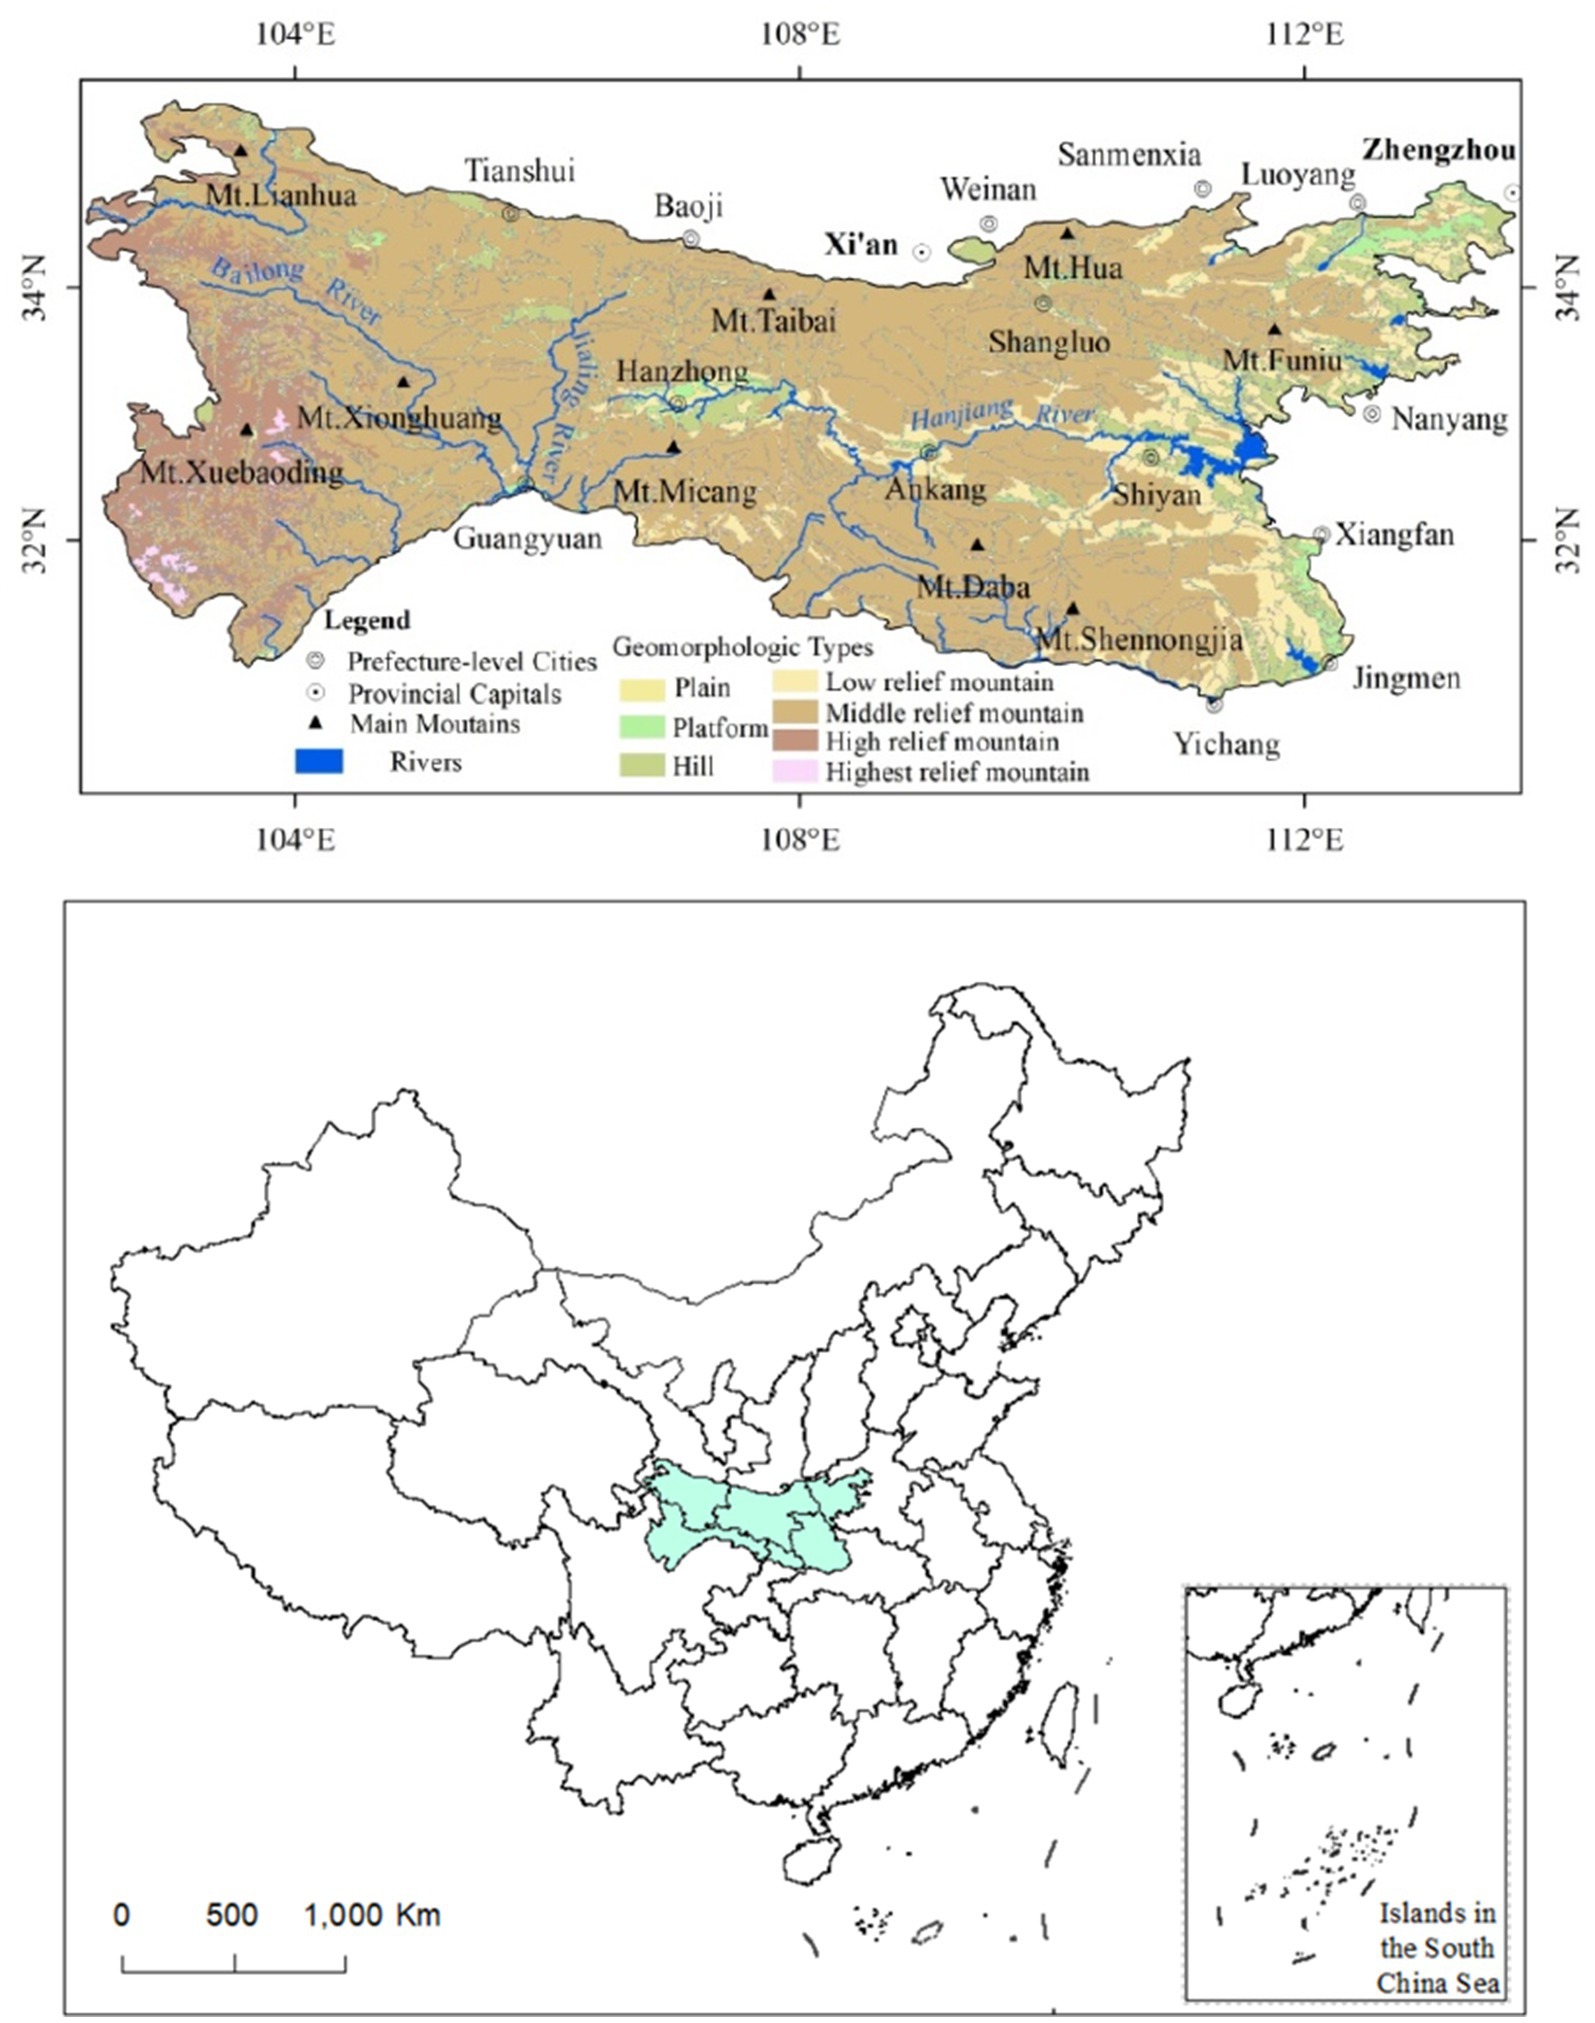
Figure 1. Location and geomorphological map of the Qinling-Daba Mountains in central China.
2.2 Datasets
The NDVI dataset used in this study was the annual growing season (May to September) NDVI data (30 m resolution) of Landsat 5/ Landsat 7/ Landsat 8 from 1986 to 2019, which were synthesized using the maximum synthesis method on the Google Earth Engine (GEE) platform. Savitzky–Golay (SG) filtering was applied to the annual growing season NDVI data to further reduce the noise (Kou, 2021). Temperature and precipitation data with 500 m resolution were downloaded from the Data Center of Resources and Environment Science, Chinese Academy of Sciences1 for 1980–2015, which were generated by 2,400 meteorological stations using the spatial interpolation method (Figures 2A,B). The ASTER GDEM (Advanced Spaceborne Thermal Emission and Reflection Radiometer Global Digital Elevation Model, downloaded from https://earthdata.nasa.gov/) with 30 m resolution was mainly used to analyze the pattern and change of NDVI with variable altitude. Land cover data sets (1 km resolution) for 1990, 1995, 2000, 2005, 2010 and 2015 were downloaded from the Data Center of Resources and Environment Science, Chinese Academy of Sciences (see text footnote 1) (Figure 2C). The soil type data (Figure 2D), population density (1990–2015), and GDP data (1995–2015) (all with 1 km resolution) were also downloaded from the Data Center of Resources and Environment Science, Chinese Academy of Sciences (see text footnote 1). Among of them, the soil type data were digitally generated according to the “1: 1,000,000 Soil Map of the People’s Republic of China” compiled and published by the National Soil Census Office in 1995 (Figure 2D); the population density data and GDP data were based on the statistics of population and GDP by county, using the multi-factor weight distribution method to calculate the distribution weights of land use type, night light brightness, residential area density, and other related factors (Xu and Zhang, 2017) (Figures 2E,F). These data were used to analyze the influencing factors on NDVI pattern and change.
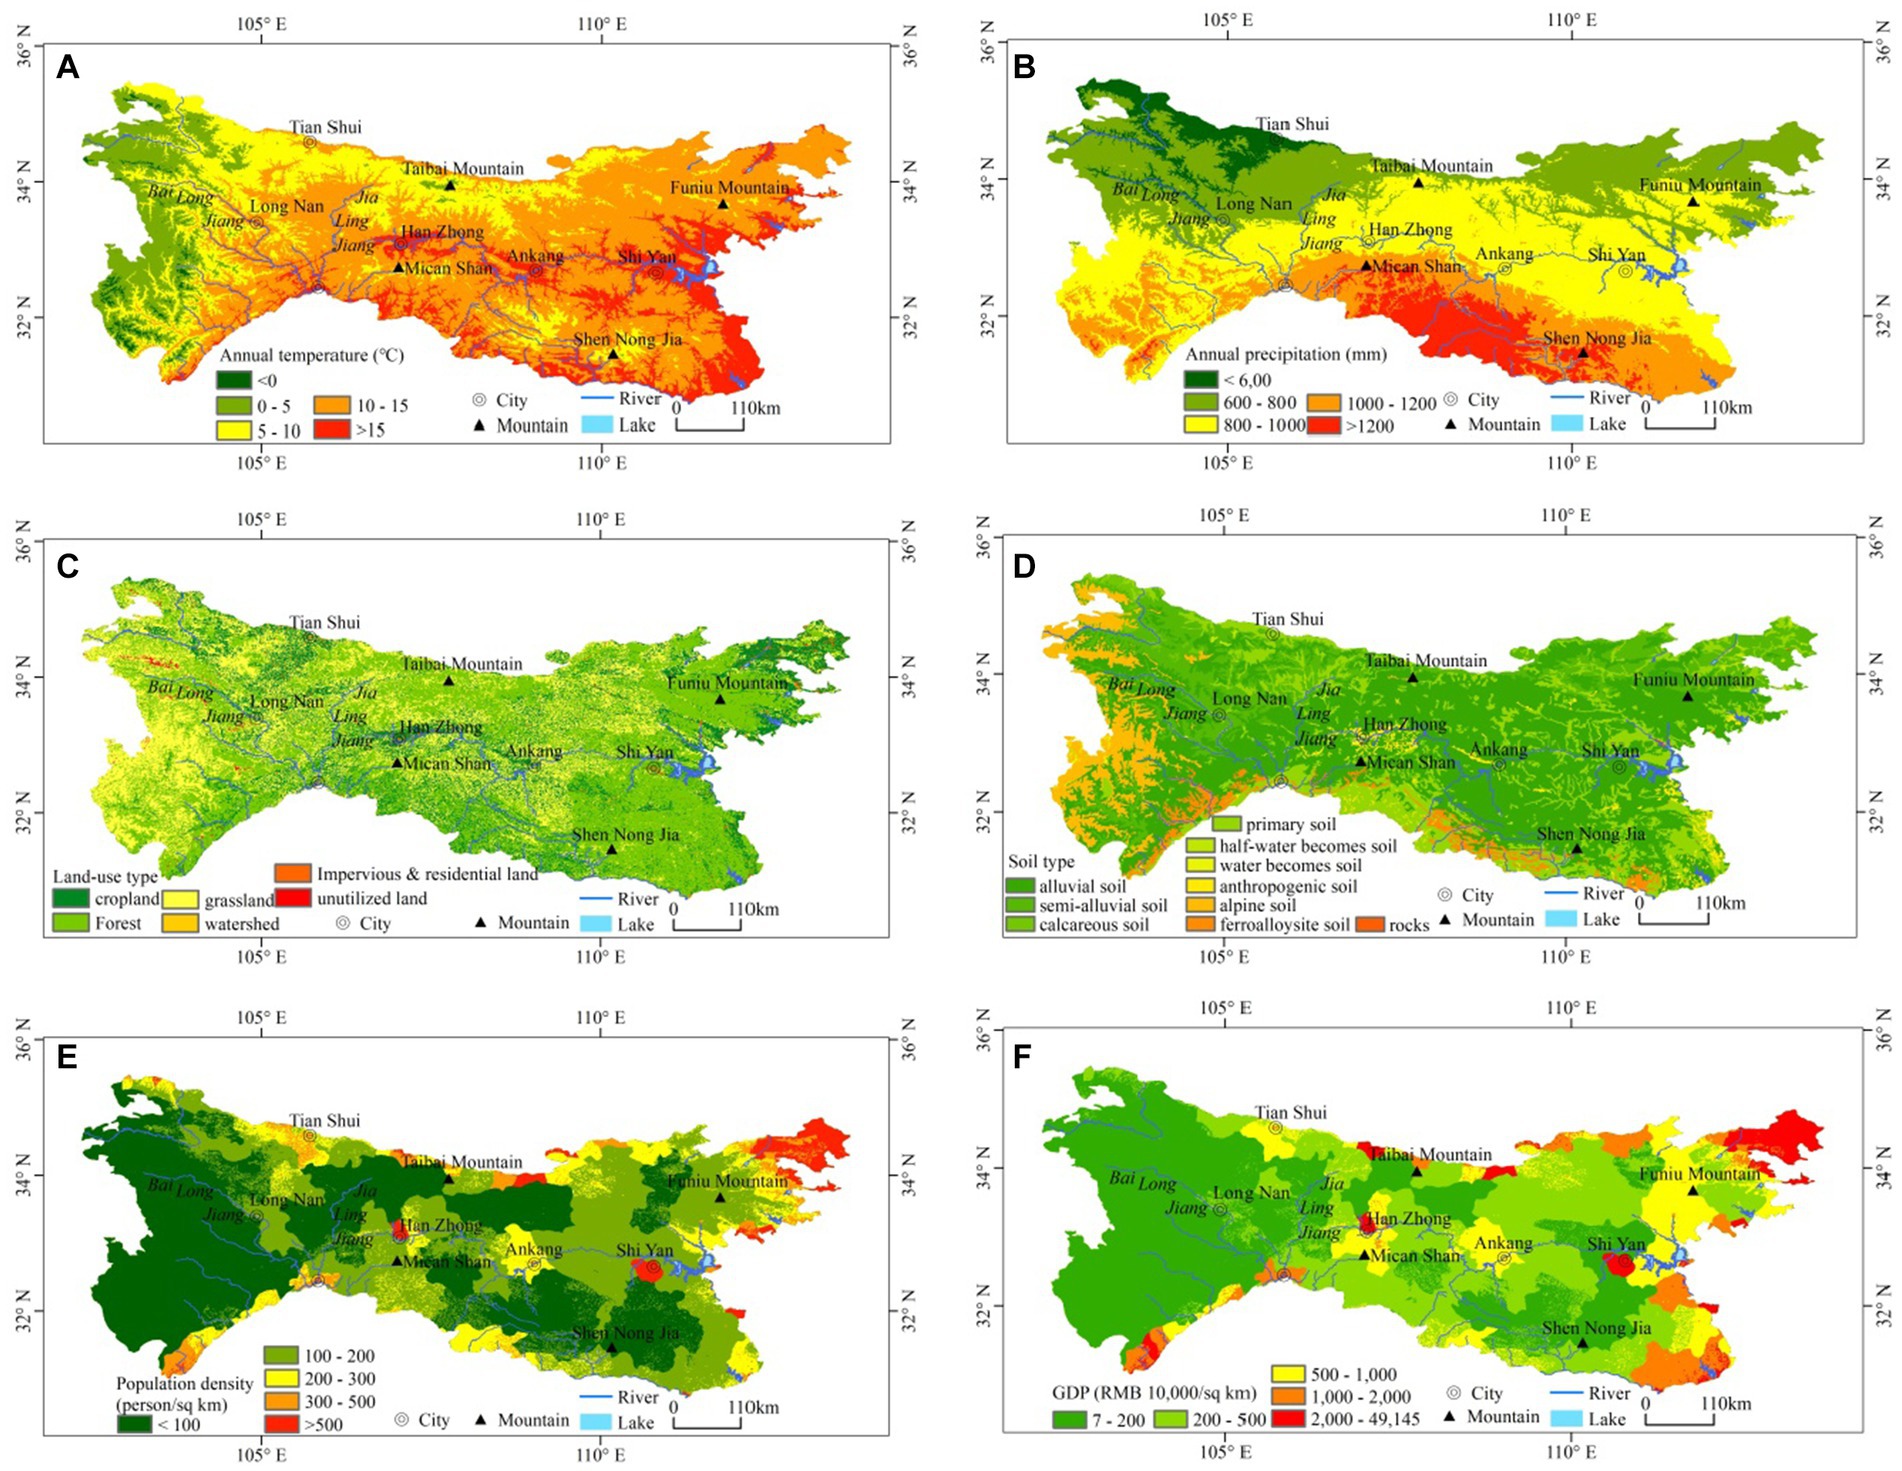
Figure 2. Main data and maps used in this study [(A) annual temperature; (B) annual precipitation; (C) land cover and land use in 2015; (D) soil map; (E) population density in 2015; (F) GDP in 2015].
2.3 Methods
Firstly, the spatial patterns and dynamics of NDVI were analyzed. The Sen trend method (Sen, 1968) and Mann-Kendall (MK) significant test were used to analyze the NDVI trend for 1986–2019. The Sen trend method can effectively avoid the influence of time series data loss and data distribution form, and eliminate the interference of time series outliers (Liu et al., 2010), and the MK significant test (Mann, 1945; Kendall, 1975) was conducted to test the significance of the calculated Sen trend. The MK mutation test (Karpouzos et al., 2010) was used to determine the mutated NDVI change period and to discover the dynamic process of NDVI. The spatial patterns of NDVI along latitude, longitude and elevation in the Qinling-Daba Mountains were investigated by profile analysis (along 33.6° N and 107° E) and statistical analysis methods.
Then, the main environmental influencing factors of NDVI pattern and its change were investigated by Geodetector analysis. As we know, climatic factors such as temperature, precipitation, light and seasonal variation are the main factors influencing vegetation distribution, and soil factors such as soil type, texture, pH, and nutrient content have important effects on vegetation growth (Brady and Weil, 2008; Marschner, 2012). Topography regulates the local re-distribution of precipitation, soil moisture, and solar radiation, which in turn affect the distribution of vegetation (Bonan, 2015; Turner et al., 2001). Therefore, four factors, including soil type, DEM (as a combination of topographical factors such as elevation and slope), temperature and precipitation, were selected as the regional environmental influencing factors of NDVI pattern. Previous studies have found that climate change was the main driving factor for NDVI changes, although human activities also had important effects on NDVI changes, but it was weaker than that of these climate factors (Pei et al., 2019; Yang and Han, 2019; Tao et al., 2020; Zhang et al., 2020). Therefore, temperature, precipitation, and three human activity factors including population density, GDP, and land use type (Table 1) were selected to reveal the driving factors of NDVI change in the Qinling-Daba Mountains based on the above mentioned data every five years. As the input data of the Geodetector requires classified data, all the selected factors were classified into the classified data with 9 categories by the natural breakpoint method.
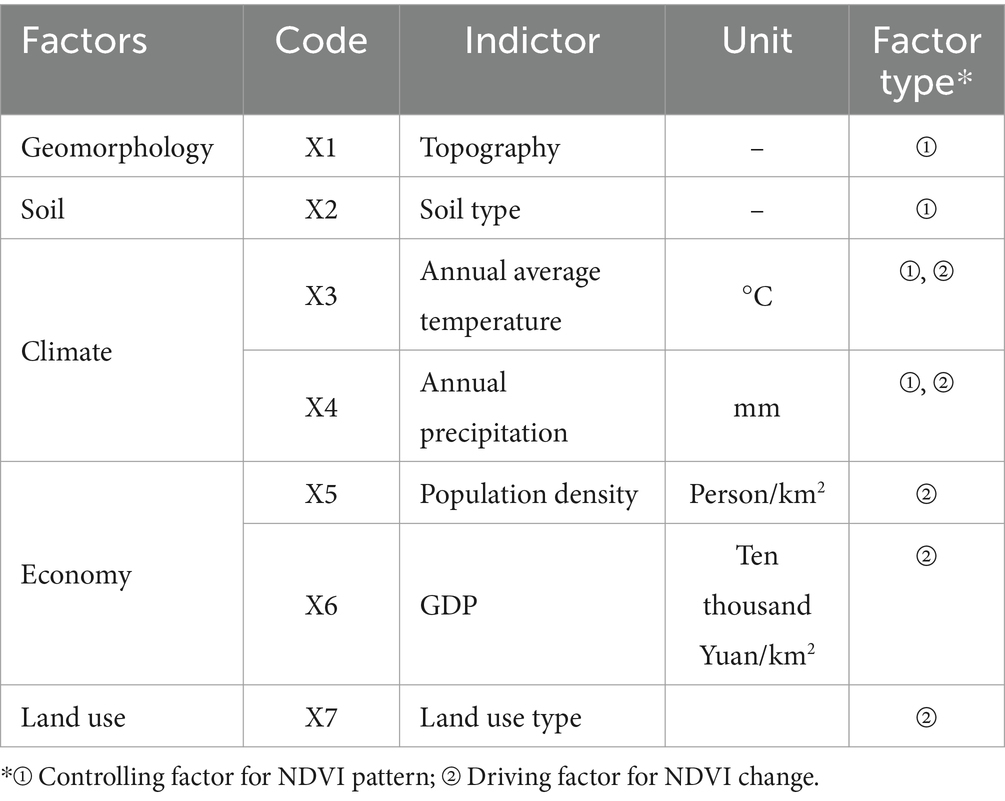
Table 1. Environmental influencing factors for NDVI pattern and change in the Qinling-Daba Mountains.
The Geodetector method was constructed on the assumption that when an independent variable has an important effect on a dependent variable, the spatial distribution of the independent variable and the dependent variable should be similar (Wang and Hu, 2012; Wang et al., 2010; Wang and Xu, 2017). It can quantitatively express the spatial stratification heterogeneity of the research object by analyzing the similarities and differences between the intra-layer variance and the inter-layer variance (Hu et al., 2011; Wang et al., 2013). At present, it has been widely used to detect the driving factors in many studies, such as land use (Hu et al., 2011), public health (Wang et al., 2013), regional economy (Ding et al., 2014), regional planning (Liu and Yang, 2012; Yang et al., 2016), meteorology and environment (Du et al., 2016), and vegetation change (Peng et al., 2019; Wang J. et al., 2019; Wang W. et al., 2019). Therefore, this study used the Geodetector method to detect the influencing factors of vegetation pattern and change. The Q-statistic in Geodetector can be used to measure spatial stratified heterogeneity, detect explanatory factors, and analyze the interactive relationship between variables (Wang and Xu, 2017). The range of the Q-statistic is [0, 1], and a larger value of the Q-statistic indicates that the independent variable has the stronger explanatory power on the dependent variable (Wang and Xu, 2017). At the extremes, a Q-statistic value of 1 indicates that the independent variable (X) completely controls the spatial distribution of the dependent variable (Y), and a Q-statistic value of 0 indicates that the independent variable of X has no relationship with the dependent variable of Y. The P-statistic, which corresponds to the Q-statistic of the independent variable (X), can be used to represent the significance of the variable X on the dependent variable Y. For example, a P-statistic of less than 0.05 means that the effect of the variable X on the dependent variable Y is significant, and a P-statistic of less than 0.01 means that the effect of the variable X on the dependent variable Y is highly significant, which can be interpreted as the smaller the P-statistic, the greater the reliability of the inference that a certain type of independent variable X has an effect on the dependent variable Y.
3 Results
3.1 NDVI spatial patterns and changes in the Qinling-Daba Mountains
3.1.1 The spatial patterns of NDVI
According to the spatial distribution of the average NDVI in the Qinling-Daba Mountains from 1986 to 2019 (Figure 3A), the NDVI showed a U-shaped distribution pattern in latitude and an anti-U-shaped pattern in longitude and with increasing altitude (Figures 3C–E). Mountainous areas such as Qinling Mountains and Daba Mountains, especially the nature reserves such as Shennongjia Nature Reserve and Taibai Mountain Nature Reserve, etc., had higher NDVI average value (above 0.8) than other areas (e.g., Hanzhong Basin area). The Hanzhong Basin-Hanshui Valley in the middle of the Qinling-Daba Mountains, the low-altitude areas of the Funiu Mountain, and some areas in Gansu and Sichuan provinces had lower average NDVI values (between 0.4 and 0.6) than these mountainous areas, and the NDVI values around the cities along the Hanjiang River were even lower than 0.3. The NDVI values in the low-altitude areas in the northeast of the study area and the high-altitude areas in the west of the study area were also relatively low. Statistical analysis of NDVI mean values at different altitudes showed that the NDVI first increased and then decreased with increasing altitude: the NDVI mean value at an altitude below 500 m was 0.6857, at altitudes between 1,000 m and1500 m was 0.7884, and slightly decreased (from 0.7743 to 0.7343) at altitudes between 1,500 m and 3,500 m; above 3,500 m, the NDVI mean value decreased significantly; above 4,000 m, the NDVI mean value decreased to 0.4429 (Figure 3E). The spatial pattern of NDVI in the Qinling-Daba Mountains showed that the physical topography, such as elevation, played an important role in the NDVI pattern.
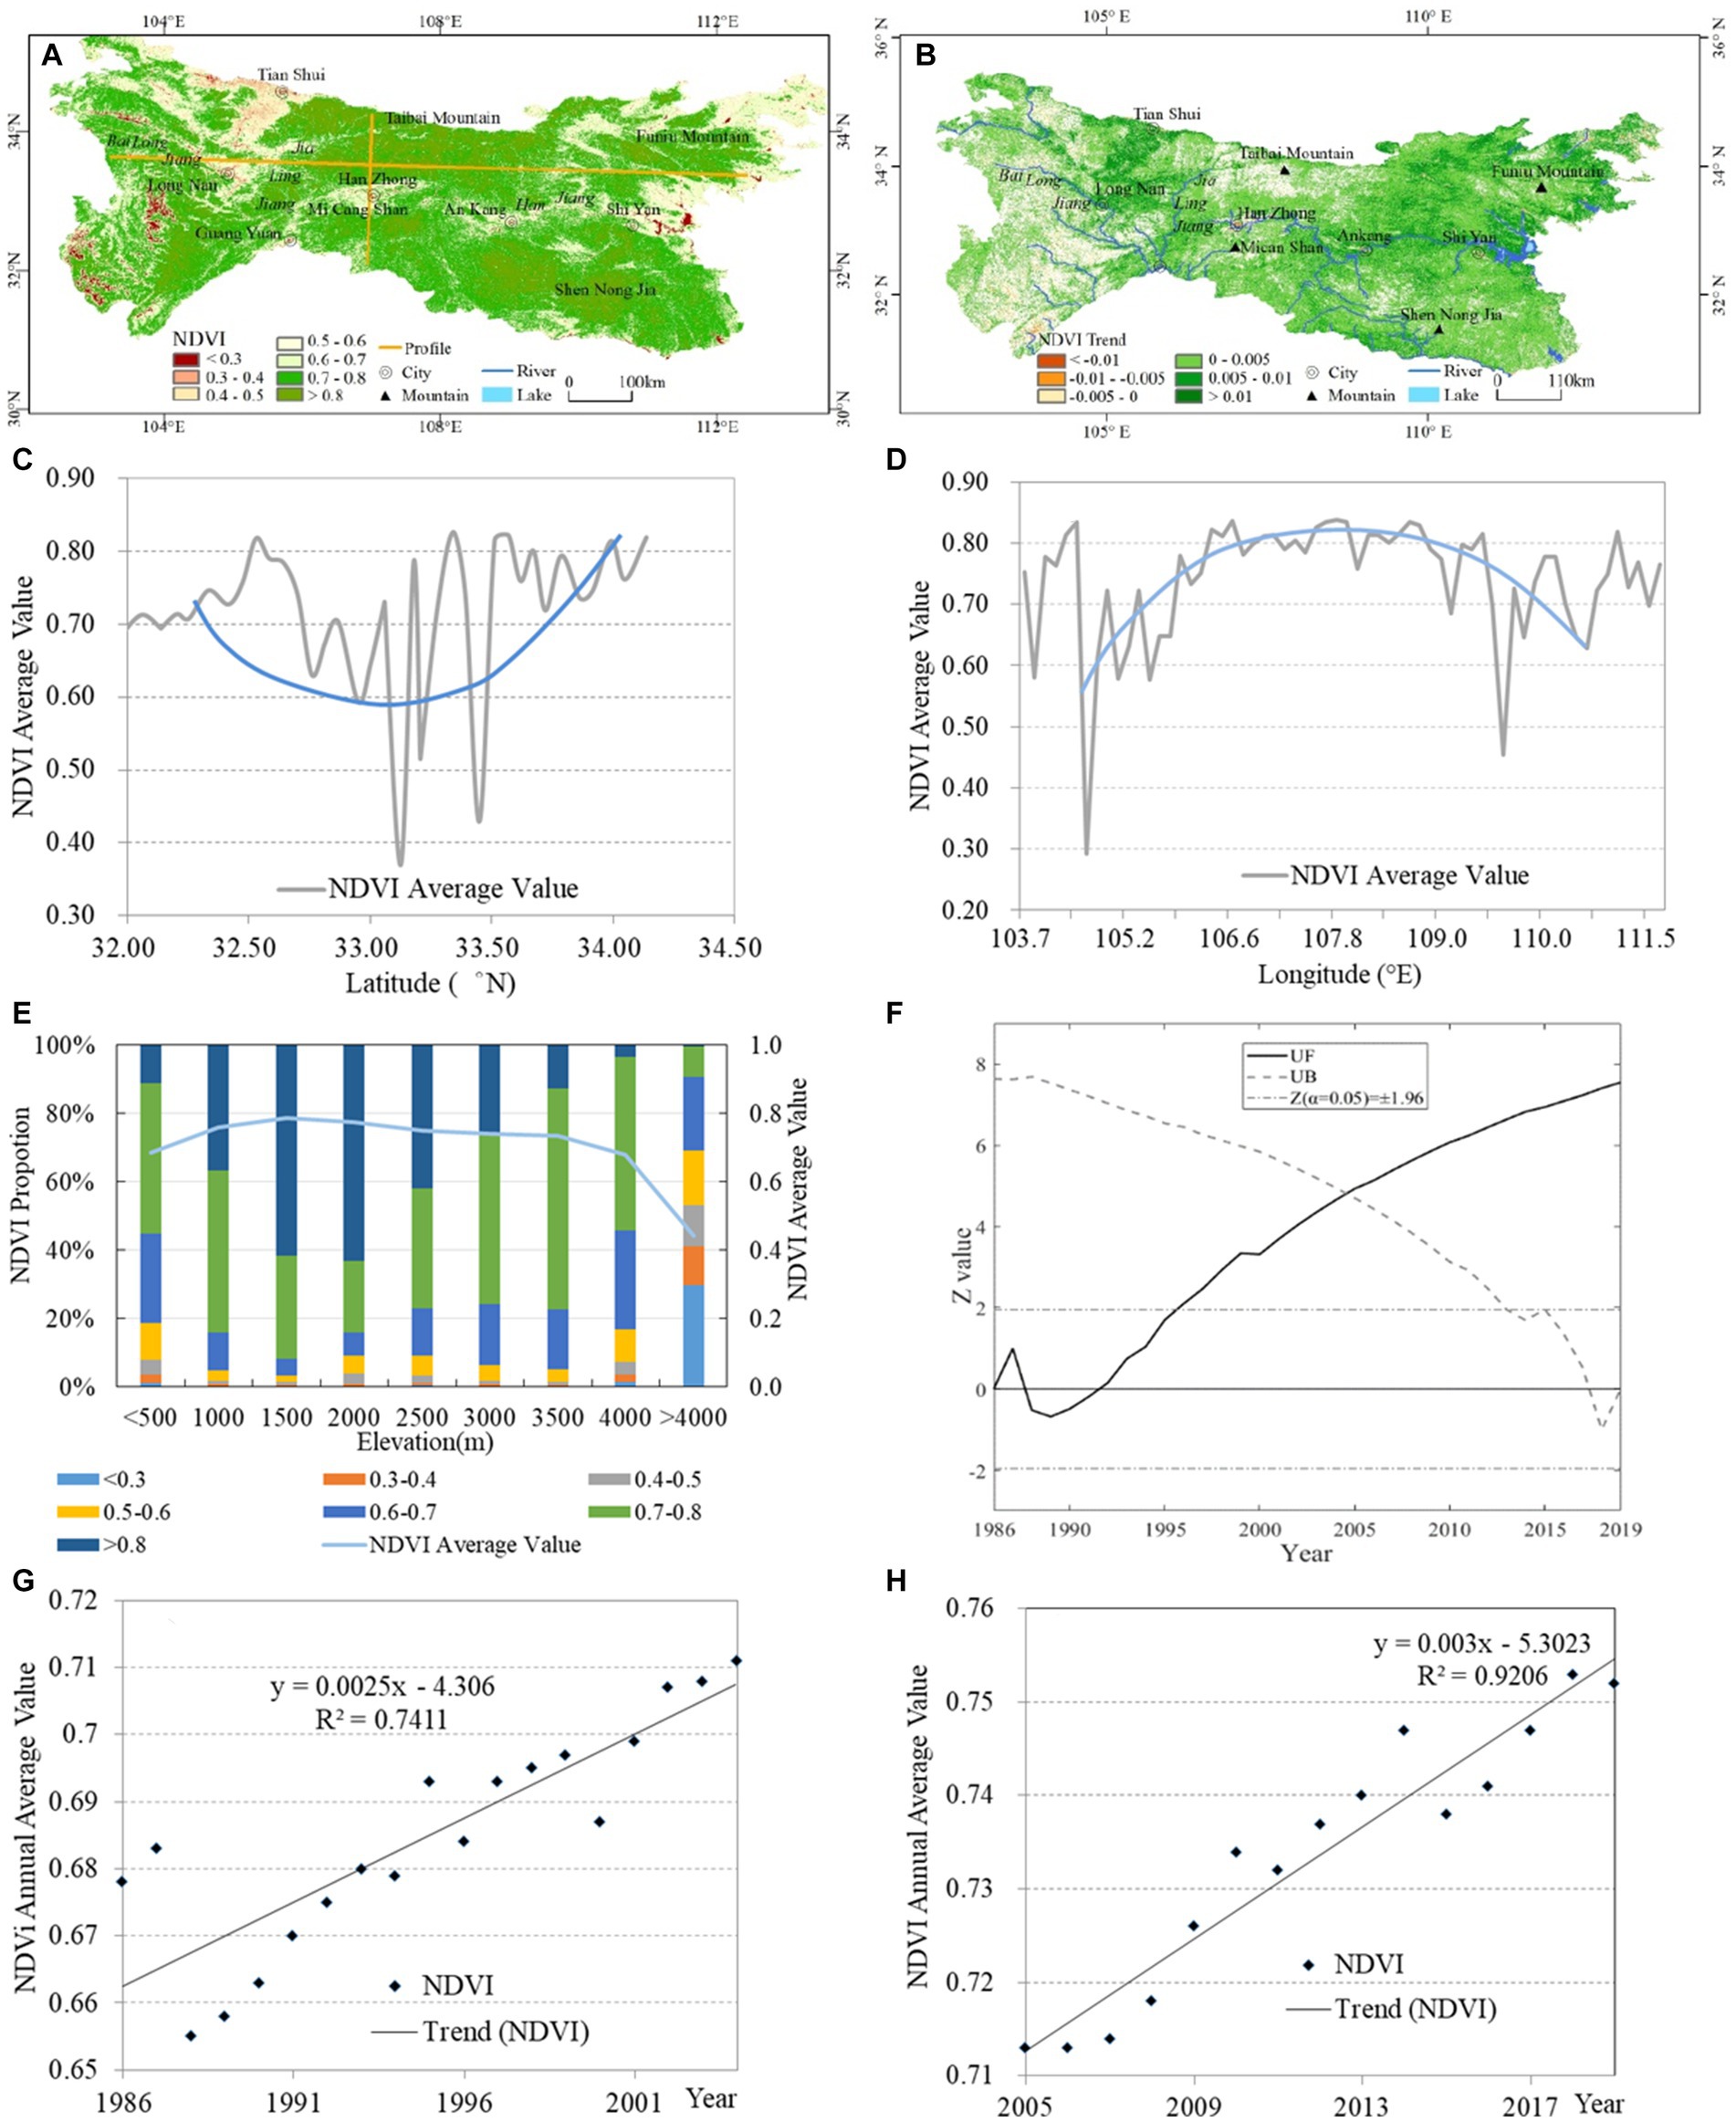
Figure 3. The temporal and spatial patterns of the average NDVI in the Qinling-Daba Mountains from 1986 to 2019 [(A) Multi-year average NDVI from 1986 to 2019; (B) Temporal and spatial variation of NDVI Sen trend from 1986 to 2019; (C) Multi-year average NDVI along 107°E profile; (D) multi-year average NDVI along 33.6°N profile; (E) multi-year average NDVI at elevation; (F) MK mutation test of NDVI in the Qinling-Daba Mountains for 1986–2019; (G) Annual average NDVI trend from 1986 to 2004; (H) Annual average NDVI trend from 2005 to 2019].
3.1.2 The temporal changes of NDVI
From 1986 to 2019, the NDVI in the Qinling-Daba Mountains showed a significant upward trend, with an average increase rate of 0.28%/a (R2 of 0.943) (Figures 3B,G,H), indicating the continuous improvement of the vegetation cover in the study area, which was also found in the previous studies (Liu et al., 2015; Yao and Cui, 2022; Chen et al., 2019a,b). Another characteristic of the NDVI change was that the upward trend of NDVI was more obvious in the low-altitude areas (below 1,500 m), while the high-altitude mountainous areas (above 2000–3,000 m), especially the nature reserves, tended to remain stable, which was also found in our previous study (Yao and Cui, 2022). For example, the places of Longnan County-Tianshui County in Gansu Province, the western part of Funiu Mountain, and the water conservancy area of the South to North Water Transfer Project had higher increasing rates of NDVI value, although where the NDVI values were slightly lower. On the contrary, the western mountainous areas of the study area and the nature reserves (such as the Taibai Mountain Nature Reserve and Shennongjia Nature Reserve) with high NDVI mean value had lower increasing rates, and the Sen trend values were between-0.005 and 0.005 (which did not pass the significant test at 0.05 level). Of cause, the NDVI value in the surrounding areas of cities and towns showed a decreasing trend (Figure 3B).
The result of MK mutation test on NDVI time series from 1986 to 2019 was the same as that from 1990 to 2019 (Yao and Cui, 2022), which showed that NDVI had a breakthrough increase around 2005 (Figure 3F). Combined with the growth and development characteristics of vegetation, the dynamic process of NDVI in the Qinling-Daba Mountains could be divided into two periods: the slow increasing period with an increasing rate of 0.25%/a from 1986 to 2004 (R2 0.74), and the rapid increasing period with an increasing rate of 0.30%/a from 2005 to 2019 (R2 0.92).
3.2 Environmental influencing factors of NDVI patterns and changes
The Q-statistics of the four factors on vegetation cover pattern were ranked as soil type (X2) > topography (X1) > annual average temperature (X3) > annual precipitation (X4) (Table 2), which showed that physical environmental factors (soil and topography) played stronger influencing roles on the NDVI spatial pattern than climate factors in Qinling-Daba Mountains.
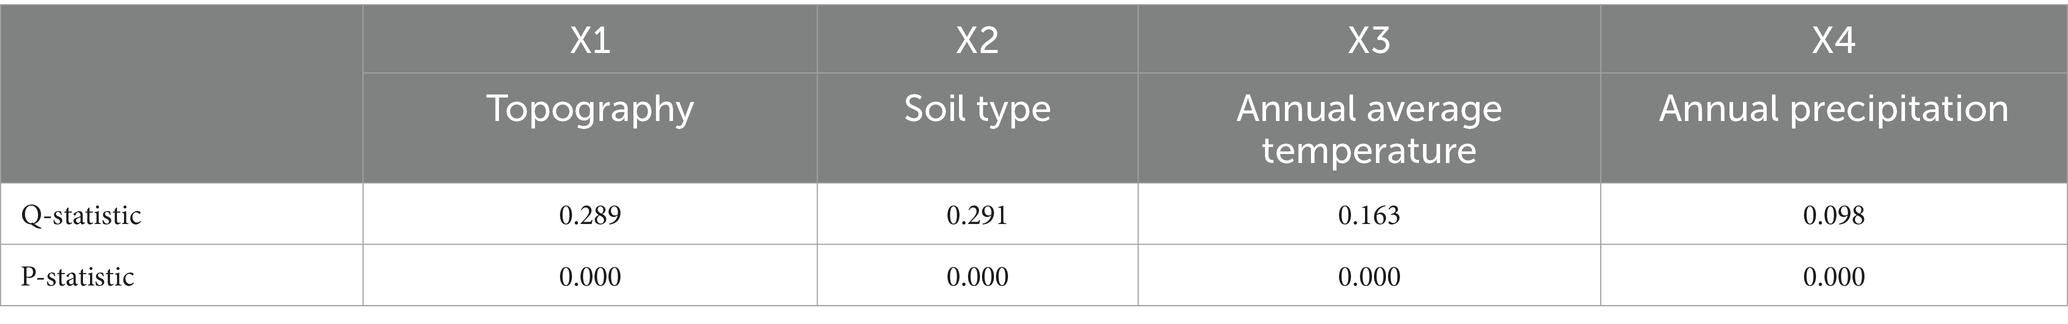
Table 2. Geodetector analysis results of environmental factors on NDVI pattern in Qinling-Daba Mountains.
Based on the Geodetector analysis of environmental factors on NDVI change, the explanatory power (Q-statistic) of each factor was ranked as follows: land use type (X7) > annual average temperature (X3) > annual precipitation (X4) > population density (X5) > GDP (X6) (Table 3). This result showed that land use and temperature had stronger effects on regional NDVI changes than precipitation, and the effect of land use was stronger than that of temperature. The effects of population density (X6) and GDP (X7) were relatively weak (Q-statistic less than 0.06).
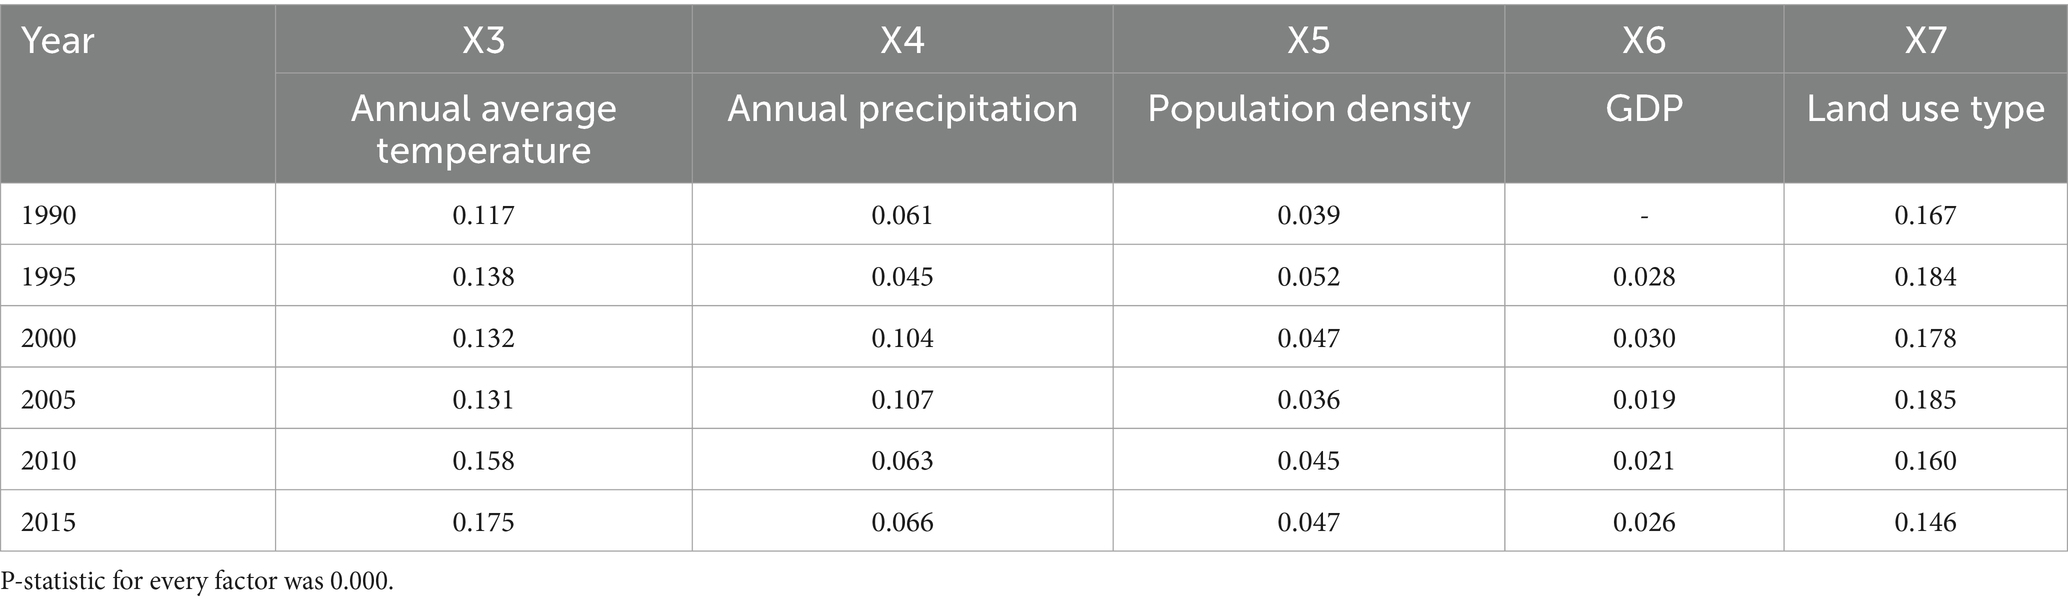
Table 3. Q-statistics of Geodetector analysis for environmental influencing factors of NDVI change in the Qinling-Daba Mountains.
4 Discussion
4.1 Environmental influences on NDVI spatial pattern at the regional scale
When studying NDVI changes and patterns, climate and anthropogenic factors are often considered, but other environmental factors such as soil and topography are often neglected. It is well known that soil properties such as soil type, texture, pH, and nutrient content have important effects on vegetation growth (Brady and Weil, 2008; Marschner, 2012), and topography redistributes local hydrothermal conditions and soil nutrients, resulting in the changes in temperature, precipitation and vegetation along elevation (Bonan, 2015; Turner et al., 2001; Zhang et al., 2009). In this study, although temperature and precipitation played important roles in the distribution and growth of vegetation, their effects on the spatial pattern of NDVI at the regional scale were weaker than soil and topography. In particular, the effect of precipitation on NDVI pattern was weaker than that of temperature in the study area. Therefore, when studying the influencing factors of NDVI patterns at different scales, we should fully consider the effects of various environmental factors.
4.2 Effects of land use on NDVI changes in the study area
A recent study showed that the “Greening Earth” was attributed to human land use practices in China and India (Chen et al., 2019a,b). This study (Table 3) and other related studies on NDVI change in the Qinling-Daba Mountains also showed that land use had a great influence on NDVI change (Yao and Cui, 2022; Cui et al., 2012; Sun et al., 2010). The Qinling-Daba Mountains is not only an ecological functional area for biodiversity conservation in China, but also a water conservation area for the “South to North Water Transfer Project” in China. Many nature reserves (over 30), national forest parks (about 37), national geological parks (11), and scenic spots (over 7) have been established in the study area from the 1960s to the present. The good condition of the vegetation was one of the achievements of these environmental protections. In addition, the rapid increase of NDVI in the areas below 1,500 m was partly contributed by the land use policies (Chen et al., 2019a,b; Yao and Cui, 2022). The Chinese government issued the Grain-for-Green policy in 1999–2000, and local governments formulated strict implementation measures (Chen et al., 2019a,b; Chen et al., 2006; Zhang et al., 2010). One of the achievements of Grain-for-Green was that croplands in mountainous areas with slopes steeper than 25° were required to be returned to forest (or grassland), and those with slopes between 15° and 25° were conditionally returned to forest or grassland (Chen et al., 2006; Zhang et al., 2010). During the field survey of the “Comprehensive Scientific Investigation of the North–South Transitional Zone” project, it was also found that a large number of croplands in the mountainous areas below 1,500 m were returned to forest. Moreover, the croplands also contributed to the increase in NDVI due to the rapid growth of hybrid cultivars, multiple cropping, irrigation, fertilizer use, pest control, improved seed quality, farm mechanization, credit availability, and crop insurance schemes (Chen et al., 2019a,b; Yao and Cui, 2022). Therefore, places below 1,500 m have higher NDVI increases, and the breakthrough increase period was around in 2005 (Figure 3). All these indicate that land use in the Qinling-Daba Mountains has had a positive effect on vegetation dynamics in recent years, and its effect on NDVI change was even stronger than that of climate warming. The temperature of the study area has been warming significantly, while the precipitation has been increasing slightly (Yao and Cui, 2022). That is why the effect of precipitation was weaker than that of land use and temperature on NDVI change in this area.
4.3 Appropriate indicators of anthropogenic factors
Due to the lack of high-resolution quantitative data on human activities (Xie and Yao, 2024), most quantitative analyses of human activities have focused on land use, population density, or GDP. However, except for land use data, the resolution and quality of population density and GDP data are not good enough to characterize human activities. As a result, the results obtained are not satisfactory. Additionally, infrastructure construction such as transportation and roads, social and economic development, and urbanization also affect the NDVI change. Therefore, which indicators can better reflect the impact of human activities on NDVI, especially how to objectively evaluate the impact of human activities on NDVI, remains to be further explored. Moreover, human activities have greatly affected every aspect of the Earth and have a profound influence on vegetation change, so there is a need for a more comprehensive indicator that can synthesize the various human activities. Recently, quantitative methods for assessing and analyzing the impact of human activities on the natural environment, as well as data products, have also developed rapidly. Human activity intensity (HAI) has been widely used to assess and quantify the impacts of human activities on landscapes (Goudie, 2018; Shrestha et al., 2021). There are some useful HAI data products such as HAI data (Xie and Yao, 2024), the global human footprint map (Sanderson et al., 2002; Venter et al., 2016; Mu et al., 2022) and the wildness map (Lin et al., 2016; Cao et al., 2019), which can greatly facilitate our analysis of the impact of human activities on NDVI.
5 Conclusion
The aim of this study is to discover the spatial pattern of NDVI and its environmental influencing factors in Qinling-Daba Mountains, and to find out which factor among of them plays a more important role in the NDVI change in recent decades. The conclusions of this study are as follows:
1. NDVI in the Qinling-Daba Mountains showed a U-shaped pattern in latitude, and anti-U-shaped patterns in longitude and with increasing altitude, indicating that the topography played an important role in the regional NDVI pattern.
2. NDVI in the Qinling-Daba Mountains showed a significant upward trend and experienced a dynamic change process (with a breakthrough increase period around 2005) for 1986–2019. According to the results of this study, the process of vegetation dynamics could be divided into two periods: the slow increase period from 1986 to 2004 (with an increase rate of 0.25%/a) and the rapid increase period from 2005 to 2019 (with an increase rate of 0.30%/a). The rapid increase period was coincided with the implementation period of the Grain-for-Green project and other ecological restoration projects in the early 21st century, which showed that land use, especially those forest conservation and expansion programs, strongly contributed to the NDVI increase.
3. Soil and topography played a more important role in the spatial pattern of NDVI than climate (temperature and precipitation) at the regional scale. The effect of land use on NDVI change was stronger than that of climate warming (temperature), and the climate warming in recent decades played a more important role than precipitation on the NDVI dynamics.
The results of this study indicated that the physical environmental factors such as soil, topography and climate control the spatial pattern of NDVI, and human activities play a more important role in NDVI change than climate change in recent decades. It is useful for the government and other related agencies to formulate plans or policies for infrastructure development and land management, ecological restoration.
Data availability statement
The datasets presented in this study can be found in online repositories. The names of the repository/repositories and accession number(s) can be found at: the NDVI data for 1986–2019 used in this study are available from the authors upon request; ASTER GDEM can be downloaded from https://earthdata.nasa.gov/; Land cover and land use, soil, geomorphology, temperature and precipitation, vegetation type map, population density and GDP data can be accessed from the Data Center of Resources and Environment Science, Chinese Academy of Sciences (http://www.resdc.cn).
Author contributions
YY: Conceptualization, Data curation, Formal analysis, Funding acquisition, Investigation, Methodology, Project administration, Resources, Software, Supervision, Validation, Visualization, Writing – original draft, Writing – review & editing.
Funding
The author(s) declare financial support was received for the research, authorship, and/or publication of this article. This work was funded by the Strategic Priority Research Program of the Chinese Academy of Sciences (Grant No. XDB0740200); the National Natural Science Foundation of China (grant number: 41871350); and the Key Project of Innovation LREIS (grant number: KPI008).
Acknowledgments
I am grateful to Kou Zhixiang for his work of NDVI data processing. I gratefully acknowledge the Data Center of Resources and Environment Science, Chinese Academy of Sciences for providing relevant data. My appreciation also goes to editors and reviewers, whose comments and suggestions helped to greatly improve the manuscript.
Conflict of interest
The author declares that the research was conducted in the absence of any commercial or financial relationships that could be construed as a potential conflict of interest.
Publisher’s note
All claims expressed in this article are solely those of the authors and do not necessarily represent those of their affiliated organizations, or those of the publisher, the editors and the reviewers. Any product that may be evaluated in this article, or claim that may be made by its manufacturer, is not guaranteed or endorsed by the publisher.
Footnotes
References
Albani, M., Medvigy, D., Hurtt, G. C., and Moorcroft, P. R. (2006). The contributions of land-use change, CO2 fertilization, and climate variability to the eastern US carbon sink. Glob. Chang. Biol. 12, 2370–2390. doi: 10.1111/j.1365-2486.2006.01254.x
Anyamba, A., and Tucker, C. J. (2005). Analysis of Sahelian vegetation dynamics using NOAA-AVHRR NDVI data from 1981–2003. J. Arid Environ. 63, 596–614. doi: 10.1016/j.jaridenv.2005.03.007
Bonan, G. (2015). Ecological climatology: Concepts and applications. Cambridge: Cambridge University Press.
Brady, N. C., and Weil, R. R. (2008). The nature and properties of soils. 14th Edn. Upper Saddle River: Pearson Prentice Hall.
Cao, Y., Carver, S., and Yang, R. (2019). Mapping wilderness in China: comparing and integrating Boolean and WLC approaches. Landsc. Urban Plan. 192:103636. doi: 10.1016/j.landurbplan.2019.103636
Chen, Y. Q., Liu, L. M., Lai, M., and Li, J. L. (2006). The research on the policy system of cropland conversion program-case study at Wuchuan County. Res. Soil Water Conserv. 13:54. doi: 10.1016/S1872-2032(06)60052-8
Chen, C., Park, T., Wang, X., Piao, S., Xu, B., Chaturvedi, R. K., et al. (2019a). China and India lead in greening of the world through land-use management. Nat. Sustain. 2, 122–129. doi: 10.1038/s41893-019-0220-7
Chen, C., Zhu, L., Tian, L., and Li, X. (2019b). Spatial-temporal changes in vegetation characteristics and climate in the Qinling-Daba Mountains. Acta Ecol. Sin. 39, 3257–3266. doi: 10.5846/stxb201801300252
Cui, X., Bai, H., and Shang, X. (2012). The vegetation dynamic in Qinling area based on MODIS NDVI. J. Northwest Univ. 42, 1021–1026. doi: 10.16152/j.cnki.xdxbzr.2012.06.038
Deng, C., Bai, H., Gao, S., Liu, R., Ma, X., Huang, X., et al. (2018). Spatial-temporal variation of the vegetation coverage in Qinling Mountains and its dual response to climate change and human activities. J. Nat. Resour. 33, 425–438. doi: 10.11849/zrzyxb.20170139
Ding, Y., Cai, J., Ren, Z., and Yang, Z. (2014). Spatial disparities of economic growth rate of China’s national-level ETDZs and their determinants based on geographical detector analysis. Prog. Geogr. 33, 657–666. doi: 10.11820/dlkxjz.2014.05.007
Du, Z., Xu, X., Zhang, H., Wu, Z., and Liu, Y. (2016). Geographical detector-based identification of the impact of major determinants on Aeolian desertification risk. PLoS One 11:e0151331. doi: 10.1371/journal.pone.0151331
Fang, J., Piao, S., He, J., and Ma, W. (2003). Vegetation of China is invigorated in recent 20 years. Sci. China Series C 6, 554–565.
Goudie, A. S. (2018). Human impact on the natural environment. New York, America: John Wiley & Sons.
He, Y., Bai, H., Gao, X., and Ma, X. (2011). Analysis on the variation tendency of vegetation cover of Micang Mountains. Acta Botan. Boreali-Occiden. Sin. 31, 1677–1682.
Hu, Y., Wang, J., Li, X., Ren, D., and Zhu, J. (2011). Geographical detector-based risk assessment of the under-five mortality in the 2008 Wenchuan earthquake, China. PLoS One 6:e21427. doi: 10.1371/journal.pone.0021427
Hussain, S., Mubeen, M., Ahmad, A., Majeed, H., Qaisrani, S. A., Hammad, H. M., et al. (2023). Assessment of land use/land cover changes and its effect on land surface temperature using remote sensing techniques in southern Punjab, Pakistan. Environ. Sci. Pollut. Res. 30, 99202–99218. doi: 10.1007/s11356-022-21650-8
Hussain, S., Mubeen, M., and Karuppannan, S. (2022). Land use and land cover (LULC) change analysis using TM, ETM+ and OLI Landsat images in district of Okara, Punjab, Pakistan. Phys. Chem. Earth 126:103117. doi: 10.1016/j.pce.2022.103117
Jiang, M., He, Y., Song, C., Pan, Y., Qiu, T., and Tian, S. (2021). Disaggregating climatic and anthropogenic influences on vegetation changes in Beijing-Tianjin-Hebei region of China. Sci. Total Environ. 786:147574. doi: 10.1016/j.scitotenv.2021.147574
Jong, R., Bruin, S., Wit, A., Schaepman, M. E., and Dent, D. L. (2011). Analysis of monotonic greening and browning trends from global NDVI time-series. Remote Sens. Environ. 115, 692–702. doi: 10.1016/j.rse.2010.10.011
Karpouzos, D., Kavalieratou, S., and Babajimopoulos, C. (2010). Trend analysis of precipitation data in Pieria region (Greece). Europ. Water 30, 30–40.
Kou, Z. (2021). Analysis on the spatio-temporal variation and driving factors of vegetation index (NDVI) in Qinba Mountains. Master: The University of Chinese Academy of Sciences, Beijing.
Kou, Z., Yao, Y., Hu, Y., and Zhang, B. (2020). Discussion on position of China’s north-south transitional zone by comparative analysis of mountain altitudinal belts. J. Mt. Sci. 17, 1901–1915. doi: 10.1007/s11629-019-5893-x
Li, P., Jiang, Y., Qi, P., and Wang, L. (2022). Spatio-temporal evolution characteristics of vegetation in water source area of the middle route project of south-to-north water diversion. J. Yangtze River Sci. Res. Inst. 39, 49–55. doi: 10.11988/ckyyb.20210505
Lin, S., Wu, R., Hua, C., Ma, J., Wang, W., Yang, F., et al. (2016). Identifying local-scale wilderness for on-ground conservation actions within a global biodiversity hotspot. Sci. Rep. 6:25898. doi: 10.1038/srep25898
Liu, Y., and Lei, H. (2015). Responses of natural vegetation dynamics to climate drivers in China from 1982 to 2011. Remote Sens. 7, 10243–10268. doi: 10.3390/rs70810243
Liu, Y., and Lu, L. (1990). Exploitation and utilization for agricultural natural resources in Qinling-Daba mountainous region of Shanxi Province. J. Moutain Res. 8, 45–52. doi: 10.16089/J.cnki.1008-2786.1990.01.010
Liu, X., Pan, Y., Zhu, X., and Li, S. (2015). Spatiotemporal variation of vegetation coverage in Qinling-Daba Mountains in relation to environmental factors. Acta Geograph. Sin. 70, 705–716. doi: 10.11821/dlxb201505003
Liu, Y., Wang, Q., Bi, J., Zhang, M., Xing, Q., and Shi, P. (2010). The analysis of NDVI trends in the coastal zone based on Mann-Kendall test: a case in the Jiaodong peninsula. Acta Oceanol. Sin. 32, 79–87.
Liu, Y., and Yang, R. (2012). The spatial characteristics and formation mechanism of the county urbanization in China. Acta Geograph. Sin. 67, 1011–1020.
Luo, X. (2009). Spatial-temporal changes of NDVI and the response to the regional climate in the Qinling-Daba Mountains for 25 years. Xi’an City: Northwest University.
Ma, Z., Peng, C., Zhu, Q., Chen, H., Yu, G., Li, W., et al. (2012). Regional drought-induced reduction in the biomass carbon sink of Canada's boreal forests. Proc. Natl. Acad. Sci. 109, 2423–2427. doi: 10.1073/pnas.1111576109
Mann, H. B. (1945). Nonparametric tests against trend. Econometrica 13, 245–259. doi: 10.2307/1907187
Marschner, P. (2012). Marschner's mineral nutrition of higher plants. 3rd Edn. London: Academic Press.
Mu, H., Li, X., Wen, Y., Huang, J., Du, P., Su, W., et al. (2022). A global record of annual terrestrial human footprint dataset from 2000 to 2018. Sci. Data 9:176. doi: 10.1038/s41597-022-01284-8
Nemani, R. R., Keeling, C. D., Hashimoto, H., Jolly, W. M., Piper, S. C., Tucker, C. J., et al. (2003). Climate-driven increases in global terrestrial net primary production from 1982 to 1999. Science 300, 1560–1563. doi: 10.1126/science.1082750
Parmesan, C., and Yohe, G. (2003). A globally coherent fingerprint of climate change impacts across natural systems. Nature 421, 37–42. doi: 10.1038/nature01286
Pei, Z., Yang, Q., Wang, C., and Yang, L. (2019). Spatial distribution of vegetation coverage and its affecting factors in the upper reaches of the Yellow River. Arid Zone Res. 36, 546–555. doi: 10.13866/j.azr.2019.03.03
Peng, W., Zhang, D., Luo, Y., Tao, S., and Xu, X. (2019). Influence of natural factors on vegetation NDVI using geographical detection in Sichuan Province. Acta Geograph. Sin. 74, 1758–1776. doi: 10.11821/dlxb201909005
Phillips, L. B., Hansen, A. J., and Flather, C. H. (2008). Evaluating the species energy relationship with the newest measures of ecosystem energy: NDVI versus MODIS primary production. Remote Sens. Environ. 112, 4381–4392. doi: 10.1016/j.rse.2008.08.002
Piao, S., Fang, J., Zhou, L., Guo, Q., Henderson, M., Ji, W., et al. (2003). Interannual variations of monthly and seasonal normalized difference vegetation index (NDVI) in China from 1982 to 1999. J. Geophys. Res. Atmos. 108, 554–565. doi: 10.1029/2002JD002848
Qin, J., Lai, S., and Li, Y. (2008). Slab breakoff model for the Triassic post-collisional Adakitic Granitoids in the Qinling Orogen, Central China: zircon U-Pb ages, geochemistry, and Sr-Nd-Pb isotopic constraints. Int. Geol. Rev. 50, 1080–1104. doi: 10.2747/0020-6814.50.12.1080
Qu, S., Wang, L., Lin, A., Yu, D., Yuan, M., and Li, C. (2020). Distinguishing the impacts of climate change and anthropogenic factors on vegetation dynamics in the Yangtze River basin, China. Ecol. Indic. 108:105724. doi: 10.1016/j.ecolind.2019.105724
Ren, Z., and Li, J. (2003). The valuation of ecological services from the vegetation ecosystems in the Qinling-Daba Mountains. Acta Geograph. Sin. 58, 503–511.
Ren, Y., Zhang, Z., Hou, Q., He, Y., and Yuan, B. (2012). Response of vegetation cover changes to climate change in Daba Mountains. Bull. Soil Water Conserv. 32, 56–59+271. doi: 10.13961/j.cnki.stbctb.2012.02.001
Sanderson, E. W., Jaiteh, M., Levy, M. A., Redford, K. H., Wannebo, A. V., and Woolmer, G. (2002). The human footprint and the last of the wild: the human footprint is a global map of human influence on the land surface, which suggests that human beings are stewards of nature, whether we like it or not. Bioscience 52, 891–904. doi: 10.1641/0006-3568(2002)052[0891:THFATL]2.0.CO;2
Schimel, D., Melillo, J., Tian, H., McGuire, A. D., Kicklighter, D., Kittel, T., et al. (2000). Contribution of increasing CO2 and climate to carbon storage by ecosystems in the United States. Science 287, 2004–2006. doi: 10.1126/science.287.5460.2004
Sen, P. K. (1968). Estimates of the regression coefficient based on Kendall's tau. J. Am. Stat. Assoc. 63, 1379–1389. doi: 10.1080/01621459.1968.10480934
Shrestha, N., Xu, X., Meng, J., and Wang, Z. (2021). Vulnerabilities of protected lands in the face of climate and human footprint changes. Nat. Commun. 12:1632. doi: 10.1038/s41467-021-21914-w
Stott, P., Stone, D., and Allen, M. (2004). Human contribution to the European heatwave of 2003. Nature 432, 610–614. doi: 10.1038/nature03089
Sun, H., Bai, H., Zhang, Q., Luo, X., and Zhang, S. (2009). Responses of vegetation coverage to regional environmental change in the northern and southern Qinling Mountains. Acta Scientiae Circumstantiae. 29, 2635–2641.
Sun, H., Bai, H., Zhang, Q., and Gao, X. (2010). Spatial-temporal changes of forest landscape in the eastern and western counties of Qinling Mountains during the last 30 years. Acta Scientiae Circumstantiae. 30, 1101–1107.
Tao, S., Kuang, T., Peng, W., and Wang, G. (2020). Analyzing the spatio⁃temporal variation and drivers of NDVI in upper reaches of the Yangtze River from 2000 to 2015: a case study of Yibin City. Acta Ecol. Sin. 40, 5029–5043. doi: 10.5846/stxb201904190790
Turner, M. G., Gardner, R. H., and O’Neill, R. V. (2001). Landscape ecology in theory and practice: Pattern and process. New York: Springer.
Venter, O., Sanderson, E. W., Magrach, A., Allan, J. R., Beher, J., Jones, K. R., et al. (2016). Sixteen years of change in the global terrestrial human footprint and implications for biodiversity conservation. Nat. Commun. 7:12558. doi: 10.1038/ncomms12558
Wang, W., Alim, S., and Jilili, A. (2019). Geo-detector based spatio-temporal variation characteristics and driving factors analysis of NDVI in Central Asia. Remote Sensing Nat. Res. 31, 32–40. doi: 10.6046/gtzyyg.2019.04.05
Wang, J., Chen, Y., Tett, S. F. B., Stone, D., Nie, J., Feng, J., et al. (2023). Storyline attribution of human influence on a record-breaking spatially compounding flood-heat event. Sci. Adv. 9:eadi2714. doi: 10.1126/sciadv.adi2714
Wang, J. F., and Hu, Y. (2012). Environmental health risk detection with GeogDetector. Environ. Model Softw. 33, 114–115. doi: 10.1016/j.envsoft.2012.01.015
Wang, J. F., Li, X. H., Christakos, G., Liao, Y. L., Zhang, T., Gu, X., et al. (2010). Geographical detectors-based health risk assessment and its application in the neural tube defects study of the Heshun region, China. Int. J. Geogr. Inf. Sci. 24, 107–127. doi: 10.1080/13658810802443457
Wang, J. F., Wang, Y., Zhang, J., Christakos, G., Sun, J. L., Liu, X., et al. (2013). Spatiotemporal transmission and determinants of typhoid and paratyphoid fever in Hongta District, Yunnan Province, China. PLoS Negl. Trop. Dis. 7:e2112. doi: 10.1371/journal.pntd.0002112
Wang, J. F., and Xu, C. (2017). Geodetector: principle and prospective. Acta Geograph. Sin. 72, 116–134. doi: 10.11821/dlxb201701010
Wang, J., Zhao, J., Li, C., Zhu, Y., Kang, C., and Gao, C. (2019). The spatial-temporal patterns of the impact of human activities on vegetation coverage in China from 2001 to 2015. Acta Geograph. Sin. 74, 504–519. doi: 10.11821/dlxb201903008
Xie, W., and Yao, Y. (2024). Quantifying human activity intensity in the Qinling-Daba Mountains. People Nat. 00, 1–16. doi: 10.1002/pan3.10649
Xu, Y. (2018). Dynamic change of vegetation and phenology to climate change in Gansu province during 2001–2015. Lanzhou City: Gansu Agricultural University.
Xu, X., Liu, H., Jiao, F., Gong, H., and Lin, Z. (2021). Nonlinear relationship of greening and shifts from greening to browning in vegetation with nature and human factors along the silk road Economic Belt. Sci. Total Environ. 766:142553. doi: 10.1016/j.scitotenv.2020.142553
Xu, X., and Zhang, Y. (2017). China meteorological background dataset. Resource and Environmental Science Data Center of Chinese Academy of Sciences. Available at: http://www.resdc.cn/DOI.
Yang, S., and Han, H. (2019). Quantitative analysis of NDVI driving factors in Gansu Province based on geodetector. J. Gansu Agric. Univ. 54, 115–123. doi: 10.13432/j.cnki.jgsau.2019.04.016
Yang, R., Liu, Y., Long, H., Wang, Y., and Zhang, Y. (2016). Spatial distribution characteristics and optimized reconstructing analysis of rural settlement in China. Sci. Geogr. Sin. 36, 170–179. doi: 10.1016/j.jrurstud.2016.05.013
Yao, Y., and Cui, L. (2022). Vegetation dynamics in the Qinling-Daba Mountains through climate warming with land-use policy. Forests 13:1361. doi: 10.3390/f13091361
Yao, Y., Hu, Y., Kou, Z., and Zhang, B. (2020). Spatial patterns of Pinus tabulaeformis and Pinus massoniana forests in Qinling-Daba Mountains and the boundary of subtropical and warm temperate zones. J. Geogr. Sci. 30, 1523–1533. doi: 10.1007/s11442-020-1797-5
Yu, F., Zhang, B., Yao, Y., Wang, J., Zhang, X., Liu, J., et al. (2022). Identifying connectivity conservation priorities among protected areas in Qinling-Daba Mountains, China. Sustainability 14:4377. doi: 10.3390/su14084377
Zhang, B. (2019). Ten major scientific issues concerning the study of China’s north-south transitional zone. Prog. Geogr. 38, 305–311.
Zhang, S., Bai, H., Gao, X., He, Y., and Ren, Y. (2011). Spatial-temporal changes of vegetation index and its responses to regional temperature in Taibai Mountain. J. Nat. Resour. 26, 1377–1386.
Zhang, B., Jiang, Y., and Yang, Z. (2010). Study on land use changes in the southeast karst mountainous areas of Yunnan Province driven by the national project of converting farmland to forest in recent eight years: a case in Wenshan County. Chin. Agric. Sci. Bull. 26, 338–343. doi: 10.11924/j.issn.1000-6850.2010-1168
Zhang, X., and Li, X. (2023). Three-dimensional differentiation of the contribution of climatic factors to vegetation change in the pan-Tibetan plateau. J. Geoph. Res. 128:e2022JG007244. doi: 10.1029/2022JG007244
Zhang, S., Nie, Y., Zhang, H., Li, Y., Han, Y., Liu, X., et al. (2020). Spatiotemporal variation of vegetation NDVI and its driving forces in Inner Mongolia based on geodetector. Acta Agrestia Sinica 28, 1460–1472. doi: 10.11733/j.issn.1007-0435.2020.05.034
Zhang, B., Tan, J., and Yao, Y. (2009). Study on the digital mountain altitudinal belts. Beijing: China Environment Press.
Keywords: Qinling-Daba Mountains, normalized difference vegetation index, climate warming, land use, topography
Citation: Yao Y (2024) Pattern and change of NDVI and their environmental influencing factors for 1986–2019 in the Qinling-Daba Mountains of central China. Front. For. Glob. Change. 7:1372488. doi: 10.3389/ffgc.2024.1372488
Edited by:
Manob Das, Mykolas Romeris University, LithuaniaReviewed by:
Jianfeng Liu, Chinese Academy of Forestry, ChinaSajjad Hussain, COMSATS Institute of Information Technology, Pakistan
Somen Dey, Ramananda College, India
Copyright © 2024 Yao. This is an open-access article distributed under the terms of the Creative Commons Attribution License (CC BY). The use, distribution or reproduction in other forums is permitted, provided the original author(s) and the copyright owner(s) are credited and that the original publication in this journal is cited, in accordance with accepted academic practice. No use, distribution or reproduction is permitted which does not comply with these terms.
*Correspondence: Yonghui Yao, eWFveWhAbHJlaXMuYWMuY24=