
95% of researchers rate our articles as excellent or good
Learn more about the work of our research integrity team to safeguard the quality of each article we publish.
Find out more
ORIGINAL RESEARCH article
Front. For. Glob. Change , 03 May 2024
Sec. People and Forests
Volume 7 - 2024 | https://doi.org/10.3389/ffgc.2024.1349772
 Zi Wang1*
 Mingyang Li2,3
Background and objectives: Urban scenic forests are a main component of forest parks, and a quantitative study of the landscape color of urban scenic forests can provide a scientific reference for the planning of forest parks and the design of scenic forest management measures. The purpose of the study is to find the quantitative correlation between autumn landscape color and ecological service functions and to obtain the important influencing factors.
Materials and methods: This study focuses on Purple Mountain National Forest Park in Nanjing as a case study area and uses forest resource survey data from Purple Mountain National Forest Park in 2020, autumn landscape color photograph data from Purple Mountain National Forest Park in 2020, and digital elevation model data as the main information sources. The correlation between two ecological functions of above-ground biomass (AGB), tree species diversity (TSD), and influencing factors (including color factors, stand factors, and terrain factors) were both analyzed by Pearson correlation analysis. Then, multiple linear regression (MLR) and random forest (RF) methods were used to perform the quantitative relationship between the functions.
Results: The results show that, in the established quantitative models of AGB, with TSD as the dependent variable, the correlation coefficients of the MLR model are both above 0.784, while the correlation coefficients of the RF model are all above 0.872. Moreover, the brightness value of the main color (BRI), the number of yellow-green blocks (NYG), and the number of yellow blocks (NY) have important effects on the two ecological service functions.
Conclusion: In conclusion, there are complex non-linear relationships between the ecological service functions of AGB, TSD, and influencing factors, and the landscape color can reflect the ecological function of the scenic forest to some extent. In addition, stand factors and color factors have important effects on the ecological function of AGB. Color factors and terrain factors have important effects on the ecological function of TSD. BRI, NYG, and NY have important effects on the two ecological functions. Finally, this quantitative method has universal applicability in the temperate zone, warm temperate zone, and subtropical zone of China.
With the acceleration of urbanization, Purple Mountain, located in the eastern suburb of Nanjing, has gradually become a “mountain in the city.” Furthermore, the social and economic conditions surrounding Purple Mountain have greatly changed. The increasing income and leisure time have caused the daily number of tourists visiting Purple Mountain National Forest Park to increase (Wang et al., 2020). The data show that the annual number of tourists visiting Purple Mountain Forest Park in 2008 reached 6.2 million. By 2012, this number had increased to 15.69 million (Cheng, 2014). Due to the presence of plentiful resources of colored leaf species, the forest scenery is popular among tourists, especially in the autumn. The number of visitors to Purple Mountain in the fall is higher than in other seasons. The original function of the Purple Mountain scenic forest was relatively singular, and the recreational resources of the peripheral landscape are scarce and cannot meet the increasing needs for recreational and color esthetic purposes of urban residents and tourists. As a national urban forest park, finding a way to coordinate multiple benefits, such as social benefits (Kim et al., 2020), esthetic benefits (Li, 2021), climate and physical benefits (Dadvand, 2019; Wang et al., 2019), and ecological benefits (Tyrväinen et al., 2005; Wang and Zhao, 2020), to meet the increasing leisure and entertainment needs of the public has become an urgent problem to be solved in Purple Mountain Forest Park.
Seasonal autumn color is common and occurs worldwide (Burnside, 2023). The changing leaf color in woody plants is caused by the unmasking of carotenoids and the breakdown of chlorophyll, which is considerably related to the leaves’ intense yellow coloration (Li et al., 2018). In terms of red coloration, anthocyanins are often treated as a functional indicator because they are beneficial for branches and the trunk in terms of enhancing the recovery rate of foliar nitrogen and other resources through the protection of photo-oxidation and photo-inhibition (Liu et al., 2016).
However, young tree leaves with a red color in tropical regions are the result of physiological causes (Wang et al., 2023), such as scavenging reactive oxygen species and defense against photoinhibition. Researchers observed that differences in relative humidity and light availability are related to autumn phenological variation. Moreover, air temperature and light were analyzed as microenvironmental drivers and were found to have an impact on the extent of differences in leaf senescence among overstory, mesostory, and understory trees, which are the three vertical canopy positions (Gressler et al., 2015). Klosterman and Richardson (2017) calculated the color indices from drone imagery of an oak-dominated temperate deciduous forest and found that the plant area index not only correlated with the canopy greenness index in the spring green-up but also correlated with the canopy redness index during autumn senescence.
Since the scenic beauty evaluation method (SBE method) can objectively reflect the esthetic value of the actual landscape, it can be adopted in the esthetic evaluation of the autumn color landscape. Zheng et al. (2016) used a community survey to carry out an esthetic evaluation of scenic forests with the SBE method. Based on different elevation levels, the autumn landscape color was quantified, and the color distribution and esthetic quality of different plant communities were obtained. Liu et al. (2023a,b) obtained the tourists’ preference for the color of forest landscapes by questionnaire survey. The results showed that tourists prefer to stay with different forest landscape colors. Additionally, color helps people to understand their surroundings and influences our behavior consciously or unconsciously (Günes and Olguntürk, 2020).
Different landscape colors, such as warm colors and cool colors, affect psychological and physiological wellbeing (Neale et al., 2021). People can achieve the beneficial effect of color esthetics ecological service (Chalmin-Pui et al., 2021). Meanwhile, landscape colors trigger various emotional reactions from people (Günes and Olguntürk, 2020). Compared to green foliage, autumn-leaf and flowering plants have higher restorative potential (Kuper, 2020). In the diverse forest landscape, colors, tourists’ attention recovery, landscape preference, and length of stay vary. Tomitaka et al. (2021) conducted a face-to-face questionnaire survey to obtain data on plant communities of people’s esthetic preferences. The results showed that biological communities with higher flower color diversity and species richness, as well as the absence of shrubs, are preferred. In urban areas, green walls play an important role in improving people’s health and wellbeing. Living walls will have high esthetic value if designed using color contrast principles (Thorpert and Englund, 2023). In addition, the seasonal forest landscape has psychological benefits for tourists (Liu et al., 2023a,b). The scenes with red and yellow and red color blocks are more preferred. Tourists feel comfortable in the environment with relatively low color temperature and high saturation.
Currently, there is limited research available on the relationships between ecological service functions and seasonal landscape colors. It is urgent to find the relationships to provide scientific reference and a basis for the ecological planning and construction of colored scenic forests.
It is possible to conduct forest management rationally by utilizing fully the seasonal change characteristics of subtropical forests to study ecological functions. This study aims to explore the relationship between landscape colors and the ecological functions of scenic forests, which can provide discriminant methods and data support for maximizing the ecological functions of forest parks.
This study focuses on Purple Mountain National Forest Park, which lies in the city of Nanjing, Jiangsu, China (Figure 1). The forest park has a total area of 3008.8 ha (Yang and Li, 2023). It belongs to the transition zone between the north subtropical zone and the warm temperate zone, with abundant sunshine and distinct seasonal changes. The park is a mixed growth area of deciduous broadleaved forest and evergreen broadleaved forest, with abundant plant species and an obvious transitional vegetation composition. The dominant tree species are Pinus massoniana, Liquidambar formosana, and Quercus acutissima (Sun and Pan, 2022). It is a significant urban forest green space in which the forest coverage rate reaches 70.2% and accounts for 15.6% of the total forest area in Nanjing. Purple Mountain National Forest Park is well known for hosting many visitors. In recent years, the average annual number of visitors has been approximately 8 million, and the number of climbers each year is approximately 9 million (Yang and Tang, 2020). The shape of the distribution of tourist volume in Purple Mountain Forest Park in 1 year is bimodal, with peaks in spring (March–May) and autumn (October). This seasonal change in tourists over 1 year is the unique advantage of urban forest parks. Purple Mountain has been recognized as one of the 40 best tourist attractions in China since 1991 and was assessed as a nationally civilized scenic area in 1999. The urban forest park was designated as an “AAAAA-level tourist area” and was certified by the ISO14000 environmental management system in 2000.
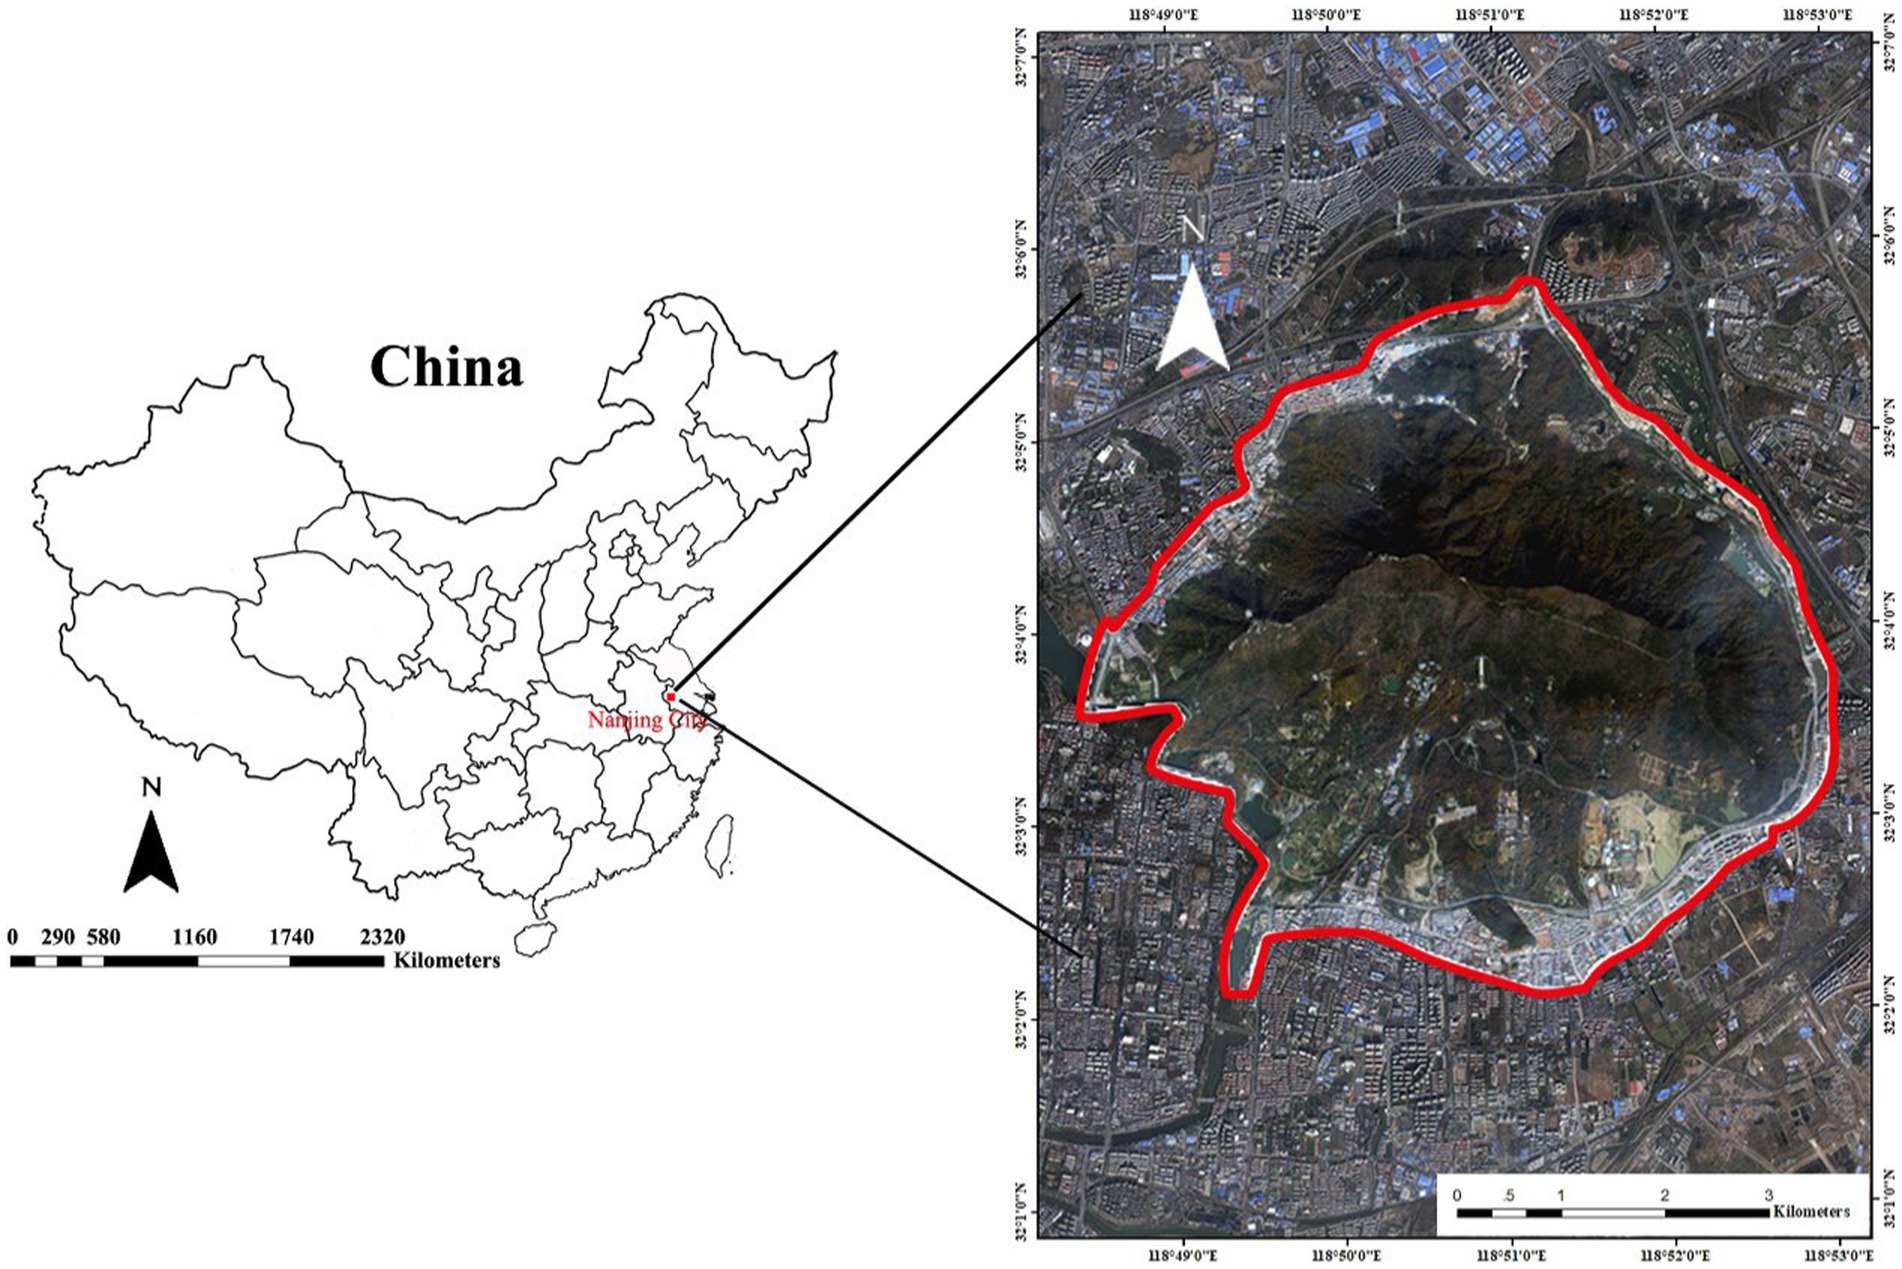
Figure 1. Location of Purple Mountain National Forest Park, Nanjing, Jiangsu.
The data sources used in this study include the forest resources survey data (includes 662 forest sub-compartments) for Purple Mountain National Forest Park in 2020 (GB/T 26424–2010), the autumn landscape color photograph data for Purple Mountain National Forest Park in 2020, and DEM data (digital elevation model made according to a 1:10,000 topographic map of Purple Mountain Forest Park, with spatial resolution of 3.3 × 3.3 m). The characteristic factors of the stands can be obtained from the forest resources survey data for Purple Mountain National Forest Park collected in 2020, including the average diameter at breast height (DBH), average tree height (AH), unit volume (UV), and canopy density (CD) of each forest sub-compartment. The autumn landscape color photograph data for Purple Mountain National Forest Park obtained in 2020 were used for landscape color quantification. DEM data were used to extract terrain factors, such as slope (SL) and aspect (AS).
The collection time of autumn landscape color photographs was during the months of October and November in the year 2020. A total of 1,324 photos were taken. Two photographs were taken in each forest sub-compartment according to the forest resources survey data of Purple Mountain National Forest Park in 2020. These two photographs were randomly sampled, and one photograph was selected. Finally, a total of 662 photographs of 662 forest sub-compartments were selected for the study data. To truly reflect the characteristics of the autumnal color landscape of scenic forest and to make the landscape more comparable, photographs were taken with the same standards.
The quantitative data of landscape color consider 24 hue wheels as the color system, the Hue, Saturation, and Brightness model (HSB model) as the color model, and ColorImpact (version 4.2.5) software as the platform to extract and quantify the different color blocks in the 662 collected photographs one by one. The 24-hue wheel is used for the qualitative classification of landscape colors with different hue values. The HSB model is used to quantify the hue value, saturation value, and brightness value of each specific color block in each photograph. The composition proportion represented by each color block in each photograph was obtained with ColorImpact. The objectives of color quantification are identifying the main landscape color and all colors composing each photograph. The main landscape color refers to the color representing the largest proportion of the total color in each forest sub-compartment, and all composed colors are each individual color composing the entire landscape in each forest sub-compartment.
After data processing, a total of 11 quantitative variables regarding color were obtained, including the hue value of the main color (HUE), the saturation value of the main color (SAT), the brightness value of the main color (BRI), the proportion of the main color in each forest subcompartment (PM), the number of red blocks (NR), the number of red-orange blocks (NRO), the number of orange blocks (NO), the number of orange-yellow blocks (NOY), the number of yellow blocks (NY), the number of yellower yellow-green blocks (NYYG), and the number of yellow-green blocks (NYG).
Forest ecosystems represent the key link of the Earth’s energy cycle, with important ecological service functions. In urban forests, plants, as primary producers, can absorb CO2 through photosynthesis and release O2, thereby slowing global warming (Zhang et al., 2023). However, trees have a large carbon pool, a high leaf area index, and a long life cycle and can effectively sequester carbon and cool temperatures (Hu et al., 2021, 2023). Forest biomass is a basic parameter used to describe the structure and function of forest ecosystems (Swamy et al., 2023). Many ecosystem processes interact with forest biomass (Maxwell et al., 2023). Since it is difficult to measure forest biomass underground, most studies focus on estimating the above-ground forest biomass (Ketterings et al., 2001; Yang B. et al., 2023).
Biodiversity is the biological resource on which human beings depend for survival. Urban forests provide habitats for wildlife (Ananyev et al., 2023; Burrascano et al., 2023) and provide residents with recreational viewing places (Marselle et al., 2021). The quality of urban ecosystems can be reflected scientifically through the biodiversity index, which can be used to carry out scientific planning for urban forestry (Hedin et al., 2022; Liu et al., 2023a,b). To describe the species diversity of a community quantitatively, a diversity index can be introduced. As the basic unit of this study is the forest sub-compartment, it is reasonable to measure the tree species composition in a forest community with the Shannon—Wiener index, which can be used to quantify α diversity (Fry et al., 2009; Coote et al., 2013; Tinya et al., 2023).
In urban areas, trees can sequester carbon through above-ground biomass to maintain the biological diversity and provide residents with multiple ecosystem service functions to optimize their living environment (Carrus et al., 2015). Therefore, the quantitative relationships between landscape colors and ecological functions can be reflected through two ecological indicators: above-ground biomass (AGB) and tree species diversity (TSD).
Fang et al. (1996) proposed the widely used method (Li et al., 2023; Liu et al., 2023a,b) of the continuous conversion factor function to estimate forest biomass and introduced the model of biomass and accumulation with the calculation parameters of the dominant tree species, which overcame the shortcomings of the static conversion parameters of the biomass conversion factor method. This method is also used in this study to predict biomass. The equation is as follows:
In the formula, B is the stand biomass per hectare (m3/hm2), V is the stand volume per hectare (t/hm2), and a and b are the parameters. The biomass is calculated for each forest sub-compartment.
For tree species diversity, we calculated the Shannon–Wiener’s diversity index (H).
In the formula, pi is the proportional abundance of species i among the total number of tree individuals of all species (in 662 forest sub-compartments), and S is the total number of tree species in each forest sub-compartment.
Multiple linear regression (MLR) is a multivariate statistical technique for examining the linear correlations between two or more independent variables and a single dependent variable. Due to its good interpretability, MLR is one of the most commonly used estimation models for forest parameters (Zhang et al., 2020). MLR has been widely employed in numerous studies of scenic beauty (Gosal and Ziv, 2020; Egbueri et al., 2023). This method is also used to analyze the relationships between various factors in the study of the seasonal color landscape of scenic forests (Chen et al., 2008). Thus, this method was introduced to analyze the existence of a linear relationship between independent variables and dependent variables.
Random forest (RF) belongs to the integrated learning algorithm. RF uses an ensemble of classification trees. Each classification tree is built using a bootstrap sample of the data, and at each split, the candidate set of variables is a random subset of the variables. Thus, the RF applies the bagging algorithm and random variable selection for tree building. Each tree is pruned to obtain low-bias trees (Breiman, 2001). RF models have been used in recent years to predict forest attributes, such as tree species distribution and the succession stage. Therefore, the RF model can also be effectively introduced in analyzing the existence of a non-linear relationship between independent variables and dependent variables in this study.
The correlation coefficient and root mean square error between the predicted values and the measured values are often used to evaluate the prediction accuracy of estimation models (Isles, 2024; Zhang et al., 2024). In addition, the mean absolute error, relative absolute error, and root relative square error are used in the evaluation of model performance by some experts (Deng et al., 2014; Sun et al., 2024). In this study, the above-mentioned five indices were calculated to evaluate the prediction performance of the quantitative models by the two above-analyzing methods using a 10-fold cross-validation method. R was developed by Ross Ihaka and Robert Gentleman from the University of Auckland, New Zealand. It is software mainly applied in statistical analysis in various fields of study. Therefore, the multiple linear regression analysis in this study was conducted using R4.2.3 as the software platform.
To explore the relationships between landscape color factors and ecological functions, the relationships between the 17 factors of PM, NR, NRO, NO, NOY, NY, NYYG, NYG, DBH, AH, UV, CD, SL, AS, HUE, SAT, and BRI and AGB and TSD were analyzed by Pearson correlation analysis. The results show that 10 factors are correlated with AGB (p < 0.05). Among them, only NO (−0.08), HUE (−0.116), and BRI (−0.102) showed a negative correlation. The 7 remaining factors, NY (0.116), SAT (0.159), UV (0.865), DBH (0.802), AH (0.845), CD (0.689), and SL (0.114), were all positively correlated with AGB. All the factors show an extremely significant correlation with AGB (p < 0.01), except NO (p < 0.05). Additionally, 14 factors were correlated with TSD (p < 0.01). NRO (−0.122), NY (−0.334), HUE (−0.125), and PM (−0.203) were negatively correlated with TSD. However, the 10 factors of NOY (0.268), NYYG (0.138), NYG (0.181), SAT (0.212), BRI (0.215), UV (0.148), DBH (0.173), AH (0.180), CD (0.171), and SL (0.376) were positively correlated with TSD.
Among them, there are nine factors with extremely significant correlation with the two ecological functions (p < 0.01): SL, PV, DBH, AH, CD, NY, HUE, SAT, and BRI. Among them, SL, PV, DBH, AH, CD, and SAT are positively correlated with the two ecological function dependent variables, while HUE is negatively correlated with the two ecological functions. NY is positively correlated with the ecological function of AGB but negatively correlated with TSD. BRI is negatively correlated with AGB but positively correlated with TSD. This indicates that, with the increase of the average DBH, the average tree height, the unit volume, the canopy density, the slope, the saturation value of the main color, and the decrease of the hue value of the main color, the function of the above-ground biomass, and the tree species diversity of the stand will be more significant. At the same time, when the number of yellow blocks in landscape colors is increasing, the ecological function of above-ground biomass is stronger, while the ecological function of tree species diversity is weaker.
In general, the stand is healthy and flourishing with a larger average DBH, higher average tree height, larger unit volume, and thick canopy. With the increase of slope in a certain suitable range, the light-receiving area of stands will be increased, promoting the growth of stands. Therefore, the above-ground biomass will be higher. Generally, the species with higher above-ground biomass are mostly concentrated in the dominant color-leaved species communities of Liquidambar formosana and Quercus acutissima in the study area. In the dominant species community of Liquidambar formosana and Quercus acutissima, the dominance degree of the dominant species is relatively low. The community generally consists of at least two dominant species, and the tree species diversity is relatively high. In addition, sufficient illumination speeds up the decomposition of chlorophyll in leaves. Then, the leaves will expose carotenoids to a greater extent, presenting a highly saturated color landscape with an excellent low hue value. When in a thin forest with good light transmittance, small trees and shrubs grow fast with sufficient light. Therefore, the need for moisture and nutrients in the soil is increasing, which will form a kind of competition relations between the small trees, shrubs, and dominant trees. This mutual influence relationship leads to the weak growth of dominant tree species with less color-changing leaves, which reduces the above-ground biomass but improves the species diversity with the increase in the number of species.
The 17 factors were input as independent variables, and AGB and TSD were input as dependent variables to establish the MLR model. During processing, all the independent variables were screened step by step. After establishing the model, the probability values of the “F statistic” of the three models were all 0.00 according to ANOVA. Since 0.00 < 0.01, the original hypothesis that the overall regression coefficient is 0 can be rejected, indicating that there is a linear relationship between the independent variables and the dependent variables. The probability values of the T-tests of the introduced independent variables need to be greater than 0.05. All independent variables involved in the modeling should be guaranteed to be significant (sig < 0.1). Through collinearity diagnosis, the VIF values of the independent variables were all found to be less than 5, indicating no collinearity. Finally, the two best multiple linear regression models of AGB and TSD were established. In the MLR model with AGB as the dependent variable, there were five factors, namely NRO, NO, BRI, UV, and AH. NR, NRO, NOY, NYYG, NYG, PM, DBH, CD, SL, HUE, SAT, and BRI were included to establish the MLR model with TSD as the dependent variable.
For the RF method, ntree (controlling for the number of trees present) and mtry (controlling for the number of predictor variables randomly sampled as candidates at each split) are two parameters that need to be tuned. Finding the best combination of parameters is critical to obtaining and optimizing the best model. For each model, the number of trees (ntree) uses the same increasing increment (100 trees, 110 trees, 120 trees, …, 1,000 trees). For mtry, the default value is one-third of the number of predictor variables (mtry = 6); half (mtry = 3) and 1.5 times (mtry = 9) the default values were also checked.
In the establishment process of RF models, the results (Figures 2A–F) show that the changes in the error depend on the ntree and mtry values used. As the number of trees and the value of the mtry of the model increase, the error first decreases and then stabilizes. When the number of trees is 200 and mtry = 9, the error is the lowest (1316.67). Therefore, we chose these two values as the tuning parameters to establish the RF model of the quantitative relationship between AGB and influence factors (Figures 2A–C). When the number of trees is 200 and mtry = 9, the error is the lowest (0.00048). Thus, we chose these two values as the tuning parameters to establish the RF model of the quantitative relationship between TSD and influence factors (Figures 2D–F).
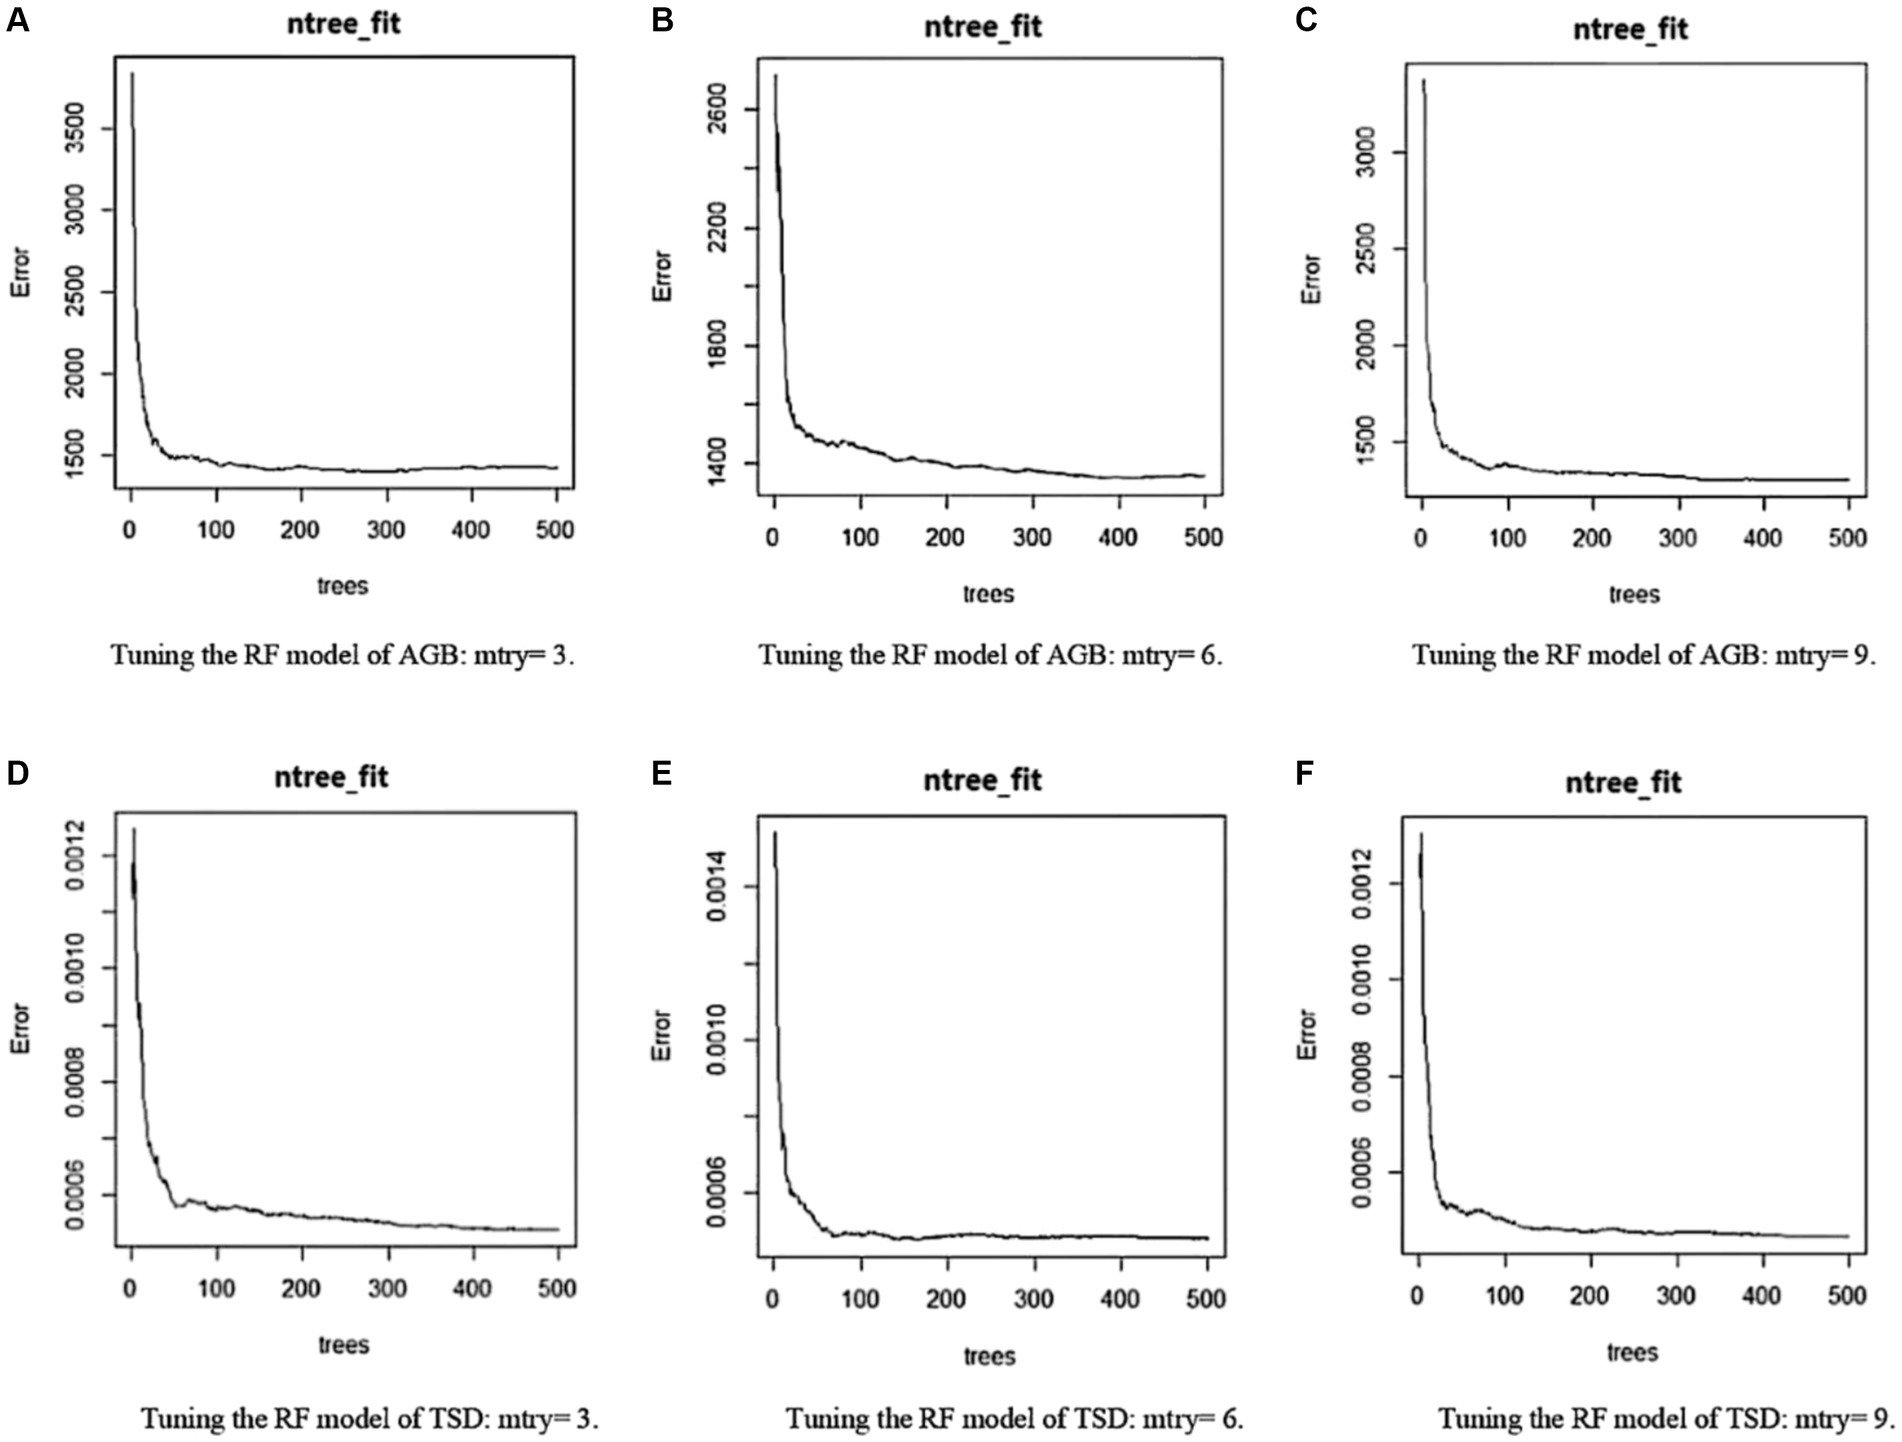
Figure 2. Tuning RF—the influence of the mtry and ntree values on the RF model (A–C) represent, respectively, tuning the RF model of AGB:mtry = 3, mtry = 6 and mtry = 9; (D–F) represent, respectively, tuning the RF model of TSD: mtry = 3, mtry = 6 and mtry = 9.
Compared with the correlation coefficients of the two established MLR models and the two established RF models (Tables 1, 2), the correlation coefficients of the RF models and the multiple correlation coefficients are all higher than that of the MLR models, which explains more variance. Therefore, the two ecological functions and influence factors, including color factors, stand factors, and terrain factors, mainly exist in the more complex non-linear quantitative relationship.
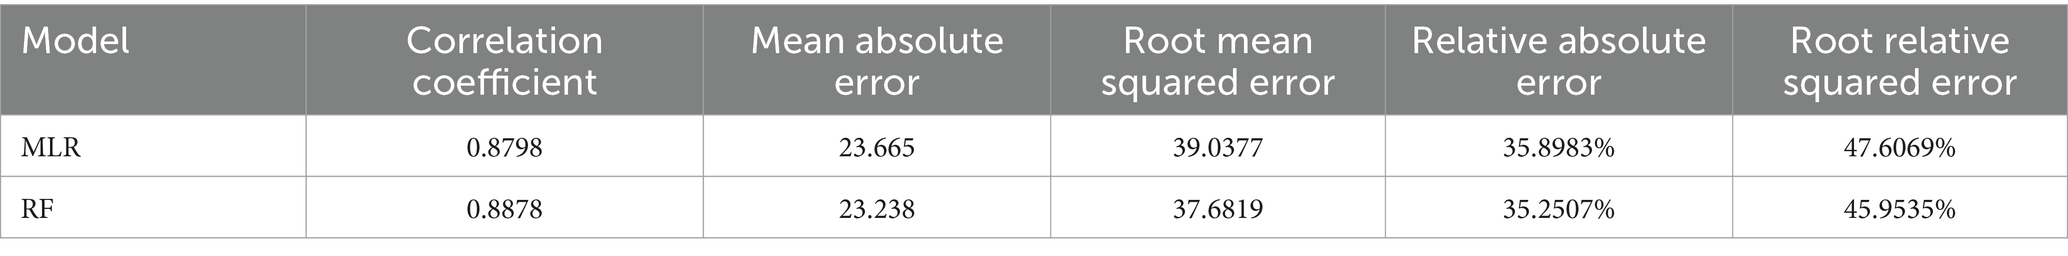
Table 1. Quantitative relationship between AGB and influence factors.
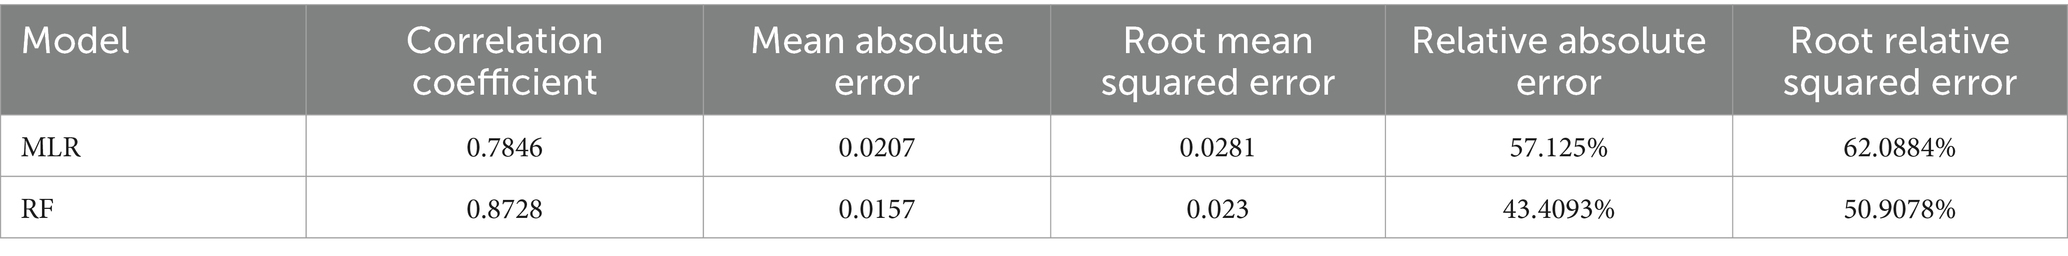
Table 2. Quantitative relationship between TSD and influence factors.
According to the significance analysis (Figure 3), UV, AH, DBH, CD, NOY, BRI, NY, and NYG had a greater impact on AGB ecological function. Among them, four stand factors have the main effect compared with other factors. The factor UV has the largest effect on AGB, and the stand factors AH and DBH also have an effect on the ecological function of AGB. Among the four color factors, the difference in importance with the stand factor, CD, is little. The three factors NOY, NY, and NYG are centrally distributed in the stands with some characteristics that reflect the good or bad of AGB to some extent. In addition, BRI can reflect the canopy density of the stand so as to reflect the growth situation of the stand and then reflect the difference of AGB.
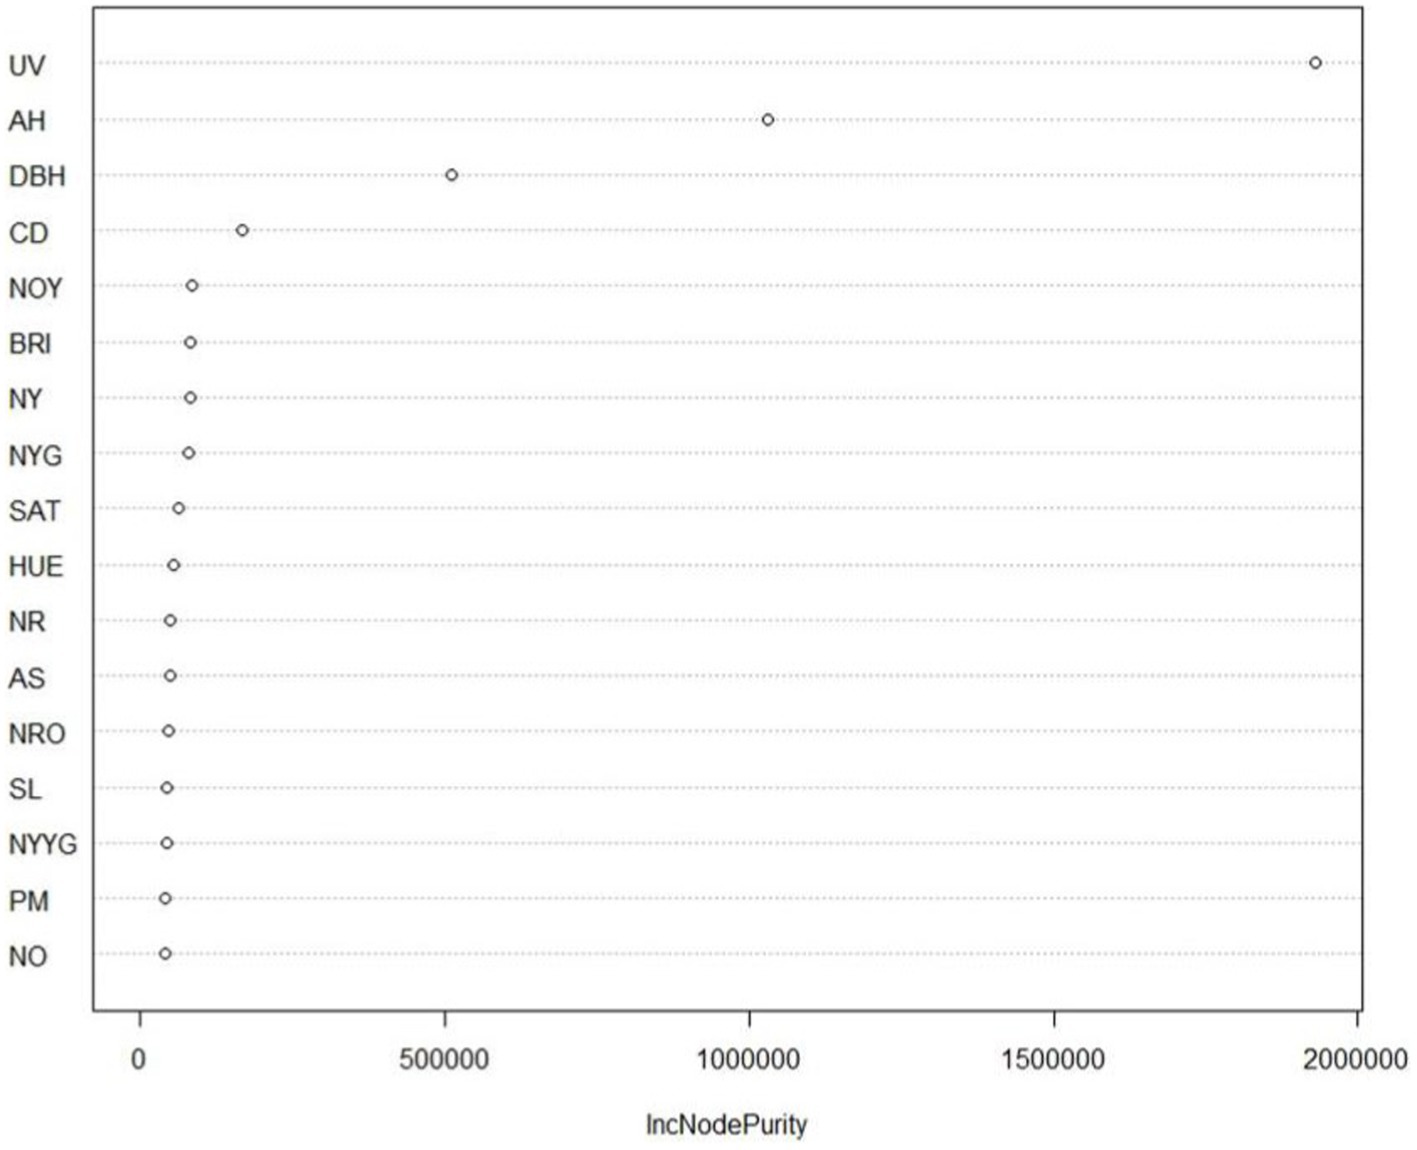
Figure 3. Importance of 17 independent variables with AGB as the dependent variable.
It can be seen that the eight independent variables of BRI, NYG, HUE, NY, SL, PM, NYYG, and SAT have a greater impact on the ecological function of TSD (Figure 4), including one terrain factor and seven color factors. BRI has the greatest influence on TSD. It indicates that the BRI factor can reflect the growth of tree species by reflecting the light transmittance of the stand and then reflect the ecological function of TSD. The six color factors of NYG, HUE, NY, PM, NYYG, and SAT are the composition and the distribution of landscape color. They can reflect the corresponding intensity of illumination and light reflection so as to reflect the difference of TSD. SL can affect the strength of tiny illumination and the distribution of tree species and soil nutrients, directly affecting TSD.
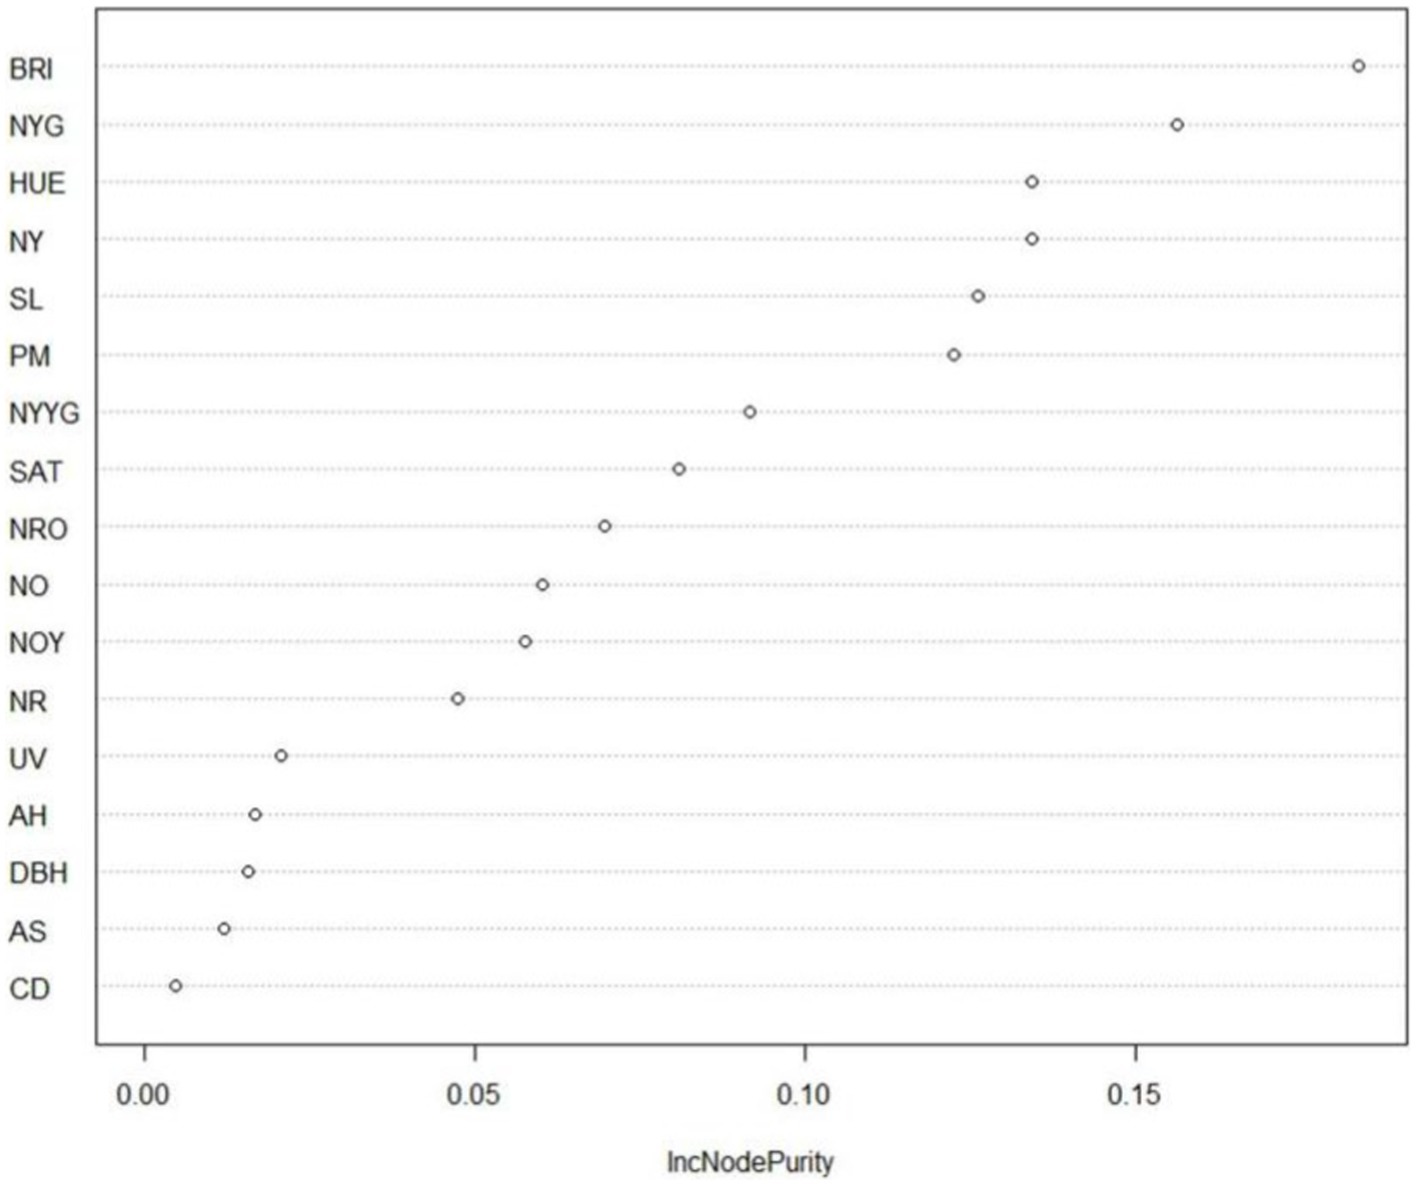
Figure 4. Importance of 17 independent variables with TSD as the dependent variable.
Overall, stand factors and color factors have important effects on the ecological function of AGB. Color factors and terrain factors have important effects on the ecological function of TSD. BRI, NYG, and NY have important effects on the two ecological functions. Based on the results above, the dominant tree species with leaves in yellow-green or yellow in autumn should be strengthened and refined in forest management, such as broadleaf mixed forest and other Quercus. Thus, the scenic forests can better utilize their ecological service functions and provide people with a good living environment.
Researchers prefer to collect photos to conduct research on landscape colors or scenic beauty of plant analysis (Erdenejargal et al., 2021; Long et al., 2023). This is because photographs are closely related to human visual perception and are basically consistent with human viewing habits. Therefore, viewers’ true feelings need to be taken into consideration (Elwell et al., 2020). Furthermore, this study focuses on physical landscape image acquisition. Meanwhile, the present photographic method of vegetation analysis with normalized difference vegetation index (NDVI) is popular (Moinardeau et al., 2021; Erlandsson et al., 2023; Zhang and Zeng, 2024). The purpose of NDVI approaches is to classify soil more clearly, extract spectral information from a top-down perspective, and then conduct research on vegetation coverage and growth status. The NDVI method can be applied to ecological service and then reflect the level of ecological quality accurately. However, it is not suitable to study the field of landscape colors or esthetics ecological service. The quantified analysis is concise and comprehensive without the feeling of a human being.
The method of color extraction and quantification in this study is based on landscape photograph data from the actual survey. Therefore, considering the applicability of this method, it is applicable to all landscape color extraction and quantification studies based on color photographs, including landscape colors in different seasons and those across different types of landscapes. According to the specific factors of autumn seasonal landscape color, the applicability of this method mainly depends on whether the seasonal changes of the autumn landscape occur in different urban forest parks. In China, most areas occur in the temperate zone, warm temperate zone, or subtropical zone. The forest types in these three climate zones are mainly deciduous broadleaf forests and evergreen broadleaf forests, which have distinct climate characteristics throughout the year. These forest communities show obvious seasonal changes. In the northern cold temperate zone, the summer is short with warm and cool temperatures, and the winter is long with cold temperatures. The regional vegetation is mainly composed of northern coniferous forests. The forest type in the tropical zone is tropical rainforest. Therefore, in the cold temperate zone and tropical zone, there is no obvious seasonal alternation in the forest communities. Since most regions in the temperate, warm temperate, and subtropical zones of China show obvious changes in autumn landscape color, and the color of the landscape is a great attraction for tourists, this quantitative method has universal applicability in the temperate zone, warm temperate zone, and subtropical zone of China.
In the established models, the variance explanations of the RF models with the three attribute values of the main color as the dependent variables are all more than 82%. Meanwhile, the RF models with the two ecological functions as the dependent variables can only explain less than 80% variance. The reason may be that the objective influencing factors are not only the selected independent variables in this study, such as the light, but also significantly related to the main color in autumn. However, due to limited objective conditions, no corresponding factor data are collected in this study. In addition, there is only little difference between the correlation coefficient of the MLR model (correlation coefficient = 0.8798) and the RF model (correlation coefficient = 0.8878) with AGB as the dependent variable. Therefore, we can find that the ecological function of AGB not only exists in a complex non-linear relationship with the influencing factors but also has a linear quantitative relationship with some influencing factors. Similar results can also be found in the esthetic evaluation of hilly and mountain village landscapes (Long et al., 2023). Based on 26 landscape indicators, the adjusted R-square of the MLR model ranks second place. In addition, the value (R2 = 0.723) is relatively close to that of the first-place model (R2 = 0.746). According to the significance analysis of color factors, the ecological service value will be higher in the environment with a yellow and yellow and green combination landscape. However, tourists prefer to stay longer in the red and yellow and red combination surroundings (Liu et al., 2023a,b). Thus, ecological indicators are different, and the important impact factors vary. It is worth noting that, in different color reference systems, the results will be different (Yang M. et al., 2023). As the landscape color of the forest community will change with the succession of the forest community, the dominant tree species will change and show different landscape colors in different periods. Therefore, the study of the landscape color associated with forests is a dynamic and long process.
Colors are difficult to describe and analyze, and there are relatively few direct studies regarding this topic. In future studies on landscape colors, other ecological factors, species richness (Tomitaka et al., 2021), the mean shape index, mean contiguity index, Shannon’s diversity index (Long et al., 2023), and color factors based on different color systems can be appropriately introduced to further explore the relationship and the value of landscape autumn colors and ecological service functions. Clearly, considering seasonal colors in the other three seasons can allow a more comprehensive measurement of the relationship between forest landscape colors and ecological significance, thereby providing a reference for rational planning associated with landscape seasonal colors and the scientific formulation of landscape forest management measures.
In this study, we find that, first, the relationships between the ecological service functions of AGB, TSD, and influencing factors are complex and non-linear. The landscape color can reflect the ecological function of the scenic forest to some extent. Second, UV, AH, DBH, CD, stand factors, and color factors (NOY, BRI, and NY) have important effects on the ecological function of AGB. In addition, color factors, including BRI, NYG, HUE, and NY, and terrain factors have important effects on the ecological function of TSD. Overall, the three factors, BRI, NYG, and NY, affect the two ecological functions significantly. It provides a scientific reference for the color construction and planning of forest parks.
The original contributions presented in the study are included in the article/supplementary material, further inquiries can be directed to the corresponding author.
ZW: Writing – original draft, Writing – review & editing. ML: Writing – review & editing.
The author(s) declare that no financial support was received for the research, authorship, and/or publication of this article.
The authors thank Xiuhong Zhang, Yanan Liu, Fei Liu, Yifan Jiang, Lin Wang, Zhenyu Xu, Yanxin Xu, Chao Li, Yingchang Li, and Jinlong Wei. They helped in processing the data.
The authors declare that the research was conducted in the absence of any commercial or financial relationships that could be construed as a potential conflict of interest.
All claims expressed in this article are solely those of the authors and do not necessarily represent those of their affiliated organizations, or those of the publisher, the editors and the reviewers. Any product that may be evaluated in this article, or claim that may be made by its manufacturer, is not guaranteed or endorsed by the publisher.
Ananyev, V. A., Pekkoev, A. N., Grabovik, S. I., Moshnikov, S. A., Medvedeva, M. V., Ruokolainen, A. V., et al. (2023). Biodiversity dynamics in primary mid-taiga spruce forests after total windthrow in the Vodlozersky National Park, Russia. Nat. Conver. Res. 8, 75–93. doi: 10.24189/ncr.2023.024
Burrascano, S., Chianucci, F., Trentanovi, G., Kepfer-Rojas, S., Sitzia, T., Tinya, F., et al. (2023). Where are we now with European forest multi-taxon biodiversity and where can we head to? Biol. Conv. 284:110176
Carrus, G., Scopelliti, M., Lafortezza, R., Colangelo, G., Ferrini, F., and Salbitano, F. (2015). Go greener, feel better? The positive effects of biodiversity on the well-being of individuals visiting urban and peri-urban green areas. Landsc. Urban Plan. 134, 221–228. doi: 10.1016/j.landurbplan.2014.10.022
Chalmin-Pui, L. S., Griffiths, A., Roe, J., Heaton, T., and Cameron, R. (2021). Why garden? – attitudes and the perceived health benefits of home gardening. Cities 112:103118. doi: 10.1016/j.cities.2021.103118
Chen, X., Jia, L., Wang, Y., Zhou, R., and Li, X. (2008). Landscape estimation and management technique principles of different seasonal scenic and recreational forests in West Mountain, Beijing. J. Beijing Forestry Univ. 30, 39–45.
Cheng, Y. (2014) Countermeasure research of the impact of tourism activities on the open national forest park. Dissertation. Nanjing: Nanjing Forestry University.
Coote, L., Dietzsch, A. C., Wilson, M. W., Graham, C. T., Fuller, L., Walsh, A. T., et al. (2013). Testing indicators of biodiversity for plantation forests. Ecol. Indic. 32, 107–115. doi: 10.1016/j.ecolind.2013.03.020
Dadvand, P. (2019). Use of green spaces, self-satisfaction and social contacts in adolescents: a population-based CASPIAN-V study. Environ. Res. 168, 171–177. doi: 10.1016/j.envres.2018.09.033
Deng, S. Q., Katoh, M., and Guan, Q. (2014). Estimating forest aboveground biomass by combining ALOS PALSAR and world View-2 data: a case study at Purple Mountain National Park, Nanjing, China. Remote Sens. 6, 7878–7910. doi: 10.3390/rs6097878
Egbueri, J., Igwe, O., Omeka, M., and Agbasi, J. (2023). Development of MLR and variedly optimized ANN models for forecasting the detachability and liquefaction potential index of erodible soils. Geosyst. Geoenviron. 2:100104. doi: 10.1016/j.geogeo.2022.100104
Elwell, T. L., López-Carr, D., Gelcich, S., and Gaines, S. D. (2020). The importance of cultural ecosystem services in natural resource-dependent communities: implications for management. Ecosyst. Serv. 44:101123. doi: 10.1016/j.ecoser.2020.101123
Erlandsson, R., Arneberg, M. K., Tømmervik, H., Finne, E. A., and Nilsen, L. (2023). Bjerke JW (2023) feasibility of active handheld NDVI sensors for monitoring lichen ground cover. Fungal Ecol. 63:101233. doi: 10.1016/j.funeco.2023.101233
Fang, J., Liu, G., and Xu, S. (1996). Biomass and net production of forest vegetation in China. Acta Ecol. Sin. 16, 497–508.
Fry, G., Tveit, M. S., Ode, A., and Velarde, M. D. (2009). The ecology of visual landscapes: exploring the conceptual common ground of visual and ecological landscape indicators. Ecol. Indic. 9, 933–947. doi: 10.1016/j.ecolind.2008.11.008
Gosal, A. S., and Ziv, G. (2020). Landscape aesthetics: spatial modelling and mapping using social media images and machine learning. Ecol. Indic. 117:106638. doi: 10.1016/j.ecolind.2020.106638
Gressler, E., Jochner, S., Capdevielle-Vargas, R. M., Morellato, L. P. C., and Menzel, A. (2015). Vertical variation in autumn leaf phenology of Fagus sylvatica L. in southern Germany. Agricul. Forest Meteorol. 201, 176–186. doi: 10.1016/j.agrformet.2014.10.013
Günes, E., and Olguntürk, N. (2020). Color-emotion associations in interiors. Color. Res. Appl. 45, 129–141. doi: 10.1002/col.22443
Hedin, M., Hahs, A. K., Mata, L., and Lee, K. T. (2022). Connecting biodiversity with mental health and wellbeing- a review of methods and disciplinary perspectives. Front. Ecol. Evol. 10:865727. doi: 10.3389/fevo.2022.865727
Hu, B., Kang, F., Han, H., Cheng, X., and Li, Z. (2021). Exploring drivers of ecosystem services variation from a geospatial perspective: insights from China’s Shanxi Province. Ecol. Indic. 131:108188. doi: 10.1016/j.ecolind.2021.108188
Hu, B., Wu, H., Han, H., Cheng, X., and Kang, F. (2023). Dramatic shift in the drivers of ecosystem service trade-offs across an aridity gradient: evidence from China's loess plateau. Sci. Total Environ. 858:159836. doi: 10.1016/j.scitotenv.2022.159836
Isles, P. D. F. (2024). A random foest approach to improve estimates of tributary nutrient loading. Water Res. 248:120876. doi: 10.1016/j.watres.2023.120876
Ketterings, Q. M., Coe, R., van Noordwijk, M., Ambagau, Y., and Palm, C. A. (2001). Reducing uncertainty in the use of allometric biomass equations for predicting above-ground tree biomass in mixed secondary forests. For. Ecol. Manag. 146, 199–209. doi: 10.1016/S0378-1127(00)00460-6
Kim, H., Shoji, Y., Tsuge, T., Aikoh, T., and Kuriyama, K. (2020). Understanding services from ecosystem and facilities provided by urban green spaces: a use of partial profile choice experiment. Forest Policy Econ. 111:102086. doi: 10.1016/j.forpol.2019.102086
Klosterman, S., and Richardson, A. D. (2017). Observing spring and fall phenology in a deciduous Forest with aerial drone imagery. Sensors 17, 2852–2869. doi: 10.3390/s17122852
Kuper, R. (2020). Effects of flowering, foliation, and autumn colors on preference and restorative potential for designed digital landscape models. Environ. Behav. 52, 544–576. doi: 10.1177/0013916518811424
Lee, D. W., Brammeler, S., and Smith, A. P. (1987). The selective advantages of anthocyanins in developing leaves of mango and cacao. Biotropica 19, 40–49. doi: 10.2307/2388458
Li, J. (2021). A simulation approach to optimizing the vegetation covers under the water constraint in the Yellow River Basin. Forest Policy Econ. 123:102377. doi: 10.1016/j.forpol.2020.102377
Li, Y., He, N., Hou, J., Xu, L., Liu, C., Zhang, J., et al. (2018). Factors influencing leaf chlorophyll content in natural forest at the biome scale. Front. Ecol. Evol. 6:64. doi: 10.3389/fevo.2018.00064
Li, W., Zhang, Y., Zhang, J., Chen, H., Chen, E., Zhao, L., et al. (2023). Tropical forest AGB estimation based on structure parameters extracted by Tomo SAR. Int. J. Appl. Earth Obs. Geoinf. 121:103369. doi: 10.1016/j.jag.2023.103369
Lieth, H., and Whittaker, R. H. (1975) Primary productivity of the biosphere. Springer-Verlag: Berlin.
Liu, Y., Feng, H., Yue, J., Jin, X., Fan, Y., Chen, R., et al. (2023a). Improved patato AGB estimates based on UAV RGB and hyperspectral images. Comput. Electron. Agric. 214:108260. doi: 10.1016/j.compag.2023.108260
Liu, W., Tsao, C., and Lin, C. (2023). Tourists’ preference for colors of forest landscapes and its implications for forest landscape planning policies. Forest Policy Econ. 147:102887. doi: 10.1016/j.forpol.2022.102887
Liu, X., Yu, W., Wang, G., Cao, F., and Cai, J. (2016). Comparative proteomic and physiological analysis reveals the variation mechanisms of leaf coloration and carbon fixation in a Xantha mutant of Ginkgo biloba L. Int. J. Mol. Sci. 17:1794. doi: 10.3390/ijms17111794
Liu, Y., Zhao, J., Zheng, X., Ou, X., Zhang, Y., and Li, J. (2023b). Evaluation of biodiversity maintenance capacity in forest landscape: a case study in Beijing, China. Land 12:1293. doi: 10.3390/land12071293
Long, K., Wang, N., Lin, Z., and Lin, Z. (2023, 2023). Assessing scenic beauty of hilly and mountain villages: an approach based on landscape indicators. Ecol. Indic. 154:110538. doi: 10.1016/j.ecolind.2023.110538
Marselle, M. R., Lindley, S. J., Cook, P. A., and Bonn, A. (2021). Biodiversity and health in the urban environment. Curr. Environ. Health Rep. 8, 146–156. doi: 10.1007/s40572-021-00313-9
Maxwell, A. E., Wilson, B. T., Holgerson, J. J., and Bester, M. S. (2023). Comparing harmonic regression and GLAD phenology metrics for estimation of forest community types and aboveground live biomass within forest inventory and analysis plots. Int. J. Appl. Earth Obs. Geoinf. 122:103435. doi: 10.1016/j.jag.2023.103435
Merzlyak, M. N., and Gitelson, A. (1995). Why and what for the leaves are yellow in autumn? On the interpretation of optical spectra of senescing leaves (Acer platanoides L.). J. Plant Physiol. 145, 315–320. doi: 10.1016/S0176-1617(11)81896-1
Moinardeau, C., Mesléard, F., Ranmone, H., and Dutoit, T. (2021). Grazing in temporary paddocks with hardy breed horses (Konik polski) improved species-rich grasslands restoration in artificial embankments of the Rhône river (southern France). Global Ecol. Conserv. 31:e01874. doi: 10.1016/j.gecco.2021.e01874
Neale, C., Griffiths, A., Chalmin-Pui, L. S., Mendu, S., Boukhechba, M., and Roe, J. (2021). Color aesthetics: a transatlantic comparison of psychologcial and physiological impacts of warm and cool colors in garden landscapes. Wellbeing Space Soc. 2:100038. doi: 10.1016/j.wss.2021.100038
Sun, Y., and Pan, J. (2022). The classification of tree species in the Purple Mountain scenic forest area of Nanjing city based on Landsat 8 images. Territ. Nat. Res. Study 2022, 64–68.
Sun, Z., Wang, G., Li, P., Wang, H., Zhang, M., and Liang, X. (2024). An improved random forest based on the classification accuracy and correlation measurement of decision trees. Expert Syst. Appl. 237:121549. doi: 10.1016/j.eswa.2023.121549
Swamy, S. L., Darro, H., Mishra, A., Lal, R., Kumar, A., and Thakur, T. K. (2023). Carbon stock dynamics in a disturbed tropical forest ecosystem of Central India: strategies for achieving carbon neutrality. Ecol. Indic. 154:110775. doi: 10.1016/j.ecolind.2023.110775
Thorpert, P., and Englund, J. E. (2023). Sang ÅO (2023) shades of green for living walls – experiences of color contrast and its implication for aesthetic and psychological benefits. Nature Based Solut. 3:100067. doi: 10.1016/j.nbsj.2023.100067
Tian, X., Li, Z., Su, Z., Chen, E., van der Tol, C., Li, X., et al. (2014). Estimating montane forest above-ground biomass in the upper reaches of the Heihe River basin using Landsat-TM data. Int. J. Remote Sens. 35, 7339–7362. doi: 10.1080/01431161.2014.967888
Tinya, F., Doerfler, I., de Groot, M., Heilman-Clausen, J., Kovacs, B., Marell, A., et al. (2023). A synthesis of multi-taxa management experiments to guide forest biodiversity conservation in Europe. Glob. Ecol. Conv. 46:e02553. doi: 10.1016/j.gecco.2023.e02553
Tomitaka, M., Uchihara, S., Goto, A., and Sasaki, T. (2021). Species richness and flower color diversity determine aesthetic preferences of natural-park and urban-park visitors for plant communities. Environ. Sustain. Indicat. 11:100130. doi: 10.1016/j.indic.2021.100130
Tyrväinen, L., Pauleit, S., Seeland, K., and Vries, S. (2005). “Benefits and uses of urban forests and trees” in Urban forests and trees. eds. C. Konijnendijk, K. Nilsson, T. Randrup, and J. Schipperijn (Netherlands: Springer)
Wang, Z., Li, M., and Qian, C. (2020). Autumn seasonal color optimization method for the scenic forest of Purple Mountain Forest Park. Fresenius Environ. Bull. 29, 3738–3755.
Wang, R., and Zhao, J. (2020). Effects of evergreen trees on landscape preference and perceived restorativeness across seasons. Landsc. Res. 45, 649–661. doi: 10.1080/01426397.2019.1699507
Wang, R., Zhao, J., Meitner, M. J., Hu, Y., and Xu, X. (2019). Characteristics of urban green spaces in relation to aesthetic preference and stress recovery. Urban Forest. Urban Green. 41, 6–13. doi: 10.1016/j.ufug.2019.03.005
Wang, Y., Zhen, J., Che, X., Zhang, K., Zhang, G., Yang, H., et al. (2023). Transcriptomic and metabolomic analysis of autumn leaf color change in Fraxinus angustifolia. PeerJ 11:e15319. doi: 10.7717/peerj.15319
Yang, C., and Li, M. (2023). Research on characteristics of tourism flow in urban forest parks based on big data——a case study in Purple Mountain National Forest Park. Forestry Ecol. Sci. 38, 517–525.
Yang, Y., and Tang, X. (2020). The evaluation and factor analysis of the visual quality of scenic forest landscape: a case study of Purple Mountain National Forest Park in Nanjing. Chin. Landscape Architect. 36, 135–140.
Yang, M., Zhou, X., Peng, C., Li, T., Chen, K., Liu, Z., et al. (2023). Developing allometric equations to estimate forest biomass for tree species categories based on phylogenetic relationships. Forest Ecosyst. 10:100130. doi: 10.1016/j.fecs.2023.100130
Yang, B., Zhu, C., FWB, L., Wei, T., Liang, X., and Wang, Q. (2023). IAACS: image aesthetic assessment through color composition and space formation. Virtual Real. Intell. Hardware 5, 42–56. doi: 10.1016/j.vrih.2022.06.006
Zhang, Y., Li, Y., Song, J., Chen, X., Lu, Y., and Wang, W. (2020). Pearson correlation coefficient of current derivatives based pilot protection scheme for long-distance LCC-HVDC transmission lines. Int. J. Electr. Power Ener. Syst. 116:105526. doi: 10.1016/j.ijepes.2019.105526
Zhang, X., Shen, H., Huang, T., Wu, T., Guo, B., Liu, Z., et al. (2024). Improved random forest algorithms for increasing the accuracy of forest aboveground biomass estimation using Sentinel-2 imagery. Ecol. Indic. 159:111752. doi: 10.1016/j.ecolind.2024.111752
Zhang, W., and Zeng, H. (2024). Spatial differentiation characteristics and influencing factors of the green view index in urban areas based on street view images: a case study of Futian District, Shenzhen, China. Urban Forestry Urban Green. 93:128219. doi: 10.1016/j.ufug.2024.128219
Zhang, X., Zheng, Z., Sun, S., Wen, Y., and Chen, H. (2023). Study on the driving factors of ecosystem service value under the dual influence of natural environment and human activities. J. Clean. Prod. 420:138408. doi: 10.1016/j.jclepro.2023.138408
Zheng, Y., Zhang, W., Wu, Q., Chen, Z., Wang, Y., Ding, G., et al. (2016). The color quantization of the fall scenic Forest in Jinsi canyon National Forest Park in Shanxi Province. J. Northwest Forestry Univ. 31, 275–280.

Keywords: above-ground biomass, autumnal landscape color, multiple linear regression, Purple Mountain, random forest, tree species diversity, urban scenic forest
Citation: Wang Z and Li M (2024) The correlation between autumnal landscape colors and environmental factors and the analysis of ecological service functions in subtropical urban scenic forests. Front. For. Glob. Change. 7:1349772. doi: 10.3389/ffgc.2024.1349772
Edited by:
Rishikesh Singh, Amity University, Mohali, IndiaReviewed by:
Ali Jahani, University of Tehran, IranCopyright © 2024 Wang and Li. This is an open-access article distributed under the terms of the Creative Commons Attribution License (CC BY). The use, distribution or reproduction in other forums is permitted, provided the original author(s) and the copyright owner(s) are credited and that the original publication in this journal is cited, in accordance with accepted academic practice. No use, distribution or reproduction is permitted which does not comply with these terms.
*Correspondence: Zi Wang, d29udGhhcmRAMTYzLmNvbQ==
Disclaimer: All claims expressed in this article are solely those of the authors and do not necessarily represent those of their affiliated organizations, or those of the publisher, the editors and the reviewers. Any product that may be evaluated in this article or claim that may be made by its manufacturer is not guaranteed or endorsed by the publisher.
Research integrity at Frontiers
Learn more about the work of our research integrity team to safeguard the quality of each article we publish.