 Jinrui Lei
 Le Zhang1,3†
 Zongzhu Chen
95% of researchers rate our articles as excellent or good
Learn more about the work of our research integrity team to safeguard the quality of each article we publish.
Find out more
ORIGINAL RESEARCH article
Front. For. Glob. Change , 19 July 2024
Sec. Forests and the Atmosphere
Volume 7 - 2024 | https://doi.org/10.3389/ffgc.2024.1349057
As a fundamental element of global carbon storage, the storage carbon in terrestrial ecosystem is significant for climate change mitigation. Land use/cover change (LUCC) is a main impact element of ecosystems’ carbon storage. Evaluating the relation between land use change and carbon storage is vital for lowering global carbon emissions. Taking Hainan Island as an example, this paper employs the InVEST as well as the CA-Markov models to assess and predict how different land use affects carbon storage in various situations from 2000 to 2020 and from 2030 to 2050 on Hainan Island. The influence factors, together with driving mechanisms of carbon storage spatial distribution are quantitatively analyzed as well in this paper. The results demonstrate that, from 2000 to 2020, Hainan Island’s net increase in built land was 605.49 km2, representing a growth rate of 77.05%. Over the last 20 years, Hainan Island’s carbon storage and density have decreased by 5.90 Tg and 1.75 Mg/hm2, respectively. The sharp rise in built land mainly makes the carbon storage decline. From 2030 to 2050, land use changes on Hainan Island are expected to result in differing degrees of carbon storage loss in various scenarios. In 2050, Hainan Island’s carbon storage will decline by 17.36 Tg in the Natural Development Scenario (NDS), 13.61 Tg in the Farmland Protection Scenario (FPS), and 8.06 Tg in the Ecological Protection Scenario (EPS) compared to 2020. The EPS can efficiently maintain carbon sequestration capability, but it cannot effectively prevent cropland area loss. Regarding the carbon storage’s spatial distribution, Hainan Island generally exhibits a pattern of high carbon storages in the low and middle carbon storages in the surrounding areas. Areas with high value are primarily located in Hainan Island’s central and southern mountainous areas, whereas areas with low value are primarily located in surrounding areas with lower elevations, primarily encompassing built land and cropland. Geographic detection presented the spatial differentiation of carbon storage in Hainan Island is mainly influenced by factors like slope, land use intensity, and DEM, as well as its interaction with other factors is significantly strengthened (p < 0.05). Under the strategic framework of the “carbon peaking and carbon neutrality” goal and the national ecological civilization pilot zone, it is imperative to carefully consider scenarios for ecological protection and farmland protection, adopt ecological regulation models with spatial differentiation, and implement land use policies to improve ecosystem stability, which will contribute to carbon storage loss reduction and ensure food and ecological security.
Global warming is now a significant influencing element for the sustainable development of human civilization and the economy as a result of the rise in greenhouse gas emissions (IPCC, 2014). The global carbon balance assessment results show that 31% of anthropogenic carbon dioxide emissions from 2010 to 2019 were absorbed by terrestrial ecosystems (Piao et al., 2022). Global warming has been significantly slowed down over the past few decades as a result of the terrestrial ecosystem’s ability to absorb atmospheric carbon dioxide (CO2) (Piao et al., 2009; Grassi et al., 2017; Kothandaraman et al., 2020). Governments and academics around the world are now focusing on regulating atmospheric CO2 concentration by safeguarding and enhancing ecological carbon storage (Yu et al., 2010; Xu et al., 2018b; Friedlingstein et al., 2020; Piao et al., 2022). The Chinese government stated specifically that by 2030 it would strive for the carbon peak and by 2060 obtain carbon neutrality. “Carbon neutrality” refers to the total amount of CO2 generated by human activities being equal to the total amount of CO2 fixed by actions such as afforestation, vegetation restoration, energy conservation and emission reduction, thus forming a relative “zero emission” of carbon. As the world’s largest developing country and carbon emitter, China has conducted in-depth monitoring, estimation, and research on carbon sinks and emissions in terrestrial ecosystems in the process of achieving the “dual carbon” goals, and has taken a series of measures including afforestation, natural forest protection, ecosystem restoration, and increasing the proportion of non-fossil fuels (Wang et al., 2021; Liu Z. et al., 2022), this plays an important role in maintaining global carbon emission balance and carbon absorption balance. According to Piao et al. (2009), terrestrial ecosystems play a significant part in global carbon storage. Its carbon pool is primarily distributed among forests, farms, grasslands, wetlands, cities, deserts, and other ecosystems (Xu et al., 2019). The carbon pool of each terrestrial ecosystem type includes a soil carbon pool and a vegetation carbon pool (Tang et al., 2018; Zhang et al., 2022), which are essential in both absorbing atmospheric CO2 and reducing climate change (Ito et al., 2016; Li et al., 2020). The major impact factor of storage of carbon in the terrestrial ecosystem is Land Use/Cover Change (LUCC), which is the major form of human activity (Wiesmeier et al., 2015; Xiang et al., 2022a). LUCC is comprehensively affected by climate, terrain, human activities, and other natural, social, and economic factors, and has an impact on ecosystem functions, such as greenhouse gas exchange, hydrological cycle, and carbon (Li et al., 2023). Therefore, quantifying the connection between carbon storage and land use change is crucial for studying terrestrial ecosystem’s carbon storage.
Two basic methodologies according to DeNitrification-DeComposition (DNDC) Model (such as Biome BGC and Century) and carbon density statistics have been used to quantify terrestrial ecosystem carbon reserves in recent years (Liang et al., 2021; Zhang et al., 2022). The former can dynamically simulate the carbon cycling process of ecosystems and has higher accuracy in estimating results, but it requires multiple model parameters, complex model structure, and does not emphasize the relationship between land type change and terrestrial ecosystem carbon storage (Liu et al., 2019), making it more suitable for small-scale research; The latter estimates carbon storage based on land use type carbon density, which has the advantages of simple required data and fast operation speed, making it more suitable for large-scale assessment (He et al., 2016). Therefore, the approach of employing carbon density data to assess regional carbon storage have been utilized by both domestic and international scholars, with the InVEST (Integrated Valuation of Ecosystem Service and Tradeoffs) Model being the most popular. This model has the qualities of less required data and fast operation speed, and it can achieve visual expression of the carbon storage’s spatial allocation and dynamic variances, which has achieved successes in evaluating the carbon storage’s dynamic differences in caused by regional land policies (Houghton and Nassikas, 2017). For instance, Zhang et al. (2016) explored the spatial pattern of carbon storage in the Bailong River Basin in Gansu Province according to the InVEST and GIS technology, and they discussed the effects of altitude, slope, and aspect on the carbon storage’s spatial allocation. Xiang et al. (2022b) utilized the InVEST to study how storage of carbon in the major urban regions of Chongqing responded to land use difference over the previous 20 years. However, previous researches put much emphasis on the current land use change responding to carbon storage, with less attention paid to future land use simulation and prediction. Especially, there are few research cases targeting carbon storage variances in land use under different circumstances. The CA-Markov model (Hoque et al., 2021; Liang et al., 2021), PLUS model (Men and Pan, 2023), and CLUE-S model (Jiang et al., 2017) are now the most widely adopted models for predicting land use. Among them, the CA-Markov model focuses on simulating its own mechanism, and its transformation rules may be difficult to consider the influence of geographical factors and economic and social factors (Zhou et al., 2016). However, the CA-Markov model combines the strong spatial simulation ability of the CA model with the high prediction accuracy of the number of Markov models, greatly improving prediction accuracy, and is widely used in various fields such as land use, urban growth, and diffusion research (Aburas et al., 2017; Liu Q. et al., 2021). Babbar et al. (2021) adopted InVEST and Markov models to assess and predict carbon storage in India’s Sariska Reserve in two different scenarios from 2000 to 2035. The findings revealed that local communities caused loss of carbon to the atmosphere through illegal logging. Hoque et al. (2021) evaluated and predicted the dynamic changes in artificial development of forest and carbon storage in the ecosystem of coastal regions of Bangladesh in three future land management scenarios according to the CA-Markov and InVEST. The results demonstrated that an increase in artificial forest area would promote regional carbon storage. Liang et al. (2021) evaluated the effect of land use variance imposed on storage of carbon in the Loess Plateau area in China from the year of 1995 to 2050 by setting up three different scenarios according to the CA-Markov and InVEST. This demonstrates that coupling the two models, combined with temporal and spatial scales to forecast regional land use situations and the carbon storage’s change trend, can serve as crucial references for local carbon storage service management and carbon neutrality policy formulation, and thus provide guidance for addressing future climate change.
Hainan Island is the largest tropical island and one of the most significant ecological functional areas in China. It has a forest cover of more than 60% and a vast area of primitive tropical rainforest. Its enormous carbon sequestration capacity is significant for the regional carbon balance and cycle (Ren et al., 2014; Kothandaraman et al., 2020). Many researches are currently focusing on the carbon storage changes in forest ecosystems, regional urban agglomerations, and critical watershed ecosystems. There is relatively little research on the carbon storage in tropical island ecosystems, particularly a lack of awareness that future land use variances will cause carbon storage changes in tropical areas (Ren et al., 2014; Liu Q. et al., 2022; Gao et al., 2023). At present, Hainan is constructing a national pilot zone of ecological civilization as well as a free trade port with Chinese features. The population of Hainan is increasing, the urban scale is rapidly rising, and the ecological environment is being continuously disrupted by human activities, which leads to severe land use changes, particularly in key urban regions such as Haikou and Sanya (Lei et al., 2020), as well as high energy consumption and carbon emission intensity, seriously threatening the carbon storage service function of local ecosystems. It also leads to a decrease in forest coverage and loss of biodiversity, further disrupting ecological balance. Hence, it is critical to investigate the changes in carbon storage and land use spatiotemporally in the current and future periods to give a reference foundation for promoting carbon sequestration and emission reduction in Hainan Island, exploring a green low-carbon economy, and developing further reasonable land use policies.
The research is conducted according to the land use statistics for Hainan Island from the year of 2000 to 2020. The InVEST model was adopted to assess the effect of changing land use on Hainan Island’s carbon storage from 2000 to 2020. The CA-Markov was adopted to model and estimate land use and carbon storage changes on Hainan Island in 2030, 2040 and 2050 in three different situations. The following trend of carbon storage change in Hainan Island and its impact factors were analyzed as well. Specifically, this study is aimed to: (1) analyze the land use features and carbon storage variances in Hainan Island from the year of 2000 to 2020; (2) predict the changing types of land use in the island in multiple scenarios from 2030 to 2050, and evaluate the spatiotemporal differences in carbon storage characteristics; (3) explore the influencing factors as well as driving force of the carbon storage’s spatial distribution in the island.
Covering approximately 3.4 × 10⁴ km2, Hainan Island (18.80°–20.10°N, 108.37°–111.03°E), is the second largest province next to Taiwan and is situated in southern China (Figure 1). Additionally, it serves as a crucial strategic hub for China’s Maritime Silk Road. There are various geomorphic types in the island, with Yingge Ridge (1,811 m) and Wuzhi Mountain (1,867 m) as the core uplift and being followed, from the center outward, by hills, mountains, plateaus, plains, as well as oceans. The climate of the island is hot and rainy, with long summers and no winters. It has a typical tropical monsoon marine climate, with an annual average temperature of 22.5°C–25.6°C. The isotherm increases from the central mountainous area to the surrounding coastal areas, with Qiongzhong County in the central part of Hainan Island having the lowest temperature and Sanya City in the southern part having the highest temperature. Hainan Island also has a typical tropical rainforest forest ecosystem and excellent ecological environment. However, in recent years, economic development and other human factors have caused considerable damage to the ecosystem.
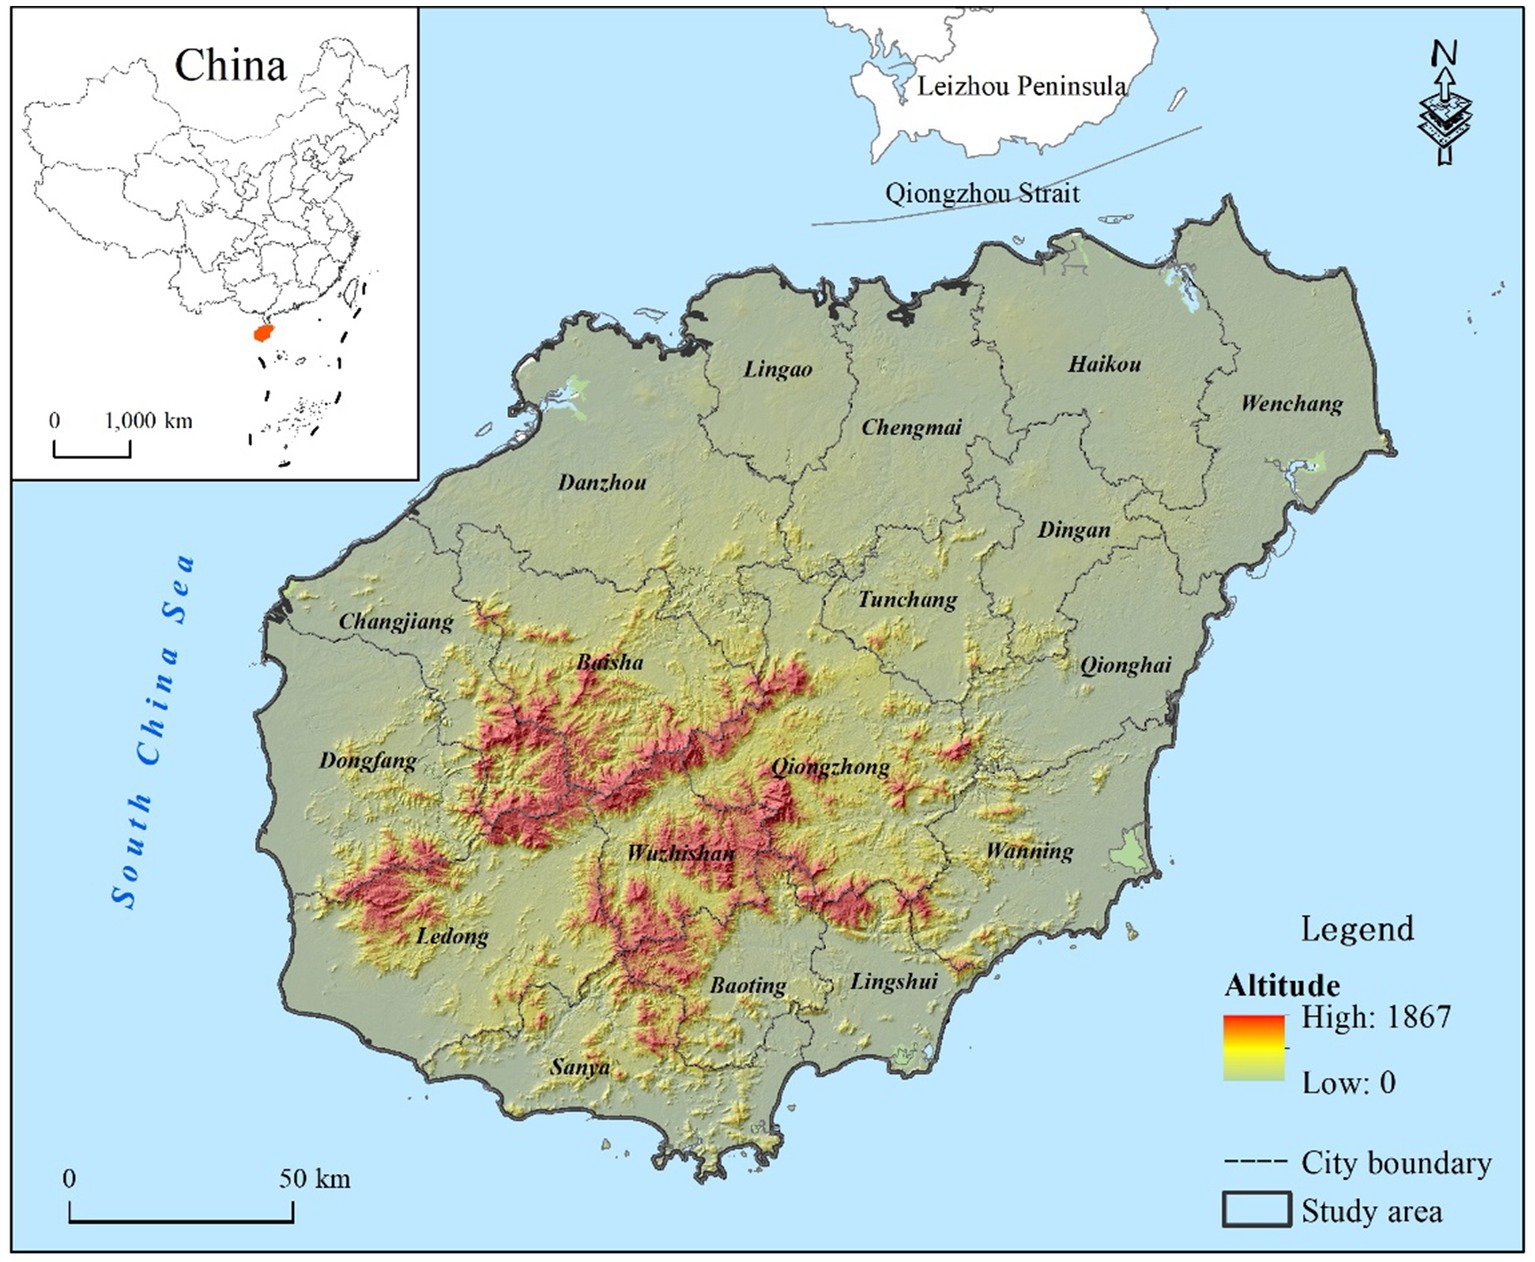
Figure 1. The location of the research area.
The Hainan Statistical Yearbook shows urban population in Hainan has risen from 40.7% in 2000 to 60.3% in 2020, and the urban area has increased from 667.0 km2 to 1,703.6 km2. In June 2020, the State Council and the Central Committee of China put forward a general plan for constructing Hainan Free Trade Port, setting up the island as a free trade port. As a major strategic deployment of the country, Hainan’s socio-economic and urban construction ushered in a new round of boom. By 2020, Hainan will have 10.0812 million residents in total, a gross regional product of 556.624 billion yuan, which is 55,100 yuan per capita. The current land use is dominated by forestland and cropland, with a forest coverage of 62.1%, ranking the forefront in China.
In this research, the statistics includes three periods of land use (Figure 2), DEM, NDVI, soil type data, meteorological data, socio-economic data, road and natural reserve vector data of Hainan Island from 2000 to 2020. The data sources and details are given in Table 1. Data preprocessing was performed using ArcGIS10.3 software, including projection conversion, resampling, as well as cropping. The above mentioned data was unified into raster data with a 30 m spatial resolution and a projected corresponding system applying CGCS2000_ 3_ Degree_ GK_ CM_111E.
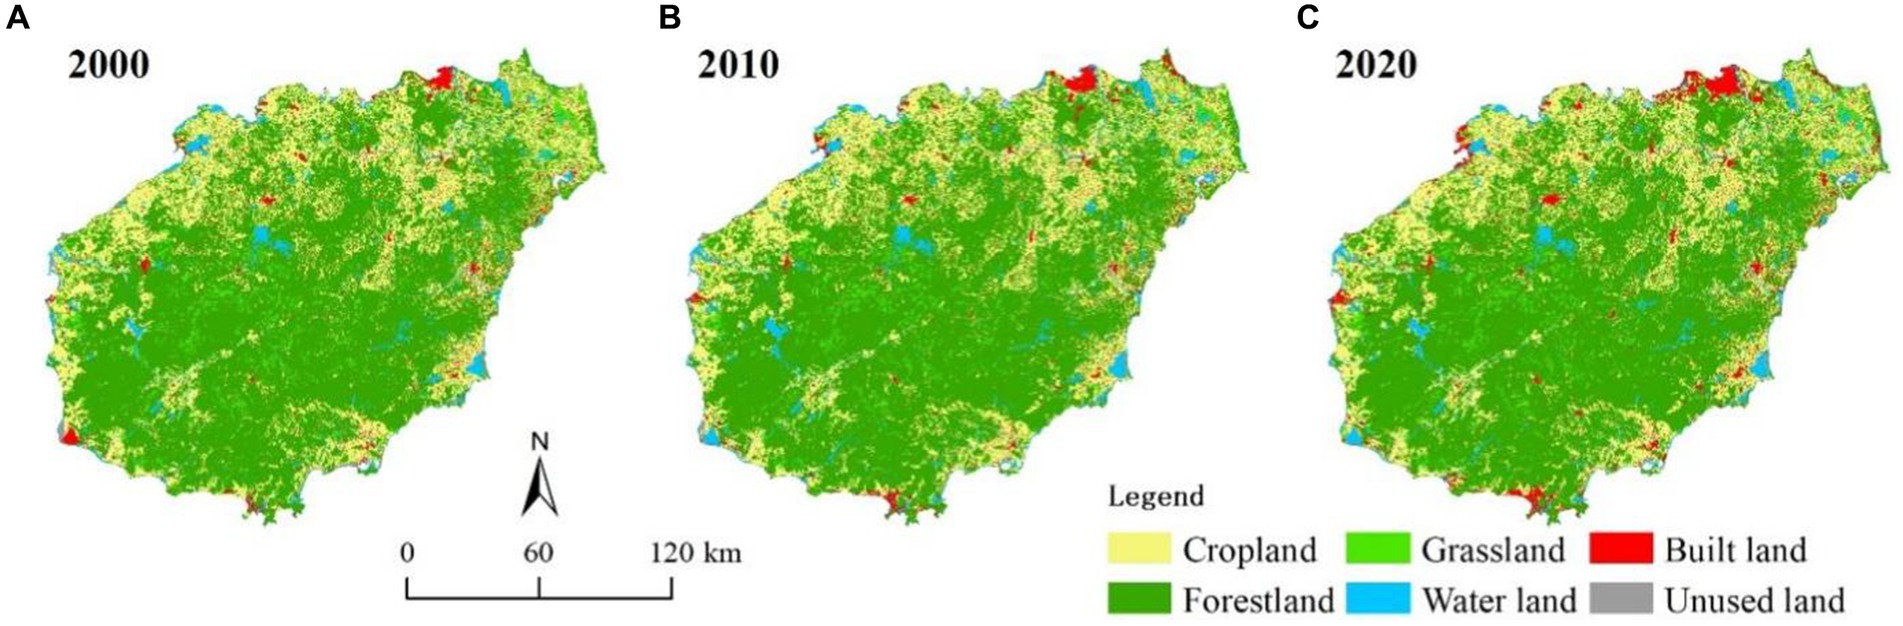
Figure 2. Land use of Hainan Island from 2000 to 2020, where (A-C) represent the years 2000, 2010, and 2020, respectively.
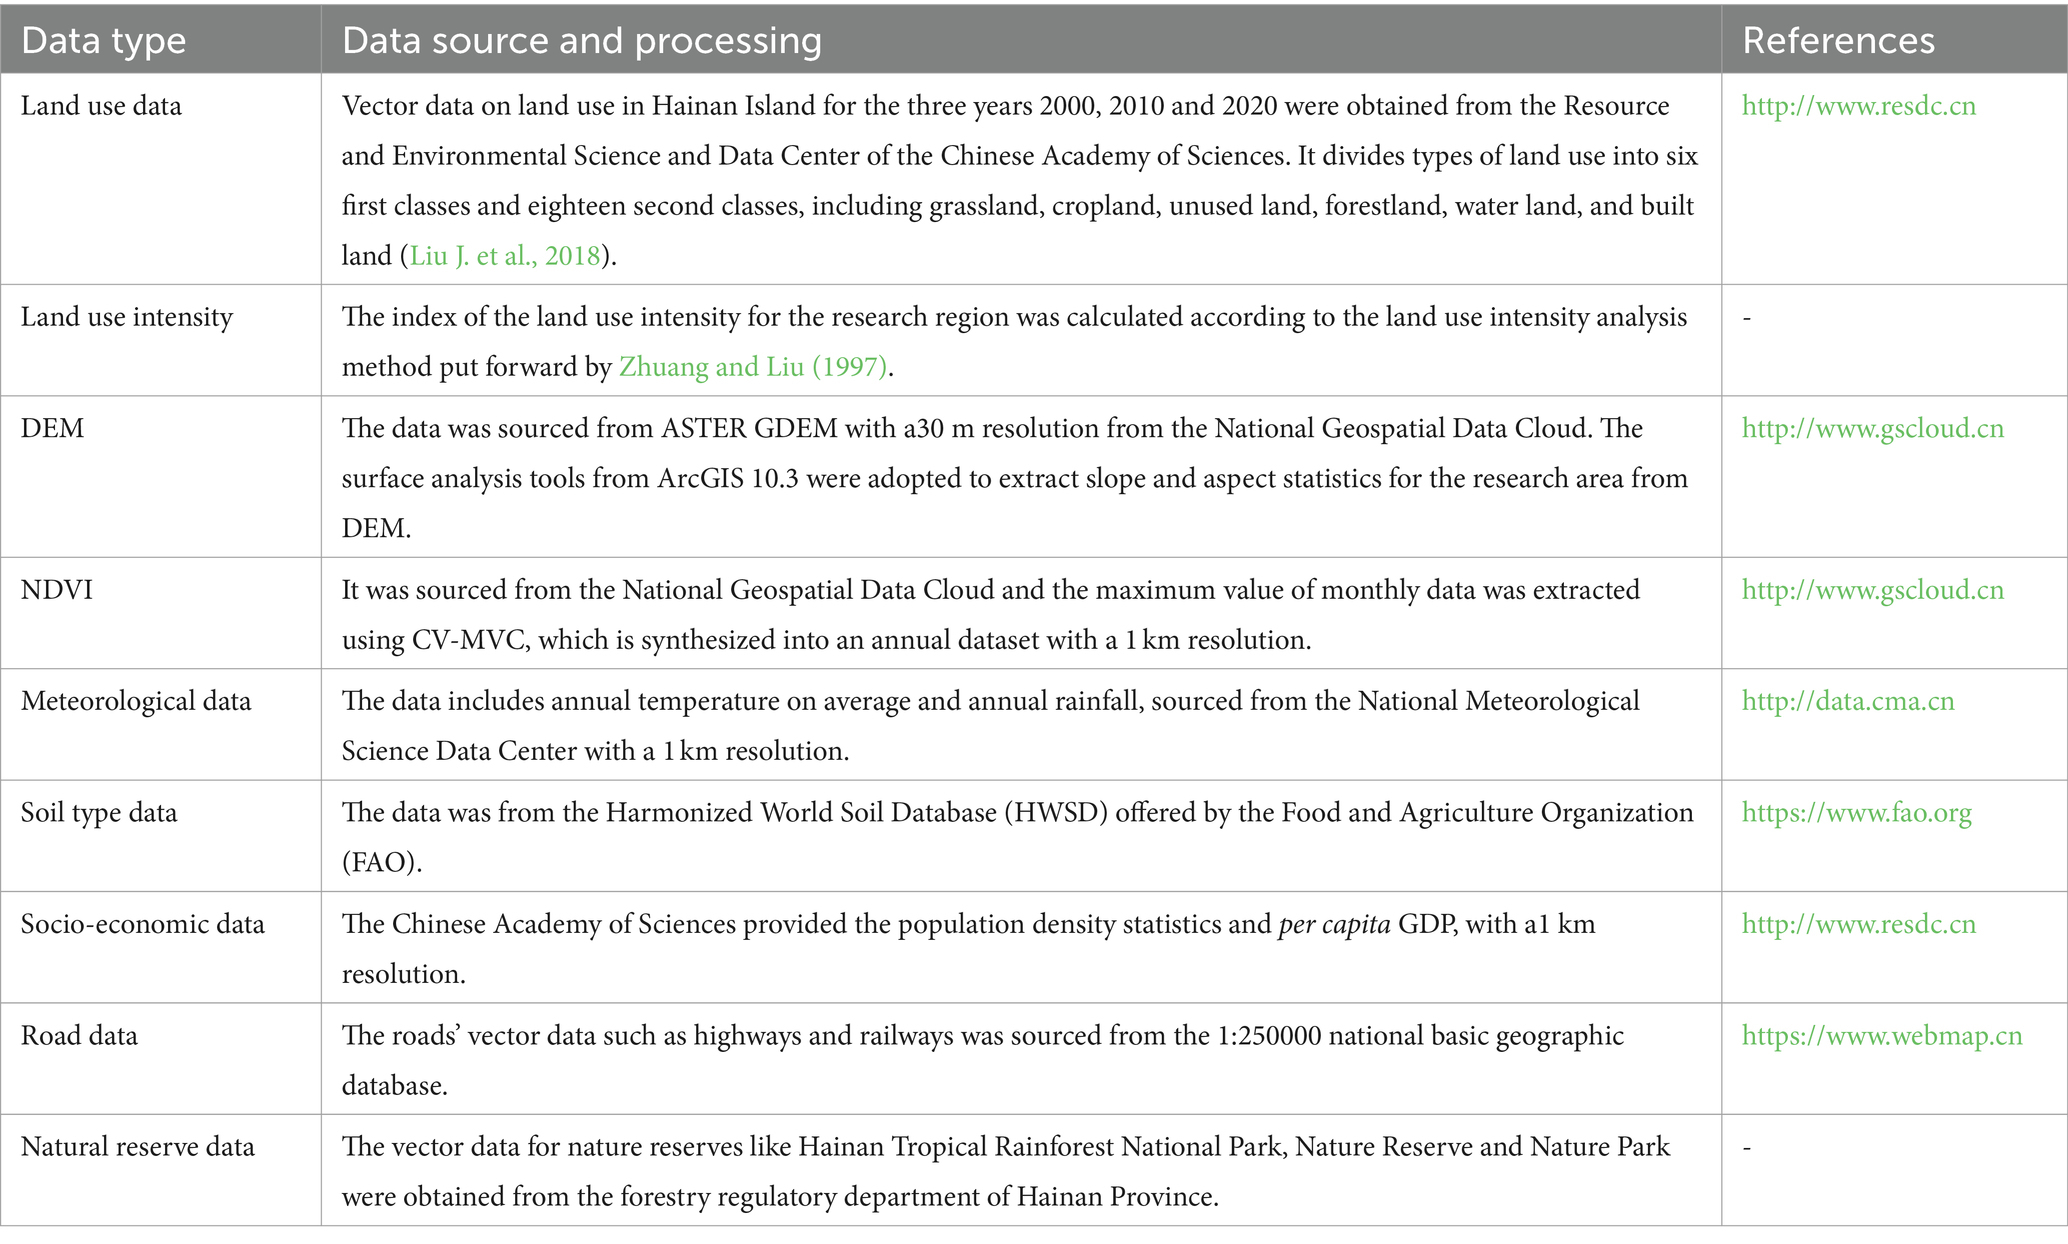
Table 1. Data acquisition and preprocessing.
The China Terrestrial Ecosystem Carbon Density Dataset of the National Ecological Science Data Center1 provides carbon density statistics. This data set was designed through connecting the carbon density of China’s terrestrial ecosystem with related experimental statistics (Xu et al., 2018a), covering major ecosystem types such as forests, grasslands, cropland, wetlands, and shrubs, including carbon density of aboveground biomass, carbon density of belowground biomass, as well as carbon density of soil organic at various depths, this study mainly refers to carbon density data at 0–100 cm soil depth. On the basis of the above data sets, the forest carbon density data of Hainan Island was obtained by referring to Gao et al. (2023), who used the latest forest resource second-class survey distribution data and field sample survey data. The carbon density data of other land types mainly refer to the carbon density results of land types in the Hong Kong Zhuhai Macao Greater Bay Area (Deng et al., 2022), Beibu Gulf (Zhang et al., 2023), and Hainan Island Coastal Zone (Sun et al., 2023), excluding data with significant differences in magnitude, and calibrating and correcting based on precipitation and temperature similarity (Alam et al., 2013; Xiang et al., 2022a,b). The relationship between biomass carbon density and annual average temperature is based on the formula proposed by Chen et al. (2007), and the relationship between soil carbon density and annual precipitation is based on the formula proposed by Alam et al. (2013). After correcting the obtained data with local climate data, the carbon density statistics of multiple kinds of land use in the research region were finally determined (Table 2).
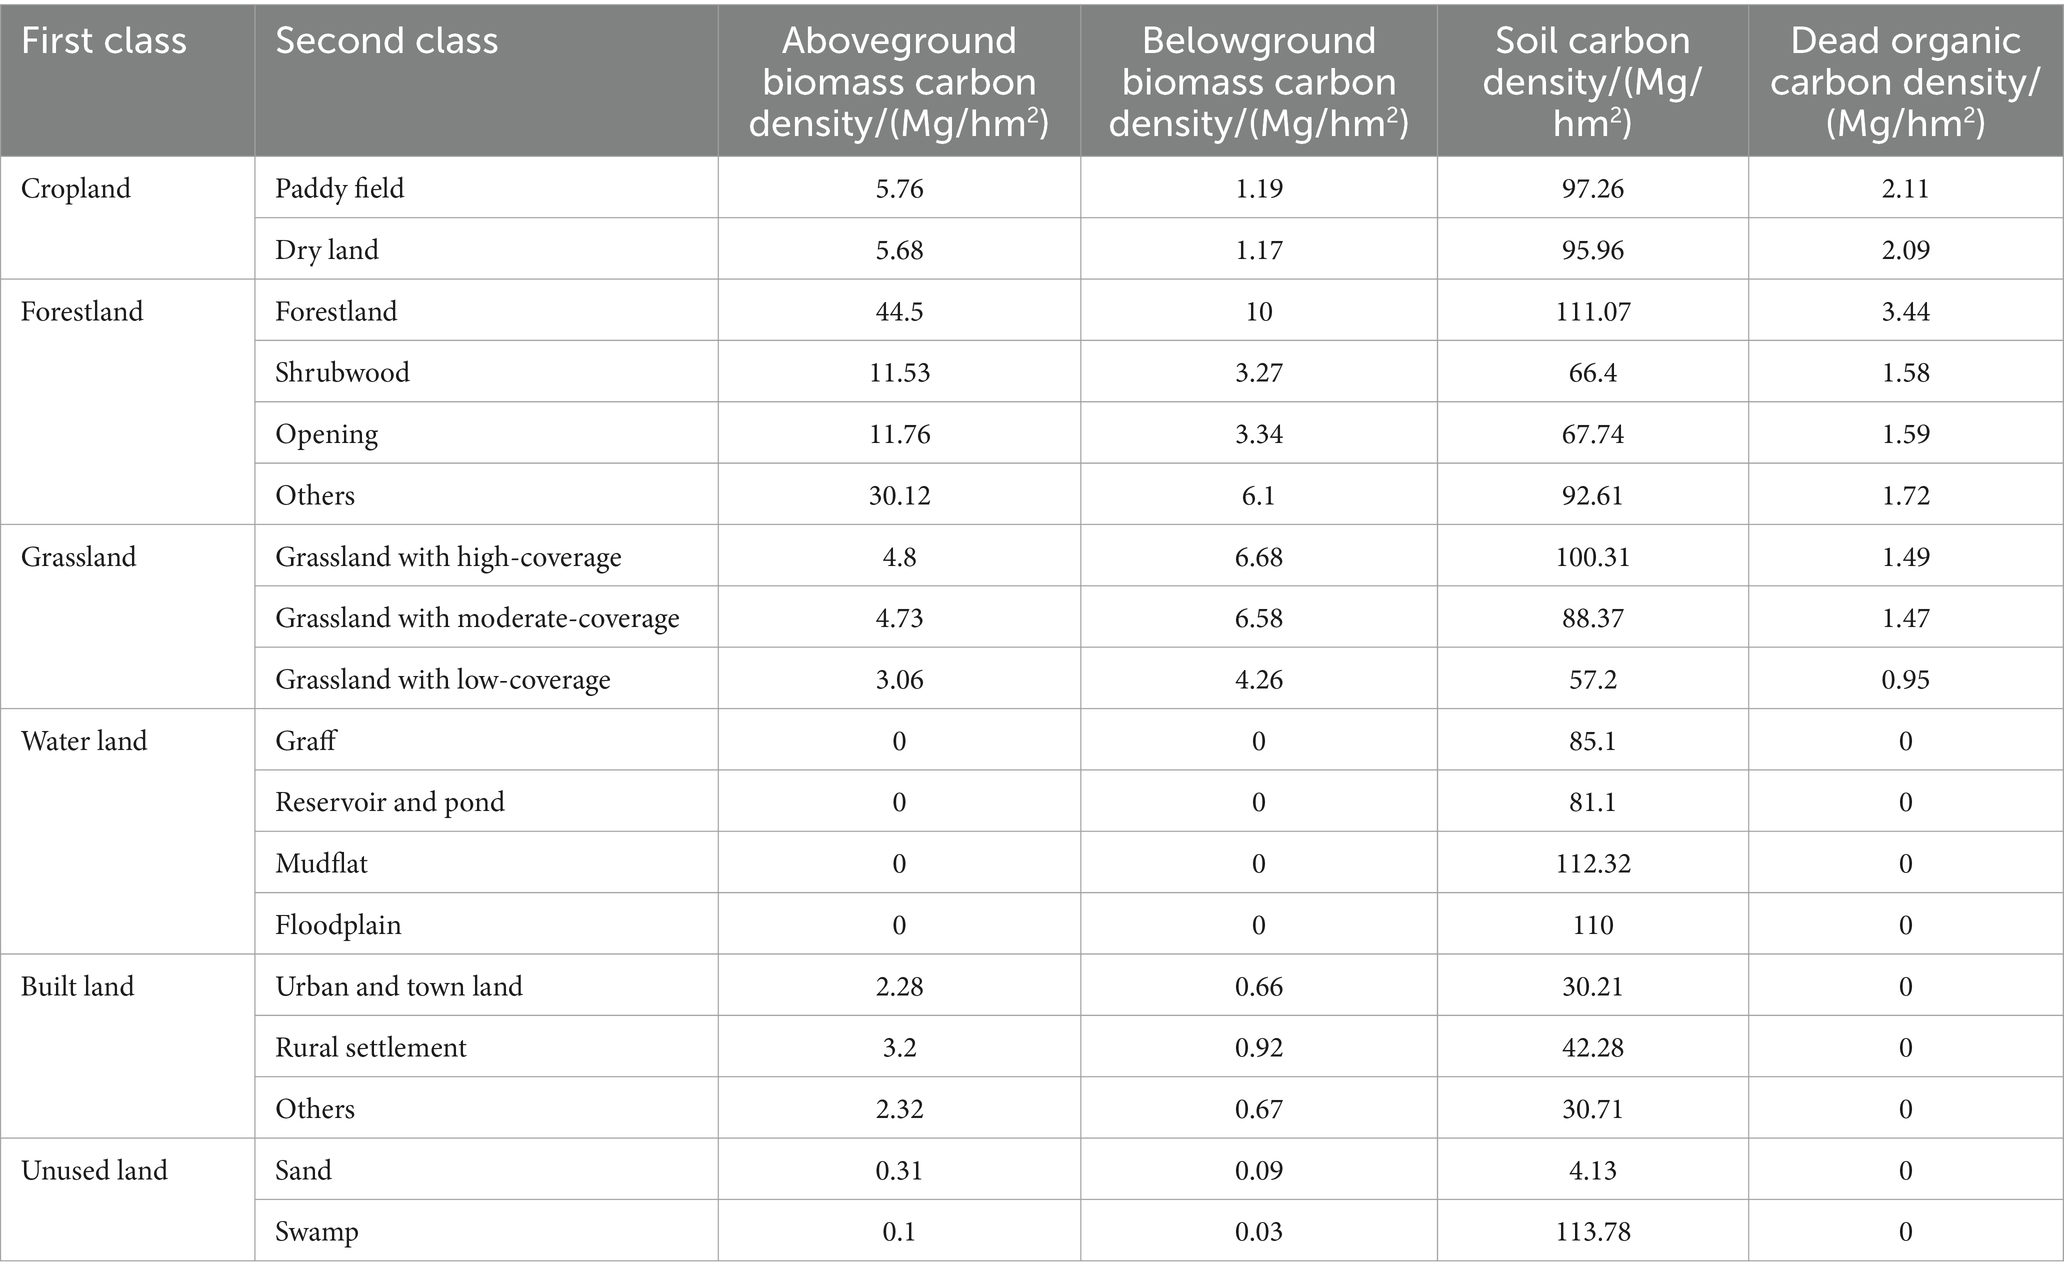
Table 2. Carbon density of various types of and use on the island.
This research evaluated the distribution of land use carbon storage in the island quantitatively by adopting the Carbon module in InVEST 3.5.0 (Clerici et al., 2019; Xiang et al., 2022a). The Carbon module estimates the storage carbon in ecosystem according to land use/land cover data, and divides the storage into 4 basic pools: belowground, aboveground, soil, and dead organics. The formula is:
Where, Ctot represents total carbon storage (Mg C); Cabove is carbon storage of aboveground biomass (Mg C); Cbelow is carbon storage of belowground biomass (Mg C); Cdead is carbon storage of dead organic (Mg C); Csoil is soil carbon storage (Mg C). According to the user guidebook of the InVEST model, a specific land use’s carbon density is assumed to be fixed (Tallis et al., 2013).
The Markov is a long-run way to predict the situation of an event in the following period according to its state in a certain period (Liu Y. et al., 2021; Zhu et al., 2021; Xiang et al., 2022a). The cellular automata (CA) model can simulate the complex systems’ spatiotemporal evolution of Li et al. (2007). The CA-Markov combines the two to complement their advantages, fully utilizing the CA model’s strong spatial simulation ability and the Markov long-run prediction ability (Hu and Zhang, 2018; Pan et al., 2018; Lei et al., 2022). The two models are as follows:
Where, Xt + 1 denotes the situation of a random event at moment t + 1, which is the outcome predicted by the Markov. Xt denotes the situation of a random event at moment t. P represents the transition probability matrix. S represents a finite and discrete set of states of cells. F represents the cells’ transformation rule. N represents the cell’s adjacency. t and t + 1 denotes various moments.
This study employs the CA-Markov in IDRISI 17.0 to finely describe the differential characteristics of land use types according to eighteen secondary land types in Hainan. Taking the land use statistics of Hainan Island in 2010 as the initial state, slope, DEM, distance from residential areas, distance from roads, as well as distance from water bodies were selected as limiting factors for prediction (Liu Q. et al., 2021), and corresponding transfer suitability maps were established to estimate the land use of Hainan Island in 2020. The coefficient Kappa was adopted to evaluate the accuracy by comparing the predicted and the actual results of land use in 2020 (Zhang et al., 2020; Xiang et al., 2022a). The formula can be:
Where, Kappa is the accuracy validation obtained from the calculation. pe and po denote the theoretical simulation accuracy and general simulation accuracy. When Kappa is between 0 and 0.20, the accuracy of the simulation results is extremely low; when between 0.20 and 0.40, the accuracy is average; when between 0.40 and 0.60, the accuracy is moderate; when between 0.60 and 0.80, the accuracy is relatively high; and when between 0.80 and 1.00, the accuracy is very high (Lei et al., 2022).
In this research, the future scenario setting is based on the development goals proposed in the “Territorial Spatial Planning of Hainan Province (2020–2035).” Referring to Liu Q. et al. (2021) and Xiang et al. (2022a)’s research on future scenario setting, three different scenario types, namely natural development scenario (NDS), farmland protection scenario (FPS), and ecological protection scenario (EPS), were built in this study to simulate the land use spatial distribution in Hainan Island in 2030, 2040, and 2050, respectively. Table 3 presents the specific scenario settings.
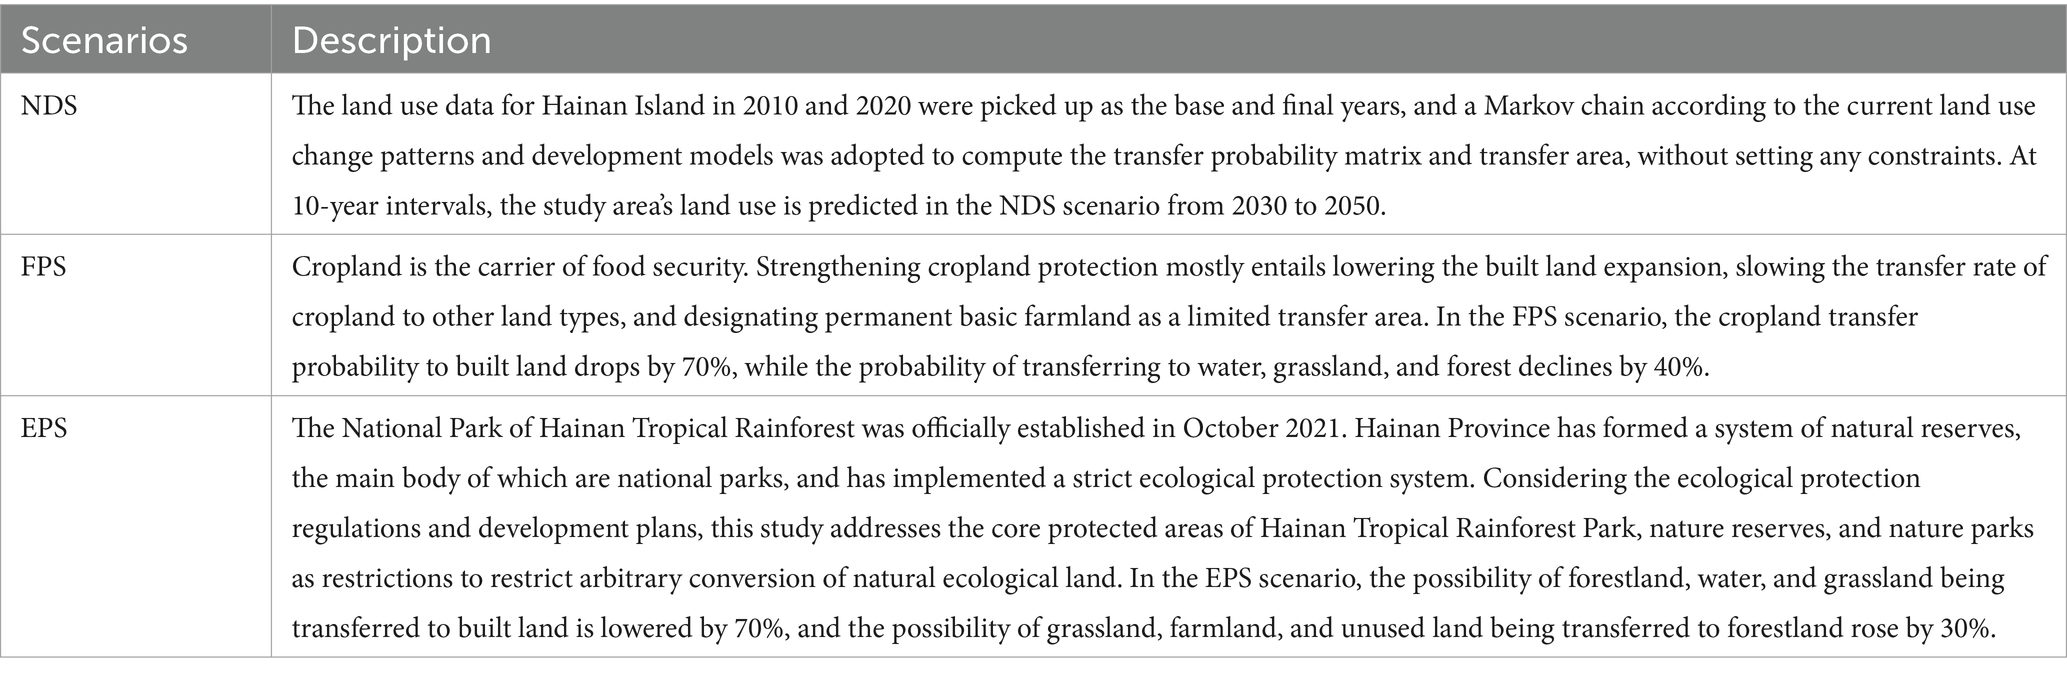
Table 3. Different development scenarios set for Hainan Island.
Put forward by Wang and Xu (2017), the geographic detector is a statistical way to detect spatial differentiation between geographical objects and analyze the corresponding driving factors (Xue et al., 2023). Carbon storage is a very complicated process influenced by human, natural, and economic factors (Hofhansl et al., 2020; Wang et al., 2022; Wang P. J. et al., 2023). Referring to relevant research cases, this research mainly emphasizes natural and human factors and selects nine indicators as influencing factors, including annual temperature, soil type, annual rainfall, slope elevation, normalized difference vegetation index (NDVI), per capita GDP, land use intensity, and population density (Han et al., 2023; Wang P. J. et al., 2023). Creating fishing nets in ArcGIS 10.8 and iterating multiple times to generate sample points, it was found that the best geographical detection results were achieved when the grid was 2 km × 2 km. Therefore, a grid unit of 2 km × 2 km was ultimately constructed on Hainan Island, and the average values of carbon storage and all influencing factor grids were extracted from the grid. Then, the optimic function in the GD package was called in the R language environment (Song et al., 2020) to set five alternative discretization ways, including natural, equal, geometric, quantitative, and sd, with the data hierarchy set between level 5–15. By comparison, the classification combination and optimal discretization method were picked up for the maximal q value. The discretization category variables were then brought in the geo-detector for interactive, risk, and factor detection. In this way, this study quantitatively analyzed the influencing factors and response mechanisms of the spatiotemporal variation of carbon reserves (Lei et al., 2023). The formula below can calculate the value of q:
Where, q, with a value range of [0, 1], describes a specific factor’s influencing extent on the spatiotemporal distribution of carbon storage. When the value becomes bigger, the impact of the factor imposed on the carbon storage spatial allocation in the research region becomes greater, and vice versa. L represents the overall sample size of the influencing factor. N and Nh denote the total and subarea carbon storage. σ2 and σh2 indicate the carbon storage discrete variance in the overall research region and subareas, respectively.
As shown in Table 4, the leading kinds of land use in Hainan are forestland and cropland, occupying 62.62 and 25.38% of the total area in 2020, respectively. With a growth rate of 77.05% and a strong increase between 2010 and 2020, Hainan saw the biggest net increase in built land between 2000 and 2020, at 605.49 km2. The water land is next, with a net rise of 195.16 km2 and a growth rate of 15.23%. Its area first increased and then slightly reduced. Forestland and cropland saw the highest decreases, with losses of 353.25 km2 and 307.30 km2, respectively, at rates of 1.62 and 3.41%. The regions of grassland and unused land reduced by 79.41 km2 and 51.80 km2, respectively, with a rate of 6.43 and 36.67%.
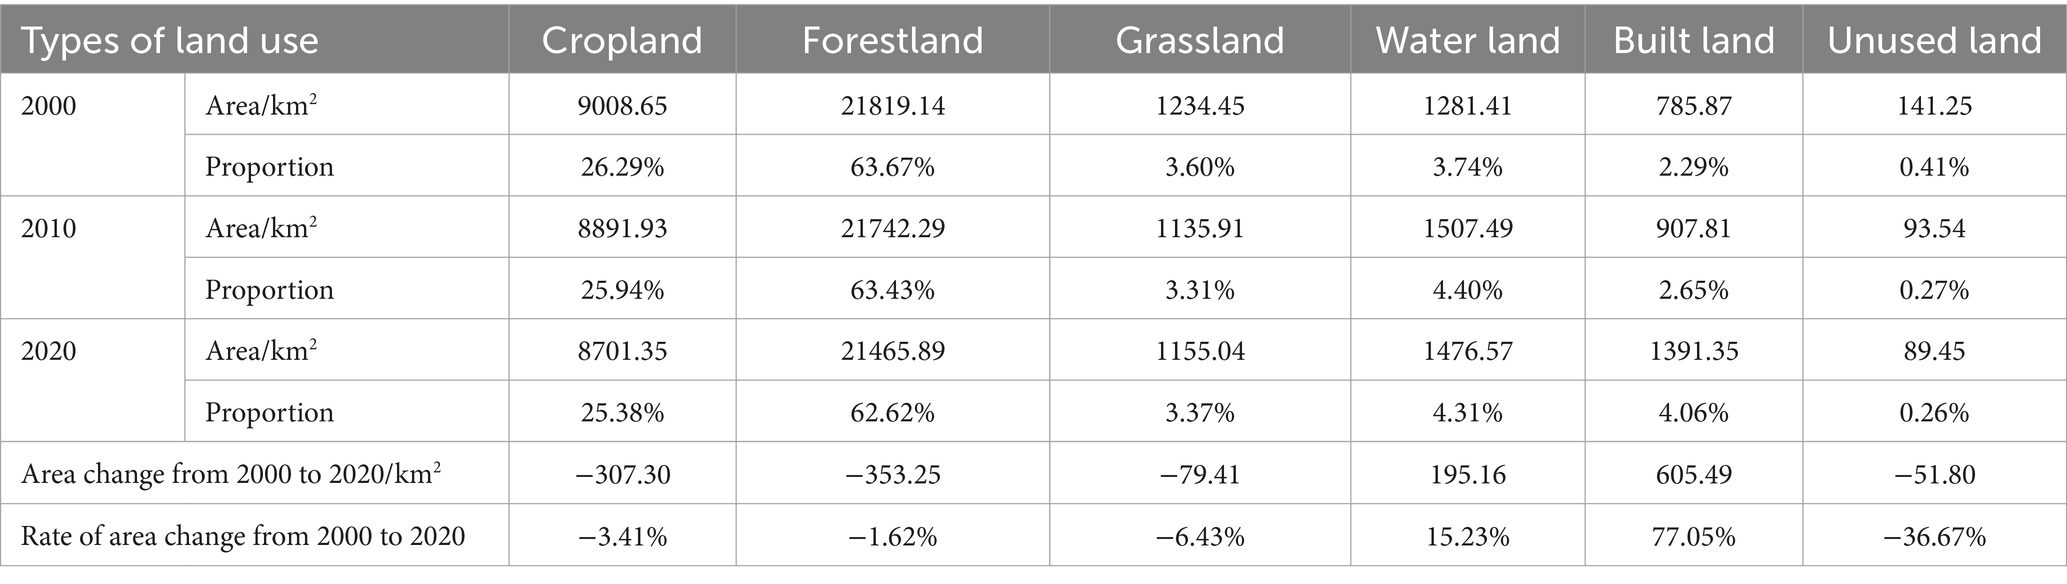
Table 4. Variances in land use types in the island (2000–2020).
According to the land use transfer map shown in Figure 3, Hainan Island experienced frequent land use transitions from 2000 to 2020. The expansion of forestland was the largest during the two decades, reaching 505.50 km2. Specifically, a total of 310.58 km2, 90.98 km2, and 74.66 km2 of the forestland were transferred into built land, water land, and cropland. Cropland possessed the second largest roll-out region of 479.71 km2, with 303.89 km2, 102.42 km2, and 61.86 km2 of the land being transferred into built land, water land, and forestland, respectively. The total roll-out area of grassland, water land, and built land was 131.34 km2, 92.81 km2, 98.07 km2, respectively, mainly into cropland, forestland, or built land. Unused land is steadily being utilized and developed as it continues to decline, mostly transferring to cropland, built land, and grassland. From a roll-in point of view, built land had the largest transfer area over the two decades, which was 684.16 km2, primarily sourced from forestland and cropland, covering 310.58 km2 and 303.89 km2, respectively. Water land also had a large roll-in area of 298.42 km2. Other land use type had relatively small roll-in areas.
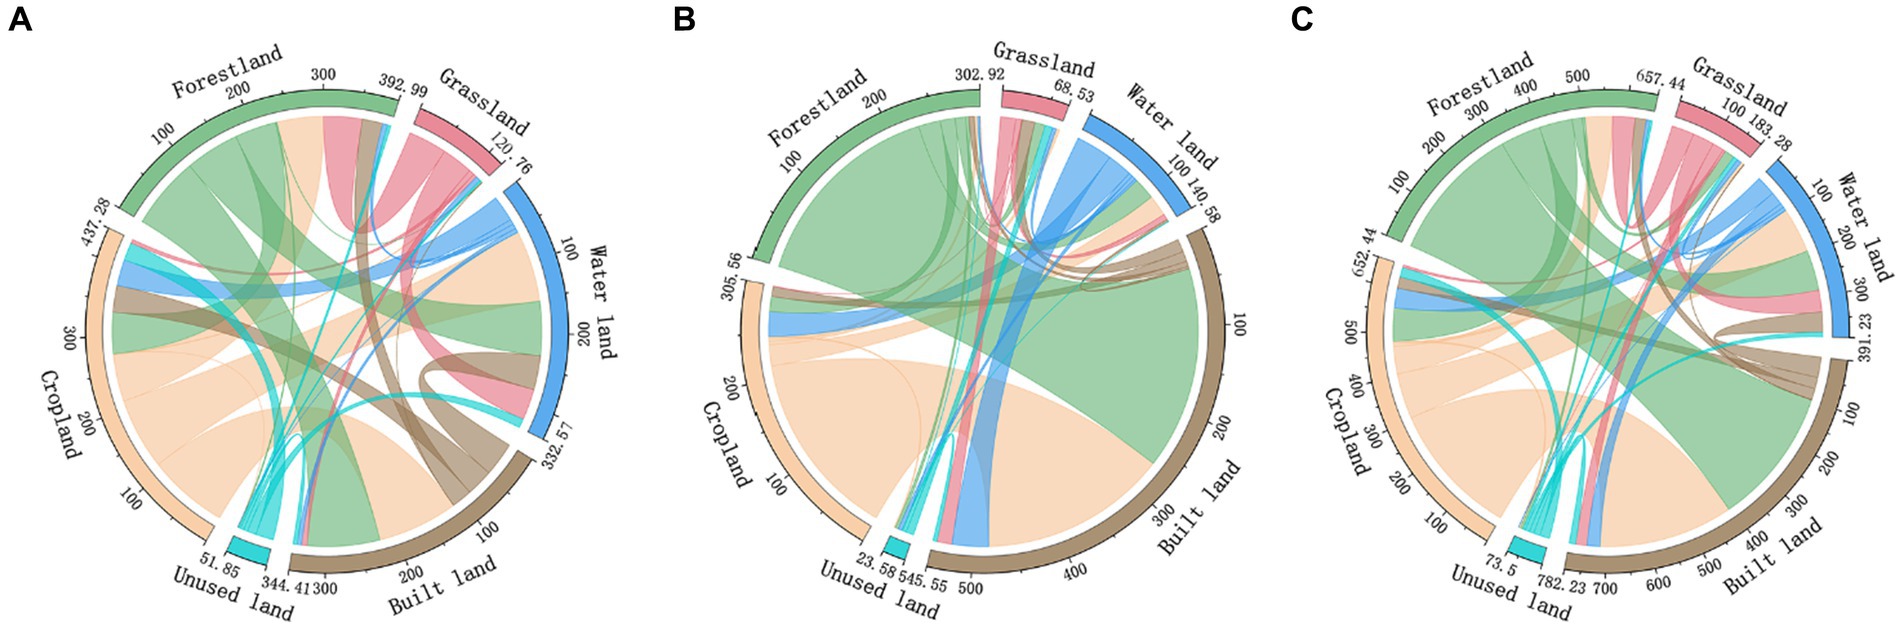
Figure 3. Map of land use transfer of Hainan Island (2000–2020), where (A-C) represent the land transfer situation from 2000 to 2010, 2010 to 2020, and 2000 to 2020, respectively.
The roll-in area of forestland was the largest between 2000 and 2010, at 158.22 km2, mostly from cropland and grassland. However, the roll-in area was only 13.03 km2 between 2010 and 2020. The roll-in area of built land between 2000 and 2010 was relatively small, at 231.52 km2, mainly transferred from cropland; whereas between 2010 and 2020, the roll-in area was relatively large, at 510.40 km2, mainly transferred from forestland.
According to Table 5, the carbon storage of the island in 2000, 2010, and 2020 was 443.37 Tg, 441.59 Tg, and 437.47 Tg, with carbon densities of 129.37 Mg/hm2, 128.82 Mg/hm2, and 127.62 Mg/hm2. The island’s carbon storage as well as carbon density has shown a downward tendency over the 20 years, with a decrease of 5.90 Tg in carbon storage and 1.75 Mg/hm2 in carbon density. In terms of time, Hainan’s carbon storage as well as carbon density fell by 1.78 Tg and 0.55 Mg/hm2 between 2000 and 2010, and 4.12 Tg and 1.20 Mg/hm2 between 2010 and 2020, respectively, with the most significant decrease between 2010 and 2020.
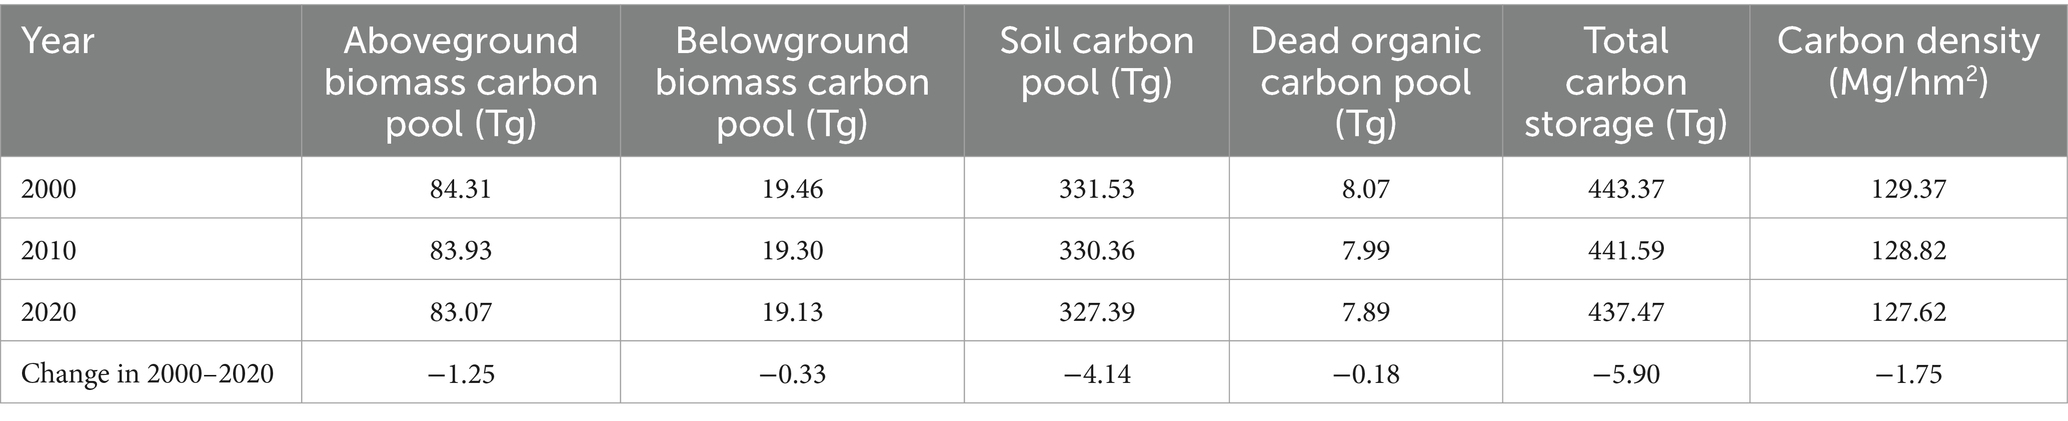
Table 5. Storage and density of carbon in various carbon pools in Hainan Island from 2000 to 2020.
By comparing different carbon pools, it can be found that the soil carbon pool of Hainan Island has the highest carbon storage, accounting for over 74% of the carbon storage in total, following aboveground and underground biomass carbon pools, and the lowest is the dead organic carbon pool. The corresponding carbon storage of the above four pools are 327.39 Tg, 83.07 Tg, 19.13 Tg, and 7.89 Tg in 2020, respectively, which decreased by 4.14 Tg, 1.25 Tg, 0.33 Tg, and 0.18 Tg in comparison with 2000.
As shown in Figure 4, as for various types of land use, forestland in Hainan Island has the highest carbon storage, occupying over 70% of the total, following cropland, while unused land has the lowest. Carbon storage of Hainan Island presented an obvious growth tendency from 2000 to 2020, with a cumulative increase of 2.25 Tg and, in particular, 1.72 Tg between 2010 and 2020. Additionally, there was an increase of 0.94 Tg of carbon storage in water land. The falling tendency of carbon storage in forestland as well a cropland is relatively obvious, with a decrease of 4.97 Tg and 3.23 Tg over 20 years, respectively.
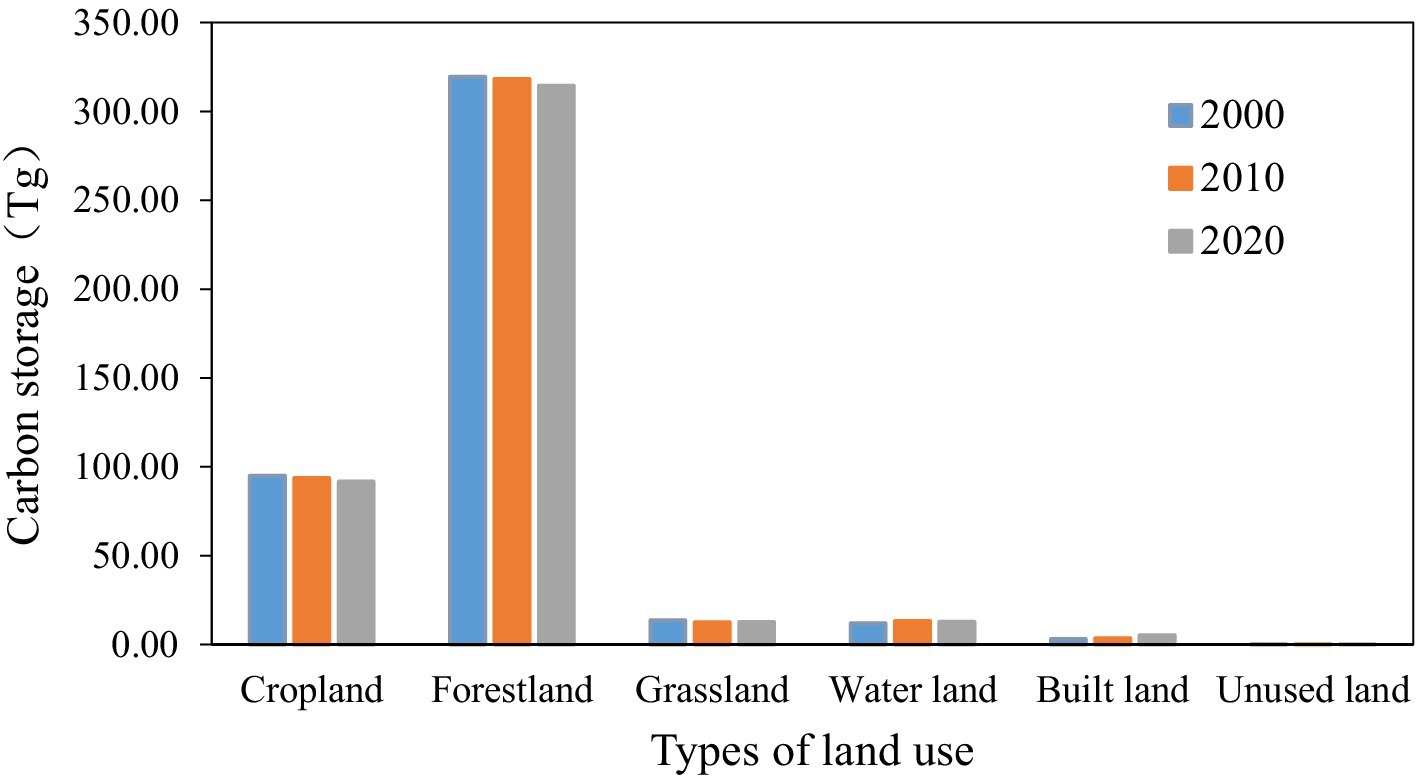
Figure 4. Changing storage of carbon in different types of land use (2000–2020).
According to IDRISI software evaluation, the Kappa coefficient in 2020 reached 0.97, indicating that the CA Markov model has high simulation accuracy. The model was adopted to predict the land use spatial distribution in Hainan Island from 2030 to 2050 in three different situations, as shown in Figure 5. It can be seen that the simulated spatiotemporal dynamic tendencies of land use have high heterogeneity in the three scenarios with diverse land use management.
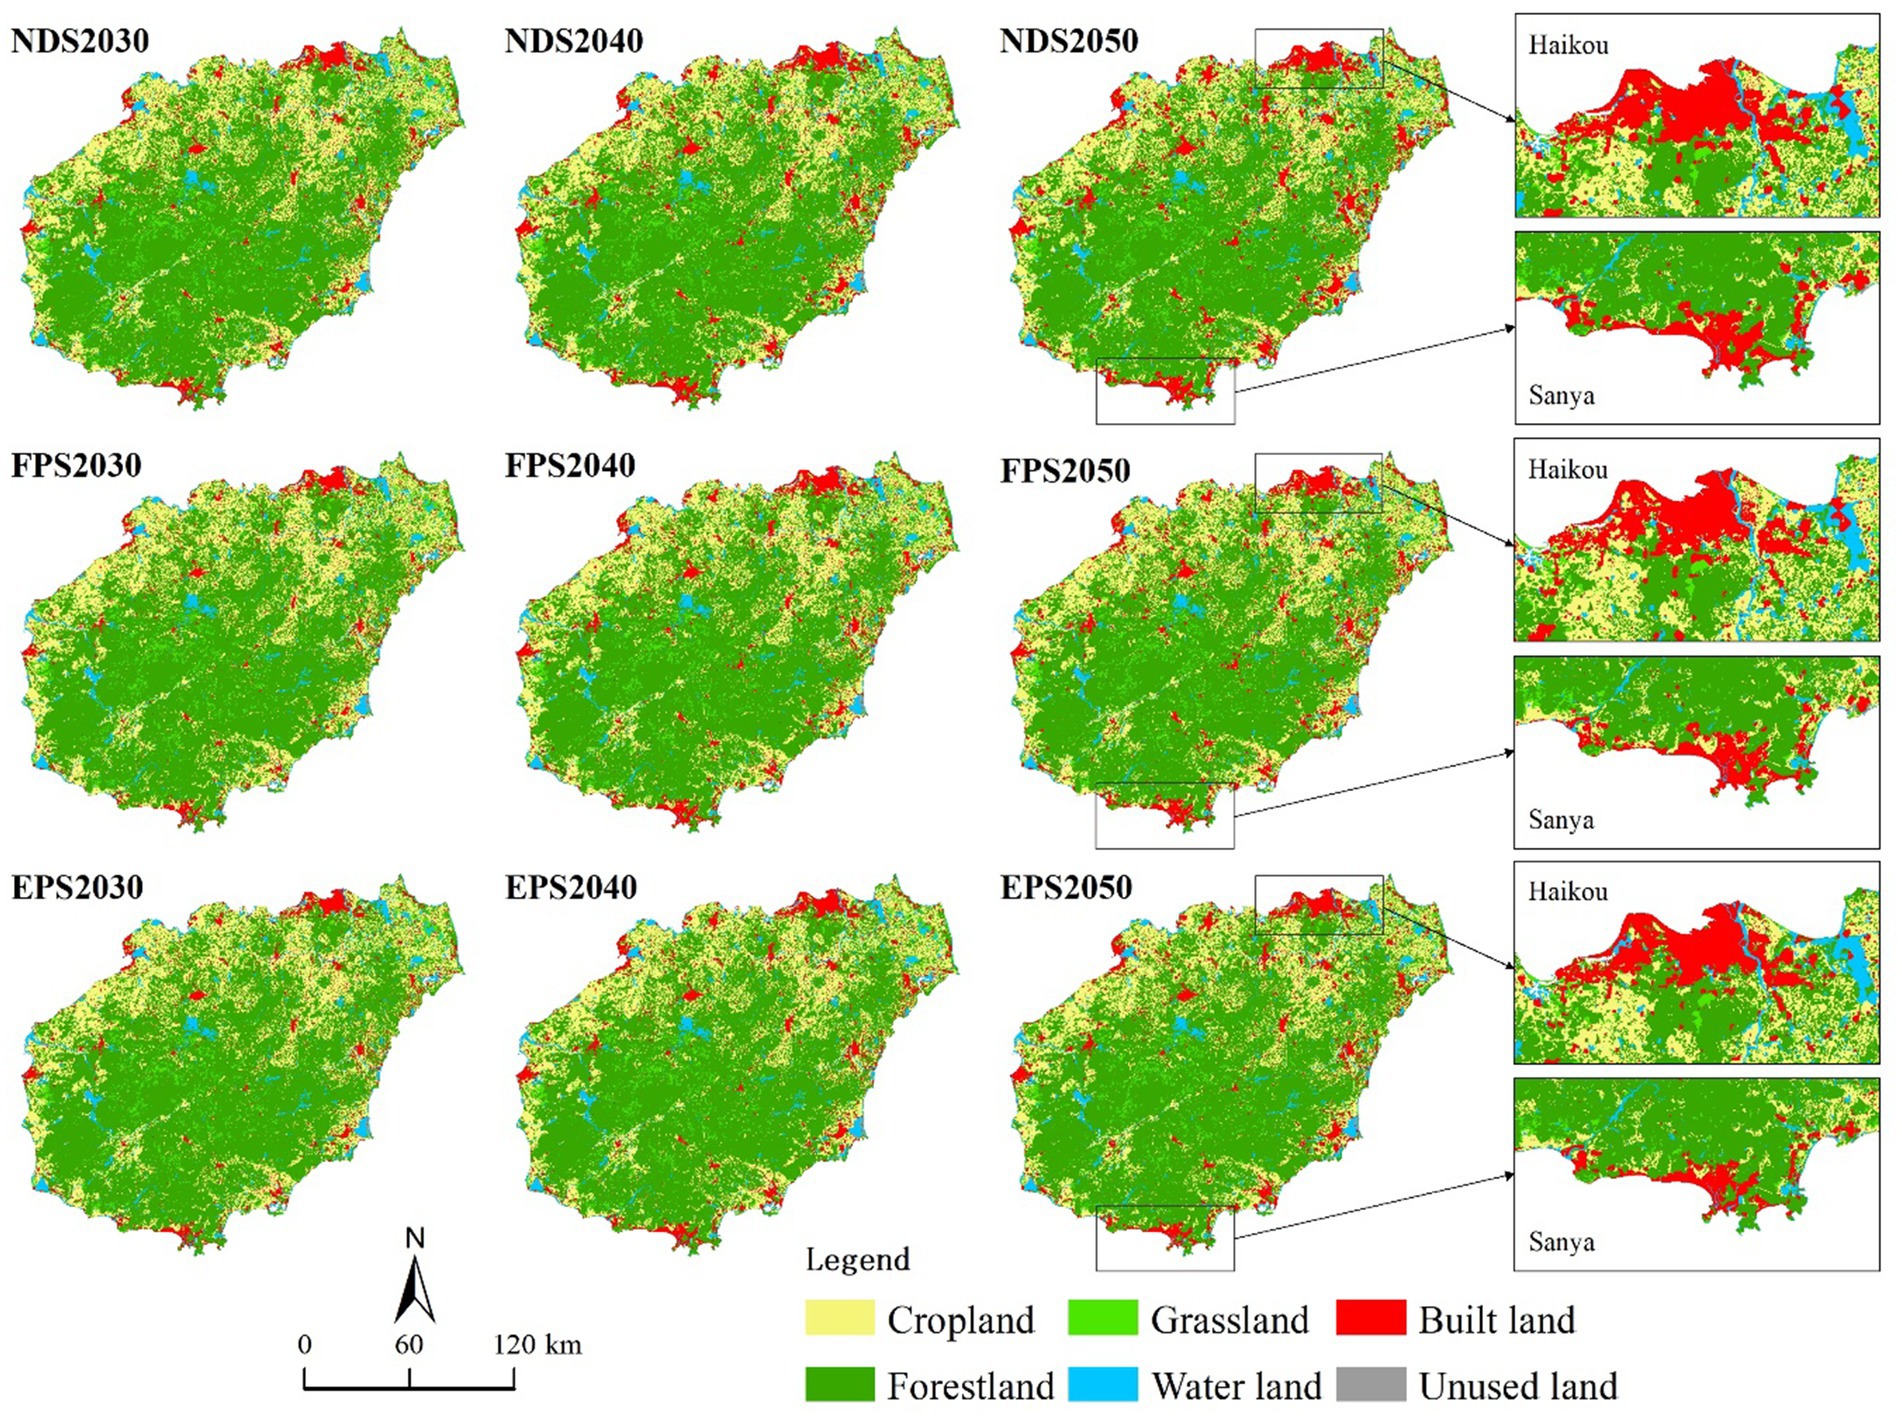
Figure 5. Prediction of land use types in the island in multiple scenarios (2030–2050).
The simulation results in Figures 5, 6 demonstrate that the general land use pattern of the island remains mostly constant across the three simulation scenarios, with an obvious rise in the number of built land. Key urban locations like Haikou and Sanya are where built land has risen the most. There are some variances in the changes of other types of land. The NDS scenario continues the and use change pattern and development modes of the previous phase, and the magnitude of the changes in each land type is broadly constant with the previous phase. In each phase from 2020 to 2050, the largest increase was in the region of built land, with a total rise of 1,885.98 km2 and 54.82 km2 in grassland over the 30 years. Cropland, forestland, water land, unused land, and other land types have their areas declined by respective amounts of 694.30 km2, 1,215.41 km2, 52.27 km2, and 1.70 km2. The reduction of cropland area in the FPS scenario is the smallest of the three simulated scenarios, only reducing 112.52 km2, effectively ensuring the food security of the province. This is accomplished by controlling the total amount of fundamental cropland. The EPS scenario restricts the uncontrolled conversion of natural ecological land, resulting in the lowest reduction in forestland and water land, at 271.21 km2 and 7.51 km2, respectively. Built land sees the smallest area growth, with an increase of 1,056.81 km2, hence effectively ensuring Hainan’s ecological environment security in 2050.

Figure 6. Statistics of land use area in Hainan in multiple scenarios.
The assessment results of three simulated scenarios (Figure 7) illustrate varying degrees of decline with respect to the density and storage of carbon in the island from 2030 to 2050. By 2050, Hainan has a carbon storage of 420.12–429.41 Tg, with a carbon density of 122.64–126.35 Mg/hm2. Compared to 2020, Hainan’s carbon storage in 2050 is reduced by 17.36 Tg in the NDS scenario, 13.61 Tg in the FPS scenario, and 8.06 Tg in the EPS scenario. The carbon densities are predicted to drop by 4.98 Mg/hm2, 3.89 Mg/hm2, and 2.27 Mg/hm2, respectively. In the NDS scenario, the density and storage level of carbon in the island are the lowest, while those in the EPS scenario are the highest.
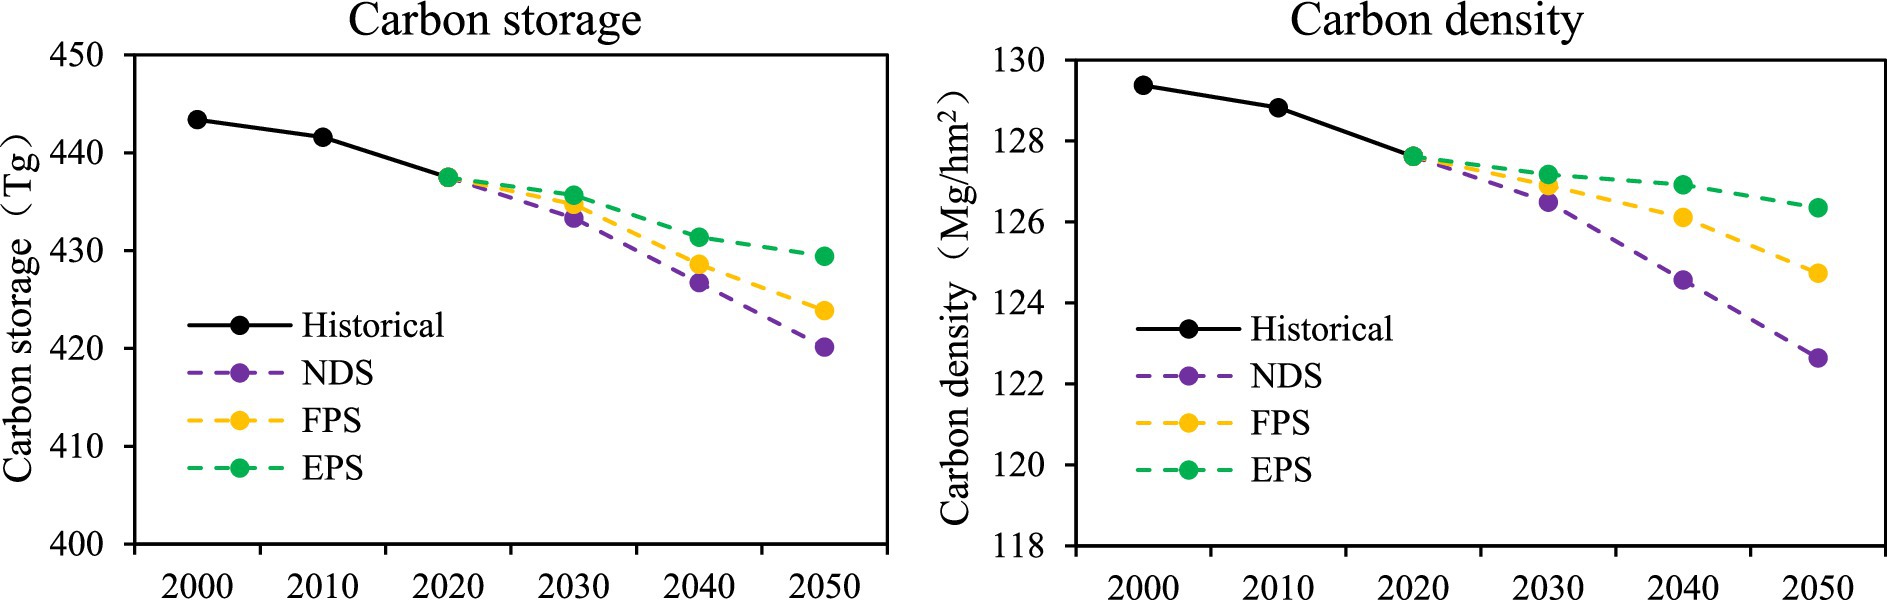
Figure 7. Changing storage and density of carbon in multiple scenarios in the island (2000–2050).
According to the carbon storage spatial distribution from 2020 to 2050 shown in Figure 8, the carbon storage of Hainan Island generally illustrates a distribution pattern of high in the low and middle around. Areas with high value are chiefly in the southern and central mountainous regions of the island. These areas are a concentrated distribution of tropical forests in Hainan, with high stand quality that favors carbon accumulation. The maximum carbon density can reach 169.01 Mg/hm2. Low-value areas are mainly found in lower-lying areas around the island, which mainly include cropland and built land due to human activities, especially distributed in major urban areas such as Haikou and Sanya. In terms of the variances in carbon storage (2020–2050), the island has the largest decreasing storage of carbon in the NDS scenario, following the FPS scenario, and the EPS scenario has the lowest reduction in carbon storage. Regions with rising carbon storage are chiefly distributed along the coast due to the impact of ecological restoration policies in degraded coastal zones.
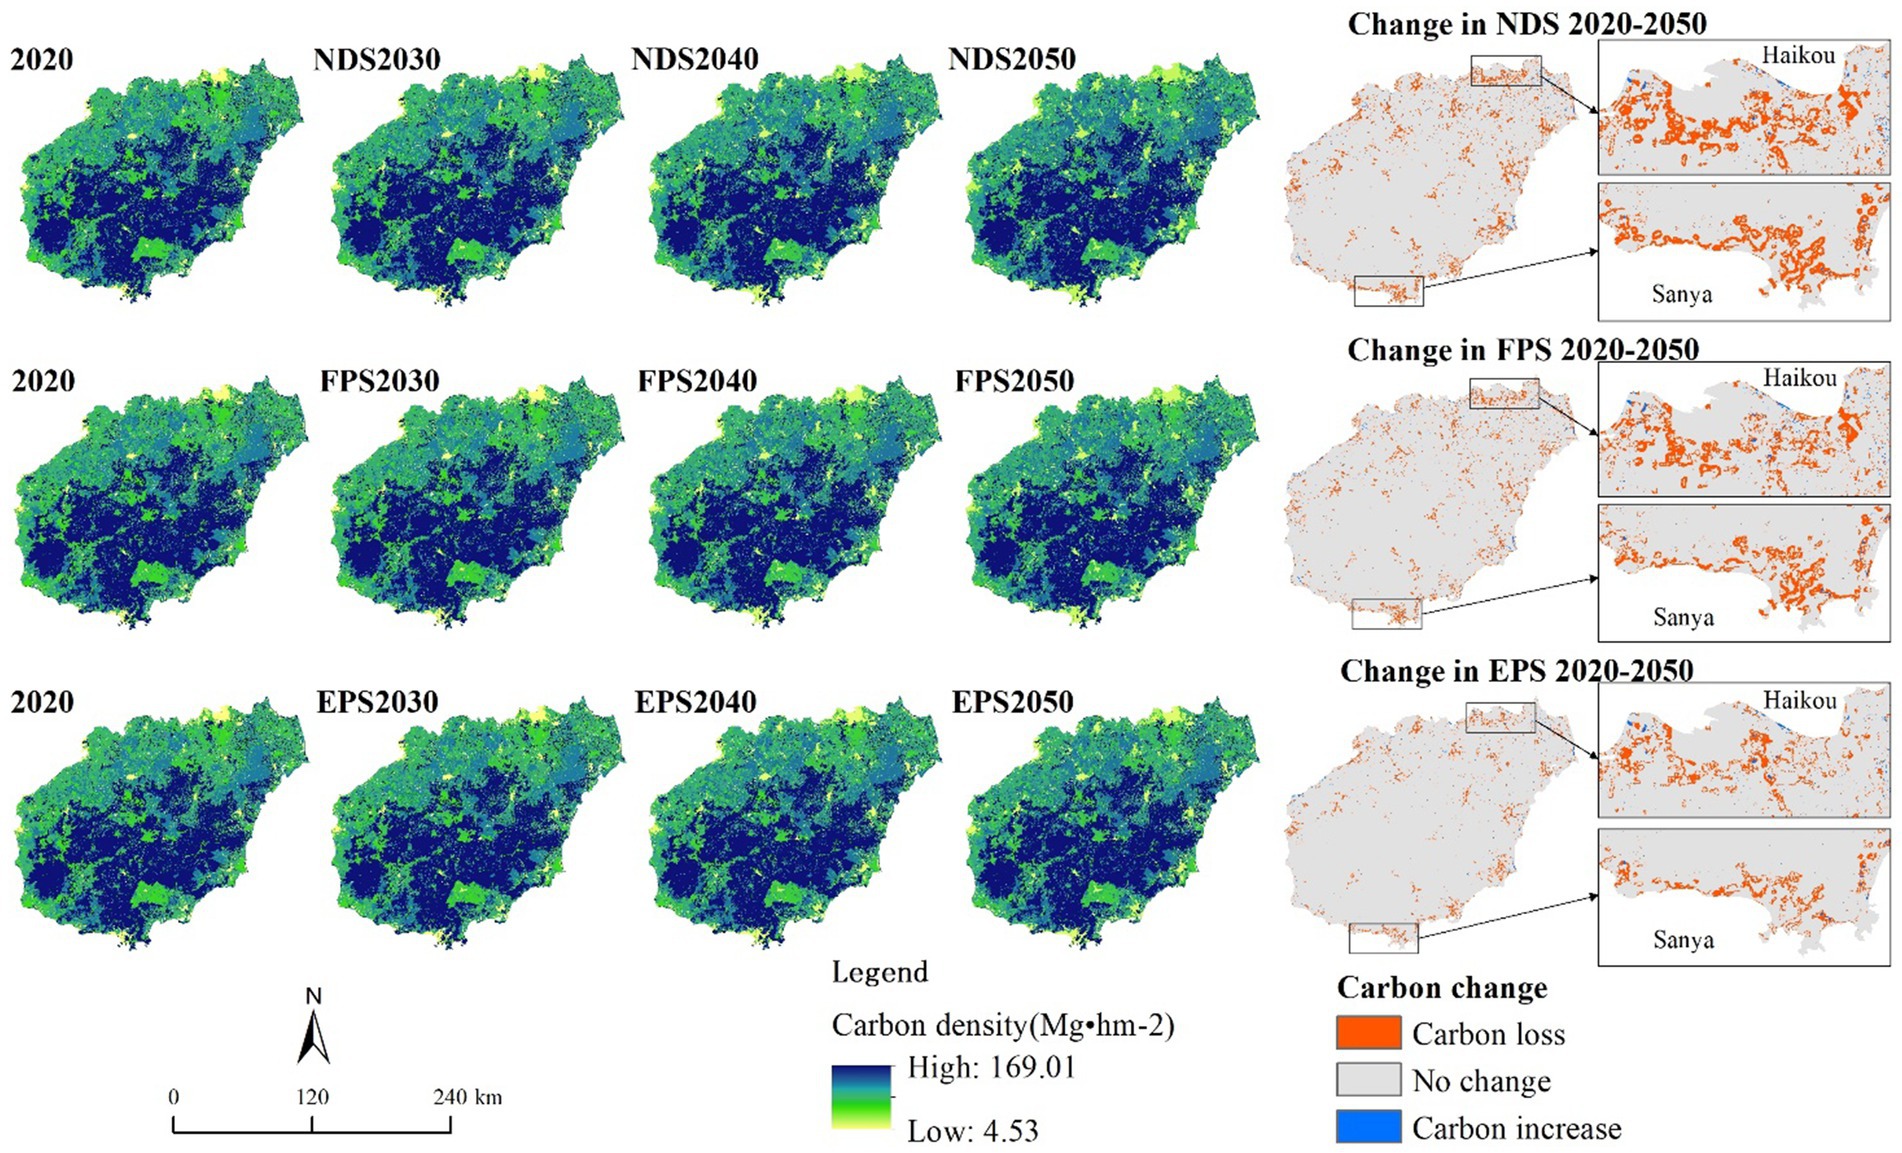
Figure 8. Carbon storage’s spatial variances in multiple scenarios in Hainan Island from 2020 to 2050.
According to the variances in carbon storage of various types of land use shown in Figure 9, over 70% of carbon storage in the island is distributed in forestland, which conforms to the overall carbon storage distribution between 2000 and 2020. However, such variances for each kind of land use in varying scenarios vary, and the overall tendency conforms to the area changes in the kind of land use of corresponding scenarios. Specifically, the carbon storage in cropland and forestland is significantly reduced from 2020 to 2050 in the NDS scenario, by 7.30 Tg and 17.01 Tg, respectively, while the built land’s carbon storage revealed a significant rise with 6.72 Tg. In the FPS scenario, carbon storage in cropland decreased by only 1.18 Tg, in forestland by 17.15 Tg, and in built land by 4.76 Tg. In the EPS scenario, by protecting natural ecological spaces, the carbon storage of forestland is reduced by only 3.69 Tg, that of cropland is reduced by 8.14 Tg, and that of built land is increased by 3.81 Tg. Carbon storage changes in grassland, water land and unused land are not obvious in the three mentioned scenarios.
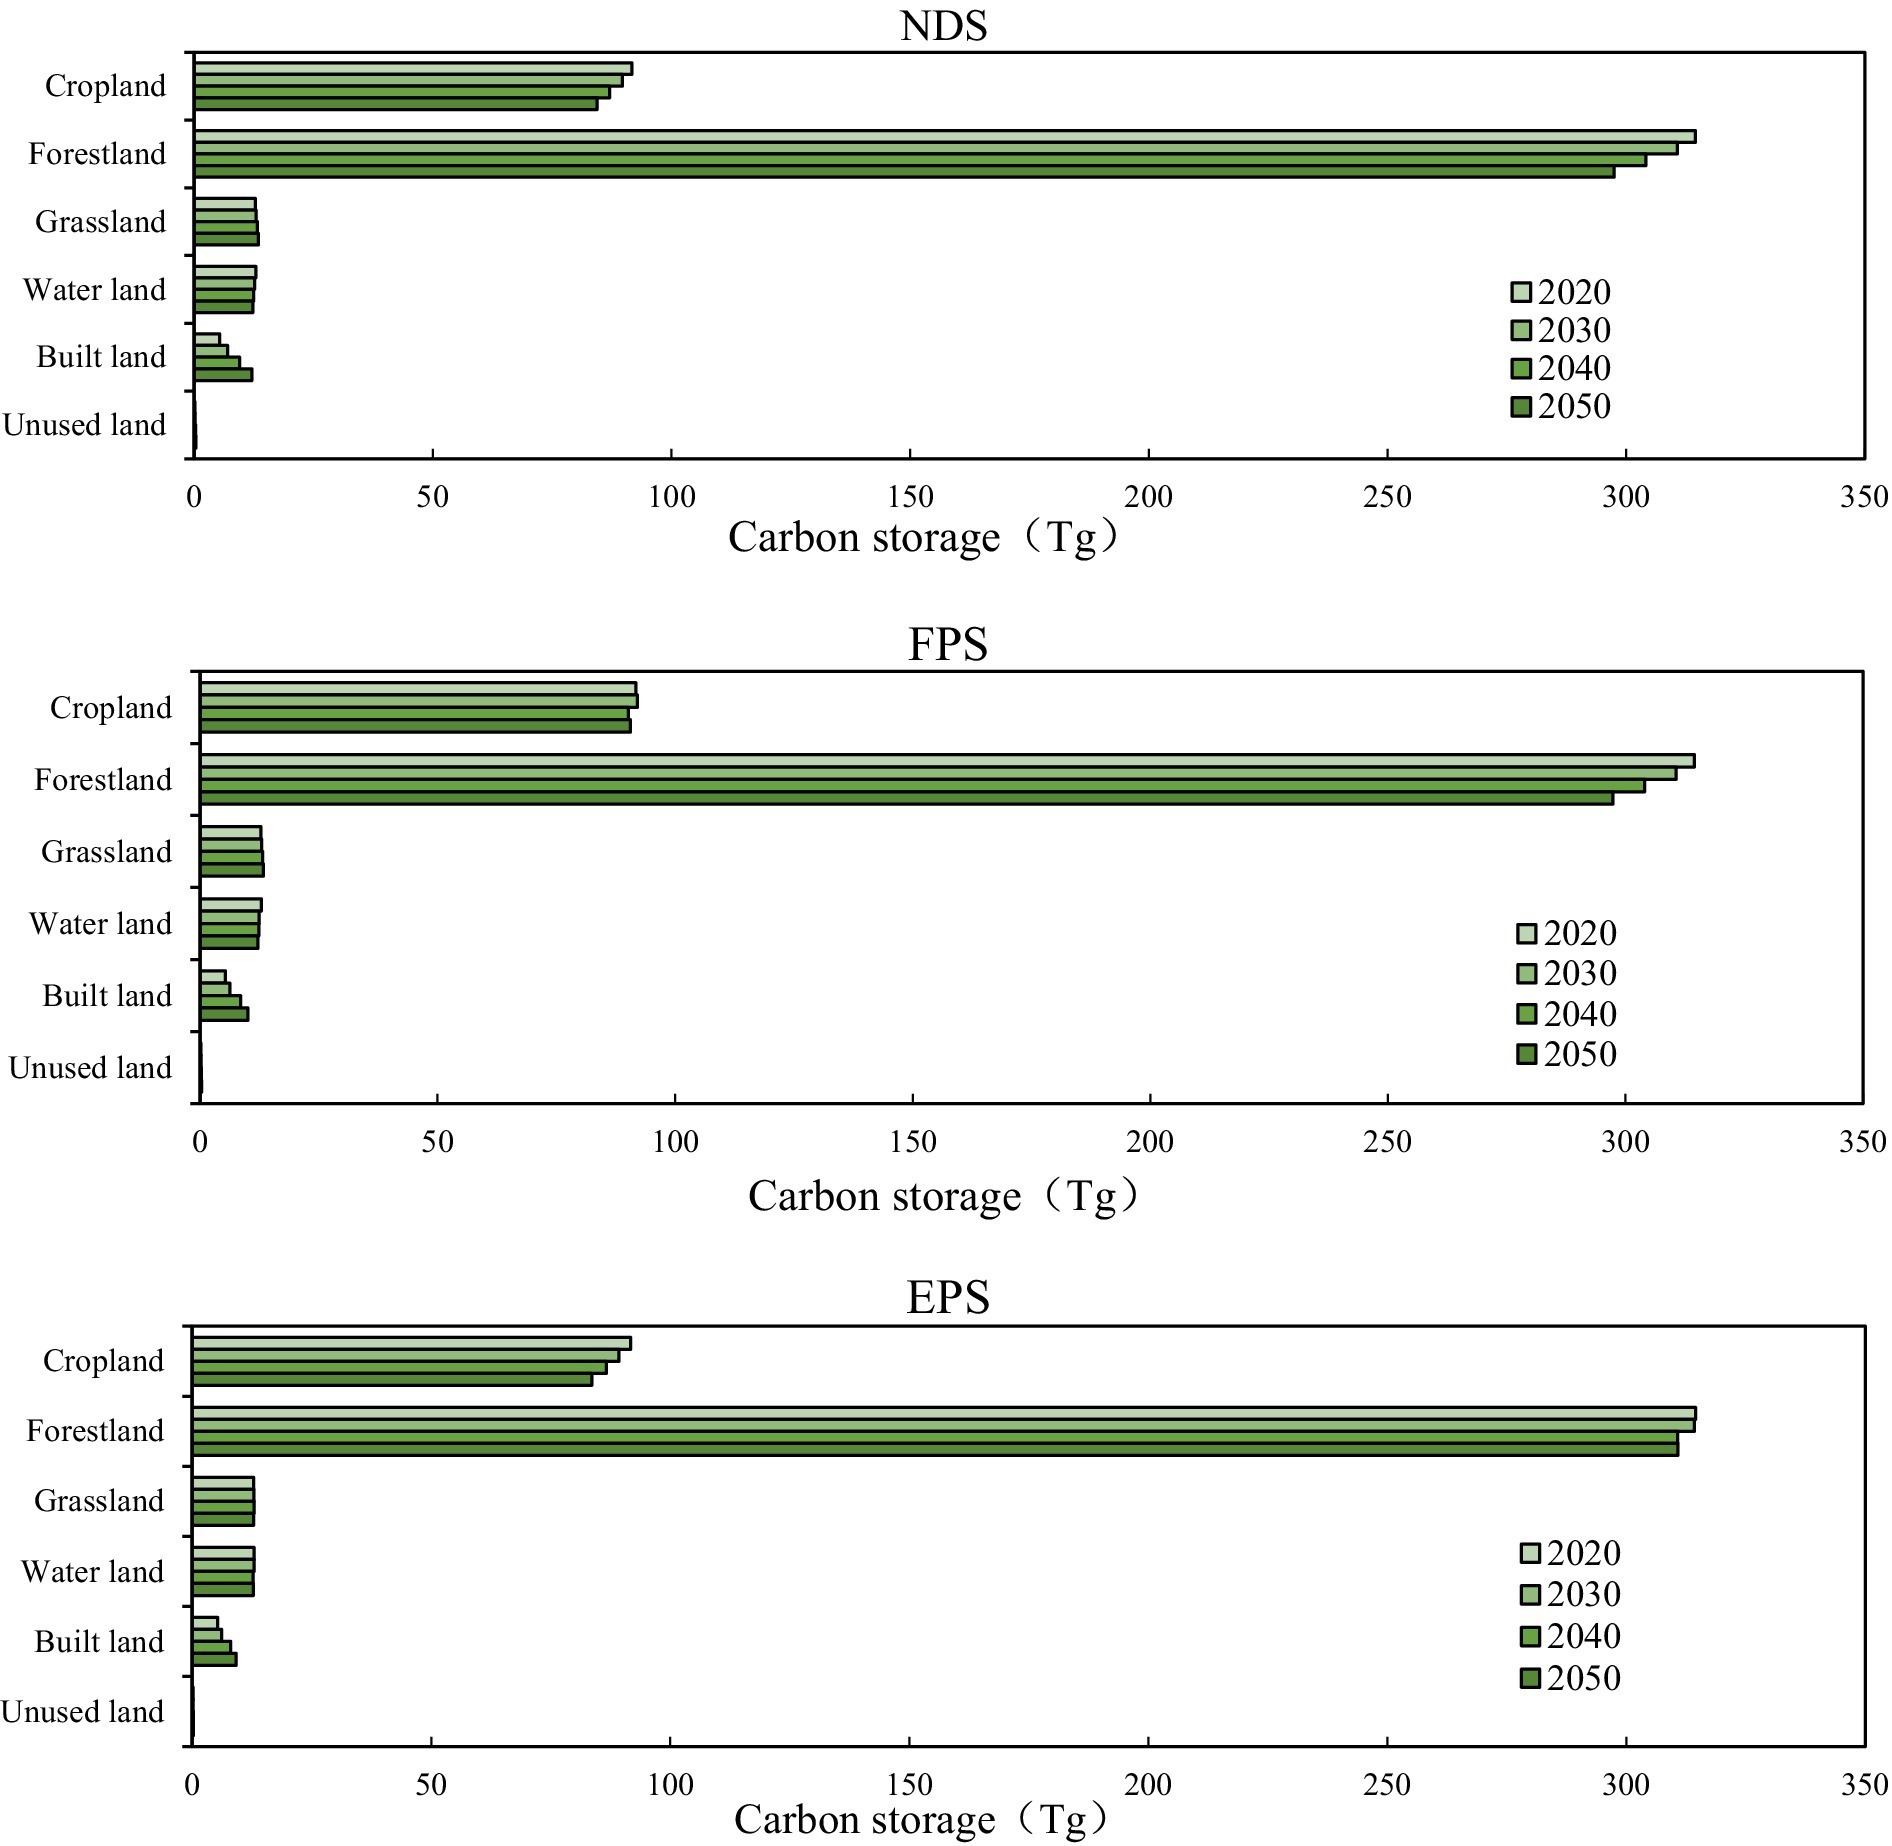
Figure 9. Temporal variances of storage of carbon in various types of land use (2020–2050).
Taking the statistics of carbon storage allocation in 2020 as an example, geo-detectors were utilized in this research to decide the effect degree of various elements on the carbon storage spatial distribution in Hainan Island. Table 6 shows that all the influencing factors affect how carbon storage is distributed spatially, and the explanatory power of each factor is in the following order: slope > land use intensity > DEM > NDVI > population density > soil type > GDP per capita > annual rainfall > annual temperature. All factors have passed the significance test, with p < 0.05. Among them, slope and land use intensity have an explanatory power of over 50%, which is the predominant element for the changing storage of carbon in Hainan Island. DEM, NDVI, population density, soil type, and per capita GDP are also important factors affecting carbon storage change, with the q values all above 0.2, indicating that the carbon storage’s spatial variance in the research region is jointly affected by natural and socio-economic elements. The influence of annual rainfall and temperature is relatively small, with the q values less than 0.2, indicating that meteorological differences impose a relatively small influence on the carbon storage distribution in Hainan Island.
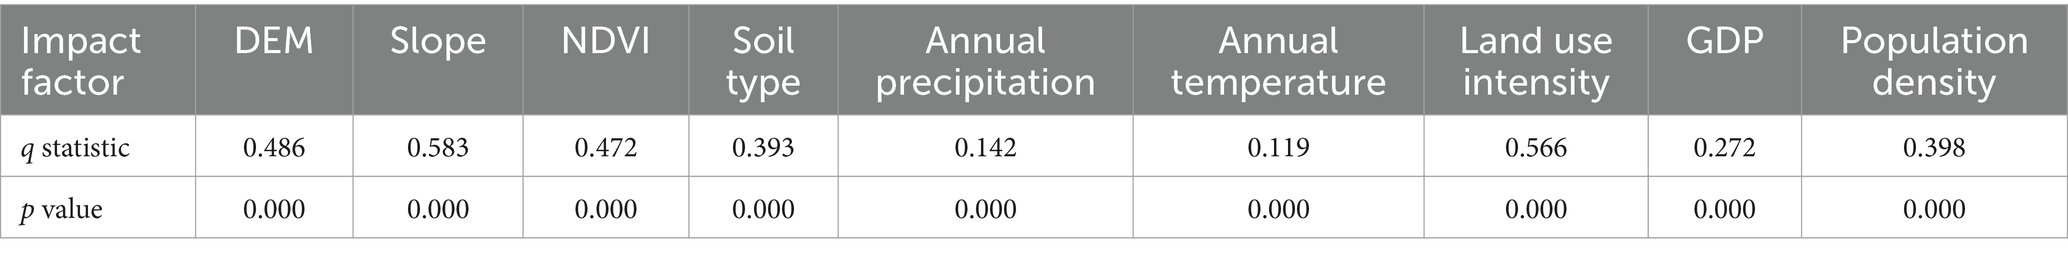
Table 6. Factor detection results.
According to the findings of interaction and ecological detections shown in Figure 10, it can be concluded that the connection between any two impact factors has a greater influence on the carbon storage spatial variance than that of a single factor. To be specific, the connection value between land use intensity and slope is the largest, with an explanatory power of more than 70%, which serves as the major cause for the carbon storage’s spatial differentiation in Hainan Island. The explanatory power of the connection between land use intensity, slope, and other elements on the spatial differentiation of carbon storage exceeds 60%, and the explanatory power of the connection between other elements is also above 40%. The interactive detection results are mainly dual-factor enhancement, with only the pairwise interaction between annual temperature, annual rainfall, and per capita GDP being nonlinear enhancement, and the q value is significantly increased. This indicates that various influencing factors under complex conditions will have a significant impact on Hainan’s carbon storage, especially when natural factors are affected by human activities, and the variance in the carbon storage function will be more significant.
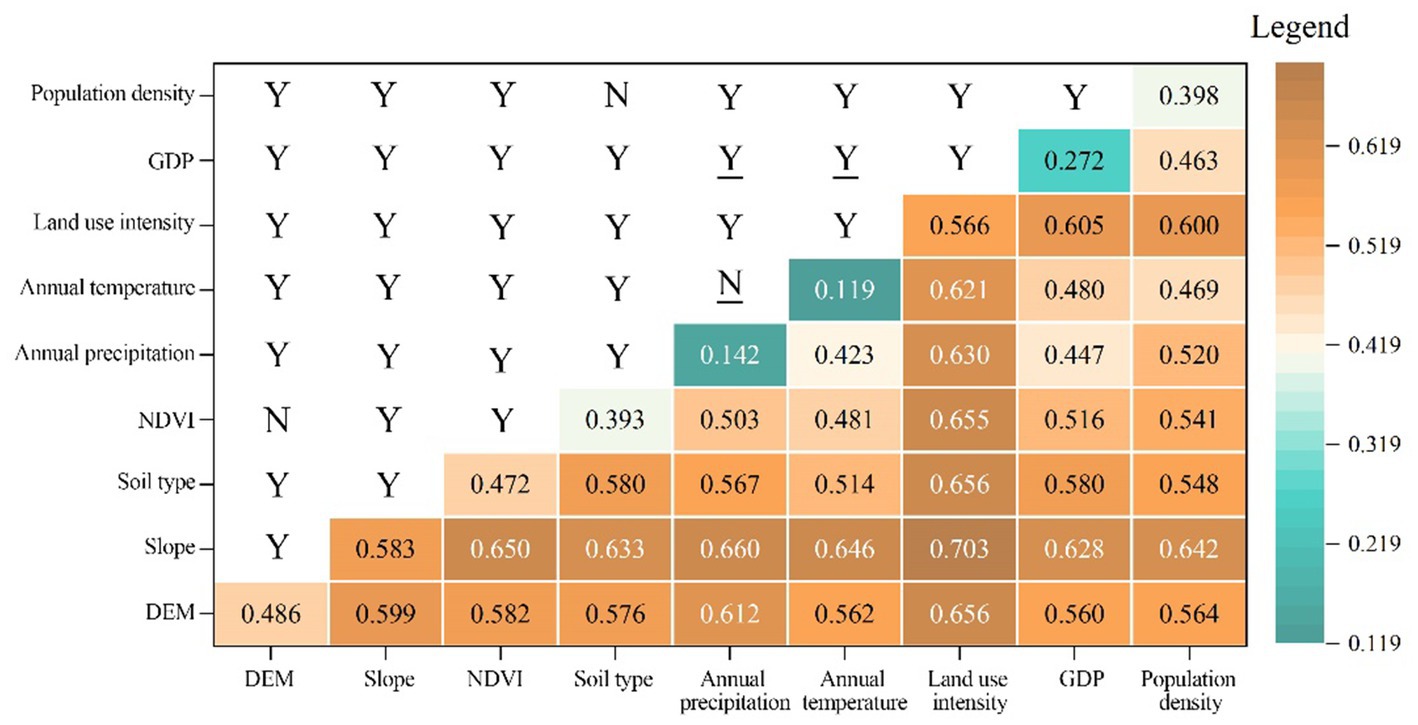
Figure 10. Interaction detection and ecological detection results. The underline indicates that the two factors’ interaction is nonlinear enhancement, while the rest is dual-factor enhancement; Y represents significant correlation, while N represents insignificant correlation.
The storage level and sequestration potential of carbon in the terrestrial ecosystem have always been a concern, which is crucial for identifying the carbon cycle mechanism and formulating emission reduction policies (Gao et al., 2023). This research adopted carbon density data and land use for Hainan Island between 2000 and 2020 to analyze the distribution characteristics of Hainan Island’s carbon storage. The results demonstrate that Hainan Island presented a downward tendency in both carbon storage and density over the two decades, falling by 5.90 Tg and 1.75 Mg/hm2. This indicates that the carbon storage capacity of Hainan Island has weakened during the period. It can be explained by the rapid social and economic development of Hainan Island from 2000 to 2020. Particularly, since the implementation of the Hainan International Tourism Island policy in 2010, land use has undergone drastic changes (Lei et al., 2020), leading to a large amount of cropland and forestland being converted into built land. The net increase in built land area was 605.49 km2, an increase of up to 77.05%. The development of built land has stripped off the surface soil, compacted the soil, and cleared vegetation in large green spaces, resulting in a significant decrease in above-ground carbon density and soil carbon density (Chen et al., 2013), leading a drop in carbon density and carbon storage across the island. This conforms to the findings from other scholars. Liang et al. (2021) evaluated the effect of land use change on storage of carbon in the Loess Plateau in China between 1995 and 2050, and found that the built land’s quick expansion and fluctuations in cropland made carbon storage fall. Xiang et al. (2022a) also found through their analysis of carbon storage change in the major urban region of Chongqing between 2000 and 2020 that the transfer of land use was mainly from cropland to built land, which increased the region of built land quickly, resulting in a fall of 5.78 Tg in carbon storage and 10.57 Mg/hm2 in carbon density in the major urban region of Chongqing. Liu Z. et al. (2022b) proposed that the changes in LUCC in Hainan Island from 1992 to 2019 resulted in a decrease of approximately 1.50 Tg in carbon storage, with the occupation of cropland by built land being the major cause for the fall in carbon storage.
This research found that the forestland’s carbon storage in the island was the highest from 2000 to 2020, which was 314.49–319.46 Tg, occupying over 70% of the total, indicating that the forestland carbon pool, as the largest one in the terrestrial ecosystem of Hainan Island, acts a crucial part in maintaining and stabilizing the carbon storage of the whole island. But it has accumulated a decrease of 4.97 Tg from 2000 to 2020, resulting in a dampening effect on the carbon storage function. The forestland carbon density on average in Hainan Island is 146.43 Mg/hm2, which is basically consistent with the values of 147.66 Mg/hm2 from Gao et al.’s study of carbon density of forest ecosystem in Hainan Island (2023), 163.70 Mg/hm2 from Ren et al.’s study of carbon density of forest ecosystem on the basis of continuous inventory data in Hainan Province (2014), and 149 ± 12 Mg/hm2 from Liu et al.’s study of carbon density of subtropical forest ecosystem (2018b). This indicates that the research findings on the forestland carbon storage and density in Hainan Island are reliable. In addition, there is significant room for improvement in the forestland carbon storage and density in Hainan. In 1994, commercial logging of ancient woodlands in Hainan was completely halted, and measures such as closing hillsides to facilitate afforestation were implemented, effectively protecting ancient woodlands resources. Moreover, with the comprehensive protection and systematic restoration of ancient forests in the National Park of Hainan Tropical Rainforest, the secondary forests, inefficient plantations, pulp and paper forests in the central mountainous areas of Hainan have been gradually restored to tropical ancient forests with rich species and diverse levels. Some studies have shown that high tree species richness can increase the carbon stock of tropical forest ecosystems (Kothandaraman et al., 2020), and each additional tree species will increase the carbon stock by 6.4% (Liu X. J. et al., 2018). In addition, research shows that the sink-increasing effect of afforestation will change regularly as the forest age increases. The increase in forest age between 2000 and 2040 will lead to an increase in China’s forest vegetation carbon stocks by 6.69 Pg C (Yao et al., 2018). Therefore, by altering the structure of a single tree species, future forest management can move toward near-natural afforestation with multiple tree species and stable forest ages. It is recommended to actively cultivate and use top-notch local tree species that can maintain carbon sequestration and further optimize forest structure, appropriately update the forest age structure, and optimize the spatial and temporal distribution of forest age and stand structure (Piao et al., 2022), which will precisely enhance forest quality, steadily increase carbon sequestration and sink potential, and maximize the potential offsetting capacity of forest ecosystems to achieve carbon neutrality.
The CA-Markov and the InVEST models in this study are to assess the influence of land use change imposed on storage of carbon in Hainan Island in three future scenarios of NDS, FPS, and EPS from 2030 to 2050. In the NDS scenario, Hainan Island will have the greatest rise in built land area from 2030 to 2050, with a rise of 1885.98 km2 in total over 30 years. Since the area of cropland and forestland will shrink, a substantial types of land use featuring with high carbon density, such as cropland and forestland, will shift to built land with low carbon density. Compared to 2020, the storage of carbon in 2050 would fall by 17.36 Tg, the lowest among the three simulated scenarios. This result conforms to the other scholars’ conclusions. Jiang et al. (2017) investigated the influences of urban growth on storage of carbon in the Changsha-Zhuzhou-Xiangtan city group, and discovered that the conversion of cropland and forestland to built land was the primary cause of the largest storage loss of carbon in the NDS scenario from 2014 to 2023. Zhu et al. (2019) studied storage of carbon of the Qihe River Basin in the Taihang Mountains in China in different scenarios and found that the carbon storage and density decreased significantly in the NDS scenario, mainly because the cropland area continued to decrease and the built land continued to expand.
Since Chinese government has always emphasized the significance of food security, the method of controlling the total amount of basic farmland is adopted in the FPS scenario, which is in line with the development goals proposed in the “Territorial Spatial Planning of Hainan Province. Of the three simulation scenarios, the FPS scenario has the lowest reduction in cropland area of only 112.52 km2. The food security of the whole province is effectively safeguarded, with carbon storage reduced by 13.61 Tg and cropland carbon storage reduced by only 1.18 Tg. In the EPS scenario, restrictions will be imposed on the arbitrary conversion of natural ecological land across the province, in line with the ecological environment protection goals proposed for constructing the Hainan Free Trade Port and the National Ecological Civilization Pilot Zone. The EPS scenario has the lowest reduction in forestland and water land, and the least rise in built land. In this scenario, the entire storage of carbon of the island is 429.41 Tg in 2050, which is the highest among the three simulated scenarios, with only a decrease of 8.06 Tg. Among them, the carbon storage of forestland only decreased by 3.69 Tg, and that of cropland decreased by 8.14 Tg, while that of built land increased by 3.81 Tg. This indicates that in this scenario, the protection and restriction of ecological lands like forests, grasslands, and water bodies have effectively curbed the risk of carbon storage reduction in Hainan Island, which is conducive to maintaining ecosystem service functions (Lei et al., 2020). Hoque et al. (2021) found the dynamic changes in artificial development of forest and ecosystem carbon storage through their study of storage of carbon in the coastal areas of Bangladesh in the three simulated land management scenarios. With improved ecological protection and forest management, future carbon storage in coastal Bangladesh will rise slightly, mainly due to the increase in artificial forest areas, which promotes increased regional carbon storage. Oppositely, if ecological protection is not accounted in the future, carbon storage will significantly decrease in the process of high urbanization. These findings are also reflected in other scholars’ researches. Xiang et al. (2022a) found in their study of carbon storage changes in the major urban region of Chongqing in 2035 that in the highly urbanized scenario, carbon storage decreased by 5.25 Tg overall, which is significantly higher than the natural trend scenario where carbon storage decreased by 3.37 Tg. This suggests that urbanization and growing built land have a crucial impact on reducing carbon storage.
In 2022, Hainan proposed to develop a new urbanization model for the island, adhering to coordinated planning, construction and management of the entire island as a major metropolis and picturesque area. By examining the influence of changing land use imposed on storage of carbon in Hainan in three scenarios: NDS, FPS and EPS from 2030 to 2050, this study reveals how land use spatial control affects the quantification of regional development and environmental protection. And, simulations of future carbon storage changes depending on multiple land use scenarios give a reference for planning regional land use.
Relevant research shows that the carbon storage’s spatial distribution in terrestrial ecosystems is the result of the comprehensive effect of natural and human factors like topography, vegetation type, climate conditions, etc. (Hofhansl et al., 2020; Kothandaraman et al., 2020; Han et al., 2023). Regarding carbon storage’s spatial distribution, Hainan Island generally exhibits a pattern of high carbon storages in the middle and low carbon storages in the surrounding areas, which highly conforms to the topographic distribution characteristics of the whole island. Mainly, areas with high value are distributed in the Tropical Rainforest National Park located in Hainan’s central mountainous areas, dominated by tropical virgin wildwood featuring high stand quality and strong carbon reserves. Areas with low value are mainly distributed in surrounding areas with lower elevations, primarily encompassing cropland and built land, especially in urban areas such as Haikou and Sanya cities, where the carbon storage is relatively low. As for mountainous areas, Xiang et al. (2022a) found that the low-carbon storage areas in the main urban area of Chongqing are mainly concentrated in Yuzhong District, which is mainly focused on construction land and has a fast urbanization process; High carbon storage areas are mainly distributed in mountainous systems dominated by forests, with strong carbon storage, reflecting the impact of terrain, landforms, and land use intensity on the distribution pattern of regional carbon storage. The analytical outcomes of this research using geo-detectors reveal that factors such as land use intensity, slope, and DEM are the major drivers of spatial differentiation of carbon storage in the island, which conforms to the conclusions of the above analysis. Other influencing factors include NDVI, population density, soil type, GDP, etc. According to Han et al. (2023), the spatial variance of carbon storage is mainly affected by annual average NDVI, human activity intensity and other factors through geographical detectors. Pereira et al. (2015) also found that soil type is the driving factor affecting the carbon storage spatial allocation. Moreover, the influence of annual rainfall and temperature is relatively small, indicating that differences in meteorological factors have a minor impact on Hainan’s carbon storage. This conclusion is consistent with Wang C. W. et al. (2023), who argued that climate factors such as annual temperature and precipitation on average are not the predominant factors for the spatial variance of carbon storages in the Taihang Mountains. Wang C. W. et al. (2023) discovered that NDVI and soil type had a significantly larger impact than other elements on the carbon storage spatial variance. The results of the interaction detection demonstrate that the influence of any two factors exceeds that of a single factor, and the synergistic enhancement effect formed by the complicated coupling of different driving factors together influences the spatial differentiation of storage of carbon in Hainan Island (Xiang M. et al., 2022; Han et al., 2023). The interaction of DEM, slope, and land use intensity with other factors has a generally higher explanatory power, implying that the synergistic effect of regional topography and land use intensity with other factors is the major element to affect the spatial differentiation of Hainan’s carbon storage.
This study combines the CA-Markov and InVEST models to analyze the changes in carbon storage and its reaction to land use changes in Hainan from 2000 to 2020. Changes concerning land use and carbon storage in Hainan Island were predicted in three different scenarios from 2030 to 2050 in this study. Geo-detectors were also used to explore the influencing factors and driving mechanisms of the carbon storage’s spatial allocation in Hainan. From 2000 to 2020, Hainan’s carbon storage and density have shown a downward trend over the two decades, with a decrease of 5.90 Tg in carbon storage and 1.75 Mg/hm2 in carbon density. Compared with 2020, the carbon storage of Hainan Island in 2050 decreased by 17.36 Tg in Natural Development Scenario (NDS), 13.61 Tg in Farmland Protection Scenario (FPS), and 8.06 Tg in Ecological Protection Scenario (EPS), indicating a lowest carbon storage level of NDS and a highest one of EPS. With respect to spatial allocation, the carbon storage of Hainan Island generally illustrates a distribution pattern of high in the low and middle around. Areas with high value are chiefly found in the southern and central mountainous regions of the island. Areas with low value are chiefly found in lower-lying areas around the island. Geo-detector analysis shows that slope, land use intensity, and DEM are the main impact factors for such a spatial difference, and its interaction with other factors shows a general reinforcement, revealing that the synergistic impact of terrain and land use intensity with other factors is the major cause of the spatial change in Hainan’s carbon storage.
In summary, under the strategic framework of the “carbon peaking and carbon neutrality” goals and the national ecological civilization pilot zone, when optimizing future land use structure and formulating land use policies on Hainan Island, FPS and EPS should be taken into consideration comprehensively. We recommend proper control of expanding built land in low-altitude regions around Hainan Island, stronger protection of high-quality cropland, and systematic ecological restoration projects in high-altitude areas, especially within the Hainan Tropical Rainforest National Park. In addition, by restoring the integrity and authenticity of tropical rainforest ecosystems, stabilizing and improving carbon storage capacity, ecological security and the amount of cropland can be effectively ensured, thus providing important support for achieving green, low-carbon, and sustainable development in Hainan.
The raw data supporting the conclusions of this article will be made available by the authors, without undue reservation.
JL: Writing – original draft, Visualization, Methodology, Investigation, Funding acquisition, Formal analysis. LZ: Writing – review & editing, Visualization, Software, Investigation. ZC: Writing – review & editing, Validation, Project administration, Funding acquisition. TW: Writing – review & editing, Validation, Software. XC: Writing – review & editing, Investigation. YL: Writing – review & editing, Visualization, Validation, Investigation.
The author(s) declare financial support was received for the research, authorship, and/or publication of this article. This research was supported by Hainan Provincial Natural Science Foundation of China (423RC551) and the National Natural Science Foundation of China (32260106).
We would like to thank KetengEdit (www.ketengedit.com) for its linguistic assistance during the preparation of this manuscripts.
The authors declare that the research was conducted in the absence of any commercial or financial relationships that could be construed as a potential conflict of interest.
The reviewer WG declared a shared affiliation, with one of the authors LZ to the handling editor at the time of the review.
All claims expressed in this article are solely those of the authors and do not necessarily represent those of their affiliated organizations, or those of the publisher, the editors and the reviewers. Any product that may be evaluated in this article, or claim that may be made by its manufacturer, is not guaranteed or endorsed by the publisher.
Aburas, M. M., Ho, Y. M., Ramli, M. F., and Ash’aari, Z. H. (2017). Improving the capability of an integrated CA-Markov model to simulate spatio-temporal urban growth trends using an analytical hierarchy process and frequency ratio. Int. J. Appl. Earth Obs. Geoinf. 59, 65–78. doi: 10.1016/j.jag.2017.03.006
Alam, S. A., Starr, M., and Clark, B. J. F. (2013). Tree biomass and soil organic carbon densities across the Sudanese woodland savannah: a regional carbon sequestration study. J. Arid Environ. 89, 67–76. doi: 10.1016/j.jaridenv.2012.10.002
Babbar, D., Areendran, G., Sahana, M., Sarma, K., Raj, K., and Sivadas, A. (2021). Assessment and prediction of carbon sequestration using Markov chain and InVEST model in Sariska Tiger Reserve, India. J. Clean. Prod. 278:123333. doi: 10.1016/j.jclepro.2020.123333
Chen, Y., Day, S. D., Wick, A. F., Strahm, B. D., Wiseman, P. E., and Daniels, W. L. (2013). Changes in soil carbon pools and microbial biomass from urban land development and subsequent post-development soil rehabilitation. Soil Biol. Biochem. 66, 38–44. doi: 10.1016/j.soilbio.2013.06.022
Chen, G., Yang, Y., Xie, J., Du, Z., and Zhang, J. (2007). The allocation of underground carbon in China’s forests. Acta Ecol. Sin. 27, 5148–5157.
Clerici, N., Cote-Navarro, F., Escobedo, F. J., Rubiano, K., and Camilo Villegas, J. (2019). Spatio-temporal and cumulative effects of land use-land cover and climate change on two ecosystem services in the Colombian Andes. Sci. Total Environ. 685, 1181–1192. doi: 10.1016/j.scitotenv.2019.06.275
Deng, Y., Jiang, W., Wu, Z., Peng, K., Ling, Z., Li, Z., et al. (2022). Assessing and characterizing carbon storage in wetlands of the Guangdong–Hong Kong–Macau Greater Bay Area, China, during 1995–2020. IEEE J. Sel. Top Appl. Earth Observ. Remote Sens 15, 6110–6120. doi: 10.1109/JSTARS.2022.3192267
Friedlingstein, P., O’Sullivan, M., Jones, M. W., Andrew, R. M., Hauck, J., Olsen, A., et al. (2020). Global carbon budget 2020. Earth Syst. Sci. Data 12, 3269–3340. doi: 10.5194/essd-12-3269-2020
Gao, S. C., Chen, Y. Q., Chen, Z. Z., Lei, J. R., and Wu, T. T. (2023). Carbon storage and its spatial distribution characteristics of forest ecosystems in Hainan Island, China. Acta Ecol. Sin. 43, 3558–3570. doi: 10.5846/stxb202207051909
Grassi, G., House, J., Dentener, F., Federici, S., den Elzen, M., and Penman, J. (2017). The key role of forests in meeting climate targets requires science for credible mitigation. Nat. Clim. Chang. 7, 220–226. doi: 10.1038/nclimate3227
Han, Y., Ding, S. T., and Yang, T. B. (2023). Spatial and temporal distribution and driving factors of carbon storage in Zhongtiao Mountain ecosystem in southern Shanxi province. China Environ. Sci. 43, 1–9. doi: 10.19674/j.cnki.issn1000-6923.20220915.015
He, C., Zhang, D., Huang, Q., and Zhao, Y. (2016). Assessing the potential impacts of urban expansion on regional carbon storage by linking the LUSD-urban and InVEST models[J]. Environ. Model. Softw. 75, 44–58. doi: 10.1016/j.envsoft.2015.09.015
Hofhansl, F., Chacón-Madrigal, E., Fuchslueger, L., Jenking, D., Morera-Beita, A., Plutzar, C., et al. (2020). Climatic and edaphic controls over tropical forest diversity and vegetation carbon storage. Sci. Rep. 10:5066. doi: 10.1038/s41598-020-61868-5
Hoque, M. Z., Cui, S., Islam, I., Xu, L., and Ding, S. (2021). Dynamics of plantation forest development and ecosystem carbon storage change in coastal Bangladesh. Ecol. Indic. 130:107954. doi: 10.1016/j.ecolind.2021.107954
Houghton, R. A., and Nassikas, A. A. (2017). Global and regional fluxes of carbon from land use and land cover change 1850–2015. Global Biogeochem. Cycles 31, 456–472. doi: 10.1002/2016GB005546
Hu, B. S., and Zhang, H. Y. (2018). Simulation of land- use change in Poyang Lake region based on CA- Markov mode. Resour. Environ. 27, 1207–1219. doi: 10.11870/cjlyzyyhj201806004
IPCC (2014). Climate change 2013 – the physical science basis working group I contribution to the fifth assessment report of the intergovernmental panel on climate change. Cambridge: Cambridge University Press.
Ito, A., Nishina, K., and Noda, H. M. (2016). Impacts of future climate change on the carbon budget of northern high-latitude terrestrial ecosystems: an analysis using ISI-MIP data. Pol. Sci. 10, 346–355. doi: 10.1016/j.polar.2015.11.002
Jiang, W., Deng, Y., Tang, Z., Lei, X., and Chen, Z. (2017). Modelling the potential impacts of urban ecosystem changes on carbon storage under different scenarios by linking the CLUE-S and the InVEST models. Ecol. Model. 345, 30–40. doi: 10.1016/j.ecolmodel.2016.12.002
Kothandaraman, S., Dar, J. A., Sundarapandian, S., Dayanandan, S., and Khan, M. L. (2020). Ecosystem-level carbon storage and its links to diversity, structural and environmental drivers in tropical forests of Western Ghats, India. Sci. Rep. 10:13444. doi: 10.1038/s41598-020-70313-6
Lei, J. R., Chen, Z. Z., Chen, X. H., Li, Y. L., and Wu, T. T. (2020). Spatio-temporal changes of land use and ecosystem services value in Hainan Island from 1980 to 2018. Acta Ecol. Sin. 40, 4760–4773. doi: 10.5846/stxb201907261580
Lei, J. R., Chen, Y. Q., Li, L. M., Chen, Z. Z., Chen, X. H., Wu, T. T., et al. (2022). Spatiotemporal change of habitat quality in Hainan Island of China based on changes in land use. Ecol. Indic. 145:109707. doi: 10.1016/j.ecolind.2022.109707
Lei, J. R., Zhang, L., Wu, T. T., Chen, X. H., Li, Y. L., and Chen, Z. Z. (2023). Spatial-temporal evolution and driving factors of water yield in three major drainage basins of Hainan Island based on land use change. Front. For. Glob. Change. 6:1131264. doi: 10.3389/ffgc.2023.1131264
Li, S. C., Gong, J., Yang, J. X., Chen, G., Zhang, Z., and Zhang, M. (2023). Characteristics of LUCC patterns of the Lanzhou-Xining urban agglomeration: based on an intensity analysis framework. Resour. Sci. 45, 480–493. doi: 10.18402/resci.2023.03.02
Li, L., Song, Y., Wei, X., and Dong, J. (2020). Exploring the impacts of urban growth on carbon storage under integrated spatial regulation: a case study of Wuhan, China. Ecol. Indic. 111:106064. doi: 10.1016/j.ecolind.2020.106064
Li, X., Yeh, A., Liu, X., and Yang, Q. (2007). Geographical simulation systems: Cellular automata and multi-agent system. Beijing: Science Press.
Liang, Y., Hashimoto, S., and Liu, L. (2021). Integrated assessment of land-use/land-cover dynamics on carbon storage services in the loess plateau of China from 1995 to 2050. Ecol. Indic. 120:106939. doi: 10.1016/j.ecolind.2020.106939
Liu, X., Li, X., Liang, X., Shi, H., and Ou, J. (2019). Simulating the change of terrestrial carbon storage in China based on the FLUS-InVEST model. Trop. Geogr. 39, 397–409. doi: 10.13284/j.cnki.rddl.003138
Liu, J., Ning, J., Kuang, W., Xu, X., Zhang, S., Yan, C., et al. (2018). Spatio-temporal patterns and characteristics of land-use change in China during 2010-2015. J. Geogr. Sci. 28, 547–562. doi: 10.1007/s11442-018-1490-0
Liu, X. J., Trogisch, S., He, J. S., Niklaus, P. A., Bruelheide, H., Tang, Z. Y., et al. (2018). Tree species richness increases ecosystem carbon storage in subtropical forests. Proc. Royal Soc. B. 285:20181240. doi: 10.1098/rspb.2018.1240
Liu, Q., Yang, D., Cao, L., and Anderson, B. (2022). Assessment and prediction of carbon storage based on land use/land cover dynamics in the tropics: a case study of Hainan island. China. Land 11:244. doi: 10.3390/land11020244
Liu, Q., Yang, Z. Y., Chen, Y. Q., Lei, J. R., Chen, Z. Z., and Chen, X. H. (2021). Multi-scenario simulation of land use change and its eco-environmental effect in Hainan Island based on CA-Markov model. Ecol. Environ. 30:1522. doi: 10.16258/j.cnki.1674-5906.2021.07.021
Liu, Y., Zhang, J., Zhou, D., Ma, J., Dang, R., Ma, J., et al. (2021). Temporal and spatial variation of carbon storage in the Shule River basin based on InVEST model. Acta Ecol. Sin. 41, 4052–4065. doi: 10.5846/stxb201911152452
Liu, Z., Zhu, D., He, G., Wang, H., Zhang, X., Lin, J., et al. (2022). Challenges and opportunities for carbon neutrality in China. Nat. Rev. Earth Environ. 3, 141–155. doi: 10.1038/s43017-021-00244-x
Men, D., and Pan, J. (2023). Ecological network identification and connectivity robustness evaluation in the Yellow River Basin under a multi-scenario simulation. Ecol. Model. 482:110384. doi: 10.1016/j.ecolmodel.2023.110384
Pan, Y., Yu, D. S., Wang, X. H., Xu, Z. Q., and Wang, X. Y. (2018). Prediction of land use landscape pattern based on CA-Markov model. Soil 50, 391–397. doi: 10.13758/j.cnki.tr.2018.02.024
Pereira, O. J. R., Montes, C. R., Lucas, Y., Santin, R. C., and Melfi, A. J. (2015). A multi-sensor approach for mapping plant-derived carbon storage in Amazonian podzols. Int. J. Remote Sens. 36, 2076–2092. doi: 10.1080/01431161.2015.1034896
Piao, S., Fang, J., Ciais, P., Peylin, P., Huang, Y., Sitch, S., et al. (2009). The carbon balance of terrestrial ecosystems in China. Nature 458, 1009–1013. doi: 10.1038/nature07944
Piao, S., He, Y., Wang, X., and Chen, F. (2022). Estimation of China’s terrestrial ecosystem carbon sink: methods, progress and prospects. Sci. China Earth Sci. 65, 641–651. doi: 10.1007/s11430-021-9892-6
Ren, H., Li, L., Liu, Q., Wang, X., Li, Y., Hui, D., et al. (2014). Spatial and temporal patterns of carbon storage in forest ecosystems on Hainan island, southern China. PLoS One 9:e108163. doi: 10.1371/journal.pone.0108163
Song, Y., Wang, J., Ge, Y., and Xu, C. (2020). An optimal parameters-based geographical detector model enhances geographic characteristics of explanatory variables for spatial heterogeneity analysis: cases with different types of spatial data. GIsci Remote Sens 57, 593–610. doi: 10.1080/15481603.2020.1760434
Sun, T., Ma, Z., Huang, Z., Wang, Z., Chen, S., Xiao, Y., et al. (2023). Coastal ecosystem restoration strategy based on carbon storage change: a case study of the southeast coastal zone of Hainan Island. Trop. Geogr. 43, 443–458. doi: 10.13284/j.cnki.rddl.003643
Tallis, H., Icketts, T., and Guerry, A.. (2013). InVEST User’s guide: Integrated valuation of environmental services and tradeoffs. Stanford: The Natural Capital Project.
Tang, X., Zhao, X., Bai, Y., Tang, Z., Wang, W., Zhao, Y., et al. (2018). Carbon pools in China’s terrestrial ecosystems: new estimates based on an intensive field survey. PNAS 115, 4021–4026. doi: 10.1073/pnas.1700291115
Wang, C., Luo, J., Qing, F., Tang, Y., and Wang, Y. (2022). Analysis of the driving force of spatial and temporal differentiation of carbon storage in Taihang Mountains based on InVEST model. Appl. Sci. 12:10662. doi: 10.3390/app122010662
Wang, C. W., Luo, J. J., and Tang, H. H. (2023). Analysis on the driving force of spatial and temporal differentiation of carbon storage in the Taihang Mountains based on InVEST model. Ecol. Environ. 32, 215–225. doi: 10.16258/j.cnki.1674-5906.2023.02.001
Wang, G., Sun, T., Zan, G., Wang, B., and Kong, X. (2021). Roles and suggestions of terrestrial ecosystem carbon sink in achieving carbon emission peak and carbon neutrality in China. Geol. Sur. China. 8, 13–19. doi: 10.19388/j.zgdzdc.2021.04.02
Wang, J. F., and Xu, C. (2017). Geodetector: principle and prospective. Acta Geograph. Sin. 72, 116–134. doi: 10.11821/dlxb201701010
Wang, P. J., Zhang, J. H., Ma, J. X., Guo, L. J., Yang, L. J., Ma, X. B., et al. (2023). What impacts ecosystem services in tropical coastal tourism cities? A comparative case study of Haikou and Sanya, China. J. Environ. Manag. 342:118227. doi: 10.1016/j.jenvman.2023.118227
Wiesmeier, M., von Lützow, M., Spörlein, P., Geuß, U., Hangen, E., Reischl, A., et al. (2015). Land use effects on organic carbon storage in soils of Bavaria: the importance of soil types. Soil Tillage Res. 146, 296–302. doi: 10.1016/j.still.2014.10.003
Xiang, S. J., Wang, Y., Deng, H., Yang, C. M., Wang, Z. F., and Gao, M. (2022a). Response and multi-scenario prediction of carbon storage to land use/cover change in the main urban area of Chongqing, China. Ecol. Indic. 142:109205. doi: 10.1016/j.ecolind.2022.109205
Xiang, M., Wang, C., Tan, Y., Yang, J., Duan, L., Fang, Y., et al. (2022). Spatio-temporal evolution and driving factors of carbon storage in the Western Sichuan plateau. Sci. Rep. 12:8114. doi: 10.1038/s41598-022-12175-8
Xiang, S. J., Zhang, Q., Wang, D., Wang, S., Wang, Z. F., Xie, Y. Q., et al. (2022b). Response and vulnerability analysis of carbon storage to LUCC in the main urban area of Chongqing during 2000-2020. J. Nat. Resour. 37, 1198–1213. doi: 10.31497/zrzyxb.20220507
Xu, L., He, N. P., and Yu, G. R. (2018a). Data from: A dataset of carbon density of China’s terrestrial ecosystem in 2010s. Science Data Bank. doi: 10.11922/sciencedb.603
Xu, L., Yu, G., and He, N. (2019). Increased soil organic carbon storage in Chinese terrestrial ecosystems from the 1980s to the 2010s. J. Geogr. Sci. 29, 49–66. doi: 10.1007/s11442-019-1583-4
Xu, L., Yu, G., He, N., Wang, Q., Gao, Y., Wen, D., et al. (2018b). Carbon storage in China’s terrestrial ecosystems: a synthesis. Sci. Rep. 8:2806. doi: 10.1038/s41598-018-20764-9
Xue, C., Chen, X., Xue, L., Zhang, H., Chen, J., and Li, D. (2023). Modeling the spatially heterogeneous relationships between tradeoffs and synergies among ecosystem services and potential drivers considering geographic scale in Bairin left banner, China. Sci. Total Environ. 855:158834. doi: 10.1016/j.scitotenv.2022.158834
Yao, Y., Piao, S., and Wang, T. (2018). Future biomass carbon sequestration capacity of Chinese forests. Sci. Bull. 63, 1108–1117. doi: 10.1016/j.scib.2018.07.015
Yu, G., Li, X., Wang, Q., and Li, S. (2010). Carbon storage and its spatial pattern of terrestrial ecosystem in China. J. Resour. Ecol. 1, 97–109. doi: 10.3969/j.issn.1674-764x.2010.02.001
Zhang, Z., Jiang, W. G., Peng, K. F., Wu, Z. F., Ling, Z. Y., and Li, Z. (2023). Assessment of the impact of wetland changes on carbon storage in coastal urban agglomerations from 1990 to 2035 in support of SDG15.1. Sci. Total Environ. 877:162824. doi: 10.1016/j.scitotenv.2023.162824
Zhang, P. P., Li, Y. H., Yin, H. R., Chen, Q. T., Dong, Q. D., and Zhu, L. Q. (2022). Spatio-temporal variation and dynamic simulation of ecosystem carbon storage in the north-south transitional zone of China. J. Nat. Resour. 37, 1183–1197. doi: 10.31497/zrzyxb.20220506
Zhang, D., Wang, X. Y., Qu, L. P., Li, S. C., Lin, Y. P., Yao, Y., et al. (2020). Land use/cover predictions incorporating ecological security for the Yangtze River Delta region, China. Ecol. Indic. 119:106841. doi: 10.1016/j.ecolind.2020.106841
Zhang, Y., Xie, Y. C., Qi, S. S., Gong, J., and Zhang, L. L. (2016). Carbon storage and spatial distribution characteristics in the Bailongjiang watershed in Gansu based on InVEST model. Resour. Sci. 38, 107–112. doi: 10.18402/resci.2016.08.16
Zhou, H., Lei, G., Zhao, Y., Lu, C., and Zhang, B. (2016). Simulation of dynamics of land use in Naoli River valley based on CA-Markov model. J. Ecol. Rural Environ. 32, 252–258. doi: 10.11934/j.issn.1673-4831.2016.02.013
Zhu, G., Qiu, D., Zhang, Z., Sang, L., Liu, Y., Wang, L., et al. (2021). Land-use changes lead to a decrease in carbon storage in arid region, China. Ecol. Indic. 127:107770. doi: 10.1016/j.ecolind.2021.107770
Zhu, W. B., Zhang, J. J., Cui, Y. P., Zheng, H., and Zhu, L. Q. (2019). Assessment of territorial ecosystem carbon storage based on land use change scenario: a case study in Qihe River basin. Acta Geograph. Sin. 74, 446–459. doi: 10.11821/dlxb201903004
Keywords: carbon storage, LUCC, InVEST, CA-Markov, multi-scenario prediction, Hainan Island, geo-detector
Citation: Lei J, Zhang L, Chen Z, Wu T, Chen X and Li Y (2024) The impact of land use change on carbon storage and multi-scenario prediction in Hainan Island using InVEST and CA-Markov models. Front. For. Glob. Change. 7:1349057. doi: 10.3389/ffgc.2024.1349057
Edited by:
Bo Huang, NTNU, NorwayReviewed by:
Xiuqing Nie, Chinese Academy of Forestry, ChinaCopyright © 2024 Lei, Zhang, Chen, Wu, Chen and Li. This is an open-access article distributed under the terms of the Creative Commons Attribution License (CC BY). The use, distribution or reproduction in other forums is permitted, provided the original author(s) and the copyright owner(s) are credited and that the original publication in this journal is cited, in accordance with accepted academic practice. No use, distribution or reproduction is permitted which does not comply with these terms.
*Correspondence: Jinrui Lei, cmF5a2luZ3JlQDE2My5jb20=; Zongzhu Chen, MzAxNjAyODBAcXEuY29t
†These authors have contributed equally to this work
Disclaimer: All claims expressed in this article are solely those of the authors and do not necessarily represent those of their affiliated organizations, or those of the publisher, the editors and the reviewers. Any product that may be evaluated in this article or claim that may be made by its manufacturer is not guaranteed or endorsed by the publisher.
Research integrity at Frontiers
Learn more about the work of our research integrity team to safeguard the quality of each article we publish.