 Hongjun Peng
 Ping Li
- School of Design, Jiangnan University, Wuxi, China
Utilizing flowering cherries to enhance suburban landscapes and attract public recreation holds significant economic and social value. However, the current quality of the cherry landscape is compromised due to the absence of variety selection and planning in planting and design. Based on the analysis of public preference, there is significant importance in boosting the sustainability of cherry blossom landscape. However, related research in this domain still needs to be explored. This study examined four representative cherry blossom landscapes in Fujian Province to assess the landscape quality and growth of existing cherry varieties. Subsequently, an improvement model of cherry blossom landscape quality was developed based on image semantic segmentation, aiming to quantify landscape elements. The findings indicated that: (1) There were a total of 46 cherry varieties blooming from January to March in the four representative cherry blossom landscapes. The health grades distribution was as follow: Grade I accounted for 41.3%, Grade II for 39.1%, Grade III for 8.7%, Grade IV for 6.5%, and Grade V for 4.4%. (2) The highest marginal benefit for flake planting was observed when the flowering ratio exceeded 60% or was less than 15%. In contrast, the optimal flowering ratio for the linear cherry blossom landscape for maximum marginal benefit was over 30.0%. (3) The outcomes of the scenic beauty model revealed that the five major factors influencing the scenic beauty were the scene cleanliness (38.04%), plant color composition (25.59%), road (17.79%), plant type (12.88%) and building (2.70%). The results of this study provide valuable objective data references for the planning, design and management of cherry blossom landscapes.
1 Introduction
Enhancing the landscape quality of scenic forests in suburban areas is an effective strategy for attracting the public, and utilizing cherries to enhance the recreational quality of these forests has demonstrated considerable effectiveness. Cherries, globally renowned for their ornamental value, boast abundant blooms, vibrant colors, a concentrated flowering period, and a rich history of admiration, leading to their widespread planted in recent years. Beyond their high aesthetic value, cherries contribute to both economic and environmental benefits (Peng et al., 2016). The romantic ambiance created by the spectacular bloom of cherries, resembling radiant clouds at their peak and a cascade of petals like celestial beings during their fall, entices crowds to cherry blossom landscapes for photography and leisure, igniting public enthusiasm for outings and exercise (Tan and Li, 2009). Furthermore, the experience of cherry blossom landscapes can alleviate mental stress, promoting the physical and mental well-being of the public—the breathtaking scenic impact of cherries results in a surge of visitors during their short blooming season. However, the number of non-seasonal visitors still needs to be increased, indicating a need to enhance their economic value. The primary challenge is economically creating cherry blossom landscapes with longer viewing seasons and exceptional landscape effects. The rational arrangement of cherry blossom landscapes necessitates consideration of three aspects: the selection of cherry species, tree species combinations, and landscape elements. Constructing an evaluation model for cherry blossom landscapes is essential for effectively determining how to choose these three elements.
Previous researchers have made significant contributions to addressing the issues above. In terms of cherry variety resources and community distribution, existing studies have documented the distribution and quantity of cherry varieties, species identification, breeding objectives, and horticultural applications (Lu et al., 2006; Wang, 2014). They have established a cherry database and emphasized that China’s most common cherry varieties are imported from Japan. Due to changes in their growth environment, these varieties are susceptible to diseases, pests, and arid climate, underscoring the critical importance of diagnosis, treatment, and variety selection (Li et al., 2014; Bian, 2018). Some scholars have focused on individual desirable traits of cherries. For example, certain cherry varieties, such as Prunus campanulata as representatives, have been introduced, providing research insights into suitability for the southeastern China’ climate, temperature, and topography (Lu et al., 2016). Concerning cherry blooming periods, researchers have established linear and non-linear relationship models between blooming periods and climate factors by analyzing trends in blooming period changes and their correlation with climate factors. They have summarized the relationship between cherry blooming periods and winter temperature changes, facilitating the prediction of blooming periods and the proper planning of cherry blossom landscapes (Chen et al., 2008; Shu et al., 2018; Tan et al., 2021). Prior research has analyzed cherries’ blooming periods and morphological characteristics in cherry blossom landscapes to create the optimal cherry viewing experience. The analysis was conducted on blooming period combinations and overall arrangements based on the different blooming periods and morphological features of various cherry varieties (Chen, 2022). Japanese scholars have cultivated over 600 cherry varieties, significantly expanding the botanical forms and applications of cherry blossom landscapes. Many regions have introduced a variety of cherries and explored plant materials from the Prunus genus to counteract the monotony that sets in after the cherry blossom landscape loses its appeal (Liu, 2012). Determining the cherry blooming ratio acceptable to the public is the foundation for setting blooming period combinations and overall arrangements. Analyzing the marginal benefits of cherry blooming ratios is particularly crucial, but scholars have yet to research the marginal benefits of cherry blooming ratios.
In addition to ornamental plants, cherry blossom landscapes should consider other landscape components to achieve enhanced landscape effects. Research has shown that the South Lingnan Botanical Park’s cherry garden emphasizes principles of plant configuration in specialized botanical gardens, plant diversity, and landscape construction (He et al., 2022). Analyzes of layout zoning, cherry varieties, vegetation planting design, and cherry community assessments have been conducted at Beijing Yuyuantan, Wuhan University, and Donghu Moshan. However, the related research has primarily relied on qualitative assessments, making it challenging to obtain widely applicable evaluation results (He et al., 2022). Scenic Beauty Estimation (SBE) is a commonly used landscape assessment method (Daniel and Boster, 1976). Early landscape assessments predominantly featured qualitative landscape elements, with quantitative assessments as a supplement. While some progress was made, issues persisted in constructing evaluation models with significant errors. With technological advancements, quantifying and analyzing landscape elements to enhance the reliability of landscape assessments became feasible (Howley et al., 2012; Schirpke et al., 2013). For example, Cui Zhe and others utilized the HSL color space model to analyze sample images for color analysis to develop a new green view rate calculation method (Cui et al., 2018). Liu Kedan and colleagues manually identified and outlined the external contours of landscape elements using Photoshop image processing software and then obtained quantitative data through a grid method (Liu et al., 2020). However, these studies still had certain methodological limitations, high time costs, and challenges in ensuring accuracy. Semantic Segmentation, a hot topic in computer vision, can automatically analyze different categories of data in images and achieve pixel-level classification of unknown images by discerning patterns. In landscape architecture, this technology has been extensively applied in tasks such as image information recognition, feature extraction, and classification (Zhang et al., 2020; Hong, 2021). Thanks to the widespread adoption of this technology, researchers have also improved the speed of data acquisition.
Fujian Province, situated in the southeastern coastal hilly area of China, is often called the “eight mountains, one river, and one patch of farmland.” The swift urban development in the region has led to the extensive utilization of available land for urban development, resulting in a shortage of urban green spaces. Enhancing the landscape quality of suburban scenic forests in Fujian Province has a dual economic value. It provides a pleasant recreational environment for urban residents and generates income for suburban communities. In this study, typical representatives of Fujian Province, including the Danying farm in Lianjiang County, the Cherry Garden of Fuzhou Botanical Park, Yutan Cherry Valley in Xiapu County, and Yongfu Cherry Garden in Zhangping City, were analyzed for their cherry species, health status, planting methods, and scenic effects. The study involved hierarchical and marginal benefit analyzes of different cherry blossom landscape configurations. Additionally, it introduced image semantic segmentation as an auxiliary method for quantitative scene analysis, focusing on the assessment of scenic beauty. The main objectives of this research are as follows: (1) Evaluate the aesthetic effects of the existing cherry varieties in Fujian Province. (2) Through marginal benefit analysis, determine the flowering ratios with the highest economic value, providing recommendations for cherry variety combinations. (3) Utilize scenic beauty assessment to analyze the landscape elements affecting cherry blossom landscapes, providing modeling support for constructing these landscapes. This study offers theoretical support for enhancing recreational forests in other areas within Fujian Province.
2 Materials and methods
2.1 Study site
Fujian Province is situated in the southeastern coastal area of China, ranging between latitudes 23°31′ to 28°18’ North and longitudes 115°50′ to 120°43′East. It falls under the North Subtropical Monsoon Climate, with an average annual temperature of 17.5°C, annual average precipitation of 1,635 mm, a frost-free period of 270 days, and an average relative humidity of 81%. Approximately 90% of the region’s area is characterized by mountains and hills. This geographical context makes it a typical representative for studying the status of cherry blossoms in a subtropical, mountainous, and coastal environment. This study selected several sites in Fujian Province for research (Table 1), including the Danying farm in Lianjiang County, the Cherry Garden of Fuzhou Botanical Park, Yutan Cherry Valley in Xiapu County, and Yongfu Cherry Garden in Zhangping City (Figure 1).
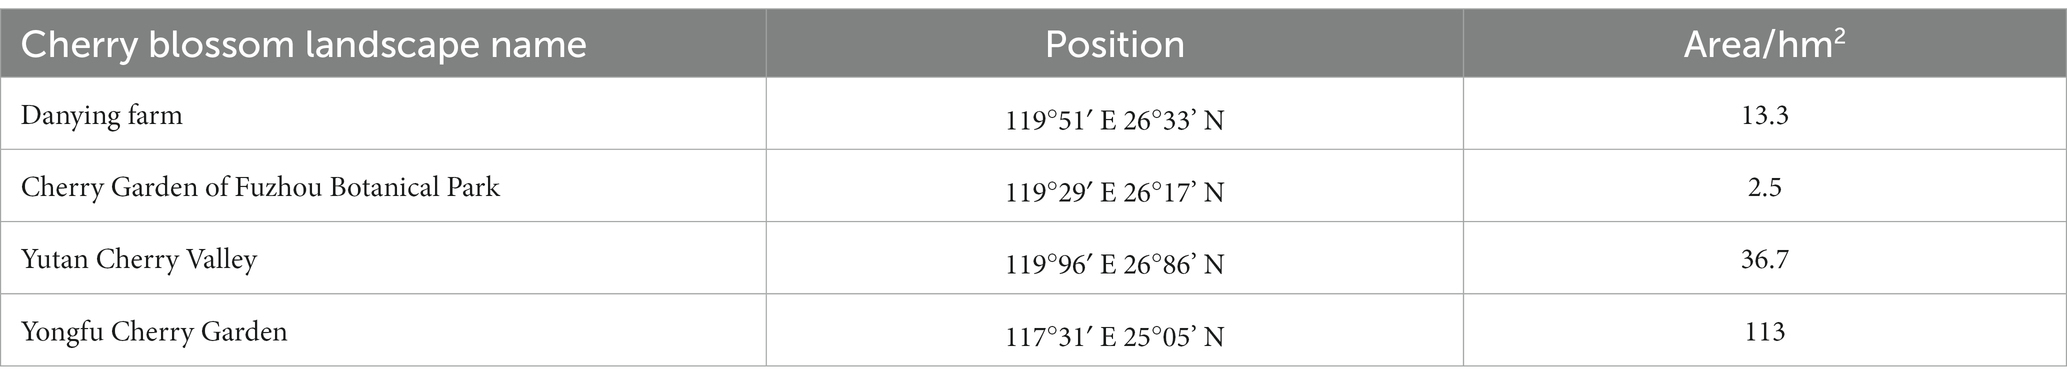
Table 1. Basic information of cherry blossom landscapes.
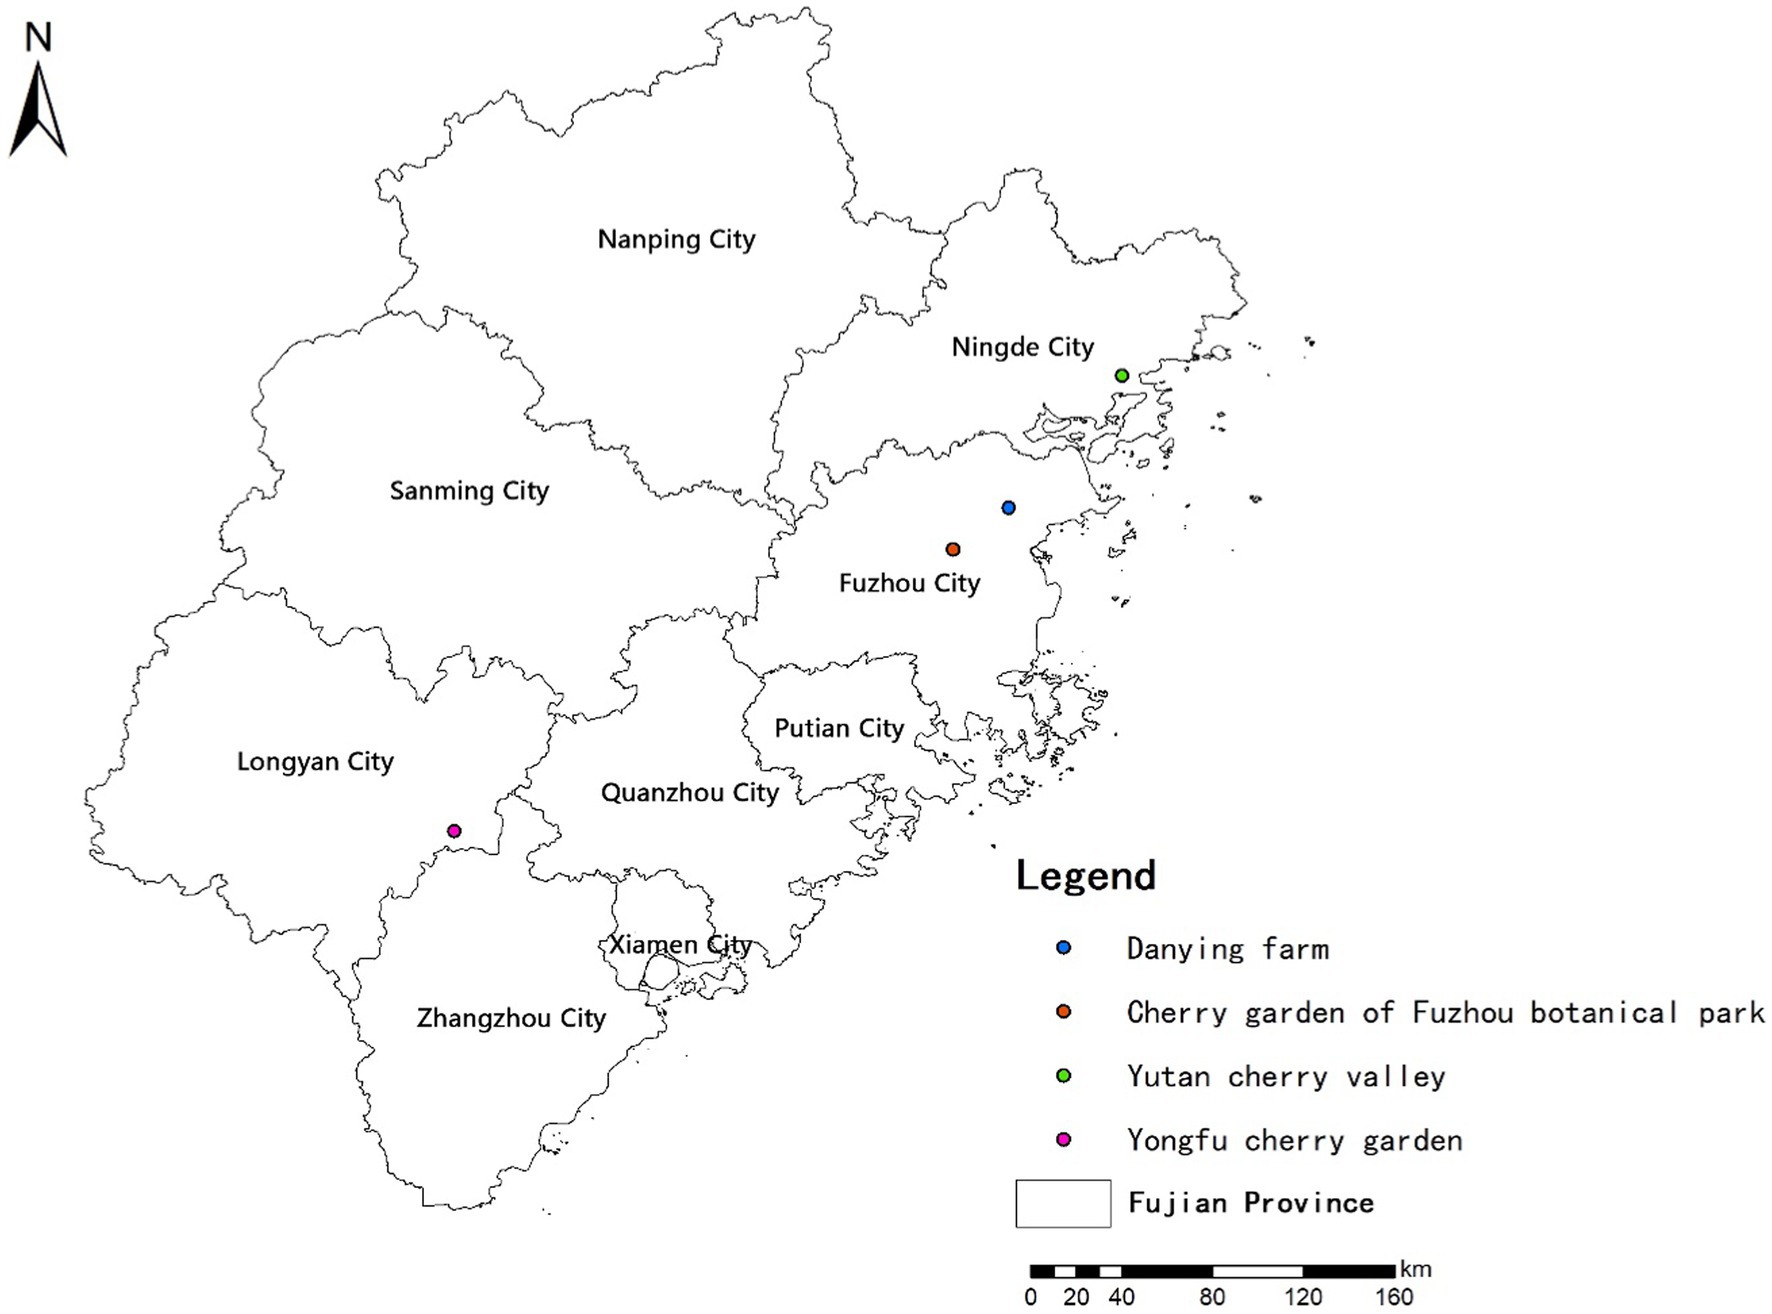
Figure 1. Distribution of typical cherry blossom landscapes in Fujian Province.
The four cherry blossom landscapes exhibit distinct planar configurations (Figure 2). Employing computer calculations to extract color elements from the four cherry blossom landscapes revealed that the Danying farm and Yutan cherry valley feature extensive cherry patches. In contrast, the Cherry Garden of Fuzhou Botanical Park and Yongfu Cherry Garden utilize the terrain of valleys and hillsides, arranging cherry rows along the viewing paths, resulting in a smaller proportion of cherry area. The overall viewing areas in these two parks adopt a narrow and elongated strip-like layout.
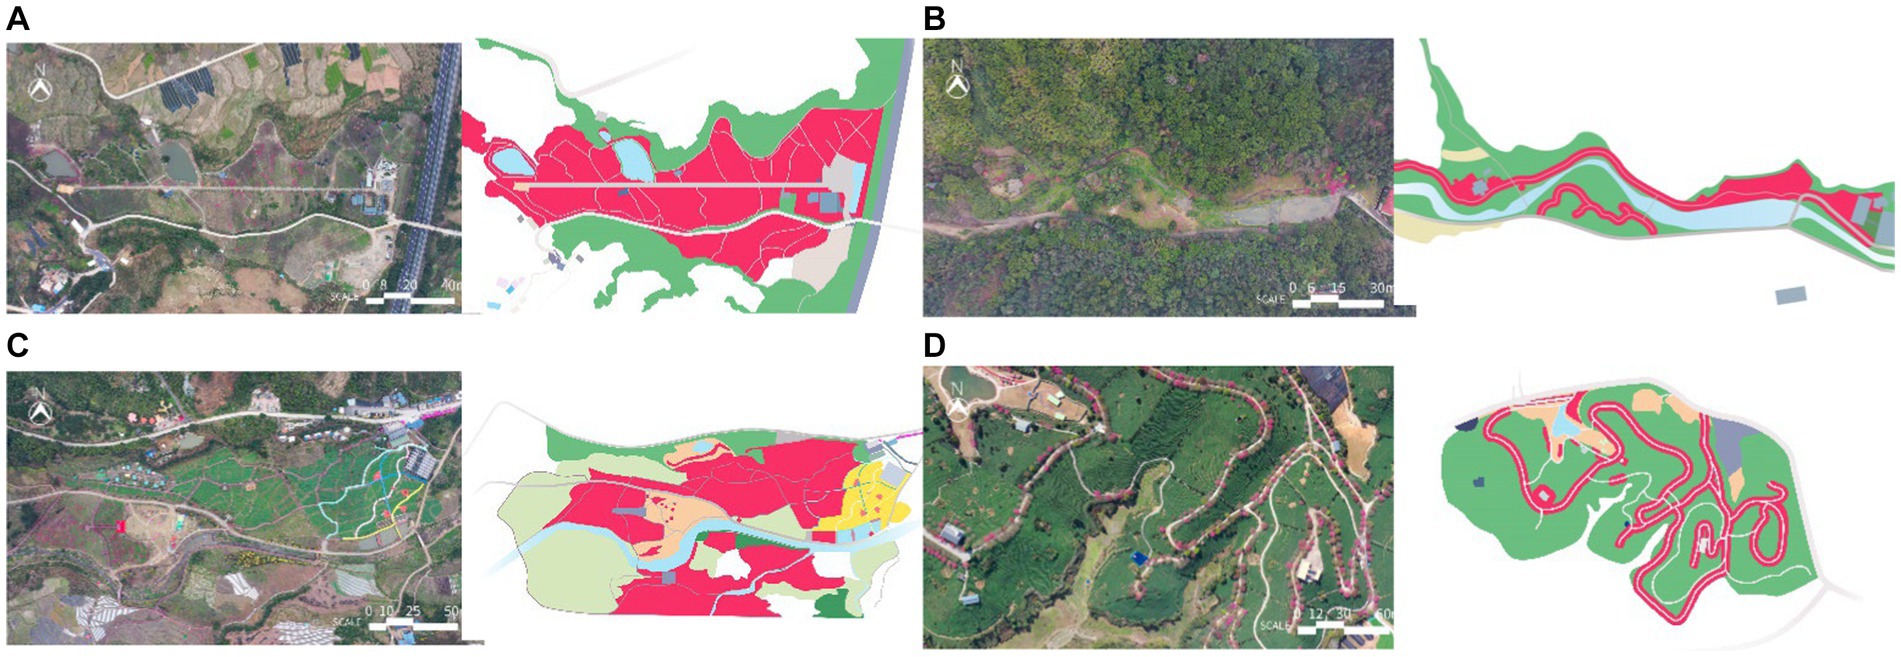
Figure 2. Aerial view of cherry blossom landscapes and their cherry distribution characteristics. (A) Danying farm (B) The Cherry Garden of Fuzhou Botanical Park (C) Yutan Cherry Valley (D) Yongfu Cherry Garden. The pink areas in the image represent the cherry planting zones.
2.2 Current cherry planting status survey and health evaluation
A field survey was conducted during the spring seasons of 2022 and 2023 to identify cherries with low flowering tendencies. While documenting photographs, the survey aimed to investigate the cherry varieties, quantities, distribution, ornamental characteristics, and park configuration patterns. Comprehensive records of the cherry varieties’ morphological features, ornamental characteristics, and growth status were maintained. Special attention was given to areas with the highest concentration of cherry varieties, and the traits recording utilized a combination of individual plants and standard plants.
The health level of the cherries in the study area was assessed using the Cherry Health Grade Evaluation method (Zhao et al., 2023), with a particular focused on introduced cherry species (including varieties). Each planting location underwent a survey employing sampling and census methods, resulting in a total of 235 surveyed plants—heights ranging from 3 to 9 meters and canopy widths from 2.4 to 5.5 meters. Records were made for cherry characteristics related to ornamental value (tree shape, branching, flower quantity, leaf canopy, leaf color), ecological adaptability (growth condition, root permeability, dead branch count), and tolerance (disease and pest resistance, cold and heat resistance). These characteristics were quantitatively scored on a scale of 1 to 5 (Table 2).
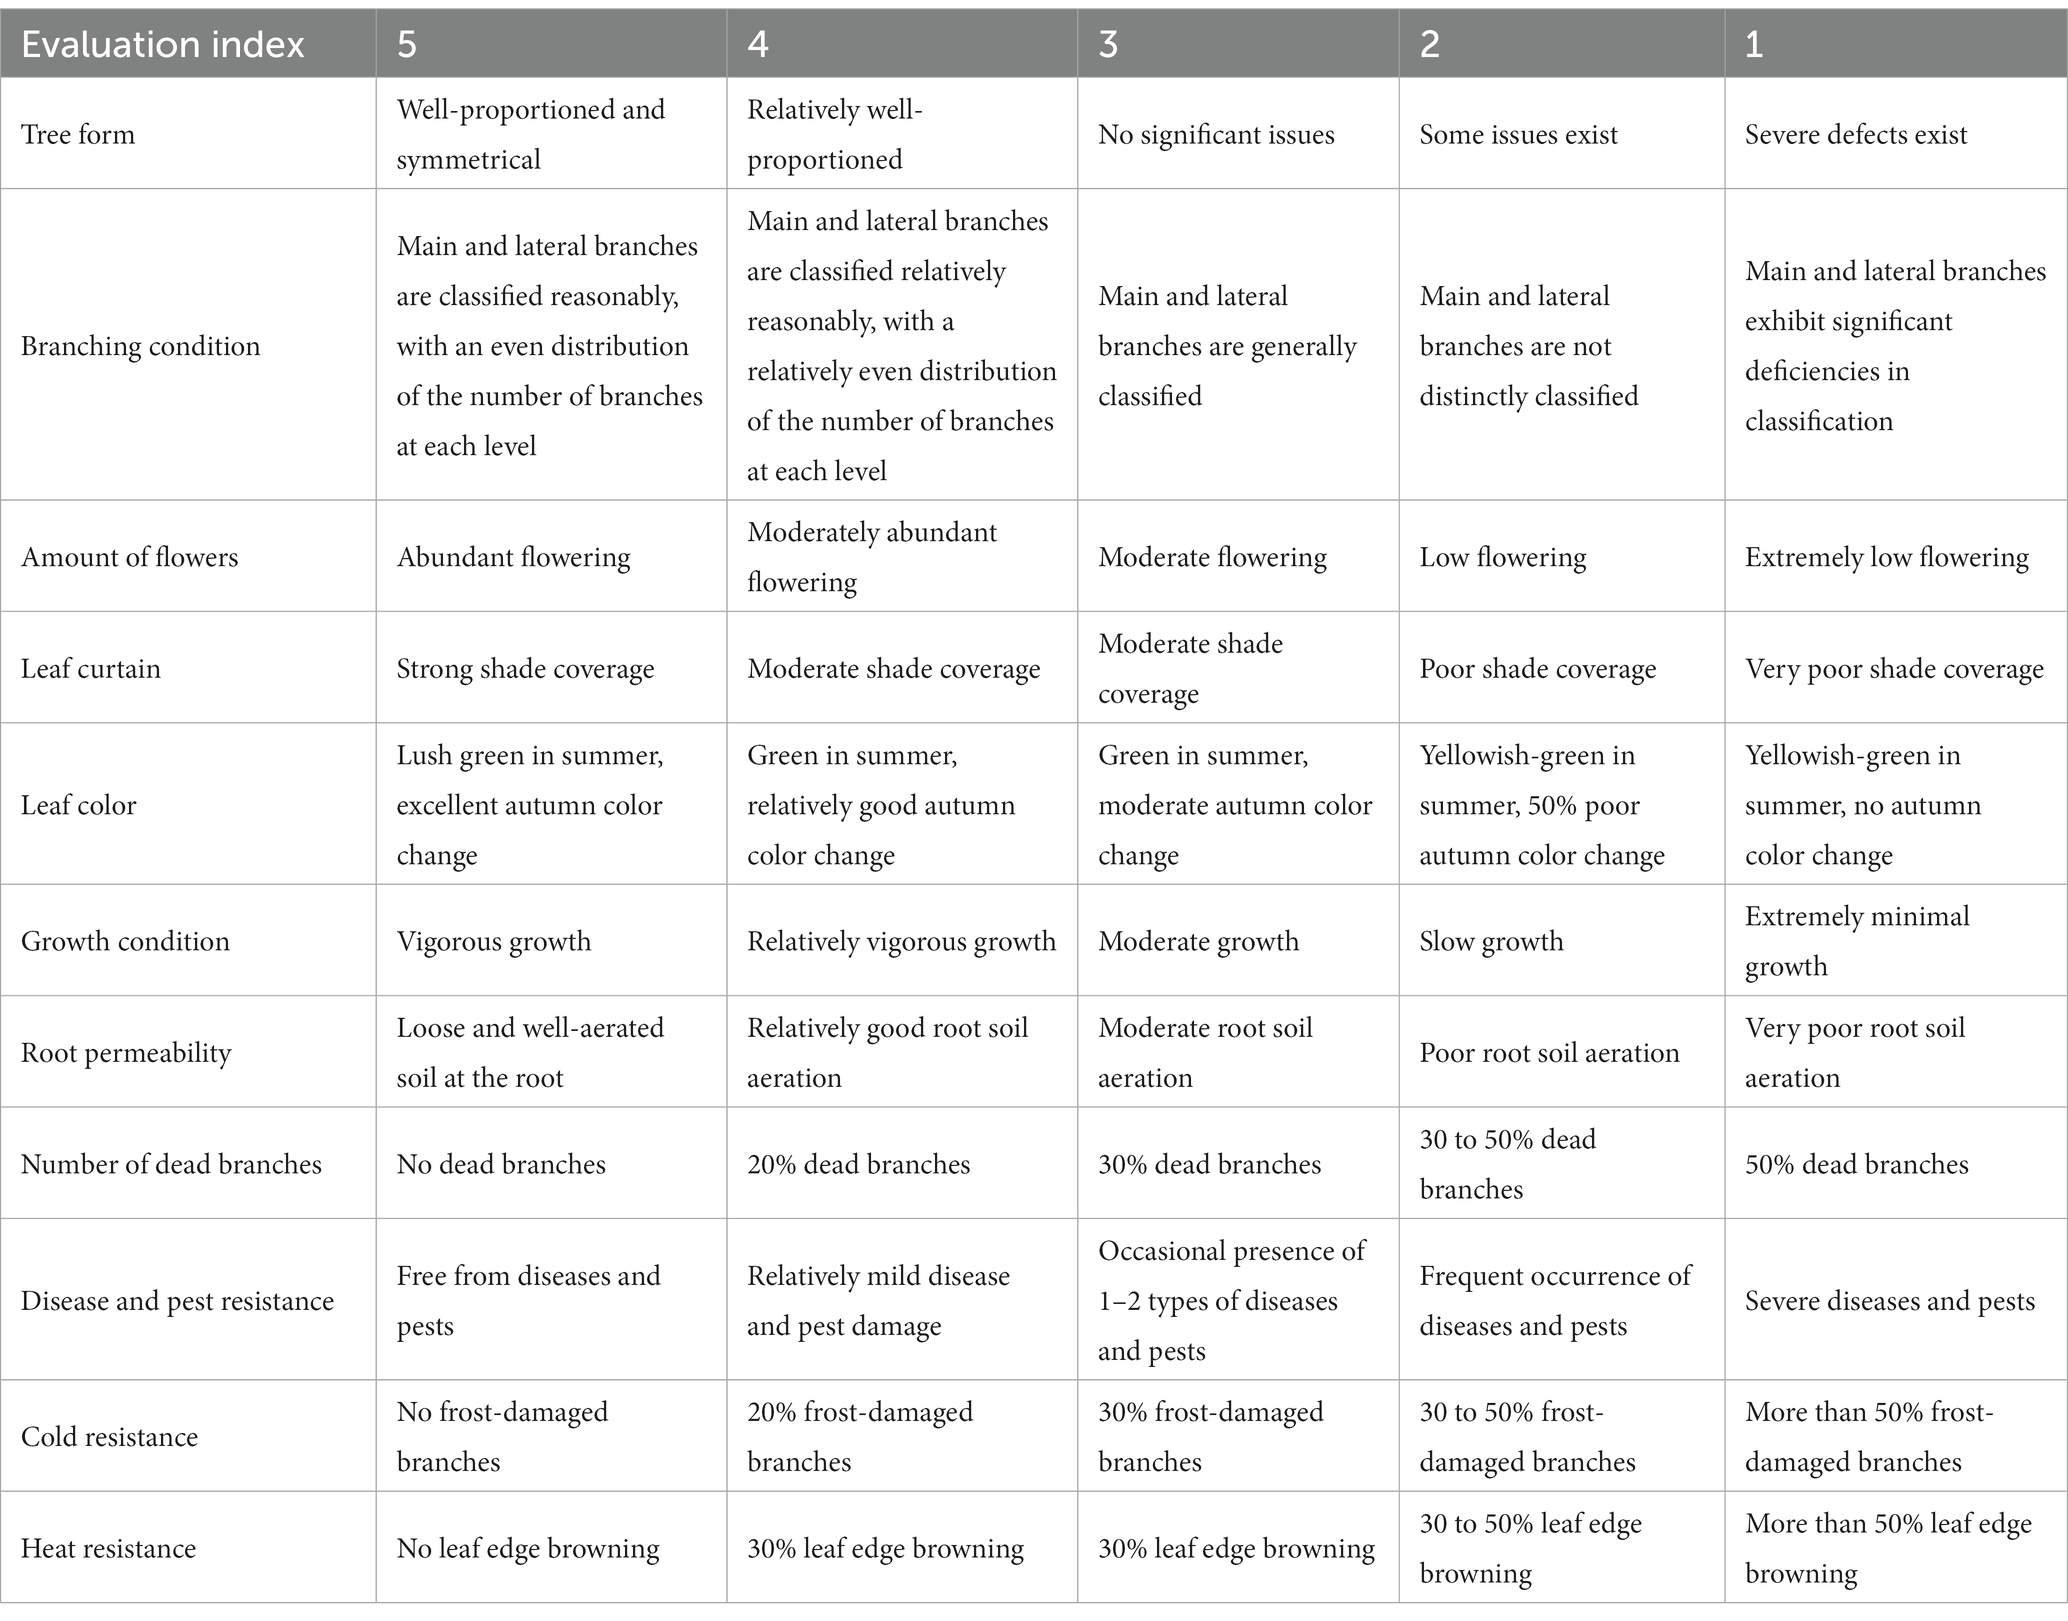
Table 2. Evaluation criteria for cherry health grades—specific rating standards (Zhao et al., 2023).
After consulting with 20 professionals with doctoral degrees or senior expertise in the fields of landscape architecture, forestry, and tourism, critical indicators for cherry health grading were carefully selected. The primary indicators identified were leaf canopy (P4), growth status (P6), and flowering quantity (P3). Following these, equally important were dead branch count (P8), tree shape (P1), disease and pest resistance (P9), followed by cold resistance (P10), root permeability (P7), and leaf color (P5) (Table 3). The results of the hierarchical analysis align with the designated indicators that influence cherry growth and health, demonstrating that the selected indicators, encompassing branch and leaf quantity, flowering quantity, tree shape, stress resistance, and leaf color, fully satisfy the criteria for cherry health grading (Xia and Wang, 2022).
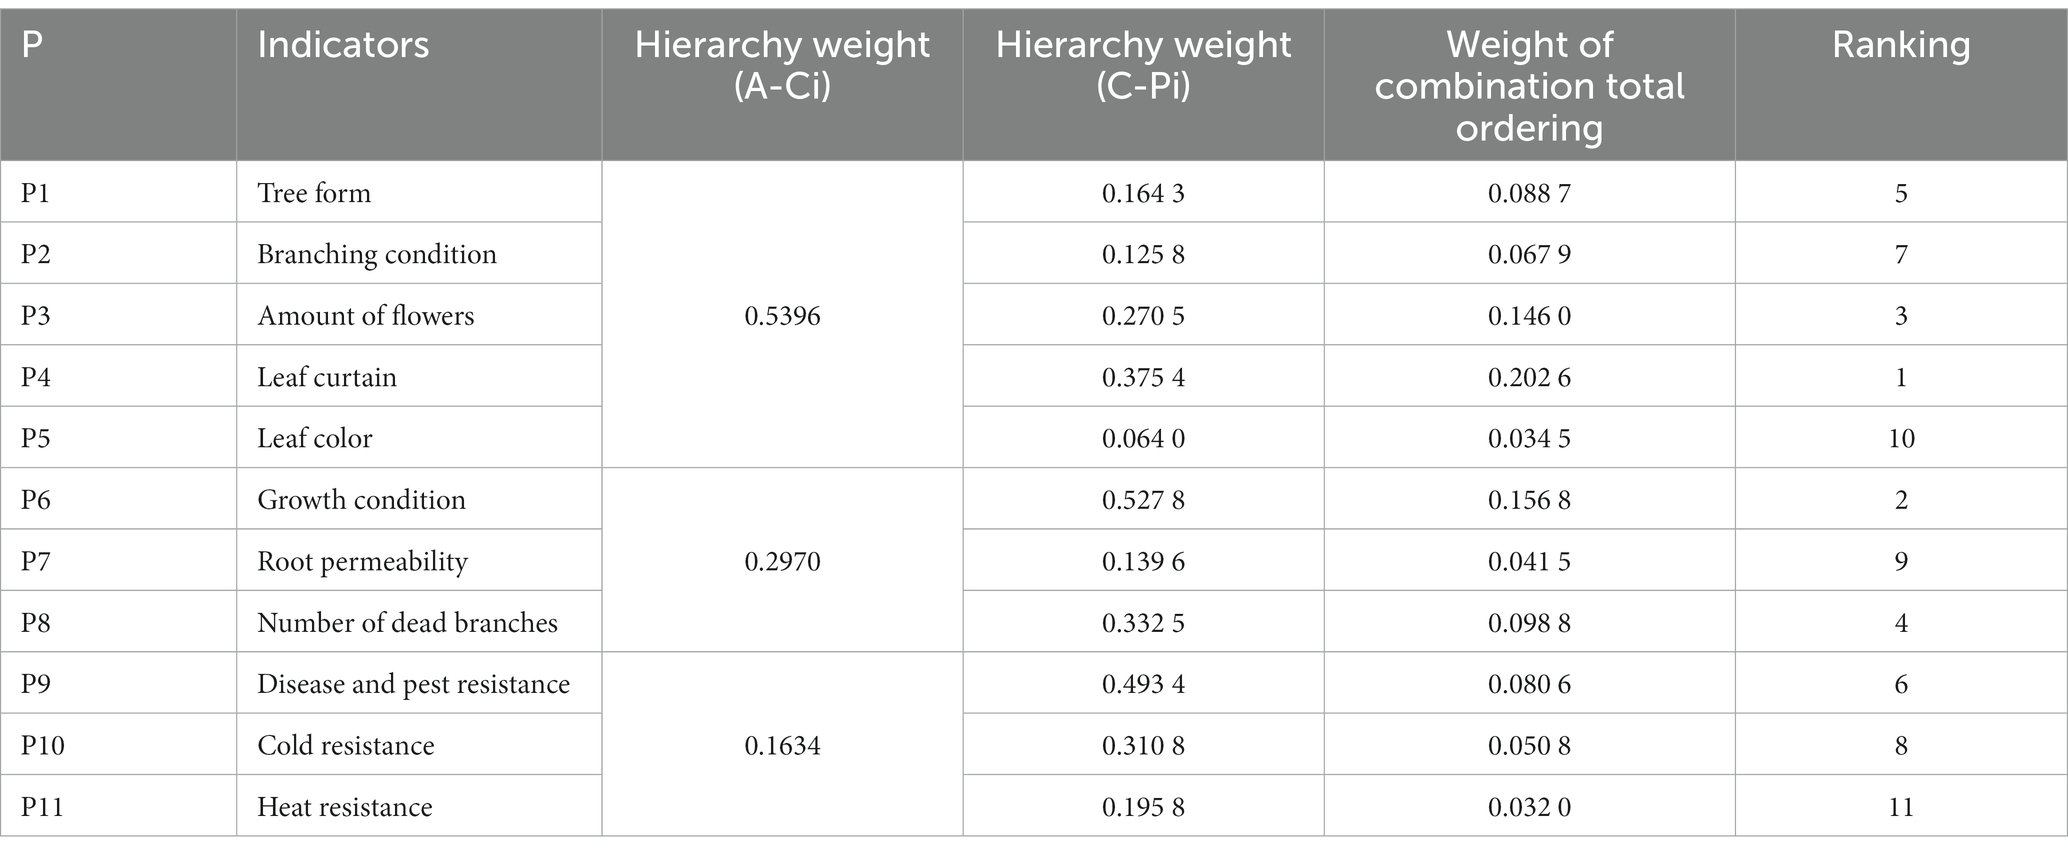
Table 3. Overall weighted composite ranking value and compliance test.
2.3 Photo acquisition and selection
In the spring of 2023, photographs were captured using a digital single-lens reflex camera (Canon 90D model) between 8:00 AM and 4:00 PM. Survey sites were photographed from various observation positions, with the camera lens set at eye level, ensuring images were taken in the direction of sunlight. Landscape photos were captured in a horizontal orientation to maintain technical uniformity. A total of 1,624 on-site photos were taken, with 30 photos selected from both flat cherry groves and linear cherry blossom landscapes, summing up to 60 photos for landscape evaluation analysis.
2.4 Participants and evaluation process
Responses to scenic beauty evaluations from diverse populations exhibit a statistically significant universality. For instance, Wei Lu found that the aesthetic judgments of the general public and professionals had some similarities in the assessment of spring landscape quality in six Shanghai city parks using the SBE (Scenic Beauty Estimation) and SD (Semantic Differential) methods (Wei et al., 2022). Zhao Qiuyue discovered in a study of park plant configurations based on the SBE method and quantitative analysis of plant color combinations that different populations demonstrated converging acceptance levels for various color indicators in plant combinations (Zhao et al., 2018). In this experiment, 120 volunteers from the university community were recruited as the participants. The evaluation process was divided into three parts: (1) Panoramic images, presented in equidistant projection format, were compiled into slideshows and shown to participants at 8-s intervals (Guo and Yang, 2005). (2) Participants evaluated the scenes according to landscape quality assessment criteria. A 7-point scoring system was used in the questionnaire, with scores ranging from 3 to −3, representing a stepwise scale from “very like” to “very dislike” to calculate the SBE values of the participants. The standardized formula is as follows:
In the equation: Zij represents the standardized value of j respondents for the i-th plant landscape; Rij is the evaluation score given by the j-th respondent for the i-th plant landscape; Rj is the average of all evaluations by the j-th respondent, and Sj is the standard deviation of all evaluation scores by the j-th respondent (Equation 1). After calculating the standardized values, the average for the same landscape is referred to as the Z value (Equation 2), which measures of scenic beauty. The scenic beauty estimation value (SBE value) reflects the landscape’s aesthetic quality and the respondents’ aesthetic preferences. Correlation analysis uses the SBE value to explore aesthetic differences among different groups and identify factors influencing the evaluation scores.
2.5 Marginal benefit analysis of cherry flowering ratio
Cherries have a relatively brief flowering period, and there is a pressing concern for operators and managers to extend the duration of cherry viewing. In addition to planting cherry varieties with more extended flowering periods, configuring cherries of different flowering times is a pivotal strategy to extend the overall flowering period within the garden (Sun et al., 2022). Therefore, analyzing the marginal benefit of cherry flowering is crucial in determining the proportions of different flowering times. Based on this, this study conducted a public aesthetic feedback analysis on cherry blossom landscape configurations with different flowering ratios, excluding the interference of other landscape elements. The calculation formula is as follows (Guan et al., 2018):
In the formula (Equation 3), MR represents a marginal benefit, indicating the change in SBE value. The SBE value at a flowering ratio of t represents the proportion of additional flowering cherry trees, with t representing the proportion of flowering cherry trees.
2.6 Landscape element selection
To determine the relationship between landscape evaluation and scenes, it is crucial to identify the landscape elements that impact scenery quality. Based on the classification of landscape elements in prior studies and a review of landscape evaluation research conducted both domestically and internationally in recent years (Kang et al., 2008; Howley et al., 2011; Weng et al., 2017; Guo, 2019; Han and Ma, 2020; Liu et al., 2020; Wang et al., 2020; Liu et al., 2021), environmental characteristics were initially categorized into 20 preselected landscape elements, further grouped into four aspects: spatial elements, natural elements, construction elements, and facility elements.
The grey statistical analysis method was deemed effective in enhancing the scientific selection of elements (Li et al., 2020). The research employed this method for further element selection with the following process: (1) opinions on the importance of the elements were gathered from 20 professionals in landscape architecture, forestry, and tourism with doctoral degrees or senior-level qualifications, using a 7-point rating scale where levels 1 to 7 indicated “very unimportant” to “very important”; (2) a grey incidence analysis function was constructed; (3) grey decision coefficients were calculated to determine the high, medium, and low grey decision coefficients for each element; and (4) the three decision coefficients in the vector were compared, and the elements with “high” importance were selected for further research. The final selection resulted in 12 landscape elements, as shown in Table 4.
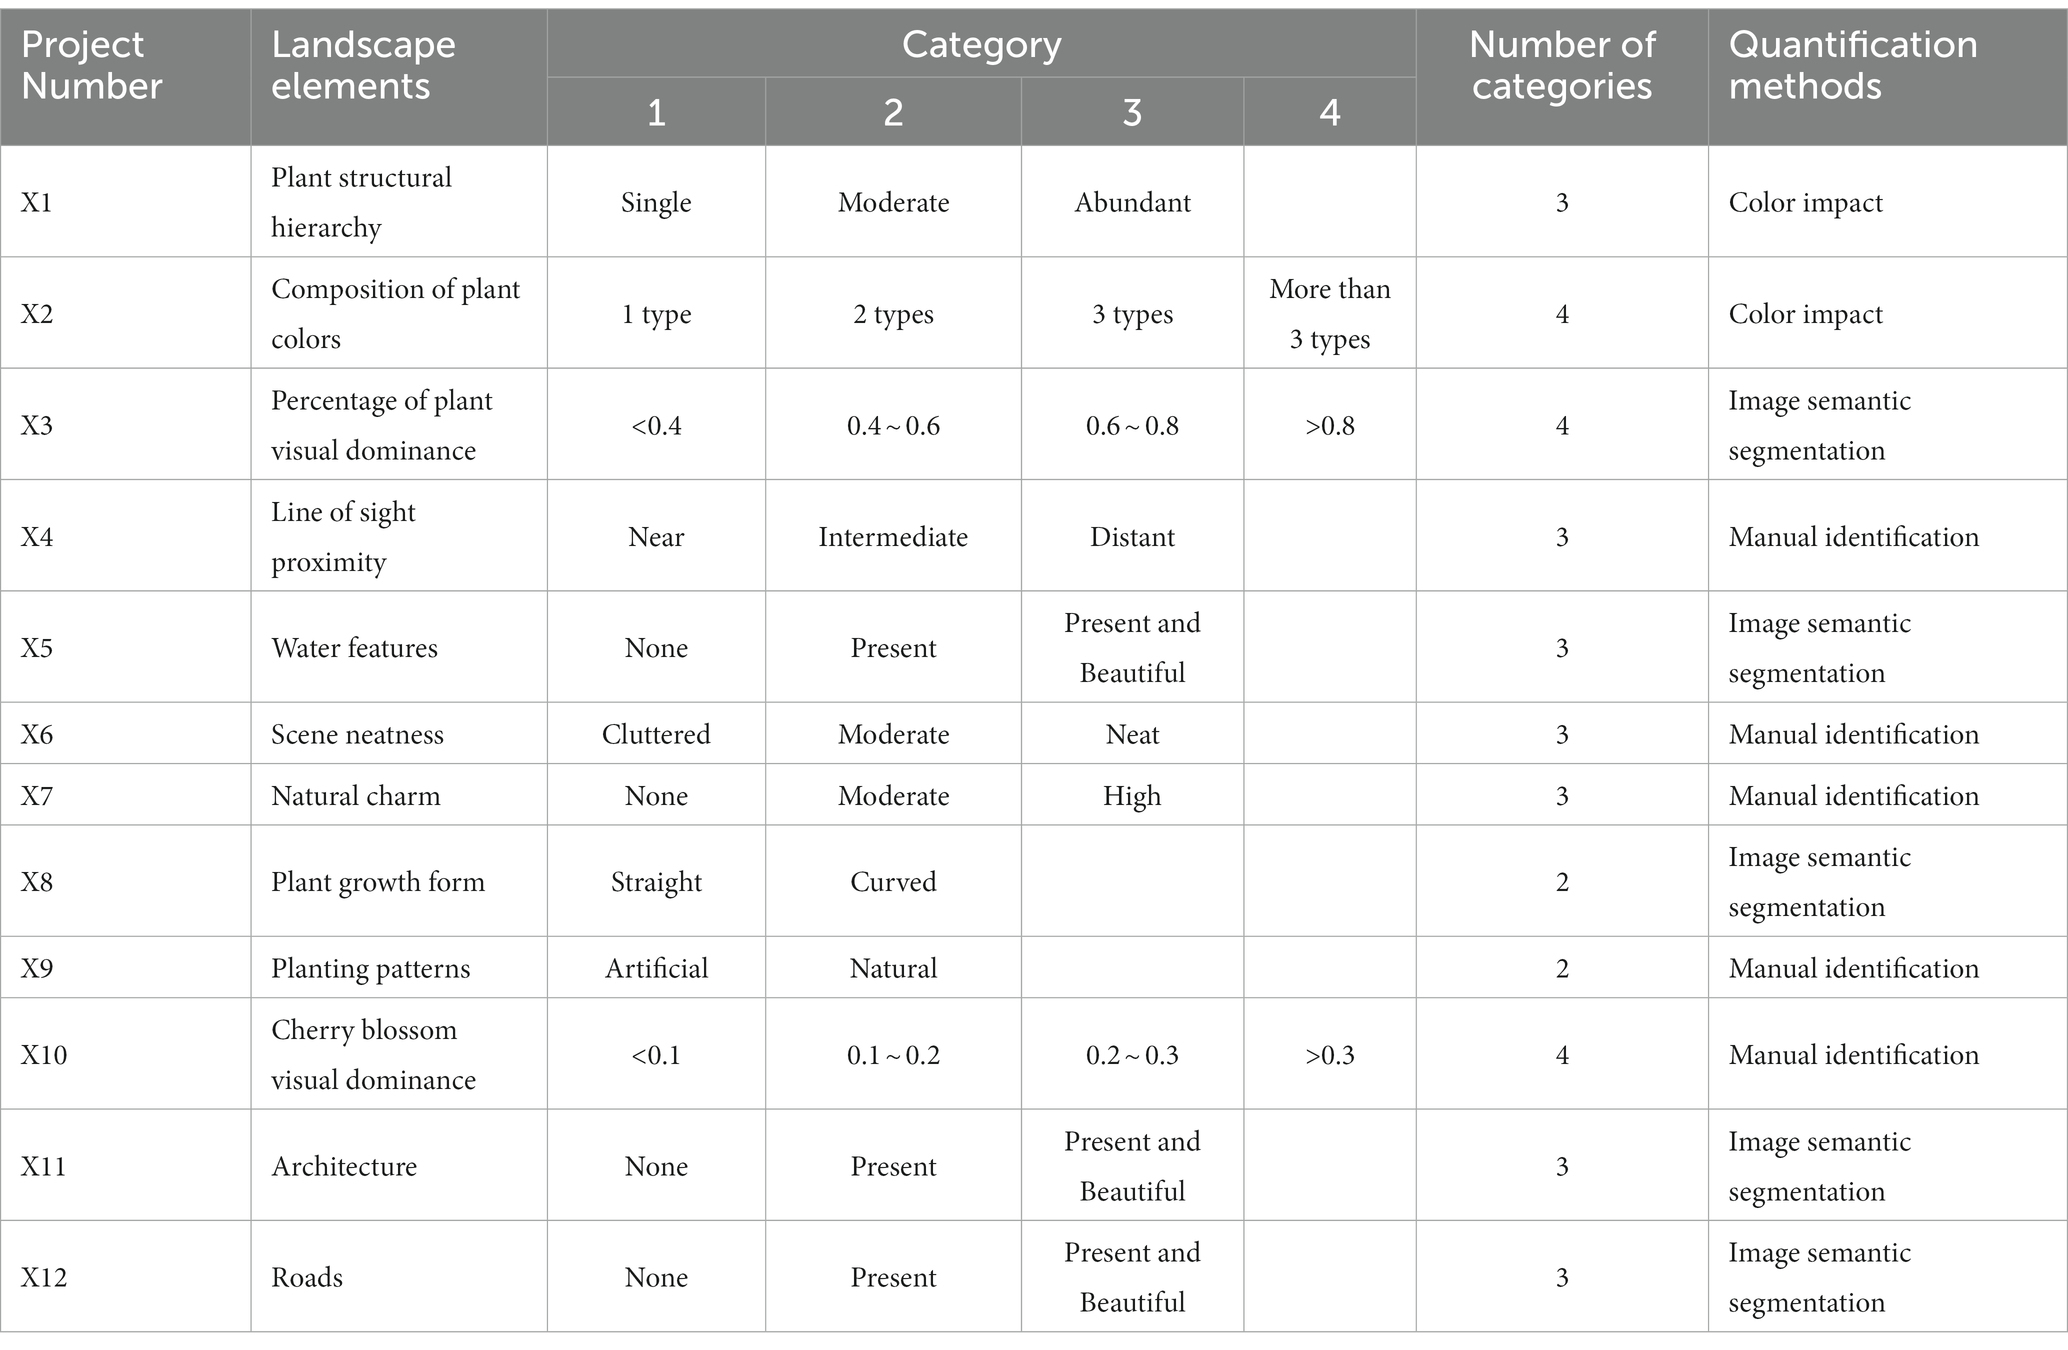
Table 4. Decomposition of cherry blossom landscape elements.
2.7 Quantitative decomposition of landscape elements
In this study, the PSPNet model, an improved version based on the Fully Convolutional Network (FCN), was employed to perform quantitative decomposition of the scenes (Figure 3).
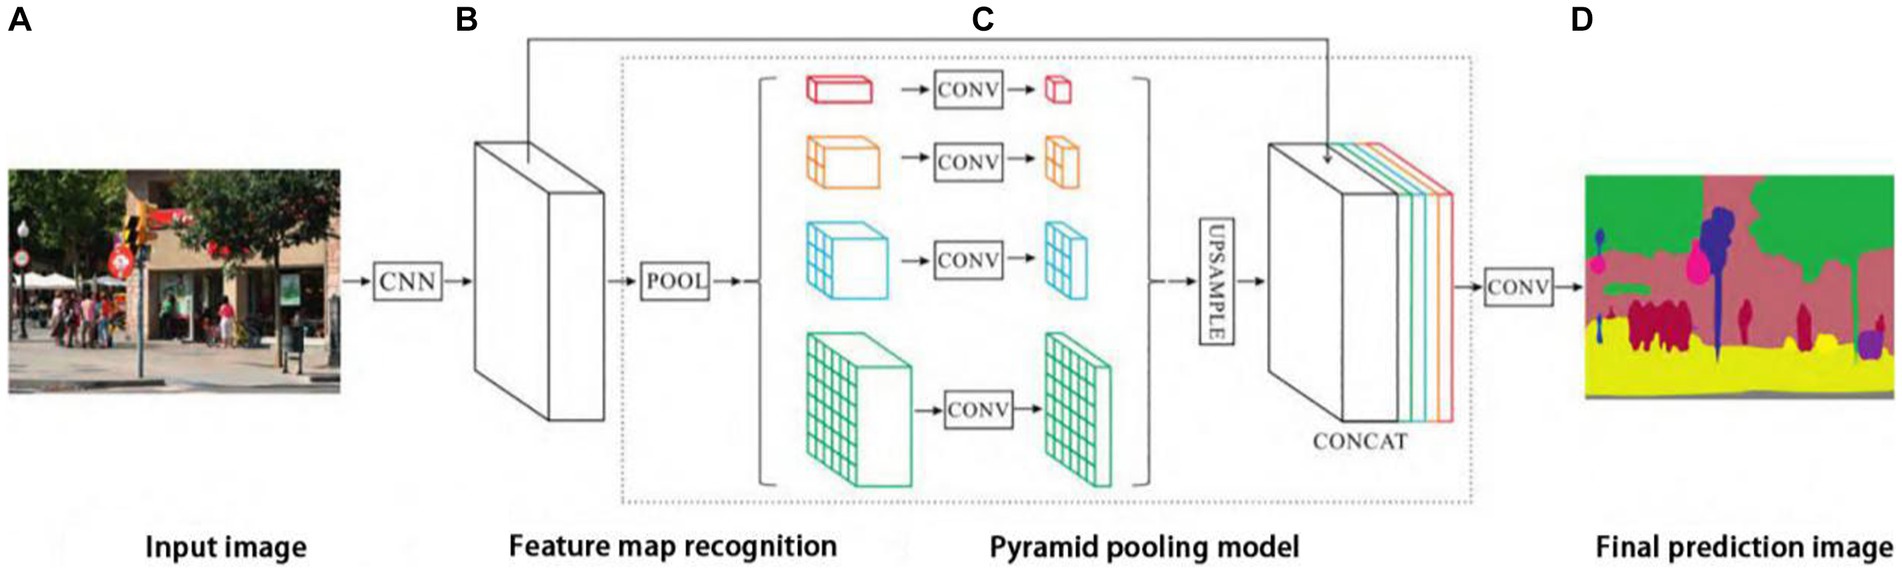
Figure 3. PSPNet network structure (Bulut and Yilmaz, 2008).
Recognition accuracy is commonly assessed using the mean Intersection over Union (MIoU) as a standard (Garcia-Garcia et al., 2017), quantifying the overlap between predicted image pixels and actual pixels, as calculated in Eq. (4). The PSPNet model is regarded as apt for relatively intricate scene analysis and previously won the 2016 ImageNet Scene Parsing Challenge, achieving the best performance in the PASCAL VOC 2012 benchmark (MIoU = 85.4%).
In the formula, k represents the total number of landscape label categories; pii denotes the total number of pixels with a true class of i that are predicted as class i; pij represents the total number of pixels with a true class of i that are predicted as class j; pji signifies the total number of pixels with a true class of j that are predicted as class i (Chen et al., 2023; Li et al., 2023).
2.8 Scenic beauty estimation model establishment
In this study, the standardized values of scenic beauty are employed as the dependent variable, while the values of various landscape elements serve as independent variables. During model-building, a partial correlation analysis method is utilized to progressively eliminate factors with weaker associations with the dependent variable, retaining those that contribute significantly to scenic beauty. This approach is employed to formulate a linear model describing the relationship between scenic beauty values and landscape elements, thereby offering support for enhancing the quality of cherry blossom landscapes.
3 Results
3.1 Cherry varieties and scenic conditions
3.1.1 Cherry varieties
46 cherry varieties (including cultivars) are collected from the four cherry blossom landscapes (Figure 4). Among these, the predominant species in all four gardens is the Prunus campanulata, constituting 81% of the total plantings. This species is characterized by early flowering, rich population variability, umbrella-shaped inflorescence, early leaf emergence, and bell-shaped calyx tube, among other features. Eight other species have been introduced, including P. lannesiana and P. × yedoensis, but comprise less than 20% of the total. Specifically, P. × yedoensis accounts for 6%, P. lannesiana for 5%, and P. ×introtsa and P. schneideriana for less than 2%. P. dielsiana, P. × subhirtella, and P. cerasoides constitute less than 1%.
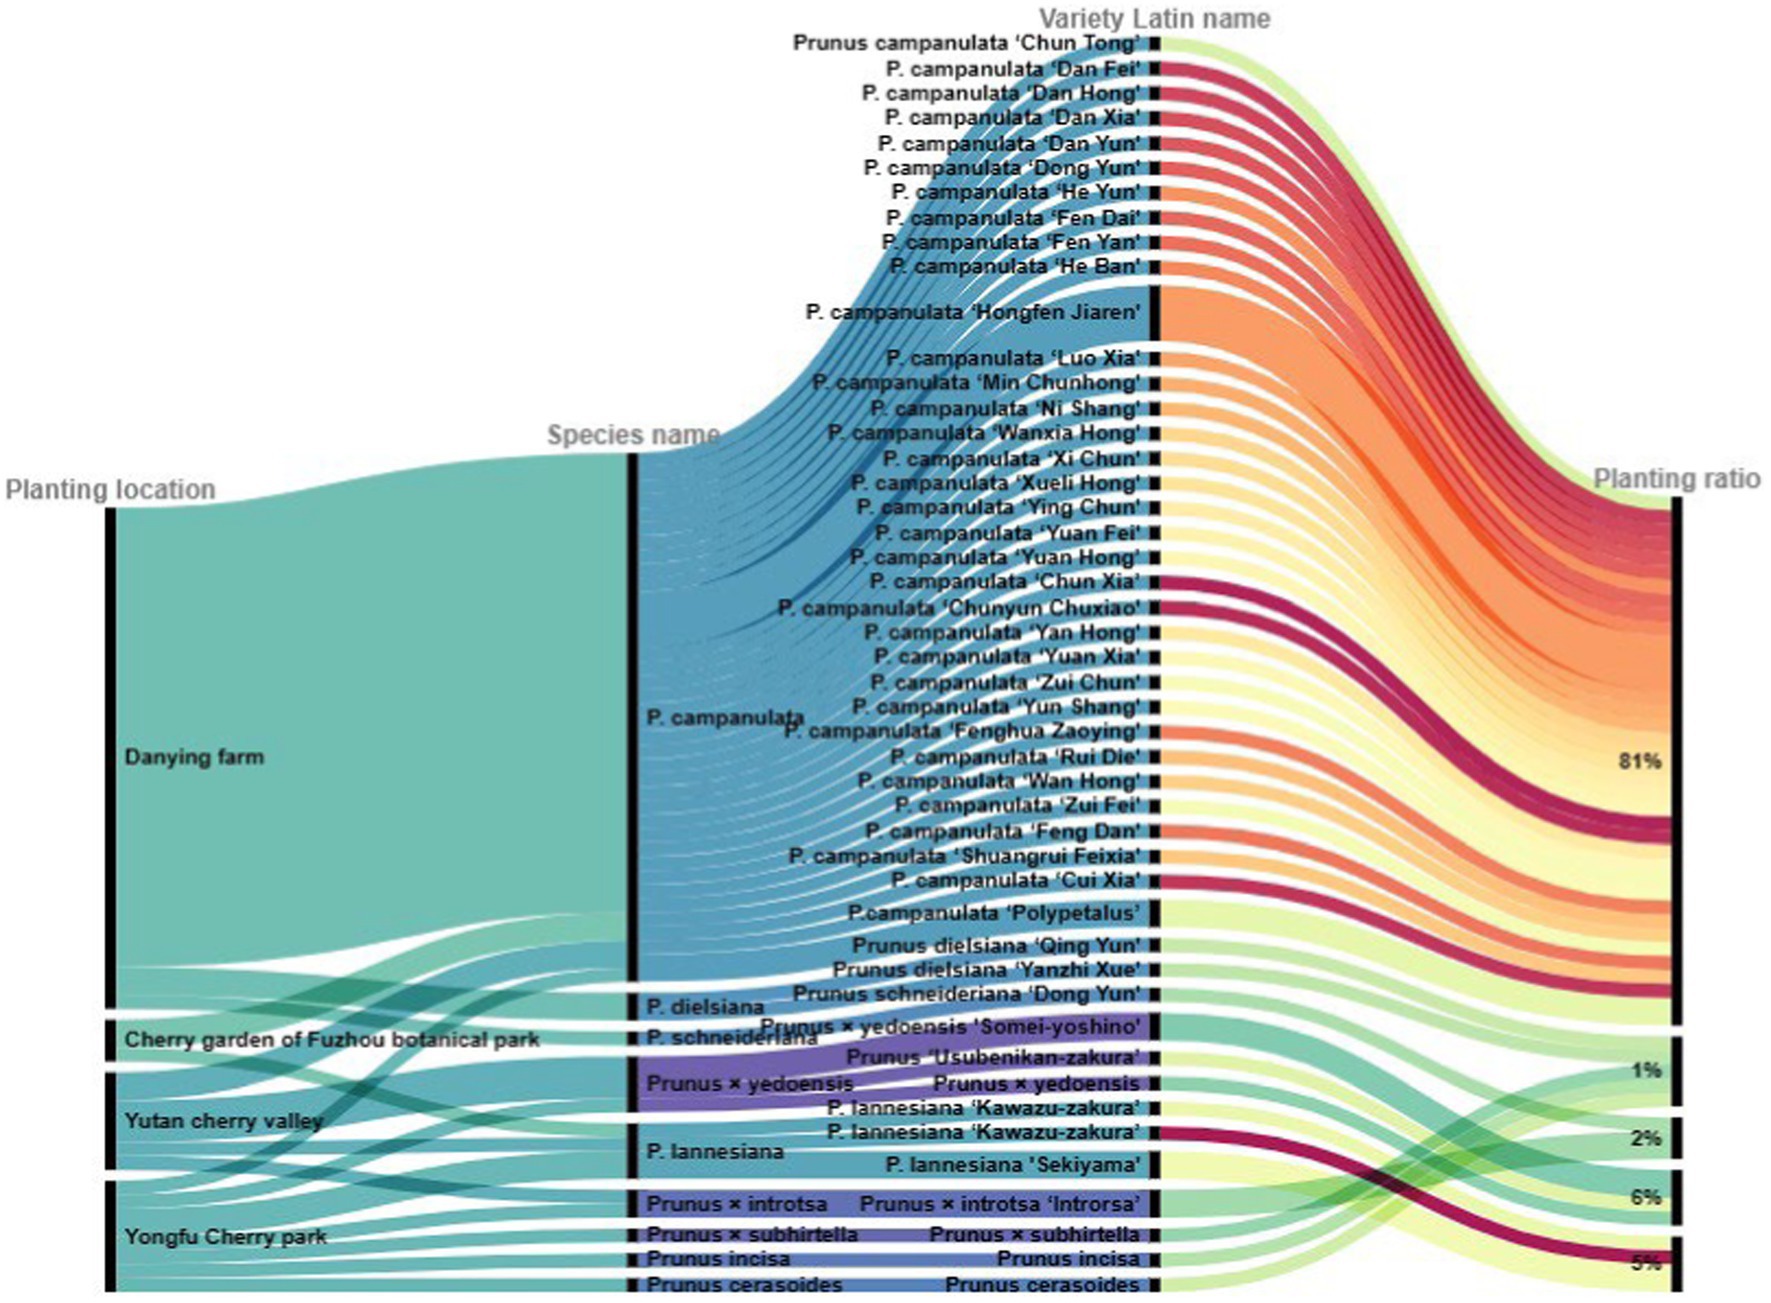
Figure 4. Distribution proportion of cherry species.
3.1.2 Cherry flowering period and color composition
Regarding flower color, various shades of light pink, pink, deep pink, and pink-white, with pink being the most predominant, accounting for up to 30.4%. The flowering period spans from January to March. Species such as Prunus campanulata “Dan Hong”, “Dan Xia”, “Fen Dai”, “Hongfen Jiaren”, and P. × subhirtella have their first blooms in January. In February, species like P. campanulata “Polypetalus”, “Chun Tong”, “Dan Yun”, “He Ban”, P. lannesiana “Kawazu-zakura”, and P. lannesiana “Sekiyama” begin to bloom. In March, species like P. campanulata “Dan Fei”, “Dong Yun”, “Fen Yun”, P. incisa, P. cerasoides, P. cerasoides, P. × yedoensis “Somei-yoshino”, P. “Usubenikan-zakura”. Apart from P. campanulata “Dan Hong”, which has an extended flowering period of 30 days, the other varieties typically have around 20 days (see Figure 5).
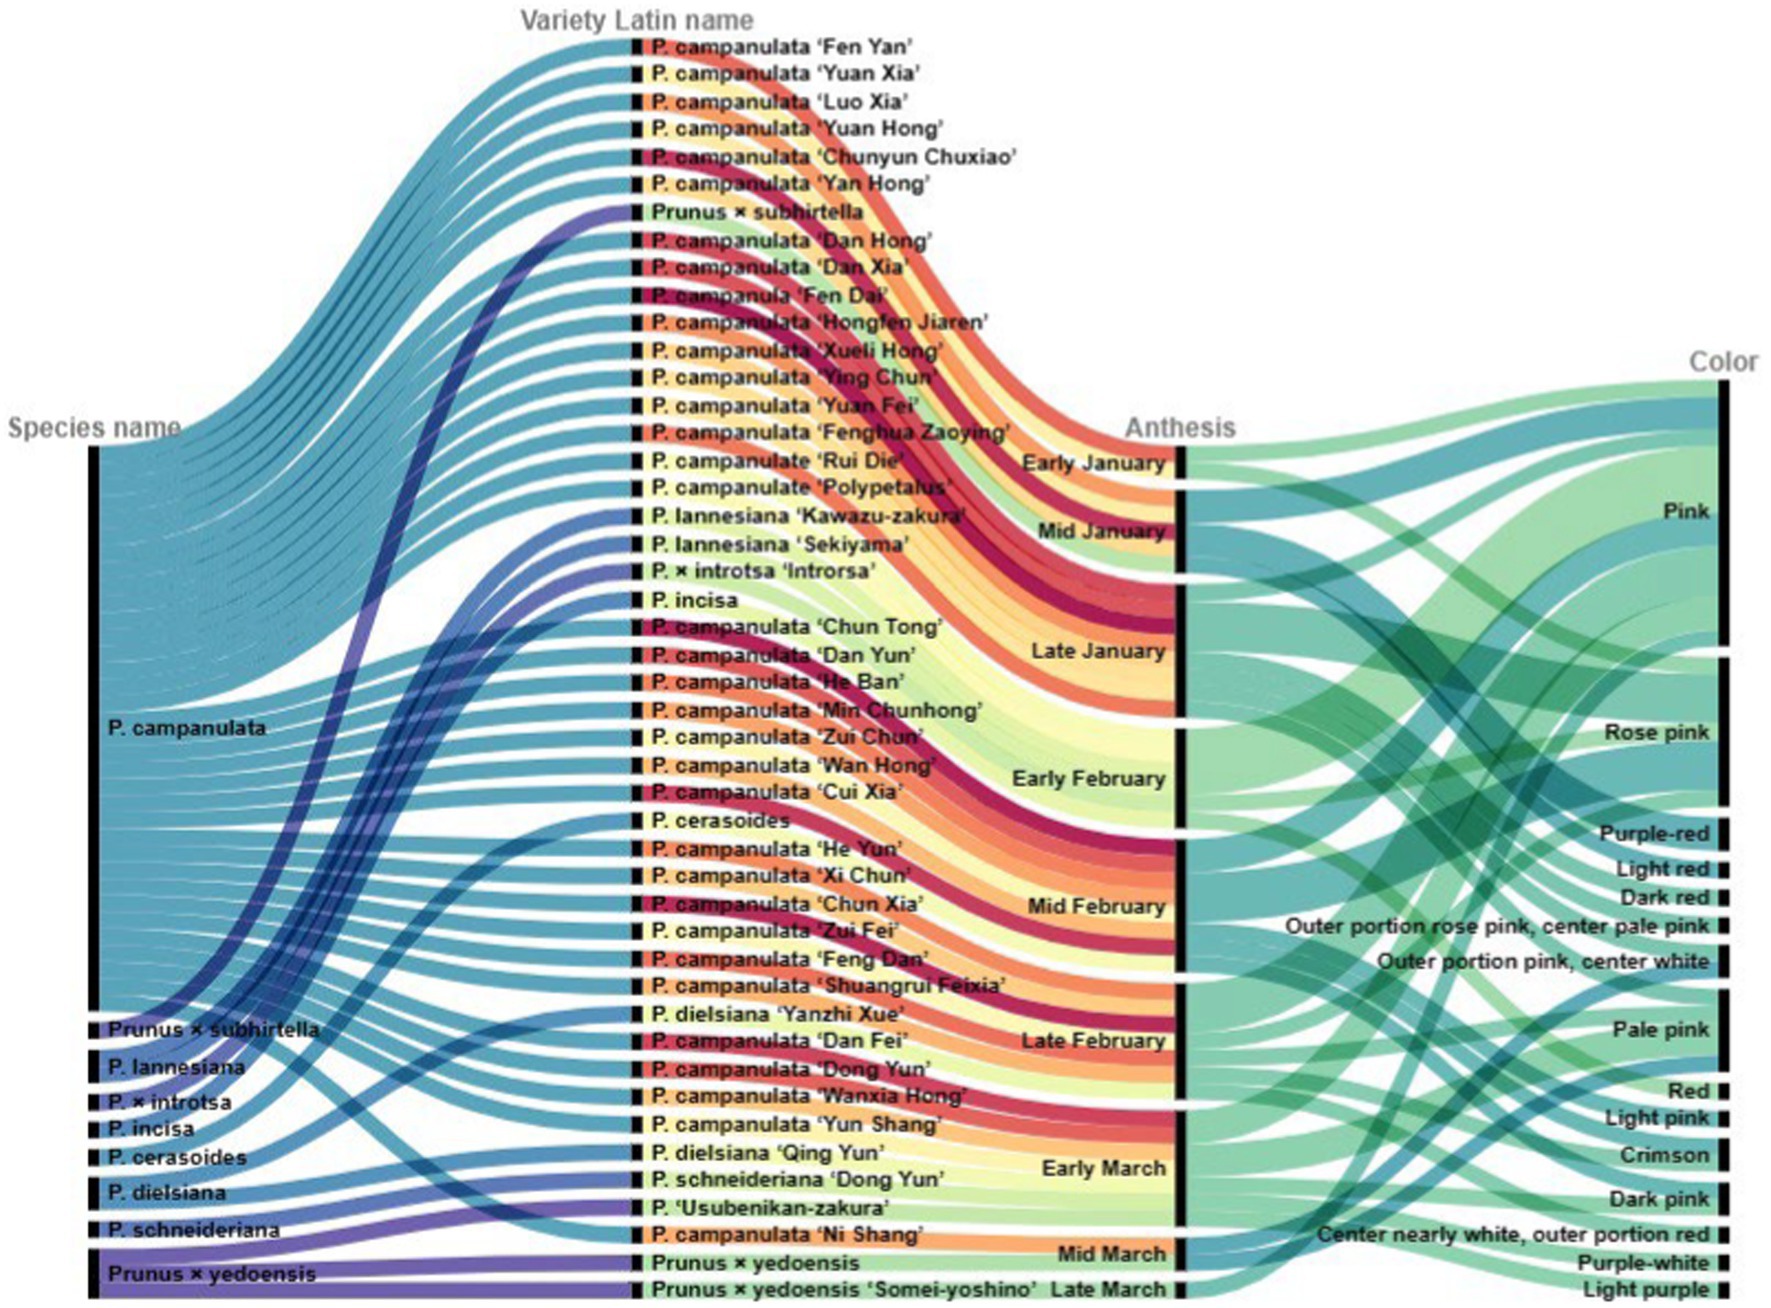
Figure 5. Cherry species, flowering periods and flower colors.
3.1.3 Cherry health status
As indicated in Table 5, 46 cherry species (including varieties) were surveyed in this study. The overall health of the cherries was commendable, exhibiting a normal distribution of healthy levels. Approximately 80.4% of the cherries displayed excellent or good growth, while 8.7% were rated as average. About 10.9% of the cherries were classified as fair or poor. Specifically, 41.3% were in Class I, with the highest score awarded to P. campanulata “Hongfen Jiaren” (4.89). Class II comprised 39.1%, with the highest score achieved by P. schneideriana “Dong Yun” (3.91). Class III accounted for 8.7%, and the top-ranking variety was P. × introtsa “Introrsa” (3.34). Class IV comprised 6.5%, with P. × yedoensis “Somei-yoshino” (2.89) of the cherry health status. Class V constituted 4.4%, with P. lannesiana “Kawazu-zakura” (1.92). Regarding the health status, P. campanulata in Fujian Province demonstrated an excellent condition, with some varieties showing good health, such as P. schneideriana and P. dielsiana. P. × introtsa, P. × subhirtella, P. × yedoensis, and P. cerasoides had an average health condition, while P. lannesiana’s health condition was worse compared to P. × yedoensis.
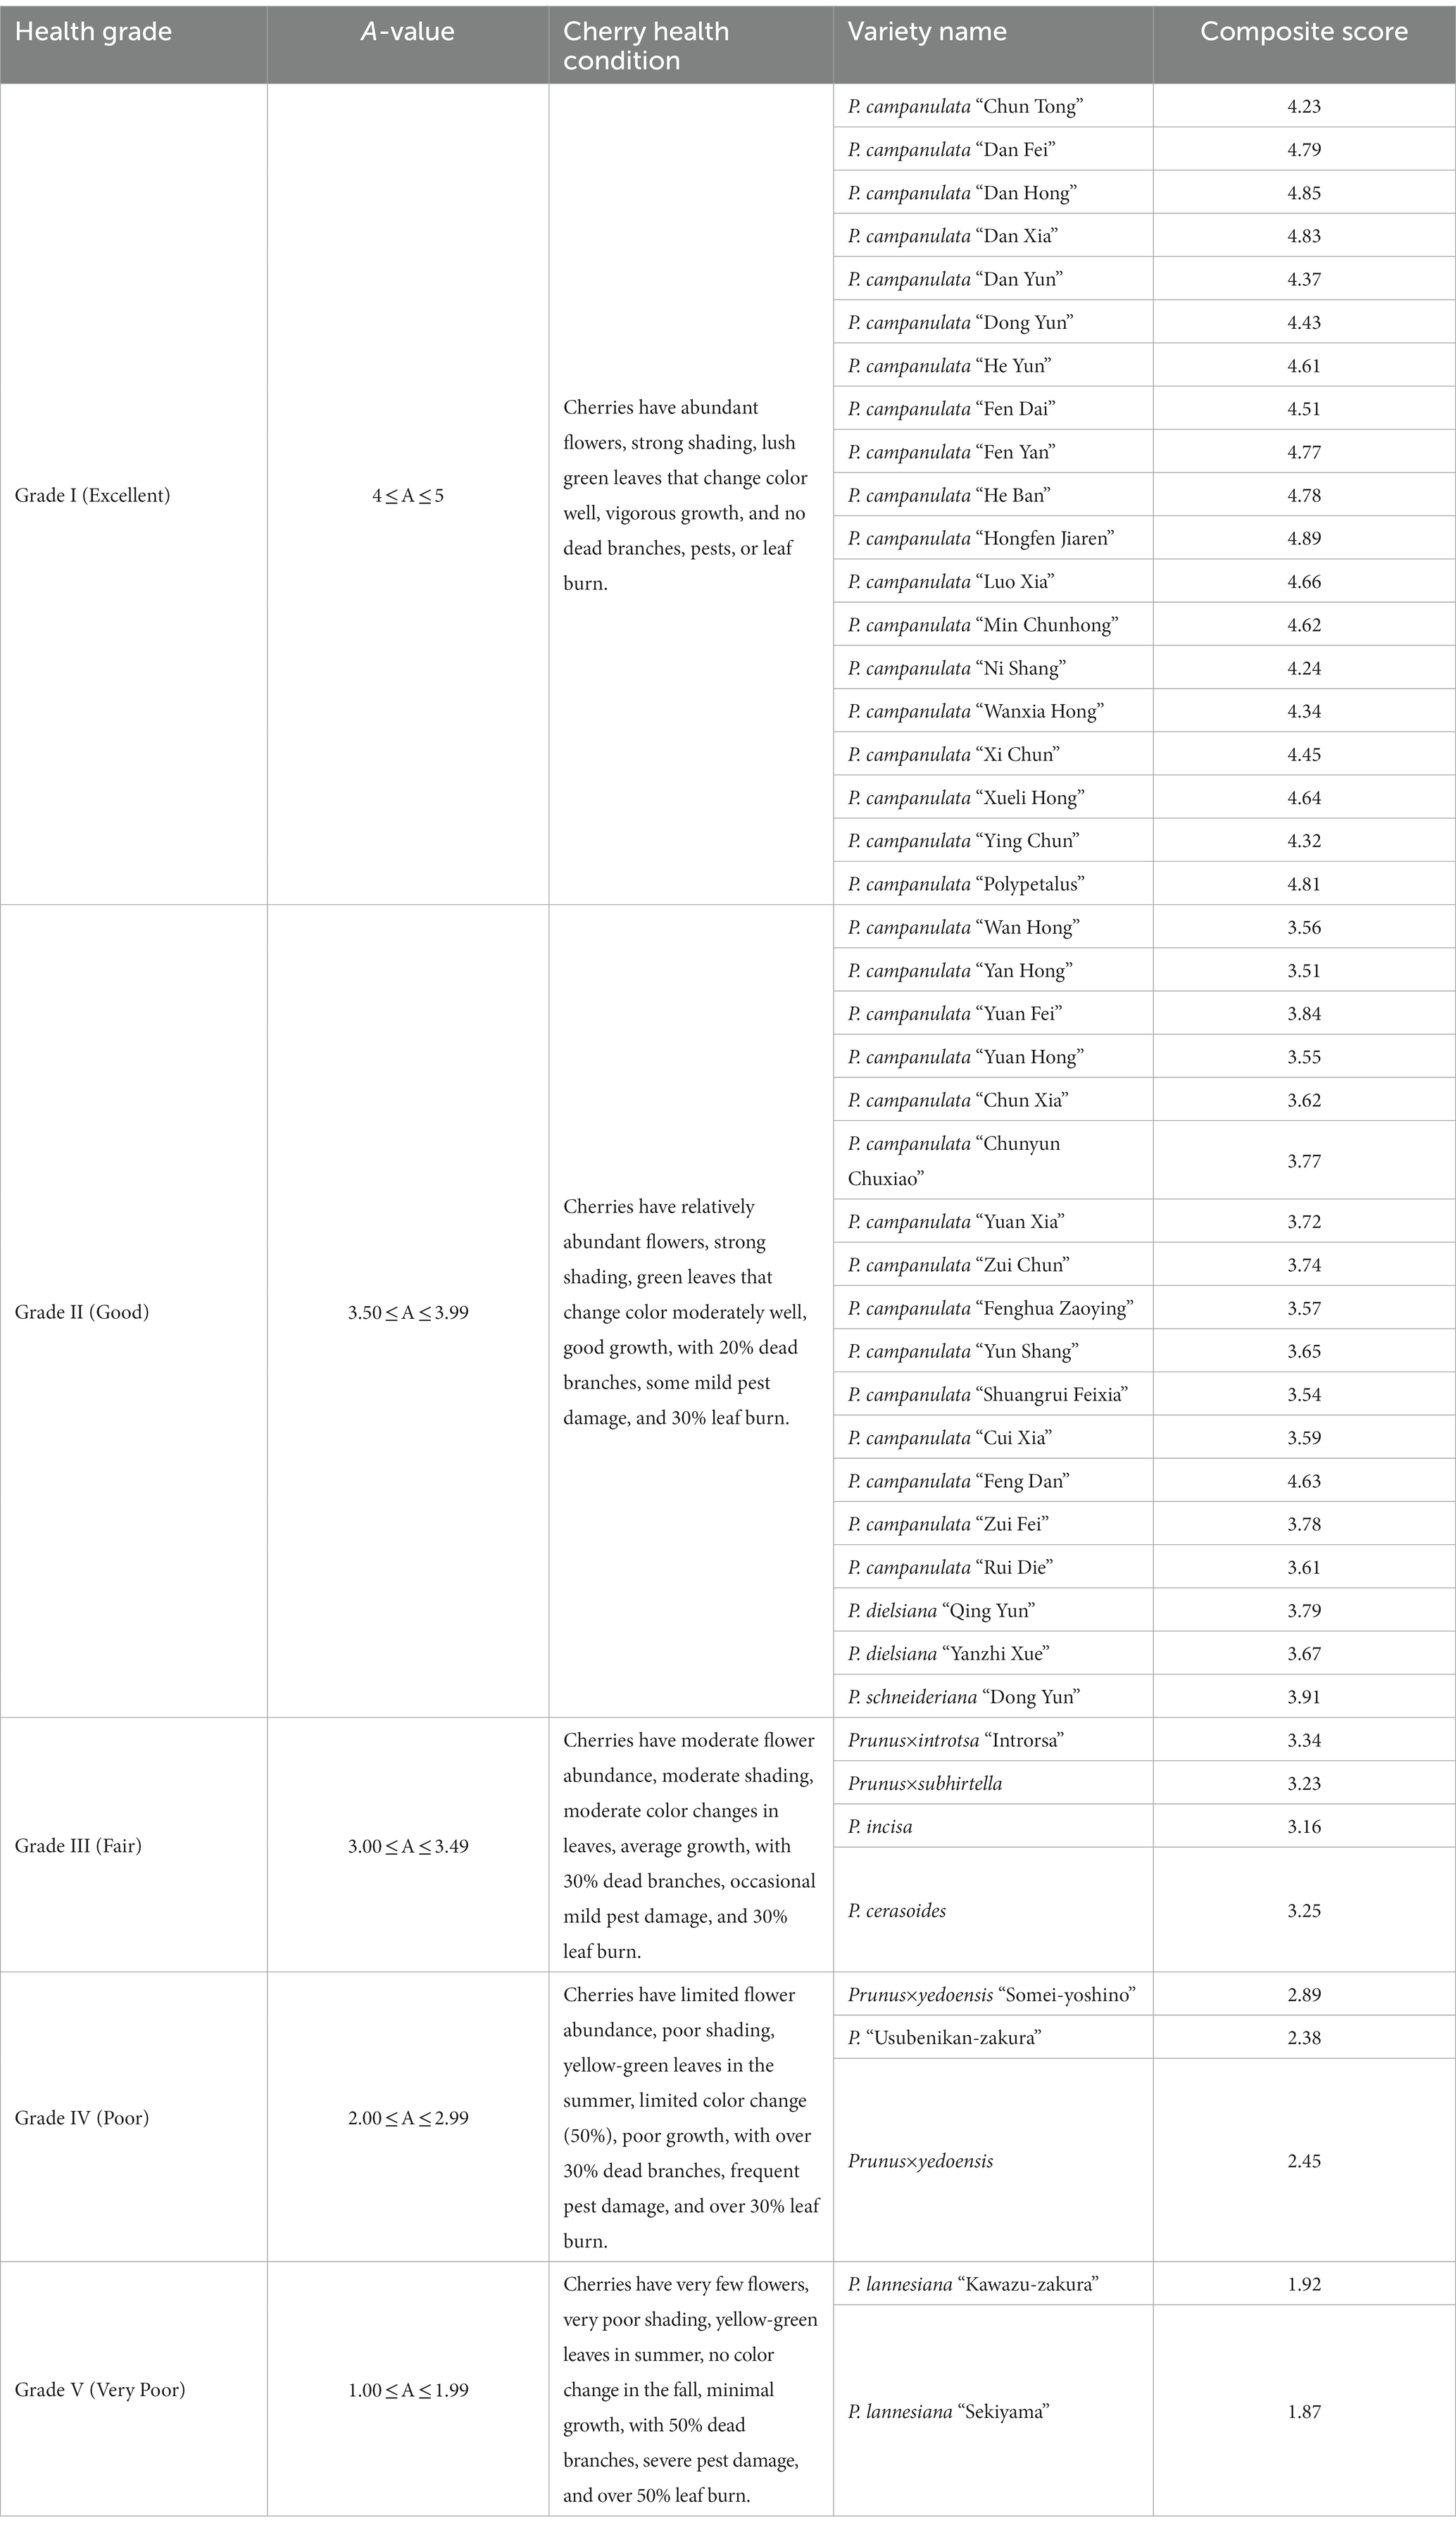
Table 5. Assessment of cherry health grades.
3.2 Marginal benefits of cherry blooming ratio
From a marginal benefit perspective, block planting exhibits two distinct marginal benefits for blooming ratios above 60% and below 15%. Specifically, when the blooming ratio exceeds 60%, increasing the proportion of flowering plants in the cherry blossom landscape significantly enhances the landscape effect. However, increasing the proportion of flowering plants between 15 and 60% does not significantly improve the landscape. On the other hand, when the proportion of flowering plants is below 15%, reducing the proportion has a significant negative impact on the scenic beauty. For linear planting, the boundary effects emerge when the blooming ratio surpasses 30%, indicating that increasing the proportion of flowering plants is beneficial for enhancing the landscape when the blooming ratio is above 30%. Conversely, reducing the proportion of flowering plants has a negative impact on the scenic beauty. Therefore, when employing linear planting, the blooming ratio should be maintained above 30% to achieve a better landscape effect (see Figure 6).

Figure 6. Box plot of marginal benefits of cherry cultivation differences in block planting (A) and linear planting (B).
3.3 Construction and analysis of landscape evaluation models
3.3.1 Construction of landscape evaluation models
After quantifying the landscape elements of different scenes as independent variables and using the public’s ratings of scenic beauty as the dependent variable, partial correlation analysis was conducted using SPSS, progressively removing unrelated elements. A total of seven iterations were carried out. After completing the seventh iteration, the t-test values for all remaining factors were consistently below 0.01, indicating that the remaining landscape elements could be used for scene model construction. Through these seven iterations, five landscape elements were selected: plant color composition, scene tidiness, plant morphology, architecture, and pathways. Using a linear regression model equation, the scenic evaluation model was formulated as follows: Y = 0.12 + 0.201 × 2-1-0.032 × 2-3-0.117 × 6-1 + 0.007 × 6-2 + 0.021 × 6-3 + 0.105 × 8-2 + 0.022 × 11-3-0.031 × 12-1 + 0.114 × 12-3.
The t-test analysis of the partial correlation coefficients for the scenic evaluation model resulted in a p-value of 0.000, less than 0.01, reaching a highly significant level. Hence, this model can serve as a predictive model for the scenic quality of cherry blossom landscapes.
3.3.2 Analysis of landscape evaluation models
Through the analysis of category scores in the landscape evaluation model, it was observed that scene tidiness has the highest contribution to the scenic evaluation of cherry blossom landscapes, accounting for 38.04%. The influence of other landscape elements, in descending order, is as follows: plant color composition (25.59%), pathways (17.79%), plant morphology (12.88%), and architecture (2.70%). Notably, it is worth mentioning that a higher scenic evaluation is associated with a lower plant color composition, suggesting that during the peak flowering period, a more uniform plant color may enhance the overall impact of the blooming plants (Table 6).
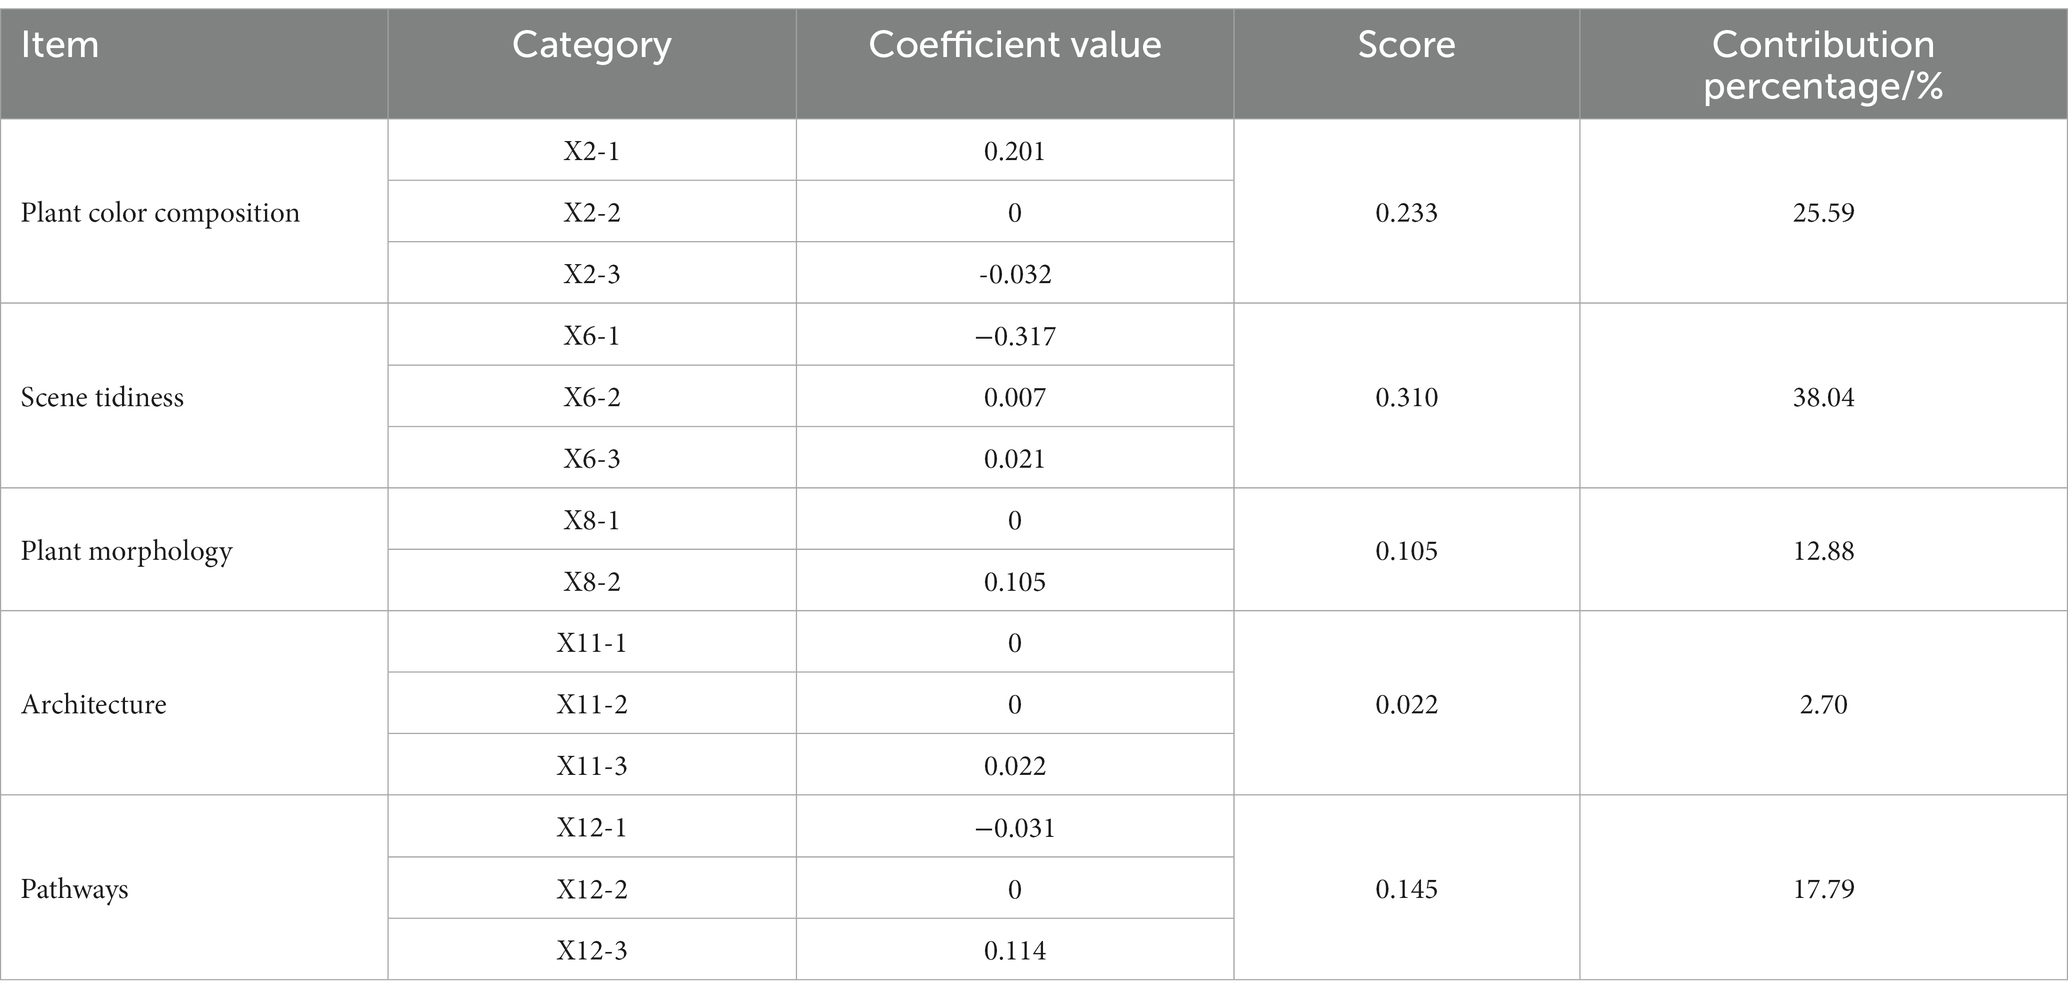
Table 6. Scores for categories in the in-forest landscape evaluation model.
4 Discussion
4.1 Cherry varieties and landscape development
In Fujian Province, a diverse range of cherry varieties exists, with P. campanulata, P. dielsiana and P. schneideriana being the most prominent. The predominant flower color falls within the pink spectrum. This partially aligns with the findings of Wei Yi’s research, suggesting that P. campanulata is well-suited to the climate of Fujian Province and holds broader applications (Wei et al., 2022). Furthermore, these cherries exhibit overall good health, displaying robust growth, and their health grades follow a normal distribution pattern. From a health-grade perspective, the P. campanulata in Fujian Province exhibits excellent health, while certain varieties, such as P. schneideriana, and P. dielsiana are classified as being in good condition. The P. subhirtella, P. introtsa, P. subhirtella, and P. cerasoides are in average condition. This contrasts with the findings of Zhao Shuang’s cherries health assessment at Yuyuantan Park (Zhao et al., 2023). Ye Chaohong’s research indicates that Japanese cherries are often unsuitable for cultivation in high-temperature, high-humidity regions in southern China, leading to various issues such as high mortality rates, poor growth, shortened flowering periods, and increased susceptibility to pests and diseases (Ye et al., 2014). By accommodating cherry growth under extreme conditions and strategically allocating different cherry varieties, the ideal flowering period can extend from late December to late March, approximately 100 days. This extension is nearly double the duration of current cherry blooms, underscoring the significant socioeconomic value of this research (Nie, 2022). This study fills a void in cherry health research in China’s subtropical southeastern coastal regions. It offers theoretical references for the cherry health status in urban areas of other coastal regions.
4.2 Marginal benefits of cherry blooming ratio
When employing block planting, two distinct marginal benefits are observed for cherry blooming ratios: above 60% and below 15%. Increasing the proportion of flowering plants significantly enhances the landscape effect if the blooming ratio within the cherry blossom landscape exceeds 60%. Conversely, if the proportion of flowering plants falls below 15%, reducing the proportion of flowering plants significantly diminishes the aesthetic appeal of the landscape. In the case of linear cherry planting, boundary effects emerge when the blooming ratio exceeds 30%. This implies that when the blooming ratio is above 30%, increasing the proportion of flowering plants enhances the landscape effect, but decreasing the proportion of flowering plants significantly reduces the aesthetic appeal. Therefore, maintaining a blooming ratio above 30% is advisable to achieve a superior landscape effect in the context of linear cherry planting. Marginal benefits are frequently applied in various disciplines, but their utilization in the evaluation of cherry blossom landscape needs to be more reported. Inspired by the principle of diminishing marginal benefits, Shi Zhengtao established a novel index evaluation method and model that analyzed how variations in indicators affect urban water security (Shi et al., 2010). Liu Chang et al., proposed a field water rights allocation method based on irrigation system structure and marginal benefits. This approach ensures that each area of farmland receives the same marginal benefits, thereby better reflecting the fairness of water rights distribution (Liu et al., 2023). In this study, marginal benefits are utilized to analyze the efficacy of cherry cultivation, providing valuable insights for landscape developers. In summary, when planning and designing flat and open areas within cherry blossom landscapes, implementing large-scale planting of the same cherry variety with a blooming ratio exceeding 60% can create breathtaking landscapes. For areas that require linear planting with a consistent display of blossoms over an extended period, arranging different cherry varieties with varying blooming periods is advisable, ensuring that the blooming ratio remains above 30%. This approach guarantees the creation of stunning landscapes with large-scale blooms throughout the cherry blossom season and maintains a continuous display of linearly planted cherry blossom landscapes.
4.3 Construction of a scenic beauty evaluation model
We quantified landscape elements through quantitative methods like image semantic segmentation, forming the basis for constructing a scenic beauty evaluation model. Semantic segmentation, employed in the examination of cherry blossom landscape scenes within images, facilitated the process of pattern analysis. The introduction of image semantic segmentation as an auxiliary technique for quantitative scene analysis provided more objective data support for the scenic quality evaluation model. This research unveils the mechanism of influence between cherry blossom landscapes and public aesthetics. Five landscape elements were chosen: plant color composition, scene tidiness, plant morphology, architecture, and pathways. This aligns with the viewpoint of Li Junyi’s research that visual complexity negatively impacts scenic quality (Li et al., 2022). The slight deviation in opinion regarding the positive influence of plant growth status, plant hierarchy, and paving forms on public aesthetic perception can be attributed to the unique composition of plant colors in cherry blossom landscapes compared to comprehensive green spaces. This study adressed a gap in quantitative research on the construction of landscape elements in cherry blossom landscapes, providing a scientific data reference for the planning and design of these landscapes. The analysis of scenic quality evaluation results underscores the importance of maintaining park tidiness, regular pruning of branches, and ensuring relatively consistent plant colors within the forest during the construction of cherry blossom landscapes to enhance area’s attraction.
4.4 Limitation
The assessment medium could be susceptible to external environmental factors, influencing judgment outcomes. Future research endeavors consider incorporating VR imagery as a visual stimulus for experimental purposes. For example, Chen Ziru conducted a comparative analysis of perceptual differences among participants using panoramic VR evaluation, real world evaluation, and two-dimensional photo evaluation, investigating the advantages and disadvantages of panoramic VR evaluation and its application value in visual landscape assessment (Chen et al., 2021). Furthermore, publicly available models and datasets are typically tailored for semantic segmentation of conventional images. Segmentation accuracy could be further improved by modifying the model’s layer structure or establishing corresponding datasets.
5 Conclusion
In this study, through field investigations and the analysis of the marginal benefits associated with cherry blooming ratios and landscape assessments, we provide objective data references for the planning, designing and managing the cherry blossom landscape. The research reveals that: (1) 46 cherry varieties in the four representative cherry blossom landscapes. (2) The marginal benefit of flake planting with flowering ratio exceeding 60% or falling below 15%, and the marginal benefit of linear cherry blossom landscape with flowering ratio surpassing 30.0%. (3) The results of the scenic beauty model showed that the scene cleanliness (38.04%), plant color composition (25.59%), road (17.79%), plant type (12.88%) and building (2.70%) were the five key factors affecting the scenic beauty. These study outcomes provide objective data reference for future cherry blossom landscape planning, design, and management. This study enriches the research methods for landscape forest evaluation. The related research findings can serve as crucial data support and model simulations for cherry variety selection, cherry blossom landscape construction, determining cherry variety proportions, and enhancing landscape construction, benefiting regions such as Fujian Province and beyond.
Data availability statement
The raw data supporting the conclusions of this article will be made available by the authors, without undue reservation.
Author contributions
HP: Conceptualization, Data curation, Formal analysis, Funding acquisition, Investigation, Methodology, Resources, Software, Supervision, Validation, Visualization, Writing – original draft, Writing – review & editing. PL: Conceptualization, Formal analysis, Investigation, Software, Visualization, Writing – original draft, Writing – review & editing. RZ: Funding acquisition, Project administration, Resources, Supervision, Writing – review & editing.
Funding
The author(s) declare financial support was received for the research, authorship, and/or publication of this article. This research was funded by Ministry of Education’s General Project for Humanities and Social Sciences Research: “Digital preservation and management of modern gardens from a heritage perspective—a case study of Wuxi,” grant number 19YJAZH131.
Conflict of interest
The authors declare that the research was conducted in the absence of any commercial or financial relationships that could be construed as a potential conflict of interest.
Publisher’s note
All claims expressed in this article are solely those of the authors and do not necessarily represent those of their affiliated organizations, or those of the publisher, the editors and the reviewers. Any product that may be evaluated in this article, or claim that may be made by its manufacturer, is not guaranteed or endorsed by the publisher.
References
Bian, J. (2018). Common diseases and insect pests of Japanese cherry in northern Jiangsu and their control. Contemp. Hortic. 2018, 53–54. doi: 10.3969/j.issn.1006-4958.2018.20.045
Bulut, Z., and Yilmaz, H. (2008). Determination of landscape beauties through visual quality assessment method: a case study for Kemaliye (Erzincan/Turkey). Environ. Monit. Assess. 141, 121–129. doi: 10.13248/j.cnki.wetlandsci.2020.03.007
Chen, A. (2022). Analysis on the configuration of cherry gardens—taking the cherry garden of Xiaoling tomb of Ming dynasty as an example. Contemp. Hortic. 45, 126–128. doi: 10.14051/j.cnki.xdyy.2022.05.057
Chen, Z., Fu, W., Zhu, Z., and Dong, J. (2021). Analysis of advantages and disadvantages of panorama presentation technology in landscape visual evaluation. J. Xi’an Univ. Archit. Technol. (Nat. Sci. Ed.) 53, 584–593. doi: 10.15986/j.1006-7930.2021.04.016
Chen, Z., Huang, Y., Shen, Y., Fu, W., Yao, X., Huang, J., et al. (2023). How vegetation colorization design affects urban Forest aesthetic preference and visual attention: an eye-tracking study. Forests 14:1491. doi: 10.3390/f14071491
Chen, Z., Xiao, M., and Chen, X. (2008). Change in flowering dates of japanese cherry (P. yedoensis Mats.) in Wuhan University campus and its relationship with variability of winter temperature. J. Ecol. 40, 5209–5217. doi: 10.3321/j.issn:1000-0933.2008.11.002
Cui, Z., He, M., and Lu, M. (2018). An analysis of green view index in cold Region City: a case study of Harbin. J. Chin. Urban Forest. 5, 34–38. doi: 10.3969/j.issn.1672-4925.2018.05.008
Daniel, T. C., and Boster, R. S. (1976). Measuring landscape esthetics: The scenic beauty estimation method; res. Pap. RM-RP-167; U.S. Department of Agriculture, Forest Service, Rocky Mountain range and Experiment Station: Washington, DC, USA. Doi: http://dx.doi.org/
Garcia-Garcia, A., Orts-Escolano, S., Oprea, S., Villena-Martinez, V., and Garcia-Rodriguez, J. (2017). A review on deep learning techniques applied to semantic segmentation. arXiv 22, 1–23. doi: 10.48550/arXiv.1704.06857
Guan, W., Qiao, W., and Yang, X. (2018). Research on the marginal benefit evaluation of China’s urbanization process. Urban Reg. Plan. Res. 10, 138–150. doi:CNKI:SUN:CQGH.0.2018-04-012
Guo, L. (2019). Research on the scenic beauty evaluation of Yingze Park in Taiyuan based on the SBE method. Shanxi Agric. Univ. doi: 10.27285/d.cnki.gsxnu.2019.000592
Guo, X., and Yang, Y. (2005). Experimental psychology fundamentals. Beijing: Higher Education Press, 1–535.
Han, L., and Ma, C. (2020). Research on the scenic beauty assessment of Riverside parks based on SBE method: a case study of Kunming Riverside Park. Jiangsu Agric. Sci. 48, 137–142. doi: 10.15889/j.issn.1002-1302.2020.10.025
He, C., Ceng, Y., Li, J., Wu, S., and Cao, F. (2022). Practice on understory plant configuration—a project in the cherry blossom section of Nanling botanic garden. J. Green Sci. Technol. 24, 73–75. doi: 10.16663/j.cnki.lskj.2022.03.023
Hong, B. Y. Z. Y. (2021). Semantic segmentation method of road scene based on Deeplabv3+ and attention mechanism. J. Meas. Sci. Instrum. 4, 412–422. doi: 10.1109/IMCEC51613.2021.9482207
Howley, P., Donoghue, C. O., and Hynes, S. (2011). Landscape aesthetics: assessing the general publics’ preferences towards rural landscapes. Landsc. Urban Plan. 104, 66–74.
Howley, P., Donoghue, C. O., and Hynes, S. (2012). Exploring public preferences for traditional farming landscapes. Landsc. Urban Plan. 104, 66–74. doi: 10.1016/j.landurbplan.2011.09.006
Kang, N., Li, S., and Li, F. (2008). A study on the psychological impact of landscape on human beings. Chin. Lands. Archit. 24, 69–72. doi: 10.3969/j.issn.1000-6664.2008.07.020
Li, L., Cai, S., and Liu, W. (2020). Evaluation and estimation of landscape beauty in mangrove forests in Beihai City based on Grey statistical analysis. Wetl. Sci. 18, 313–319. doi: 10.13248/j.cnki.wetlandsci.2020.03.007
Li, J., Huang, Z., Zheng, D., Zhao, Y., Huang, P., Huang, S., et al. (2023). Effect of landscape elements on public psychology in Urban Park waterfront green space: a quantitative study by semantic segmentation. Forests 14:244. doi: 10.3390/f14020244
Li, J., Lin, Y., and Dong, J. (2022). Aesthetic evaluation of urban Riverside green spaces under semantic segmentation technology: a case study of Fuzhou West Lake Park and Zuo Hai Park. Chin. Lands. Archit. 38, 92–97. doi: 10.19775/j.cla.2022.10.0092
Li, S., Wei, J., Zhang, Y., Rong, J., Xu, Y., Zheng, Y., et al. (2014). The effects of drought stress on endogenous hormone in Prunus campanulata maxim. and Prunus yedoensis Matsum. Seedlings. Chin. J. Tropi. Crops 35, 1143–1147. doi: 10.3969/j.issn.1000-2561.2014.06.017
Liu, X. (2012). “Study on the ornamental evaluation of fourteen Cerasus Serrulata cultivars and the application in landscape” in Dissertation for degree of master (Zhejiang A&F University)
Liu, K., Luo, H., and He, T. (2020). Analysis of influencing factors of park waterfront landscape based on scenic beauty evaluation method. Sci. Technol. Eng. 30, 12552–12559. doi: 10.3969/j.issn.1671-1815.2020.30.043
Liu, C., Yan, J., and Zhou, L. (2023). Field water rights allocation method based on irrigation system structure and marginal benefit. People’s Yellow River 45, 16–20. doi: 10.3969/j.issn.1000-1379.2023.08.004
Liu, Y., Zhao, J., and Li, X. (2021). Comprehensive evaluation of plant community landscape in Zhengzhou Longzihu Park based on AHP and SBE methods. J. Northwest A&F Univ. 36, 250–257. doi: 10.3969/j.issn.1001-7461.2021.02.36
Lu, Y., Chen, Z., and Shi, J. (2006). Research advance Prospect and breeding strategy of Prunus campanulata maxim. J. Nanjing Forest. Univ. 2006, 115–118. doi: 10.3969/j.jssn.1000-2006.2006.01.030
Lu, T., Zhao, S., and Lu, Y. (2016). Flowering cherry cultivar resources and the landscape application. In China landscape architecture society. Proceedings of 2016 annual conference of China landscape architecture society. China Architecture & Building Press, 466–474.
Nie, W. (2022). Research on rural Flower Sea tourism development from the perspective of experience economy. Yunnan Normal University.
Peng, Y., Peng, H., Li, C., Guan, B., Chen, H., Zhang, H., et al. (2016). Prunus resources and their exploitation and utilization value. Contemp. Hortic. 23, 43–45. doi: 10.14051/j.cnki.xdyy.2016.23.026
Schirpke, U., Tasser, E., and Tappeiner, U. (2013). Predicting scenic beauty of mountain regions. Landsc. Urban Plan. 111, 1, 1–12. doi: 10.1016/j.landurbplan.2012.11.010
Shi, Z., Liu, X., and Huang, Y. (2010). Urban water security assessment method based on the principle of diminishing marginal benefits. J. Hydraul. Eng. 41, 545–552. doi: 10.13243/j.cnki.slxb.2010.05.010
Shu, S., Xiao, M., and Chen, Z. (2018). A method for forecasting first-flowering dates of cherries. J. Ecol. 38, 405–411. doi: 10.5846/stxb201610122065
Sun, Y., Li, J., and Zhao, S. (2022). Application screening and evaluation of cherry varieties in Beijing Yuyuantan Park. J. Beijing Agric. Coll. 36, 63–70. doi: 10.19444/j.cnki.1671-7252.2022.01.010
Tan, J., Chen, Z., and Xiao, M. (2021). Characteristics and forecast of flowering duration of cherries in Wuhan University. J. Ecol. 41, 38–47. doi: 10.5846/stxb201909241996
Tan, S., and Li, J. (2009). Restoration and stress relief benefits of Urban Park and green space. Chin. Landsc. Archit. 25, 79–82. doi: 10.3969/j.issn.1000-6664.2009.06.020
Wang, X., Gao, X., and Liang, Y. (2020). Quantitative study of waterside plant landscape based on SBE analysis: a case study of Nanjing Waterside Park. Chinese Landsc. Archi. 36, 122–126. doi: 10.19775/j.cla.2020.05.0122
Wei, Y., Wang, L., and Lin, R. (2022). Resources and landscape applications of mountain cherry varieties in Fujian. Southeast Hortic. 10, 389–393. doi: 10.20023/j.cnki.2095-5774.2022.05.016
Weng, S., Zhu, J., and Su, Z. (2017). Evaluation of plant landscape quality in waterside green spaces in the Lingnan region. For. Sci. 53, 20–27. doi: 10.11707/j.1001-7488.20170103
Xia, D., and Wang, Y. (2022). Application of analytic hierarchy process in the selection of cut flower plants for garden flowers. Contemp. Hortic. 12, 198–200. doi: 10.14051/j.cnki.xdyy.2022.12.057
Ye, C., Chen, J., and Hu, X. (2014). Suitable cherry varieties in Guangdong and their landscape applications. Guangdong Landsc. 36, 59–61. doi: 10.3969/j.issn.1671-2641.2014.05.021
Zhang, Y., Yang, M., and Zhou, Y. (2020). Visible street space analysis based on geo-tagged panoramic images. J. Wu Han Univ. Technol. 12, 70–78.
Zhao, S., Liu, Z., Yin, Z., Zhou, Y., and Wang, X. (2023). On health level evaluation of Cersus in Beijing Yuyuantan Park. J. Beijing Univ. Agric. 2, 99–104. doi: 10.13473/j.cnki.issn.1002-3186.2023.0218
Keywords: cherry blossom landscape, cherry varieties, marginal benefit, scenic beauty assessment, semantic segmentation
Citation: Peng H, Li P and Zhu R (2024) Enhancing the sustainability of cherry blossom landscapes-a case study in Fujian Province, China. Front. For. Glob. Change. 7:1339603. doi: 10.3389/ffgc.2024.1339603
Edited by:
Jinda Qi, National University of Singapore, SingaporeReviewed by:
Sagheer Ahmad, Guangdong Academy of Agricultural Sciences, ChinaMengmeng Gu, Colorado State University, United States
Copyright © 2024 Peng, Li and Zhu. This is an open-access article distributed under the terms of the Creative Commons Attribution License (CC BY). The use, distribution or reproduction in other forums is permitted, provided the original author(s) and the copyright owner(s) are credited and that the original publication in this journal is cited, in accordance with accepted academic practice. No use, distribution or reproduction is permitted which does not comply with these terms.
*Correspondence: Rong Zhu, emh1cm9uZ3NldUBmb3htYWlsLmNvbQ==