 Stanley Anak Suab1
 Hitesh Supe1Albertus Stephanus Louw1
 Alexius Korom2
 Mohd Rashid Mohd Rakib3
 Yong Bin Wong4
 Ricky Anak Kemarau5
 Ram Avtar6*
- 1Graduate School of Environmental Science, Hokkaido University, Sapporo, Japan
- 2Faculty of Plantation and Agrotechnology, Universiti Teknologi MARA (UiTM) Sabah Branch, Kota Kinabalu, Malaysia
- 3Faculty of Sustainable Agriculture, Universiti Malaysia Sabah, Sandakan, Malaysia
- 4Faculty of Geo-information Science and Earth Observation, University of Twente, Enschede, Netherlands
- 5Earth Observation Centre, Institute of Climate Change, Universiti Kebangsaan Malaysia, Bangi, Malaysia
- 6Faculty of Environmental Science, Hokkaido University, Sapporo, Japan
The assessment of environmental sustainability is of utmost importance for the forests and plantations in Borneo, given the critical need for environmental protection through the identification and mitigation of potential risks. This study was conducted to assess the environmental sustainability of tropical forest and plantations landscape, a case study in northern Sabah, Malaysian Borneo. Applications of the latest high-resolution multi-sensor remote sensing and geospatial MCDA are cost-effective and useful for large-scale environmental sustainability assessment. The land use land cover (LULC) of the study area was mapped with synergistic use of Sentinel-1 Synthetic Aperture Radar (SAR) and Sentinel-2 optical and high-resolution PlanetScope satellite imageries, resulting in overall accuracy of 87.24%. Five sustainability indicator layers: slope erosion protection, river buffer, landscape connectivity and quality, high conservation value (HCV), and water turbidity were developed from the LULC map, ancillary datasets of SRTM, and forest operation basemap with reference to standards from the Environment Protection Department (EPD), Roundtable on Sustainable Palm Oil (RSPO), and Forest Management Plan (FMP) for the analysis using multi-criteria decision analysis (MCDA) model. The results revealed that overall, the study areas are in the high sustainability category at 61%, medium at 31%, and low at only 8%. We analyzed the environmental sustainability of five land use boundaries, and the results showed that Industrial Tree Plantations (ITP) and Village Reserve are mostly in the high category. Meanwhile, oil palm plantations, rubber plantations, and forest reserve (FR) are the majority in the medium category. Both oil palm and rubber plantations are a majority in the medium class due to monocropping land use type having low landscape connectivity and quality individual sustainability indicator layer. The study presented the concept of use of multi-sensor remote sensing for LULC mapping with geospatial MCDA for environmental sustainability assessment useful to stakeholders for improving the management plan also contributing toward the progress of achieving UNSDGs and addressing REDD+.
1 Introduction
Sustainably well-managed tropical forests and plantations ensure the balance between socioeconomic benefits and maintaining landscape ecosystems. This is particularly important for Borneo, a region with extensive and biodiverse tropical forests, but also widespread Industrial Tree Plantations (ITPs) and agri-plantations, such as oil palm and rubber, that play an important socioeconomic role for the region (Bryan et al., 2013). The forest and plantation landscape in Borneo has become highly fragmented and is currently the focus of numerous biodiversity conservation initiatives (Anderson et al., 2022). Risk to biodiversity and forest fragmentation is particularly pronounced in the Borneo lowlands and Sabah (Ocampo-Peñuela et al., 2020; Anderson et al., 2022), with oil palm plantations accounting for 26.6% of Sabah’s land cover in 2022 (MPOB, 2022). The conversion of tropical rainforests into oil palm plantations is the primary environmental impact of the industry (Murphy et al., 2021). On the other hand, the Industrial Tree Plantations (ITPs) and oil palm and agriculture sectors contribute significant income to the local economy of Sabah. It was reported in 2022 that oil palm, the largest agricultural sub-sector, contributed 9.6% out of the total MYR12.5 billion (Approx. USD2.6 billion) agricultural sector to the state’s GDP and is thus considered vital to regional economic and socioeconomic development (Bernama, 2023). This highlights the need for the management of forests and industrial plantations in a way that both protects natural assets and ecosystems and ensures economic development and stable livelihoods for local communities. In light of the issue of sustainable management of tropical forests and plantations in Borneo, the applications of multi-sensor remote sensing techniques and geospatial techniques provide a cost-effective way of large-scale environmental monitoring and assessment (Ocampo-Peñuela et al., 2020). The commitment to responsible and sustainable management of forests and plantations stretches into the distant future, when the assessment must be done in a timely manner. This is to aid in identifying high-risk areas, preventing environmental degradation, and providing the necessary insights for replanting or restoration efforts. Sustainability assessment is crucial for addressing REDD+, UNSDG initiatives, certification purposes, and transparency issues related to traceability, measurable outcomes, and mitigation strategies to minimize the adverse impacts of plantations (Avtar et al., 2013; Biswas et al., 2020).
Sustainability assessment (SA) is important for oil palm, ITP, and other agricultural activities in Borneo for several reasons. First, environmental protection and sustainability assessment help to identify and mitigate the negative impacts of LULC changes, such as habitat loss, deforestation, and greenhouse gas emissions (Murphy et al., 2021; Hanafiah et al., 2022). Second, sustainability assessment is important for biodiversity conservation. It helps to identify and preserve high conservation value (HCV), such as riparian zones, and to promote sustainable land management practices that support biodiversity conservation (Dickson and Ong-Abdullah, 2022). The third reason is that sustainability helps to ensure that LULC changes are socially and economically sustainable by promoting good practices that support smallholders and sustainable livelihoods. In addition, sustainability assessment is a requirement necessary for certification schemes such as RSPO, FSC, and MTCC. Sustainability indicators are used to assess the sustainability of LULC and to monitor progress toward achieving the United Nations Sustainability Goals (UNSDG). SA studies can support the achievement of several UNSDGs, particularly Goal 15: Life on land. This goal aims to protect, restore, and promote sustainable use of terrestrial ecosystems, sustainably manage forests, combat desertification, halt and reverse land degradation, and halt biodiversity losses. By providing evidence-based insights, this study can directly contribute to the realization of this critical environmental sustainability objective, which helps identify strategies toward improving conservation and sustainable land management (United Nations (UN), 2023). SA also to meet UNSDG goal 9 “build resilient infrastructure, promote inclusive and sustainable industrialization and foster innovation. This study can contribute to this goal by promoting the use of multi-sensor remote sensing techniques and geospatial MCDA for sustainable forest and plantation management in Borneo (D’Adamo and Gastaldi, 2022).
The multi-sensor remote sensing technique involves using multiple sources of remotely sensed imageries to improve the accuracy and reliability of LULC mapping. The technique offers several advantages over using single-source data for mapping tropical forest and plantation landscapes. First, it enables the integration of data with diverse spatial, spectral, and temporal resolutions, thus allowing for a more comprehensive and detailed characterization of the land surface (Srivastava and Gupta, 2003). Additionally, the use of multi-sensor data can enhance the capacity to monitor LULC changes over time, providing a complete providing a complete understanding of landscape dynamics (Roy and Inamdar, 2019). Furthermore, a combination of data from different sensors can improve the accuracy of LULC mapping, particularly in tropical forests and plantations with complex and heterogeneous land cover (Nguyen et al., 2020). The technique also supports identifying and characterizing specific land cover types and differentiations of forest types or agricultural crops by leveraging the unique capabilities of individual sensors (Nguyen and Henebry, 2019). Overall, the multi-sensor remote sensing technique offers a powerful and flexible tool for LULC mapping in tropical forest and plantation landscapes, enabling more accurate, detailed, and timely information for environmental monitoring, assessment, and land management applications (Zhu et al., 2022).
Multi-criteria decision analysis (MCDA) is a decision-making approach that aids in formally structuring complex decisions and evaluating multiple often conflicting criteria (Greene et al., 2011). In the context of geospatial studies, MCDA is used to assess environmental sustainability by integrating various criteria and spatial data to support decision-making related to LULC and, in this study, in tropical forest and plantation landscapes. This approach allows decision-makers to consider and balance multiple factors, such as topography, LULC type, and ecological and social significance values, when evaluating different land use options (Mohamadzadeh et al., 2020). MCDA in geospatial studies involves integrating geospatial data and value judgments to solve spatial problems. By combining spatial data with qualitative and quantitative criteria, MCDA can provide a comprehensive framework for assessing the environmental sustainability of land use options in tropical forests and plantations (Cammerino et al., 2023; Mopan et al., 2023). This approach enables the consideration of diverse factors such as biodiversity, slope and soil protection, water quality, and landscape connectivity in the decision-making process, ultimately supporting the identification of land use strategies that are more environmentally sustainable.
The use of MCDA in geospatial studies is supported by various literature that demonstrate its application in different environmental contexts. For example, Chen (2014) used MCDA for land use suitability assessment, where the results provided valuable inputs for policy and decision makers on urban extensions. Another study by Yalcin (2020) presented a GIS-MCDA-based model for determining glacier vulnerability. These examples illustrate the versatility of MCDA in addressing diverse environmental challenges, including those related to LULC in tropical forest and plantation landscapes. By integrating spatial data and multiple criteria, MCDA supports more informed decision-making and can help identify land use options that are more environmentally sustainable.
In this study, we utilized high-resolution Sentinel-1 (S1) C-band Synthetic Aperture Radar (SAR), Sentinel-2 (S2) Multi-spectral, and PlanetScope satellite imageries for the LULC mapping. Using S1, S2, and PlanetScope for LULC mapping offers several advantages over traditional sensors such as Landsat. S-1 SAR is particularly useful in areas with frequent cloud cover, such as tropical regions like Borneo, as it can penetrate clouds and shadow covers in day or night operations (Ohki and Shimada, 2018; Ngo et al., 2020; Robertson et al., 2020). Additionally, SAR is sensitive to the structure, geometry, and dielectric properties of forests and plantations, thus providing useful information complementing optical data (Musthafa et al., 2020; Priyanka et al., 2023). S-2 and PlanetScope, on the other hand, provide high-resolution optical imagery that is useful for differentiating between different types of LULC, such as different tree species in a forest and different crop types in the plantations (Dagne et al., 2023). The combination of these two sensors allows for a more comprehensive understanding of LULC in tropical regions, as the strengths of one sensor can compensate for the weakness of the other. This led to more accurate and detailed LULC maps, which are crucial for effective and sustainable land use management.
In the context of this study, the application of MCDA to assess the environmental sustainability of the tropical forests and plantations landscape in Borneo was proposed. MCDA is a basic scientific decision-making method that combines multiple criteria to evaluate and rank different best alternatives or scenarios in order of preference (Yuan et al., 2022). Multi-criteria decision analysis (MCDA) is one ‘decision-aid’ or evaluation framework that is frequently used for forest management (Acosta and Corral, 2017) and other natural resource management applications (Herath and Prato, 2006). This study aims to assess the environmental sustainability of tropical forests and plantations in Borneo using multi-sensor remote sensing techniques and a geospatial MCDA model. Meanwhile, the specific objectives of this study are as follows:
i. To map the current LULC extent of the study area and produce sustainability indicators based on existing literature and standard guidelines.
ii. Assess and evaluate the environmental sustainability of the study area landscape using Multi-Criteria Decision Analysis (MCDA) model.
iii. To highlight the benefits of using multi-sensors and the effectiveness of using multi-sensor and MCDA for environmental sustainability assessment in improving sustainable management of tropical forests and plantations in the study area.
The findings of the study will provide spatially explicit insights into the environmental sustainability of tropical forests and plantations in the study area. This information is an important input for decision-making and planning for biodiversity conservation efforts and sustainable management of natural resources in the study area and Borneo region in general. Additionally, the results will provide a model for assessing the environmental sustainability of other forest-plantation landscapes using multi-sensor remote sensing and geospatial MCDA techniques, which may also be extended for use in other tropical regions or case studies.
2 Materials and methods
2.1 Study area
The study area is situated in the northern part of Sabah state in Borneo. The study area encompasses the Bengkoka Peninsula, Malawali Island, and part of Banggi Island, as depicted in Figure 1. The area of interest spans from approximately between latitude 6° 44′ 2.23” N and 7° 19′ 19.53” N and longitude 116° 58′ 37.59″ E and 117° 22′ 34.98″ E. The terrain varies from coastal plains to undulating and hilly areas with some steep slopes. The elevation ranges from sea level up to approximately 221 meters at the center of the study area. The primary geological formation is the Bogaya formation, primarily composed of sandstone and mudstone (Felix, 1991). The climate is tropical, with average mean surface temperatures consistently approximately 26.9°C to 28.5°C and a high mean annual precipitation of 3,085 mm per year (World Bank Group and Asian Development Bank, 2021).

Figure 1. (A) Map overview of the study area location in Northern Sabah, Malaysian Borneo, and (B) map showing the Area of Interest (AOI) with Sentinel-2 and PlanetScope fused high-resolution satellite composite (Acquired in April 2023).
The landscapes land use and land cover (LULC) in the study area encompasses a variety of features, including mangrove forests, nipah mangroves, mixed forests with smallholder rubber plantations and crop patches, orchards, secondary growth forests, Industrial Tree Plantations (ITPs), predominantly fast-growing Acacia mangium and Eucalyptus pellita, wild Acacia, oil palm plantations, and rubber plantations and villages. The ITPs were established in the early 1980s as part of a reforestation, afforestation, and resettlement initiative led by the Sabah Government in collaboration with the Sabah Forestry Department and supported by the World Bank (JICA, 1984). Acacia mangium is a preferred species in ITP due to its fast growth and flexibility in growing on poor and degraded soil (Hon and Shibata, 1970). Acacia is harvestable after 7 years with a high survival rate of 50–60% and yield volume between 150 and 170 m3 ha-1 (Lee, 2018). In 2002, approximately 72% (106,581 hectares) of fast-growing tree species planted in Sabah were Acacia mangium (Abe et al., 2005). The forests consist of mixed patches of lowland natural tropical forest, secondary forest, mangrove, and nipah. At the same time, the major plantations in the study area are oil palm, rubber plantations, and Industrial Tree Plantation (ITP).
2.2 Dataset and processing
Two categories of datasets used for the LULC mapping and to produce the sustainability indicators were a multi-sensor combination of S-1, S-2, PlanetScope, an ancillary dataset of SRTM, and a forest operation base map. The data used are summarized in Table 1. All satellite data were acquired in April 2023, and the ancillary dataset of SRTM updated version 3 with 30-meter resolutions was released in 2015 (NASA, n.d.), while the forest operations base map was updated in 2021.
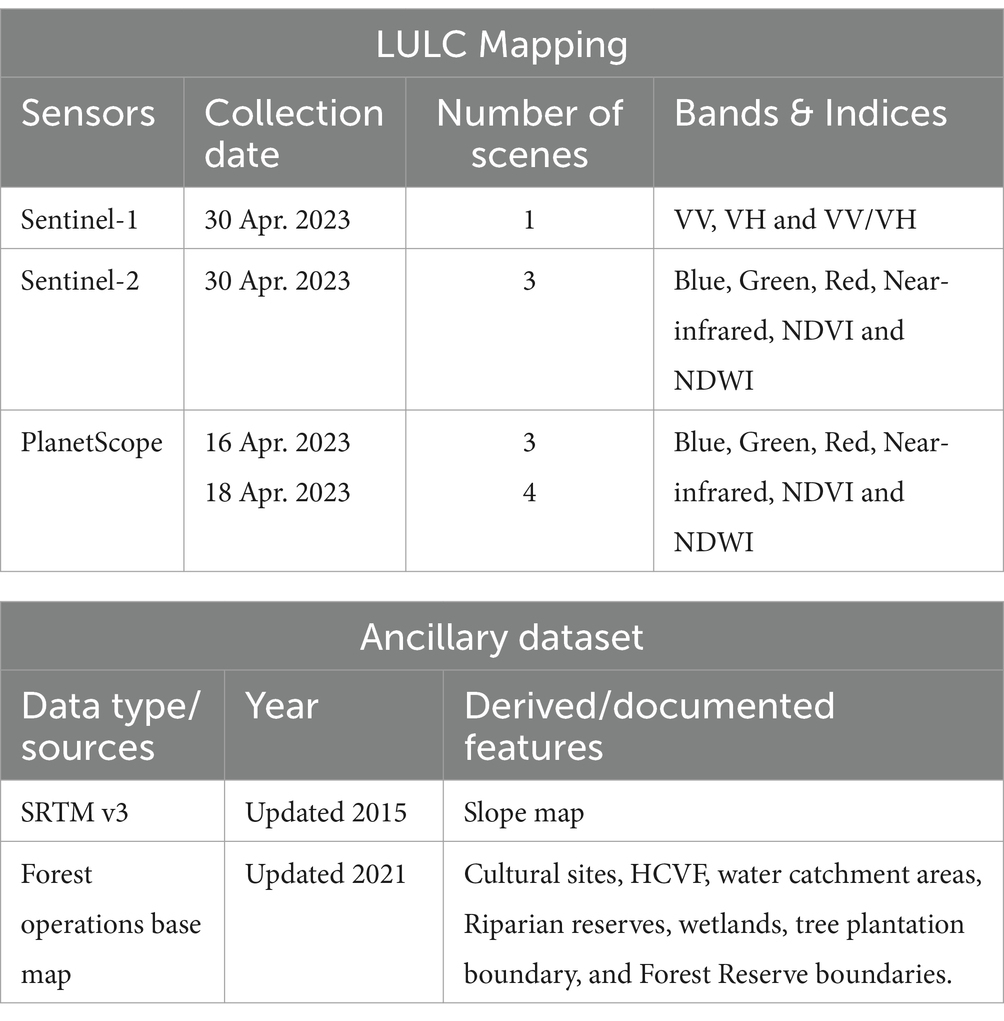
Table 1. Summary of the dataset used in this study, which consists of data for LULC mapping and ancillary dataset.
The S-1 SAR Ground Range Detected (GRD) Vertical transmit and return (VV), Vertical transmit and Horizontal return (VH), and ratio of VV/VH were acquired on 30th April 2023. S-2 GRD product is focused SAR data that has been detected, multi-looked, and projected to the ground range using the Earth ellipsoid model (sentinels.copernicus.eu). The S-1 SAR GRD data are widely used for LULC mapping. Three scenes of S-2 Surface Reflectance (SR) Harmonized imageries were acquired on 30th April 2023, and sets of PlanetScope (16th April 2023, 3 scenes and 18th April 2023, 4 scenes) were used for the LULC mapping. The very high-resolution PlanetScope imageries were resampled from 3 m resolution to 10 m according to S-2 for the data fusion. The S-2 and PlanetScope bands consist of blue (B), green (G), red (R), and near-infrared (NiR).
Meanwhile, SRTM v3 was used to produce the slope map of the study area. The forest operation base map was obtained from the forest management company which was updated in 2021. Various geospatial features, such as cultural sites, HCVForest, water catchment area, riparian reserves, wetlands, ITP, village reserve, and forest reserve boundaries, are also extracted from this base map. All of the features mentioned within the ITP were officially demarcated on the ground and documented in the Forest Management Plan (FMP) and map based on the EPD guidelines.
2.3 Land use and land cover mapping
In the LULC mapping, we fused Sentinel-2 (S2) imagery with PlanetScope imageries. Before the fusion, several required preprocessing steps were performed. First, radiometric correction to align the number of bands; second, spatial resolution; and third, radiometric resolution. Notably, the S2 value ranges from 0 to 3,000 and PlanetScope values are higher, necessitating the adjustment of PlanetScope values to range 0–1 by dividing by the highest value, 99.98% percentile. This preprocessing step ensured compatibility and effective fusion of the two datasets for accurate LULC mapping. Subsequently, cloud and shadow-covered areas were masked in the S-2 composite and fused with the PlanetScope composite imagery. Several vegetation indices layers were generated, namely NDVI, NDWI, and NDTI, as summarized in Table 2, to assist in the classification. The training data for the classification of the respective 14 LULC classes were sampled from the high-resolution Google Earth imagery and based on field visits to the study area. LULC classification was performed using a Statistical Machine Intelligence and Learning Engine (SMILE) Random Forest (RF) machine-learning algorithm implemented within the Google Earth Engine (GEE) cloud computing platform (Google, n.d.). In the training dataset, all variable bands (B, G, R, NIR, NDVI, NDWI, VV, VH, and VV/VH) were used in the classification. The previous study (Qu et al., 2021) found that the use of auxiliary datasets can improve the accuracy of LULC classification. The accuracy assessment was conducted using a total of 2,382 sample points, which included 200 ground reference points collected using handheld GPS during field visits, and the remaining sample points derived from high-resolution Google earth imagery. Validation was performed by comparing the reference points with the classification results through a confusion matrix in Supplementary material, ensuring a thorough and robust method to assess the reliability of the classification result.
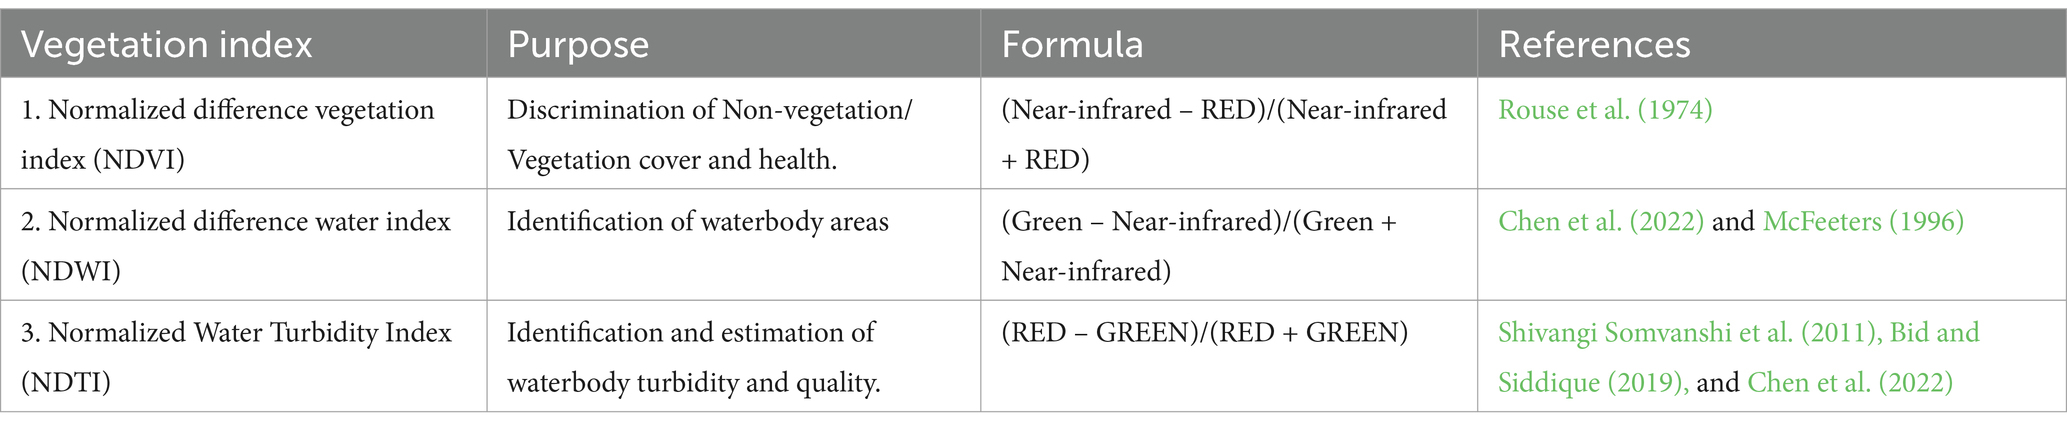
Table 2. Indices used in this study.
2.4 Spatial multi-criteria decision analysis sustainability analysis
To gage the environmental sustainability of the study area, criteria and indicators that encompass important aspects, such as slope erosion, riparian reserves, landscape connectivity and quality, high conservation value (HCV), and water turbidity, was established based on the references’ standard of Environmental Protection Department (EPD) Sabah, Forest Management Plan (FMP), and Roundtable on Sustainable Palm Oil (RSPO). In this study, sustainability is categorized into scores of low, medium, and high corresponding to the LULC layers, as summarized in Table 3.
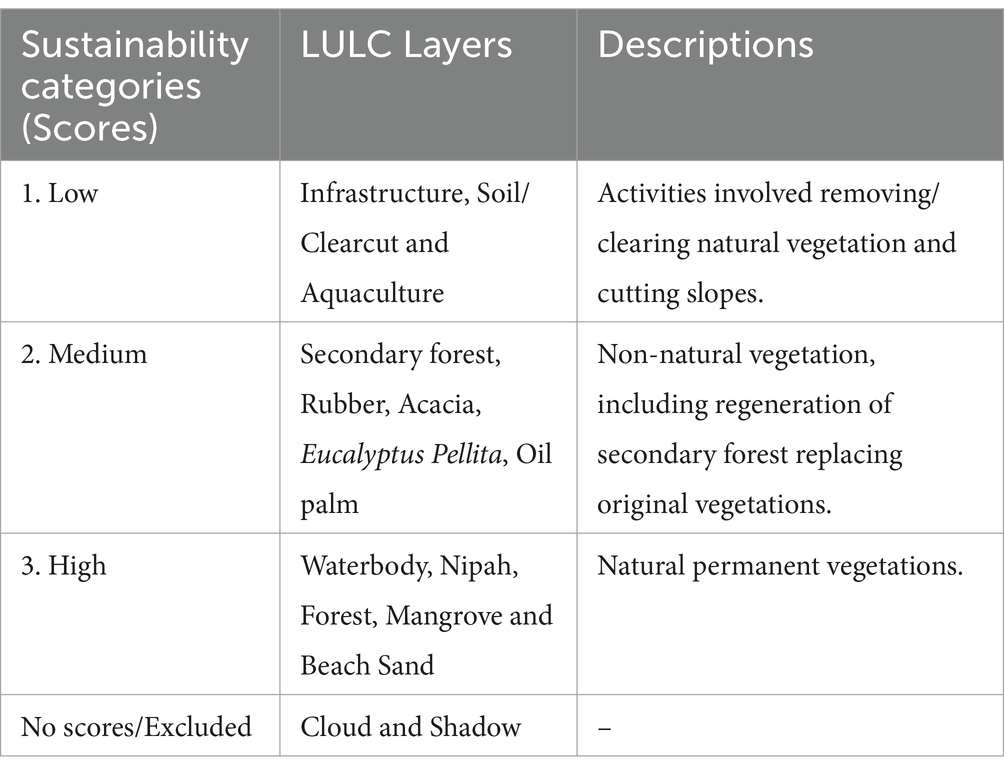
Table 3. LULC sustainability categories weightage (Scores).
The methodology of this study is based on the spatial structure of the Multi-Criteria Decision Analysis (MCDA), and it consists of procedures involving sharing of geographic data and preferences according to specified rules (Malczewski, 1999). The main advantage of the integration of GIS and MCDA is to have unique capabilities that complement each other (Gigović et al., 2018). This multi-criteria decision analysis (MCDA) model integrates the capabilities of geographic information systems (GIS) in data storage, manipulation, management, analysis, and visualization with MCDA procedures, techniques, and algorithms. This integration enables the structuring of decision problems, evaluation of decision alternatives, and assessment of environmental sustainability. The MCDA procedure employed in this study is illustrated in detail in Figure 2.

Figure 2. Detailed workflow of the indicators weighted overlay analysis of the MCDA model for producing the sustainability index maps.
The workflow of sustainability analysis in this study is illustrated in Figure 3. It starts by defining the research problem as outlined in the introduction, followed by the objective and the architecture of the MCDA model. Continue with the identifications of sustainability evaluation indicators and criteria, in this case, sustainability category scores, as described in Tables 3, 4. Then, the second phase is the geospatial data preparation, where all the indicator layers are mapped and generated. The third phase is the analysis, where all indicator layers are analyzed using weighted overlay analysis to produce the final sustainability map. In the last phase, the map and statistics of results are produced, and finally, interpretations and recommendations are drawn. The detailed indicator layers generation workflow and analysis of the MCDA model are illustrated in Figure 3.
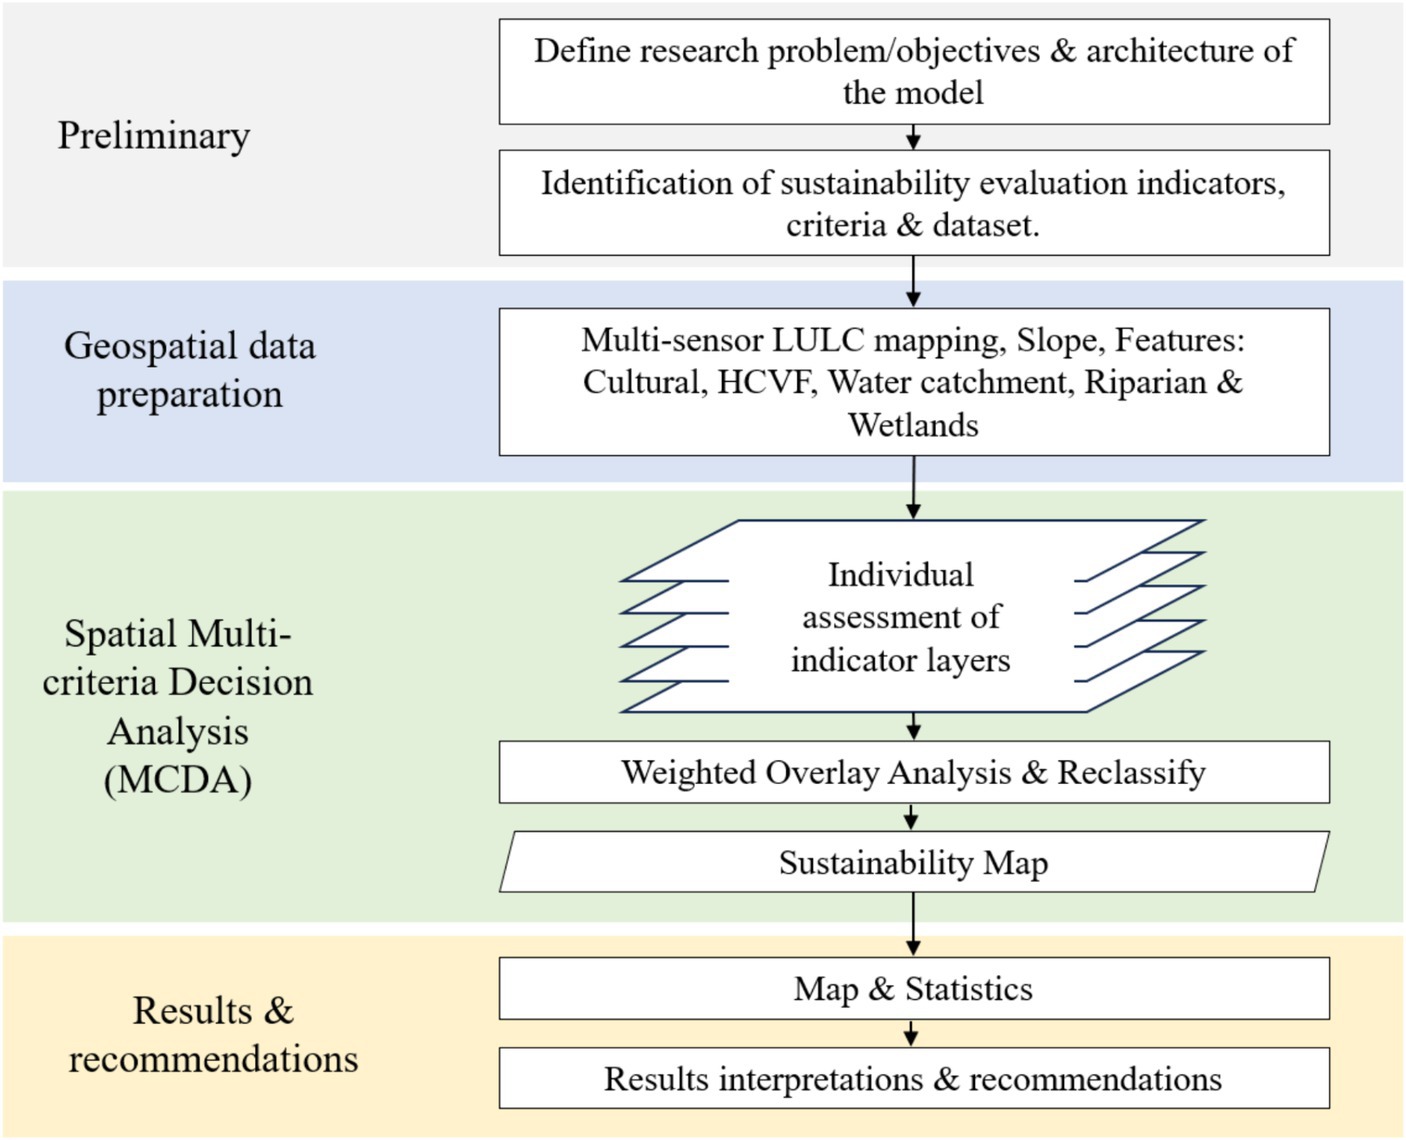
Figure 3. Sustainability analysis workflow of this study using Spatial Multi-criteria Decision Analysis (MCDA) [adapted from Gigović et al., 2018].
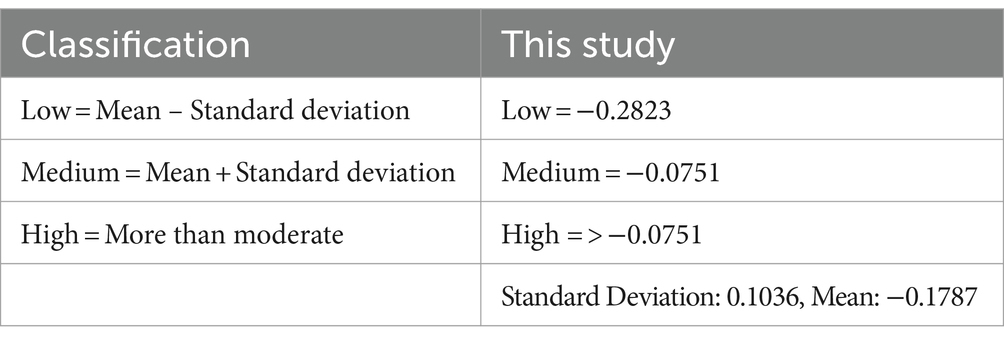
Table 4. Classification of NDTI values adopted from Shivangi Somvanshi et al. (2011).
In this study, five sustainability indicators were used to assess the environmental sustainability of the study site. These indicators were selected based on their relevance to the study objectives and their ability to provide insights into sustainability. Previous studies (Hristov and Chirico, 2019; Nath et al., 2021; Wong et al., 2023) have identified a range of indicators related to biodiversity, water quality, erosions slope protection, and riparian reserves.
2.4.1 Slopes erosion protection
In the study area (Sabah), land use (clearing and cutting) involving a slope gradient of 20 degrees or more is prescribed under the Environmental Protection Department (EPD) Environmental Impact Assessment (EIA) order year 2005, which requires EIA report (EPD Sabah, 2012a). Land use activities, such as Reduced Impact Logging (RIL) in natural forests or Industrial Tree Plantations (ITP), are only permitted up to a slope gradient of 25 degrees (EPD Sabah, 2012b) and should be clearly marked on the ground and mapped. A previous study has shown that the widely used legume cover crop Mucuna bracteata (MB) in Oil palm plantations can effectively reduce surface runoff and soil erosions (Wawan and Hapsoh, 2019). In this study, any soil clearing and slope-cutting area of more than 25 degrees is considered to have low sustainability.
2.4.2 River buffers
The river buffers of riparian zone vegetation play an important role in regulating water quality and protecting aquatic ecosystems and wildlife habitats (Bedell et al., 2017). Previous studies have shown that riparian reserves sustain biodiversity within cultivated land (Mitchell et al., 2018; Seaman et al., 2019). In Sabah, riparian reserves are useful for the preservation of native vegetation along bordering waterbodies and riverbanks, as well as for mitigation strategies, reducing negative impacts from land use changes in plantations. Therefore, retaining, restoring, maintaining, and managing riparians within oil palm plantations and ITP is a useful strategy to improve biodiversity conservation (Pianzin et al., 2021). Riparian reserve is one of the certification requirements for sustainable oil palm under the Roundtable on Sustainable Palm Oil Scheme (RSPO) and ITP certifications under the Forest Stewardship Council (FSC) or Malaysia Timber Certification Scheme MTCC. In Sabah, the EPD legislation presently requires riparian buffers with a minimum of 20–30 m wide to be retained on all streams with width of 3 m and 10 m (EPD Sabah, 2012b,c).
2.4.3 Landscape connectivity and quality
Landscape connectivity depicts the vital links between forest patches across the landscape, serving as a crucial habitat for diverse flora and fauna. Ensuring the quality and connectivity of these landscapes is paramount for maintaining viable populations of species, particularly iconic ones found in Borneo, such as the Bornean orangutans (Pongo pygmaeus), proboscis monkey (Nasalis larvatus), pygmy elephants (Elephas maximus borneensis), bearded pigs (Susbarbatus), and sun bears Helarctos malayanus (Alamgir et al., 2020). Retaining connectivity between remaining forested areas within oil palm, rubber plantations, and ITP is essential for the movement and survival of terrestrial species. In this study, the standard used for class sustainability rating is based on the RSPO Manual of Best Management Practices (BMPs), Environmental Protection Department (EPD) standards, and FMP document, which studies were conducted with external consultants and local communities, as summarized in Table 5. The conservation and forest cover criterion focuses on maintaining the integrity of forest ecosystems and protecting biodiversity. This involves measures to prevent deforestation, habitat fragmentation, and the loss of endangered species. By prioritizing landscape connectivity and biodiversity conservation, we can ensure the long-term sustainability of Borneo’s unique and irreplaceable natural heritage.
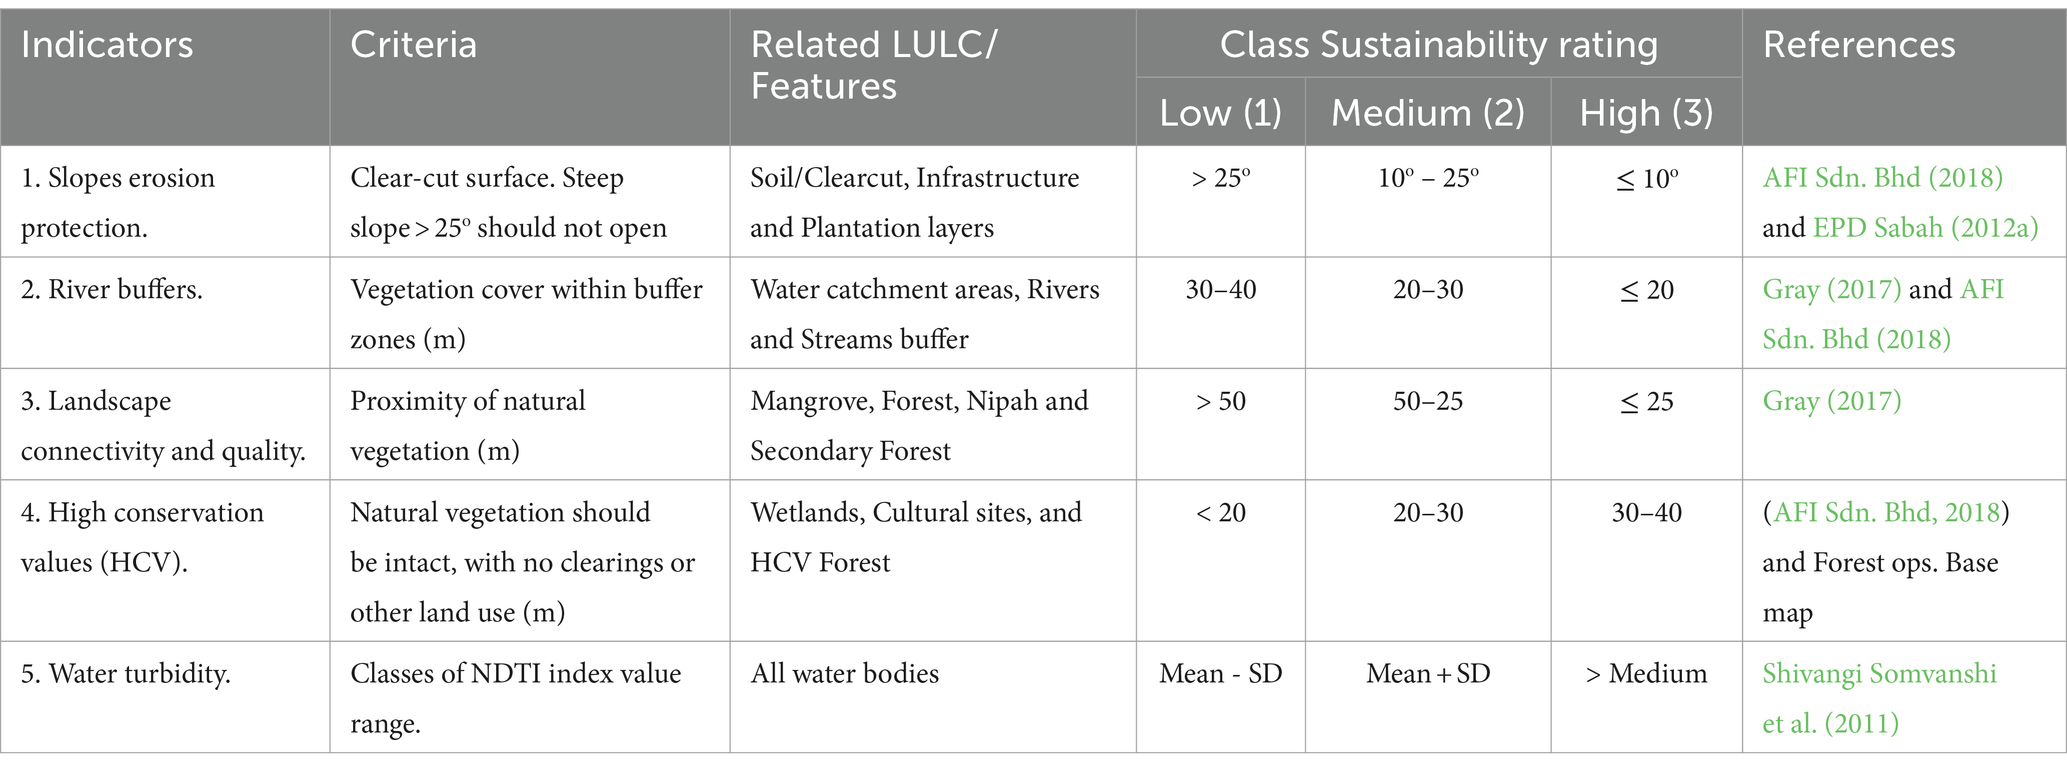
Table 5. Sustainability indicators, criteria for the related LULC, sustainability criteria, class, and sustainability ratings.
2.4.4 High conservation values
High conservation value (HCV) encompasses areas of significance in terms of biological, ecological, social, or cultural significance or critical importance within a specific landscape or site. The HCV network common guidance for the identification of high conservation values (Brown et al., 2013) outlines six categories of HCVs.
i. Species diversity: Areas with concentrations of biological diversity, including endemic species, rare, threatened, or endangered species, that are significant at local, national, regional, and global scales.
ii. Landscape-level ecosystems and mosaics: Large landscape-level ecosystems and mosaics that are significant at national, regional, and global scales, and contain viable populations of the great majority of the naturally occurring species in natural patterns of distribution and abundance.
iii. Ecosystems and habitats: where rare, threatened, or endangered ecosystems, habitats, and refugia.
iv. Ecosystem services: Areas critical for ecosystem services, including protection of water catchments and control of erosion of vulnerable soils and slopes.
v. Community needs: Sites and resources fundamental for satisfying the necessities of local communities or indigenous peoples for livelihoods, health, nutrition, water, etc. identified through engagement with communities or indigenous peoples.
vi. Cultural values: sites, resources, habitats, and landscapes of national or global archeological or historical significance and/or of critical cultural, ecological, economic, or religious/sacred importance for the traditional cultures of local communities or indigenous peoples identified through the engagement of these peoples.
HCV was initially developed by FSC® for forestry, and the HCV concept has been adopted by RSPO for oil palm also other certification schemes and organizations that aim to maintain and enhance significant and critical environmental and social values as part of responsible management (Brown et al., 2013; Gray, 2017). In this study, the HCV layers were derived from the Forest Operation Base map, which was officially demarcated on the ground by the forest management company in collaboration with wildlife consultants and local communities. These HCVs encompass wetlands, cultural sites, and forests of high conservation importance, reflecting a commitment to responsible environmental management and conservation practices.
2.4.5 Water turbidity
Sustainable water management, maintaining water quality, and availability within forest ecosystems and plantations is important for socioeconomic development and the environment. Sabah Environment Protection Department (EPD) requires the forest and plantation companies to submit an EIA report prepared by EPD-appointed consultant, which includes water quality monitoring every 4 months (AFI Sdn. Bhd, 2018). Sediment loads and improper waste handling from plantations or forest operations may degrade water quality. The infiltration of chemicals into waterways can seriously affect aquatic life and freshwater supply. Main elements compounded in fertilizers such as nitrogen (N), potassium (K), phosphorus (P), and magnesium (Mg) may end up in watercourses through washed surface soil, leaching soluble compounds into groundwater and runoff that carries both soluble and insoluble compounds (EPD Sabah, 2012c).
In this study, water turbidity is monitored using remotely sensed data measured by Normalized Difference Turbidity Index (NDTI). The NDTI is a remote sensing technique widely used for identifying water turbidity caused by sediment, and it is the ratio of red and green bands of the solar spectrum (Subramaniam and Saxena, 2011; Bid and Siddique, 2019; Chen et al., 2022). The classification of NDTI value was calculated by the mean and standard deviation values. The class values for low, medium, and high were calculated by the following formulas in Table 4.
The sustainability indicators, as summarized in Table 5, were meticulously designed by integrating various datasets, including demarcated features outlined in the Forest Management Plan (FMP) and depicted in the Forest Operation Base map. These indicators were developed by aligning the criteria with the land use/land cover (LULC) map and adhering to the standards set forth by the Environmental Protection Department (EPD) and the Roundtable on Sustainable Palm Oil (RSPO). These standards are essential guidelines that oil palm, rubber, and ITP companies are required to adhere to in order to comply with regulations and ensure sustainable practices.
3 Results
3.1 Land use land cover map and accuracy assessment
The 2023 LULC was mapped (Figure 4) into the 14 classifications at 10-meter resolution. Overall accuracy achieved was 87.24% with a kappa coefficient k of 85.89%. The majority of the overall LULC (Figure 5A; Table 6) was 39% of forest, followed by 19% mangrove, 12% Acacia, 8% oil palm, 7% secondary forest, and 6% the rest, as summarized in Figure 5A. Meanwhile, breakdown according to boundaries of land use areas (Figure 5B; Table 7) shows that ITP consists of 40% forest, 24% Eucalyptus, 13% Acacia, 8% oil palm, 6% secondary forest, 5% mangrove, and 0.02% or 6 hectares rubber. Forest reserves boundary areas consist of 27% forest, 21% of the remaining wild Acacia, 20% already planted with Eucalyptus, 16% clearcut results of the Acacia harvesting for replanting with Eucalyptus, and 7% both infrastructures of road networks and secondary forest, while 2% oil palm. The village boundary is 58% forest, 19% secondary forest, 14% infrastructures, 4% Acacia, and 3% oil palm. Meanwhile, the oil palm boundary majority is 81% oil palm, 10% infrastructures, and 4% forest and secondary forest. Finally, rubber boundary consists of 68% rubber, 22% secondary forest, and 7% forest, which are in the riparian buffer areas, both 1% mangrove and soil or clearcut.
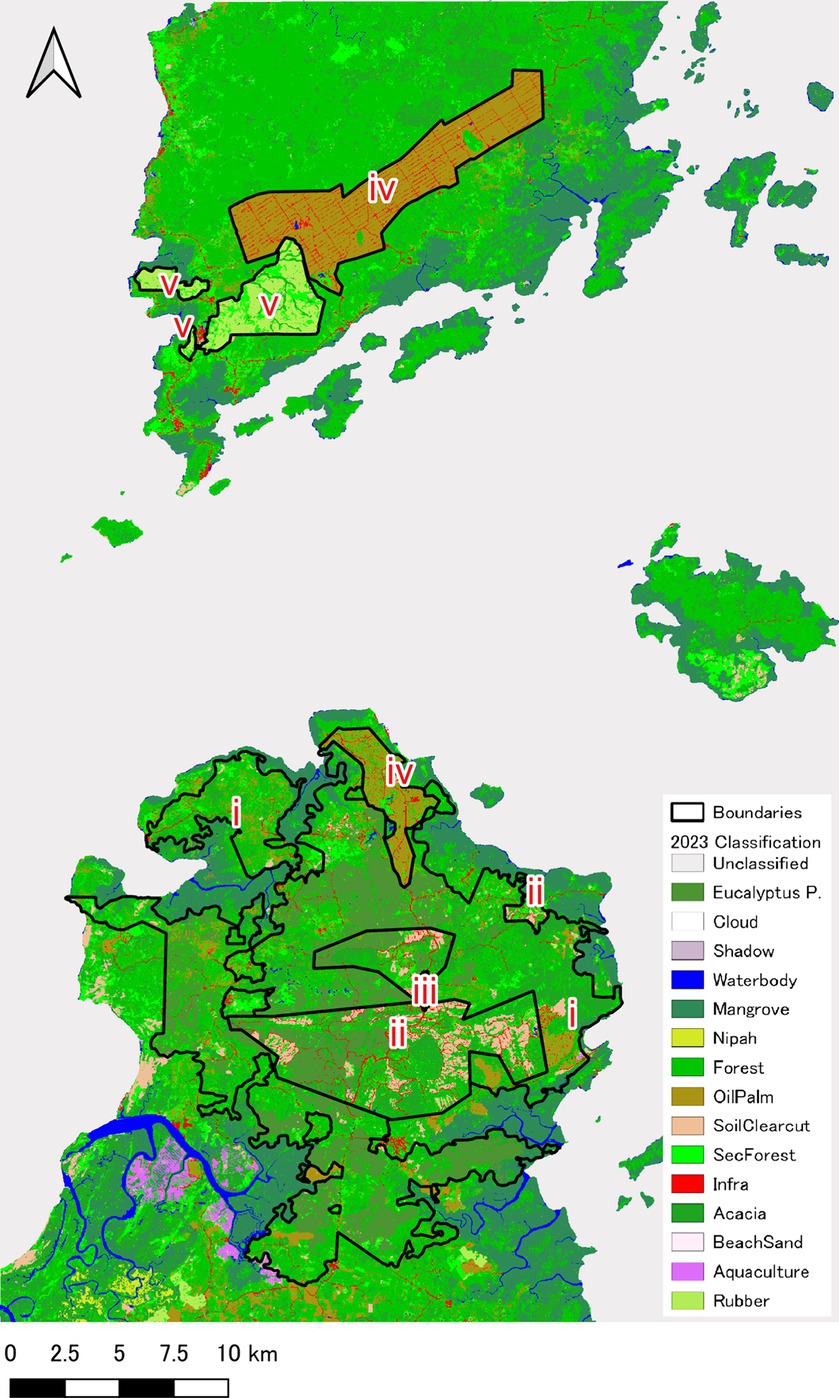
Figure 4. Year 2023 LULC map of the study area with five boundaries of land use areas: (i) Industrial Tree Plantations (ITP), (ii) forest reserves, (iii) village reserves, (iv) oil palm plantations, and (v) rubber plantations.
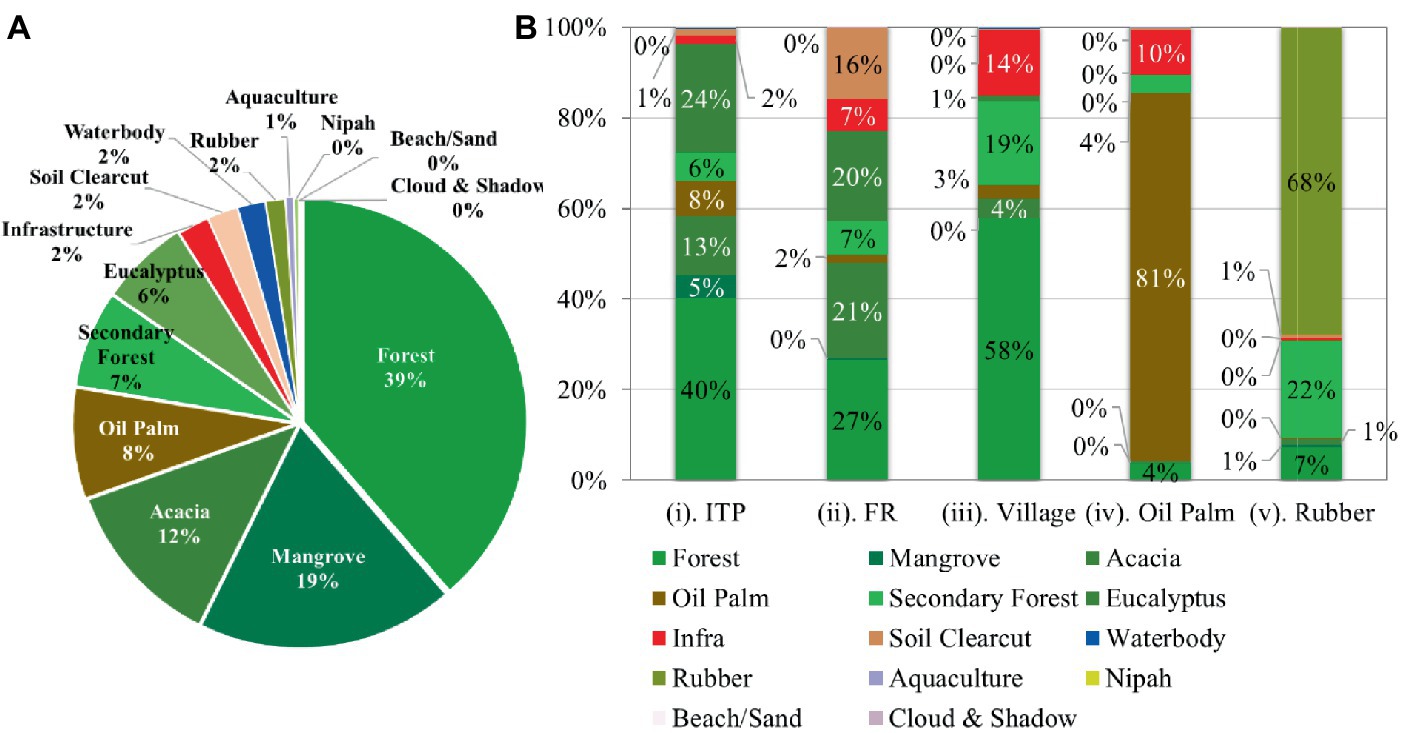
Figure 5. Percentages of LULC in 2023 by (A) overall study area and (B) five land use boundaries.
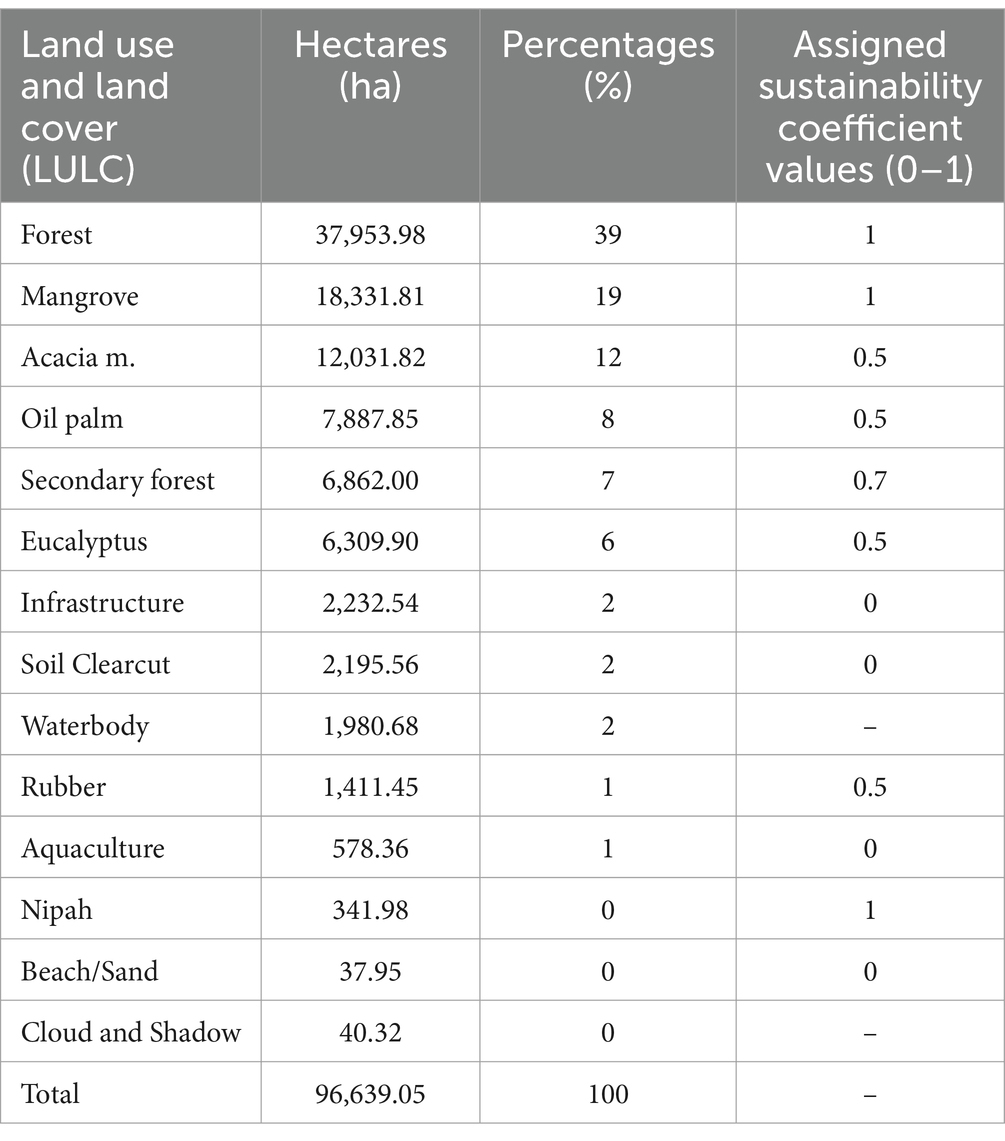
Table 6. The 2023 LULC map classes statistics sorted by size with assigned sustainability coefficient values for the MCDA model.
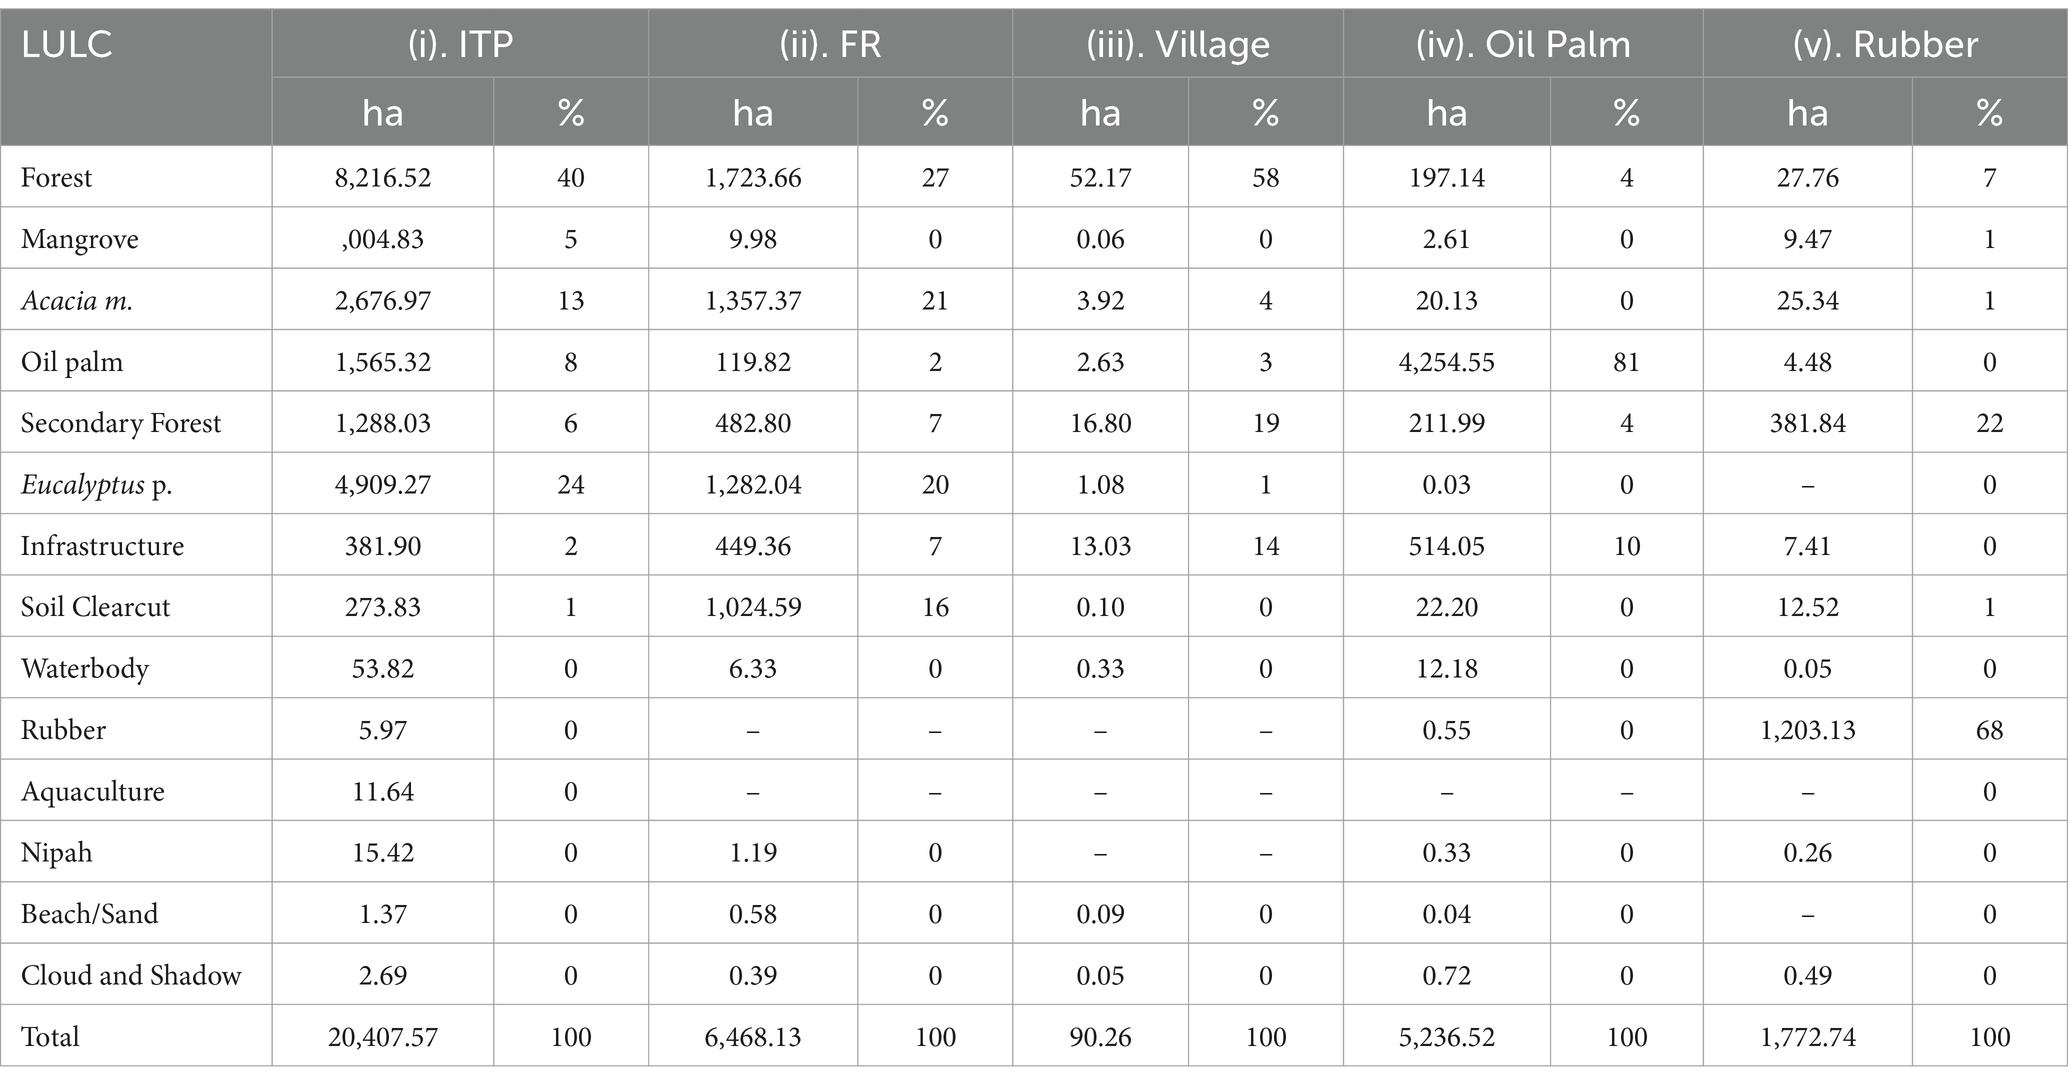
Table 7. LULC classes statistics by five boundaries of land use areas in 2023.
We assigned sustainability coefficient values to the LULC classes (Table 6) based on the coefficient categories specified in the RSPO Recommendation and Compensation Procedure (RaCP) vegetation coefficient categories values standards (RSPO, 2015).
3.2 Environmental sustainability indicator map layers
The five individual sustainability indicator maps (Figure 6) were produced based on the previously mentioned workflow (Figure 2). In addition, we compiled five boundaries of land use areas as in the map below (Figure 6F).
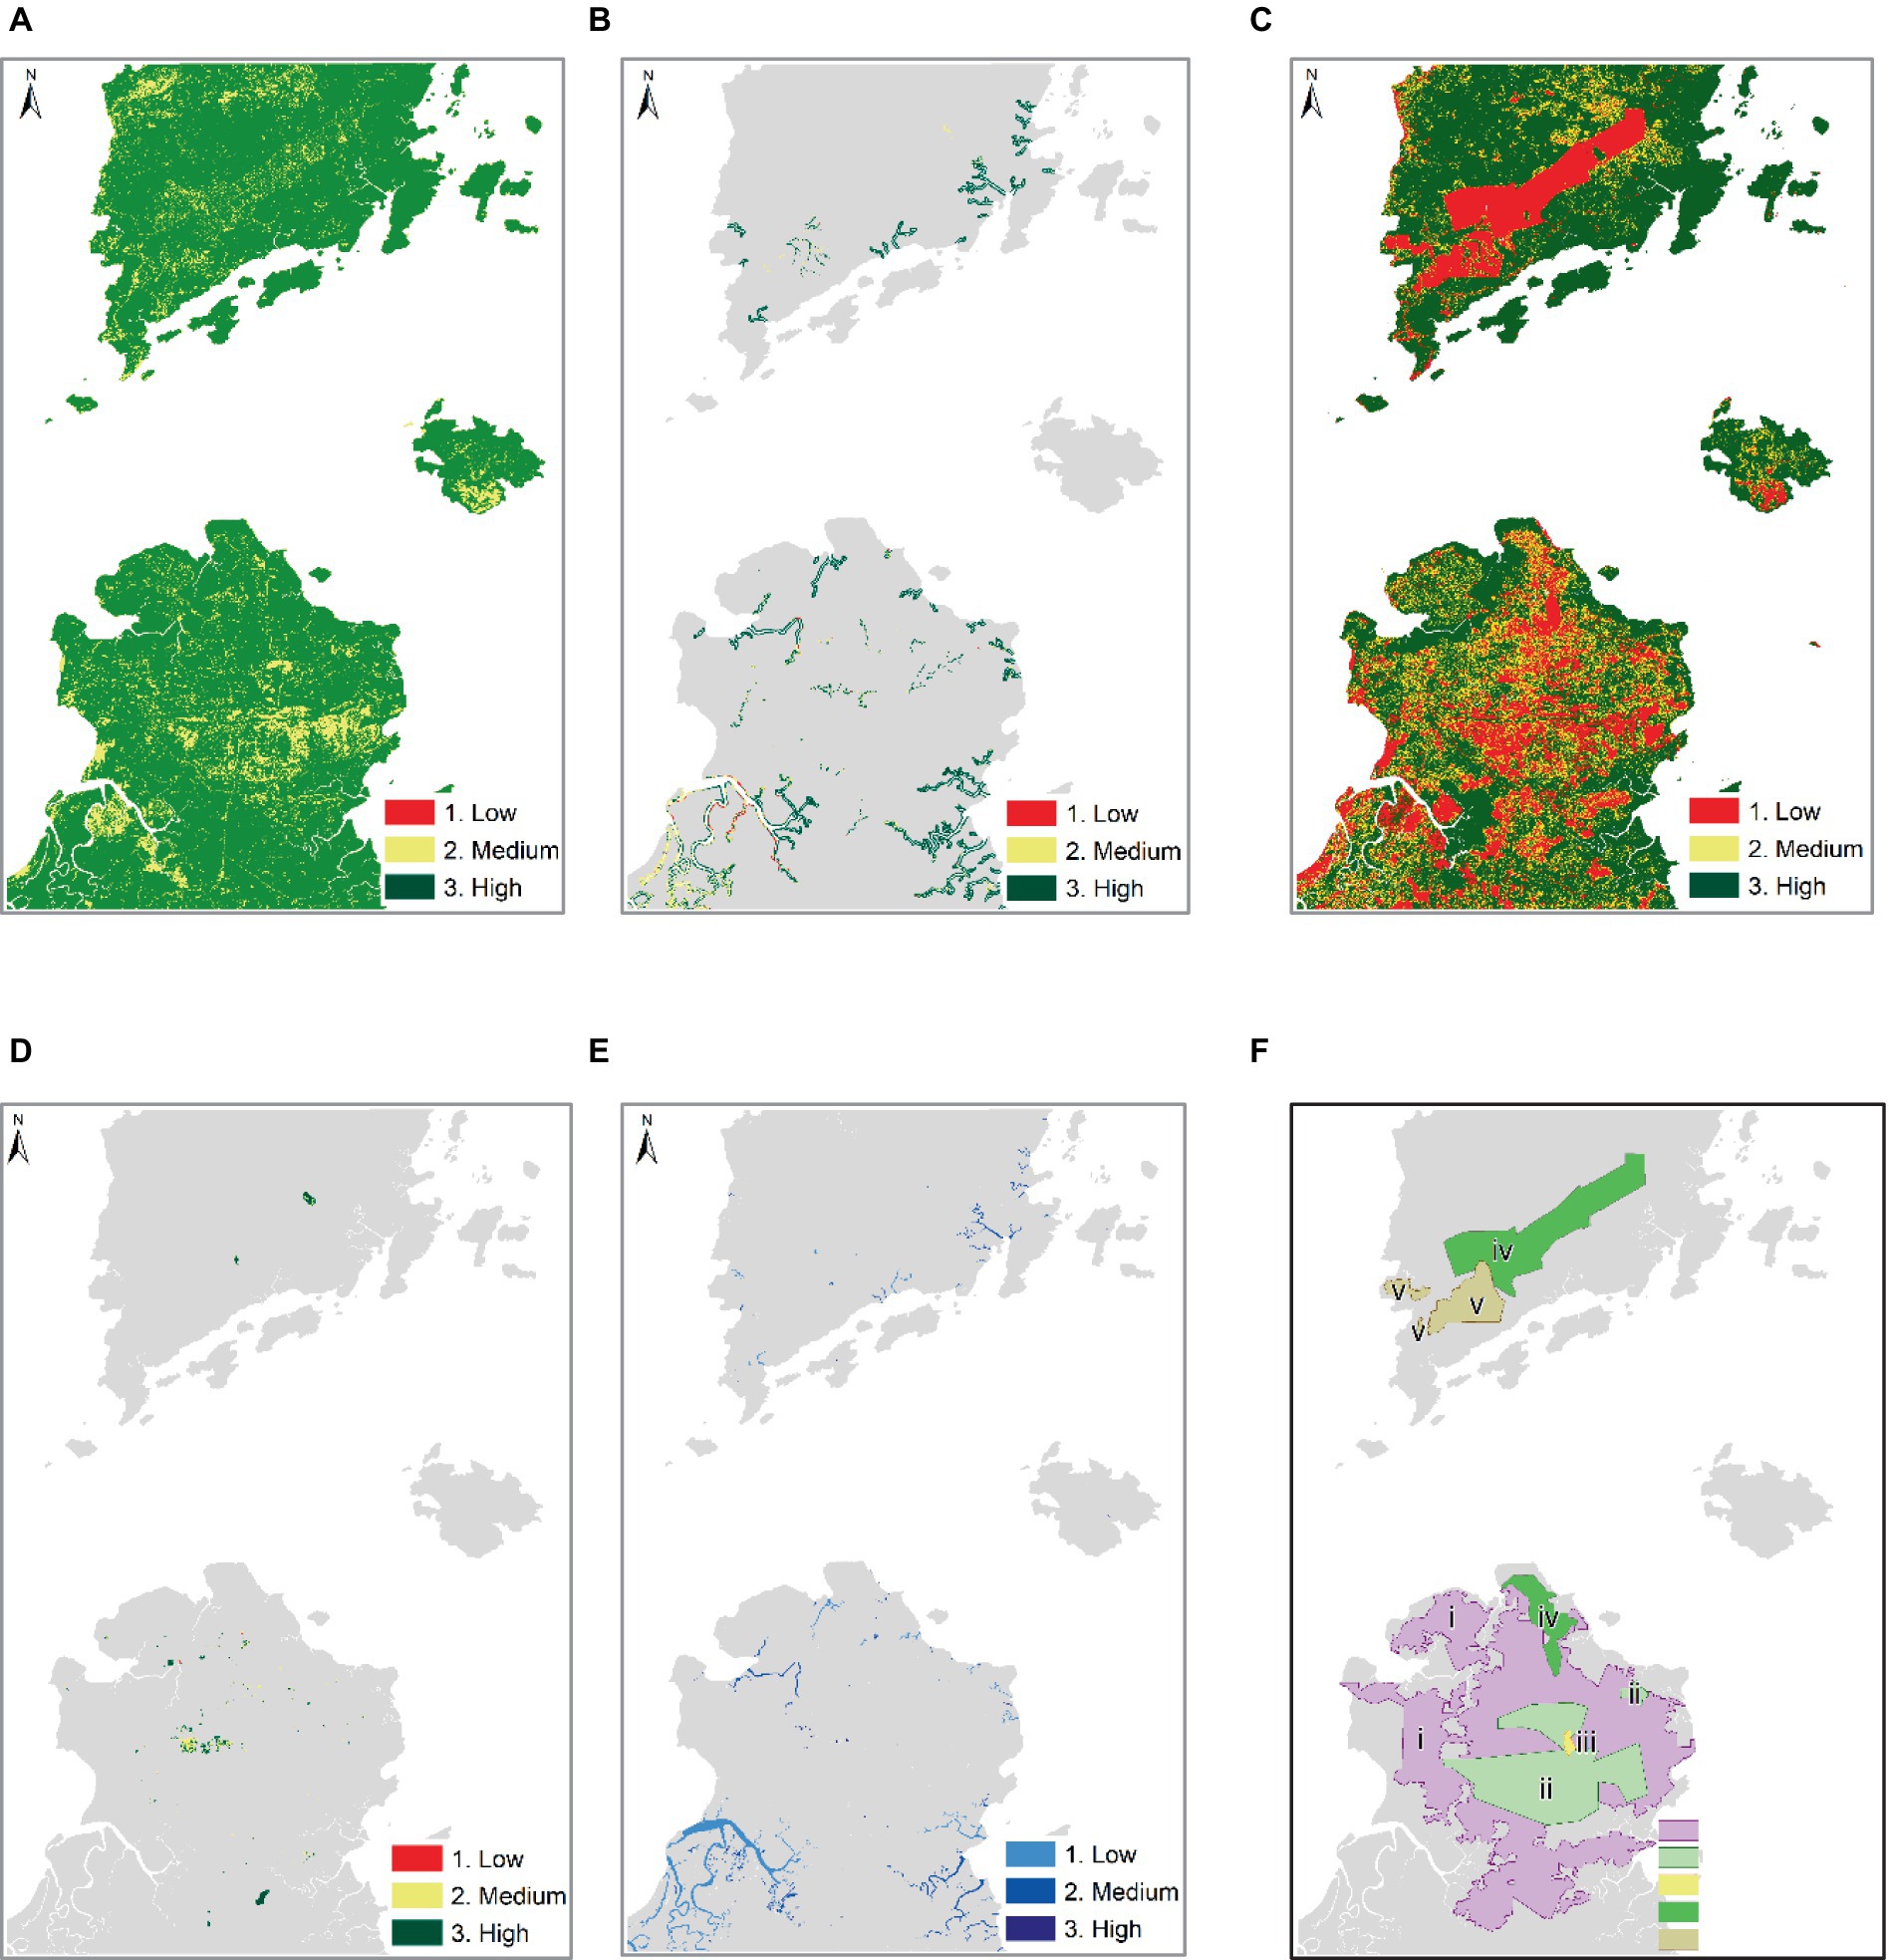
Figure 6. Environmental sustainability indicator map layers; (A) slope erosion protection, (B) river buffers, (C) landscape connectivity and quality, (D) High conservation values HCV, (E) water turbidity, and (F) five boundaries of land use areas of (i.) Industrial Tree Plantations (ITP), (ii.) forest reserves, (iii.) village reserves, (iv.) oil palm plantations, and (v.) rubber plantations. In maps, layers (B), (D), and (E) non-related features are gray.
Statistics of the individual sustainability indicators were extracted as summarized in Figure 7. For the slope erosion protection map, the majority, at 89%, are in the high sustainability class, and 11% medium and no low sustainable class recorded. River buffer areas also are the majority highly sustainable at 79%, medium at 19%, and low at 3%. Landscape connectivity and quality maps recorded 63% in the high sustainability class, 17% medium sustainability class, and 20% in low sustainability class. This is due to monocrop types of land use such as oil palm, rubber, and ITP plantations that cover large areas and have no or less near natural vegetation cover connectivity. Meanwhile, HCVs are mostly in the high sustainability class at 59%, medium at 39%, and low sustainability at only 2%. The water quality majority, at 61%, are in the low sustainability class. Evidently, the rivers that are in this low sustainability class are located near to the modified land uses, such as aquaculture, timber harvesting or clearings, oil palm, and infrastructures where the water bodies quality is attributed to surface runoff. While 32% is medium, 2% of the water turbidity is high, and the remaining 5% un-classified are small rivers, which are difficult to determine the NDTI value due to the limitation of S-1 fused PlanetScope produced final 10 m resolution imagery.
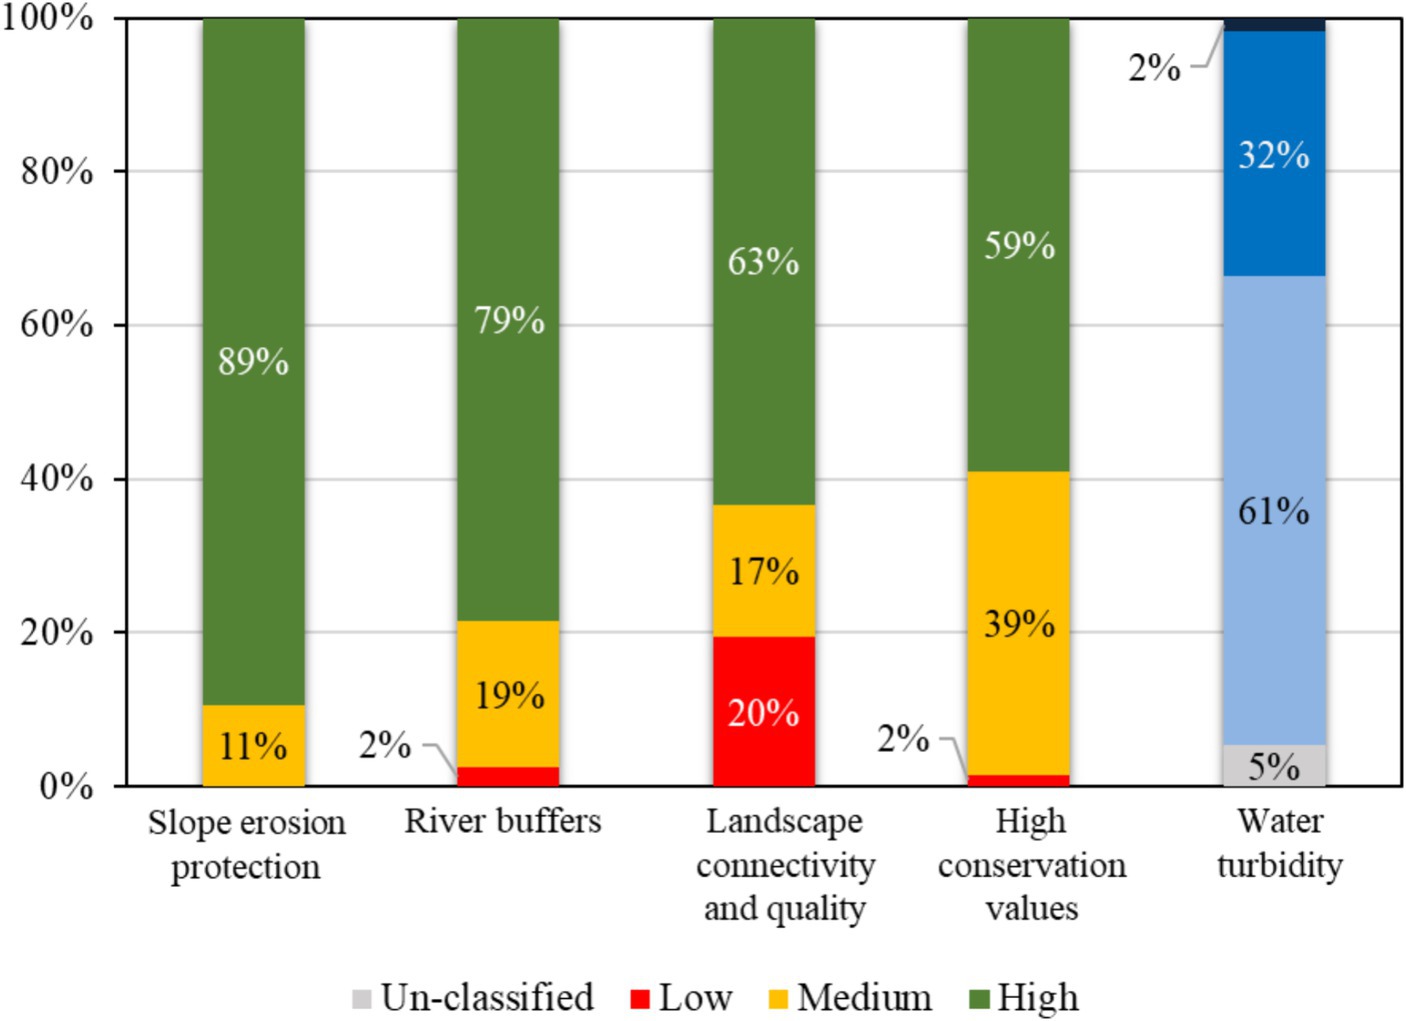
Figure 7. Percentages of sustainability indicators by sustainability categories (scores): un-classified, low, medium, and high.
3.3 Geospatial multi-criteria decision analysis
The majority of the overall sustainability score at 61% (58,995.06 hectares) are highly sustainable, 31% (30,182.49 hectares) are medium, and only 8% (7,398.73 hectares) are low (Figures 8, 9A). It can be observed from the sustainability score map (Figure 8) that in the southwest part, river networks are in the low sustainability class, contributed by clearings of mangrove forests for aquaculture land uses. Other river networks that are connected to the ITP or plantations are also in the low sustainability class. The oil palm and rubber plantations are predominantly medium class in terms of sustainability because of the lack of monoculture crops and breaking the linkage of forest cover. Similar is the Forest Reserve area, where currently timber harvesting is ongoing, which causes clearcut of planted forest. The ITP areas are mostly medium sustainability due to the monoculture nature of the forest plantation. It is obvious that undisturbed mangrove forests fall into the highly sustainable class.
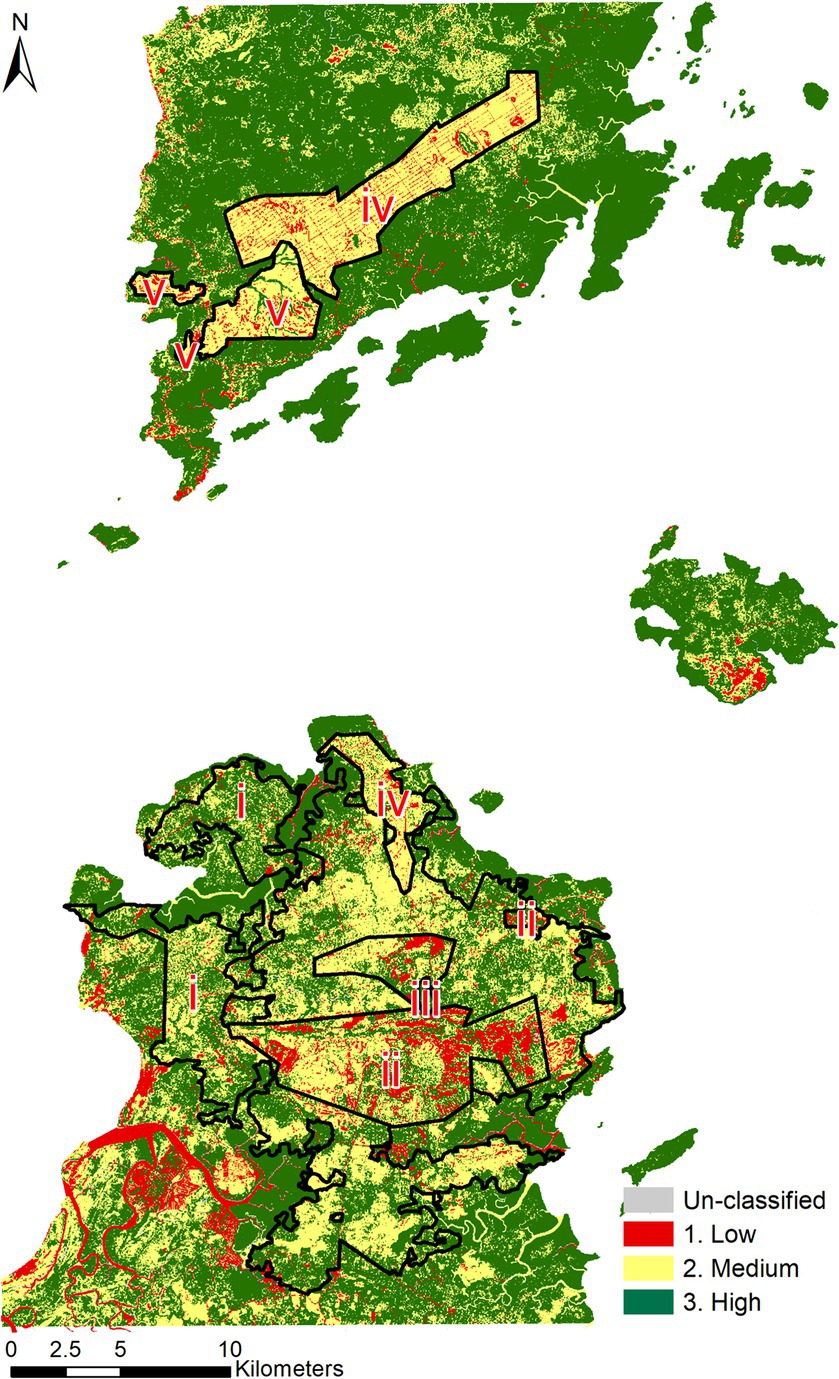
Figure 8. Sustainability score map of the study area with five boundaries of land use areas: (i.) Industrial Tree Plantations (ITP), (ii.) forest reserves, (iii.) village reserves, (iv.) oil palm plantations, and (v.) rubber plantations.
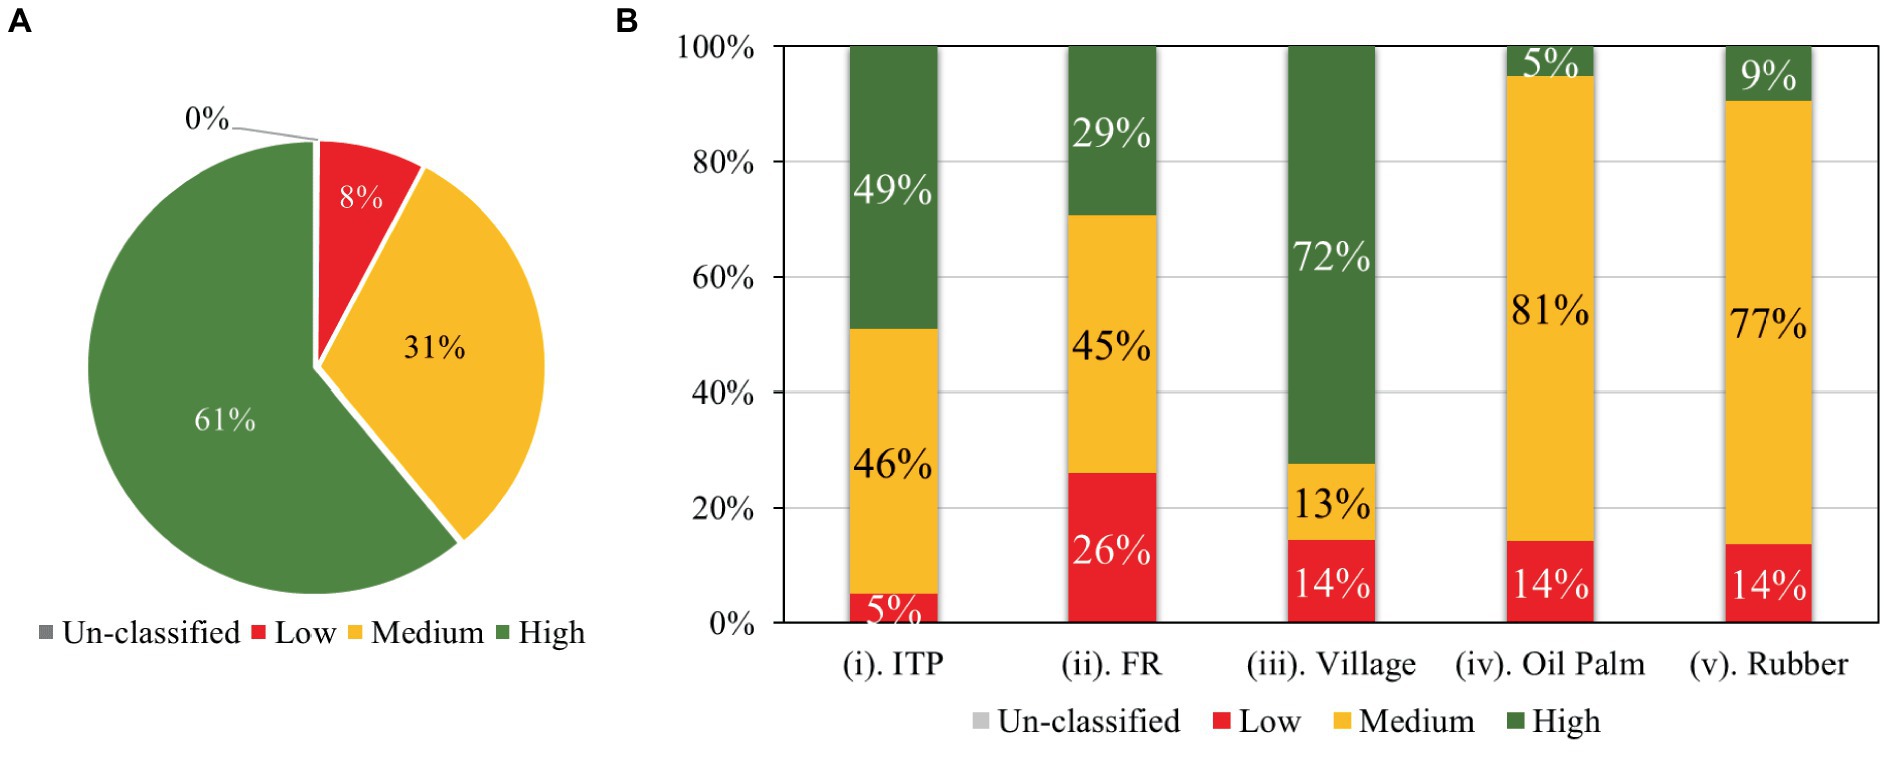
Figure 9. Percentages of the sustainability classes by (A) overall study area and (B) five land use boundaries areas.
Meanwhile, within the land use boundaries (Figure 9B), 49% of the ITPs are highly sustainable, 46% medium, and only 5% low, which is attributed to the land clearing of timber harvesting in some of the areas. The FR has 45% in medium class, 29% high, and 26% low, due to clearing. The village boundary area is 72% high, 14% low, and 13% medium class. Meanwhile, 81% of oil palm are medium, 14% low sustainable, and only 5% are sustainable. Finally, rubber boundary areas are at 77% medium, 14% low, and only 9% high. Both oil palm and rubber plantations are the majority in the medium class due to the monocropping land use type, which is also shown as low in the landscape connectivity and quality individual sustainability indicator layer (Figure 6C).
Detailed statistics of the MCDA model by five boundaries of land use areas are summarized in Table 8. The ITP is the biggest area, consisting of a total of 20,407.57 hectares, followed by the forest reserve at 6,468.13 hectares, oil palm at 5,236.52 hectares, rubber plantation at 1,772.74 hectares, and finally the village reserve at 90.26 hectares.
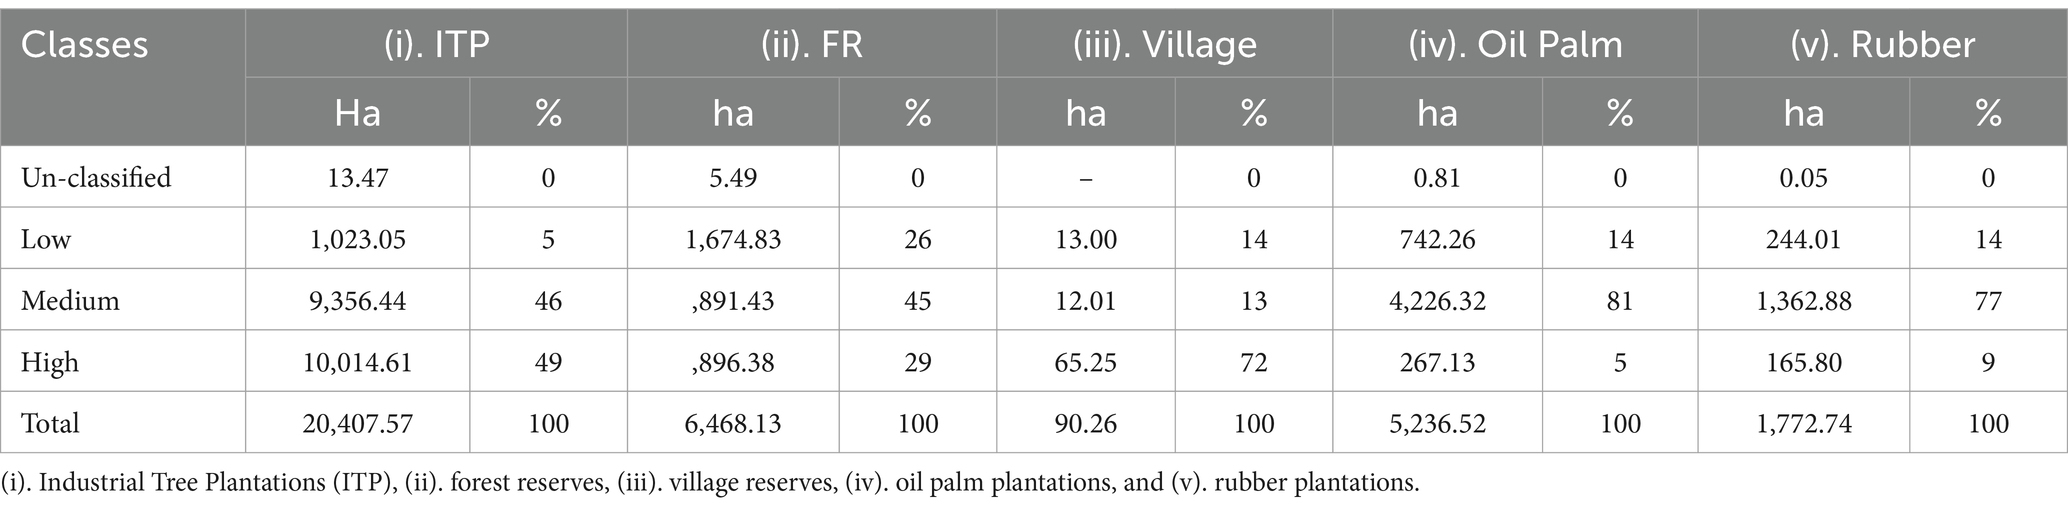
Table 8. Summary of the sustainability classes according to the five boundaries of land use areas.
4 Discussions
4.1 Land use land cover mapping improvement using multi-sensor remote sensing
The synergistic use of S1-S2 and fusion with PlanetScope satellite imageries reduced the effects of clouds and shadows in the classifications. Thus, a good LULC classification map result was produced with a high overall accuracy of 87.24%. The incorporation of S-1 SAR imagery allows mapping of LULC based on physical characteristics such as roughness, moisture, and structures combined with S-2 and PlanetScope high-resolution optical, which are useful for detailed visual and spectral-based detailed discrimination of LULC classes, which led to richer information, thus increasing classification accuracies (Van Tricht et al., 2018). Another benefit of employing a multi-sensor remote sensing technique is that SAR overcomes the limitations of optical remote sensing, which can be affected by cloud cover and shadows, especially tropical regions such as Borneo. These limitations are mitigated by SAR because active sensors can penetrate cloud cover. A study by Sharifi et al. (2022) of mangrove forest mapping in West Asia shows that the use of only S-1 with S-2 is sufficient to overcome cloud cover issues and for better mapping and monitoring of mangrove forests. The multi-sensor use of SAR and optical also enhances the detection of specific LULC features, especially in complex tropical forest and plantation landscapes, such as in the study area (Solórzano et al., 2021). The use of multi-sensors can be effectively combined with Machine Learning applications algorithms to improve the accuracy of LULC mapping (Jarayee et al., 2022).
4.2 Effectiveness of using multi-sensor MCDA model for assessing environmental sustainability
For the use of high-resolution multi-scale remote sensing data for mapping forests and plantations, LULC is highly effective considering the wide area coverage with a high level of detail in the classification. This enabled the indicator layers based on the assessment criteria to possibly be produced. The five indicators were as follows: 1. slope erosion protection, 2. river buffers, 3. landscape connectivity and quality, 4. high conservation values (HCVs), and 5. water turbidity. Subsequently, the indicator layers were analyzed using the MCDA model for the sustainability assessment. As discussed in the results sections, 61% of the water quality indicator layer was identified in the low sustainable category, followed by 20% of the landscape connectivity and quality indicator layer. Meanwhile, the final sustainability map result shows overall 61% of the total study area is identified as still highly sustainable, and breakdown by boundary layer shows 72% of the village reserve are highly sustainable. Oil palm and rubber plantations LULC are identified as 81 and 77%, respectively, in the medium sustainability category. This is attributed to the fact that the two LULCs are monocrop types of land cover, which possibly have less capacity for ecosystem functions. Additionally, oil palm and rubber plantation sites were prepared in a way where terraces were constructed, and crops were planted in a systematic way. The ITP and FR, however, are comparably more sustainable at 49 and 29%, respectively. This is due to the rubber and ITP land cover type mimicking the natural forests, although they are single tree species, and there was usually no terrain modification required for the tree planting. The use of multi-sensor remote sensing made it possible to effectively identify and map areas according to sustainability categories. MCDA model is an effective tool for assessing environmental sustainability; it allows for the comparison of decision alternatives based on the evaluation criteria set and different weights applied based on standards in the references (Paletto et al., 2021).
4.3 Recommendations for sustainability improvement
To improve the environmental sustainability of tropical forests and plantations in the study area, stakeholders should prioritize targeted management interventions in areas identified as having medium to low sustainability, particularly in the oil palm and rubber plantations. These interventions should focus on enhancing landscape connectivity and quality, as monoculture plantations have been shown to negatively impact linkages and biodiversity (Fitzherbert et al., 2008; Koh and Wilcove, 2008). Promoting sustainable practices in the Industrial Tree Plantations (ITP) and village reserves, which were found to have high sustainability, will help maintain and enhance environmental protection (Putz et al., 2012). Align sustainability assessments and management plans with the UN Sustainable Development Goals (UNSDGs), particularly SDG 15 (Life on land), and REDD+ initiatives can contribute to global environmental conservation efforts by protecting and restoring forest ecosystems, promoting sustainable land use, and halting biodiversity loss (Panfil and Harvey, 2016; Strassburg et al., 2020), especially mangroves that are affected by aquaculture land use in the study area. By implementing these recommendations, which are supported by the findings of this study and the broader literature on sustainable forest management and biodiversity conservation in tropical regions, stakeholders can ensure the long-term health and resilience of these critical ecosystems, which provide vital ecosystem services and support the livelihoods of local communities (Chazdon et al., 2009; Strassburg et al., 2020).
4.4 Limitations and future studies
This study has several limitations that provide avenues for future research. First, incorporating soil information such as soil types into the slope analysis and considering vegetation cover and types could enhance the accuracy of the environmental sustainability assessment. Additionally, while this study utilized Sentinel-1, Sentinel-2, and PlanetScope data, future studies may benefit from incorporating other data sources to provide a more comprehensive understanding of the study area. Furthermore, future research could investigate temporal changes in environmental sustainability, providing valuable insights into the dynamic nature of these ecosystems and the effectiveness of conservation efforts over time.
5 Conclusion
This study presented a concept use of a multi-sensor remote sensing technique combined with geospatial multi-criteria decision analysis (MCDA) for the environmental sustainability assessment of tropical forest and plantation landscapes in Borneo. The combination of high-resolution SAR and optical data demonstrated that a detailed LULC map and indicator layers can be produced, which are crucial for the analysis. The application of the MCDA model is an effective tool for assessing environmental sustainability. The results will help contribute to achieving UNSDGs and REDD+ initiatives, which are also useful for certification purposes of the plantations. The systematic workflow developed in this could also be applied to other future case studies with more indicator layers and improved details.
Data availability statement
The original contributions presented in the study are included in the article/Supplementary material, further inquiries can be directed to the corresponding author.
Author contributions
SS: Writing – review & editing, Writing – original draft, Validation, Software, Methodology, Data curation, Conceptualization. HS: Formal analysis, Writing – review & editing, Data curation. AL: Writing – review & editing, Methodology. RA: Writing – review & editing, Validation, Supervision, Resources, Methodology, Funding acquisition. AK: Writing – review & editing. MR: Writing – review & editing, Visualization, Investigation. YW: Writing – review & editing, Resources, Formal analysis. RK: Writing – review & editing, Methodology, Investigation.
Funding
The author(s) declare financial support was received for the research, authorship, and/or publication of this article. The first author of this research received financial support from the “Special Grant Program for Self-Supported International Students” and the DX Doctoral Fellowship (Grant no. JPMJSP2119) from Hokkaido University, Japan.
Acknowledgments
Authors acknowledge the European Commission and the European Space Agency (ESA) for the free access to Sentinel-1 and 2 data and PlanetScope (Education and Research Standard) data access, and Google Earth Engine (GEE) for providing a great science platform. The authors thank Sabah State Government, Sabah Biodiversity Center (SaBC), Sabah Forestry Development Authority (SAFODA), Hijauan Bengkoka Plantations Sdn. Bhd., and Acacia Forest Industries Sdn. Bhd. for data permissions, access, advice, and feedback. They thank Billie Jivinson for his expert advice and assistance related to the study area. They also thank the Village Head and Committee of Kampung Maringgan and Kampung Bawing of Bengkoka Peninsula for their support, access permission, and assistance during field visits.
Conflict of interest
The authors declare that the research was conducted in the absence of any commercial or financial relationships that could be construed as a potential conflict of interest.
Publisher’s note
All claims expressed in this article are solely those of the authors and do not necessarily represent those of their affiliated organizations, or those of the publisher, the editors and the reviewers. Any product that may be evaluated in this article, or claim that may be made by its manufacturer, is not guaranteed or endorsed by the publisher.
Supplementary material
The Supplementary material for this article can be found online at: https://www.frontiersin.org/articles/10.3389/ffgc.2024.1337535/full#supplementary-material
References
Abe, H., Itoh, S., Shibata, M., Ogata, K., Kitin, P. B. P., and Fujii, T. (2005). Tree species of timber imported to Japan from Southeast Asia.
Acosta, M., and Corral, S. (2017). Multicriteria decision analysis and participatory decision support Systems in Forest Management. Forests 8:116. doi: 10.3390/f8040116
AFI Sdn. Bhd. (2018). AFI public Forest management plan 2016–2025 (Revision 02 Feb. 2022). Kota Kinabalu, Sabah.
Alamgir, M., Campbell, M. J., Sloan, S., Engert, J., Word, J., and Laurance, W. F. (2020). “Emerging challenges for sustainable development and Forest conservation in Sarawak, Borneo” edited by P. Dwivedi. PLoS One 15:e0229614. doi: 10.1371/journal.pone.0229614
Anderson, J. A., McClean, C. J., Sim, S., Pettorelli, N., Jelling, A., Tangah, J., et al. (2022). Weak edge effects on trees in Bornean rainforest remnants bordering oil palm. Biotropica 54, 921–932. doi: 10.1111/btp.13115
Avtar, R., Takeuchi, W., and Sawada, H. (2013). Full polarimetric PALSAR-based land cover monitoring in Cambodia for implementation of REDD policies. Int. J. Digit. Earth. 6, 255–275.
Bedell, E., Leslie, M., Fankhauser, K., Burnett, J., Wing, M. G., and Thomas, E. A. (2017). Unmanned aerial vehicle-based structure from motion biomass inventory estimates. J. Appl. Remote. Sens. 11:026026. doi: 10.1117/1.jrs.11.026026
Bid, S., and Siddique, G. (2019). Identification of seasonal variation of water turbidity using NDTI method in Panchet Hill dam, India. Model. Earth Syst. Environ. 5, 1179–1200. doi: 10.1007/s40808-019-00609-8
Biswas, S., Huang, Q., Anand, A., Mon, M. S., Arnold, F. E., and Leimgruber, P. (2020). A multi sensor approach to Forest type mapping for advancing monitoring of sustainable development goals (SDG) in Myanmar. Remote Sens. 12, 1–21. doi: 10.3390/rs12193220
Brown, E., Dudley, N., Lindhe, A., Muhtaman, D. R., Stewart, C., and Synnott, T. (2013). Common guidance for the high conservation values a good practice guide for identifying HCVs across different ecosystems and production systems. (October).
Bryan, J. E., Shearman, P. L., Asner, G. P., Knapp, D. E., Aoro, G., and Lokes, B. (2013). Extreme differences in Forest degradation in Borneo: comparing practices in Sarawak, Sabah, and Brunei. PLoS One 8:679. doi: 10.1371/journal.pone.0069679
Cammerino, A. R., Bernadette, M. I., Piacquadio, L., and Monteleone, M. (2023). Assessing and mapping Forest functions through a GIS-based, multi-criteria approach as a participative planning tool: an application analysis. Forests 14:934. doi: 10.3390/f14050934
Chazdon, R. L., Harvey, C. A., Komar, O., Griffith, D. M., Ferguson, B. G., Martínez-Ramos, M., et al. (2009). Beyond reserves: a research agenda for conserving biodiversity in human-modified tropical landscapes. Biotropica 41, 142–153. doi: 10.1111/j.1744-7429.2008.00471.x
Chen, J. (2014). GIS-based multi-criteria analysis for land use suitability assessment in City of Regina. Environ. Syst. Res. 3:13. doi: 10.1186/2193-2697-3-13
Chen, X., Chen, W., Bai, Y., and Wen, X. (2022). Changes in turbidity and human activities along Haihe River basin during lockdown of COVID-19 using satellite data. Environ. Sci. Pollut. Res. 29, 3702–3717. doi: 10.1007/s11356-021-15928-6
D’Adamo, I., and Gastaldi, M. (2022). Sustainable development goals: a regional overview based on multi-criteria decision analysis. Sustain. For. 14:9779. doi: 10.3390/su14159779
Dagne, S. S., Hirpha, H. H., Tekoye, A. T., Dessie, Y. B., and Endeshaw, A. A. (2023). Fusion of Sentinel-1 SAR and Sentinel-2 MSI data for accurate urban land use-land cover classification in Gondar City, Ethiopia. Environ. Syst. Res. 12:40. doi: 10.1186/s40068-023-00324-5
Dickson, O. D., and Ong-Abdullah, M. (2022). “Sustainability of the oil palm industry” in Elaeis guineensis. ed. O. D. Dickson (London: IntechOpen).
EPD Sabah (2012a). Environmental impact assessment (EIA): guidelines for construction on Hill slopes. Kota Kinabalu, Sabah: Environment Protection Department (EPF) Sabah.
EPD Sabah (2012b). Environmental impact assessment (EIA): Guidelines for Forest harvesting (logging) and Forest plantation establishment. Sabah: Kota Kinabalu.
EPD Sabah (2012c). Environmental impact assessment (EIA): Guidelines for oil palm plantation. Sabah: Kota Kinabalu.
Felix, T. (1991). Basin development and deposition of the Bongaya formation in the pitas area, Nothern Sabah. Bulletin of the Geological Society of Malaysia, pp. 183–193.
Fitzherbert, E., Struebig, M., Morel, A., Danielsen, F., Bruhl, C., Donald, P., et al. (2008). How will oil palm expansion affect biodiversity? Trends Ecol. Evol. 23, 538–545. doi: 10.1016/j.tree.2008.06.012
Gigović, L., Jakovljević, G., Sekulović, D., and Regodić, M. (2018). GIS multi-criteria analysis for identifying and mapping Forest fire Hazard: Nevesinje, Bosnia and Herzegovina. Tehn. Vjesnik 25:1722. doi: 10.17559/TV-20151230211722
Google. (n.d.). Google Earth Engine. Available at: https://developers.google.com/earth-engine/apidocs/ee-classifier-smilerandomforest. (Accessed July 10, 2023).
Gray, C. L. (2017). RSPO manual on best management practices (BMPs) for the management and rehabilitation of riparian reserves RSPO manual on best management practices (BMPs) for the management and rehabilitation of riparian reserves Holly Barclay, Claudia L. Gray, Sa, Kuala.
Greene, R., Devillers, R., Luther, J. E., and Eddy, B. G. (2011). GIS-based multiple-criteria decision analysis. Geogr. Compass 5, 412–432. doi: 10.1111/j.1749-8198.2011.00431.x
Hanafiah, M., Khayriyyah, A. H., Mutalib, A., Miard, P., Goh, C. S., Sah, S. A. M., et al. (2022). Impact of Malaysian palm oil on sustainable development goals: co-benefits and trade-offs across mitigation strategies. Sustain. Sci. 17, 1639–1661. doi: 10.1007/s11625-021-01052-4
Herath, G., and Prato, T. (2006). Using multi-criteria decision analysis in natural resource management, no. 4.
Hon, J., and Shibata, S. (1970). A review on land use in the Malaysian state of Sarawak, Borneo and recommendations for wildlife conservation inside production Forest environment. Borneo J. Resour. Sci. Technol. 3, 22–35. doi: 10.33736/bjrst.244.2013
Hristov, I., and Chirico, A. (2019). The role of sustainability key performance indicators (KPIs) in implementing sustainable strategies. Sustain. For. 11:5742. doi: 10.3390/su11205742
Jarayee, A. N., Shafri, H. Z. M., Ang, Y., Lee, Y. P., Bakar, S. A., Abidin, H., et al. (2022). Oil palm plantation land cover and age mapping using Sentinel-2 satellite imagery and machine learning algorithms. IOP Conf. Ser. Earth Environ. Sci. 1051:012024. doi: 10.1088/1755-1315/1051/1/012024
JICA. (1984). Report for the study on the afforestation and settlement project in division 5 of the Bengkoka area of the state of Sabah Malaysia.
Koh, L. P., and Wilcove, D. S. (2008). Is oil palm agriculture really destroying tropical biodiversity? Conserv. Lett. 1, 60–64. doi: 10.1111/j.1755-263X.2008.00011.x
Lee, S. S. (2018). Observations on the successes and failures of acacia plantations in sabah and Sarawak and the way forward. J. Trop. For. Sci. 30, 468–475. doi: 10.26525/jtfs2018.30.5.468475
McFeeters, S. K. (1996). The use of the normalized difference water index (NDWI) in the delineation of open water features. Int. J. Remote Sens. 17, 1425–1432. doi: 10.1080/01431169608948714
Mitchell, S. L., Edwards, D. P., Bernard, H., Coomes, D., Jucker, T., Davies, Z. G., et al. (2018). “Riparian reserves help protect Forest bird communities in oil palm dominated landscapes” edited by C. Banks-Leite. J. Appl. Ecol. 55, 2744–2755. doi: 10.1111/1365-2664.13233
Mohamadzadeh, P., Pourmoradian, S., Feizizadeh, B., Sharifi, A., and Vogdrup-Schmidt, M. (2020). A GIS-based approach for spatially-explicit sustainable development assessments in East Azerbaijan Province, Iran. Sustain. For. 12:10413. doi: 10.3390/su122410413
Mopan, A., Ediver, Y., Pino, A. F. S., Rubiano-Ovalle, O., Paz, H., and Mejia, I. R. (2023). Spatial analysis of the suitability of Hass avocado cultivation in the Cauca department, Colombia, using multi-criteria decision analysis and geographic information systems. ISPRS Int. J. Geo Inf. 12:136. doi: 10.3390/ijgi12040136
Murphy, D. J., Goggin, K., Russell, R., and Paterson, M. (2021). Oil palm in the 2020s and beyond: challenges and solutions. CABI Agric. Biosci. 2:39. doi: 10.1186/s43170-021-00058-3
Musthafa, M., Khati, U., and Singh, G. (2020). Sensitivity of PolSAR decomposition to Forest disturbance and regrowth dynamics in a managed Forest. Adv. Space Res. 66, 1863–1875. doi: 10.1016/j.asr.2020.07.007
NASA. (n.d.). NASA Shuttle Radar Topography Mission (SRTM) Version 3.0 Global 1 Arc Second Data Released over Asia and Australia. Available at: https://www.earthdata.nasa.gov/news/nasa-shuttle-radar-topography-mission-srtm-version-3-0-global-1-arc-second-data-released-over-asia-and-australia. (Accessed February 27, 2024).
Nath, A. J., Rakesh Kumar, N., Devi, B., Rocky, P., Giri, K., Sahoo, U. K., et al. (2021). Agroforestry land suitability analysis in the eastern Indian Himalayan region. Environ. Chall. 4:100199. doi: 10.1016/j.envc.2021.100199
Ngo, K. D., Lechner, A. M., and Tuong Thuy, V. (2020). Land cover mapping of the Mekong Delta to support natural resource management with multi-temporal sentinel-1A synthetic aperture radar imagery. Remote Sens. Appl. 17:100272. doi: 10.1016/j.rsase.2019.100272
Nguyen, L. H., and Henebry, G. M. (2019). Characterizing land use/land cover using multi-sensor time series from the perspective of land surface phenology. Remote Sens. 11:1677. doi: 10.3390/rs11141677
Nguyen, H. T., Thanh, T. M., Doan, E. T., and McRoberts, R. E. (2020). Land use/land cover mapping using multitemporal Sentinel-2 imagery and four classification methods—a case study from Dak nong, Vietnam. Remote Sens. 12:1367. doi: 10.3390/rs12091367
Ocampo-Peñuela, N., Garcia-Ulloa, J., Kornecki, I., Philipson, C. D., and Ghazoul, J. (2020). Impacts of four decades of Forest loss on vertebrate functional habitat on Borneo. Front. Forests Glob. Change 3, 1–13. doi: 10.3389/ffgc.2020.00053
Ohki, M., and Shimada, M. (2018). Large-area land use and land cover classification with quad, compact, and dual polarization SAR data by PALSAR-2. IEEE Trans. Geosci. Remote Sens. 56, 5550–5557. doi: 10.1109/TGRS.2018.2819694
Paletto, A., Pieratti, E., De Meo, I., Agnelli, A. E., Cantiani, P., Chiavetta, U., et al. (2021). A multi-criteria analysis of Forest restoration strategies to improve the ecosystem services supply: an application in Central Italy. Ann. For. Sci. 78:7. doi: 10.1007/s13595-020-01020-5
Panfil, S. N., and Harvey, C. A. (2016). REDD+ and biodiversity conservation: a review of the biodiversity goals, monitoring methods, and impacts of 80 REDD+ projects. Conserv. Lett. 9, 143–150. doi: 10.1111/conl.12188
Pianzin, A., Wong, A., and Bernard, H. (2021). Riparian reserves serve as a critical refuge for asian otters (Aonyx cinereus and Lutrogale perspicillata) in oil palm dominated landscapes of Sabah, Malaysian Borneo. IUCN SSC Otter Spec. Group Bull. 38, 133–154.
Priyanka, R., Avtar, R., Rashmi Malik, M., Musthafa, V. S., Rathore, P. K., and Singh, G. (2023). Forest plantation species classification using full-pol-time-averaged SAR scattering powers. Remote Sens. Appl. 29:100924. doi: 10.1016/j.rsase.2023.100924
Putz, F. E., Zuidema, P. A., Synnott, T., Peña-Claros, M., Pinard, M. A., Sheil, D., et al. (2012). Sustaining conservation values in selectively logged tropical forests: the attained and the attainable. Conserv. Lett. 5, 296–303. doi: 10.1111/j.1755-263X.2012.00242.x
Qu, L., Chen, Z., Li, M., Zhi, J., and Wang, H. (2021). Accuracy improvements to pixel-based and object-based LULC classification with auxiliary Datasets from Google earth engine. Remote Sens. 13:453. doi: 10.3390/rs13030453
Robertson, D., Laura, A. M., Davidson, H. M. N., Hosseini, M., Mitchell, S., de Abelleyra, D., et al. (2020). C-band synthetic aperture radar (SAR) imagery for the classification of diverse cropping systems. Int. J. Remote Sens. 41, 9628–9649. doi: 10.1080/01431161.2020.1805136
Rouse, J. W., Haas, H., and Deering, W. (1974). Monitoring vegetation Systems in the Great Plains with ERTS. In: Third earth resources technology Satellite-1 symposium. Washington, DC: NASA, pp. 309–317.
Roy, A., and Inamdar, A. B. (2019). Multi-temporal land use land cover (LULC) change analysis of a dry semi-Arid River basin in Western India following a robust multi-sensor satellite image calibration strategy. Heliyon 5:e01478. doi: 10.1016/j.heliyon.2019.e01478
RSPO. (2015). Remediation and compensation procedure (RaCP) related to land clearance without prior high conservation value (HCV) assessment.
Seaman, D. J. I., Bernard, H., Ancrenaz, M., Coomes, D., Swinfield, T., Milodowski, D. T., et al. (2019). Densities of Bornean orang-utans (Pongo pygmaeus Morio) in heavily degraded Forest and oil palm plantations in Sabah, Borneo. Am. J. Primatol. 81:e23030. doi: 10.1002/ajp.23030
Sharifi, A., Felegari, S., and Tariq, A. (2022). Mangrove forests mapping using Sentinel-1 and Sentinel-2 satellite images. Arab. J. Geosci. 15:1593. doi: 10.1007/s12517-022-10867-z
Shivangi Somvanshi, P., Kunwar, N. B. S., and Kachhwaha, T. S.. (2011). Water turbidity assessment in part of Gomti River using high resolution Google Earth’s Quickbird satellite data. Geospatial World forum.
Solórzano, J. V., Mas, J. F., Gao, Y., and Gallardo-Cruz, J. A. (2021). Land use land cover classification with U-net: advantages of combining Sentinel-1 and Sentinel-2 imagery. Remote Sens. 13:3600. doi: 10.3390/rs13183600
Srivastava, S. K., and Gupta, R. D. (2003). Monitoring of changes in land use/land cover using multi-sensor satellite data. Map India Conference, pp. 1–7.
Strassburg, B. B. N., Iribarrem, A., Beyer, H. L., Cordeiro, C. L., Crouzeilles, R., Jakovac, C. C., et al. (2020). Global priority areas for ecosystem restoration. Nature 586, 724–729. doi: 10.1038/s41586-020-2784-9
Subramaniam, S., and Saxena, M. (2011). Automated algorithm for extraction of wetlands from irs RESOURCESAT LISS III DATA. International Archives of the Photogrammetry, Remote Sensing and Spatial Information Science, Volume XXXVIII, Part 8/W20,2011 XXXVIII (November).
Van Tricht, K., Kristof, A. G., Gilliams, S., and Piccard, I. (2018). Synergistic use of radar Sentinel-1 and optical Sentinel-2 imagery for crop mapping: a case study for Belgium. Remote Sens. 10:1642. doi: 10.3390/rs10101642
United Nations (UN). (2023). The 17 Goals. Available at: https://sdgs.un.org/goals (Accessed September 20, 2023).
Wawan, I. R. D., and Hapsoh, H. (2019). The effect of legume cover crop Mucuna bracteata on soil physical properties, runoff and Erosion in three slopes of immature oil palm plantation. IOP Conf. Ser. Earth Environ. Sci. 250:12021. doi: 10.1088/1755-1315/250/1/012021
Wong, Y. B., Gibbins, C., Badrul Azhar, S., Phan, S., Scholefield, P., Azmi, R., et al. (2023). Smallholder oil palm plantation sustainability assessment using multi-criteria analysis and unmanned aerial vehicles. Environ. Monit. Assess. 195:577. doi: 10.1007/s10661-023-11113-z
World Bank Group and Asian Development Bank. (2021). Climate risk country Profil: Malaysia. Available at: https://climateknowledgeportal.worldbank.org/country/malaysia/climate-data-historical.
Yalcin, M. (2020). A GIS-based multi-criteria decision analysis model for determining glacier vulnerability. ISPRS Int. J. Geo Inf. 9:180. doi: 10.3390/ijgi9030180
Yuan, Z., Wen, B., He, C., Zhou, J., Zhou, Z., and Feng, X. (2022). Application of multi-criteria decision-making analysis to rural spatial sustainability evaluation: a systematic review. Int. J. Environ. Res. Public Health 19:6572. doi: 10.3390/ijerph19116572
Keywords: environmental sustainability, multi-sensor, Borneo, multi-criteria decision analysis, tropical forest, plantations
Citation: Suab SA, Supe H, Louw AS, Korom A, Rakib MRM, Wong YB, Kemarau RA and Avtar R (2024) Assessing Borneo’s tropical forests and plantations: a multi-sensor remote sensing and geospatial MCDA approach to environmental sustainability. Front. For. Glob. Change. 7:1337535. doi: 10.3389/ffgc.2024.1337535
Edited by:
Mukunda Dev Behera, Indian Institute of Technology Kharagpur, IndiaReviewed by:
Alexander Röll, University of Bonn, GermanyVazeed Shaik, National Institute of Advanced Studies, India
Copyright © 2024 Suab, Supe, Louw, Korom, Rakib, Wong, Kemarau and Avtar. This is an open-access article distributed under the terms of the Creative Commons Attribution License (CC BY). The use, distribution or reproduction in other forums is permitted, provided the original author(s) and the copyright owner(s) are credited and that the original publication in this journal is cited, in accordance with accepted academic practice. No use, distribution or reproduction is permitted which does not comply with these terms.
*Correspondence: Ram Avtar, cmFtQGVlcy5ob2t1ZGFpLmFjLmpw