 Chunxi Gu
 Zhenyan Zhou
 Guanglong Ou
94% of researchers rate our articles as excellent or good
Learn more about the work of our research integrity team to safeguard the quality of each article we publish.
Find out more
ORIGINAL RESEARCH article
Front. For. Glob. Change, 26 July 2024
Sec. Forest Management
Volume 7 - 2024 | https://doi.org/10.3389/ffgc.2024.1298804
This article is part of the Research TopicInteractions Between Forest Management and Carbon Balance: Mechanisms, Simulation and PracticeView all 8 articles
Amid global carbon reduction and climate action, precise forest carbon storage estimation is crucial for comprehending the carbon cycle. This study forecasts P. kesiya var. langbianensis forests’ 2030 stand carbon storage using data from 81 permanent plots across three Yunnan Province forest surveys and remote sensing. Findings: (1) In 2000, storage ranged from 26 to 38 t·hm−2. Central areas had higher values; southwest and southeast exceeded northwest and northeast. By 2010, storage grew eastward, receded northward. By 2020, east storage declined, southwest rose. (2) GM (1,1) model: posterior difference C 0.001, R2 power function model 0.945, GM (1,1) p value 0.999, power function model p value 0.997. (3) Predictions: Cosivarang border forest’s 2030 carbon stock 2850.804 t·hm−2, up 103.463 t·hm−2 from 2000. At 2022’s certified Emission Reduction carbon price of 60 yuan/ton, 2030’s carbon asset value per unit (t·hm−2) approx. 6207.78 Yuan, compared to 2000. Integrating gray system theory, especially GM (1,1) model, robustly addresses “small data and uncertainty” system challenges. Introducing GM (1,1) gray theory in forestry research offers fresh insight into forest carbon sink dynamics.
Global climate change has become one of the most significant environmental problems and complex challenges faced by human being in the 21st century. Addressing this issue has led to the signing of international treaties such as the Kyoto Protocol and the Paris Agreement (Wei et al., 2018, 2022; Liang et al., 2022). The commitment to reducing carbon emissions is exemplified by China’s pledge to take a leading role. By implementing effective policies, China aims to achieve the “two carbon goals” of peaking carbon emissions by 2030 and achieving carbon neutrality by 2060 (Wang et al., 2021).
The concept of carbon peaking involves reaching the historical pinnacle of carbon dioxide emissions, followed by a period of decline. This signifies a pivotal shift from emission increase to decrease. The pursuit of the “two carbon goals” aligns with the aspiration for an improved quality of life after fulfilling basic material needs. Moreover, the timing and extent of carbon peaking directly influence emission reduction and the duration of the transition to carbon neutrality. Among terrestrial ecosystems, forests house the largest carbon reservoir, exceeding other ecosystems in carbon storage per unit area (Li and Jiang, 2004; Kuuluvainen and Gauthier, 2018; Lan et al., 2021). Optimal utilization of forest carbon sequestration proves to be a cost-effective approach. In comparison to industrial emission reduction, this strategy proves more efficient and vital in combating global climate change (Richards and Stokes, 2004; Makkonen et al., 2015; Pingoud et al., 2016). As global efforts toward carbon reduction and climate action persist, the exploration of forest carbon storage has gained substantial scholarly attention. Accurately assessing forest carbon stocks has evolved into a pivotal facet of research concerning global climate change and the carbon cycle (Siddiq et al., 2021).
In recent years, forest carbon storage research has progressed from the embryonic stage to rapid development (Ma, 2019). The effects of intensive forest management on carbon stocks were analyzed using forest growth models (Schroeder, 1991). Nepal et al. (2012) assessed the carbon sink potential of the US forest sector by integrating forest yield (USFPM/GFPM) with the matter method and WOODCARB2 model. Estimation of tree biomass and carbon stocks in subtropical and temperate forests in the central Himalayas, India, was conducted by Vcja et al. (2021). While Chinese scientists initiated forest carbon storage and cycle research relatively late, the focus primarily shifted to carbon storage and sink measurements since China’s establishment. In the 1990s, Chinese scholars began estimating national forest biomass, carbon storage, and carbon density, proposing regional and national estimation methods. Fang (2004) employed an improved biomass conversion factor method based on China’s forest resource inventory data to estimate historical dynamic changes in China’s forest carbon storage. Zhang and Wu (2021) analyzed the relationship between forest biomass and carbon change, and indicated that both stand carbon and total carbon storage increased from 1977 to 2018. Their studies reveal a clear upward trend, pointing to a substantial future carbon sink potential in China. Che (2020) employed regression fitting models to predict the total forest carbon pool in Gansu Province, China. However, a previous study (Amaro et al., 2013) showcased limitations in traditional forest carbon stock estimation methods, including the sample inventory, vorticity correlation, and model estimation methods. Prior research summarized various techniques for measuring forest carbon stocks, utilizing remote sensing technologies such as aerial lidar, satellite observations, GPS positioning, and meteorological approaches for precise stand carbon storage estimation. Given the diversity in forest carbon storage measurement, the selection of key factors and research methods for future carbon storage prediction remains non-uniform. While influencing factors and research methods for predicting future carbon stocks vary, achieving significant breakthroughs in time series carbon stock prediction poses challenges (Deng, 1988). Simultaneously, amid the global trend toward carbon emission reduction and climate action, accurate forest carbon stock estimation assumes paramount importance in studying global climate change and the carbon cycle. This estimation not only unveils prospective changes in forest carbon stocks and anticipates their primary developmental trajectories, but also furnishes theoretical guidance for enhancing global climate change response and forest management. Moreover, it holds significant strategic importance for China to reach peak carbon neutrality under the vision of a carbon trading market.
Accurately estimating carbon storage is crucial for assessing the carbon sequestration capacity of ecosystems. To predict and estimate carbon storage, researchers employ various mathematical models and techniques based on ground measurements, remote sensing data, climate, and land use data. Traditional forest carbon storage predictions typically integrate field data with remote sensing using correlation models to back-calculate biomass, but there are relatively few instances of future forest carbon storage predictions. Wang Fenghua et al. conducted a comparative analysis of multiple stepwise regression, partial least square regression, and radial basis function neural network models for estimating carbon stocks. The results indicated that the radial basis function neural network model demonstrated superior performance in estimating forest carbon stocks, with a coefficient of determination reaching 0.645 (Wang et al., 2019). Cao Cong used ordinary least squares (OLS) model and four geographically weighted regression (GWR) models to predict the spatial distribution of forest carbon stocks in the Pearl River Delta. The research shows that: All the four GWR models have better fitting effect and independent sample test results than the OLS model, and the MGWR (Gaussian) model has the best fitting effect (Cao et al., 2023). Zou Weimin applied the Geographically Weighted Regression (GWR) model to estimate forest carbon storage and its spatial distribution in Songyang County, achieving an R2 value of 0.71 (Zou et al., 2023). Wu Wenqi et al. applied the gray GM (1,1) model in predicting urban atmospheric pollutant concentrations. The model passed residual analysis and posterior difference checks, with results falling within acceptable ranges, indicating high accuracy (Wu, 2019). Fan Chengjie et al. developed GM (1,1) gray prediction models for six types of atmospheric pollutants to investigate the future five-year development trends in Linfen City. Following residual analysis, the predicted results were found to be feasible (Fan, 2021). Huang Xinyi et al. effectively forecasted carbon emissions in Jiangsu Province from 2022 to 2026 using the GM (1,1) prediction model. The predictions demonstrated high accuracy and reliability, with calculations being relatively straightforward (Huang et al., 2022). It can be concluded that the GM (1,1) model has a good estimation ability. Based on this, GM (1,1) is used to predict forest carbon storage.
The gray system theory, proposed by Deng Jurong in the 1980s (Dong et al., 2022), serves as a valuable tool for predicting system behavior through time series datasets. It involves accumulating and mining existing data from limited samples, uncovering system connections and change rules, leading to objective predictions of future data (Deng, 1990; Kayacan et al., 2010; Wang et al., 2020). At the heart of the gray prediction model lies the GM (1,1) model (Deng, 1985; Deng, 2002; Liu and Chi, 2021), which addresses analysis, prediction, decision-making, and control for systems characterized by “small data and uncertainty.” CM (1,1) effectively fits and predicts characteristic values within complex systems, revealing future change patterns and developmental trends (Jiang, 2016; Zeng, 2016). GM (1,1) has proven its efficacy in various applications such as analyzing forest carbon sink potential in Beijing and China (Zhang et al., 2022a,b), forest carbon sink prediction under diverse management levels in Jiangxi Province (Kang and Fu, 2022), and studying influencing factors on forest carbon storage in Hebei Province (Dong et al., 2022).
In this study, we collected stand carbon storage data from sample plots within P. kesiya var. langbianensis forests. Through integration with remote sensing data, we employed the GM (1,1) model to predict stand carbon storage for P. kesiya var. langbianensis forests in 2030. This allowed us to explore change patterns and quantify carbon storage contributions, aligning with carbon peak and neutrality objectives.
The study sites (Figure 1) are situated in the southern region of the Yunnan province, encompassing a blend of subtropical and tropical zones, exhibiting an average annual temperature spanning from 17°C to 22°C. Annual precipitation exceeds 1,500 mm, while relative humidity surpasses 80%. The study area comprises expansive valleys, as well as low mountains and hills, with altitudes ranging from 600 m to 1700 m. P. kesiya var. langbianensis, a distinctive tree species in Yunnan, is predominantly distributed across Malipo County, Puer City, Mangshi City of Dehongtai, and the Jingpo Autonomous Prefecture in western Yunnan. These regions collectively encompass 11% of Yunnan’s forest-covered expanse. This evergreen tree species belongs to the Pinus kesiya family and thrives as a light-demanding plant, favoring elevated temperatures and humid environments. Conversely, it exhibits intolerance toward cold, arid conditions, and infertile soil. Recognized as a fast-growing coniferous species, P. kesiya var. langbianensis holds significant economic value alongside its ecological roles and services, including carbon sequestration.
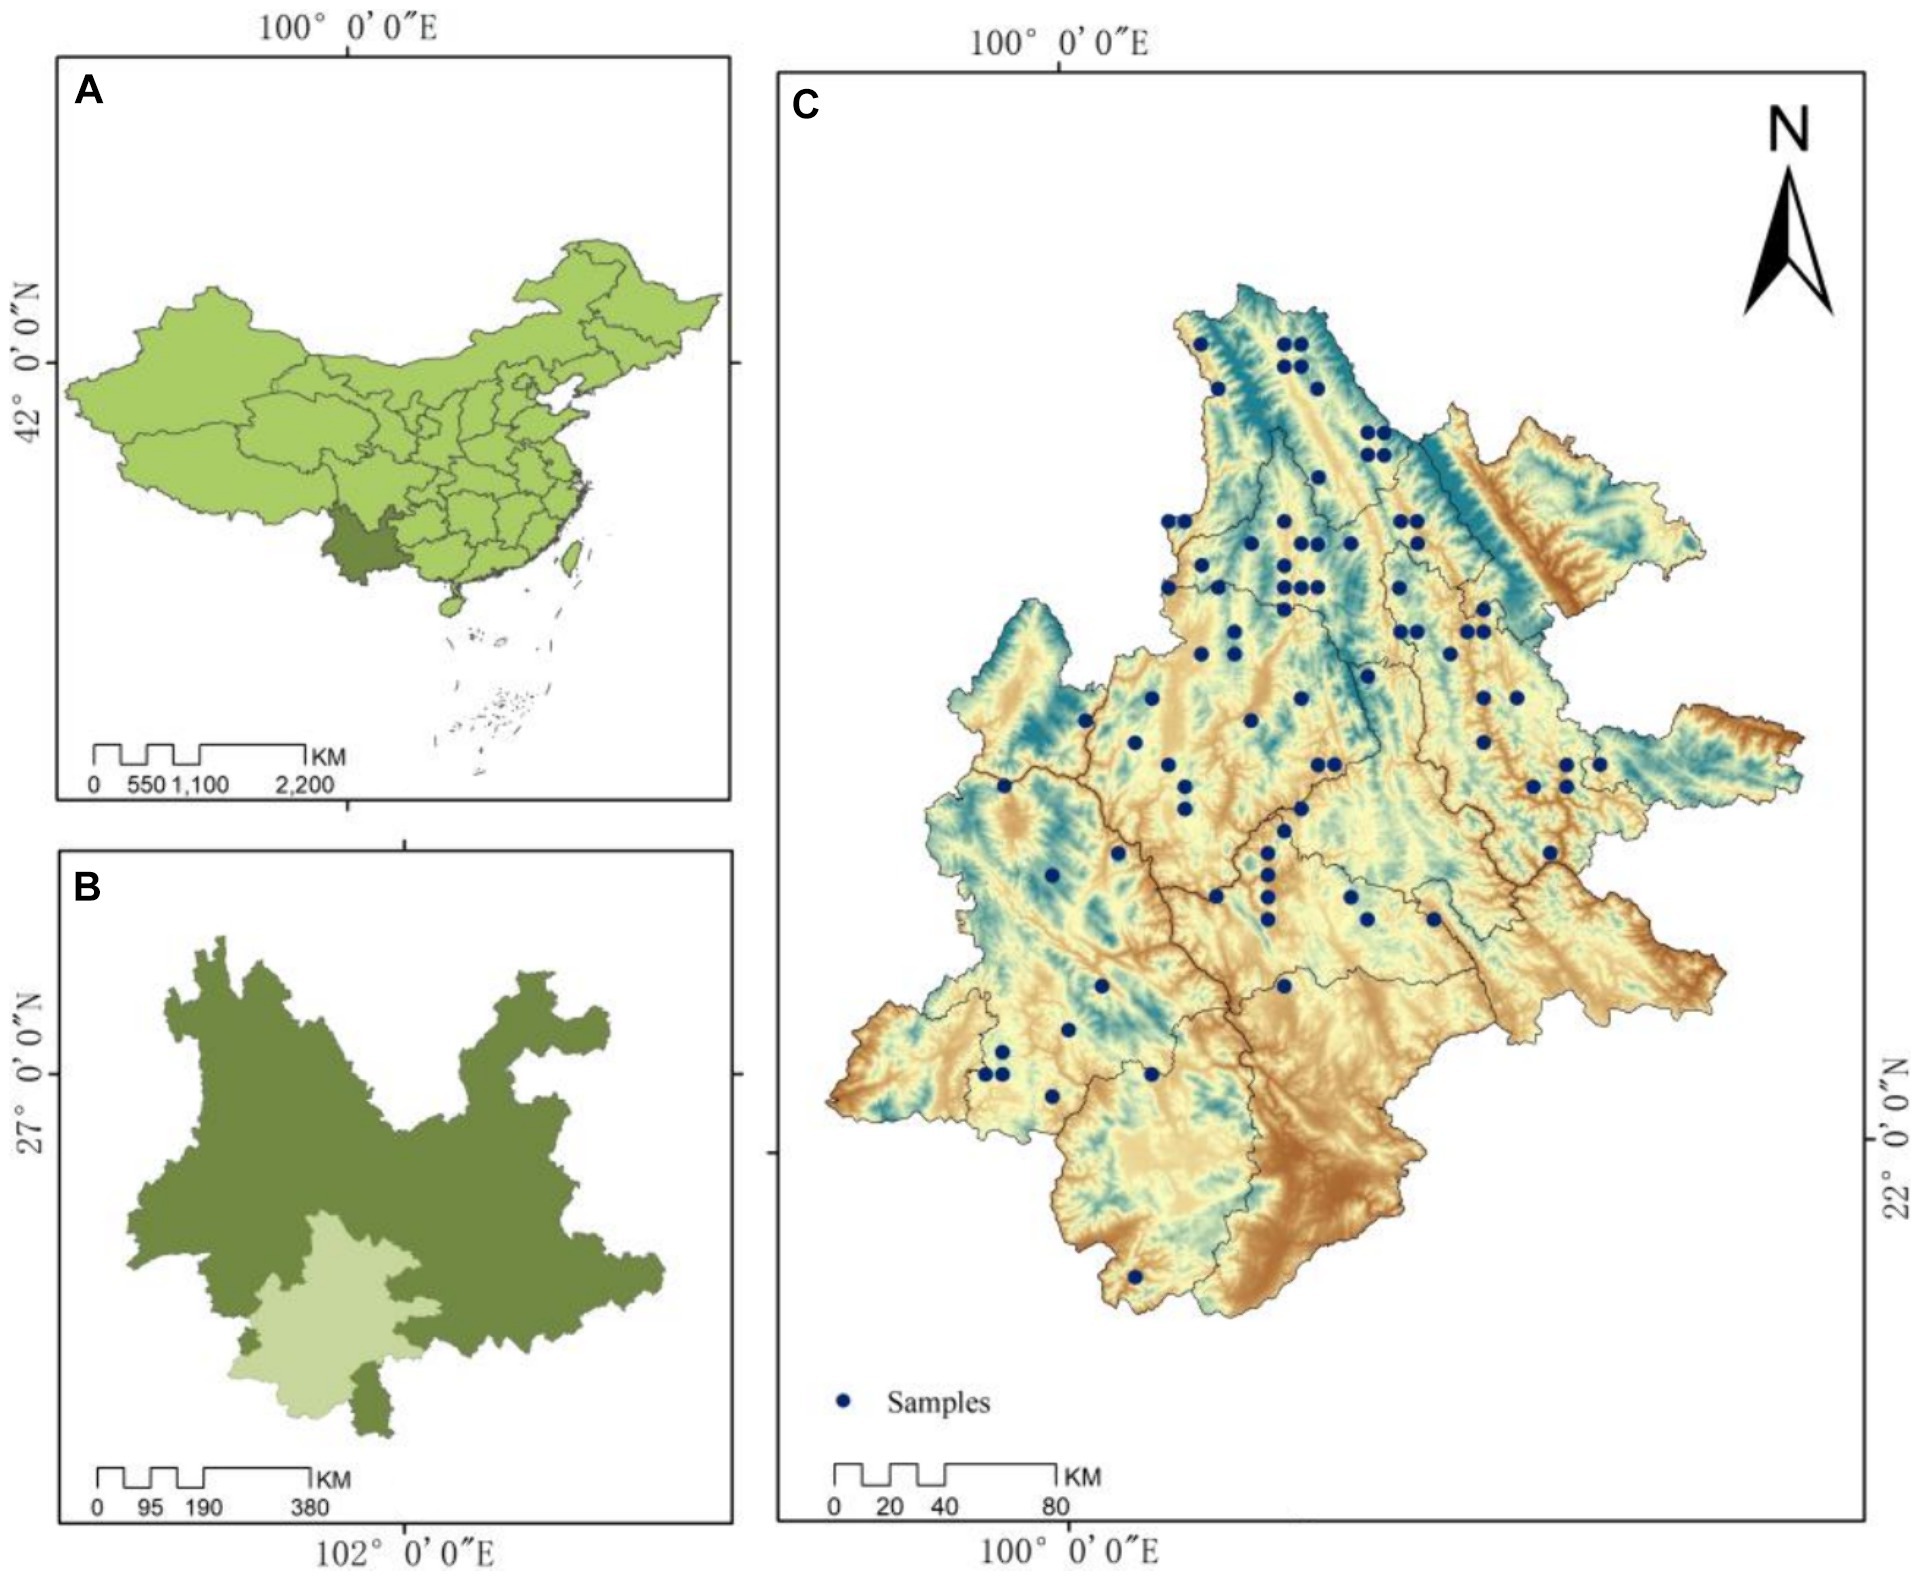
Figure 1. Sample plot distribution. The standard map downloaded from the standard map service website is GS (2019)1823, and the base map is not modified.
Carbon storage data for P. kesiya var. langbianensis forests were collected from a total of 89 permanent plots. Over three periods of assessment (2007, 2012, and 2017), forest inventories were conducted in Yunnan. Following the mitigation of disturbances, 81 plots remained, with P. kesiya var. langbianensis emerging as the dominant tree species, encompassing all its varieties. Landsat images were acquired from the study area via the Google Earth Engine remote sensing cloud platform, including Landsat 7 (2000, 2002, 2007, and 2010) and Landsat 8 OLI (2020), with no identified issues after inspection. Figure 1 illustrates the distribution of sample plots, with 81 forest plots (c) strategically positioned for stand carbon storage measurement in Pu’er Prefecture (b), Yunnan Province (a). The carbon storage summary for the study area is presented in Table 1, while Table 2 provides the remote sensing image dataset.
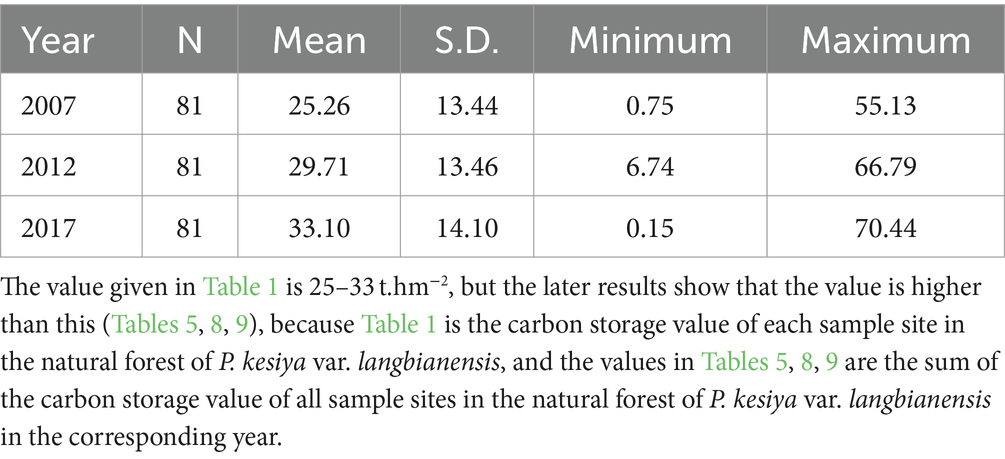
Table 1. Statistical characteristics of carbon storage at sample sites in Pinus kesiya var. langbianensis forests (t.hm−2).
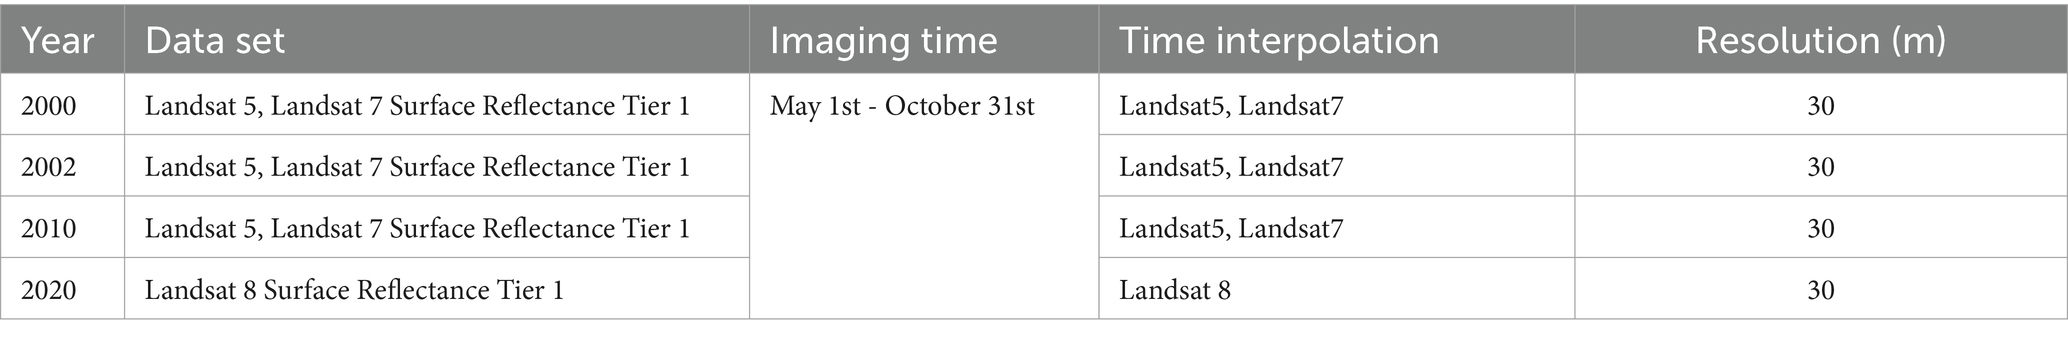
Table 2. Remote sensing image data sets.
ENVI 5.3 software was employed to preprocess the Landsat images. Remote sensing features provide rich surface information that is closely related to vegetation cover, thereby enabling estimation of carbon storage. Analyzing these remote sensing features allows for a more accurate assessment of terrestrial ecosystem status and carbon cycling processes, thereby supporting and providing a basis for carbon storage evaluation. A total of 73 remote sensing features (Table 3) were extracted from Landsat 7 (2000, 2002, and 2007) and Landsat 8 OLI (2020) images, categorizing into four types for constructing the carbon storage estimation model for P. kesiya var. langbianensis forests. These types encompass single-band factors, information enhancement factors (utilizing principal component analysis, PCA), vegetation index factors, and texture features. Texture features were extracted using 3 × 3, 7 × 7, and 5 × 5 windows, with Pearson correlation analysis favoring the 3 × 3 window over 5 × 5 and 7 × 7. Consequently, this study adopts the 3 × 3 window. The 73 extracted remote sensing factors were loaded into ArcGIS software to establish a connection with field-collected plots. Pearson correlation coefficient was computed to assess the relationship between carbon storage and the extracted features (2007). Significant correlations were used for modeling. This approach was replicated for images acquired in 2000, 2002, 2010, and 2020.
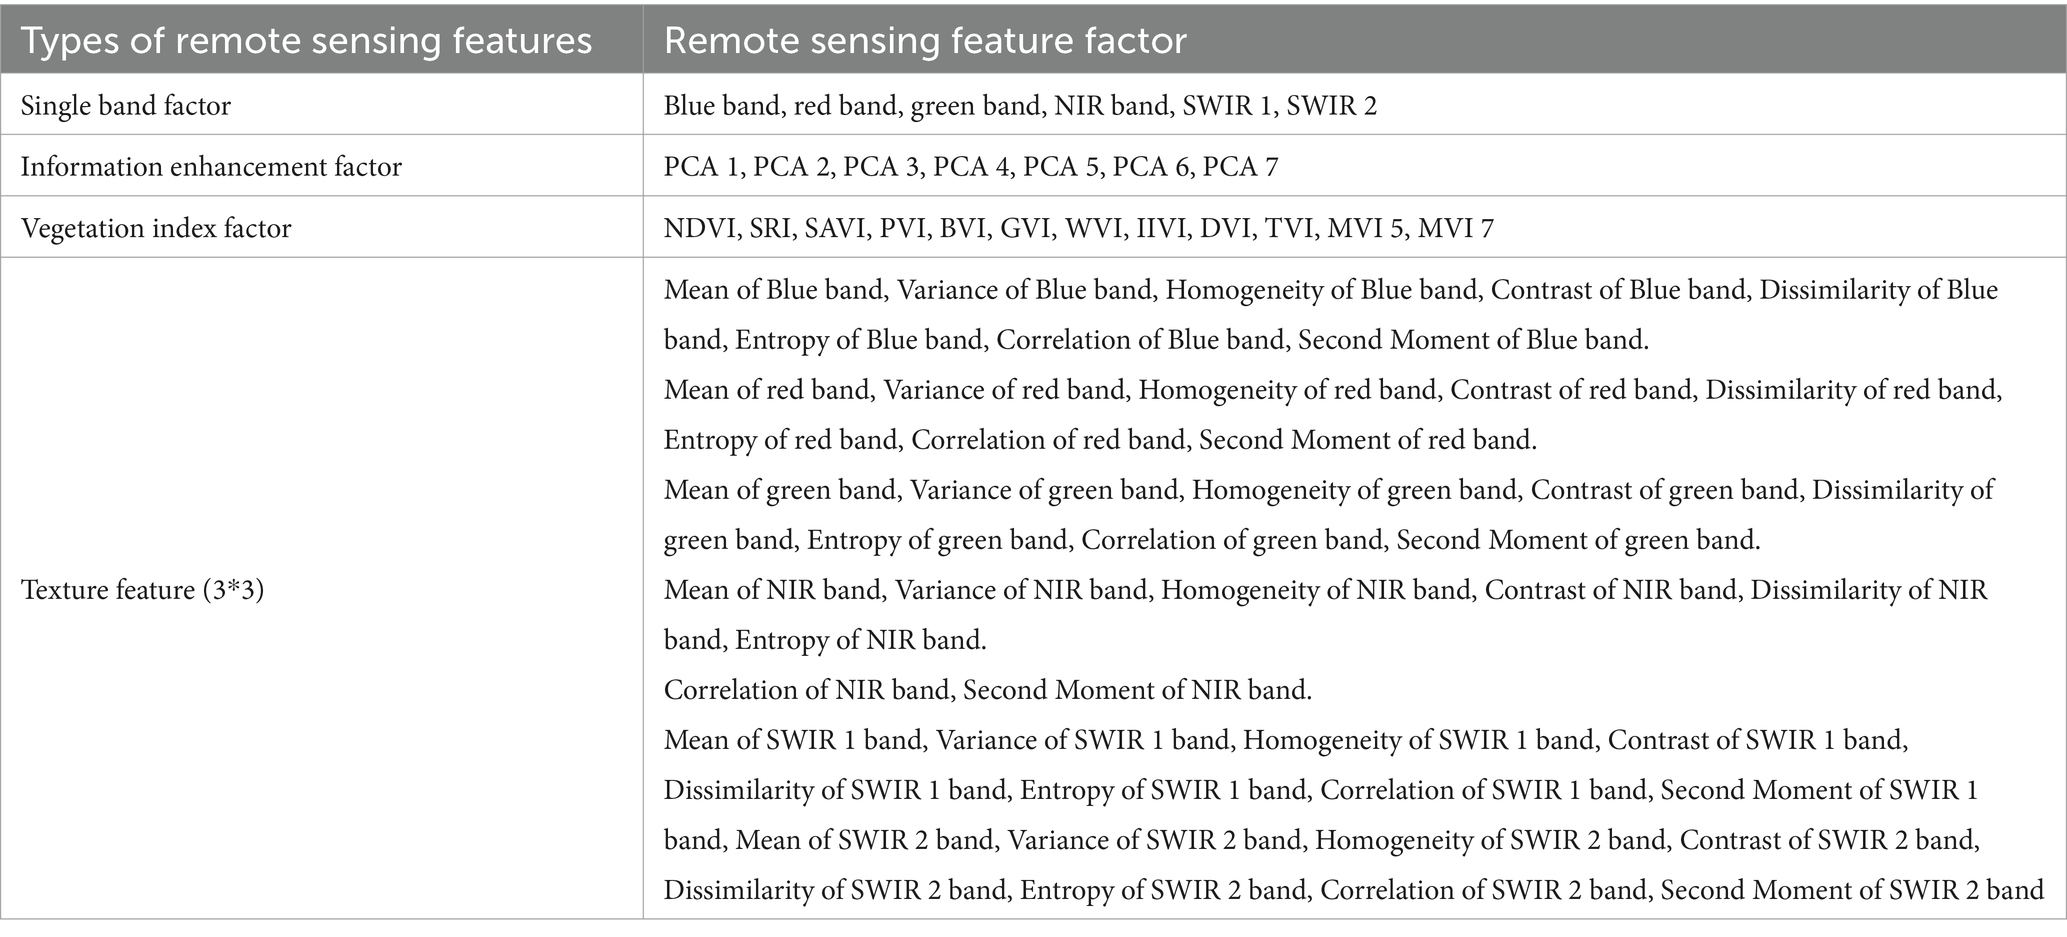
Table 3. Feature factor extraction from remote sensing.
In this study, carbon storage was estimated using three algorithms: the K-nearest neighbor (K-NN) method, the random forest regression model, and the partial least squares regression. Utilizing data from 81 permanent plots in the Yunnan Forest survey of 2007 and Landsat satellite remote sensing images obtained from the Google Earth Engine remote sensing cloud platform, regression modeling and evaluation occurred over three feature selection stages. The optimal remote sensing model for estimating carbon storage in the P. kesiya var. langbianensis forest was chosen. Model performance was assessed through determination coefficient (R2) and root mean square error (RMSE), while predictive capability was measured by prediction accuracy (P). Employing the selected model alongside remote sensing feature variables for relevant years (2000, 2002, 2010, and 2020), carbon storage for P. kesiya var. langbianensis forest in those corresponding years was inferred. Using the GM (1,1) model, carbon storage for P. kesiya var. langbianensis forest in 2002 and field data from 2007 and 2012 were fitted, with subsequent prediction and comparison of carbon storage for P. kesiya var. langbianensis forest in 2017 against measured 2017 data. This process demonstrated the viability of the GM (1,1) model. Upon demonstrating the feasibility of the GM (1,1) model, the carbon storage model for the P. kesiya var. langbianensis forest in 2000, 2010 and 2020 was established, along with the prediction of its carbon storage up to 2030. To compare the predictive capabilities of the GM (1,1) model, the power function model was used as its counterpart. The technical process is shown in Figure 2.
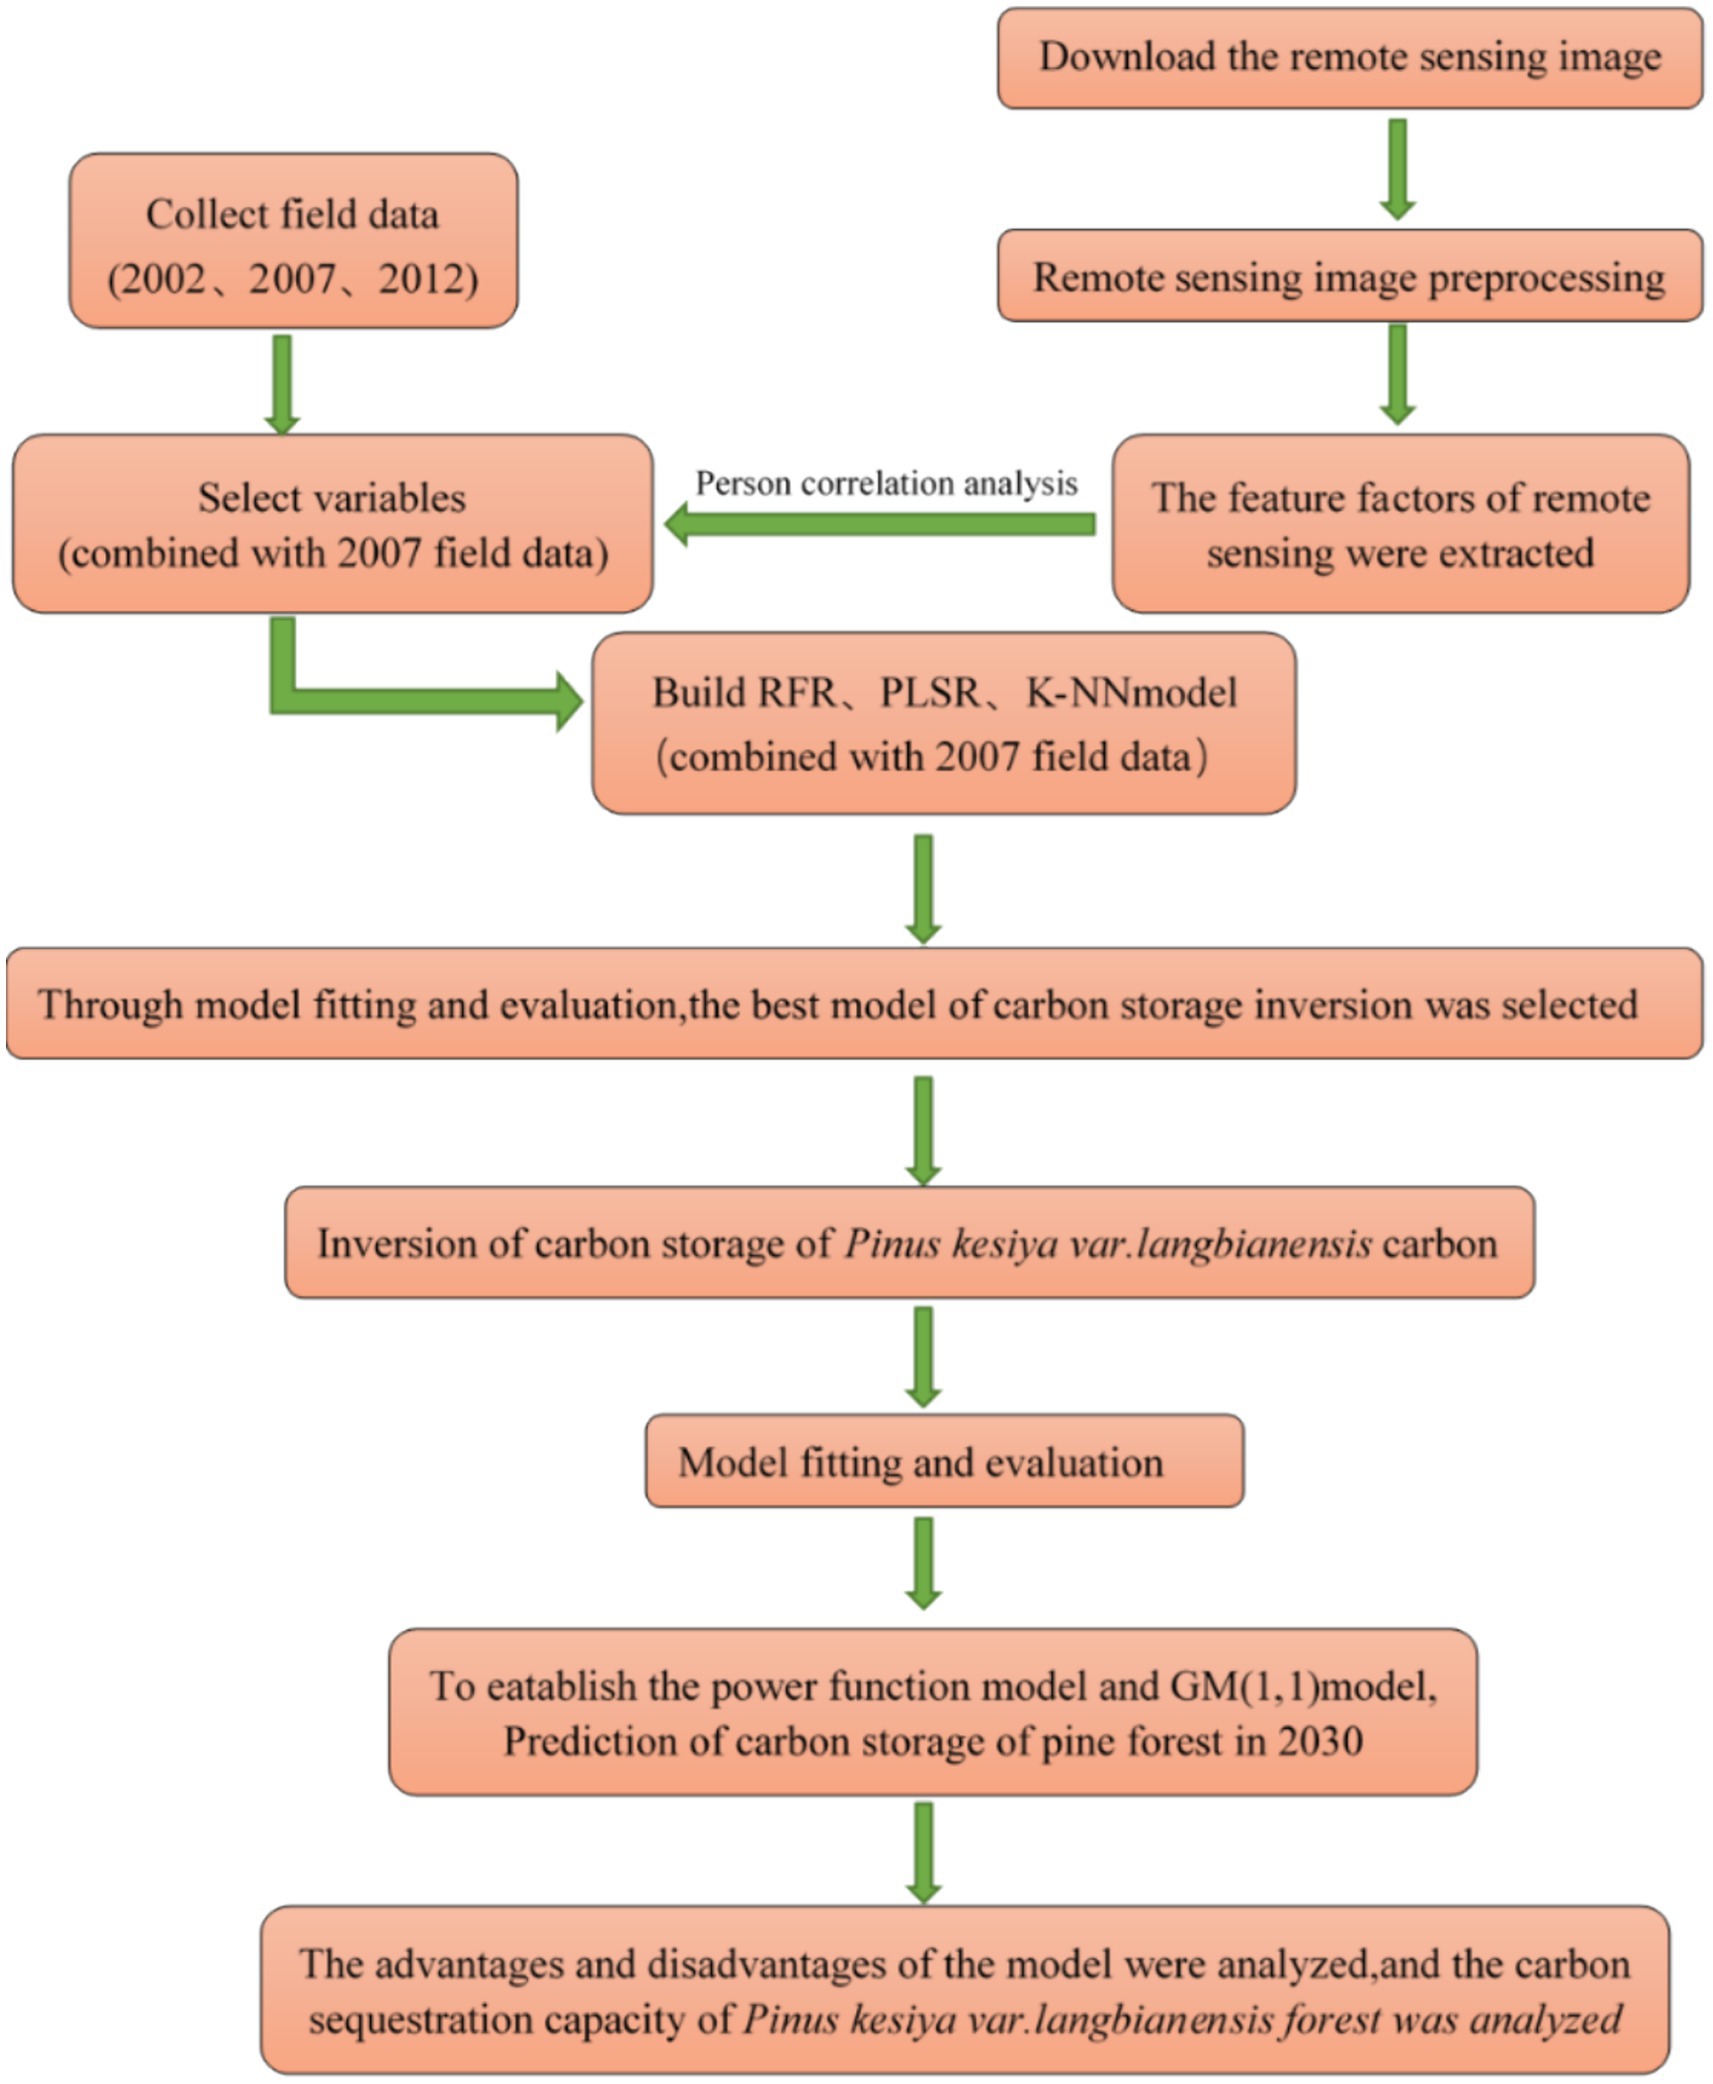
Figure 2. Technology roadmap.
The K-NN method algorithm was proposed by COVER et al. in 1968 (Jiang et al., 2003) and at first it is one of the basic classification algorithms. In this study, it is used as a retrieval function, the estimated value Mp is a continuous variable such as carbon storage here at pixel P, it is calculated as follows (eq. 1):
where is the measured value at reference sample location i of variable M; k is the number of neighbors considered when calculating the predicted value ; indicates the pixel weight.
Partial least squares regression (PLSR) of the random forest regression model involves synthesizing the outcomes of multiple established decision tree models to derive a single model. The final prediction is obtained by averaging the results from these decision tree models, resulting in high fitting accuracy. Additionally, it exhibits robustness against noise and outliers, effectively preventing overfitting. This approach often achieves superior generalization performance and accuracy compared to a standalone regression tree (Liu et al., 2014).
PLSR combines various analytical techniques, including principal component analysis, canonical correlation analysis, and multiple linear regression analysis. PLSR effectively addresses the challenges of multiple correlations and variable noise during the process of multiple regression analysis. This method serves a predictive role and mitigates the impact of parameter structure uncertainty and model non-identification (Breiman, 1996). Its basic formula is as follows (eq. 2):
where is model parameter, is dependent variable (biomass), is independent variable (remote sensing factor).
The model performance was validated through R2 (eq. 3), RMSE (eq. 4), and P (eq. 5).
The advantages of gray prediction include lower data requirements, ease of original operation, high short-term prediction accuracy, and testability. A gray differential prediction model can be established with limited incomplete information to provide a fuzzy long-term description of developmental patterns. The core model of the gray approach is the GM (1,1) model, primarily used for sequence prediction. This model employs exponential curve fitting following the accumulation of original data. The modeling process encompasses original sequence accumulation, background value construction, parameter estimation for the defined equation, and predicted value calculation using the solution of a unary first-order linear differential equation.
For the GM (1,1) model:
Let the original sequence be , where is a continuous function, and the sequence is accumulated once to generate the sequence , (Li, 2007) (eq. 6) then
Accumulation can reduce the randomness of the scattered original data, thereby showing an approximate exponential growth law. Deng proposed to establish the following differential equation form according to the sequence generated by one accumulation, which is the whitening differential equation of GM (1,1) model:
Integrating it over the interval [I, i + 1], the
Of which
The in the interval [I, I + 1] on the background value of , generally averaged forms, namely
Then, there is
Substituting Equations (9) and (11) into equation (8), the discretization equation of Formula (7) of whitening differential equation of GM (1,1) model is obtained, and it is called the defining equation of GM (1,1) model:
In Equation (12), a is a development coefficient, its size and positive or negative can reflect the development trend of the original column. b is the gray action.
The development coefficient an of GM (1,1) is given as follows:
The restricted area is ;
The allowable region is .
Because when a = 2, all the predictions that can be inferred are , when a, all the predictions that can be inferred are going to infinity, However, when and , the predicted value is positive or negative, and the model is rendered irrelevant. The GM (1,1) model feasibility can be judged by the level ratio of the original sequence (Li, 2007) (eqs. 13–24).
Let the original sequence be , where n is the observed values, and let be the level ratio of the original sequence:
It calculates and judges the level ratio of the observed values, with the model being established only when all the level ratios fall into the calculation range. In this study, the GM (1,1) model accuracy is tested by post-residual and post-posterior tests. For the residual test method, the residual is the difference between the real and estimated values, with the residual test testing the gradual deviation degree between the estimated and the real values.
Let the original data and simulated data be:
Subtract to get the residual, then the residual sequence
Of which
Calculating relative error
Then has the average relative error.
The smaller was the relative error value, the better. Generally, < 20% means good fitting. For posterior difference method, the variances of the original data series X (0) and the predicted residual series E are shown below:
Of which
The posterior difference ratio is
Small error probability P
is the mean of the residual sequence
When C has a small value, it indicates that is small and is large. A large value indicates significant dispersion in observed data or large swing amplitude in original data, signifying poor data regularity. Conversely, a small indicates low dispersion in prediction errors. Thus, effective prediction necessitates minimizing while considering ; a smaller comprehensive index C is preferable. Here, 0.35 < C ≤ 0.65. P denotes error frequency, and a larger P indicates better performance. A typical requirement for P is >0.95 and not <0.7.
The study employed the Pearson correlation coefficient to assess the sensitivity of extracted remote sensing features. The dependent variable was the stand carbon storage of the P. kesiya var. langbianensis forest plot, while the independent variables consisted of the extracted features. A total of 11 remote sensing features were found that were significantly correlated (p < 0.001; Figure 3) with the stand carbon storage, which were chosen as potential variables for constructing the model. These features encompass PCA2, SRI, TVI, IIVI, SAVI, NDVI, MVI7, B7Mean, B3Mean, B2Mean, and B2Coreelation, with B3Mean displaying the highest correlation (r = 0.41) and B2Coreelation exhibiting the lowest correlation (r = 0.32) among the selected variables.
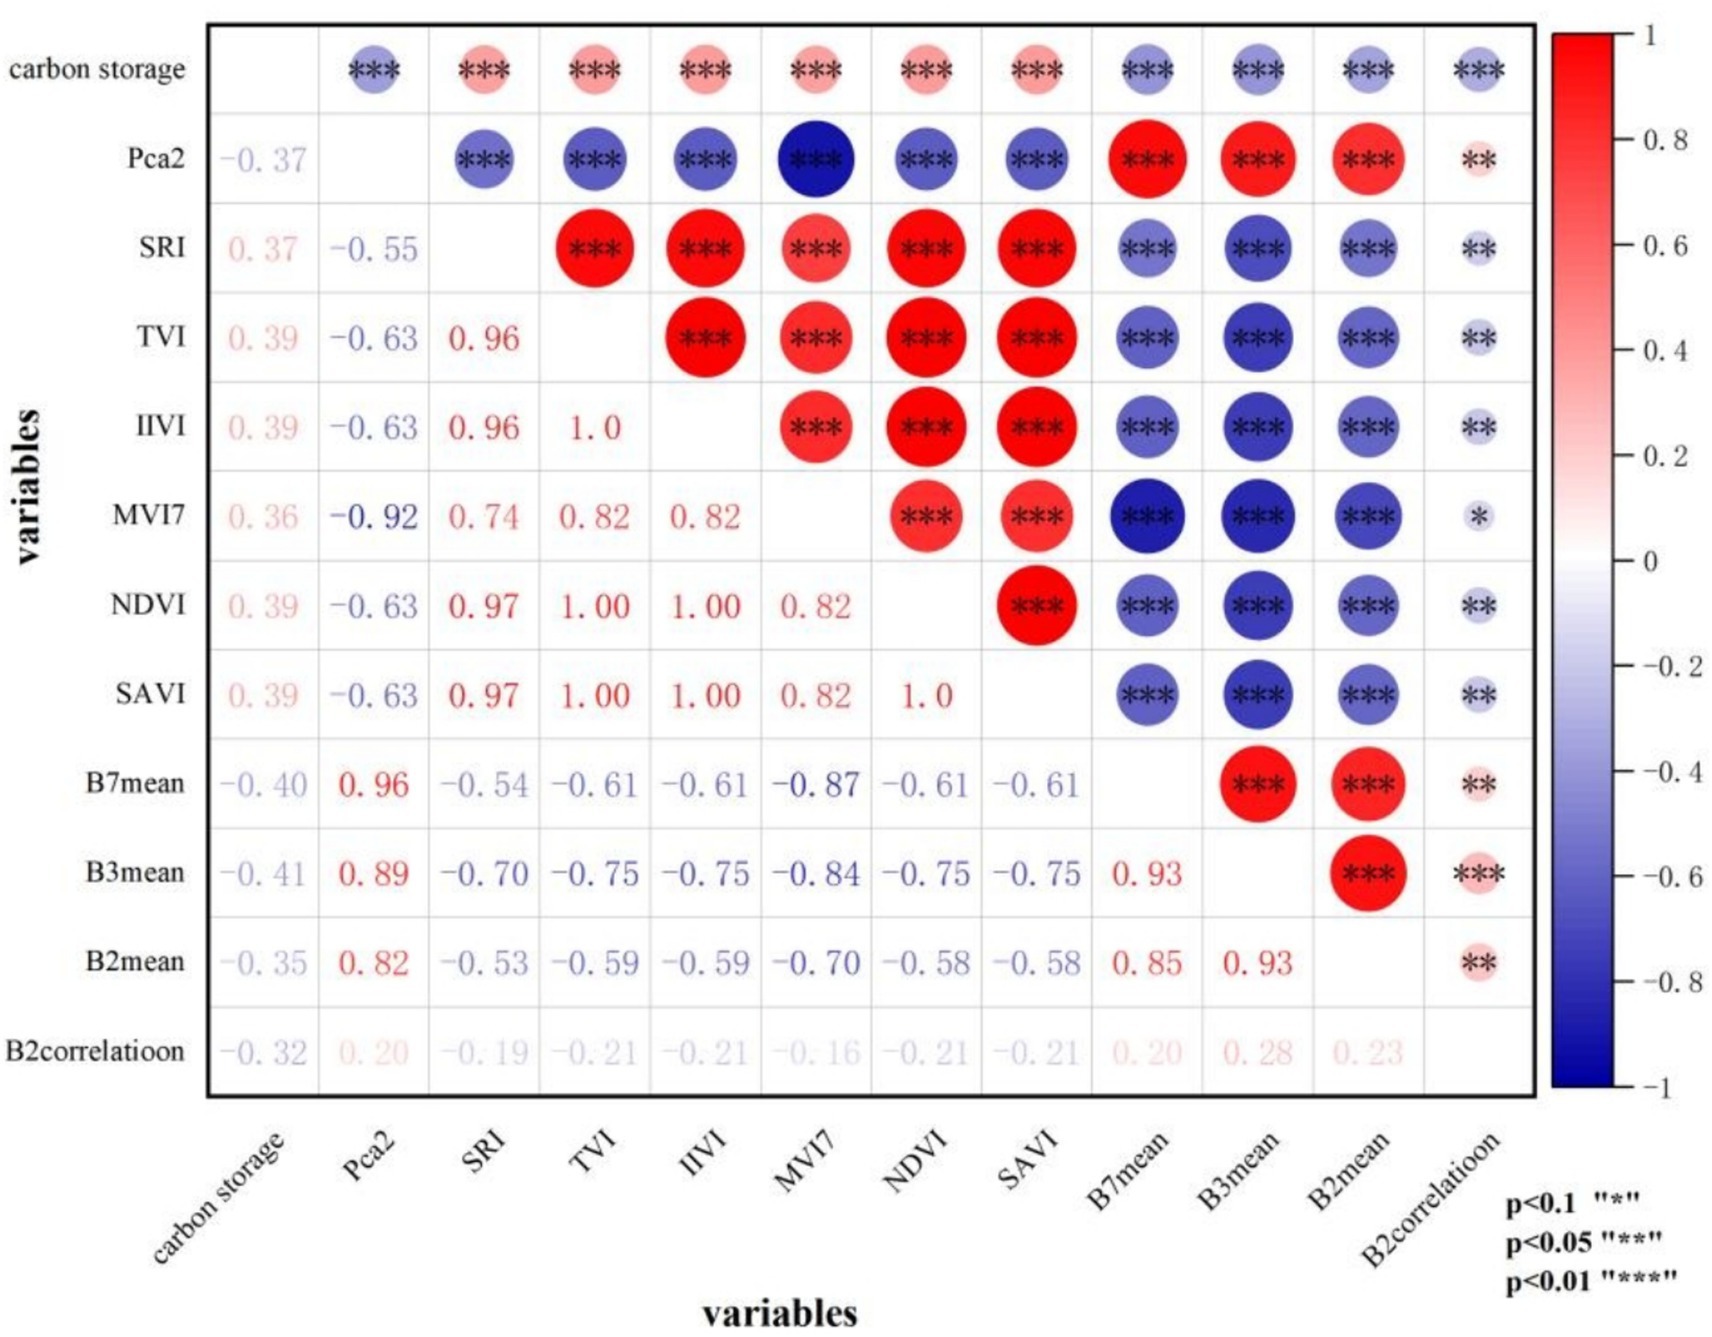
Figure 3. Correlation analysis diagram.
In 2007, data from 81 permanent sample plots were utilized to fit three models (KNN, PLSR, and RF) for stand carbon storage estimation. The RF model exhibited the highest determination coefficient (R2 = 0.83), minimal root mean square error (RMSE = 5.55), and the highest prediction accuracy (p = 83.2%; Table 4). This suggests that the RF model is suitable for estimating stand carbon storage in natural P. kesiya var. langbianensis forests.
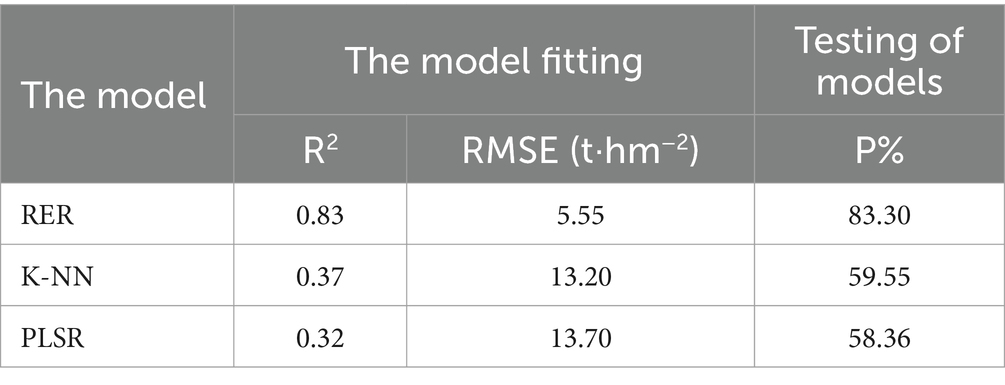
Table 4. Based on RFR, K-NN, PLSR model fitting.
Random forest the application of the RF model extended to estimating stand carbon storage in P. kesiya var. langbianensis forests for 2000, 2002, 2010, and 2020 (Table 5; Figure 4), as well as generating a spatial distribution map of carbon storage (Figure 5).
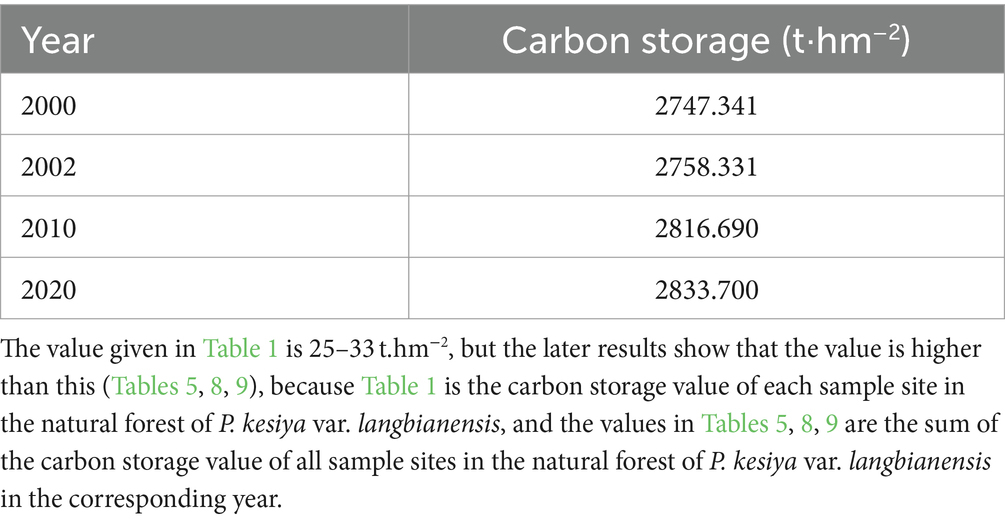
Table 5. Inversion of annual carbon storage.
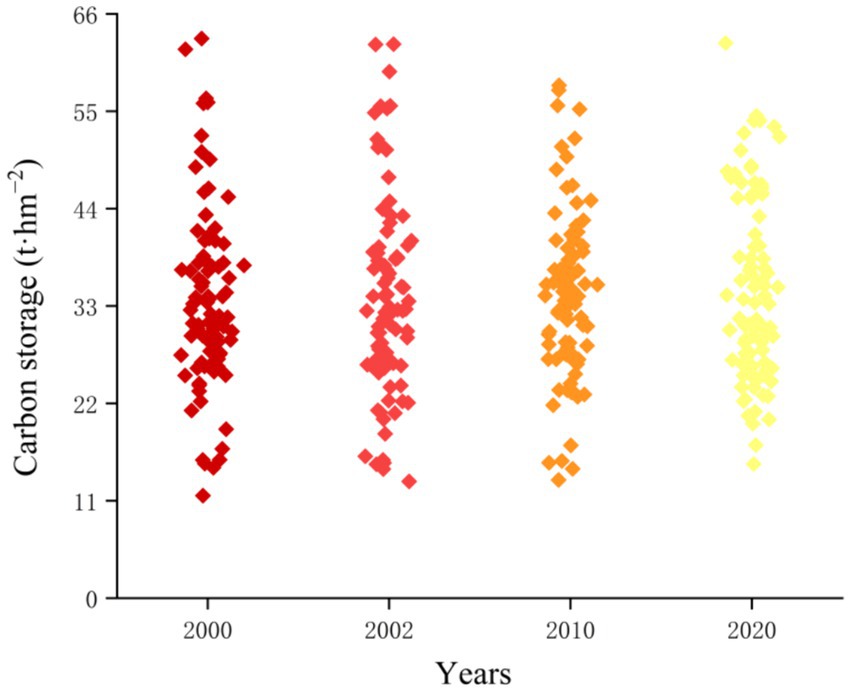
Figure 4. Carbon storage at the sample site.
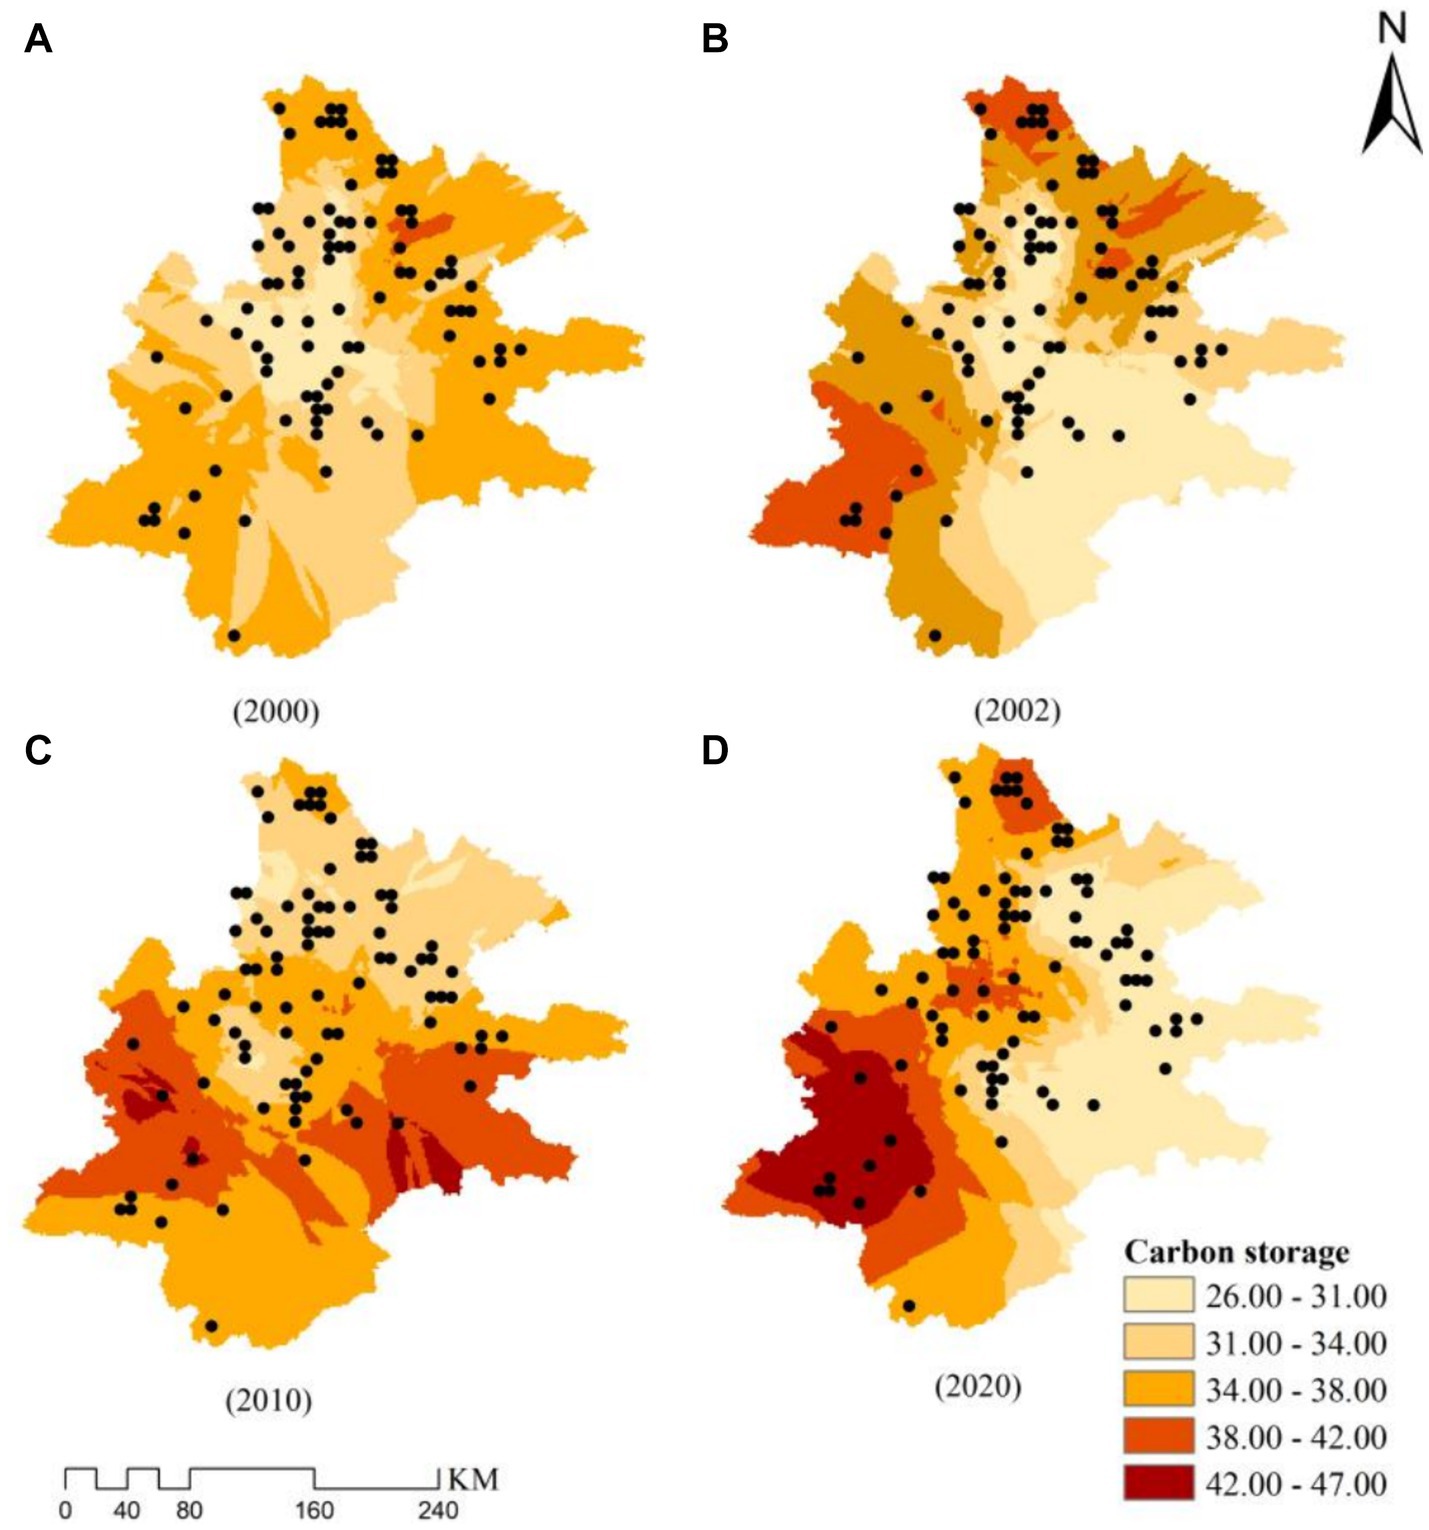
Figure 5. Carbon storage distribution at sample sites.
According to Table 6, the inversion of carbon storage value for P. kesiya var. langbianensis plot revealed an upward trend in average carbon storage from 2000 to 2020. In 2020, the average carbon storage of P. kesiya var. langbianensis plots increased by 1.786 t·hm − 2 compared to the average carbon storage of P. kesiya var. langbianensis plots in 2000. Notably, the standard deviation of carbon storage for P. kesiya var. langbianensis plots in 2010 (10.396 t·hm−2) was lower than that in 2000, 2002, and 2020. The minimum carbon storage value in 2000 was inferior to that in 2002, and the 2010 value was lower than the 2002 value, while the 2020 value surpassed the 2010 value. The maximum value experienced a decrease followed by an increase from 2000 to 2020. However, the maximum value in 2020 remained lower than the 2000 value.
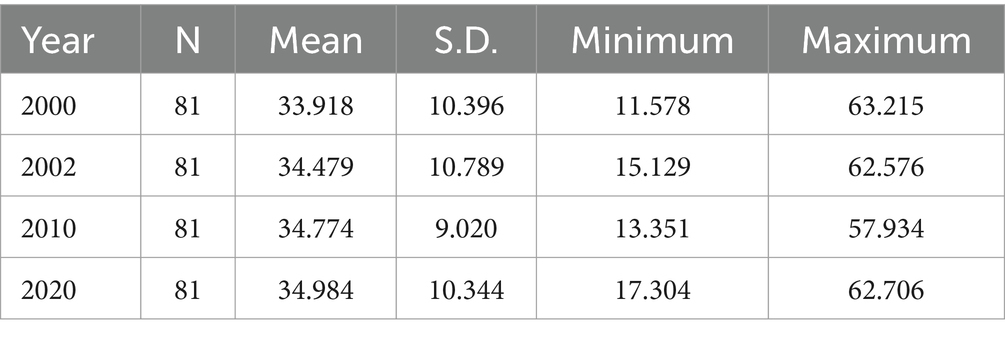
Table 6. Inversion of carbon storage value in P. kesiya var. langbianensis sample plot (t·hm−2).
Figure 4 illustrates that the carbon storage’s maximum value was higher in 2000 than in 2002, 2010, and 2020, reaching 63.2 in 2000. When examining Table 5 in conjunction, it becomes apparent that although a single sample site exhibited greater values in 2000 than the other 3 years, the carbon storage in the study area consistently increased annually across 2000, 2002, 2010, and 2020.
For a comprehensive analysis of P. kesiya var. langbianensis carbon storage distribution, the study area’s corresponding slope, aspect, and altitude were evaluated using the ArcGIS 10.8 data analysis module. Results are shown in Figure 6. In 2000, carbon storage distribution for P. kesiya var. langbianensis indicated lower values at the center and higher values around it. Significantly elevated carbon storage was observed in the southwest and southeast regions compared to the northwest and northeast regions. The primary distribution ranged between 26 and 38 t·hm −2 . By 2002, the southeastern carbon storage for pine decreased relative to 2000, while the southwestern portion experienced a notable increase, reaching a peak storage gradient of 38 to 42 t·hm −2 . Shifting to 2010, the eastern carbon storage for P. kesiya var. langbianensis expanded compared to 2002, but the northern region encountered a substantial decrease. In 2020, a decline in carbon storage of P. kesiya var. langbianensis was observed in the eastern study area compared to 2010. However, there was a notable increase in carbon storage in the southwestern study area. Over the period 2000 to 2020, fluctuations in carbon storage for P. kesiya var. langbianensis were associated with elevation, slope, and aspect within the study area. External factors such as land usage changes (deforestation or establishment of new sample land), economic conditions, and policy also played a role. To analyze elevation, slope, and aspect’s impact on forest carbon storage change, DEM elevation data was obtained from the geospatial data cloud. Relevant elevation, slope, and aspect characteristics were extracted using ARCGIS. Combining this with the carbon storage change rate from 2000 to 2020, a linear regression model was established. The results are presented in Table 7, revealing that slope exerted the most significant influence on P. kesiya var. langbianensis forest carbon stock change, followed by elevation.
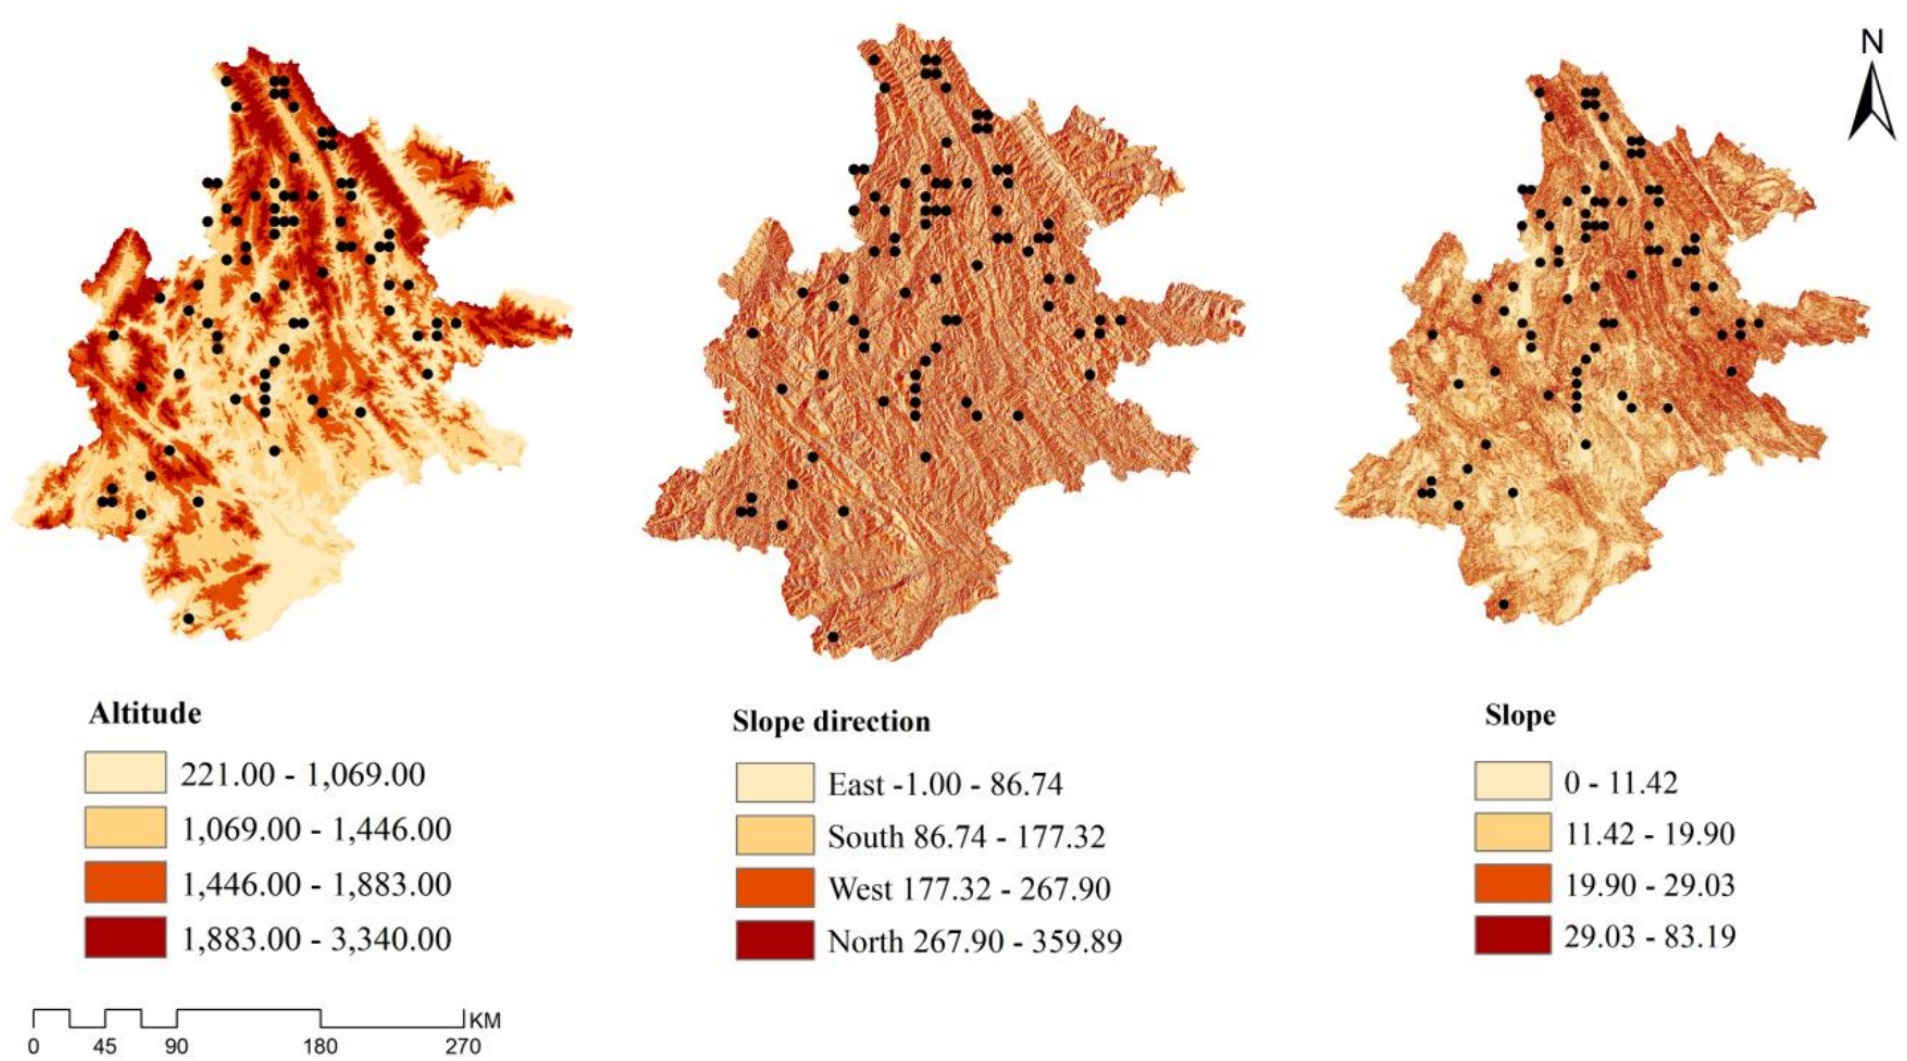
Figure 6. Analysis of elevation, slope and aspect of study area.
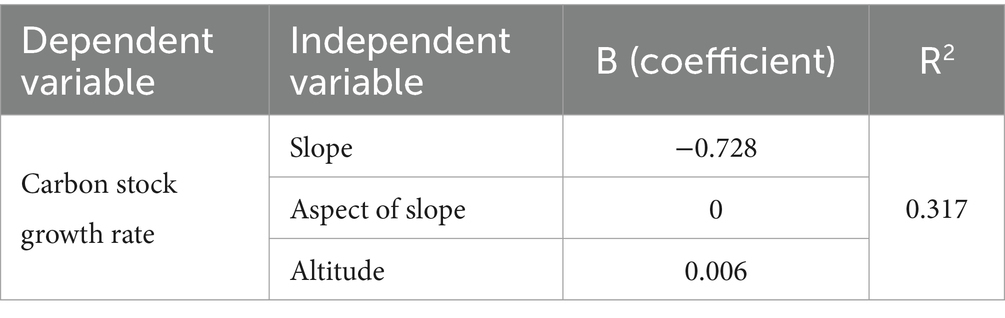
Table 7. Linear regression model fitting.
1. Fitting the GM (1,1) model: Programming and related predictions of GM (1,1) gray model were implemented in the MATLAB software. Using year as the variable data of time term (categorization) and carbon storage of P. kesiya var. langbianensis in corresponding year as the variable Y of time series data (quantitative), a GM (1,1) gray prediction model is used to analyze the change in carbon storage within the study area from 2002 to 2017. Table 8 shows the initial and predicted values for the years 2002, 2007, 2012, and 2017, along with calculated P and C values for the predicted results. The accuracy of the gray prediction can be verified through the posterior difference ratio in the GM (1,1) model fitting (Table 8). A smaller posterior difference ratio indicates higher prediction accuracy. Generally, a C value <0.35 signifies high accuracy, C < 0.5 implies qualified accuracy, C < 0.65 suggests basic qualification, and C > 0.65 indicates low accuracy. For assessing model fit, a smaller relative error value, ideally less than 20%, signifies a good fit. The probability of small error, denoted as P, should be larger, preferably p > 0.95 and not p < 0.7. The GM (1,1) model fitting results in Table 8 demonstrate a posteriori difference ratio of 0.006 and a small error frequency P of 0.989, indicating high model accuracy. The average relative error is 0.671%, reflecting a good model fit.
2. Comparison of prediction models: To compare the performance of GM (1,1) model, the power function model was taken as the comparison model. The parametric equation of the power function model is as follows (Zhang, 2022a) (eq. 25):
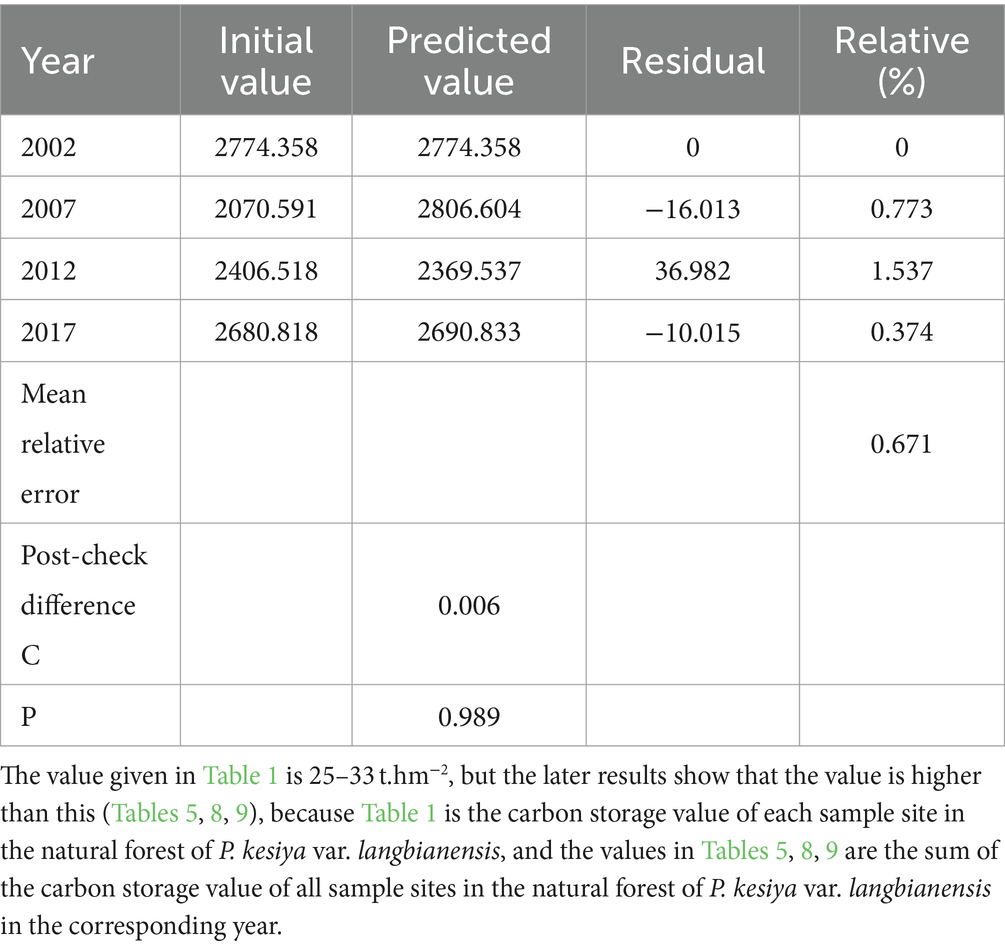
Table 8. The GM (1,1) model was used to fit the annual carbon storage of P. kesiya var. langbianenis.
where represents the carbon storage of P. kesiya var. langbianensis, and the value of K is 1,2,3,4,... n-1,1 means base year 2000, 2,3,4... and represents the sequence value of the relevant year after the base period.
As per the predictions by the gray forecasting model GM (1,1) for the results (Table 9), the posterior difference of the GM (1,1) model is 0.001°C with an R2 value of 0.945. For both the GM (1,1) model and the power function model, the p values are 0.999 and 0.996, respectively. Generally, the accuracy of the GM (1,1) model surpasses that of the power function model. Compared to the power function model, the GM (1,1) model better addresses analysis and prediction issues within a “small data and uncertainty” system. Based on the GM (1,1) model, the projected carbon storage of P. kesiya var. langbianensis forest in 2030 is 2850.804 t·hm −2 , a rise of 103.463 t·hm −2 from 2000. Conversely, using the power function model, the carbon storage is estimated to reach 2863.746 t·hm −2 in 2030, indicating an increase of 116.405 t·hm −2 from 2000. According to the carbon storage increment estimation of P. kesiya var. langbianensis natural forest, it is anticipated that this natural forest will significantly contribute to China’s target of achieving carbon peak and carbon neutral forestry by 2030. These estimates are conservative. If the forest management level can be effectively improved, the natural forests of P. kesiya var. langbianensis will have greater potential for carbon sequestration and make greater contribution to the strategic goal of carbon peak and carbon neutrality.
1. The GM (1,1) model predicts: Based on the GM (1,1) model, the prediction for carbon storage in the natural forest sample of P. kesiya var. langbianensis in 2030 was performed. The projected GM (1,1) carbon storage values for 2030 are shown in Figure 7. Within the prediction for GM (1,1) carbon storage in 2030 (Figure 7), the forest’s carbon storage of P. kesiya var. langbianensis displays a lower extent in the east and a higher extent in the southwest. The eastern region of the forest mainly exhibits a carbon storage gradient of 14.34–24.00 t·hm −2 , while the southwestern part ranges from 47.00–59.00 t·hm −2 . Conversely, the forest’s carbon storage in the central study area exhibits a relatively uniform distribution, ranging between 24.00–32.00 t·hm −2 and 32.00–40.00 t·hm −2 . Additionally, in some northern portions of the P. kesiya var. langbianensis forest, a carbon storage ranges of 49.00–59.00 t·hm − 2 is anticipated. In conclusion, by 2030, there is an upward trend in the carbon storage of the P. kesiya var. langbianensis forest within the study area. Considering the domestic carbon market’s CCER carbon asset trading price (60 yuan/ton) in 2022, the projected economic value of carbon assets per unit (t·hm − 2) for 2030 could amount to about 6207.78 yuan compared with that in 2000.
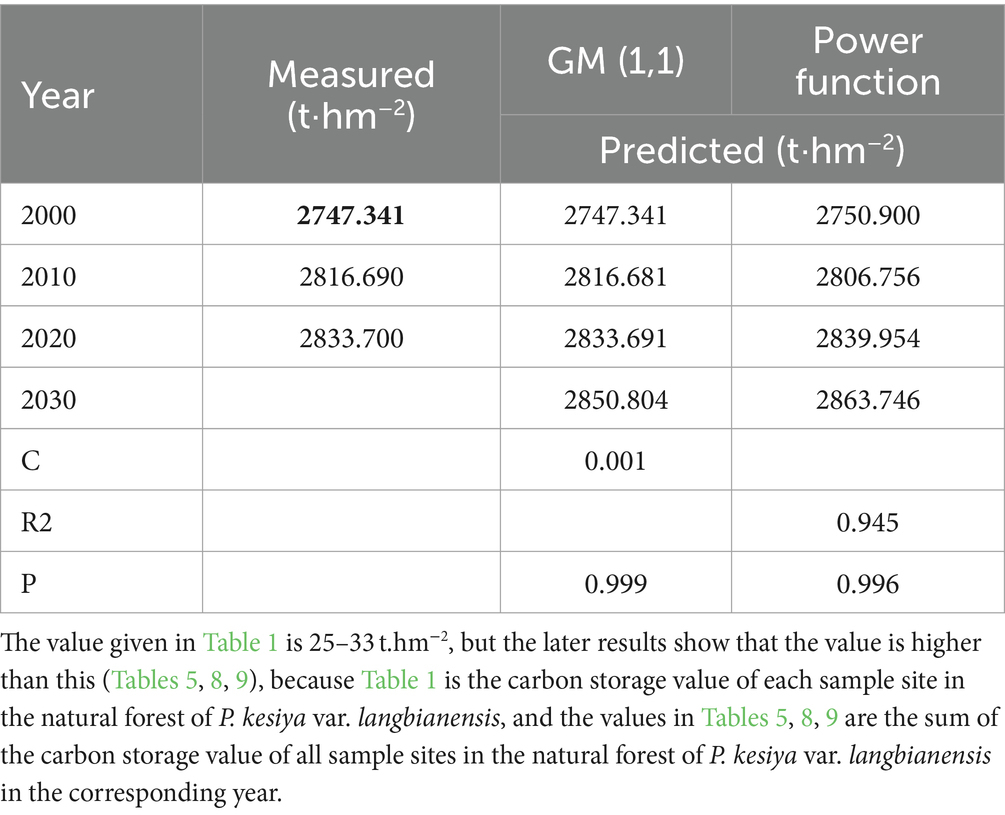
Table 9. Carbon storage prediction of natural forest of P. kesiya var. langbianensis. (t.hm−2).
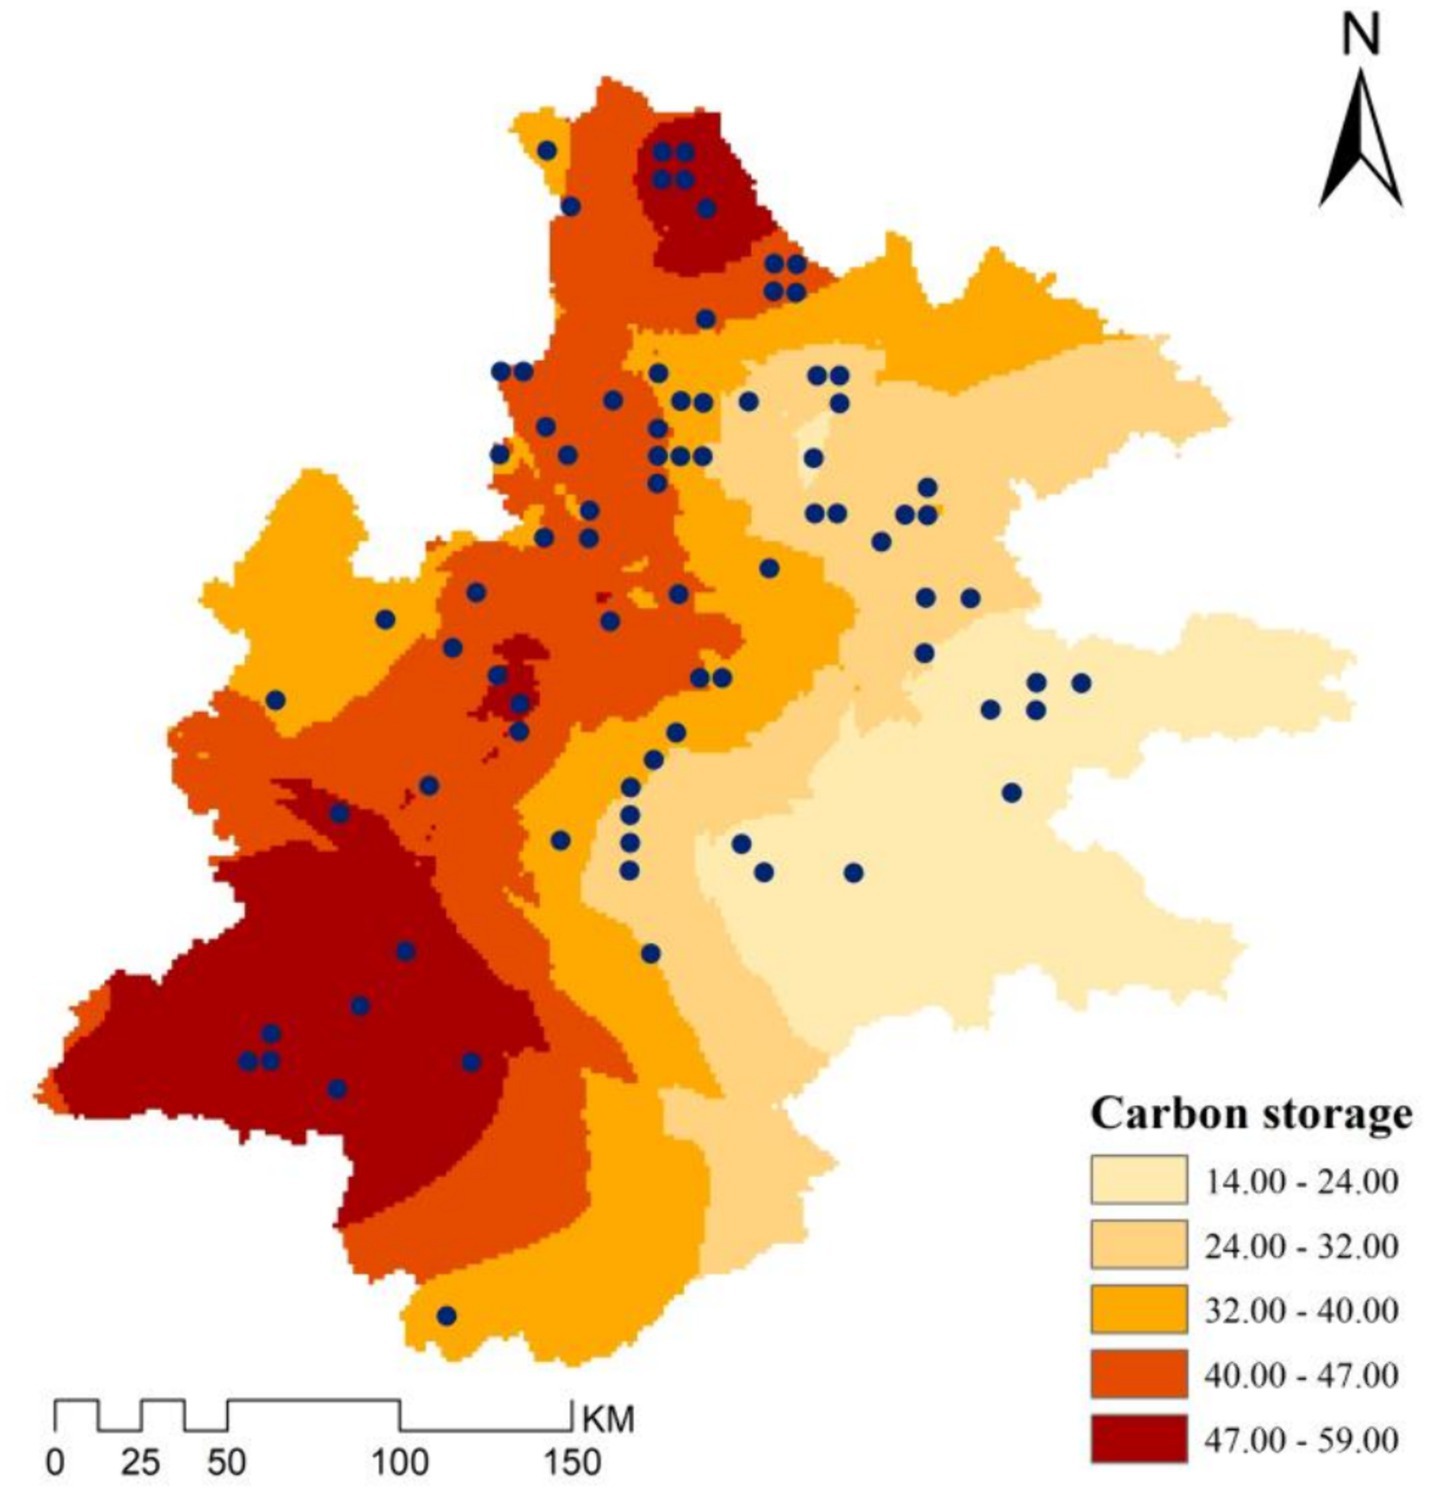
Figure 7. Projections of GM (1,1) carbon stocks for 2030.
The carbon storage data for the natural forest of P. kesiya var. langbianensis were utilized in this study. GM (1,1) gray and power function models were established to predict its carbon storage of the natural forest of P. kesiya var. langbianensis. To optimize the dependent variables for carbon storage inversion, four categories of remote sensing variables were extracted, totaling 73. These included single-band factors, information enhancement factor (principal component analysis), vegetation index factor, and texture features. After person correlation analysis, 11 factors with significant correlations were selected.
In order to better understand to explore the application of GM (1,1) gray theory in forestry, this study employed RFR, K-NN, and PLSR models to enhance the inversion model for carbon storage in the natural forest of Pinus sylvestris. Following model optimization, the random forest model exhibited the best fitting effect, serving for carbon storage estimation. The random forest model generally outperformed methods like multiple linear stepwise regression and PLSR (Cai, 2021), demonstrating high prediction and test accuracy. Consequently, the random forest model estimated carbon storage in the natural forest of P. kesiya var. langbianensis via remote sensing. The consistency of these findings with those of previous studies by Zhao et al., where remote sensing was employed to estimate the biomass of P. kesiya var. langbianensis artificial forests at various growth stages using random forest regression, as well as the aboveground biomass estimation for natural secondary forests based on bias-corrected random forest and multi-source data by Sun et al., is evident (Sun et al., 2015; Zhao et al., 2021). Specifically, it is observed that: (1) RF exhibits superior fitting ability and model accuracy compared to multiple stepwise regression and support vector machine. (2) RF demonstrates effective fitting and avoids over-fitting tendencies, rendering it suitable for precise forest biomass modeling that reflects real-world scenarios. Moreover, RF attains remarkable prediction accuracy for extensive forest biomass estimation. Nevertheless, it is noteworthy that the model developed in this study and the accuracy test data consist of only 81 sample plots, indicating limited generality for large-scale generalization. The prevalent saturation phenomenon in carbon storage estimation, when training samples lack sufficient representation, which can lead to machine learning interpreting saturation as a training learning capability, and eventually this phenomenon cannot be significantly eliminated (Wang et al., 2022)This aligns with Gao’s findings (Gao, 2018), signifying that non-parametric models like RF exhibit insensitivity to regions with either low or high forest carbon storage. To mitigate the saturation impact on biomass prediction, future research could incorporate more informative indicators unaffected by data saturation, such as texture features, vertical structural information, and climatic factors. These additions aim to enhance model accuracy, thus yielding improved practical prediction results.
The overall increasing trend in carbon storage of P. kesiya var. langbianensis plots in the study area during 2000–2020 is evident from the carbon storage distribution map (Figure 5) and the altitude, slope, and aspect analysis map (Figure 6). Analyzing spatial changes in Pinus yunnanensis natural forest from 2000 to 2020 involved acquiring DEM elevation data from the geospatial data cloud and extracting elevation, slope, and aspect characteristics using ARCGIS software. By establishing a linear regression model considering the natural forest carbon storage change rate during 2000–2020, the most influential factors were identified. Table 7 displays these results, showing that slope had the greatest impact on carbon storage change in P. kesiya var. langbianensis forest, followed by altitude. Notably, the growth rate and magnitude of the 2002–2010 period exceeded those of 2000–2002, while the growth rate and magnitude were smaller in the 2020–2010 period compared to the 2002–2010 period. Our findings suggest a continuous increase in carbon storage and forest quality, indicating a strengthening forest carbon sink function to a certain extent.
This study utilized the GM (1,1) gray model to predict carbon storage in the natural forest of P. kesiya var. langbianensis. To assess the predictive performance of the GM (1,1) model, a power function model was employed for comparison. The prediction results of the GM (1,1) gray prediction model (Table 9) show a marginal difference of 0.001 in the posterior difference C of the GM (1,1) model, while the power function model exhibits an R2 of 0.945. The GM (1,1) model’s p value is 0.999, and the power function model’s p value is 0.997. Overall, the precision of the GM (1,1) model surpasses that of the power function model, aligning with findings from Zhang on Beijing’s forest carbon sink potential under carbon peak and carbon neutrality, as well as with Kang and Fu (2022) analysis of forest carbon sink contribution in Jiangxi Province across various management levels. Disregarding external influences such as sample land clearance or newly established lands, economic and policy considerations, the carbon storage the natural forest of P. kesiya var. langbianensis is projected to reach 2844.287 t·hm − 2 by 2030, signifying an increase of 103.463 t·hm −2 compared to 2000.
In carbon storage within the P. kesiya var. langbianensis forest is closely linked to appropriate management, excellent stand quality, favorable climatic conditions, and suitable forest location. Pu′er city, a model of China’s green economy, boasts significant forest coverage and serves as a substantial carbon sink market, effectively addressing the carbon emissions. Furthermore, the study site lies in Yunnan’s southwest, on the periphery of the Yunnan-Guizhou Plateau. With a mixed subtropical and tropical climate, the area maintains an annual average temperature ranging from 17°C to 22°C, receives over 1,500 mm of annual precipitation, and enjoys a frost-free period of 315 days with relative humidity exceeding 80%. Utilizing carbon storage data from 89 permanent plots across three Yunnan Forest surveys (2007, 2012, and 2017), 81 plots remained after disturbance removal. These plots were dominated by P. kesiya var. langbianensis, accompanied by various Pinus species. Under the influence of the subtropical monsoon climate, P. kesiya var. langbianensis exhibited robust growth, bolstered by a combination of these factors that collectively enhanced plant photosynthesis and indirectly influenced the growth and carbon storage of the natural P. kesiya var. langbianensis forests.
This paper presents an innovative application of GM (1,1) gray theory to address forestry challenges. GM (1,1) gray theory, primarily utilized in mathematics, proves advantageous due to its minimal sample requirements, independence from regular sample distribution, and suitability for short- and medium-term predictions. It effectively captures data trends. Unlike prior studies on dynamic forest carbon stocks that involved complex processing procedures, the GM (1,1) model simplifies this task. It eliminates the need for separate model constructions for distinct time periods, thus saving time and effort. Our application of the GM (1,1) gray theory in forestry research demonstrates its potential to predict forest carbon sinks. By introducing this theory, we extend its utility into the field of forestry studies, which can be used to predict forest carbon sinks. Despite the data limitations preventing an examination of change patterns in other species, the potential of GM (1,1) gray theory remains promising, demanding further investigation. Given its suitability for short- and medium-term predictions, we focus on forecasting the carbon storage of the P. kesiya var. langbianensis forest in 2030 to enhance accuracy and reduce predictive errors. Notably, our study excludes considerations of forest area expansion, increased forest coverage, and predictions under future climate change scenarios. Future research should encompass these diverse scenarios to yield comprehensive insights.
Estimating carbon storage requires strengthened assessment efforts. Ground-based quantitative data provide precise estimations of carbon storage, crucial for determining the carbon sequestration capabilities of specific regions. This is essential for setting goals to reduce carbon emissions and establishing standards for participation in carbon markets. Improving forest management practices involves understanding carbon storage in forests or specific areas, which informs decisions on methods and optimizing vegetation types or structures to maximize carbon sequestration benefits. Monitoring and verifying the effectiveness of carbon projects through continuous updates of field-based quantitative data validate their efficiency and compliance.
From the analysis above, it is evident that the southwestern region of the study area has the highest carbon storage. Priority should be given to conservation efforts in regions abundant in carbon storage to achieve optimal carbon sequestration benefits. Generally, carbon storage in the western regions is relatively higher compared to the eastern regions, which have relatively less. Attention should be focused on increasing carbon storage in the east by implementing sustainable forest management practices to enhance carbon storage and reduce emissions. These measures will effectively manage and increase terrestrial ecosystem carbon storage.
The datasets presented in this article are not readily available because the datasets analyzed during the current study are available from the Institute of Forestry Survey and Planning, but restrictions apply to the availability of these data, which were obtained from the corresponding author CL and sixth author GO, and so are not publicly available. Requests to access the datasets should be directed to bWlzc2xpdUBzd2Z1LmVkdS5jbg== and b2xnMjAwNzYyMUBzd2Z1LmVkdS5jbg==.
CG: Formal analysis, Writing – original draft. CL: Methodology, Writing – original draft. WaZ: Writing – review & editing. ZY: Software, Validation, Writing – original draft. WeZ: Software, Validation, Writing – original draft. GO: Data curation, Writing – original draft, Supervision. ZZ: Data curation, Writing – review & editing.
The author(s) declare financial support was received for the research, authorship, and/or publication of this article. This study was supported by a project grant from the Ten Thousand Talents Program of Yunnan Province (Grant no. YNWR-QNBJ-2019-064), Science and Technology Plan Project of Science and Technology Department of Yunnan Province: 202401AT070272 and a project grant from the Scientific Research Fund of Yunnan Provincial Department of Education (Grant no. 2023Y0738).
The authors declare that the research was conducted in the absence of any commercial or financial relationships that could be construed as a potential conflict of interest.
All claims expressed in this article are solely those of the authors and do not necessarily represent those of their affiliated organizations, or those of the publisher, the editors and the reviewers. Any product that may be evaluated in this article, or claim that may be made by its manufacturer, is not guaranteed or endorsed by the publisher.
Amaro, M. A., Soares, C. P. B., Souza, A. L. D., Leite, H. G., and Silva, G. F. D. (2013). Volume, biomass and carbon stocks in a seasonal semideciduous forest in vicosa. Rev Arvore. 37, 849–857. doi: 10.1590/S0100-67622013000500007
Cai, X. Y. (2021). Aboveground biomass estimation and random forest bias correction for natural secondary forests based on multi-source remote sensing data. Jou North For Uni.China. doi: 10.27009/d.cnki.gdblu.2021.000258
Cao, C., Guo, Z. X., and Guo, Y. Q. (2023). Based on geographical weighted regression model of the pearl river delta forest carbon space distribution. Forest Resources Res. 6, 98–104. doi: 10.13466/j.carolcarrollnkilczyyj.2023.06.012
Che, Q. L. (2020). Calculation and prediction of forest carbon sink dynamics in Gansu Province. Forest. Sci. Tech 4:7. doi: 10.13456/j.cnki.lykt.2019.07.16.0002
Dong, Z. L., Jia, Y. J., Shang, Y. T., and Zhang, J. J. (2022). Prediction of economic value of Forest carbon sinks in Hebei Province and analysis ofInfluencing factors. Jour Hebei GEO Uni. 45, 87–96.
Fan, C.G. (2021). Based on GM (1, 1) model of Linfen city in the concentration prediction of atmospheric pollutants analysis and improved suggestion Chinese Society for Environmental Sciences. Proceedings of 2021 science and technology annual meeting of Chinese Society of Environmental Sciences (1). College of Resources and Environment, Shanxi University of finance and economics.
Fang, J.Y. (2004). Estimation of terrestrial vegetation carbon sinks in China: integration of observational data and remote sensing information. Chinese Ecological Society. Ecology and Comprehensive, coordinated and sustainable development. 24–25.
Gao, Y. K. (2018). Estimation of forest aboveground biomass in a typical subtropical region based on machine learning and multi-source data. China: Zhejiang A & F University.
Huang, X. Y., Wu, J. Y., and Lin, W. H. (2022). Carbon emission prediction of Jiangsu Province based on GM(1,1) model. Heilongjiang Sci. 13, 26–32.
Jiang, X. (2016). Analysis of carbon sequestration potential in Chinese forestry under the economic new Normal. Chinese. Rural. Eco. 11:11.
Jiang, S., Pang, G., Wu, M., and Kuang, L. (2003). An improved k-nearest neighbor algorithm for text categorization. Expert Syst. Appl. 39, 1503–1509. doi: 10.1016/j.eswa.2011.08.040
Kang, H. Q., and Fu, X. G. (2022). Analysis on the contribution of forest carbon sink in Jiangxi Province under different management levels. South China For Sci. 50, 45–49. doi: 10.16259/j.cnki.36-1342/s.2022.06.011
Kayacan, E., Ulutas, B., and Kaynak, O. (2010). Grey system theory-based models in time series prediction. Expert Syst. Appl. 37, 1784–1789. doi: 10.1016/j.eswa.2009.07.064
Kuuluvainen, T., and Gauthier, S. (2018). Young and old forest in the boreal: critical stages of ecosystem dynamics and management under global change. Forest Eco 5. doi: 10.1186/S40663-018-0142-2
Lan, T., Gu, J., and Wen, Z. (2021). Spatial distribution characteristics of carbon storage density in typical mixed fir and broadleaf forests. Energy Rep. 7, 7315–7322. doi: 10.1016/j.egyr.2021.10.094
Li, X. (2007). Application of optimization method of GM (1, 1) model in cultivated land prediction [D]. Anhui Normal University.
Li, S. L. D., and Jiang, M. Y. (2004). Preliminary study on forest carbon sink in our country. Green. Finance. Acco. 2.
Liang, C., Wei, X., Meng, J., and Chen, W. (2022). How to improve Forest carbon sequestration output performance: an evidence from state-owned Forest farms in China. Forests 13:778. doi: 10.3390/f13050778
Liu, X. J., and Chi, Y. H. (2021). Real estate Price forecast based on VAR – GM (1.1) -- SVR model. Math. Pract. Theory. 51:12.
Liu, Q. G., Peng, D. L., Tu, Y. Y., et al. (2014). Remote sensing estimation of forest biomass based on partial least squares. Jou North For Uni. 42:4. doi: 10.13320/j.cnki.jauh.2017.0007
Ma, X. W. (2019). Research progress and prospect of forest ecosystem carbon storage. Jour. North. Forest. Uni. 5, 62–72. doi: 10.3969/j.issn.10017461.2019.05.10
Makkonen, M., Huttunen, S., Primmer, E., Repo, A., and Hildén, M. (2015). Policy coherence in climate change mitigation: an ecosystem service approach to forests as carbon sinks and bioenergy sources. Forest Policy Econ. 50, 153–162. doi: 10.1016/j.forpol.2014.09.003
Nepal, P., Ince, P. J., Skog, K. E., and Chang, S. J. (2012). Projection of U.S. forest sector carbon sequestration under U.S. and global timber market and wood energy consumption scenarios, 2010–2060. Biomass Bioenergy 45, 251–264. doi: 10.1016/j.biombioe.2012.06.011
Pingoud, K., Ekholm, T., Soimakallio, S., and Helin, T. (2016). Carbon balance indicator for forest bioenergy scenarios. GCB Bioenergy 8, 171–182. doi: 10.1111/gcbb.12253
Richards, K. R., and Stokes, C. (2004). A review of Forest carbon sequestration cost studies: a dozen years of research. Clim. Chang. 63, 1–48. doi: 10.1023/B:CLIM.0000018503.10080.89
Schroeder, P. (1991). Can intensive management increase carbon storage in forests? Environ. Manag. 15, 475–481. doi: 10.1007/BF02394738
Siddiq, Z., Hayyat, M. U., Khan, A. U., Mahmood, R., and Cao, K. F. (2021). Models to estimate the above and below ground carbon stocks from a subtropical scrub forest of Pakistan. Global Ecol. Conservation. 27:e01539. doi: 10.1016/j.gecco.2021.e01539
Sun, X. L., Su, Q. T., and Ou, G. L. (2015). Remote sensing estimation of biomass in Pinus. Kesiya var. langbianensis plantation forests of different age groups based on random forest regression. Guangdong Agri Sci. 42, 148–193. doi: 10.16768/j.issn.1004-874x.2015.15.022
Vcja, C., Vsn, A., Db, A., Rcs, B., and Da, C. (2021). Tree biomass and carbon stock assessment of subtropical and temperate forests in the central Himalaya, India. Trees, Forests and People 6. doi: 10.1016/j.tfp.2021.100147
Wang, M., Fu, W., He, X., Hao, S., and Wu, X. (2022). A survey on large-scale machine learning. IEEE Tran Know Data Engin. 6:34.
Wang, Y., Guo, C. H., Chen, X. J., Jia, L. Q., Guo, X. N., Chen, R. S., et al. (2021). Carbon peak and carbon neutrality in China:goals, implementation path and prospects. China Geo. 4:27. doi: 10.31035/cg2021083
Wang, Z. X., Wang, Z. W., and Li, Q. (2020). Forecasting the industrial solar energy consumption using a novel seasonal GM(1,1) model with dynamic seasonal adjustment factors. Energy 200:117460. doi: 10.1016/j.energy.2020.117460
Wang, F. H., Wen, M., Ren, L. X., et al. (2019). Estimation of forest carbon storage in Taojiang County based on radial basis function neural network model. Hunan Forestry Sci. Technol. 47, 84–89. doi: 10.3969/j.issn.1003-5710.2020.03.014
Wei, Y. M., Chen, K., Kang, J. N., Chen, W., Wang, X. Y., and Zhang, X. (2022). Policy and Management of Carbon Peaking and Carbon Neutrality: a literature review. Engineering 14, 52–63. doi: 10.1016/j.eng.2021.12.018
Wei, Y., Han, R., Liang, Q. M., Yu, B. Y., Yao, Y. F., Xue, M. M., et al. (2018). An integrated assessment of INDCs under shared socioeconomic pathways: an implementation of C3IAM. Nat. Hazards 92, 585–618. doi: 10.1007/s11069-018-3297-9
Wu, W. Q. (2019). Prediction of air pollutant concentration in Chengdu based on grey GM(1,1) model. Energy Environ. Protect. 33, 56–58.
Zeng, X. Y. (2016). Research on several extension models of Grey prediction GM (1.1) model. China: Uni Elec Sci tech China.
Zhang, Y., Li, X. G., and Yali, W. (2022a). Forest carbon sequestration potential in China under the background of carbonemission peak andcarbon neutralization. Jour Beijing For Uni. 44, 38–47. doi: 10.12171/j.1000-1522.20210143
Zhang, Y., Li, X. G., and Yali, W. (2022b). Carbon sink potential of Beijing's forests under carbon peak and carbon neutrality. Resources Indust. 24, 15–25. doi: 10.13776/j.cnki.resourcesindustries.20210907.001
Zhang, Y. X., and Wu, X. J. (2021). Modeling and carbon change of forest stock biomass in China. Sci. Sinica. (Vit). 51, 199–214.
Zhao, Y. H., Cai, X. Y., and Zhen, Z. (2021). Above-ground biomass estimation of natural secondary forests based on random forest bias correction and multi-source remote sensing data. JourCentral South Uni For Tech. 41:12. doi: 10.14067/j.cnki.1673-923x.2021.07.012
Keywords: carbon sequestration potential, Pinus Kesiya var. langbianensis, GM (1,1) gray model, carbon storage, random forest
Citation: Gu C, Zhou Z, Liu C, Zhang W, Yang Z, Zhou W and Ou G (2024) Application of GM (1,1) to predict the dynamics of stand carbon storage in Pinus Kesiya var. langbianensis natural forests. Front. For. Glob. Change. 7:1298804. doi: 10.3389/ffgc.2024.1298804
Edited by:
Lingbo Dong, Northeast Forestry University, ChinaReviewed by:
Sumit Chakravarty, Uttar Banga Krishi Viswavidyalaya, IndiaCopyright © 2024 Gu, Zhou, Liu, Zhang, Yang, Zhou and Ou. This is an open-access article distributed under the terms of the Creative Commons Attribution License (CC BY). The use, distribution or reproduction in other forums is permitted, provided the original author(s) and the copyright owner(s) are credited and that the original publication in this journal is cited, in accordance with accepted academic practice. No use, distribution or reproduction is permitted which does not comply with these terms.
*Correspondence: Chang Liu, bWlzc2xpdUBzd2Z1LmVkdS5jbg==
Disclaimer: All claims expressed in this article are solely those of the authors and do not necessarily represent those of their affiliated organizations, or those of the publisher, the editors and the reviewers. Any product that may be evaluated in this article or claim that may be made by its manufacturer is not guaranteed or endorsed by the publisher.
Research integrity at Frontiers
Learn more about the work of our research integrity team to safeguard the quality of each article we publish.