 K. V. Suresh Babu
 Swati Singh
 G. Kabdulova1
95% of researchers rate our articles as excellent or good
Learn more about the work of our research integrity team to safeguard the quality of each article we publish.
Find out more
ORIGINAL RESEARCH article
Front. For. Glob. Change , 12 June 2024
Sec. Fire and Forests
Volume 7 - 2024 | https://doi.org/10.3389/ffgc.2024.1296100
This article is part of the Research Topic Spatial and Temporal Monitoring of Wildfire Hazard Under a Climate Change Environment: Prevention, Mitigation and Management View all 5 articles
Forest fires or wildfires frequently occur in Kazakhstan, especially in the months from June to September, damaging the forest resources. Burnt area mapping is important for fire managers to take appropriate mitigation steps and carry out restoration activities after the fire event. In this study, KazEOSat-1 high-resolution satellite datasets are used to map the burnt area in the regions of Kazakhstan. KazEOSat-1 satellite is in a Sun-synchronous orbit, consisting of four bands, namely blue, green, red, and NIR multispectral bands, in 4 m spatial resolution, while panchromatic data are in 1 m spatial resolution. This study examined three spectral indices, namely AVI, BAI, and GEMI, for mapping the burnt area based on the four spectral bands NIR, blue, red, and green of the KazEOSat-1 satellite datasets. The DN values for each band are used to determine TOA reflectance, which is then used as a basis for deriving the aforementioned spectral indices. The results of spectral indices, AVI, BAI, and GEMI are compared based on a discriminative index (M) for quantifying the effectiveness of each index based on burned area derived from KazEOSat-1 datasets. The spectral index BAI shows higher M values than other indices; therefore, the index BAI has the higher capability to extract the burned area as compared with AVI and GEMI. Accuracy was calculated based on the number of forest fire incidents that fell in burned and unburned areas, and the results indicate that BAI shows the highest accuracy, whereas AVI shows the lowest accuracy among them. Therefore, the BAI has the highest ability for extracting the burned area using the KazEOSat-1 satellite datasets. As the revisit time period of KazEOSat is 3 days, this study will be useful to map the burnt area and fire progression in Kazakhstan.
Forests play a significant role in human life because they contain the bulk of sustainable natural resources and provide environmental goods and services (Stocks et al., 2002). Forests are the principal source of numerous non-wood and timber products, and they play a critical role in protecting the natural conditions required to sustain human life on Earth. According to a UN study, the earth’s forest area was approximately 4,128 million ha in 1990 and had reduced to 3,999 million ha by 2015, representing a decrease from 31.6% (1990) to 30.6% (2015) (FAO, 2015). Forest fires, often known as wildfires, contribute to the deterioration of forests. Burnt area mapping is crucial to taking precautions and estimating damage for fire managers in order to put out fires throughout the upcoming fire season. Fire is a natural disturbance source in many ecosystems, which aids in instigating diversity and natural regeneration (Stevens-Rumann and Morgan, 2019). However, fire has also been used as a tool for hunting, land management, and deforestation throughout human history (Östlund et al., 2015). Fire cycles are historically associated with climate fluctuations, mostly with increases in temperature and multi-millennium-scale variation in the amount and timing of rainfall (Flannigan et al., 2000; Senande-Rivera et al., 2022). Forest fires or wildfires are currently raging around the world, wreaking havoc on the environment, wildlife, and economy (Penner et al., 1992; Cochrane et al., 1999; Cochrane, 2003; Chu et al., 2017).
The satellite-derived burnt area provides a comprehensive evaluation of forest damage during the fire season. The damage caused by the fire event to the vegetation causes a significant change in reflectance because of the differences in the mixture of forest plants and soil properties (de Magalhaes and Schwilk, 2012). Burnt area mapping is an important part of developing mitigation procedures and efforts for rebuilding vegetation regrowth after the fire season (Parks et al., 2014; Suresh Babu et al., 2018). Burnt area mapping needs to be dependable and quick in order to facilitate the planning of fire prevention operations such as planned preparation, mitigation actions, and regrowth of vegetation activities (García and Caselles, 1991; Key and Benson, 1999; Michalek et al., 2000; Suresh Babu et al., 2018).
Burnt area mapping is a crucial component of forest management because it emphasizes the impact of fire on vegetation and soil components (Miller and Thode, 2007) and is also helpful for forecasting vegetation restoration actions (Macdonald, 2007; Suresh Babu et al., 2018). Mapping burned regions using traditional methods is challenging due to the diverse topography, including variations in elevation, slope, and aspect (Eskandari et al., 2020). These factors influence fire behavior, leading to irregularly shaped burned patches that are difficult to delineate accurately. Additionally, terrain obstacles and shadowing effects further complicate the mapping process, necessitating advanced remote sensing techniques for precise assessment (Roy et al., 2002).
The NOAA-AVHRR data were utilized in the 1990s to map burned regions using a multi-temporal analysis of the Normalized Difference Vegetation Index (NDVI) (Kasischke et al., 1993; Martin and Chuvieco, 1995). Global burnt area products were later made available, with some validation provided by the “SPOT Vegetation” and “ATSR-2” instruments on the European Remote Sensing-2 satellite (Grégoire et al., 2003; Simon et al., 2004; Roy et al., 2005; Roy and Boschetti, 2009). Following the installation of the ‘MODIS’ sensor on the Terra and Aqua satellites, daily maps of regional burned areas were created with a medium spatial resolution (500 m) (Justice et al., 2002). Because the MODIS sensor delivers data with a better radiometric resolution on a daily basis, it is much simpler to distinguish between burned areas, and this makes it possible to perform accurate mapping, with an increase in the number of visits. The MODIS burnt area product, which is available monthly with 500 m spatial resolution and has been validated at the regional level (Roy et al., 2008), was found to detect approximately 75% of the fire-affected area when compared to Landsat satellite datasets (Roy and Boschetti, 2009).
The majority of burnt area studies employ a combination of near-infrared (NIR) and shortwave infrared (SWIR) bands because burnt areas in the SWIR bands exhibit more reflectivity than green vegetation (García and Caselles, 1991). Accurate burnt area mapping at the regional and local levels is currently possible using satellite datasets with higher spatial resolution (30–10 m). Burnt area mapping has been carried out using medium-spatial-resolution Landsat series satellite datasets such as Landsat-7 TM, ETM+, and Landsat-8 as well as the LISS-3 sensor onboard Indian remote sensing satellites (Chuvieco and Congalton, 1988; Chuvieco, 2008). A number of satellites with high to extremely high spatial resolutions, such as “QUICKBIRD,” “RAPIDEYE,” “FORMOSAT,” “IKONOS,” and “EARLYBIRD,” have been utilized for rapid, instant, and localized mapping of burned areas (Leblon et al., 2016). The burned region is mapped using medium-spatial-resolution satellite datasets such as Landsat 8 OLI (30 m) and IRS P6 Advanced Wide Field Sensor (AWIFS) (56 m) in the research (García and Caselles, 1991; Key and Benson, 1999). Recently, sentinel datasets (Sentinel 2A and 2B) have been used to map burned regions because of their better spatial resolution (10 m and 20 m, respectively) (Suresh Babu et al., 2018).
In the present study, satellite datasets with higher spatial resolution are used to map the burned regions, specifically utilizing bands limited to NIR, blue, red, and green. Kazakhstan launched two satellites, i.e., KazEOSat-1 and KazEOSat-2; the former has a higher resolution (4 m) than the latter (6.5 m) for the management of natural resources. In this study, KazEOSat-1 high-resolution satellite datasets are used to map burnt areas in Kazakhstan. KazEOSat-1 satellite is in a Sun-synchronous orbit, capturing imagery in four bands, namely blue, green, red, and NIR multispectral, with multispectral bands at a 4 m spatial resolution, while panchromatic data are captured at a 1 m spatial resolution. Three different indices—Global Environmental Monitoring Index (GEMI), Ashburn Vegetation Index (AVI), and Burn Area Index (BAI)—are tested for mapping burnt areas using KazEOSat-1 datasets.
Kazakhstan is the largest of the Central Asian countries; its neighboring countries are Russia, China, Kyrgyzstan, Uzbekistan, and Turkmenistan; it is the ninth largest country in the world; and 4.6% area of its total land area is covered by forests. Forest fires are most common in Kazakhstan during the months from June to September because of extreme weather conditions. According to the Ministry of Emergency Situations report of Kazakhstan, nearly 39 km2 of forests were burnt causing a loss of US $370,802.1 According to Kazakhstan’s Vice Minister of Ecology, Geology, and Natural Resources, 499 forest fires have been reported in the forest territories since the beginning of 2019 and the total damage amounted to US $5,89,5702 (Mamyrkhanova, 2019).
Accurate burned area mapping using high-resolution satellite data can provide valuable information for forest management, fire prevention, and ecosystem restoration efforts in Kazakhstan, a country prone to wildfires. Forest managers can utilize these maps to assess fire damage, prioritize areas for rehabilitation, and develop long-term forest management plans that consider fire risk and promote fire-resistant landscapes (Hammill and Bradstock, 2006). By identifying areas with high fire danger and past burn scars, fire prevention strategies can be more effectively targeted, including controlled burns, increased patrols in high-risk areas, and public awareness campaigns.
Additionally, burned area maps can play a crucial role in ecosystem restoration. The maps help identify areas that require immediate restoration efforts, such as reseeding or replanting, to support vegetation recovery and prevent erosion. Monitoring the progress of restoration projects and tracking vegetation recovery over time is also possible using burned area maps (Johnstone and Chapin, 2006). This aids in evaluating the effectiveness of restoration actions and adapting strategies accordingly.
Kazakhstan has started using the latest satellite techniques from EADS Astrium and its subsidiary SSTL (‘Surrey Satellite Technology Ltd’) to develop the new ERSSS (‘Earth Remote Sensing Satellite System’) for the management of natural resources (Elstak et al., 2010). This earth observation system includes a high-resolution satellite KazEOSat-1 and a medium-resolution satellite KazEOSat-2. The KazEOSat-1 satellite was launched in 2014 from the Guiana Space Center, French Guiana. It orbits at an altitude of approximately 630 km in a Sun-synchronous orbit, capturing very high-resolution panchromatic (1 m) and multispectral (4 m) images that cover the entire Earth. It is run by Kazakhstan’s Gharysh Sapary, a division of KazCosmos. These data products are used for different applications, such as land surveys, surveillance, natural resource management, and environmental applications.
The KazEOSat-1 satellite consists of instrument NAOMI-1 (‘New AstroSat Optical Modular Instrument’), a high-resolution pushbroom imager, and technical specifications are shown in Table 1 (NAOMI-1, 2014).
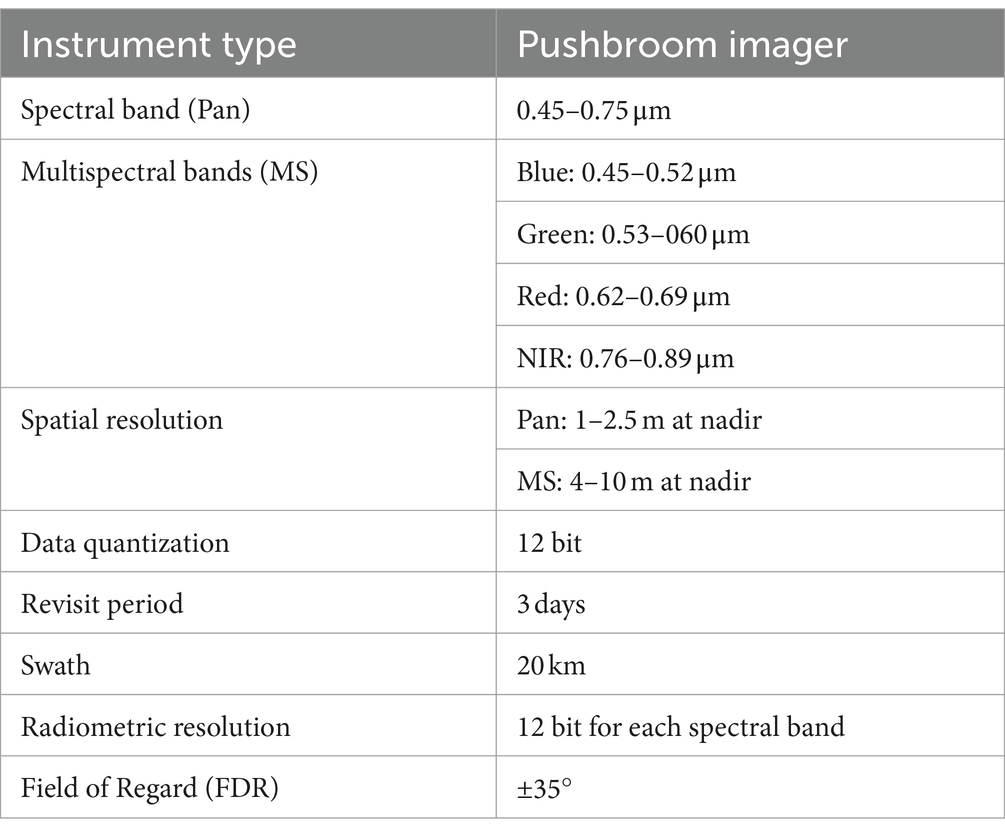
Table 1. Technical specifications of the NAOMI instrument.
The KazEOSat-1 images were downloaded from the Gharysh Kazakhstan official website. The image product consists of images in tiff format and metadata information in. DIM format. Initially, KazEOSat-1 images from the specified day were mosaicked to create a seamless output image. The spectral resolution of KazEOSat-1 is 12-bit, meaning each image contains digital number (DN) values ranging from 0 to 4,095. KazEOSat-1 is equipped with a NAOMI-1 instrument. The radiometric calibration of its datasets involves two steps: first, converting the DN to sensor radiance, and then converting this radiance to top-of-atmosphere (TOA) reflectance.
The DN image was converted into at-sensor radiance (L) using equation (1)
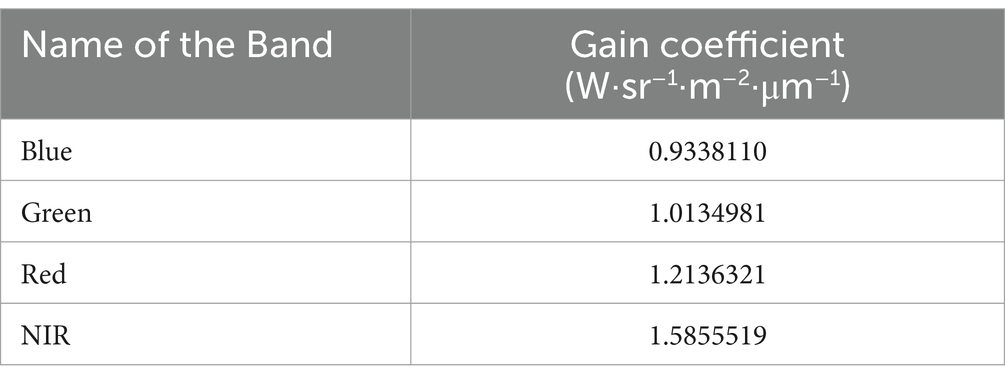
Table 2. Gain coefficients for NIOMI 1 instrument (Mattar et al., 2014).
Once the DN values of each band are converted to radiance, spectral reflectance ( is derived using equation (2).
The solar zenith angle is determined from the sun elevation angle found in the satellite metadata file supplied by the satellite data using equation (3).
Thus, DN values are converted into TOA reflectance for each spectral band using the above-mentioned equations (Table 3).
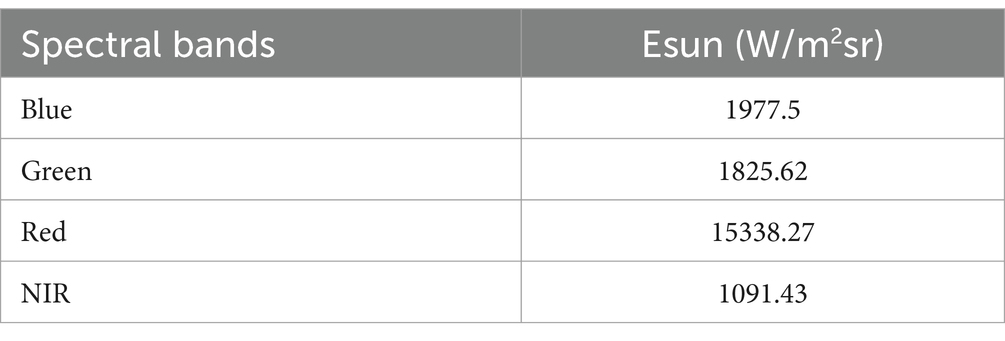
Table 3. Mean solar irradiance for the spectral bands (Thuillier et al., 2003).
As the KazEOSat-1 satellite image contains four spectral bands, three spectral indices, namely, Ashburn Vegetation Index (AVI), Burn Area Index (BAI), and Global Environmental Monitoring Index (GEMI) were chosen in this study for generating the burned area. The Ashburn Vegetation Index (AVI) is a simple index that is useful for measuring green vegetation in images and is calculated from the following equation (4) (Ashburn, 1979).
BAI is calculated using the following equation (5) (Martin and Chuvieco, 1995; Martín et al., 2002).
A discriminatory index (M) has been used to measure the efficacy of the three spectral indices above and is shown in equation (8) (Veraverbeke et al., 2011).
If the M value is higher for any spectral index, then better the distinction between burned and unburned area regions (Veraverbeke et al., 2011). Supervised classification is used to generate the burned mask based on the KazEOSat-1 images before and after the fire event. Threshold conditions are derived to extract the burned area for the spectral indices AVI, BAI, and GEMI based on mean and standard deviation values. The threshold for the burned area ranged from and , and each burn index image was categorized into two types, viz. burned and unburned area. The discriminative index (M) was calculated for the spectral indices AVI, BAI, and GEMI to know the ability of each spectral index for burned area mapping. Table 4 shows the M values calculated on the dates 25 September and 13 October 2018.

Table 4. Discriminative index (M) values.
As the M value is greater than 1, spectral indices AVI, BAI, and GEMI have the potential to map the burned area. The BAI index has higher M values than other indices, and among these, AVI has the lowest M values. The results indicate that BAI has a greater ability to map the burned areas and is in strong agreement with the other studies, i.e., Chuvieco et al. (2002) and Liu et al. (2016).
Furthermore, the moderate-resolution imaging spectroradiometer (MODIS) TERRA and Aqua active fire product (MCD14) were used for validating the results, and the data were downloaded from the ‘Fire Information for Resource Management System (FIRMS)’ website (FIRMS). To evaluate the estimated burnt area, the MCD14 data product can be used as a reference or ground truth. This can be done by comparing the estimated burnt area derived from other sources, such as very high-resolution images, with the burnt area information provided by the MCD14 product (França et al., 2018). The MCD14 product is often considered a good reference or validation tool for retrieved burnt areas based on very high-resolution images due to the following reasons: The MCD14 product provides information about burned areas globally, covering large regions and diverse ecosystems. This makes it suitable for comparison with very high-resolution images that might cover smaller areas. The MCD14 product is updated on a daily basis, providing near-real-time information about burned areas. This timeliness allows for timely validation of burnt area retrievals based on high-resolution images. While the spatial resolution of MODIS (~250–1,000 m) is relatively coarse compared to very high-resolution images, it can still capture the overall extent and patterns of burned areas. This helps in validating and corroborating burnt area estimates from high-resolution images that might provide more detailed information at a local scale.
In Table 5, the number of fire incidents that occurred in burned and unburned areas was counted, and the accuracy was calculated based on the percentage of forest fires occurring in burned areas with respect to the total number of fires that occurred.
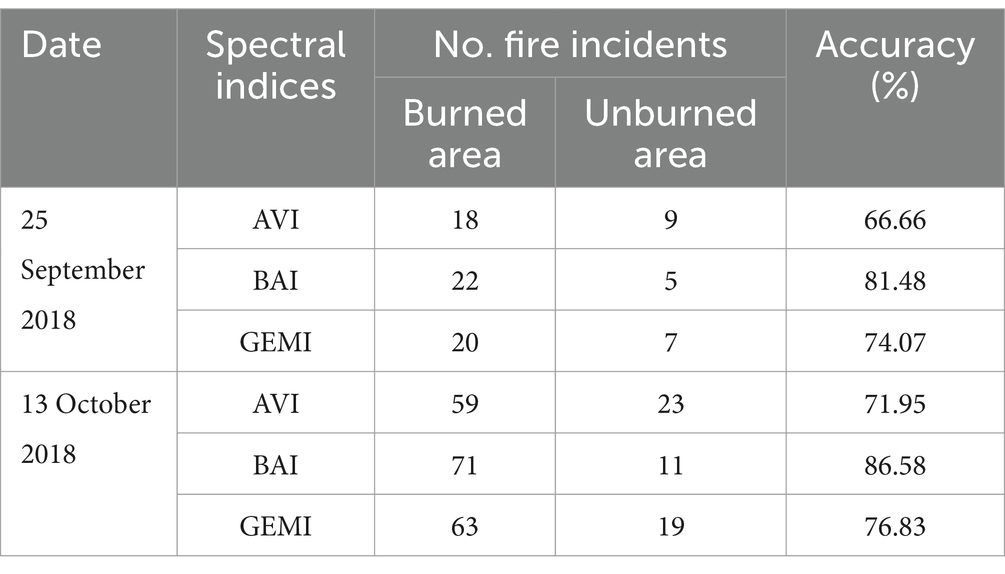
Table 5. Accuracy of burned area indices AVI, BAI, and GEMI.
It was observed from Table 5 that the BAI showed the highest accuracy (81.48%; 86.58%), followed by GEMI (74.07%; 76.83%), and then, AVI showed the lower accuracy (66.66%; 71.95%). Figures 1A,B show the images of the burned area based on BAI, which is overlaid with corresponding active fires that occurred on the dates 25 September 2018 and 13 October 2018, respectively.
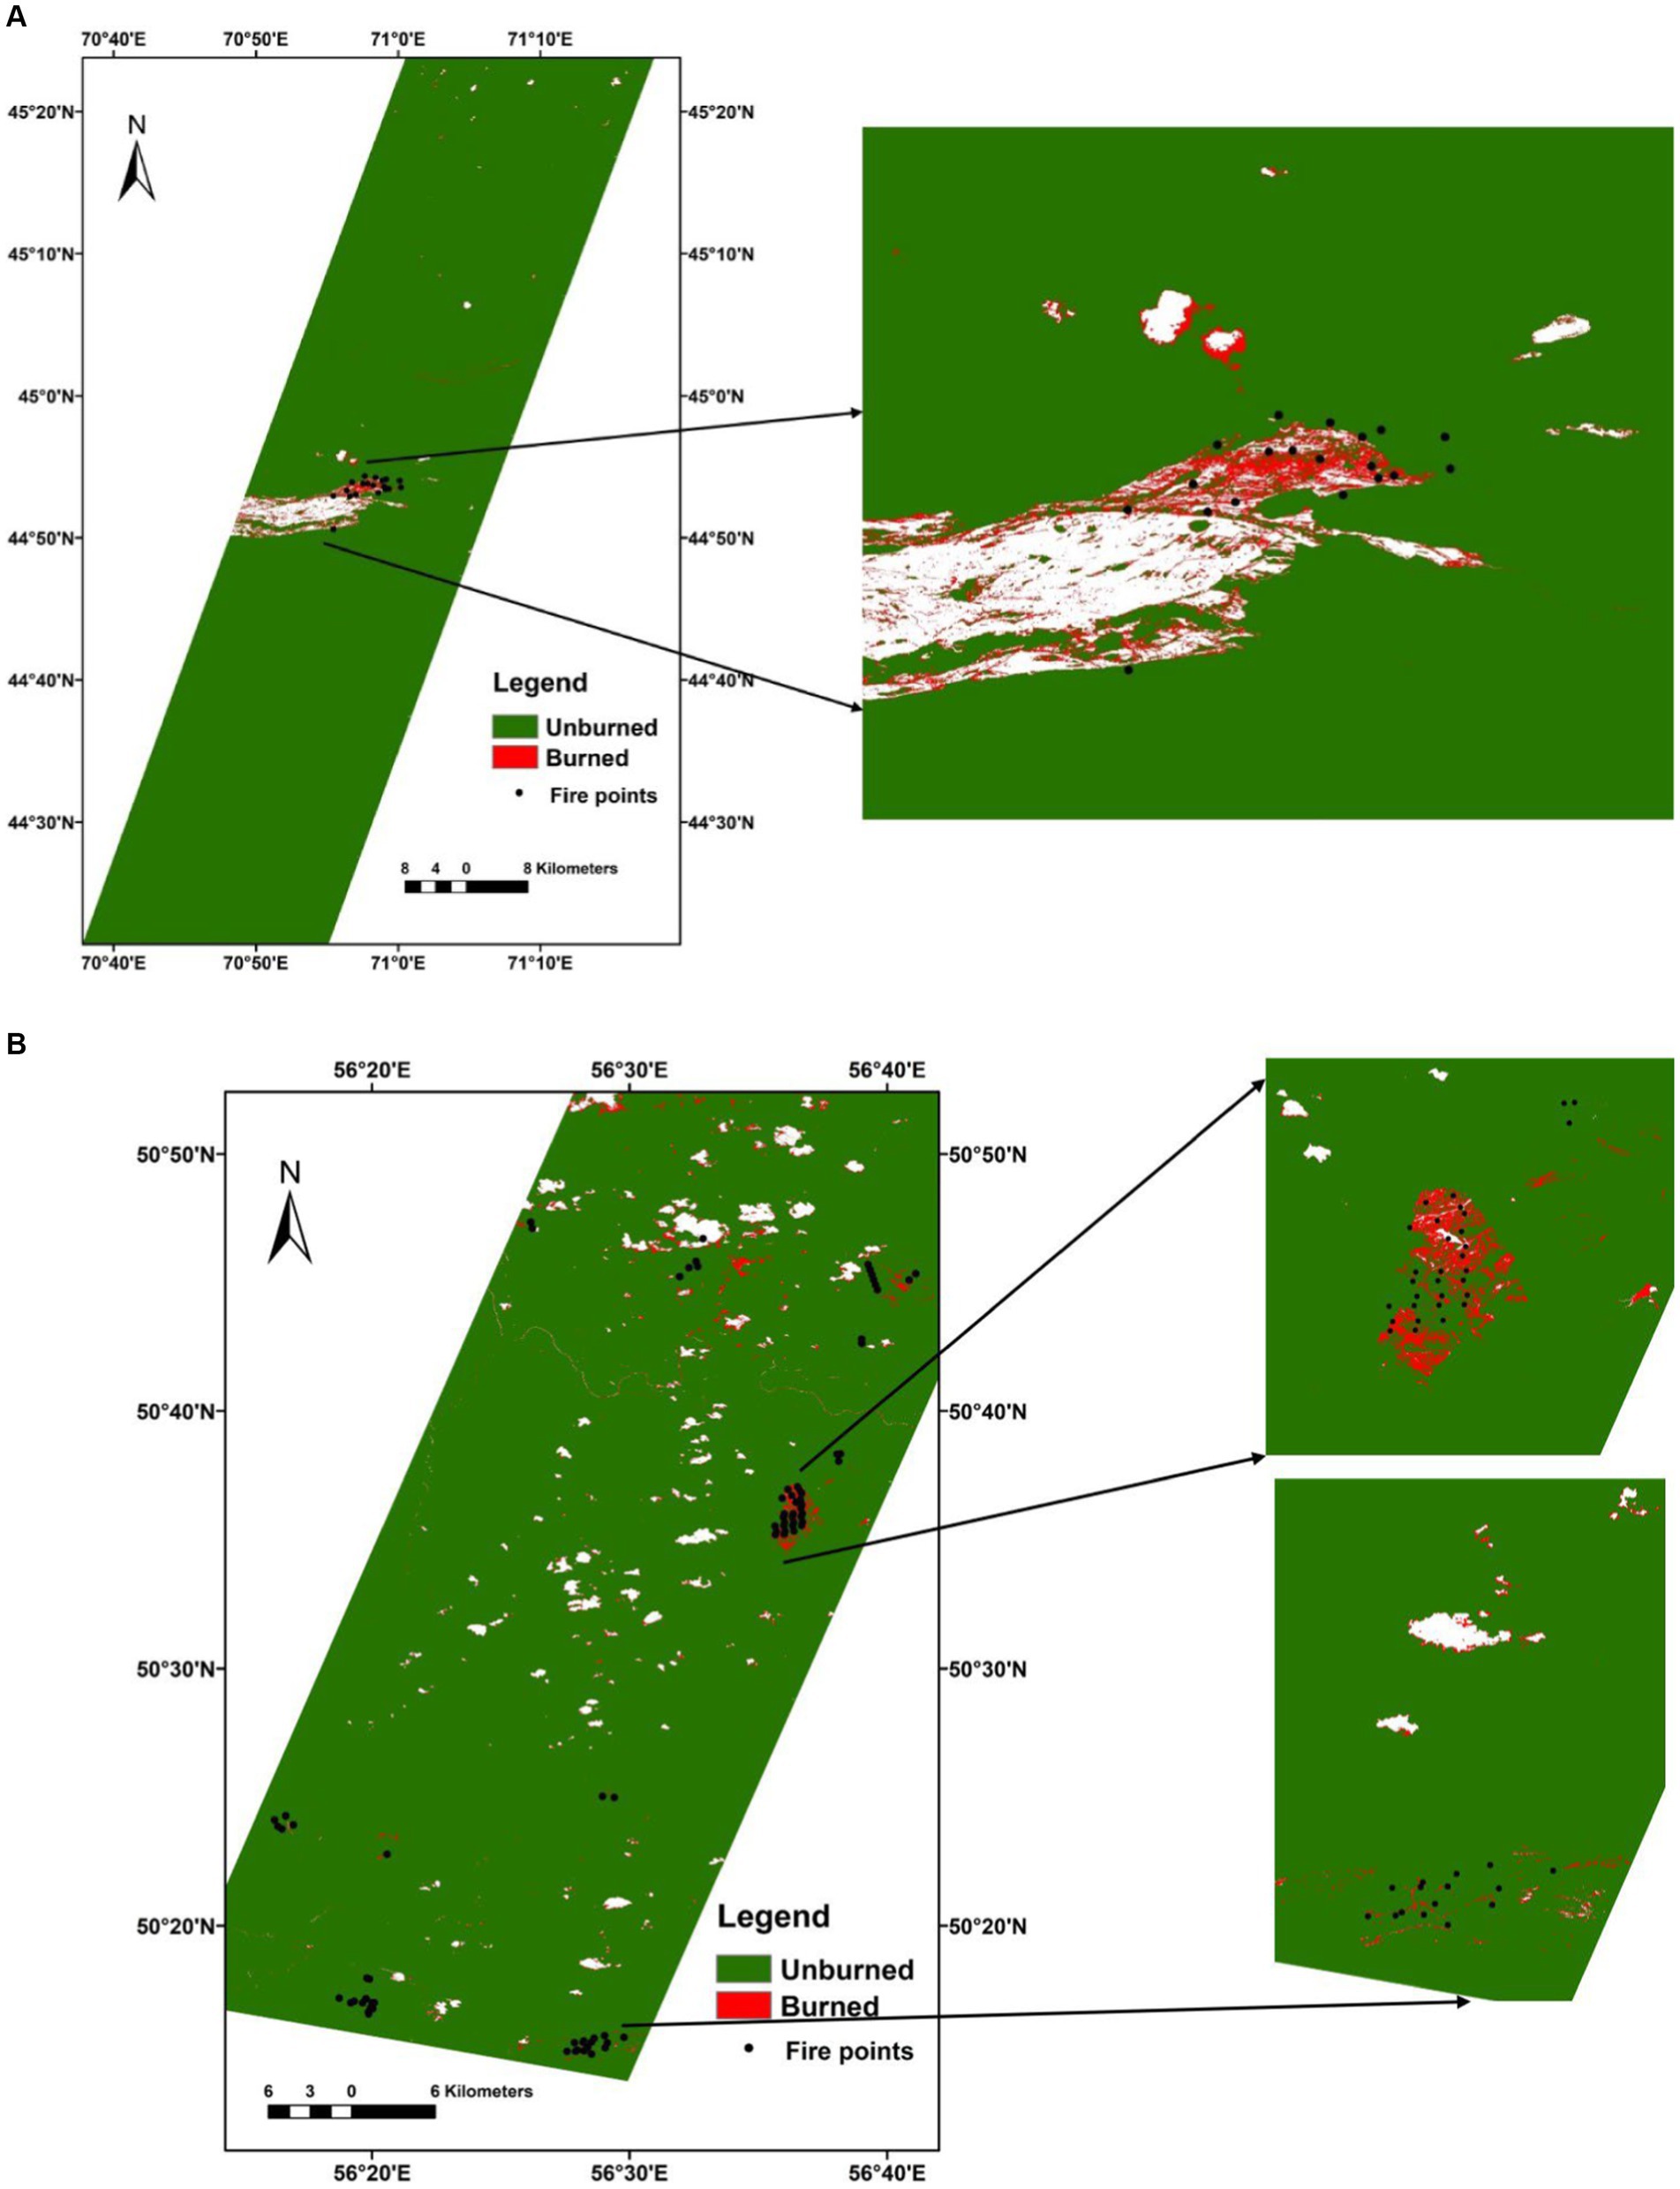
Figure 1. Burned area maps based on the BAI: (A) 25 September 2018 and (B) 13 October 2018 overlaid with the corresponding day active fire points.
It was also concluded from the above discussion that the BAI shows the highest accuracy in extracting the burned area from the KazEOSat-1 satellite datasets.
High-resolution satellite data have limitations and challenges for burned area mapping, including spectral similarities between burned areas and other land cover types, cloud cover, and weather conditions obstructing accurate mapping, timing of image acquisition impacting accuracy, difficulties in capturing mixed severity burns, and biases introduced by data processing algorithms (Woodbury and Weinstein, 2006). As a result, there can be underestimation of burned areas, overestimation due to cloud cover and smoke, and uncertainties in spectral signatures and severity classification. Ancillary data and field validation can help improve accuracy and reduce uncertainties.
In this study, KazEOSat-1 satellite datasets are utilized to map the burned area in the different regions of Kazakhstan due to its higher spatial resolution (4 m). This study compared three spectral indices, namely, AVI, BAI, and GEMI for mapping the burnt area based on four spectral bands NIR, blue, red, and green of KazEOSat-1 satellite datasets. First, TOA reflectance is calculated from the DN values for each band before proceeding to calculate the above-mentioned spectral indices. The results of spectral indices, AVI, BAI, and GEMI are compared based on a discriminative index (M) for quantifying the effectiveness of each index based on burned area. The spectral index BAI shows higher M values than other indices; therefore, the index BAI has the higher capability to extract the burned area as compared with AVI and GEMI. Accuracy was calculated based on the number of forest fire incidents that fell in burned and unburned areas, and results show that BAI shows the highest accuracy, whereas AVI shows the lowest accuracy among them. Therefore, the BAI has the highest ability for extracting the burned area using the KazEOSat-1 satellite datasets. As the revisit time period of KazEOSat is 3 days, this study will be useful to map the burnt area and fire progression in Kazakhstan.
The results presented in the article were obtained within the framework of the implementation of the Republican budget program 008 No. BR0533648/EFP “Optimization of technical parameters and a methodological approach to the use of remote sensing data of domestic satellite KazEOSat-1,2 “Subprogram 1 “Development of scientific methods for evaluating soil fertility of North Kazakhstan on the basis of the Earth remote sensing data from KazEOSat-1,2 satellites and geoinformation technologies.”
Publicly available datasets were analyzed in this study. This data can be found here: http://www.gharysh.kz.
KVS: Conceptualization, Data curation, Investigation, Methodology, Project administration, Supervision, Validation, Writing – original draft, Writing – review & editing. SS: Writing – original draft, Writing – review & editing, Software. GK: Funding acquisition, Resources, Writing – review & editing. KG: Resources, Writing – review & editing. GB: Resources, Writing – review & editing.
The authors declare that this study received funding from Kazakhstan National Company. The funder was not involved in the study design, collection, analysis, interpretation of data, the writing of this article, or the decision to submit it for publication.
The authors are grateful to the Ministry of Digital Development, Innovations, and Aerospace Industry of the Republic of Kazakhstan and Kazakhstan National Company for providing support during the research. The article presents the results obtained in the framework of the implementation of the scientific and technical program on targeted program financing of applied scientific research studies in the field of space activities for 2018-2020 by the Aerospace Committee of the Ministry of Defense and Aerospace Industry of the Republic of Kazakhstan. The authors acknowledge the MODIS Science team for the Science Algorithms, the Processing Team for producing MODIS data, and the GES DAAC MODIS Data Support Team for making the MODIS data available to the user community, the NASA Earthdata team, and FIRMS websites for free MODIS TERRA datasets and active fire data.
Authors KVS, SS, GK, KG, and GB were employed by company Kazakhstan National Company.
The remaining authors declare that the research was conducted in the absence of any commercial or financial relationships that could be construed as a potential conflict of interest.
All claims expressed in this article are solely those of the authors and do not necessarily represent those of their affiliated organizations, or those of the publisher, the editors and the reviewers. Any product that may be evaluated in this article, or claim that may be made by its manufacturer, is not guaranteed or endorsed by the publisher.
Ashburn, P. (1979). The vegetative index number and crop identification. NASA. Johnson Space Center Proc. of Tech. Sessions, Houston, TX, USA.
Bisquert, M., Sánchez, J., and Caselles, V. (2014). Modeling fire danger in Galicia and Asturias (Spain) from MODIS images. Remote Sens. 6, 540–554. doi: 10.3390/rs6010540
Chu, T., Guo, X., and Takeda, K. (2017). Effects of burn severity and environmental conditions on post-fire regeneration in Siberian larch forest. Forests 8:76. doi: 10.3390/f8030076
Chuvieco, E. (2008). “Satellite observation of biomass burning: implications in global change research” in Earth observation of global change: The role of satellite remote sensing in monitoring the global environment (Dordrecht: Springer Netherlands), 109–142.
Chuvieco, E., and Congalton, R. G. (1988). Mapping and inventory of forest fires from digital processing of TM data. Geocarto Int. 3, 41–53. doi: 10.1080/10106048809354180
Chuvieco, E., Martin, M. P., and Palacios, A. (2002). Assessment of different spectral indices in the red-near-infrared spectral domain for burned land discrimination. Int. J. Remote Sens. 23, 5103–5110. doi: 10.1080/01431160210153129
Cochrane, M. A., Alencar, A., Schulze, M. D., Souza, C. M. Jr., Nepstad, D. C., Lefebvre, P., et al. (1999). Positive feedbacks in the fire dynamic of closed canopy tropical forests. Science 284, 1832–1835. doi: 10.1126/science.284.5421.1832
de Magalhaes, R. M., and Schwilk, D. W. (2012). Leaf traits and litter flammability: evidence for non-additive mixture effects in a temperate forest. J. Ecol. 100, 1153–1163. doi: 10.1111/j.1365-2745.2012.01987.x
Elstak, J., Taylor, M., Praine, I., Da Silva, C. A., Carrin, G., Laffaye, G., et al. (2010). A million square kilometer optical satellite for Kazakhstan. In 61st international Astronautical congress 2010, 2010 (pp. 3128–3133).
Eskandari, S., Pourghasemi, H. R., and Tiefenbacher, J. P. (2020). Relations of land cover, topography, and climate to fire occurrence in natural regions of Iran: applying new data mining techniques for modeling and mapping fire danger. For. Ecol. Manag. 473:118338. doi: 10.1016/j.foreco.2020.118338
FAO (2015). “Global Forest Resources Assessment 2015” in FAO forestry paper no. 1 (Rome: UN Food and Agriculture Organization).
FIRMS. Available at: https://firms.modaps.eosdis.nasa.gov/download/. (Accessed on July, 30 2019).
Flannigan, M. D., Stocks, B. J., and Wotton, B. M. (2000). Climate change and forest fires. Sci. Total Environ. 262, 221–229. doi: 10.1016/S0048-9697(00)00524-6
França, G. B., Souza, C. M., Sano, E. E., and Shimabukuro, Y. E. (2018). Estimating burned area in tropical forests by combining very-high resolution and moderate-resolution satellite data. Int. J. Appl. Earth Obs. Geoinf. 66, 1–9.
García, M. L., and Caselles, V. (1991). Mapping burns and natural reforestation using thematic mapper data. Geocarto Int. 6, 31–37. doi: 10.1080/10106049109354290
Grégoire, J. M., Tansey, K., and Silva, J. M. N. (2003). The GBA2000 initiative: developing a global burnt area database from SPOT-VEGETATION imagery. Int. J. Remote Sens. 24, 1369–1376. doi: 10.1080/0143116021000044850
Hammill, K. A., and Bradstock, R. A. (2006). Remote sensing of fire severity in the Blue Mountains: influence of vegetation type and inferring fire intensity. Int. J. Wildland Fire 15, 213–226. doi: 10.1071/WF05051
Mamyrkhanova, M. (2019). Multi-million dollar damage caused by forest fires in Kazakhsta. Available at: https://kursiv.kz/news/proisshestviya/2019-08/mnogomillionnyy-uscherb-nanesli-lesnye-pozhary-v-kazakhstane
Johnstone, J. F., and Chapin, F. S. (2006). Effects of soil burn severity on post-fire tree recruitment in boreal forest. Ecosystems 9, 14–31. doi: 10.1007/s10021-004-0042-x
Justice, C. O., Giglio, L., Korontzi, S., Owens, J., Morisette, J. T., Roy, D., et al. (2002). The MODIS fire products. Remote Sens. Environ. 83, 244–262. doi: 10.1016/S0034-4257(02)00076-7
Kasischke, E. S., French, N. H., Harrell, P., Christensen, N. L. Jr., Ustin, S. L., and Barry, D. (1993). Monitoring of wildfires in boreal forests using large area AVHRR NDVI composite image data. Remote Sens. Environ. 45, 61–71. doi: 10.1016/0034-4257(93)90082-9
Key, C. H., and Benson, N. C. (1999). “Measuring and remote sensing of burn severity” in Proceedings joint fire science conference and workshop, vol. 2 (Moscow, ID: University of Idaho and International Association of Wildland Fire), 284.
Leblon, B., San-Miguel-Ayanz, J., Bourgeau-Chavez, L., and Kong, M. (2016). “Remote sensing of wildfires” in Land surface remote sensing (London: Elsevier), 55–95.
Liu, W., Wang, L., Zhou, Y., Wang, S., Zhu, J., and Wang, F. (2016). A comparison of forest fire burned area indices based on HJ satellite data. Nat. Hazards 81, 971–980. doi: 10.1007/s11069-015-2115-x
Macdonald, S. E. (2007). Effects of partial post-fire salvage harvesting on vegetation communities in the boreal mixedwood forest region of northeastern Alberta, Canada. For. Ecol. Manag. 239, 21–31. doi: 10.1016/j.foreco.2006.11.006
Martin, M. P., and Chuvieco, E. (1995). Mapping and evaluation of burned land from multitemporal analysis of AVHRR NDVI images. EARSeL Adv. Remote Sen. 4, 7–13.
Martín, M. P., Díaz-Delgado, R., Chuvieco, E., and Ventura, G. (2002). Burned land mapping using NOAA-AVHRR and TERRA-MODIS. In IV International conference on forest fire research (pp. 18–23).
Mattar, C., Hernández, J., Santamaría-Artigas, A., Durán-Alarcón, C., Olivera-Guerra, L., Inzunza, M., et al. (2014). A first in-flight absolute calibration of the Chilean earth observation satellite. ISPRS J. Photogramm. Remote Sens. 92, 16–25. doi: 10.1016/j.isprsjprs.2014.02.017
Michalek, J. L., French, N. H. F., Kasischke, E. S., Johnson, R. D., and Colwell, J. E. (2000). Using Landsat TM data to estimate carbon release from burned biomass in an Alaskan spruce forest complex. Int. J. Remote Sens. 21, 323–338. doi: 10.1080/014311600210858
Miller, J. D., and Thode, A. E. (2007). Quantifying burn severity in a heterogeneous landscape with a relative version of the delta normalized burn ratio (dNBR). Remote Sens. Environ. 109, 66–80. doi: 10.1016/j.rse.2006.12.006
NAOMI-1. KazEOSat-1. (2014). Available at:https://directory.eoportal.org/web/eoportal/satellite-missions/k/kazeosat-1
Östlund, L., Hörnberg, G., DeLuca, T. H., Liedgren, L., Wikström, P., Zackrisson, O., et al. (2015). Intensive land use in the Swedish mountains between AD 800 and 1200 led to deforestation and ecosystem transformation with long-lasting effects. Ambio 44, 508–520. doi: 10.1007/s13280-015-0634-z
Parks, S. A., Dillon, G. K., and Miller, C. (2014). A new metric for quantifying burn severity: the relativized burn ratio. Remote Sens. 6, 1827–1844. doi: 10.3390/rs6031827
Penner, J. E., Dickinson, R. E., and O'Neill, C. A. (1992). Effects of aerosol from biomass burning on the global radiation budget. Science 256, 1432–1434. doi: 10.1126/science.256.5062.1432
Pereira, J. M. (1999). A comparative evaluation of NOAA/AVHRR vegetation indexes for burned surface detection and mapping. IEEE Trans. Geosci. Remote Sens. 37, 217–226. doi: 10.1109/36.739156
Pinty, B., and Verstraete, M. M. (1992). GEMI: a non-linear index to monitor global vegetation from satellites. Vegetatio 101, 15–20. doi: 10.1007/BF00031911
Roy, D. P., and Boschetti, L. (2009). Southern Africa validation of the MODIS, L3JRC, and GlobCarbon burned-area products. IEEE Trans. Geosci. Remote Sens. 47, 1032–1044. doi: 10.1109/TGRS.2008.2009000
Roy, D. P., Boschetti, L., Justice, C. O., and Ju, J. (2008). The collection 5 MODIS burned area product—global evaluation by comparison with the MODIS active fire product. Remote Sens. Environ. 112, 3690–3707. doi: 10.1016/j.rse.2008.05.013
Roy, D. P., Jin, Y., Lewis, P. E., and Justice, C. O. (2005). Prototyping a global algorithm for systematic fire-affected area mapping using MODIS time series data. Remote Sens. Environ. 97, 137–162. doi: 10.1016/j.rse.2005.04.007
Roy, D. P., Lewis, P. E., and Justice, C. O. (2002). Burned area mapping using multi-temporal moderate spatial resolution data—a bi-directional reflectance model-based expectation approach. Remote Sens. Environ. 83, 263–286. doi: 10.1016/S0034-4257(02)00077-9
Schepers, L., Haest, B., Veraverbeke, S., Spanhove, T., Borre, J. V., and Goossens, R. (2014). Burned area detection and burn severity assessment of a heathland fire in Belgium using airborne imaging spectroscopy (APEX). Remote Sens. 6, 1803–1826. doi: 10.3390/rs6031803
Senande-Rivera, M., Insua-Costa, D., and Miguez-Macho, G. (2022). Spatial and temporal expansion of global wildland fire activity in response to climate change. Nat. Commun. 13:1208. doi: 10.1038/s41467-022-28835-2
Simon, M., Plummer, S., Fierens, F., Hoelzemann, J. J., and Arino, O. (2004). Burnt area detection at global scale using ATSR-2: the GLOBSCAR products and their qualification. J. Geophys. Res. Atmos. 109:D14S02. doi: 10.1029/2003JD003622
Stevens-Rumann, C. S., and Morgan, P. (2019). Tree regeneration following wildfires in the western US: a review. Fire Ecol. 15, 1–17. doi: 10.1186/s42408-019-0032-1
Stocks, B. J., Mason, J. A., Todd, J. B., Bosch, E. M., Wotton, B. M., Amiro, B. D., et al. (2002). Large forest fires in Canada, 1959–1997. J. Geophys. Res. Atmos. 107:FFR-5. doi: 10.1029/2001JD000484
Suresh Babu, K. V., Roy, A., and Aggarwal, R. (2018). Mapping of forest fire burned severity using the sentinel datasets. Int. Arch. Photogramm. Remote. Sens. Spat. Inf. Sci. XLII-5, 469–474. doi: 10.5194/isprs-archives-XLII-5-469-2018
Thuillier, G., Hersé, M., Labs, D., Foujols, T., Peetermans, W., Gillotay, D., et al. (2003). The solar spectral irradiance from 200 to 2400 nm as measured by the SOLSPEC spectrometer from the ATLAS and EURECA missions. Sol. Phys. 214, 1–22. doi: 10.1023/A:1024048429145
Veraverbeke, S., Harris, S., and Hook, S. (2011). Evaluating spectral indices for burned area discrimination using MODIS/ASTER (MASTER) airborne simulator data. Remote Sens. Environ. 115, 2702–2709. doi: 10.1016/j.rse.2011.06.010
White, J. D., Ryan, K. C., Key, C. C., and Running, S. W. (1996). Remote sensing of forest fire severity and vegetation recovery. Int. J. Wildland Fire 6, 125–136. doi: 10.1071/WF9960125
Woodbury, P., and Weinstein, D. (2006). State-of-the-science review of probabilistic regional risk assessment methodologies for Western wildlands. Available at: https://www.fs.usda.gov/wwetac/old/projects/PDFs/Wildlands_report_complete.pdf.
Keywords: burned area, KazEOSat-1 satellite, GEMI, AVI, BAI
Citation: Suresh Babu KV, Singh S, Kabdulova G, Gulnara K and Baktybekov G (2024) Geospatial assessment of forest fire impacts utilizing high-resolution KazEOSat-1 satellite data. Front. For. Glob. Change. 7:1296100. doi: 10.3389/ffgc.2024.1296100
Edited by:
Olga Christopoulou, University of Thessaly, GreeceReviewed by:
Massimo Menenti, Delft University of Technology, NetherlandsCopyright © 2024 Suresh Babu, Singh, Kabdulova, Gulnara and Baktybekov. This is an open-access article distributed under the terms of the Creative Commons Attribution License (CC BY). The use, distribution or reproduction in other forums is permitted, provided the original author(s) and the copyright owner(s) are credited and that the original publication in this journal is cited, in accordance with accepted academic practice. No use, distribution or reproduction is permitted which does not comply with these terms.
*Correspondence: Suresh Babu KV, c3VyZXNoYmFidS5paWl0aEBnbWFpbC5jb20=
Disclaimer: All claims expressed in this article are solely those of the authors and do not necessarily represent those of their affiliated organizations, or those of the publisher, the editors and the reviewers. Any product that may be evaluated in this article or claim that may be made by its manufacturer is not guaranteed or endorsed by the publisher.
Research integrity at Frontiers
Learn more about the work of our research integrity team to safeguard the quality of each article we publish.