 Andrew B. Reinmann
 Justin T. Bowers1
95% of researchers rate our articles as excellent or good
Learn more about the work of our research integrity team to safeguard the quality of each article we publish.
Find out more
ORIGINAL RESEARCH article
Front. For. Glob. Change , 16 February 2023
Sec. Forest Disturbance
Volume 6 - 2023 | https://doi.org/10.3389/ffgc.2023.988233
This article is part of the Research Topic Legacy Effects in Forest Ecosystems: How Forest Structure and Functioning Changes in the Years Following Disturbance Events View all 4 articles
Spring frosts can defoliate trees, reduce canopy carbon assimilation, and alter interspecific competition dynamics. These events may become more common with climate change, but our understanding of the associated ecological impacts is limited by the stochastic nature of their occurrences. In 2020, a late spring frost defoliated oak (Quercus spp.), but not co-occurring maples (Acer spp.) across temperate broadleaf forests of the Hudson Highlands in southern New York State, U.S.A. Defoliation impacted 60% of this region’s forests and delayed full leaf expansion of oaks by ∼17 days. We used this event as an opportunity to advance understanding of how leaf-level physiology, radial growth, and interspecific competition dynamics of mature trees respond to frost-induced defoliation. We quantified leaf-level photosynthetic capacity, stomatal conductance, and water-use efficiency (WUE), as well as basal area increment of defoliated red oak (Q. rubra) trees and non-defoliated red maple (A. rubrum) trees in 2020 (“defoliation year”) and 2021 (“reference year”). Oak defoliation provided red maple trees with a competitive edge in terms of photosynthetic capacity early in the growing season. However, the second cohort of red oak leaves that developed following defoliation had photosynthetic capacities that were 3–4 times higher than red maple trees by the second half of the growing season, likely facilitated by higher rates of stomatal conductance. The growing season mean photosynthetic capacities for the defoliation year were significantly higher for red oaks than red maples. Red oak basal area increment tended to be higher than red maple during both the defoliation and reference years. For both species basal area increment was significantly higher during the reference year than defoliation year, but the reasons remain unclear. Taken together, these findings demonstrate that temporal patterns of photosynthesis in temperate broadleaf forests are altered by defoliation events, but enhanced photosynthetic capacities of second cohort leaves can reduce the negative effects of delayed leaf expansion and mitigate competitive advantages conferred to undefoliated co-occurring tree species. We suggest that understanding a tree species’ ability to compensate for frost-induced defoliation is essential to accurately predict effects of extreme climate events on tree competition dynamics and ecosystem processes.
Climate change is expected to cause profound shifts in ecosystem community composition and a variety of ecosystem processes, such as carbon cycling (Reichstein et al., 2013; Frank et al., 2015; Taheri et al., 2021). In addition to changes in mean climate conditions, the frequency and severity of extreme climate events like drought, heavy precipitation, heat waves, and defoliating spring frosts are also changing (Xu et al., 2020; Zohner et al., 2020; Seneviratne et al., 2021). These extreme events often have larger and more adverse impacts on ecosystems and society than changes in mean climate alone (Ciais et al., 2005; Reichstein et al., 2013; Orsenigo et al., 2014; Frank et al., 2015). For example, heat waves, droughts, and spring frost defoliations have resulted in large declines in forest carbon uptake in Europe and North America (Ciais et al., 2005; Hufkens et al., 2012). Furthermore, ecosystem responses to extreme climate events often extend well beyond the duration of the event (Frank et al., 2015). The importance of extreme climate events as key drivers of ecosystem response to climate change is clear. However, the stochastic and often abrupt nature of these events make them difficult to study and has resulted in a paucity of published studies on this topic (Frank et al., 2015). This is particularly true for defoliating spring frosts.
Trees of temperate forests are most vulnerable to freeze events when leaves are emerging in the spring (Vitasse et al., 2014). Both leaf-out phenology and date of last frost are advancing and are expected to continue to do so as the climate warms (IPCC, 2022). However, the extent to which the advancement in the timing of these events is changing or will change the frequency of defoliating spring frost events remains a topic of debate. Changes in frost risk may vary as a function of geography, species, and even genetic provenance (Kramer et al., 2017; Bigler and Bugmann, 2018; Mura et al., 2022). Warming conditions in Switzerland are increasing, decreasing, or leaving unchanged the risk of spring frost damage to foliage of temperate tree species, depending on elevation (Bigler and Bugmann, 2018; Vitasse et al., 2018). Although most of the forests across North America are experiencing declines in the risk of damaging spring frost, many parts of the northeastern U.S. are actually experiencing an increase (Zohner et al., 2020). Augspurger (2013), using 124 years of phenology data for 13 tree species in Illinois, USA (and common across the northeastern U.S.), suggests that the risk of defoliating spring frost events for these species will increase as the climate warms. Additionally, results from a probabilistic model developed for North Carolina, USA indicates that increases in spring temperature variability are likely to overshadow any declines in defoliating spring frost risk associated with increasing mean spring air temperatures (Rigby and Porporato, 2008).
Defoliating spring frosts typically arise from a complex succession of meteorological events that influence spring leaf out phenology and include above average air temperatures in the spring followed by a hard freeze (generally < −2°C) (Vitasse et al., 2019). Leaf out phenology is tightly coupled with air temperatures (Richardson et al., 2006; Polgar and Primack, 2011) and has important implications for annual rates of gross primary production (GPP) and net ecosystem productivity (NEP) in temperate broadleaf forests (Richardson et al., 2009). Warmer conditions in the spring that trigger an earlier leaf out could effectively extend the growing season and increase forest canopy carbon uptake. However, earlier leaf out may also increase susceptibility to a late spring frost that causes defoliation of affected trees. While these events typically trigger production of a second cohort of leaves, the effective start of the growing season is delayed, which has the potential to reduce tree growth and forest canopy carbon uptake in temperate broadleaf forests (Hufkens et al., 2012; Wiley et al., 2017; Rubio-Cuadrado et al., 2021).
Although defoliation reduces the time period of canopy carbon uptake, trees may exhibit some capacity to compensate for this (Wang et al., 2021). Defoliation experiments indicate that the second cohort of leaves can have higher photosynthetic capacities than the initial cohort, though the magnitude of this compensatory response can vary across species (Heichel and Turner, 1983; Vitasse et al., 2019). In addition, trees can utilize stored nonstructural carbohydrates to maintain wood production and radial growth (Hoogesteger and Karlsson, 1992; Wang et al., 2021). Findings from a recent meta-analysis of tree response to experimental defoliation suggest that increases in photosynthetic capacity of second cohort leaves could be driven by reductions in the carbon source (i.e., leaf area) relative to the sink (e.g., wood production, nonstructural carbohydrate storage) (Wang et al., 2021). However, as the authors note, the majority of studies on this topic have induced summer defoliation (i.e., mimicking insect defoliators) on seedlings and saplings and the response of mature trees to defoliation from a late spring frost is comparatively poorly understood. Tree response to insect defoliation could be very different than the response from a spring frost-induced defoliation because of differences in the timing and abruptness of defoliation.
Because the susceptibility of a tree species to a spring frost is linked to the timing of leaf out, differences in spring leaf out phenology of co-occurring tree species could have important implications for species range distributions and tree competition dynamics (Olano et al., 2021). Temperate broadleaf forests across much of the eastern U.S. are dominated by oak (Quercus sp.) trees, but changes in disturbance dynamics, browsing pressure, and mesiphication are causing the abundance of red maple (A. rubrum) trees to increase and recruitment of oaks to decline (Abrams, 1998; McEwan et al., 2011). Oaks and maples have very different physiological characteristics with species like red oak (Q. rubra) having higher rates of photosynthesis, transpiration, net primary production, and a higher carbon-use efficiency of wood production than red maples (Bassow and Bazzaz, 1998; Nagel et al., 2002; Turnbull et al., 2002; Daley and Phillips, 2006; Reinmann and Templer, 2016). As a result, increases in the relative abundance of red maple trees could have important implications for ecosystem carbon dynamics. In addition, differences in leaf out phenology of red maple and red oak trees (Xie et al., 2018) could impart different levels of susceptibility to spring frosts.
Our understanding of tree physiological response to late spring frost events and how these events might impact interspecific competition dynamics among co-occurring trees is currently limited. The mechanism of defoliation from spring frosts (i.e., low temperatures) imposes serious challenges to experimentally simulating these events in tall-stature forest ecosystems, which increases the importance of taking advantage of naturally occurring events. In early-May of 2020, there was a spring frost event that caused substantial defoliation damage to trees across the Hudson Highlands Ecoregion in southeastern New York, USA. Here, we use this extreme climate event as an opportunity to answer the following key questions related to mature tree response to frost-induced defoliation: (1) How might leaf-level physiological parameters such as photosynthesis, stomatal conductance, and water-use efficiency (WUE) differ between first and second cohort leaves? (2) How is radial tree growth impacted? and (3) Do such events tilt competition dynamics between co-occurring tree species that are differentially impacted by a spring frost?
This research was conducted at Black Rock Forest, which is a 1,550-ha research forest located in Cornwall, New York (41°24′ N, 74°01′ W; Figure 1) within the Hudson Highlands Ecoregion. The topography is mountainous with elevations ranging from 110 to 450 m above mean sea level and forest structure, composition, and recruitment dynamics driven by natural processes. Mean annual precipitation is 1,200 mm evenly distributed throughout the year and air temperatures are strongly seasonal ranging from a mean of −2.7°C in January to a mean of 23.4°C in July (Ross, 1958; Turnbull et al., 2001). The forests are dominated by oak trees (Quercus sp.) with red oak (Q. rubra) comprising the highest proportion of total tree biomass (Schuster et al., 2008). Red maple (Acer rubrum) is increasing in abundance in the canopy and is the most common tree species in the understory (Schuster et al., 2008). Black Rock Forest is within the Hudson Highlands Ecoregion (58i), which spans an approximately 8,000 km2 area from northern New Jersey northeast through southern New York (Figure 1) that is dominated by temperate deciduous forest.
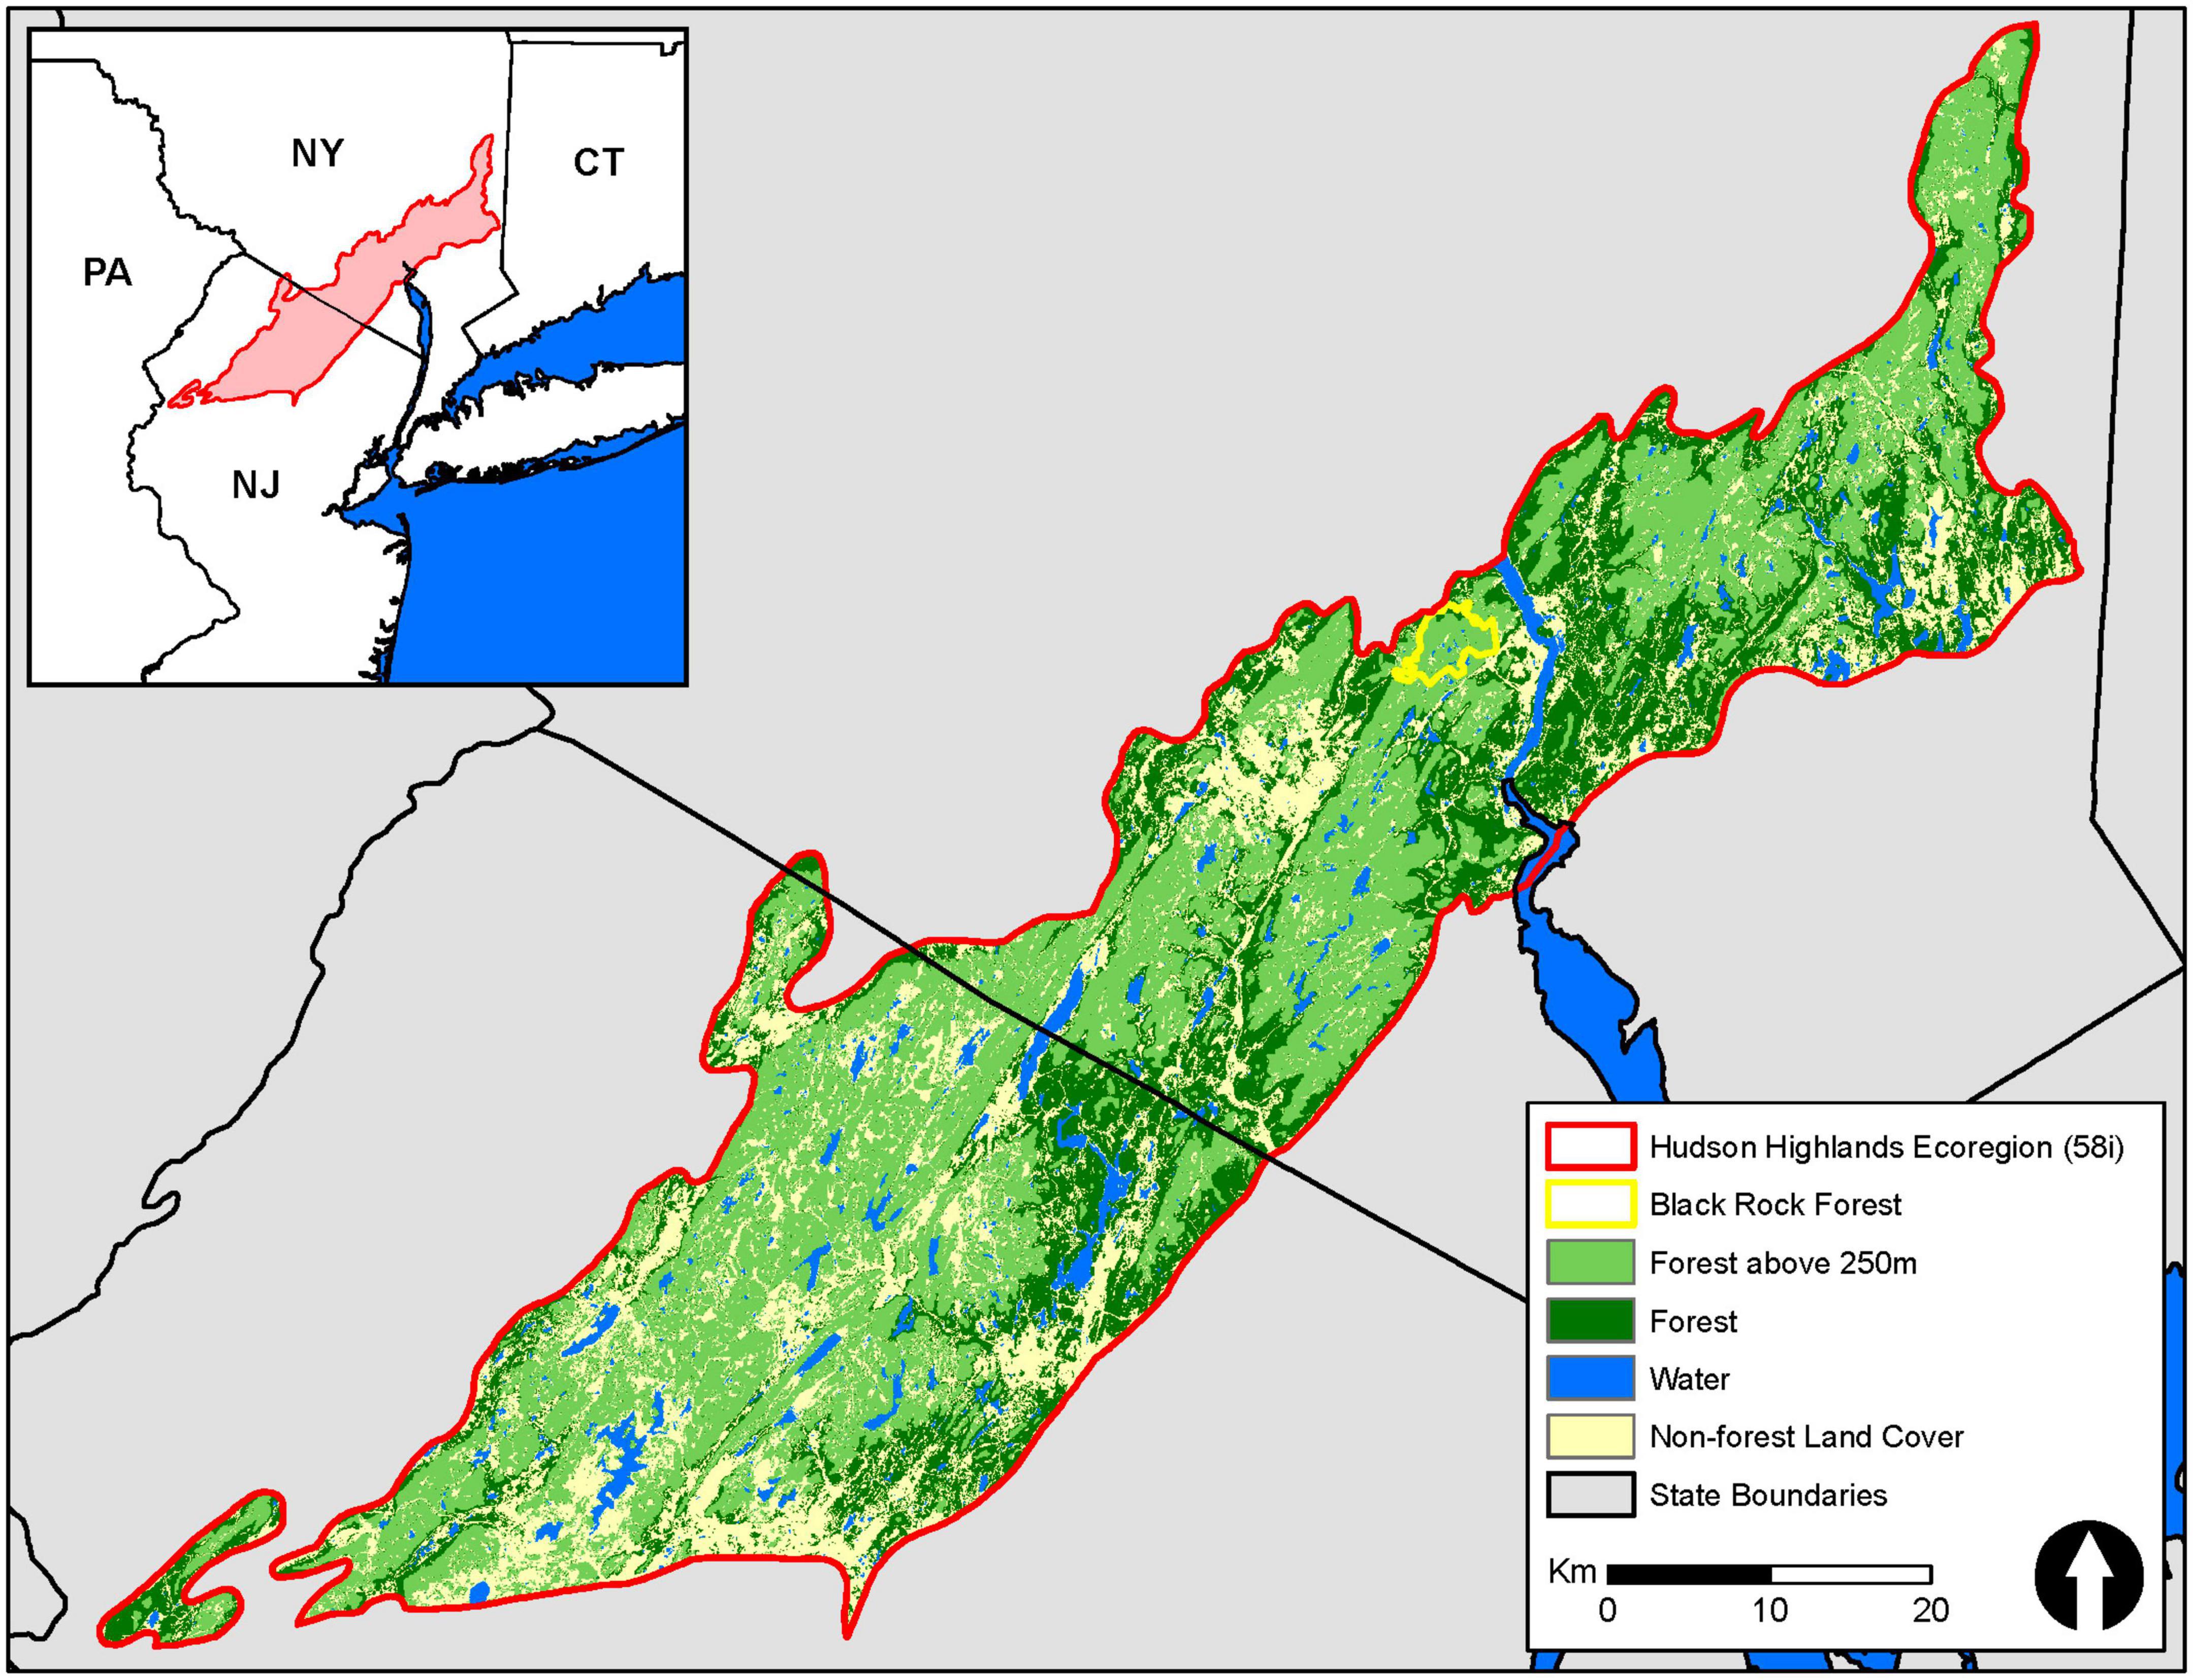
Figure 1. Extent of the Hudson Highlands Ecoregion (red outline) in southern New York and northern New Jersey. Greens indicate the extent of forest cover within the Ecoregion and light green indicates the extent of forest area that was likely impacted by the defoliating spring frost event on May 8, 2020. Land cover type was derived from the 2019 National Land Cover Database. Extent of defoliation was estimated using differences in NDVI between 2019 and 2020 to determine elevation thresholds.
In 2018, we established three long-term monitoring plots spanning an elevation range from 300 to 420 m at Black Rock Forest. Each plot was centered on three mature red oak trees and two (n = 1 plot) or three (n = 2 plots) mature red maple trees in the canopy (hereafter “core trees”). Within each plot, all of the core canopy trees were within 30 m of one another. On the evening of May 8 – 9, 2020 middle and higher elevations across much of the Hudson Highlands Ecoregion in northern New Jersey and Southern New York experienced a hard freeze (hereafter referred to as the 2020 freeze event). Air temperatures during this event dropped to nearly −5°C (Figure 2), which is substantially colder than the temperature threshold of ∼−2°C typically considered damaging to new foliage in temperate broadleaf forests (Vitasse et al., 2019). This freeze event resulted in widespread defoliation of oak trees, which had leafed out several days prior (Figure 3). Red maple trees have been documented to leaf out earlier than red oak trees in this region (Xie et al., 2018). However, in 2020 the co-occurring red maple trees did not leaf out until several days after this event and no defoliation was observed (Figure 2). We measured radial tree growth and leaf-level physiology of red maple and red oak trees in each plot in 2020 and also in 2021, which we used as a “reference” year because there was no defoliation. We used records from a weather station at Black Rock Forest to characterize climate conditions during 2020 and 2021 (Munson et al., 2023).
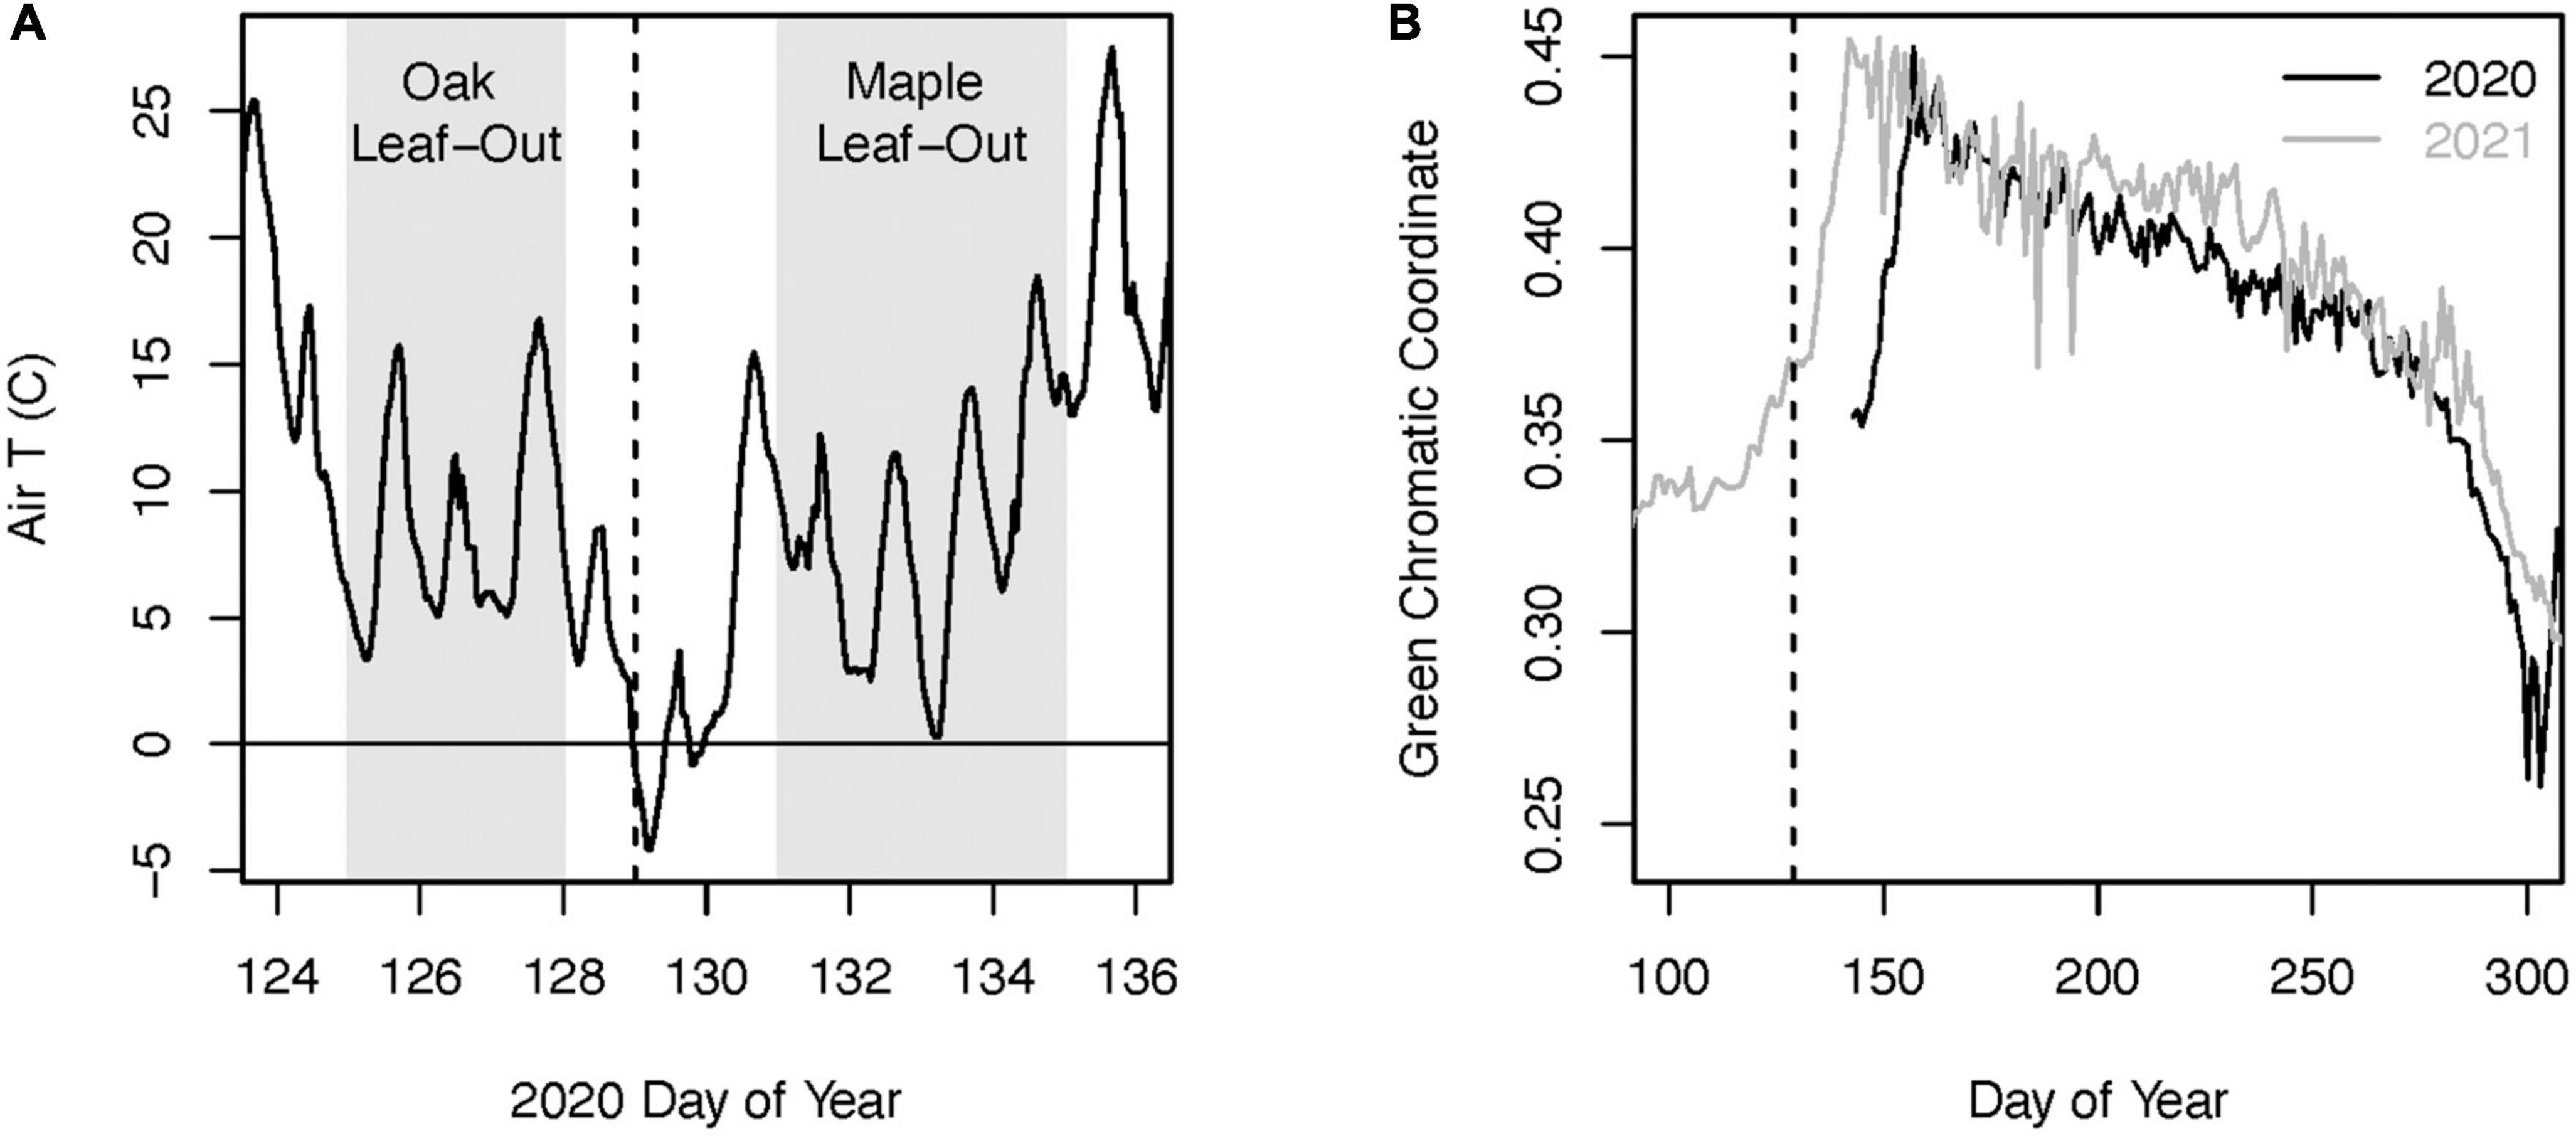
Figure 2. Air temperature at Black Rock Forest during the leaf-out period of 2020 (A). The gray shaded areas indicate the approximate time period of leaf bud break for the red oak and red maple trees in our plots. The green chromatic coordinate from phenocam data at Black Rock Forest (B) indicates the delayed leaf-out phenology following the defoliating freeze event in 2020 compared to the reference year of 2021. The dashed vertical lines in both figures indicate the night of the freeze event.
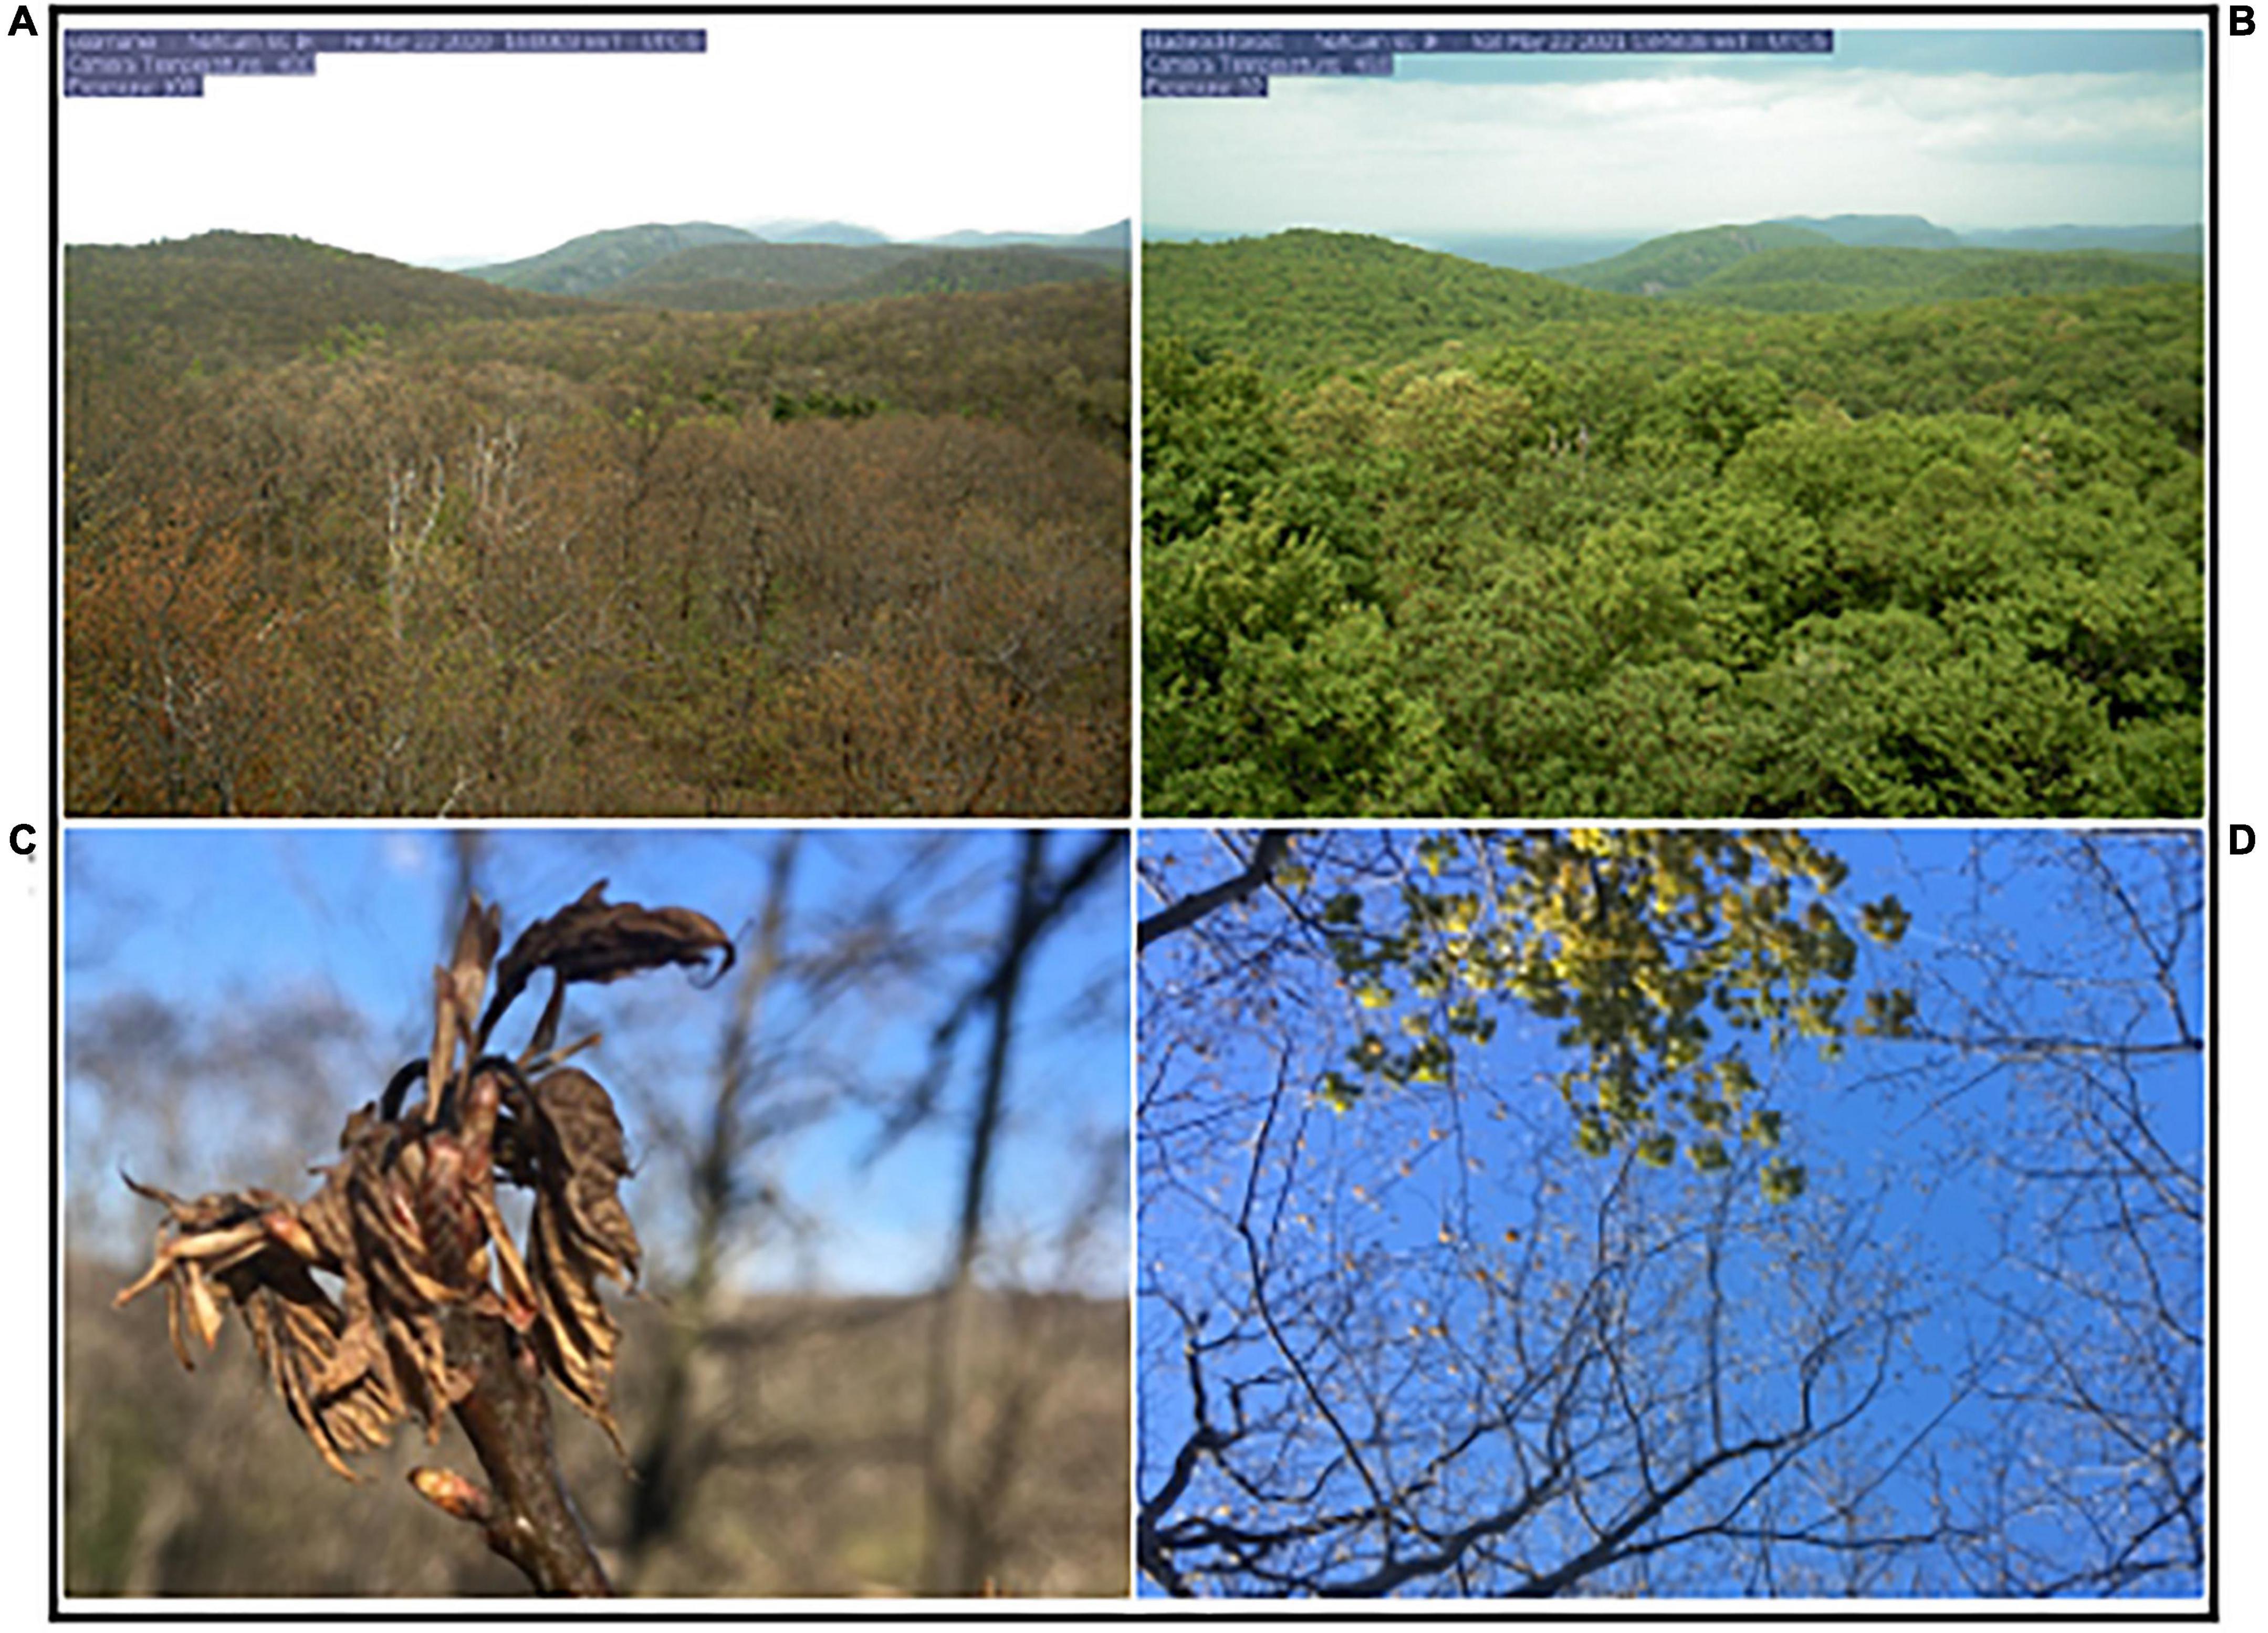
Figure 3. Images of impacts of spring freeze defoliation at Black Rock Forest including phenocam images from May 22, 2020 (A) and May 22, 2021 (B), frost-killed oak leaves (C), and canopy with red maple tree fully leafed-out and defoliated oaks in the background (D). Note, text in images includes image metadata associated with all phenocam images and is not relevant to the current study.
Leaf phenology data from a phenology camera targeting an oak-dominated canopy at Black Rock Forest1 indicates that the defoliation during the 2020 freeze event delayed the timing of peak green chromatic coordinate (a metric of canopy greenness; ∼June 10th) by ∼17 days compared to 2021 (May 23rd) (Figures 2, 3). To estimate the spatial extent of this defoliation event across the Hudson Highlands Ecoregion, we analyzed 10-m resolution Sentinel-2 satellite remote sensing imagery for May 21, 2019 (i.e., year without defoliation) and May 17, 2020 (i.e., year with defoliation). We selected these imagery dates based on the date of the freeze event, data availability, and cloud cover. The imagery was used to quantify the Normalized Difference Vegetation Index (NDVI). Within the Ecoregion, we created 12.1 km × 1 km plots that were selected based on absence of cloud cover, presence of forest, and to have even spatial distribution across the study area. For each 1 km2 plot, we extracted NDVI values from each pixel of the rasters for both acquisition dates, as well as elevation values from the 10 m resolution National Elevation Dataset (Us Geological Survey (USGS), 1999), creating 120,000 points of data between 175 and 425 m in elevation. For each point, the difference in NDVI value year to year was calculated and plotted against the elevation of the given point to determine the lower elevation threshold that corresponded to defoliation. We used this elevation threshold in conjunction with the 2019 National Land Cover Database land cover product (Dewitz and US Geological Survey (USGS), 2021) and the National Elevation Dataset to estimate the total forest area within the Hudson Highlands Ecoregion that was impacted by this defoliation event. All GIS analyses were conducted using ArcMap version 10.5.1.
During March, 2020 (i.e., before the defoliating freeze event), one Meter Group D1 manual dendrometer band (Meter Group, Pullman, Oregon) was installed at breast height on each core red oak and red maple tree in each plot (n = 9 total red oak trees; n = 8 total red maple trees) to quantify temporal patterns in radial tree growth. We recorded dendrometer band measurements bi-weekly from March through October during 2020 and 2021, but growth generally ceased by the end of September. Radial growth measurements were converted to Basal Area Increment (BAI) from:
where r is the tree radius at the most recent measurement (t1) or the initial measurement (t0).
Following the 2020 freeze event, we selected an additional two canopy red oak trees and two canopy red maple trees in each plot for sampling canopy foliage for leaf-level physiological measurements. Canopy sampling was conducted on separate trees from those with dendrometers to avoid any artifacts of adding disturbance to the trees (i.e., frequent foliar sampling) with dendrometer bands. Using a shotgun, we excised sunlit twigs <1 cm in diameter from the canopy of each of the two red oak trees and two red maple trees designated for canopy sampling in each plot. During both 2020 and 2021, we collected canopy samples once during the early growing season (May 29–June 7; hereafter “Early”), once during the middle growing season (June 16–July 7, hereafter “Mid”), once during the late growing season (August 6–26, hereafter “Late”), and once at the end of the growing season (September 11–20, hereafter “End”). For a given year and sampling interval, all trees were sampled within a 7-day period. Each excised twig was cut in water generally within 3 min of sampling to maintain the transpiration stream. In a few instances, a twig got hung up as it fell to the ground and it took 5–10 min to get it into water. However, we have found that for the oak and maple trees in our study site twigs left out of water can maintain stomatal conductance and assimilation rates following excision for at least 10 min (i.e., the duration of our test). Twigs were kept immersed in water until after leaf-level physiological measurements were made (i.e., within 60 min of being excised). All oak leaves sampled were second cohort leaves.
We used a LiCor 6800 portable photosynthesis system with the Multiphase Fluorometer chamber (2 cm2 leaf cuvette; LiCor Bioscience, Lincoln, Nebraska, USA) to measure leaf-level photosynthetic capacity (“Amax”) and stomatal conductance (“gsw”) on 2–3 leaves per tree (from the excised branches) on each sampling date. Measurements were made under light saturating conditions (1400 μmols m–2 s–1) at ∼60% relative humidity, carbon dioxide concentrations of 410 ppm, and air temperatures of 24–26°C. Intrinsic water-use efficiency (“WUE”) was calculated from:
All statistical analyses were conducted using R version 4.2.0 (R Core Team). The plot was used as that smallest statistical sampling unit (i.e., n = 3). We used Analysis of Variance (ANOVA) to quantify potential differences among tree BAI, A, gsw, and WUE between tree species within a year. Differences among BAI, A, gsw, and WUE between years within a species were assessed using linear mixed-effects models [LMM; “lme” function in the “nlme” package (Pinheiro et al., 2019)] with “plot” as the random effect to account for the lack of independence among repeated measures from a plot. We use α = 0.05 to denote significance, but also report differences significant at α = 0.10. Assumptions of normality and constant variance were assessed by visual inspection of residuals and the Shapiro–Wilk normality test. Hereafter, the “defoliation year” refers to 2020 and the “reference year” refers to 2021.
Mean air temperatures during the growing season were similar in 2020 and 2021 and within 0.5°C of the 2015–2022 mean (i.e., duration of the record; Figure 4). The 2020 growing season was ∼20% drier than the 2015–2022 mean while the 2021 growing season was 55% wetter (Figure 4). However, the differences in precipitation between these two growing seasons were from two large tropical storms during the end of August (DOY 235 and 244; i.e., after our late growing season measurements) that collectively dropped 265 mm of rain. Prior to these events, cumulative precipitation was very similar between the 2 years (Figure 4). Our analyses of the Sentinel-2 satellite imagery indicate that across the 12.1 km2 areas surveyed, 119,600 out of 120,00010 m × 10 m pixels exhibited a decline in NDVI between 2019 and the defoliation year (2020) and 92.7% of these were above 250 m in elevation. Field observations from Black Rock Forest also suggest the lower elevation limit of the defoliation event was between 225 and 250 m. Using 250 m as lower elevation for the defoliation, we estimate that nearly 60% of the 185,00 ha of forest across the Hudson Highlands Ecoregion was impacted by this defoliation event in 2020 (Figure 1).
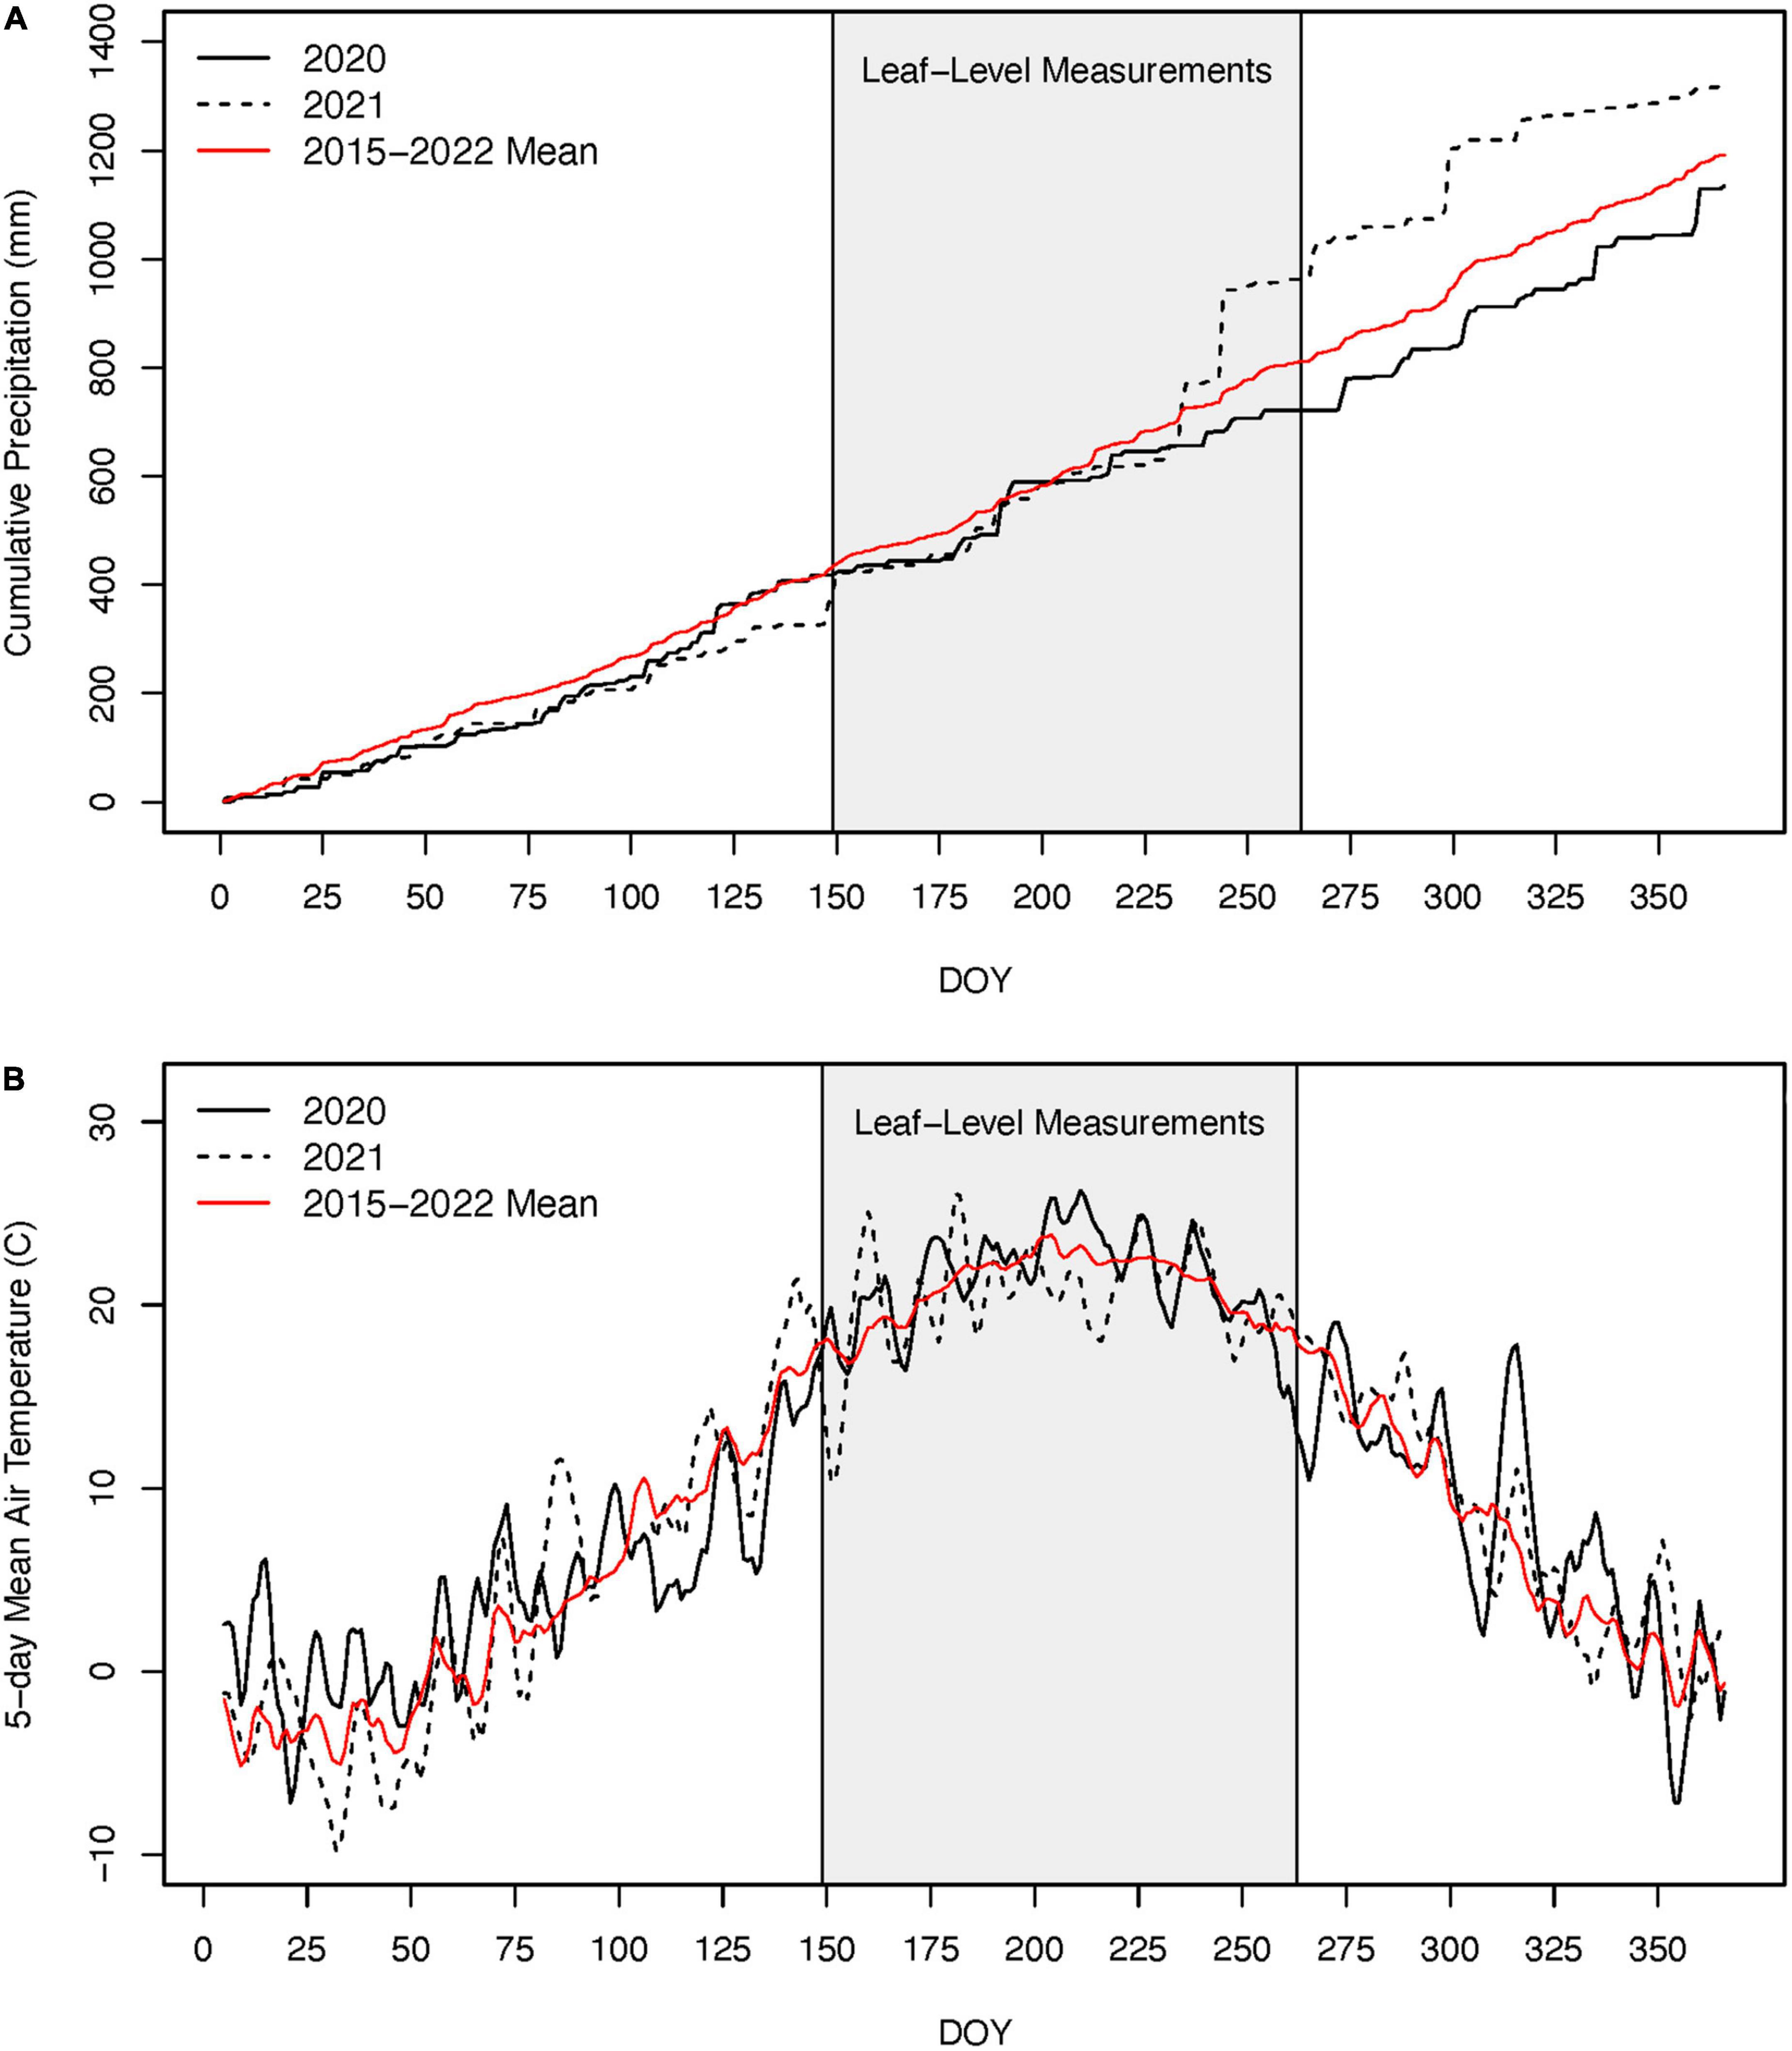
Figure 4. Cumulative precipitation (A) and 5-day running mean daily air temperatures (B) for 2020, 2021, and the 2015–2022 mean (i.e., period of time with available records for Black Rock Forest) (A). The gray box indicates the period during which we made leaf-level physiological measurements. Note, the large precipitation events in 2021 occurred after our August (late growing season) measurements and after nearly all radial tree growth occurred.
Photosynthetic capacity (i.e., Amax) of red oak trees peaked later in the season and at rates 2–3× higher than the peak of red maple trees during both years of this study (Figure 5). Seasonality of Amax was more pronounced for both species during the defoliation year than in the reference year (Figure 5). Amax of red maple trees was fairly stable across measurement periods during the reference year. By contrast, Amax of red maple trees during the first half of the defoliation year’s growing season (6.10 ± 0.99–6.58 ± 2.00 μmols CO2 m–2 s–1) tended to be twice as high as Amax during the second half (2.83 ± 0.37–3.15 ± 0.70 μmols CO2 m–2 s–1), but these differences were not statistically significant (p > 0.19). For red oak trees, Amax increased during the defoliation year’s growing season from 2.91 ± 0.64 μmols CO2 m–2 s–1 in the early growing season to a peak of 14.17 ± 2.94 μmols CO2 m–2 s–1 by the end of the growing season (p = 0.01) (Figure 5). During 2021, Amax of red oak was also lowest in the early growing season (4.04 ± 1.33 μmols CO2 m–2 s–1), but peaked by mid growing season (i.e., earlier than in 2020; 9.28 ± 1.75 μmols CO2 m–2 s–1) and remained relatively constant thereafter (Figure 5).
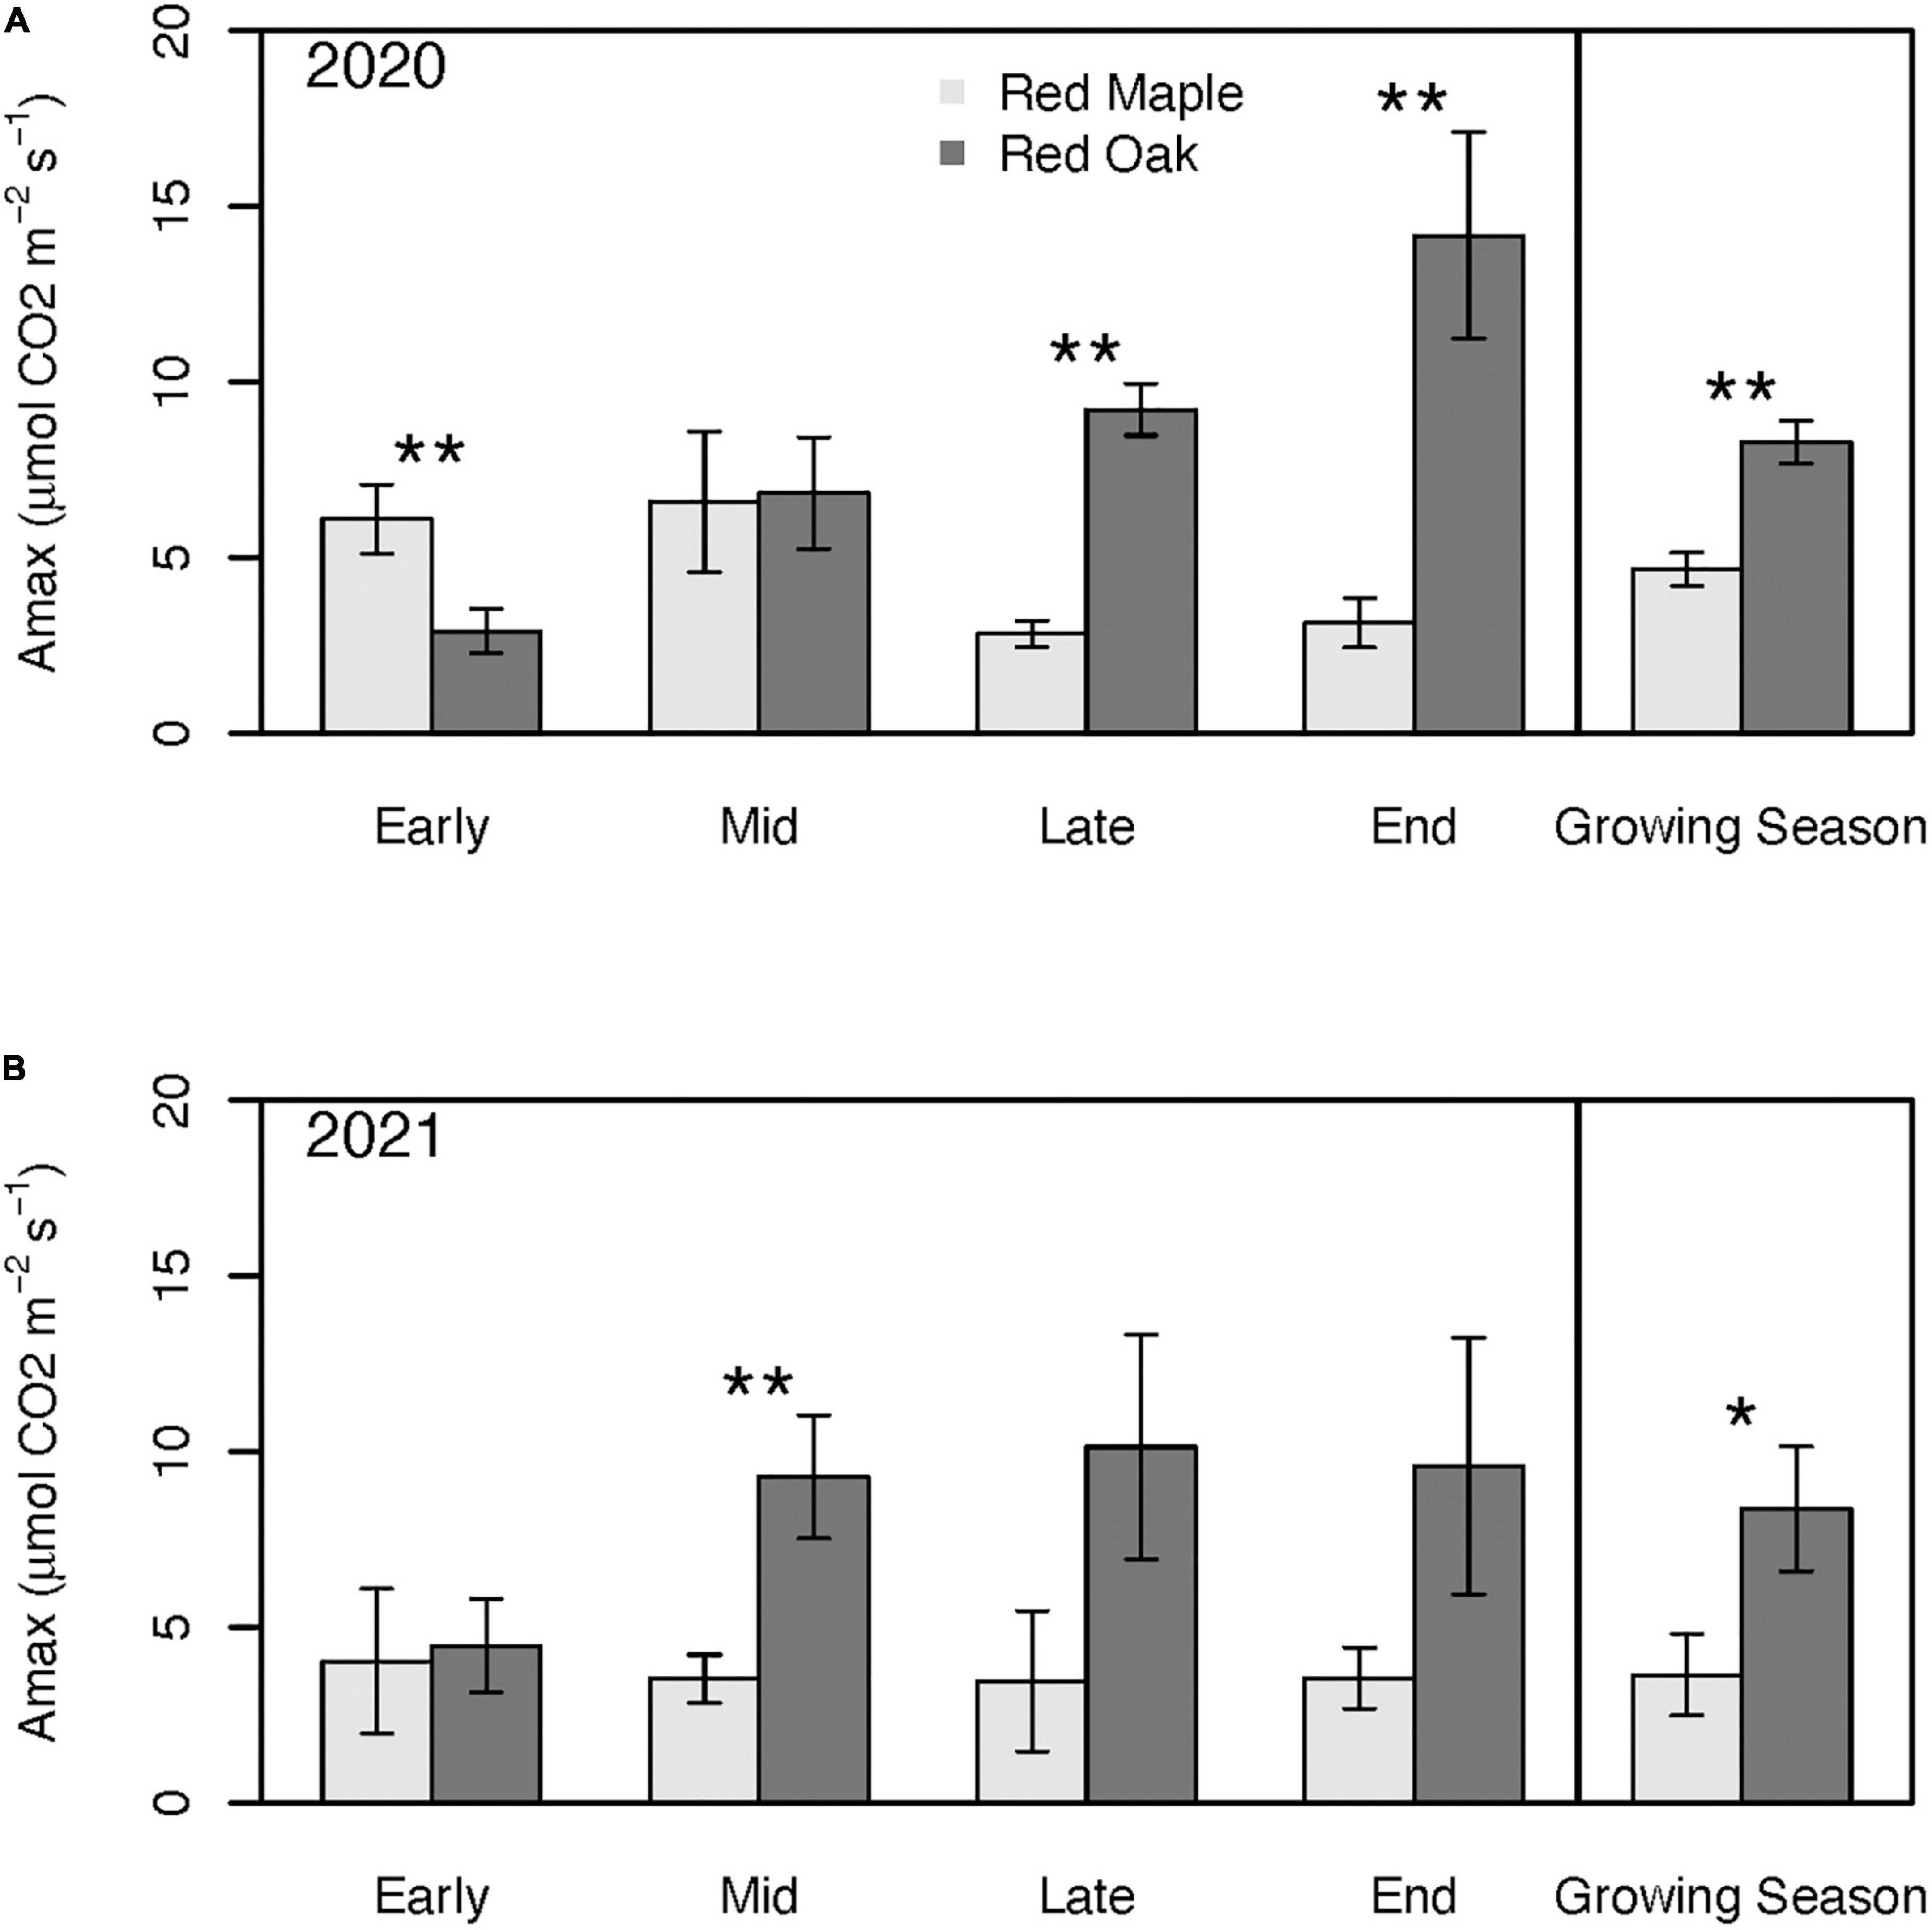
Figure 5. Photosynthetic capacity across the growing season and for the mean of the entire growing season during 2020 (i.e., year with oak-defoliating frost) (A) and 2021 (i.e., year without defoliating frost); (B) for red maple and red oak leaves. Asterisks denote differences between species within a year at **p < 0.05 and *p < 0.1. There were no significant interannual differences within a species. See Supplementary Tables 1A, B for summary statistics.
Amax of red maple trees tended to be lower than that of red oak trees with the exception of the early growing season of the defoliation year when red maple Amax was nearly twice as high as it was for red oak (p = 0.05; Figure 5). During this defoliation year, Amax of red oak trees caught up to the red maple trees by the mid growing season and by the late and end of the growing season red oak Amax was 3.25–4.5 times greater than Amax of red maple trees (p < 0.02; Figure 5). By contrast, during the reference year, Amax of red maple trees was never higher than the red oaks, but Amax differences between the two species also tended to be smaller than in the defoliation year (Figure 5). Despite having a higher photosynthetic capacity early in the growing season, mean growing season Amax of red maple trees was significantly lower than for red oak trees (p = 0.01; Figure 5). During the reference year, differences in mean growing season Amax between the two tree species was larger than during defoliation year (p = 0.09).
Patterns in stomatal conductance (gsw) across sampling periods and between species generally mimicked the patterns observed for Amax (Figure 6). Except for the early growing season, gsw of red oak leaves was typically considerably higher than for red maple leaves. Although Amax of maple was significantly higher than red oak during the early growing season, oak leaf gsw tended to be nearly twice that of the red maple leaves, but these differences were not significant (p = 0.51). There were few differences in WUE between these two species at any time during the growing season (Figure 7 and Supplementary Tables 3A, B). However, there were significant differences in WUE of red oak leaves between the defoliation year and the reference year. During the early growing season WUE of red oak leaves was nearly three times lower during the defoliation year than the reference year (p = 0.07). In contrast, WUE in the defoliation year was considerably higher than the reference year during the mid (p = 0.08) and late (p = 0.01) growing season sampling periods (Figure 7).
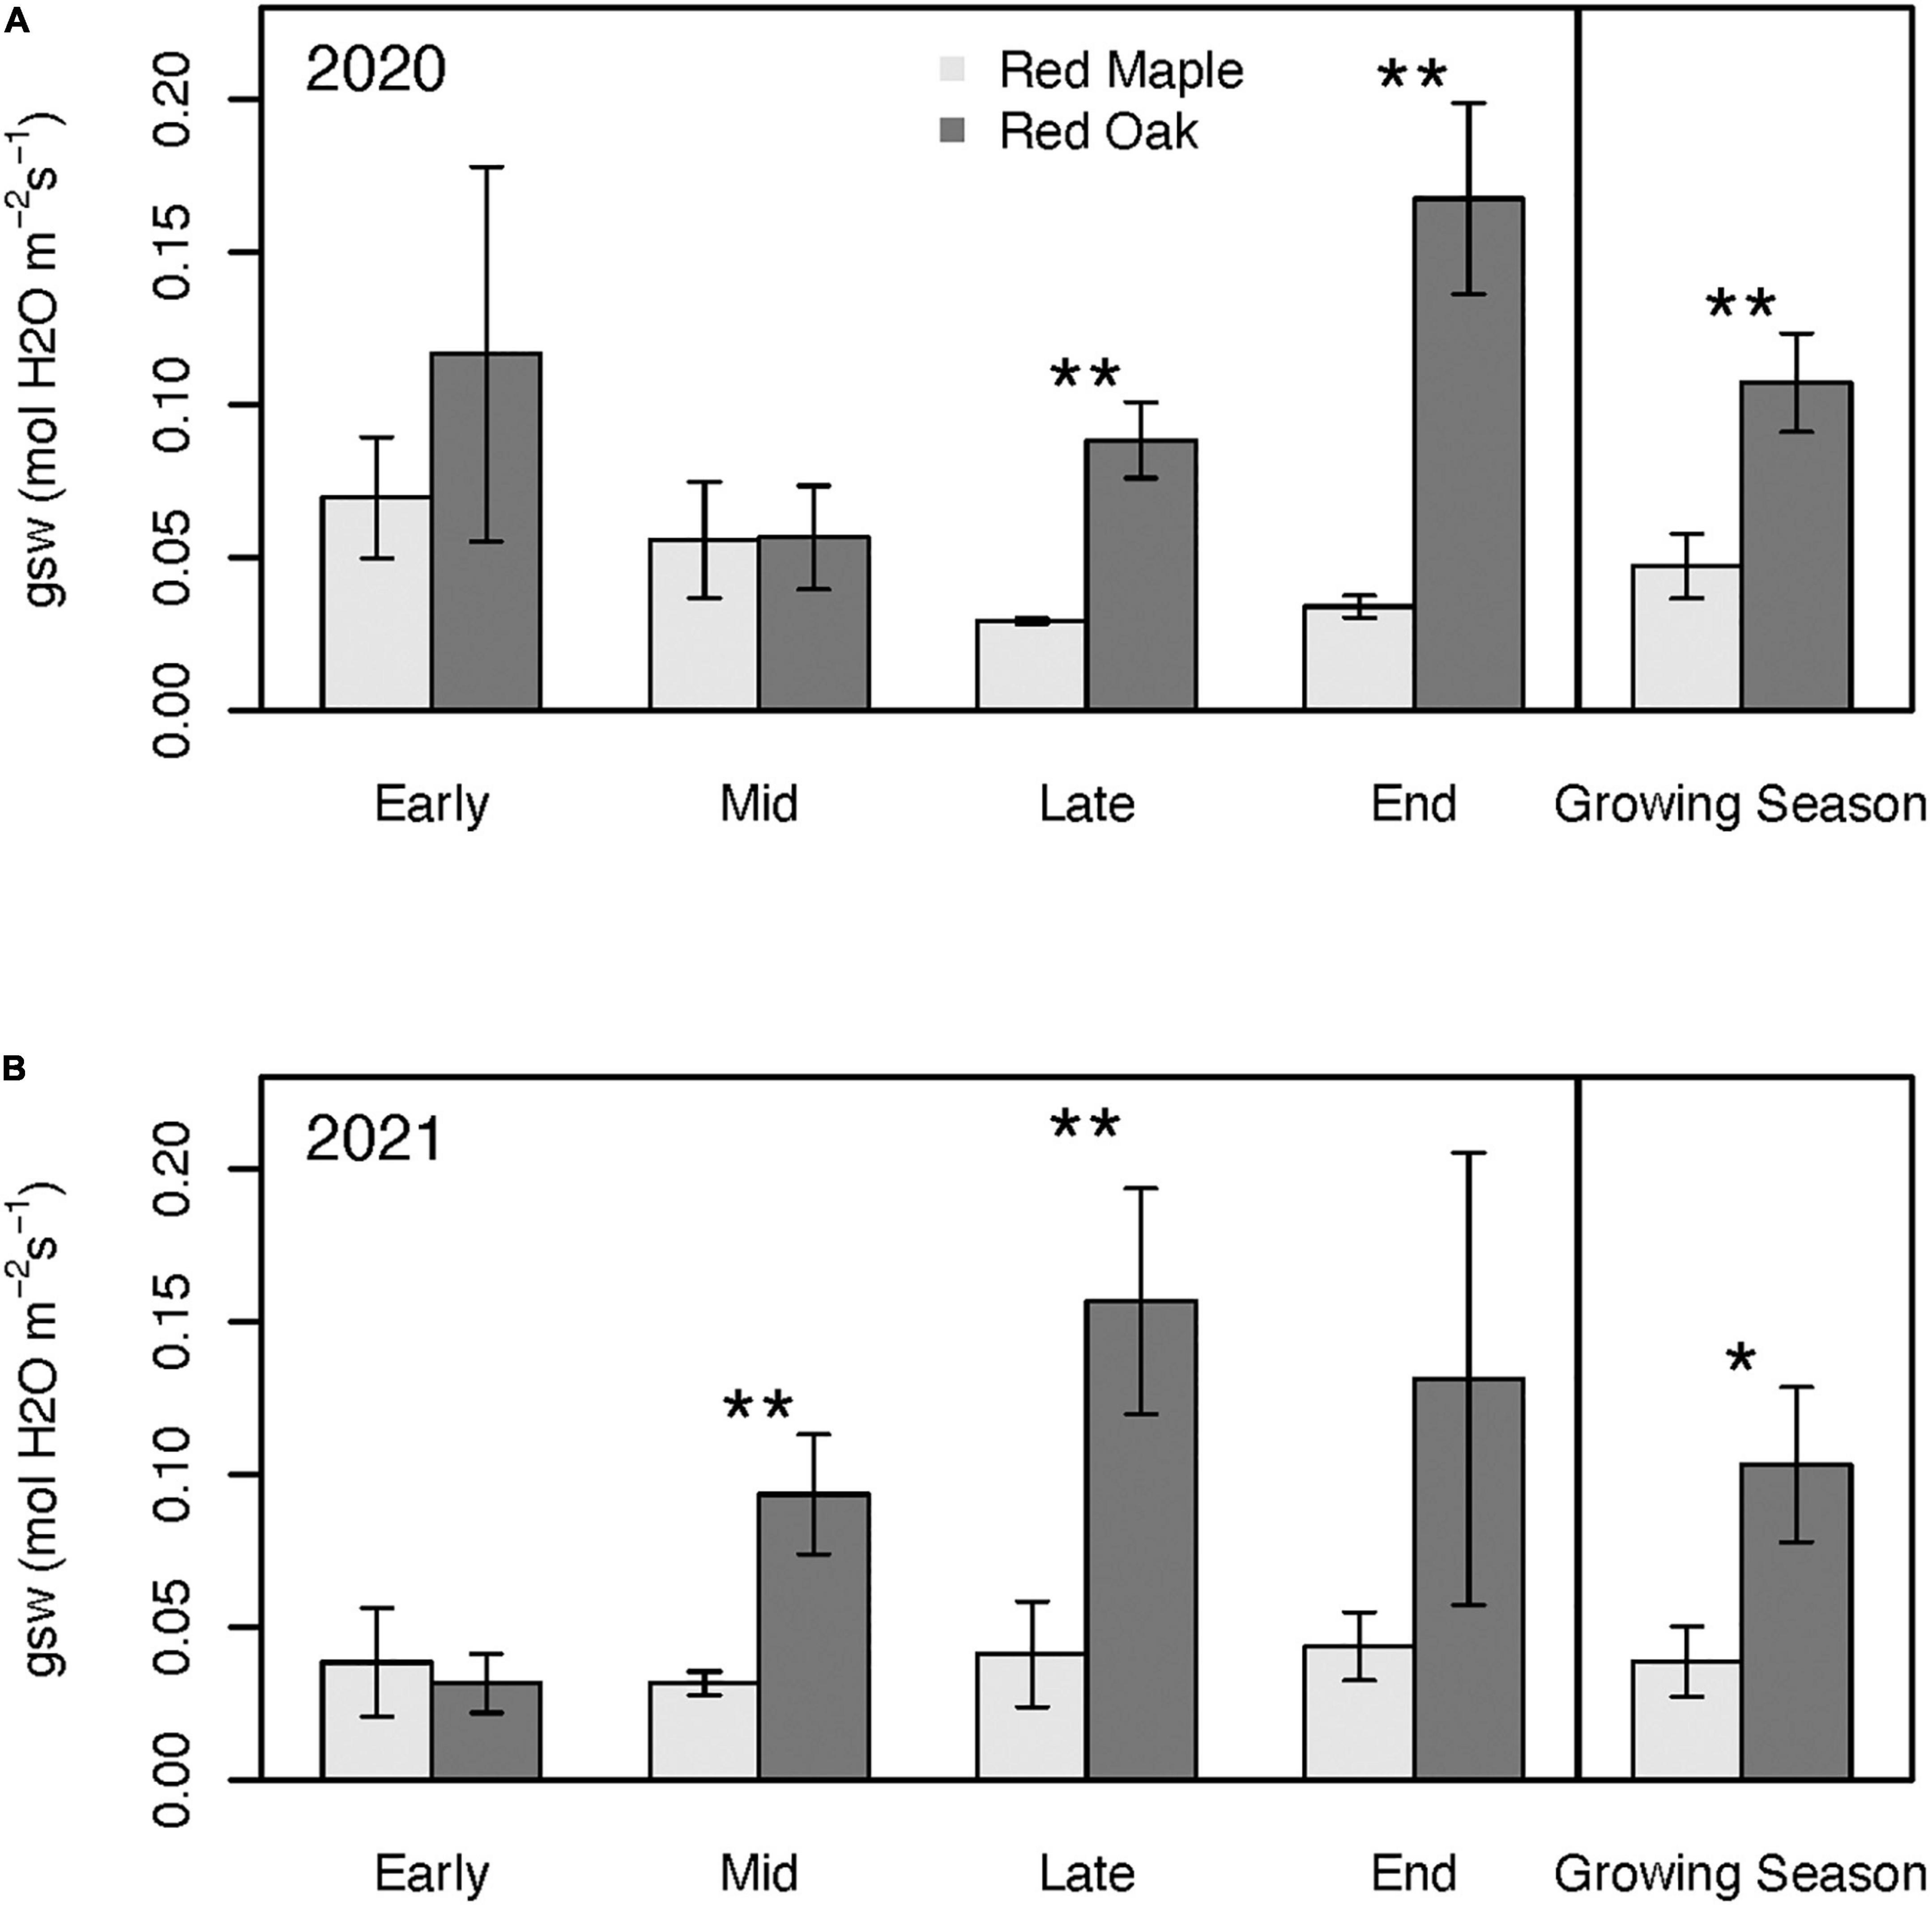
Figure 6. Stomatal conductance (gsw) across the growing season and for the mean of the entire growing season during 2020 (i.e., year with oak-defoliating frost) (A) and 2021 (i.e., year without defoliating frost); (B) for red maple and red oak leaves. Asterisks denote differences between species within a year at **p < 0.05 and *p < 0.1. There were no significant interannual differences within a species. See Supplementary Tables 2A, B for summary statistics.
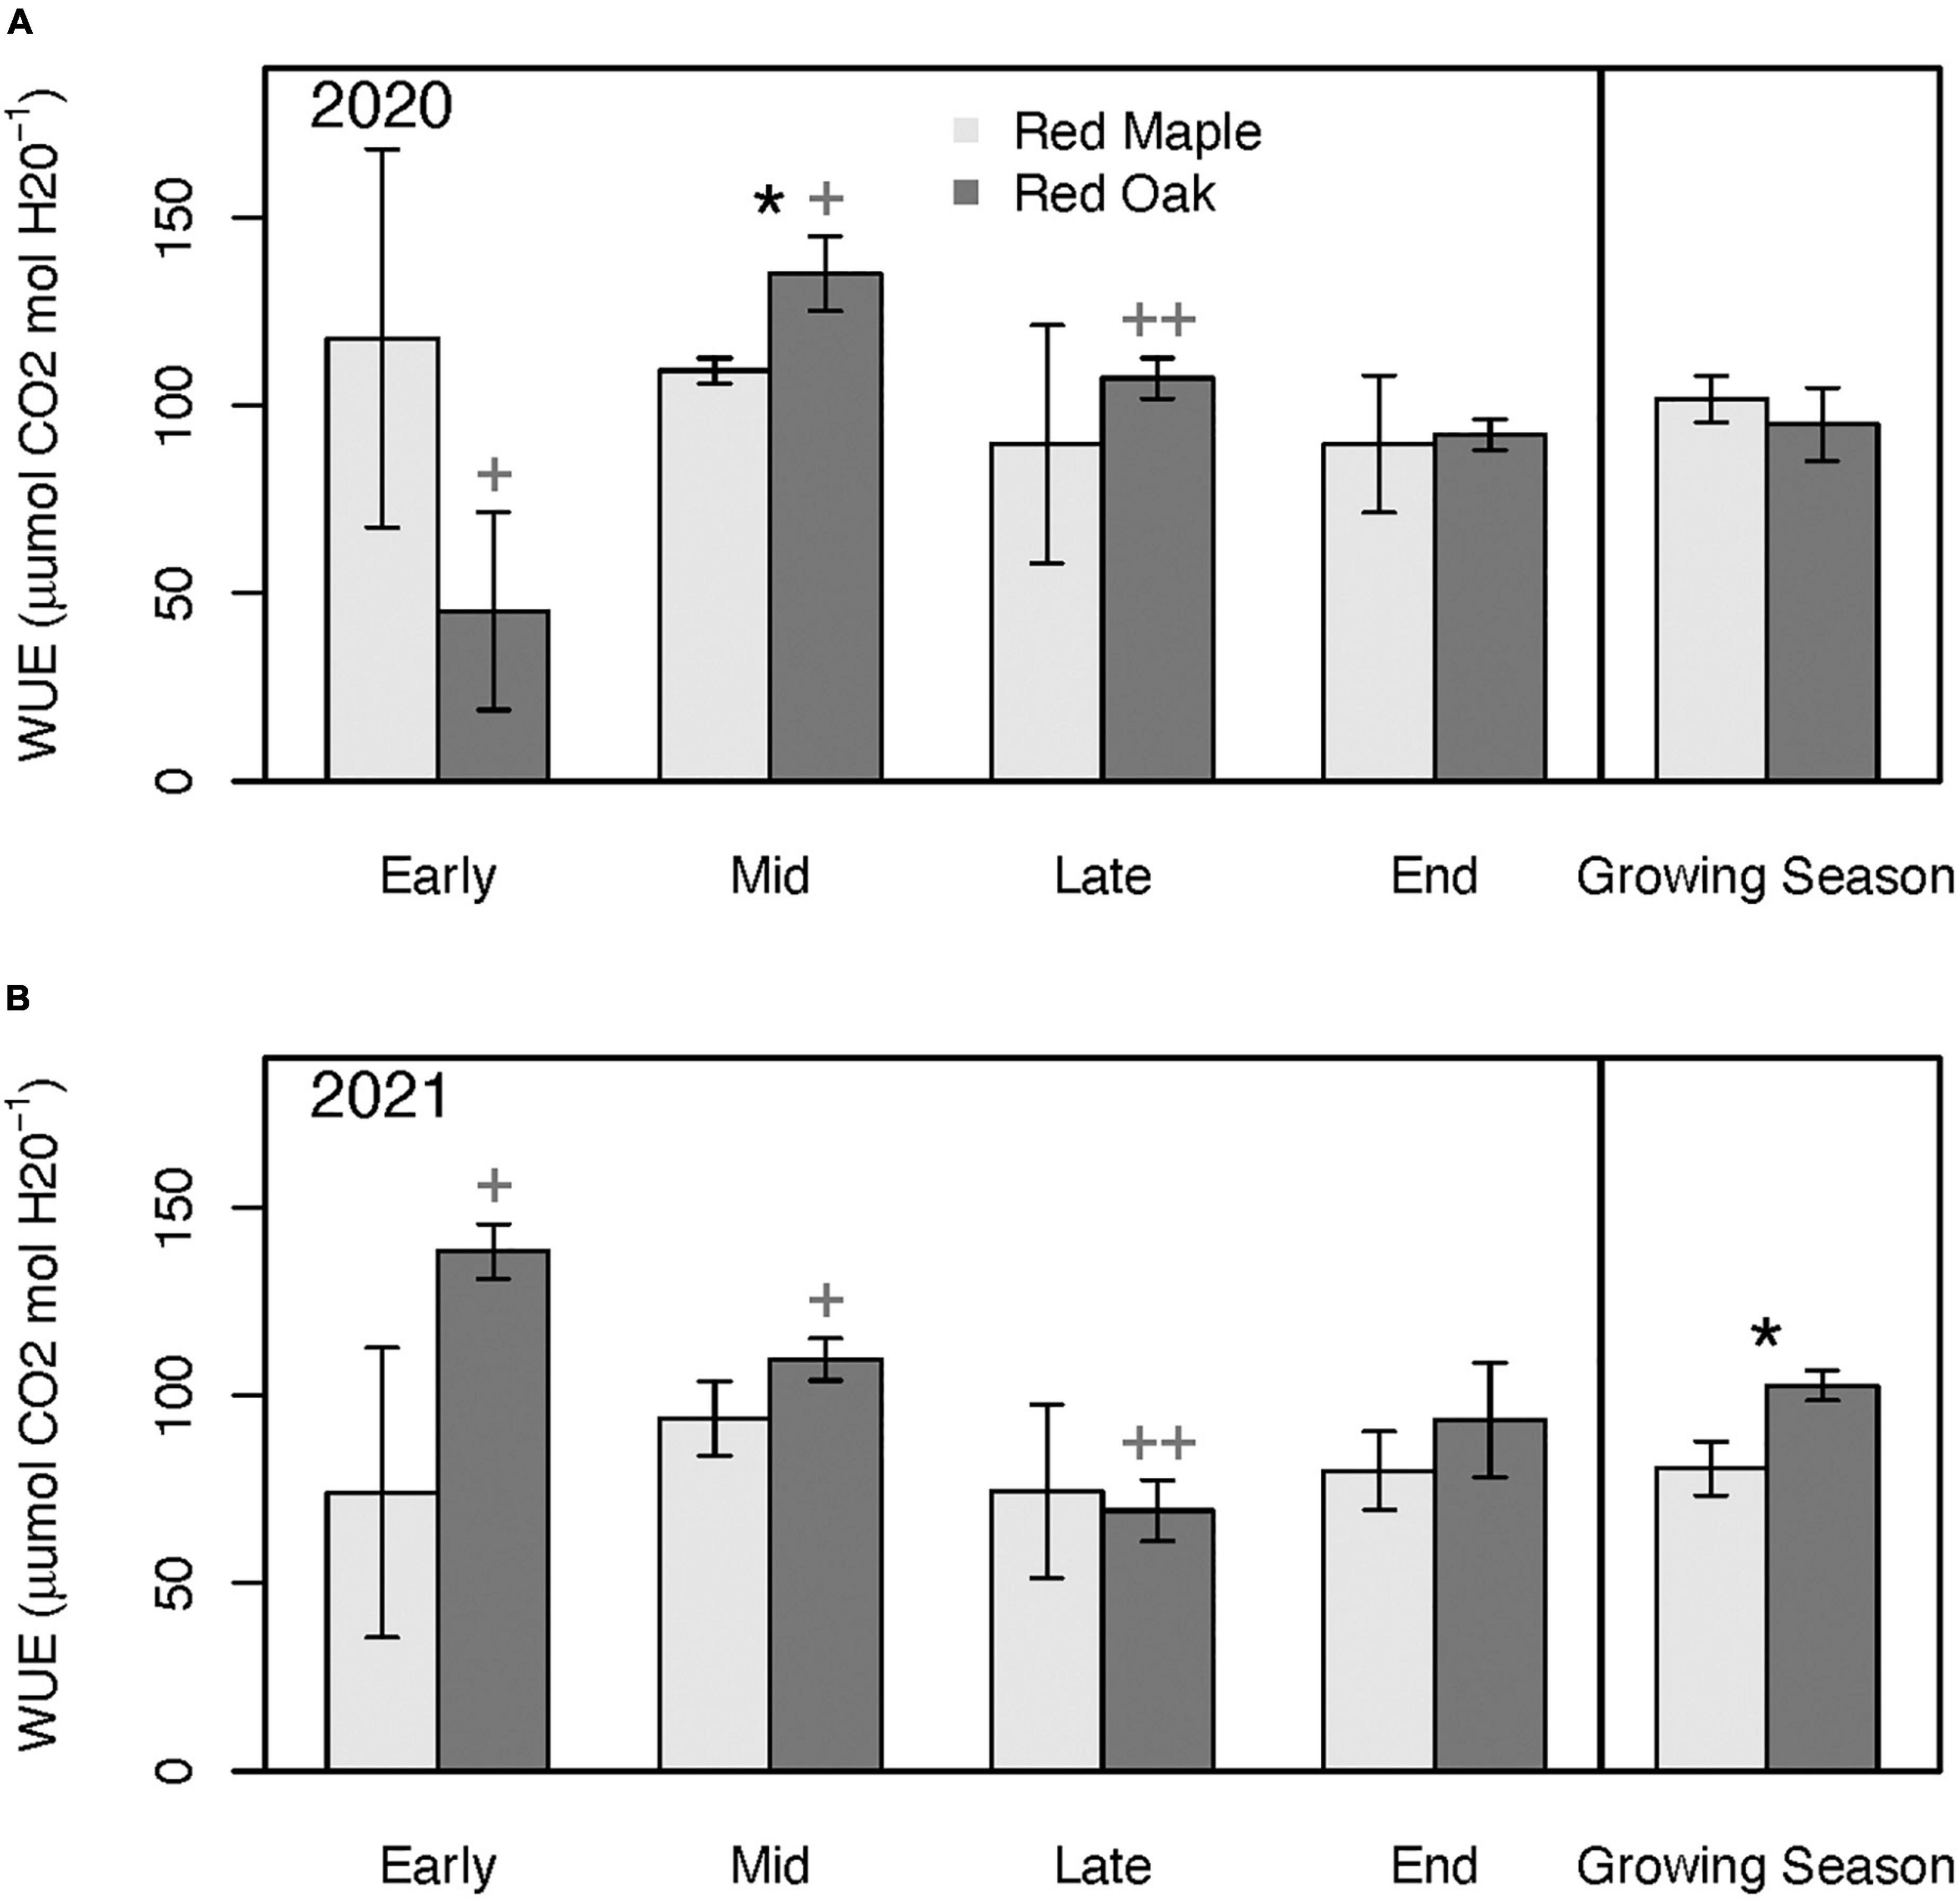
Figure 7. Leaf-level water-use efficiency (WUE) across the growing season and for the mean across the growing season during 2020 (i.e., year with oak-defoliating frost) (A) and 2021 (i.e., year without defoliating frost) (B) for red maple and red oak leaves. Asterisks denote differences between species within a year at *p < 0.1. Plus signs denote differences between years for oak trees at ++p < 0.05 and +p < 0.1. There were no significant differences between years for the maple trees. See Supplementary Tables 3A, B for summary statistics.
Total growing season BAI for both species was significantly higher in 2021 than 2020 for both red maple trees (11.78 ± 1.69 cm2 yr–1 vs. 6.08 ± 0.63 cm2 yr–1; p = 0.034) and red oak trees (15.39 ± 2.81 cm2 yr–1 vs. 9.56 ± 1.59 cm2 yr–1; p = 0.041) (Figure 8). Red oak BAI tended to be higher than red maple BAI in 2020 (p = 0.11), but not in 2021 (p = 0.33). We also partitioned BAI between the early (April–June, i.e., period surrounding the late freeze event that defoliated oak trees) and late (July–October) growing seasons. We found high levels of consistency in early growing season BAI within a species between years (Figure 8). Early growing season BAI tended to be higher for red oak trees than red maple trees, but these differences were only significant during 2021 (p = 0.007). During both 2020 and 2021, early growing season BAI also tended to make a larger contribution to total growing season BAI for red oak trees (∼24%) than for red maple trees (∼9.3%). In contrast to the early growing season, late growing season BAI did not vary between species in either year but was higher in 2021 than 2020 for both red maple (p = 0.077) and red oak (p = 0.089).
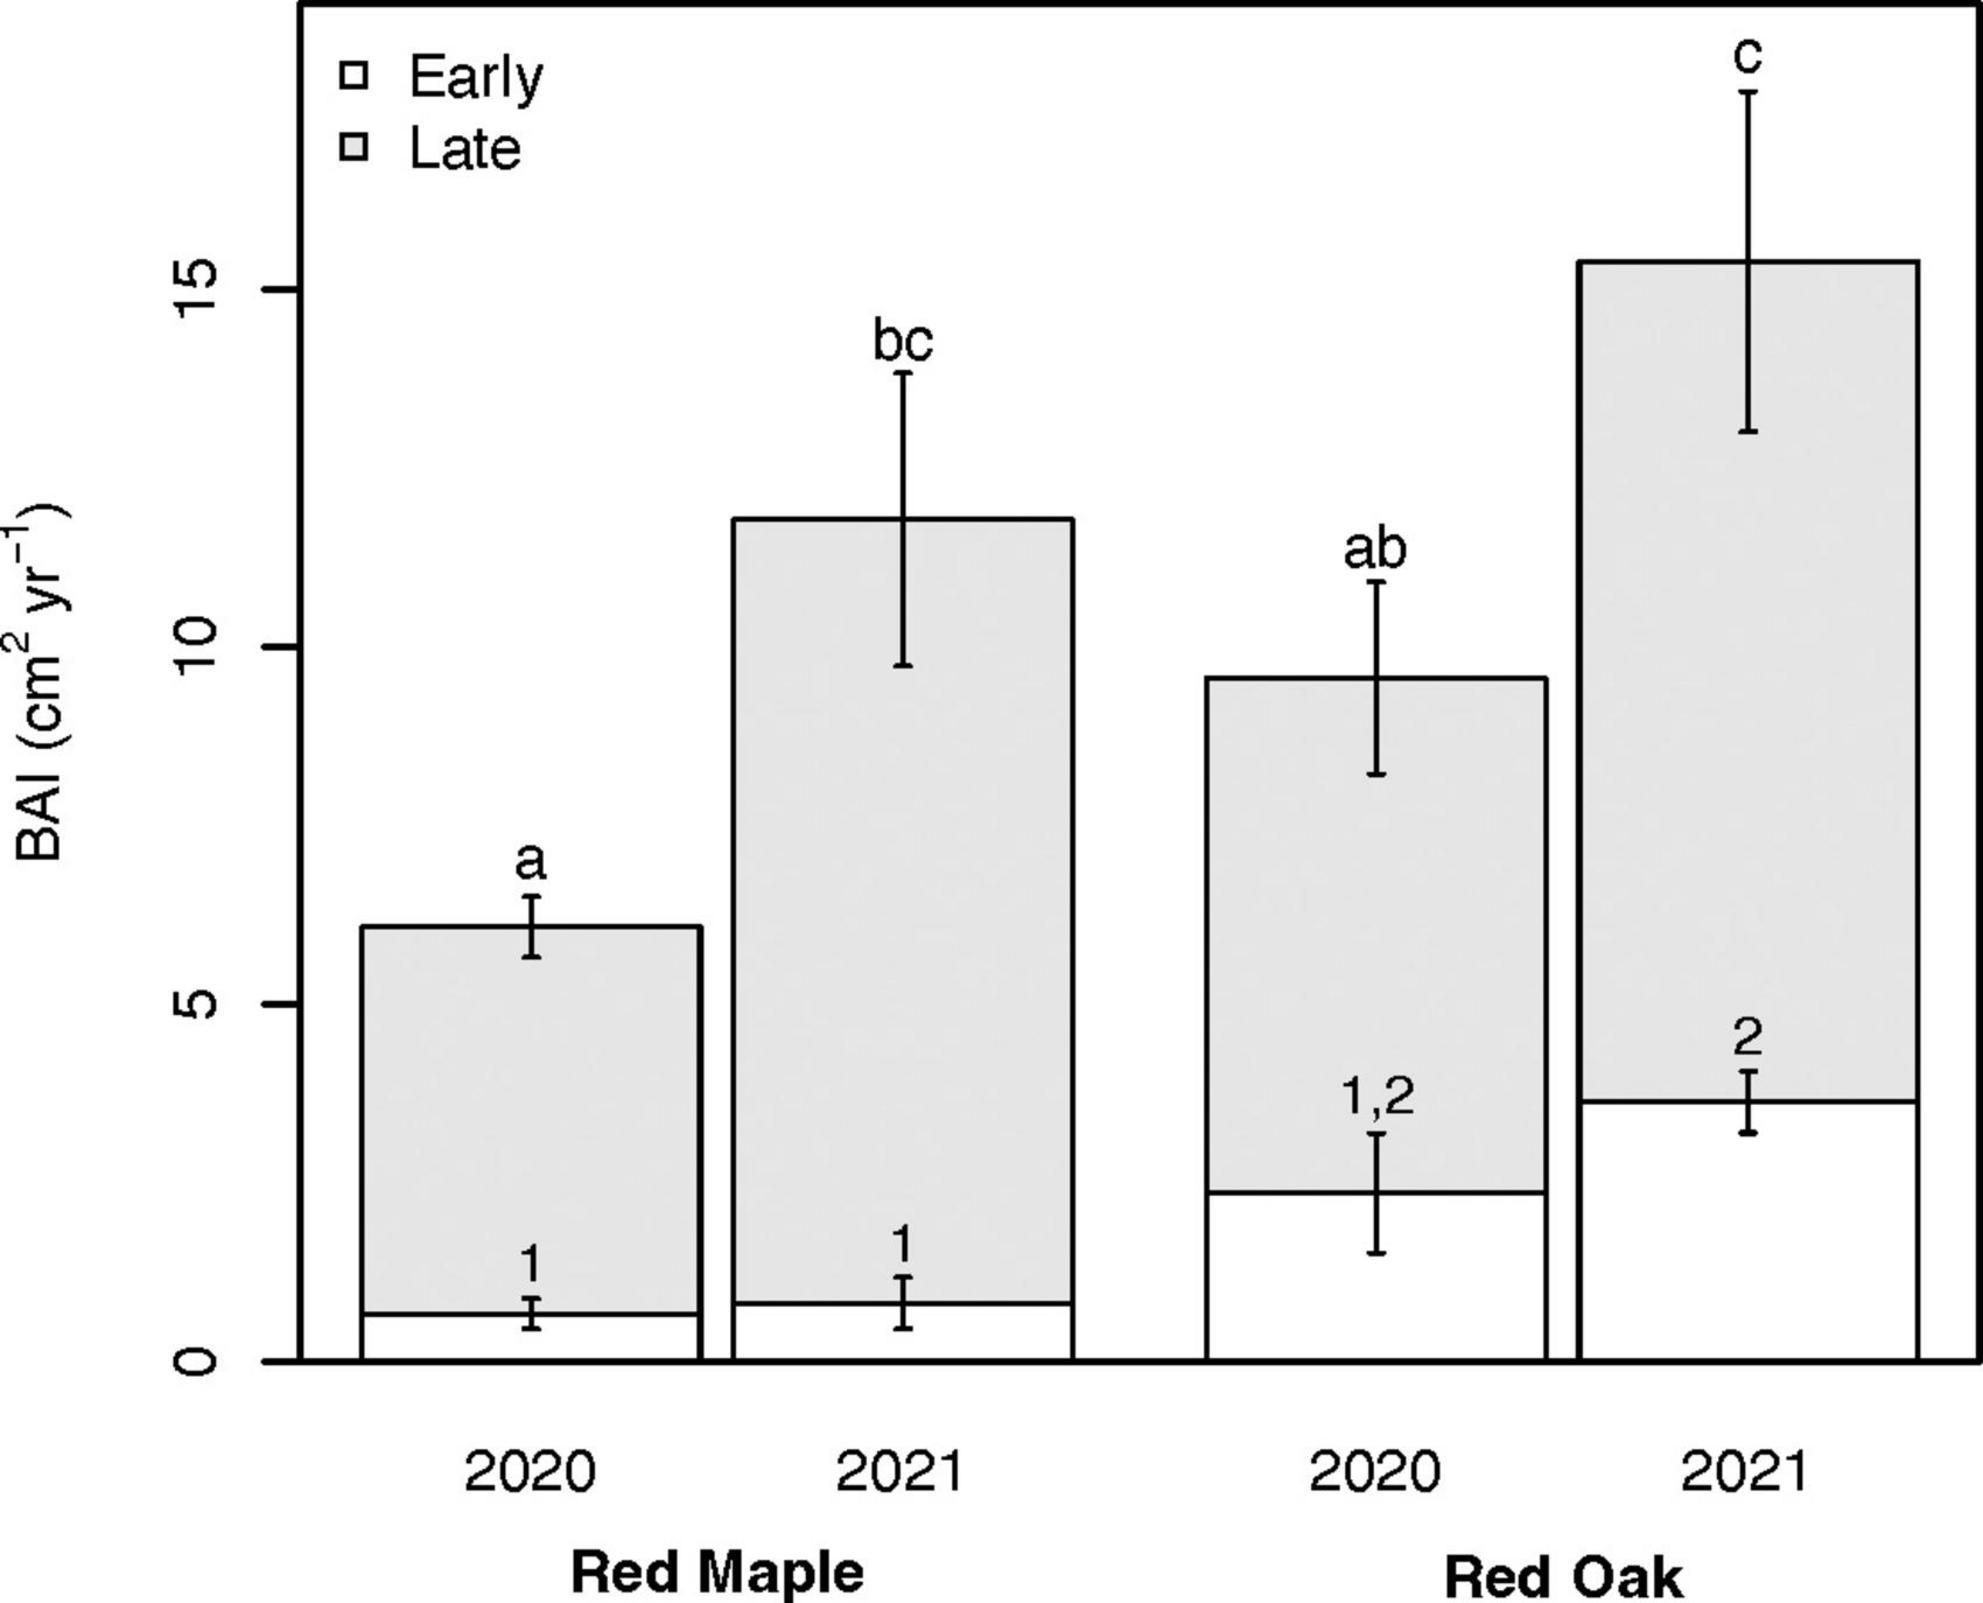
Figure 8. Basal area increment (BAI) for red maple (left pair) and red oak (right pair) trees during 2020 (i.e., year with oak-defoliating frost) and 2021 (i.e., year without oak-defoliating frost) for the entire growing season (April–October) and the contributions from the early growing season (April–June; white) and the late growing season (July–October; gray). Error bars indicate the standard error of the mean. Different numbers and letters denote differences (p < 0.10) in early growing season BAI and late growing season BAI, respectively. Different letters also denote significant differences in total growing season BAI. See Supplementary Tables 4A, B for summary statistics.
The stochastic nature of many extreme climate events, like defoliating spring frosts, poses serious challenges to studying their effects on ecosystem processes. This has contributed to extreme climate events such as defoliating frosts being a particularly understudied aspect of climate change ecology (Wang et al., 2021). Here, we took advantage of a spring freeze defoliation event to quantify its impacts on leaf-level physiology and radial growth, using a year without a defoliation event as a reference. We found that this spring freeze event in 2020 defoliated oak trees across more than 110,000 ha across the Hudson Highlands Ecoregion in southern New York State and Northern New Jersey. The forests of this region are dominated by oak trees (Dyer, 2006) and although defoliated oak trees put out a second flush of leaves, our analyses of phenocam data and qualitative assessments in the field suggest that full leaf expansion of oak trees was delayed by nearly 17 days compared to years without defoliation. By contrast, co-occurring red maple trees were not defoliated and effectively experienced a growing season that was more than 2 weeks longer than the oaks. We had expected this extreme climate event that defoliated red oak trees, but not red maple trees to have profoundly different impacts on these two species and shift competition dynamics in favor of red maple trees, which are often outcompeted by neighboring oaks. However, red oak trees exhibited a compensatory response in the physiology of second flush leaves that likely mitigated the adverse impacts of this defoliation event on leaf-level carbon uptake capacity and aboveground woody net primary production (NPP). Although red maple trees had a higher photosynthetic capacity than red oak trees early in the growing season of the defoliation year, the photosynthetic capacity and stomatal conductance of red oak trees rapidly increased over the course of the growing season and, in some cases, were higher than first flush leaves during the reference year. Cumulative BAI (i.e., aboveground woody NPP) of oak trees tended to be higher than that of the red maple trees during both the defoliation year and the reference year. These differences in BAI between species were not significant in either year, but BAI of both species was significantly higher in the reference year.
The light saturated rates of photosynthesis that we measured are slightly lower than values previously reported for red oak and red maple trees at Black Rock Forest (Turnbull et al., 2002), but similar to values reported for these species from other locations in the northeastern U.S. (Bassow and Bazzaz, 1998; Nagel et al., 2002) and the Great Lakes region (Jurik et al., 1988). Stomatal conductance and BAI has also been shown to be higher in red oaks than co-occurring red maples in temperate broadleaf forests of the eastern U.S. (Turnbull et al., 2002; Fekedulegn et al., 2003; Daley and Phillips, 2006). Defoliation delayed ramping up of photosynthetic capacity for red oak trees in 2020, but we found that by the end of the growing season, second flush oak leaves in 2020 tended to have higher photosynthetic capacity than first flush leaves in 2021. This high photosynthetic capacity late in the growing season of 2020 was sufficient to offset the delay in ramp up and the growing season mean for red oak trees was similar between years. Few other studies have compared rates of photosynthesis between first and second flush leaves following freeze-induced defoliation, but experimental summer defoliation (compared to spring defoliation in our study) of red oaks have also demonstrated an increased photosynthetic capacity of second flush leaves (Heichel and Turner, 1983).
The extent to which a compensatory response of photosynthetic capacity at the leaf level, like the one we observed here, translates to compensation at the canopy scale is largely unknown. Data collection limitations imposed by the COVID-19 pandemic during 2020 limited our capacity to quantify the extent to which this defoliation event may have altered leaf area index (LAI), which would have enabled scaling leaf-level measurements to the canopy. However, other Quercus sp. in North America have been observed to bounce back to nearly 100% canopy cover following severe defoliation from a spring frost (Augspurger, 2009), which corroborates anecdotal evidence from our observations. We found similar peak green chromatic coordinate values (from phenocam images) between 2020 and 2021, but this might not be a reliable indicator of LAI because, like NDVI, it saturates under the high LAI conditions of temperate broadleaf forests (Keenan et al., 2014). Collectively, our analyses indicate that this defoliation event delayed canopy development but compensatory upregulation of photosynthesis at the leaf-level prevented declines in growing season mean rates of oak tree photosynthesis per unit leaf area. Because mean leaf-level rates of oak tree photosynthesis were statistically the same in 2020 and 2021, even small changes in LAI from the defoliation event could have impacted total canopy carbon uptake. Delayed leaf expansion and reductions in maximum LAI following a defoliating spring frost have been estimated to reduce gross primary production in a northern hardwood forest by 7–14% (Hufkens et al., 2012). To the extent that defoliation in the oak dominated forests we studied impacted the timing of full leaf expansion and reduced LAI, we might expect the response of total canopy carbon uptake to be similar to what Hufkens et al. (2012) estimated for a northern hardwood forest. Unfortunately, the lack of reliable metrics for retroactively quantifying LAI for 2020 and 2021 from our study site precludes reconciling canopy-scale carbon uptake dynamics.
While our measurements of leaf-level physiology suggest the possibility of relatively small impacts of oak defoliation on growing season carbon uptake, we find that oak BAI in 2020 was nearly 40% lower than in 2021. This decline in BAI was similar to what was observed following an experiment simulating June insect defoliation of closely related black oak (Q. velutina) trees (Wiley et al., 2017), but two to three times larger than what was found following spring frost-induced defoliation of oaks in the Central Appalachian Mountains (Liu and Muller, 1993) and sugar maples (A. saccharum) in northern New England (Reinmann et al., 2019). Most diameter growth of red oak trees tends to occur from May through July (Finzi et al., 2020), which overlaps with the period of time canopy carbon uptake was most adversely impacted, in terms of carbon assimilation, by defoliation and could have caused a carbon limitation for wood production. It is possible that the defoliation event in this study reduced LAI and canopy carbon uptake, but given that there were no differences in peak green chromatic coordinate (see above) it seems unlikely that LAI could have been reduced to a large enough extent to be the main cause of the large differences in oak tree radial growth that we observed between 2020 and 2021. The growing season of 2020 was a drier than 2021, which could have adversely impacted tree growth (Martin-Benito and Pederson, 2015). However, differences in precipitation during these two years were the result of two anomalous tropical storms at the end of August 2021, but previous research has shown that 80–90% of total BAI of oak and maple trees in this region occurs by early August (Dow et al., 2022). As such, it is unlikely that precipitation was an important driver of differences in BAI. Alternatively, loss of cold hardiness, which commonly occurs during spring in trees from regions with cold winters (Neuner, 2014), prior to the freeze event could have played a role. Warm spring air temperatures above 16°C—which occurred in the week prior to the freeze event in the current study—have been shown to de-harden stem tissue in temperate tree species and make them more prone to frost damage (Sakai, 1968). Freeze events during the early growing season could potentially damage young stem tissue (Ambroise et al., 2020) and impair radial growth even in the absence of defoliation. The impacts of spring freeze events on tree growth in temperate regions have largely focused on trees that get defoliated and the possible effects of such events on radial growth in the absence of defoliation are poorly known.
The abundance of red maple trees has been increasing across the eastern U.S. and in the Hudson Highlands Ecoregion (Abrams, 1998; Schuster et al., 2008). However, red oak trees typically outcompete co-occurring red maple trees in terms of growth and carbon assimilation (Bassow and Bazzaz, 1998) and are accumulating biomass at considerably faster rates (Schuster et al., 2008). Variations in leaf-out phenology that result in spring frost events defoliating some tree species, but not others, have been suggested as a mechanism that could tilt interspecific competition dynamics within a forest (Hufkens et al., 2012). In this study, we expected red maple trees, which were not defoliated, to gain a competitive edge, in terms of photosynthetic capacity and growth, over defoliated co-occurring red oak trees during the 2020 growing season. We found that early in the growing season (late-May/early-June) the photosynthetic capacity of red maple trees was about two times higher than the red oak trees. In contrast, during the early growing season of 2021 (year without defoliation) there were no significant differences in the photosynthetic capacity between the two species. The second flush of oak leaves were still developing during the early growing season of 2020, which likely suppressed rates of net carbon assimilation. At the same time, red maple leaves were able to develop under higher light conditions—because of less competition with oak leaves (see Figure 3D)—which likely increased their leaf-level photosynthetic capacity. However, the compensatory response of red oak trees to defoliation appeared to offset any early growing season advantages the red maples had and mean photosynthetic capacity across the growing season was significantly higher for oaks than maples. Red oak BAI also tended to be higher than red maple BAI. WUE was comparable between the two species during both years of this study. However, red oak trees are anyisohydric and maintain transpiration and photosynthesis under higher levels of water stress than comparatively isohydric red maple trees (Roman et al., 2015). The more deeply-rooted nature of red oak trees (Lyford and Wilson, 1964; Lyford, 1980) also likely provides them with greater access to water. Stomatal conductance of red oak leaves was up to five times higher than red maple leaves during the second half of the growing season in our study, which helped to facilitate considerably higher rates of photosynthesis, despite the similar WUE.
There is growing recognition that extreme climate events have disproportionate impacts on ecosystem composition and processes relative to the more gradual changes in mean climate (Ciais et al., 2005; Reichstein et al., 2013; Orsenigo et al., 2014; Frank et al., 2015). Compared to other extreme climate events (e.g., drought), defoliating spring frosts are understudied (Wang et al., 2021). The results of this study highlight the complexities in understanding how forest ecosystems respond to defoliating spring frost events in temperate broadleaf forests. Late spring frosts, particularly when preceded by warmer than normal conditions, can cause widespread defoliation, but the timing of a frost event relative to leaf-out phenology has important implications for the level of susceptibility in different co-occurring tree species (Hufkens et al., 2012; Olano et al., 2021; Sangüesa-Barreda et al., 2021). In our study, the less than 1 week difference in timing of leaf bud break resulted in complete defoliation of oak trees while the foliage of red maple trees was largely unscathed. This event provided red maple trees with a ∼17-day “head start” on the growing season while the second flush of oak leaves developed. However, the second flush of red oak leaves exhibited a higher photosynthetic capacity than first flush in the reference year. This compensatory response helped to mitigate the adverse effects of defoliation and the competitive advantage conferred to red maple trees. The capacity—and presumably mechanism—of a tree to compensate for defoliation likely varies substantially across species, though few direct comparisons exist in the literature (but see Heichel and Turner, 1983). Elucidating species-specific susceptibility and response to both the timing and source (e.g., frost vs. insect) of defoliation events is a key frontier in our understanding of how forests respond to environmental change. Taken together, our findings highlight the importance of understanding and including a tree species’ ability to compensate for defoliation in predictions of how competition dynamics and ecosystem processes such as carbon balance might respond to extreme climate events.
The data used for this manuscript have published with the Environmental Data Initiative with Reinmann (2023).
AR conceived the experimental design, led data collection, data analysis, and writing of the manuscript. JB led GIS and remote sensing analyses and contributed to the writing of the manuscript. PK and CK contributed to the field measurements, data analysis, and writing of the manuscript. All authors contributed to the article and approved the submitted version.
This work was supported by funding from The City University of New York and the Black Rock Forest David Redden Conservation Science Fund.
We would like to thank William Schuster, Isabel Ashton, Matthew Munson, Aaron Culotta, Katie Terlizzi, Matt Brady, and the staff of Black Rock Forest for their assistance with site location, canopy leaf sampling, and climate data acquisition.
The authors declare that the research was conducted in the absence of any commercial or financial relationships that could be construed as a potential conflict of interest.
All claims expressed in this article are solely those of the authors and do not necessarily represent those of their affiliated organizations, or those of the publisher, the editors and the reviewers. Any product that may be evaluated in this article, or claim that may be made by its manufacturer, is not guaranteed or endorsed by the publisher.
The Supplementary Material for this article can be found online at: https://www.frontiersin.org/articles/10.3389/ffgc.2023.988233/full#supplementary-material
Ambroise, V., Legay, S., Guerriero, G., Hausman, J., Cuypers, A., and Sergeant, K. (2020). The roots of plant frost hardiness and tolerance. Plant Cell Physiol. 61, 3–20. doi: 10.1093/pcp/pcz196
Augspurger, C. (2009). Spring 2007 warmth and frost: Phenology, damage and refoliation in a temperate deciduous forest. Funct. Ecol. 23, 1031–1039.
Augspurger, C. K. (2013). Reconstructing patterns of temperature, phenology, and frost damage over 124 years: Spring damage risk is increasing. Ecology 94, 41–50.
Bassow, S., and Bazzaz, F. (1998). How environmental conditions affect canopy leaf-level photosynthesis in four deciduous tree species. Ecology 79, 2660–2675.
Bigler, C., and Bugmann, H. (2018). Climate-induced shifts in leaf unfolding and frost risk of European trees and shrubs. Sci. Rep. 8:9865. doi: 10.1038/s41598-018-27893-1
Ciais, P., Reichstein, M., Viovy, N., Granier, A., Ogée, J., Allard, V., et al. (2005). Europe-wide reduction in primary productivity caused by the heat and drought in 2003. Nature 437, 529–533. doi: 10.1038/nature03972
Daley, M., and Phillips, N. (2006). Interspecific variation in nighttime transpiration and stomatal conductance in a mixed New England deciduous forest. Tree Physiol. 26, 411–419. doi: 10.1093/treephys/26.4.411
Dewitz, J., and Us Geological Survey (USGS) (2021). National land cover database (NLCD) 2019 products (ver. 2.0, June 2021): U.S. geological survey data release. Reston, VA: US Geological Survey.
Dow, C., Kim, A., D’Orangeville, L., Gonzalez-Akre, E., Helcoski, R., Herrmann, V., et al. (2022). Warm springs alter timing but not total growth of temperate deciduous trees. Nature 608, 552–557. doi: 10.1038/s41586-022-05092-3
Dyer, J. M. (2006). Revisiting the deciduous forests of eastern North America. BioScience 56, 341–352.
Fekedulegn, D., Hicks, R., and Colbert, J. (2003). Influence of topographic aspect, precipitation and drought on radial growth of four major tree species in an Appalachian Watershed. For. Ecol. Manag. 177, 409–425.
Finzi, A. C., Giasson, M. A., Plotkin, A. A. B., Aber, J. D., Boose, E., Davidson, E. A., et al. (2020). Carbon budget of the harvard forest long-term ecological research site: Pattern, process, and response to global change. Ecol. Monogr. 90:e01423.
Frank, D., Reichstein, M., Bahn, M., Thonicke, K., Frank, D., Mahecha, M., et al. (2015). Effects of climate extremes on the terrestrial carbon cycle: Concepts, processes and potential future impacts. Glob. Chang. Biol. 21, 2861–2880. doi: 10.1111/gcb.12916
Heichel, G., and Turner, N. (1983). CO2 assimilation of primary and regrowth foliage of red maple (Acer rubrum L.) and red oak (Quercus rubra L.): Response to defoliation. Oecologia 57, 14–19. doi: 10.1007/BF00379555
Hoogesteger, J., and Karlsson, P. (1992). Effects of defoliation on radial stem growth and photosynthesis in the mountain birch (Betula pubescens ssp. Tortuosa). Funct. Ecol. 6:317.
Hufkens, K., Friedl, M. A., Keenan, T. F., Sonnentag, O., Bailey, A., O’Keefe, J., et al. (2012). Ecological impacts of a widespread frost event following early spring leaf-out. Glob. Change Biol. 18, 2365–2377.
IPCC (2022). Climate change 2022: Impacts, adaptation, and vulnerability, contribution of working group II to the sixth assessment report of the intergovernmental panel on climate change, eds H.-O. Pörtner, D. C. Roberts, M. Tignor, E. S. Poloczanska, K. Mintenbeck, A. Alegría, et al. (Cambridge and New York, NY: Cambridge University Press), 3056. doi: 10.1017/9781009325844
Jurik, T., Weber, J., and Gates, D. (1988). Effects of temperature and light on photosynthesis of dominant species of a Northern hardwood forest. Bot. Gazette 149, 203–208.
Keenan, T., Darby, B., Felts, E., Sonnentag, O., Friedl, M., Hufkens, K., et al. (2014). Tracking forest phenology and seasonal physiology using digital repeat photography: A critical assessment. Ecol. Appl. 24, 1478–1489. doi: 10.1890/13-0652.1
Kramer, K., Ducousso, A., Gömöry, D., Hansen, J. K., Ioniţă, L., Liesebach, M., et al. (2017). Chilling and forcing requirements for foliage bud burst of European beech (Fagus sylvatica L.) differ between provenances and are phenotypically plastic. Agric. For. Meteorol. 234–235, 172–181.
Liu, Y., and Muller, R. (1993). Effect of drought and frost on radial growth of overstory and undesrstory stems in a deciduous forest. Am. Midl. Nat. 129:19.
Lyford, W. (1980). Development of the root system of northern red oak. Petersham, MA: Harvard Forest.
Lyford, W., and Wilson, B. (1964). Development of the root system of Acer rubrum L. Petersham, MA: Harvard Forest.
Martin-Benito, D., and Pederson, N. (2015). Convergence in drought stress, but a divergence of climatic drivers across a latitudinal gradient in a temperate broadleaf forest. J. Biogeogr. 42, 925–937.
McEwan, R., Dyer, J., and Pederson, N. (2011). Multiple interacting ecosystem drivers: Toward an encompassing hypothesis of oak forest dynamics across eastern North America. Ecography 34, 244–256.
Munson, M., Ashton, I., Griffin, K., et al. (2023). Open lowland environmental monitoring station. Cornwall NY: Black Rock Forest.
Mura, C., Buttò, V., Silvestro, R., Deslauriers, A., Charrier, G., Raymond, P., et al. (2022). The early bud gets the cold: Diverging spring phenology drives exposure to late frost in a Picea mariana [(Mill.) BSP] common garden. Physiol. Plant 174:e13798. doi: 10.1111/ppl.13798
Nagel, J., Griffin, K., Schuster, W., Tissue, D., Turnbull, M., Brown, K., et al. (2002). Energy investment in leaves of red maple and co-occurring oaks within a forested watershed. Tree Physiol. 22, 859–867. doi: 10.1093/treephys/22.12.859
Neuner, G. (2014). Frost resistance in alpine woody plants. Front. Plant Sci. 5:654. doi: 10.3389/fpls.2014.00654
Olano, J., García-Cervigón, A., Sangüesa-Barreda, G., Rozas, V., Muñoz-Garachana, D., García-Hidalgo, M., et al. (2021). Satellite data and machine learning reveal the incidence of late frost defoliations on Iberian beech forests. Ecol. Appl. 31:e02288. doi: 10.1002/eap.2288
Orsenigo, S., Mondoni, A., Rossi, G., and Abeli, T. (2014). Some like it hot and some like it cold, but not too much: Plant responses to climate extremes. Plant Ecol. 215, 677–688.
Pinheiro, J., Bates, D., DebRoy, S., and Sarkar, D. (2019). Package ‘nlme’ linear and nonlinear mixed effects models. version 3.
Polgar, C., and Primack, R. (2011). Leaf-out phenology of temperate woody plants: From trees to ecosystems. New Phytol. 191, 926–941. doi: 10.1111/j.1469-8137.2011.03803.x
Reichstein, M., Bahn, M., Ciais, P., Frank, D., Mahecha, M., Seneviratne, S., et al. (2013). Climate extremes and the carbon cycle. Nature 500, 287–295. doi: 10.1038/nature12350
Reinmann, A. (2023). Black rock forest spring freeze defoliation radial growth and leaf-level gas exchange ver. 3. Environmental data initiative. Available online at: https://doi.org/10.6073/pasta/cc676a2b5d725755960aacac8c0d142a (accessed February 8, 2023).
Reinmann, A., Susser, J., Demaria, E., and Templer, P. (2019). Declines in northern forest tree growth following snowpack decline and soil freezing. Glob. Change Biol. 25, 420–430. doi: 10.1111/gcb.14420
Reinmann, A., and Templer, P. (2016). Reduced winter snowpack and greater soil frost reduce live root biomass and stimulate radial growth and stem respiration of red maple (Acer rubrum) trees in a mixed-hardwood forest. Ecosystems 19, 129–141.
Richardson, A., Hollinger, D., Dail, D., Lee, J., Munger, J., and O’keefe, J. (2009). Influence of spring phenology on seasonal and annual carbon balance in two contrasting New England forests. Tree Physiol. 29, 321–331. doi: 10.1093/treephys/tpn040
Richardson, A. D., Bailey, A. S., Denny, E. G., Martin, C. W., and O’Keefe, J. (2006). Phenology of a northern hardwood forest canopy. Global Change Biol. 12, 1174–1188.
Rigby, J. R., and Porporato, A. (2008). Spring frost risk in a changing climate. Geophys. Res. Lett. 35:L12703.
Roman, D., Novick, K., Brzostek, E., Dragoni, D., Rahman, F., and Phillips, R. (2015). The role of isohydric and anisohydric species in determining ecosystem-scale response to severe drought. Oecologia 179, 641–654. doi: 10.1007/s00442-015-3380-9
Ross, P. (1958). Microclimatic and vegetational studies in a cold-wet deciduous forest. Cornwall, NY: Cornwall Press.
Rubio-Cuadrado, Á., Camarero, J., Rodríguez-Calcerrada, J., Perea, R., Gómez, C., Montes, F., et al. (2021). Impact of successive spring frosts on leaf phenology and radial growth in three deciduous tree species with contrasting climate requirements in central Spain. Tree Physiol. 41, 2279–2292. doi: 10.1093/treephys/tpab076
Sangüesa-Barreda, G., Di Filippo, A., Piovesan, G., Rozas, V., Di Fiore, L., García-Hidalgo, M., et al. (2021). Warmer springs have increased the frequency and extension of late-frost defoliations in southern European beech forests. Sci. Total Environ. 775:145860. doi: 10.1016/j.scitotenv.2021.145860
Schuster, W., Griffin, K., Roth, H., Turnbull, M., Whitehead, D., and Tissue, D. (2008). Changes in composition, structure and aboveground biomass over seventy-six years (1930-2006) in the black rock forest, Hudson Highlands, southeastern New York State. Tree Physiol. 28, 537–549. doi: 10.1093/treephys/28.4.537
Seneviratne, S., Zhang, X., Adnan, M., Badi, C., Dereczynski, A., Di Luca, S., et al. (2021). “Weather and Climate Extreme Events in a Changing Climate,” in Climate change 2021: The physical science basis. contribution of working group i to the sixth assessment report of the intergovernmental panel on climate change, eds V. Masson-Delmotte, P. Zhai, A. Pirani, S. L. Connors, C. Péan, S. Berger, et al. (Cambridge, MA: Cambridge University Press).
Taheri, S., Naimi, B., Rahbek, C., and Araújo, M. (2021). Improvements in reports of species redistribution under climate change are required. Sci. Adv. 7:eabe1110. doi: 10.1126/sciadv.abe1110
Turnbull, M., Whitehead, D., Tissue, D., Schuster, W., Brown, K., Engel, V., et al. (2002). Photosynthetic characteristics in canopies of Quercus rubra, Quercus prinus and Acer rubrum differ in response to soil water availability. Oecologia 130, 515–524. doi: 10.1007/s00442-001-0842-z
Turnbull, M., Whitehead, D., Tissue, D., Schuster, W., Brown, K., and Griffin, K. (2001). Responses of leaf respiration to temperature and leaf characteristics in three deciduous tree species vary with site water availability. Tree Physiol. 21, 571–578. doi: 10.1093/treephys/21.9.571
Us Geological Survey (USGS) (1999). USGS 30 Meter resolution, one-sixtieth degree national elevation dataset for conus, alaska, hawaii, puerto rico, and the U. S. Virgin Islands. Sioux Falls, SD: USGS, EROS Data Center.
Vitasse, Y., Bottero, A., Cailleret, M., Bigler, C., Fonti, P., Gessler, A., et al. (2019). Contrasting resistance and resilience to extreme drought and late spring frost in five major European tree species. Glob. Change Biol. 25, 3781–3792. doi: 10.1111/gcb.14803
Vitasse, Y., Lenz, A., and Körner, C. (2014). The interaction between freezing tolerance and phenology in temperate deciduous trees. Front. Plant Sci. 5:541. doi: 10.3389/fpls.2014.00541
Vitasse, Y., Schneider, L., Rixen, C., Christen, D., and Rebetez, M. (2018). Increase in the risk of exposure of forest and fruit trees to spring frosts at higher elevations in Switzerland over the last four decades. Agric. For. Meteorol. 248, 60–69.
Wang, Z., Zhou, Z., and Wang, C. (2021). Defoliation-induced tree growth declines are jointly limited by carbon source and sink activities. Sci. Total Environ. 762:143077. doi: 10.1016/j.scitotenv.2020.143077
Wiley, E., Casper, B., and Helliker, B. (2017). Recovery following defoliation involves shifts in allocation that favour storage and reproduction over radial growth in black oak. J. Ecol. 105, 412–424.
Xie, Y., Civco, D., and Silander, J. (2018). Species-specific spring and autumn leaf phenology captured by time-lapse digital cameras. Ecosphere 9:e02089.
Xu, B., Arain, M., Black, T., Law, B., Pastorello, G., and Chu, H. (2020). Seasonal variability of forest sensitivity to heat and drought stresses: A synthesis based on carbon fluxes from North American forest ecosystems. Glob. Change Biol. 26, 901–918. doi: 10.1111/gcb.14843
Keywords: extreme events, climate change, photosynthesis, tree growth, Acer, maple, oak, Quercus
Citation: Reinmann AB, Bowers JT, Kaur P and Kohler C (2023) Compensatory responses of leaf physiology reduce effects of spring frost defoliation on temperate forest tree carbon uptake. Front. For. Glob. Change 6:988233. doi: 10.3389/ffgc.2023.988233
Received: 07 July 2022; Accepted: 27 January 2023;
Published: 16 February 2023.
Edited by:
Gabriel Sangüesa-Barreda, Valladolid University, SpainReviewed by:
José Javier Peguero-Pina, Agrifood Research and Technology Centre of Aragon (CITA), SpainCopyright © 2023 Reinmann, Bowers, Kaur and Kohler. This is an open-access article distributed under the terms of the Creative Commons Attribution License (CC BY). The use, distribution or reproduction in other forums is permitted, provided the original author(s) and the copyright owner(s) are credited and that the original publication in this journal is cited, in accordance with accepted academic practice. No use, distribution or reproduction is permitted which does not comply with these terms.
*Correspondence: Andrew B. Reinmann,  YXJlaW5tYW5uQGdjLmN1bnkuZWR1
Disclaimer: All claims expressed in this article are solely those of the authors and do not necessarily represent those of their affiliated organizations, or those of the publisher, the editors and the reviewers. Any product that may be evaluated in this article or claim that may be made by its manufacturer is not guaranteed or endorsed by the publisher.
Research integrity at Frontiers
Learn more about the work of our research integrity team to safeguard the quality of each article we publish.