 Minghui Xu
 Zhenke Zhang
 Yue Wang1
95% of researchers rate our articles as excellent or good
Learn more about the work of our research integrity team to safeguard the quality of each article we publish.
Find out more
ORIGINAL RESEARCH article
Front. For. Glob. Change , 05 January 2024
Sec. Forest Disturbance
Volume 6 - 2023 | https://doi.org/10.3389/ffgc.2023.1332631
This article is part of the Research Topic Assessment of Anthropogenic Pollution as a Cause of Forest Disturbance View all 5 articles
As an important part of the terrestrial ecosystem, vegetation dynamics are subject to impacts from both climate change and human activities. Clarifying the driving mechanisms of vegetation variation is of great significance for regional ecological protection and achieving sustainable development goals. Here, net primary productivity (NPP) was used to investigate the spatiotemporal variability of vegetation dynamics from 2000 to 2020 in East Africa, and its correlations with climate factors. Furthermore, we utilized partial derivatives analysis and set up different scenarios to distinguish the relative contributions of climatic and human factors to NPP changes. The results revealed that NPP exhibited a significant increase with 4.16 g C/m2/a from 2000 to 2020 in East Africa, and an upward trend was detected across 71.06% of the study area. The average contributions of precipitation, temperature, and solar radiation to the NPP inter-annual variations in East Africa were 2.02, −1.09, and 0.31 gC⋅m–2⋅a–1, respectively. Precipitation made the greatest positive contribution among all of the climatic factors, while temperature made strong negative contributions. The contributions of climate change and human activities to NPP changes were 1.24 and 2.34 gC⋅m–2⋅a–1, respectively. Moreover, the contribution rate of human activities to NPP increase was larger than that of climate change, while the role of climate change in NPP decrease was larger than that of human activities. The findings of the study can provide new evidence for a deeper understanding of ecosystem stability and carbon cycling in East Africa, as well as a reference for decision-making and scientific support for ecological environmental protection.
As an essential part of terrestrial ecosystems, vegetation performs an irreplaceable role in transferring and transforming carbon, regulating the global carbon balance, and maintaining global climate stability (Qu et al., 2020; Wu et al., 2020). Due to ongoing global warming, coupled with the intensification of human activities, vegetation ecosystems are facing severe challenges. Investigating vegetation dynamics and quantifying the relative impacts of climate and human factors on vegetation dynamics is crucial for formulating effective adaptation and mitigation strategies (Ge et al., 2021; Bejagam and Sharma, 2022; Yang et al., 2022).
Net primary productivity (NPP) is the capacity of vegetation to fix net carbon through photosynthesis under natural conditions and serves as a crucial indicator for monitoring vegetation growth and evaluating ecosystem health (Yan et al., 2019; Ma et al., 2023). The effects of climate change on the dynamics of vegetation have received extensive attention (Qu et al., 2020). Numerous scholars have explored the relationship between NPP and major climate factors at global or regional scales (Liu et al., 2021; Gu et al., 2022; Ma et al., 2023). Within the threshold range, a temperature rise can enhance plant photosynthesis, thereby promoting vegetation NPP accumulation. When the temperature is below the threshold, the higher the temperature, the faster the rate of vegetative photosynthesis; however, excessive warming can increase evapotranspiration rate and physiological drought, reduce vegetation photosynthesis rate, and thus inhibit vegetation NPP (Teng et al., 2020; Alvarado et al., 2021). Climatic factors are characterized by large spatial heterogeneity, and thus the climate-dominant factor for vegetation NPP varies by region and ecosystem. For example, in arid and semi-arid regions, vegetation development is more constrained by water, so precipitation changes may have a greater influence on vegetation NPP changes. In humid and cold regions, vegetation growth might be restricted by the temperature (Cao et al., 2023; Zhu et al., 2023).
Human activities have a notable effect on the dynamics of vegetation, with this effect increasingly expanding. Anthropogenic impacts on vegetation are usually small-scale and short-lived compared to climatic factors (Zhu et al., 2023). With rapid economic development and increasing population, anthropogenic impacts on vegetation ecosystems are becoming more intense. Anthropogenic impacts on NPP are both promoting and inhibiting. Human activities can contribute to vegetation improvement through ecological construction activities as well as technological advances in agriculture, while activities such as overgrazing, urban sprawl, irrational farming, deforestation, and economic construction can inhibit vegetation productivity (Liu et al., 2019a; Pan et al., 2021; Wei et al., 2022). Thereby, distinguishing the relative roles of climate change and human activities on vegetation changes is crucial for further understanding the dynamic mechanisms of vegetation productivity.
In recent years, numerous approaches have been proposed to separate the effects of climate and human activities on vegetation dynamics. Among them, the most commonly used methods are the following categories: mathematical–statistical method (e.g., regression analysis and principal component analysis), the biophysical model-based method, and the residual trend-based method (Caputo et al., 2016; Jiang et al., 2020; Yin et al., 2020). While the mathematical–statistical method is the simplest, it will ignore the ecological processes and is unsuitable for distinguishing the intricate interplay between vegetation and impact factors (Liu et al., 2020). The biophysical model-based method uses process-based simulation models to calculate the potential and actual NPP to distinguish the relative effects of climate change and human activities. However, this method requires multiple vegetation parameters, which may increase model uncertainty (Ge et al., 2021; Liu et al., 2022). The residual trend-based method typically predicts vegetation NPP by constructing correlations between climate factors and vegetation, and treating the difference between predicted and observed values of NPP as the effect of human activities. Nevertheless, the NPP prediction value has great uncertainty, and it is not possible to estimate the impact of individual climate factors on NPP dynamics using this approach (Pan et al., 2017; Yan et al., 2019; Qu et al., 2020). Therefore, to overcome the shortcomings of the above methods, we utilize the partial derivative method to assess the respective impacts of climatic and human factors on NPP. Currently, the partial derivative method is widely used to analyze vegetation dynamics in response to influencing factors (Qu et al., 2020; Ge et al., 2021; Zhu et al., 2023).
East Africa is one of the most densely populated regions in Africa and faces enormous population pressure. The region is characterized by complex landforms, diverse climates, susceptibility to climate change and lack of resilience to maintain stable ecosystems. Over the past 50 years, East Africa has experienced an average temperature increase of 1.5–2°C, as well as significant changes in precipitation, and its rate of warming is much higher than that of the African continent and the global average over the same period (Measho et al., 2022). Climate change has led to a high incidence of extreme events and a further deterioration of ecological problems in East Africa (Haile et al., 2020). Regional differences in climate change, coupled with human disturbances such as urban expansion, agricultural land expansion, overgrazing, deforestation, and afforestation have complicated vegetation dynamics in East Africa (Bullock et al., 2021). The contributions of the various drivers of the spatiotemporal evolution in vegetation productivity in East Africa, however, remained unclear.
To address the above research deficiencies, the response of vegetation NPP variation to climatic and anthropogenic factors in East Africa need to be analyzed. In this article, a quantitative model is built of influencing factors of vegetation NPP change, which can be utilized to quantify where and the degree to which climate change and human activities influence vegetation NPP variation in this region. Therefore, the objectives of this article are as follows: (1) to evaluate the spatiotemporal dynamics of NPP in East Africa from 2000 to 2020; (2) to explore the relationships between NPP and climatic factors (precipitation, temperature, and solar radiation); and (3) to quantify the relative contributions of climatic and anthropogenic drivers to NPP using the partial derivative method and scenarios designing. The study outcomes can enhance the comprehension of the feedback of vegetation dynamics to various drivers in East Africa. Further, this study can provide reliable information for policy making toward sustainable development of vegetation ecosystem in East Africa.
The study area includes five countries in total: Tanzania, Kenya, Uganda, Rwanda, and Burundi, and is commonly referred to as East Africa (5°2′N-11°45′S, 28°51′-41°54′E). East Africa covers a total area of 1.82 million km2. East Africa has a fluctuating terrain with an altitude difference of nearly 6,000 m and is characterized by diverse landscape characteristics such as Rift Valley, Lake Victoria, Mount Kilimanjaro, and Mount Kenya (Ayugi et al., 2021b). The average annual temperature and annual precipitation have a range of 8–31°C and 200–2000 mm, respectively. Influenced by the seasonal cycle of the Inter-Tropical Convergence Zone (ITCZ), East Africa experiences two main rainy seasons: the long rainy season, March–May (MAM), and the short rainy season, October–December (OND) (Kimani et al., 2017; Ayugi et al., 2021a). The region boasts one of the highest population densities in Africa and is largely dependent on an agrarian economy, with 80% of the population relying on rainfed agriculture for subsistence, making it less resilient to climate change (Kalisa et al., 2019). The main vegetation types in this region are grassland, forest, and cropland (Figure 1).
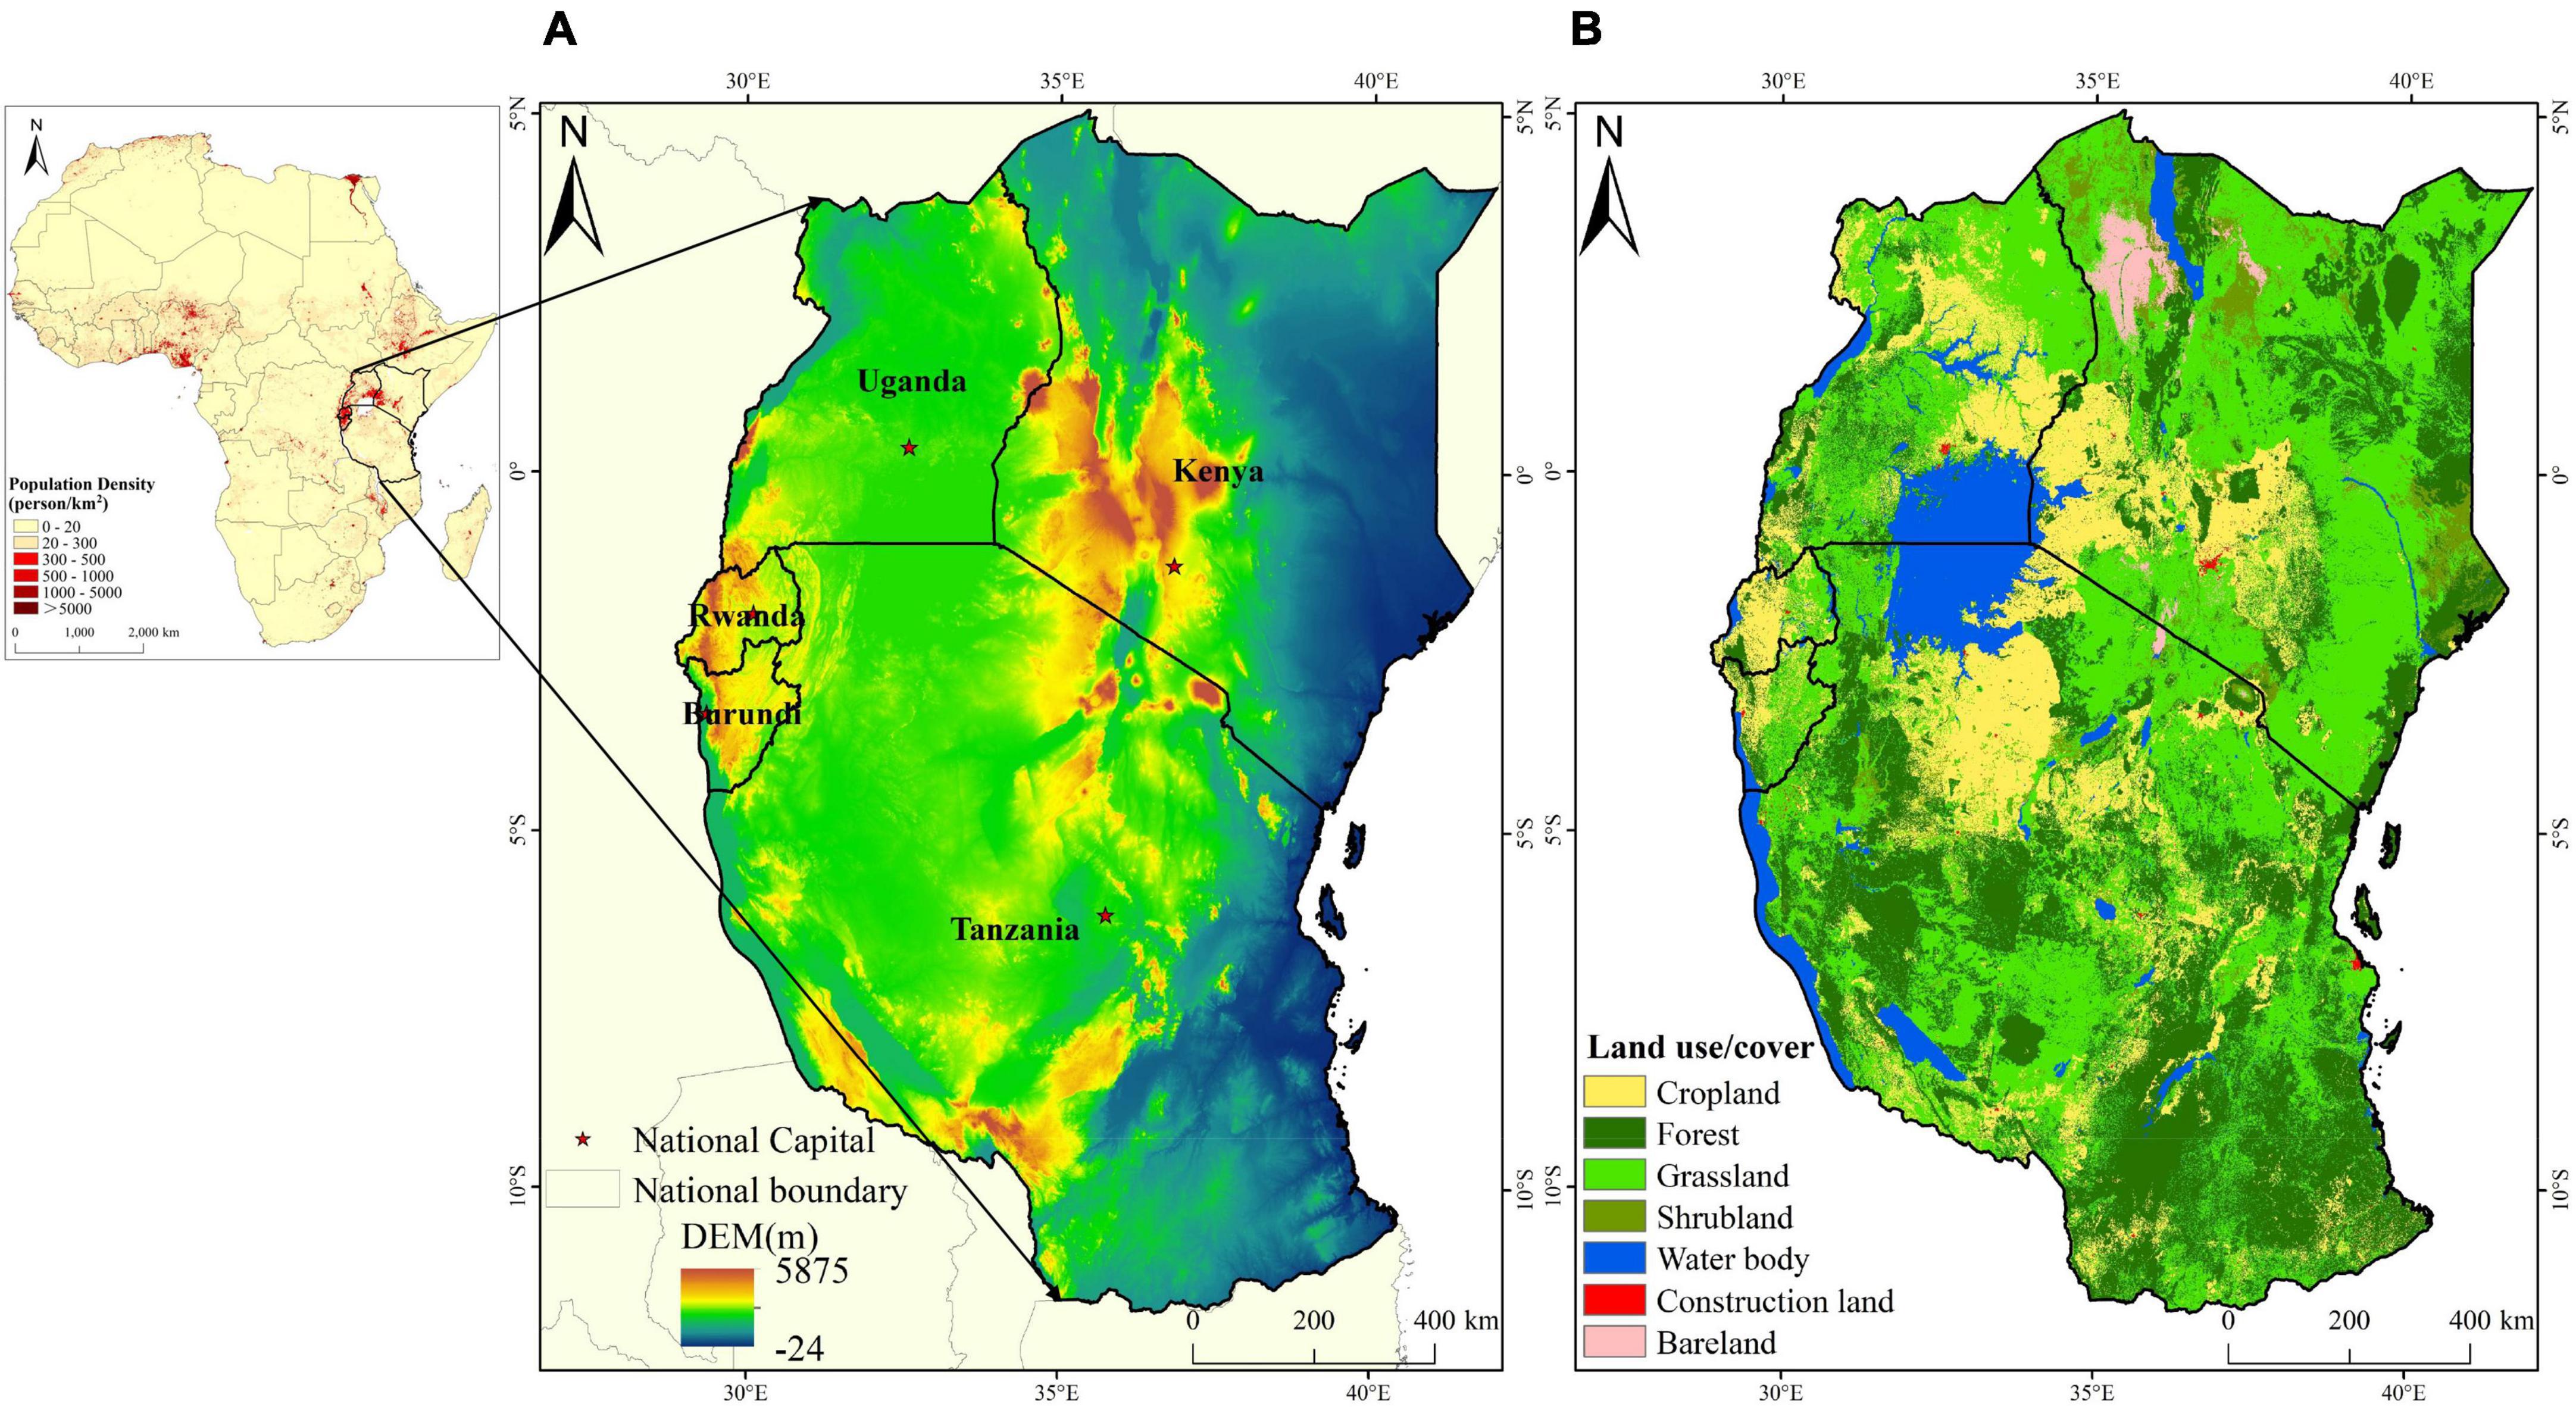
Figure 1. Map of location (A) and land cover (B) of East Africa.
In this study, the MODIS product (MOD17A3HGF v006) was taken from NASA LAADS Web,1 at a pixel of 500 × 500 m, in HDF format, from 2000 to 2020. The MODIS reprojection tool (MRT) was used for format conversion, image stitching and projection conversion of the MODIS NPP data. Annual precipitation from 2000 to 2020 at a spatial resolution of 0.05° was obtained from the CHIRPS product.2 Previous studies have demonstrated that the CHIRPS dataset performs reasonably well in capturing rainfall dynamics, especially in Africa (Zhou et al., 2021). Monthly temperature data at a spatial resolution of 0.1° was collected from the ERA5-Land reanalysis dataset,3 which was developed by the European Centre for Medium-Range Weather Forecasts (ECMWF). Solar radiation data was calculated from the downward shortwave radiation data in the TerraClimate dataset, a high-spatial-resolution climate dataset (1/24°, i.e., approximately 0.0417°) (Song et al., 2022). Monthly temperature, and solar radiation were calculated to generate annual time series data for 2000–2020. Land cover data in 2000 was provided by the Global Land Cover Datasets (GlobeLand30, resolution 30 m4). Land cover data was resampled to a resolution of 1 km based on the nearest neighbor algorithm, and other data were resampled to 1 km spatial resolution using the bilinear interpolation method (Chen et al., 2019).
The variation coefficient was utilized to measure the fluctuation of NPP dynamics, with larger values indicating greater fluctuations in NPP and more unstable vegetation conditions, and vice versa (Zhu et al., 2023). The formula is as follows:
where CV is the variation coefficient; NPPi is the vegetation NPP in year i; is the average value of NPP over a 21-year period; n is the number of research years.
The linear regression model based on the least square method was utilized to characterize the long-term trends of NPP in East Africa from 2000 to 2020 (Teng et al., 2020; Ge et al., 2021).
where θslope is the long-term trend of NPP; n is the number of research years, here n = 21; i is the sequence number of the year; Vari represents the NPP value in year i. A positive θslope indicates that NPP shows an increasing trend over time, while vice versa indicates that NPP shows a decreasing trend. Moreover, the t-test was utilized to test the significance of slope in this study, where p < 0.05 represents statistically significant, and p < 0.01 represents statistically extremely significant (Ge et al., 2021).
In this study, correlations between NPP and climate factors (temperature, precipitation, and solar radiation) were calculated using the second-order partial correlation analysis (Ma et al., 2023).
Correlation analysis method:
where rxy represents the correlation coefficient; n represents the sample size; and represent the mean values of x and y, respectively.
First-order partial correlation method:
where rxy,z represents the partial correlation coefficient between the variable x and y when the variable z is regarded as a constant; rxy, rxz, and ryz represent the correlation coefficient between two variables.
Second-order partial correlation method:
where R represents the second-order partial correlation coefficient between the variable x and y when the variables z and t are regarded as constant; rxy,z, rxt,z, and ryt,z represent first-order partial correlation coefficients.
The significance of the second-order partial correlation coefficient was verified using t-test, and the formula is:
where R is the second-order partial correlation coefficient, n is the number of samples, and q is the number of independent variables. Based on the results of the t-test, the significance test results of the partial correlation coefficients between NPP and climate factors can be divided into the following types: (1) ESN: extremely significant negative correlation (R < 0, p < 0.01); (2) SN: significant negative correlation (R < 0, p < 0.05); (3) NN: nonsignificant negative correlation (R < 0, p > 0.05); (4) SP: significant positive correlation (R > 0, p < 0.05); (5) ESP: extremely significant positive correlation (R > 0, p < 0.01); and (6) NP: nonsignificant positive correlation (R > 0, p > 0.05).
Vegetation NPP changes are a function of climate (mainly referring to precipitation, temperature, and solar radiation) and other variables (dominated by human activities) (Qu et al., 2020). In this study, we used the partial derivative method to calculate the contributions of each driver to NPP, as followed (Yan et al., 2019; Ge et al., 2021; Zhu et al., 2023):
where θslope is the NPP trend; C_con, H_con, Pre_con, Tem_con, and Rad_con are the contributions of climate change, human activities, precipitation, temperature, and solar radiation to the inter-annual NPP changes, respectively; C_con is the sum of Pre_con, Tem_con, and Rad_con; , and are the inter-annual variation rates of temperature, precipitation and solar radiation, respectively; , and are the slopes of the linear regression curves between NPP and three climate factors, respectively; UF is the residual of the equation, representing the contribution of unknown factors to NPP. In this study, we hypothesize the dominance of human factors in UF concerning related studies (Zhang et al., 2016; Zhu et al., 2023).
Based on Eq. 7, a positive θslope represents NPP increase, whereas a negative θslope denotes NPP decrease. The positive C_con and H_con represent climate change and human activities that benefit vegetation growth, whereas the negative values represent that they hinder vegetation growth. Moreover, scenarios were designed to isolate climate and anthropogenic impacts on vegetation NPP trend (Table 1).
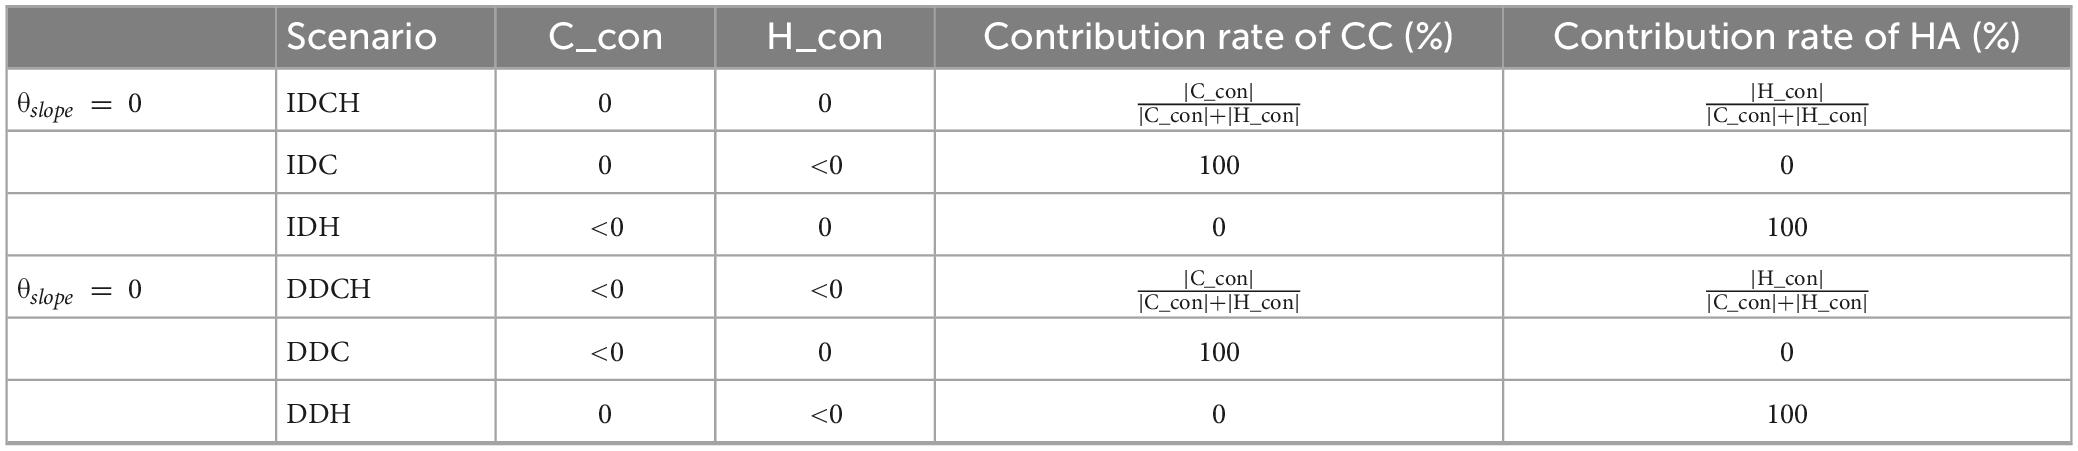
Table 1. Relative effects scenario of climate change (CC) and human activities (HA) on NPP increase/decrease.
Under the condition of θslope 0 (NPP increase), if C_con 0 and H_con 0, climate change and human activities combine to promote an increase in vegetation NPP. In this scenario (Scenario IDCH), the relative contribution of the two factors to the increase in NPP can be calculated based on the equation shown in Table 1. If C_con 0 and H_con < 0, then climate change contributed to the vegetation NPP increase and human activities facilitated a decrease in vegetation NPP. Therefore, Scenario IDC represents that the NPP increase is entirely attributed to climate change. If C_con < 0 and H_con 0, the NPP increase is entirely attributed to human activities, because C_con < 0 shows that climate change is harmful to vegetation growth and caused a decrease in vegetation NPP, whereas H_con 0 indicates that human activities are beneficial to vegetation growth and promoted an increase in vegetation NPP. Therefore, this scenario represents that NPP increases due to human factors (IDH).
Under the condition of θslope < 0 (NPP decrease), if C_con < 0 and H_con < 0, the NPP decrease was caused by the combined effects of climatic and human factors (DDCH). If C_con < 0 and H_con 0, the NPP decrease is entirely attributed to climate change, because C_con < 0 indicates that climate change is harmful to vegetation growth and induced a decrease in NPP, whereas H_con 0 shows that human activities promoted an increase in NPP. Therefore, Scenario DDC represents that NPP decreases due to climate change. If C_con 0 and H_con < 0, climate change promoted an increase in NPP and human activities caused a decrease in NPP. In this scenario, the NPP decrease is caused by human activities (DDH).
Annual average vegetation NPP in East Africa exhibited an increasing trend from 2000 to 2020, and its linear increasing trend reached a significant level (p < 0.01) (4.16 g C/m2/a). For East Africa, NPP increased from 701.11 to 928.50 g C/m2/a with an average value of 806.21 g C/m2/a. The minimum and maximum NPP values appeared in 2000 and 2020, respectively. In terms of specific countries, growth rates of vegetation NPP in Uganda and Tanzania from 2000 to 2020 were higher than that of the East African average, while growth rates in Burundi, Kenya, and Rwanda were lower than that of the East African average, and the growth trends in Kenya and Rwanda were not significant (Figure 2).
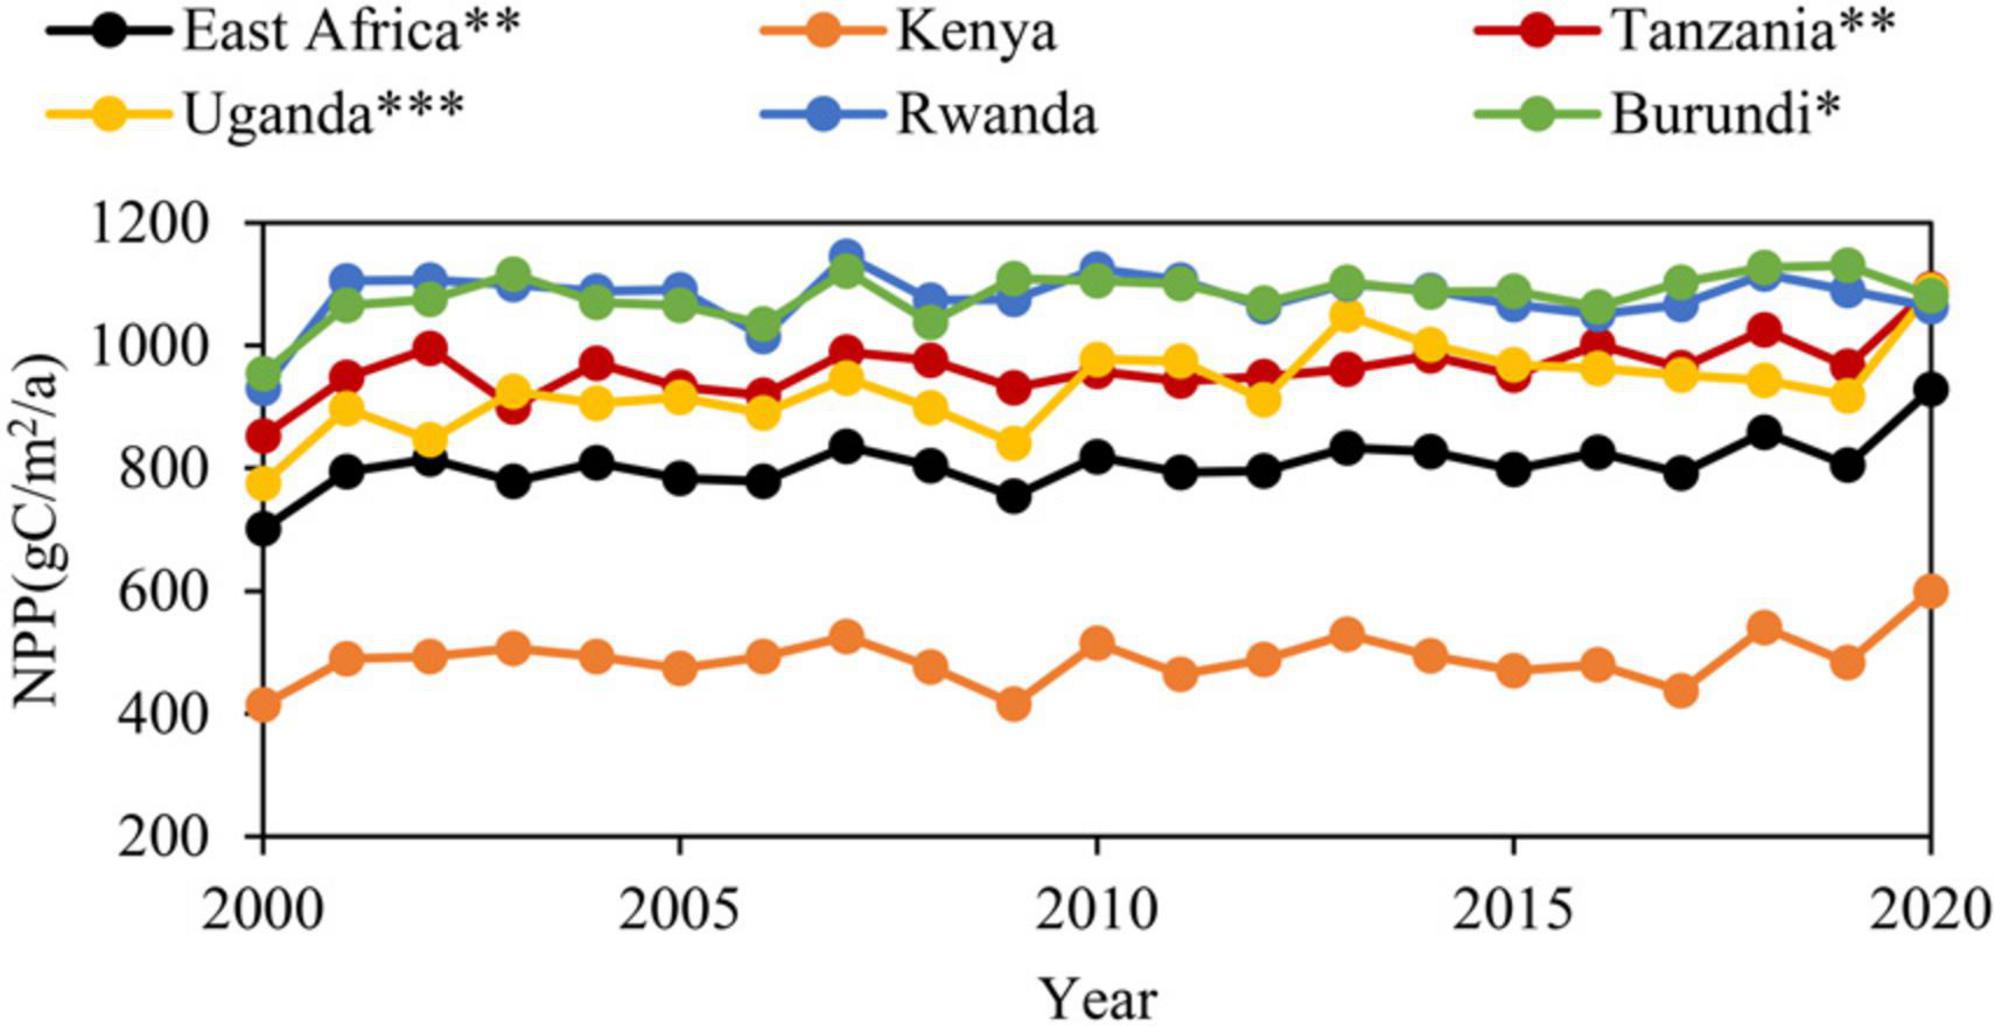
Figure 2. Inter-annual variation of average vegetation NPP in East Africa, 2000–2020. East Africa: y = 4.16x-7558.30, R2= 0.33**; Kenya: y = 2.18x-3883.93, R2= 0.06; Tanzania: y = 4.75x-8582.87, R2= 0.35**; Uganda: y = 7.54x-14215.99, R2= 0.42***; Rwanda: y = 0.13x-1192.93, R2= 0.02; Burundi: y = 3.18x-5315.22, R2= 0.21*. ***p < 0.001, **p < 0.01, *p < 0.05.
The average vegetation NPP in East Africa was 801.29 g C/m2/a, and its distribution presented distinct spatial heterogeneity (Figure 3A). The areas with a mean value below 400 g C/m2/a accounted for 19.18% of the total area in East Africa and were mainly located in Kenya. Areas with a mean value above 1,500 g C/m2/a were distributed in southwestern Kenya, northeastern and south-central Tanzania, western Uganda, and southwestern Rwanda. In general, the spatial distribution of NPP in Kenya was the most heterogeneous, followed by Tanzania, while Uganda, Burundi, and Rwanda had a more homogeneous distribution of multi-year average NPP. Moreover, based on Eq. 1, the variation coefficient of NPP had a similar spatial distribution to the multi-year average NPP. Specifically, the areas with high NPP had a smaller coefficient of NPP variation and more stable vegetation status, while a more fluctuating vegetation status was observed in areas with low NPP values (Figure 3B).
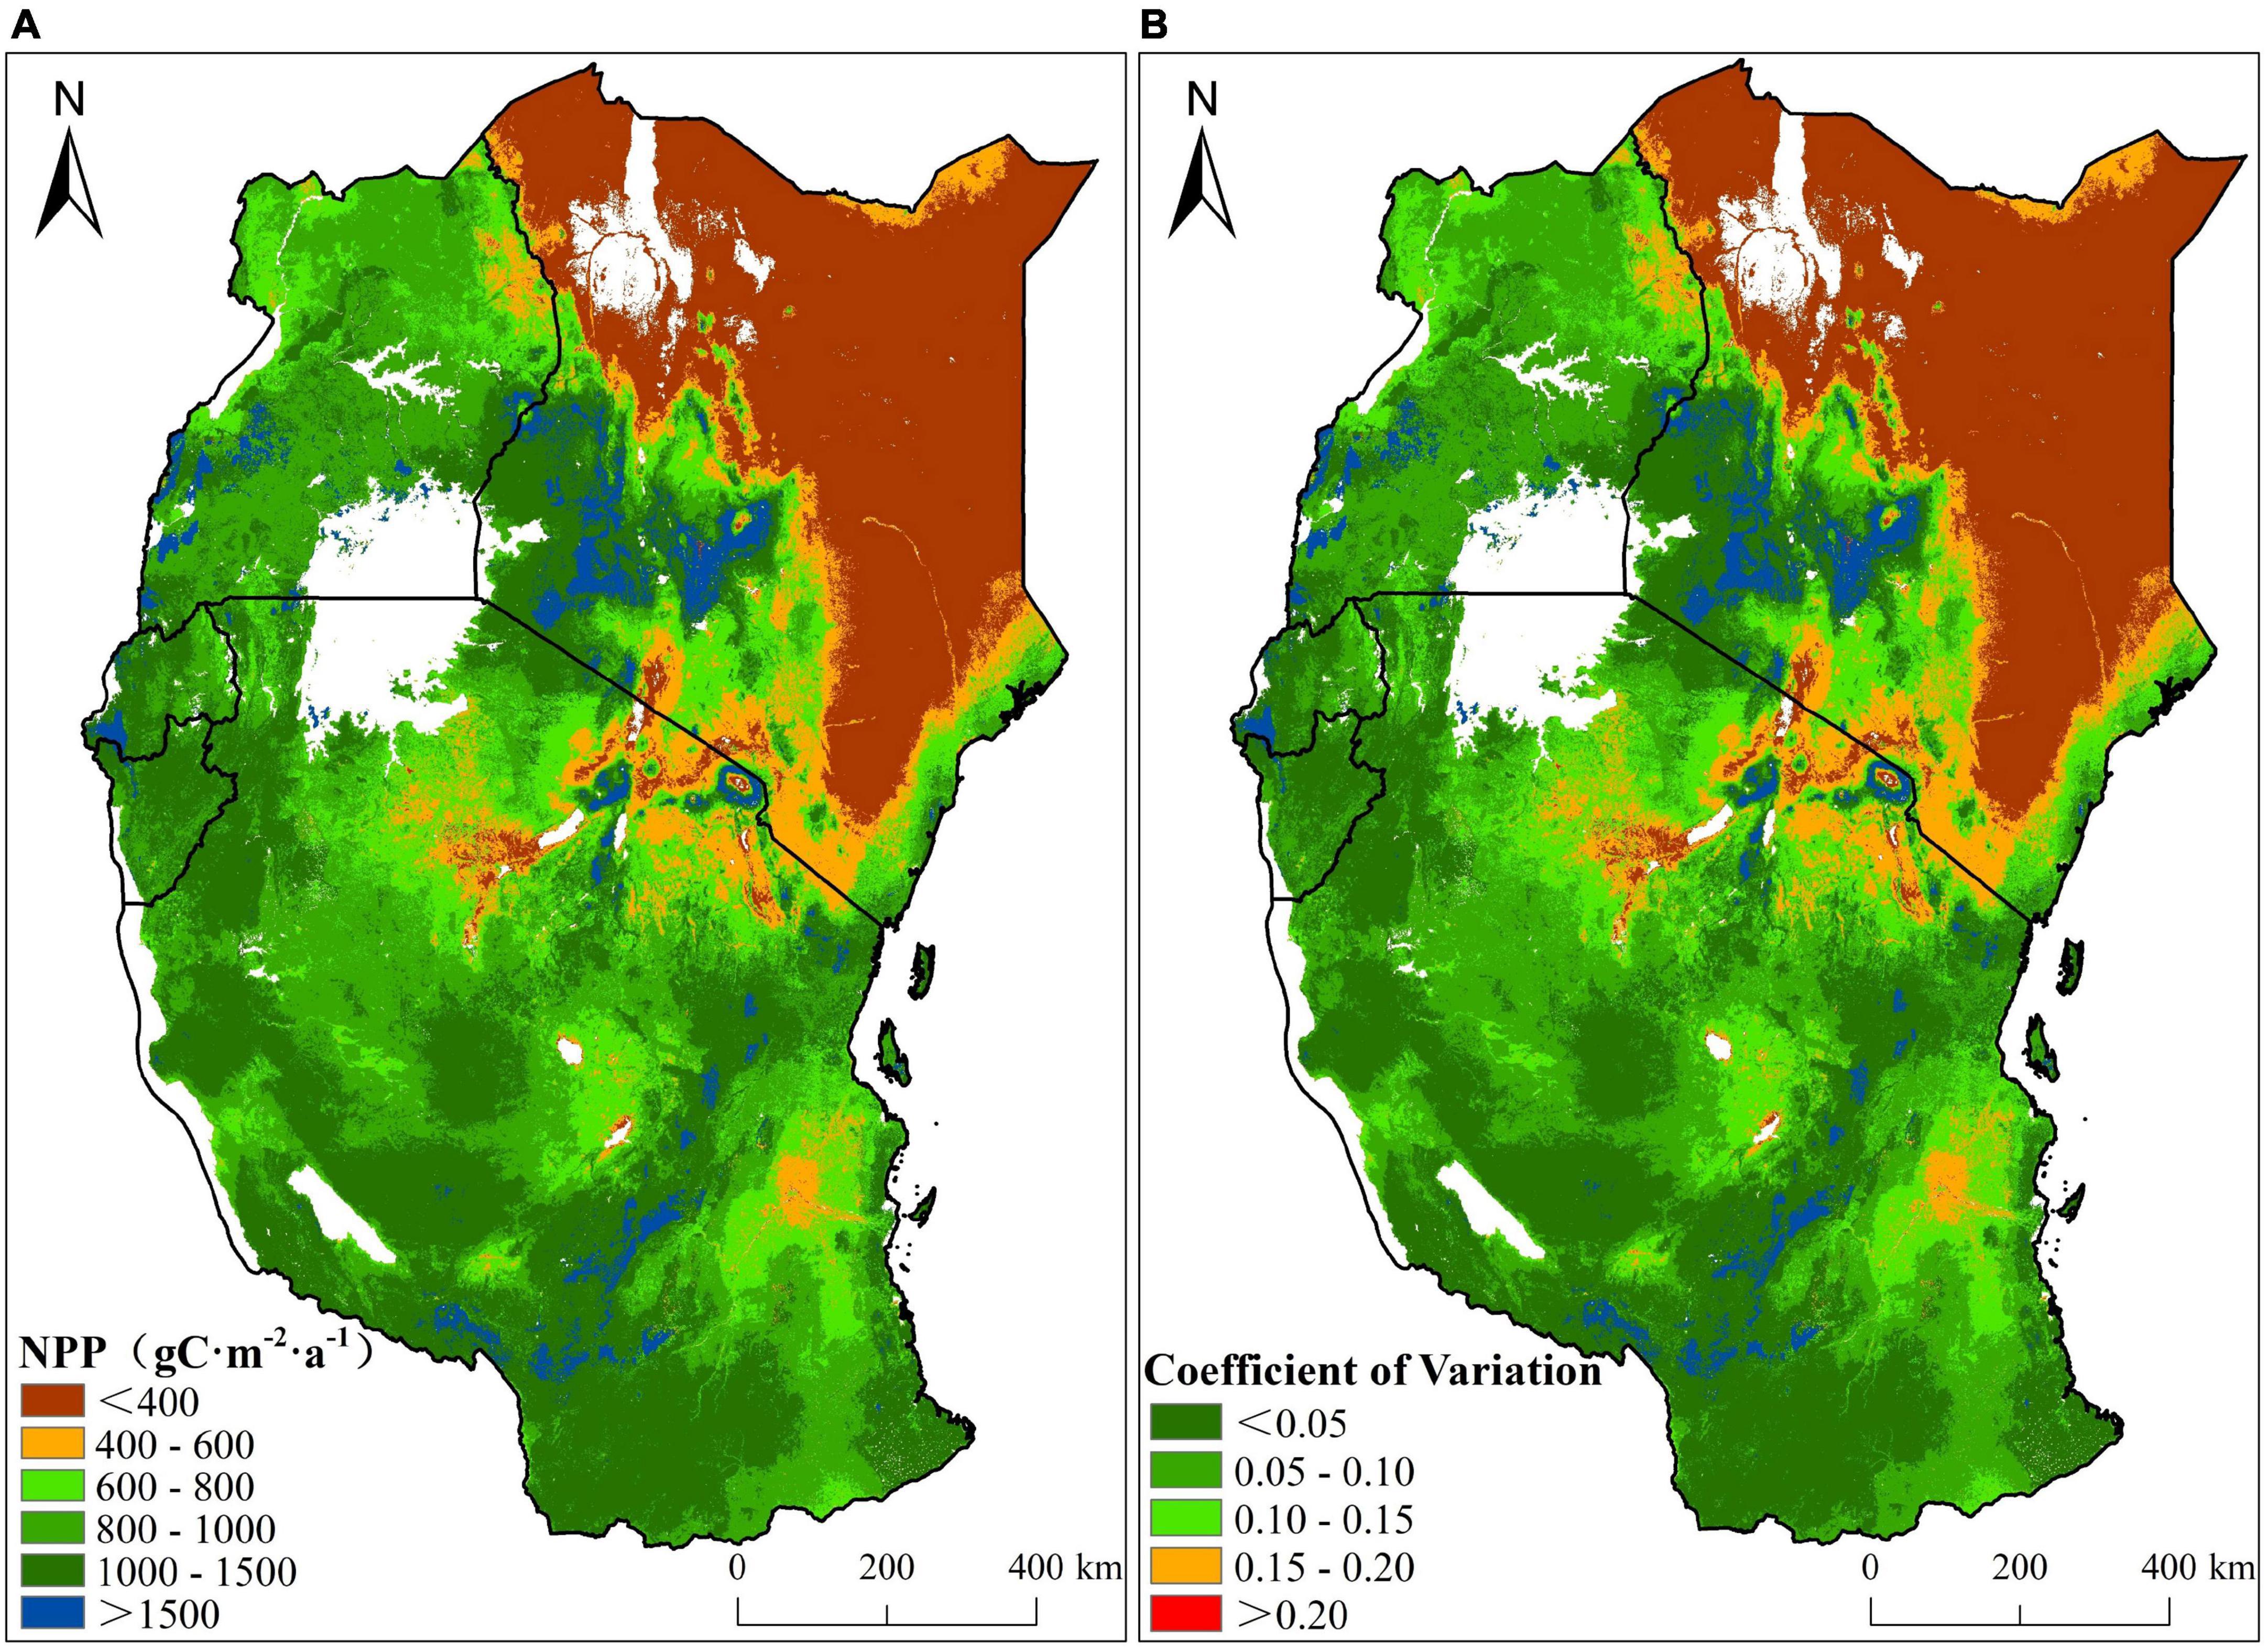
Figure 3. Spatial distribution of the multiyear average NPP (A) and variation coefficient (B).
During 2000–2020, determined by Eq. 2, vegetation NPP exhibited an increasing trend and a decreasing trend in 71.06% and 28.94% of the study area, respectively (Figure 4A). Moreover, 36.05% of the study area had statistically significant trends in vegetation NPP (p < 0.05). In the significantly change areas, the significant increasing trend (p < 0.05) accounted for 87.14%, mainly located in northern Uganda, western Tanzania, and central and western Kenya. The area ratio with a significant downward trend was 12.86%, mainly in eastern Kenya, central and eastern Uganda, western Rwanda, and western, northern and central Tanzania (Figure 4B). In Uganda, 96.26% of the significantly change areas exhibited a significant increase trend. In the significantly change areas, the significant decrease of NPP in Rwanda (33.92%) and Kenya (32.22%) was greater than in Uganda (3.74%), Tanzania (8.82%), and Burundi (11.15%). Meanwhile, there were more significantly increased areas of NPP in Tanzania (91.18%) and Burundi (8.85%) than in Rwanda (66.08%) and Kenya (67.78%) (Figure 5).
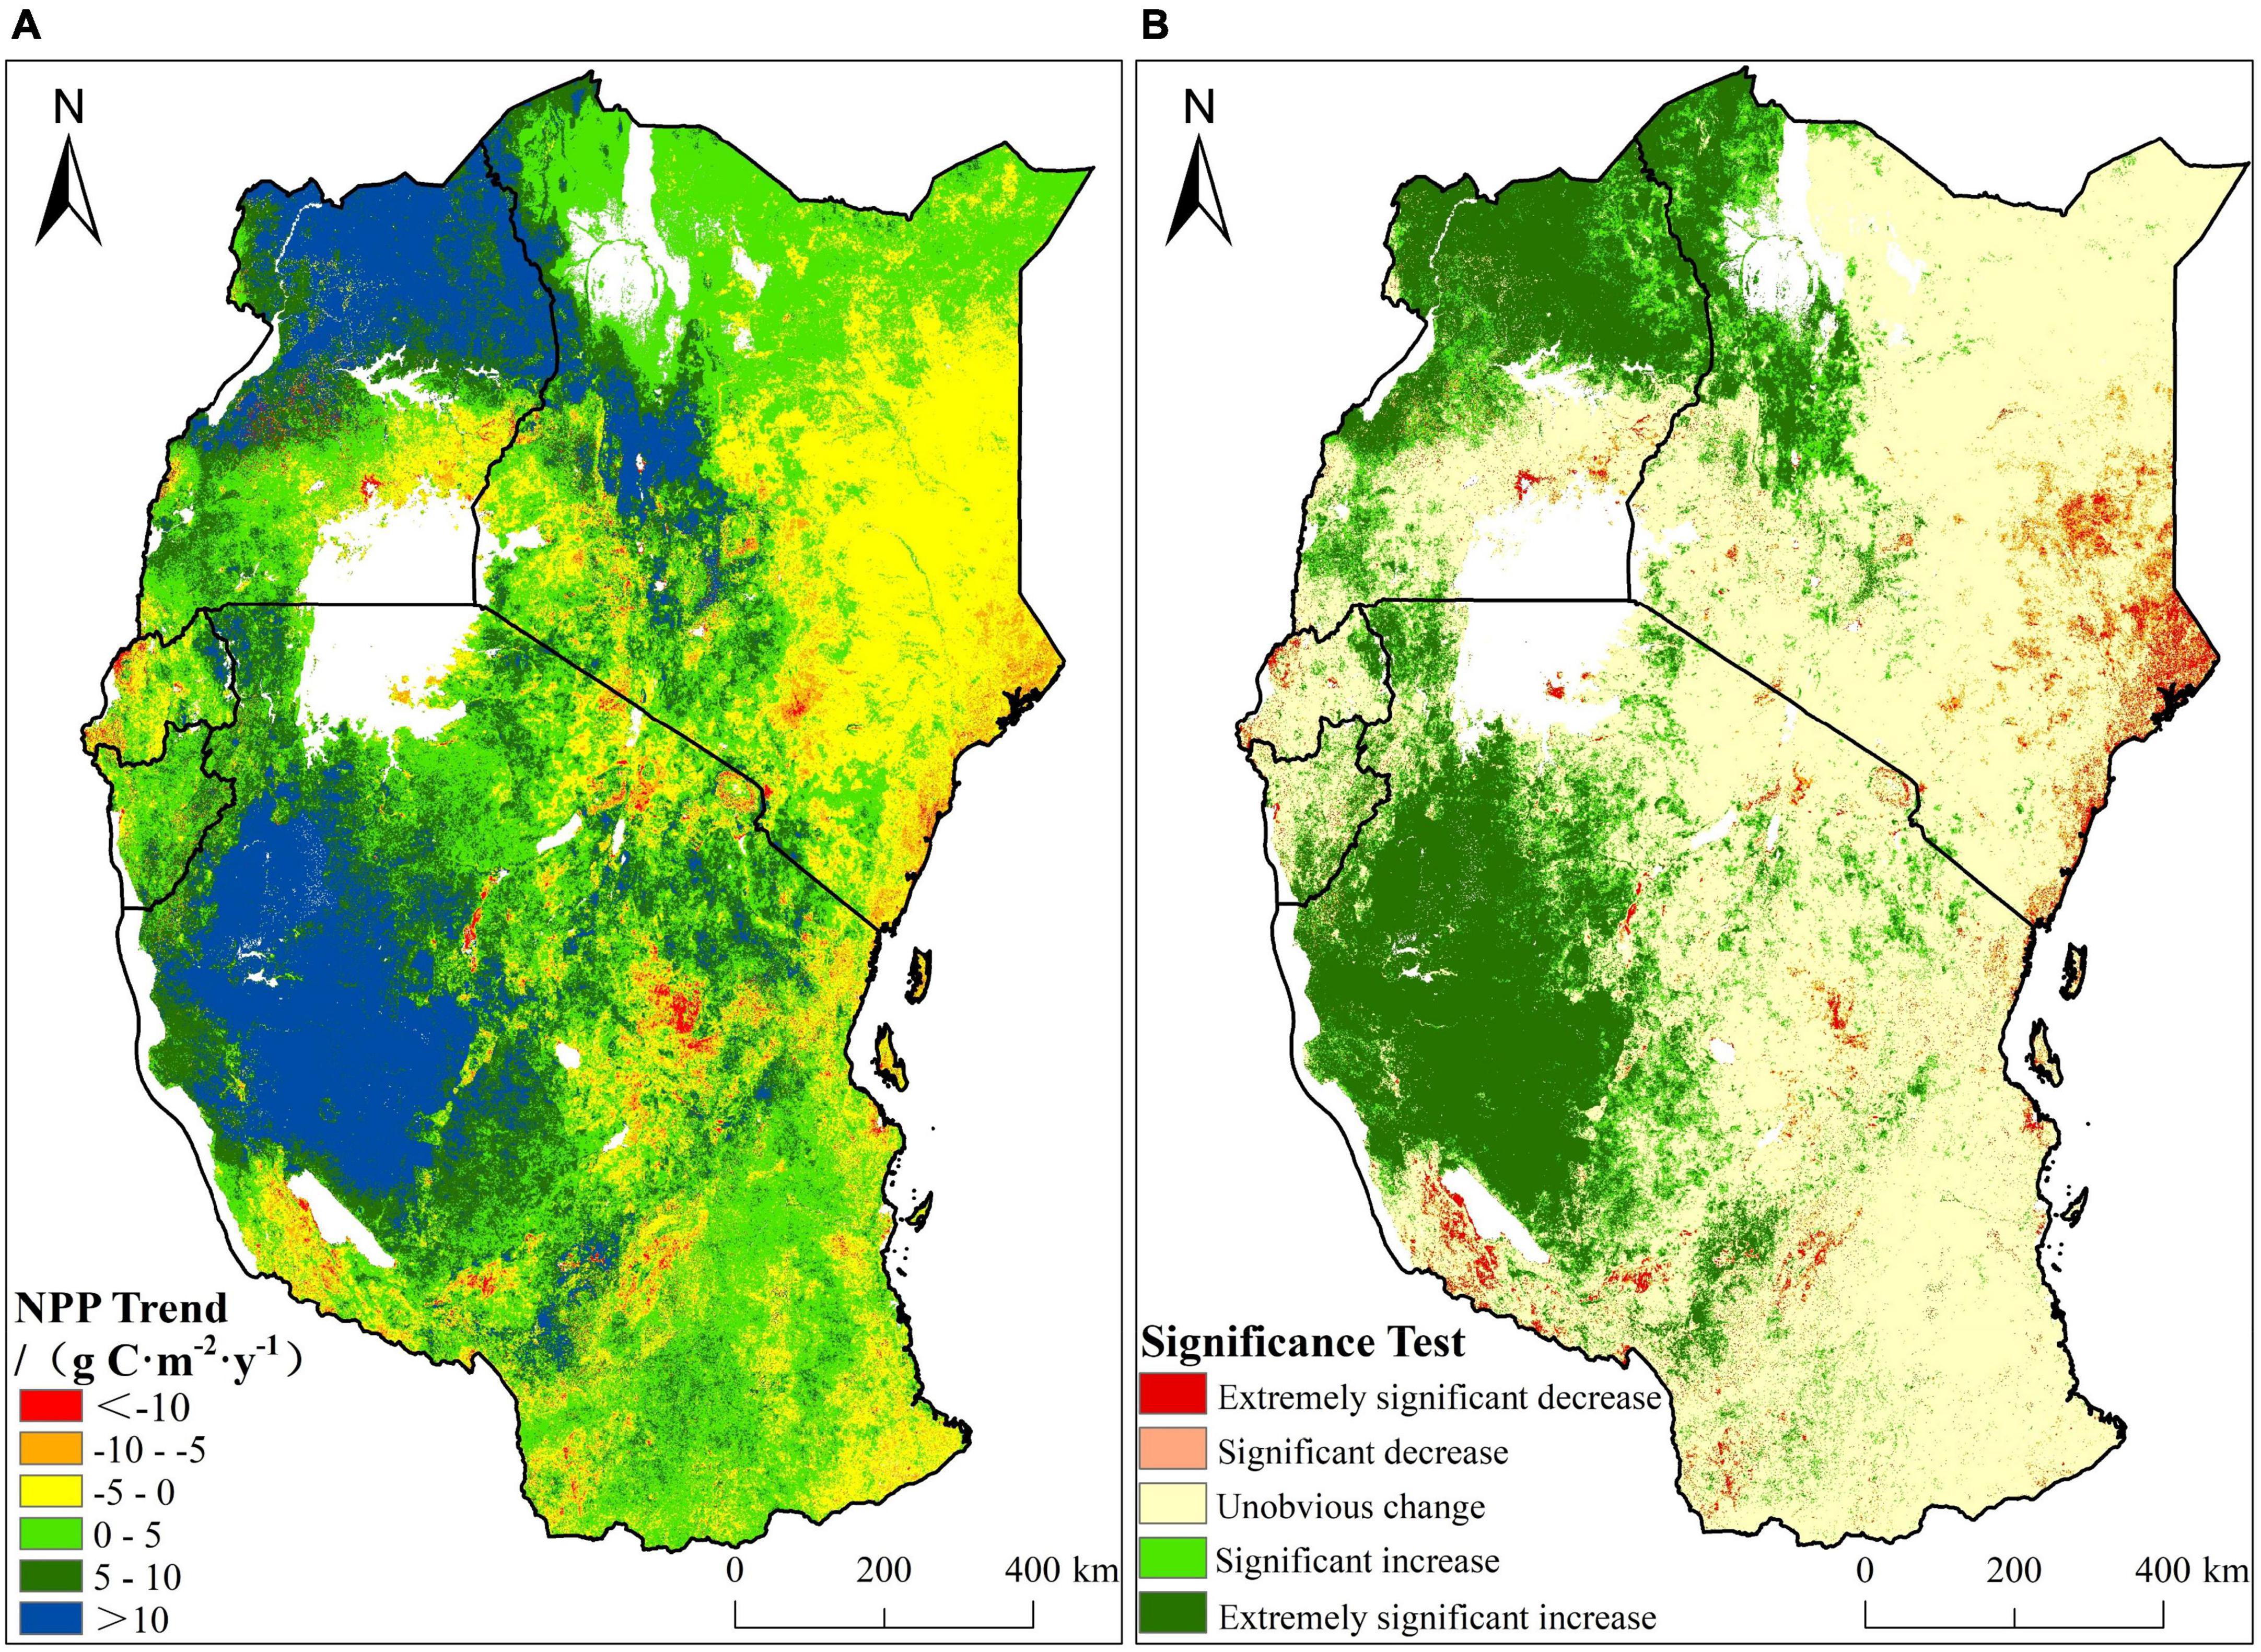
Figure 4. Spatial distribution of change trend (A) and significance test (B) of NPP in East Africa from 2000 to 2020.
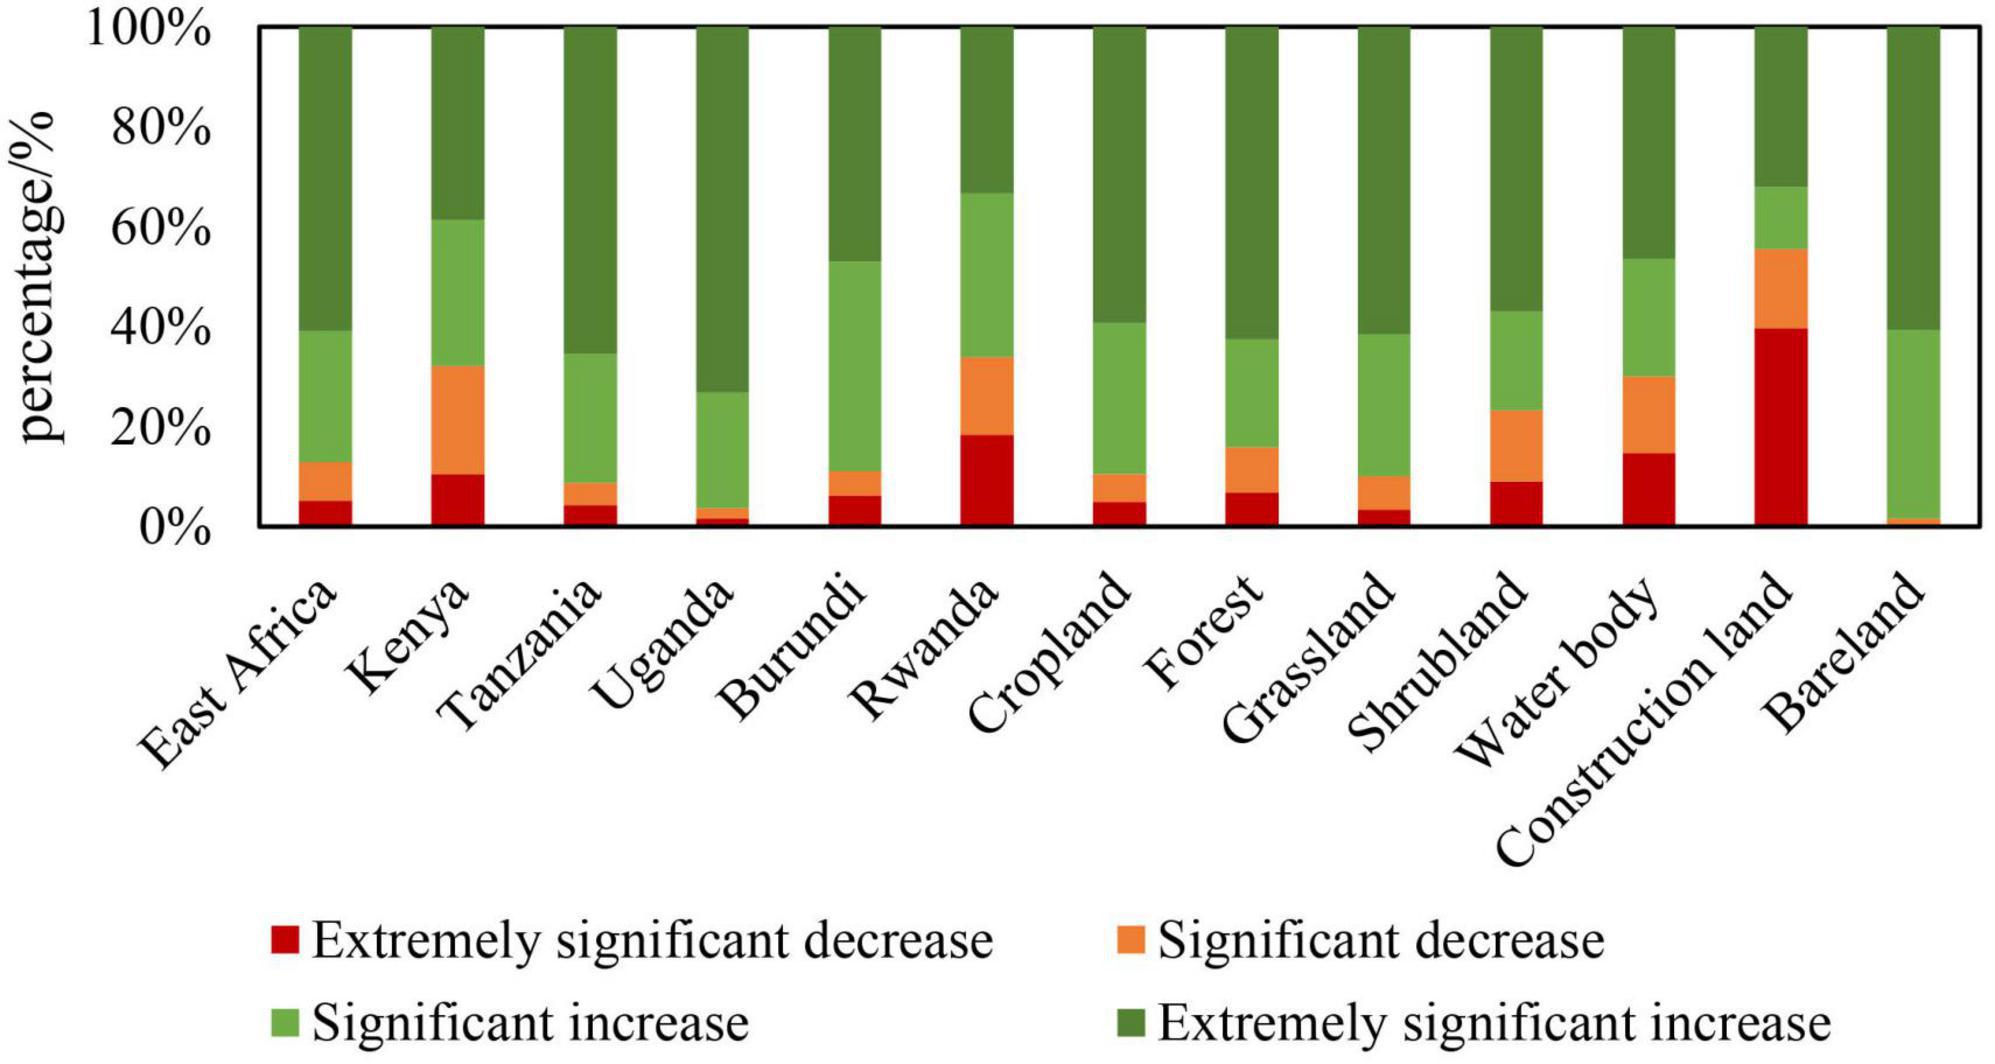
Figure 5. Percentage of NPP significant changes for different countries and land use types.
In the past 21 years, NPP change trends varied for different types of vegetation (Figure 5). In the significantly change areas, compared with other land types, construction land had the lowest increase ratio (44.44%) and the highest decrease ratio (55.56%). Bare land accounted for 98.33% and 1.67% of the significantly change areas with significant improvement and degradation, respectively. In shrubland, grassland and cropland, a total of 76.70%, 89.90%, and 89.48% of the pixels exhibited significant improvements, respectively. There are 84.11% and 69.87% of the pixels representing forest and water body exhibited significant improvement, respectively.
The results of second-order partial correlation analysis are shown in Figure 6 (Eqs 3–6). The correlation coefficient values between NPP and precipitation had a maximum of 0.92 and a minimum of −0.88, with a median value of 0.56 (Figures 6A, 7). In areas where NPP was significantly correlated with precipitation (p < 0.05), the maximum, minimum, and median values of the correlation coefficients were 0.49, 0.11, and 0.32, respectively (Figure 7). The proportion of NPP positively correlated with precipitation was 83.26%, of which 29.84% was significantly positive (p < 0.05), mainly concentrated in the northern, northeastern and mid-western Kenya, northern and eastern regions of Uganda, and the western and northwestern corners of Tanzania. The proportion of vegetation NPP negatively correlated with precipitation was only 1.03% (Figure 6D).
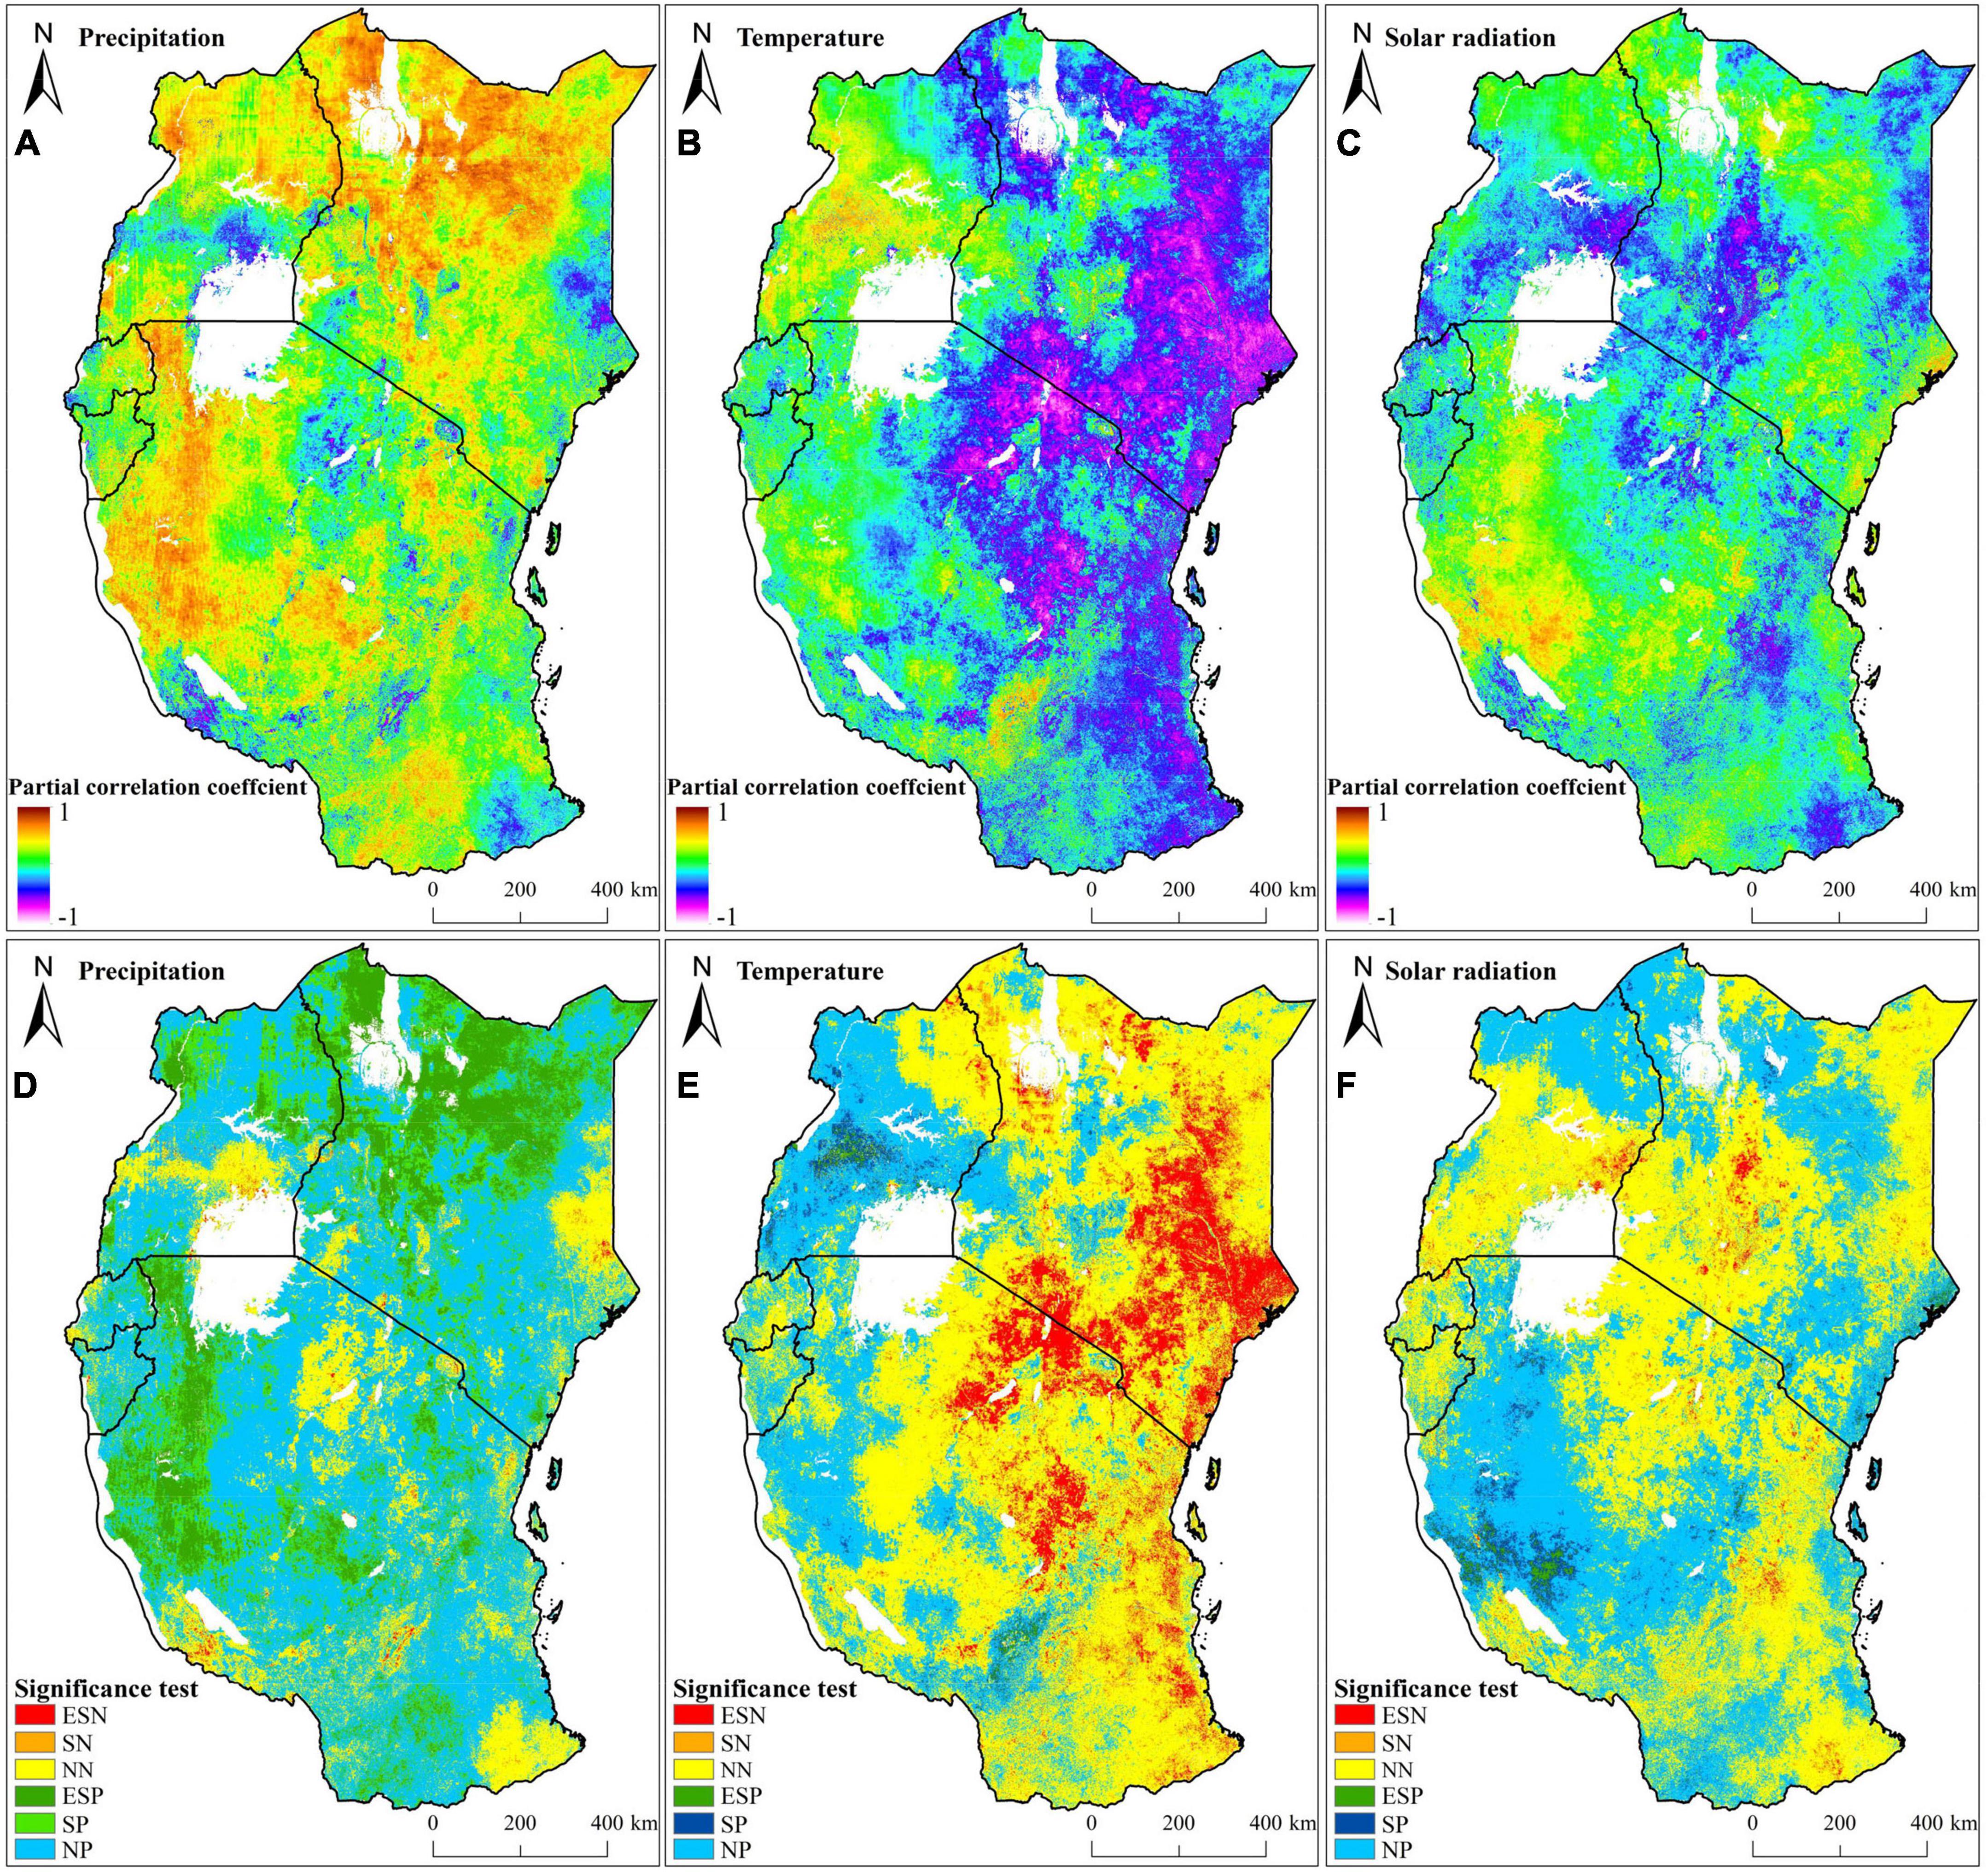
Figure 6. Second-order partial correlations and significance test between NPP and precipitation (A,D), temperature (B,E), solar radiation (C,F).
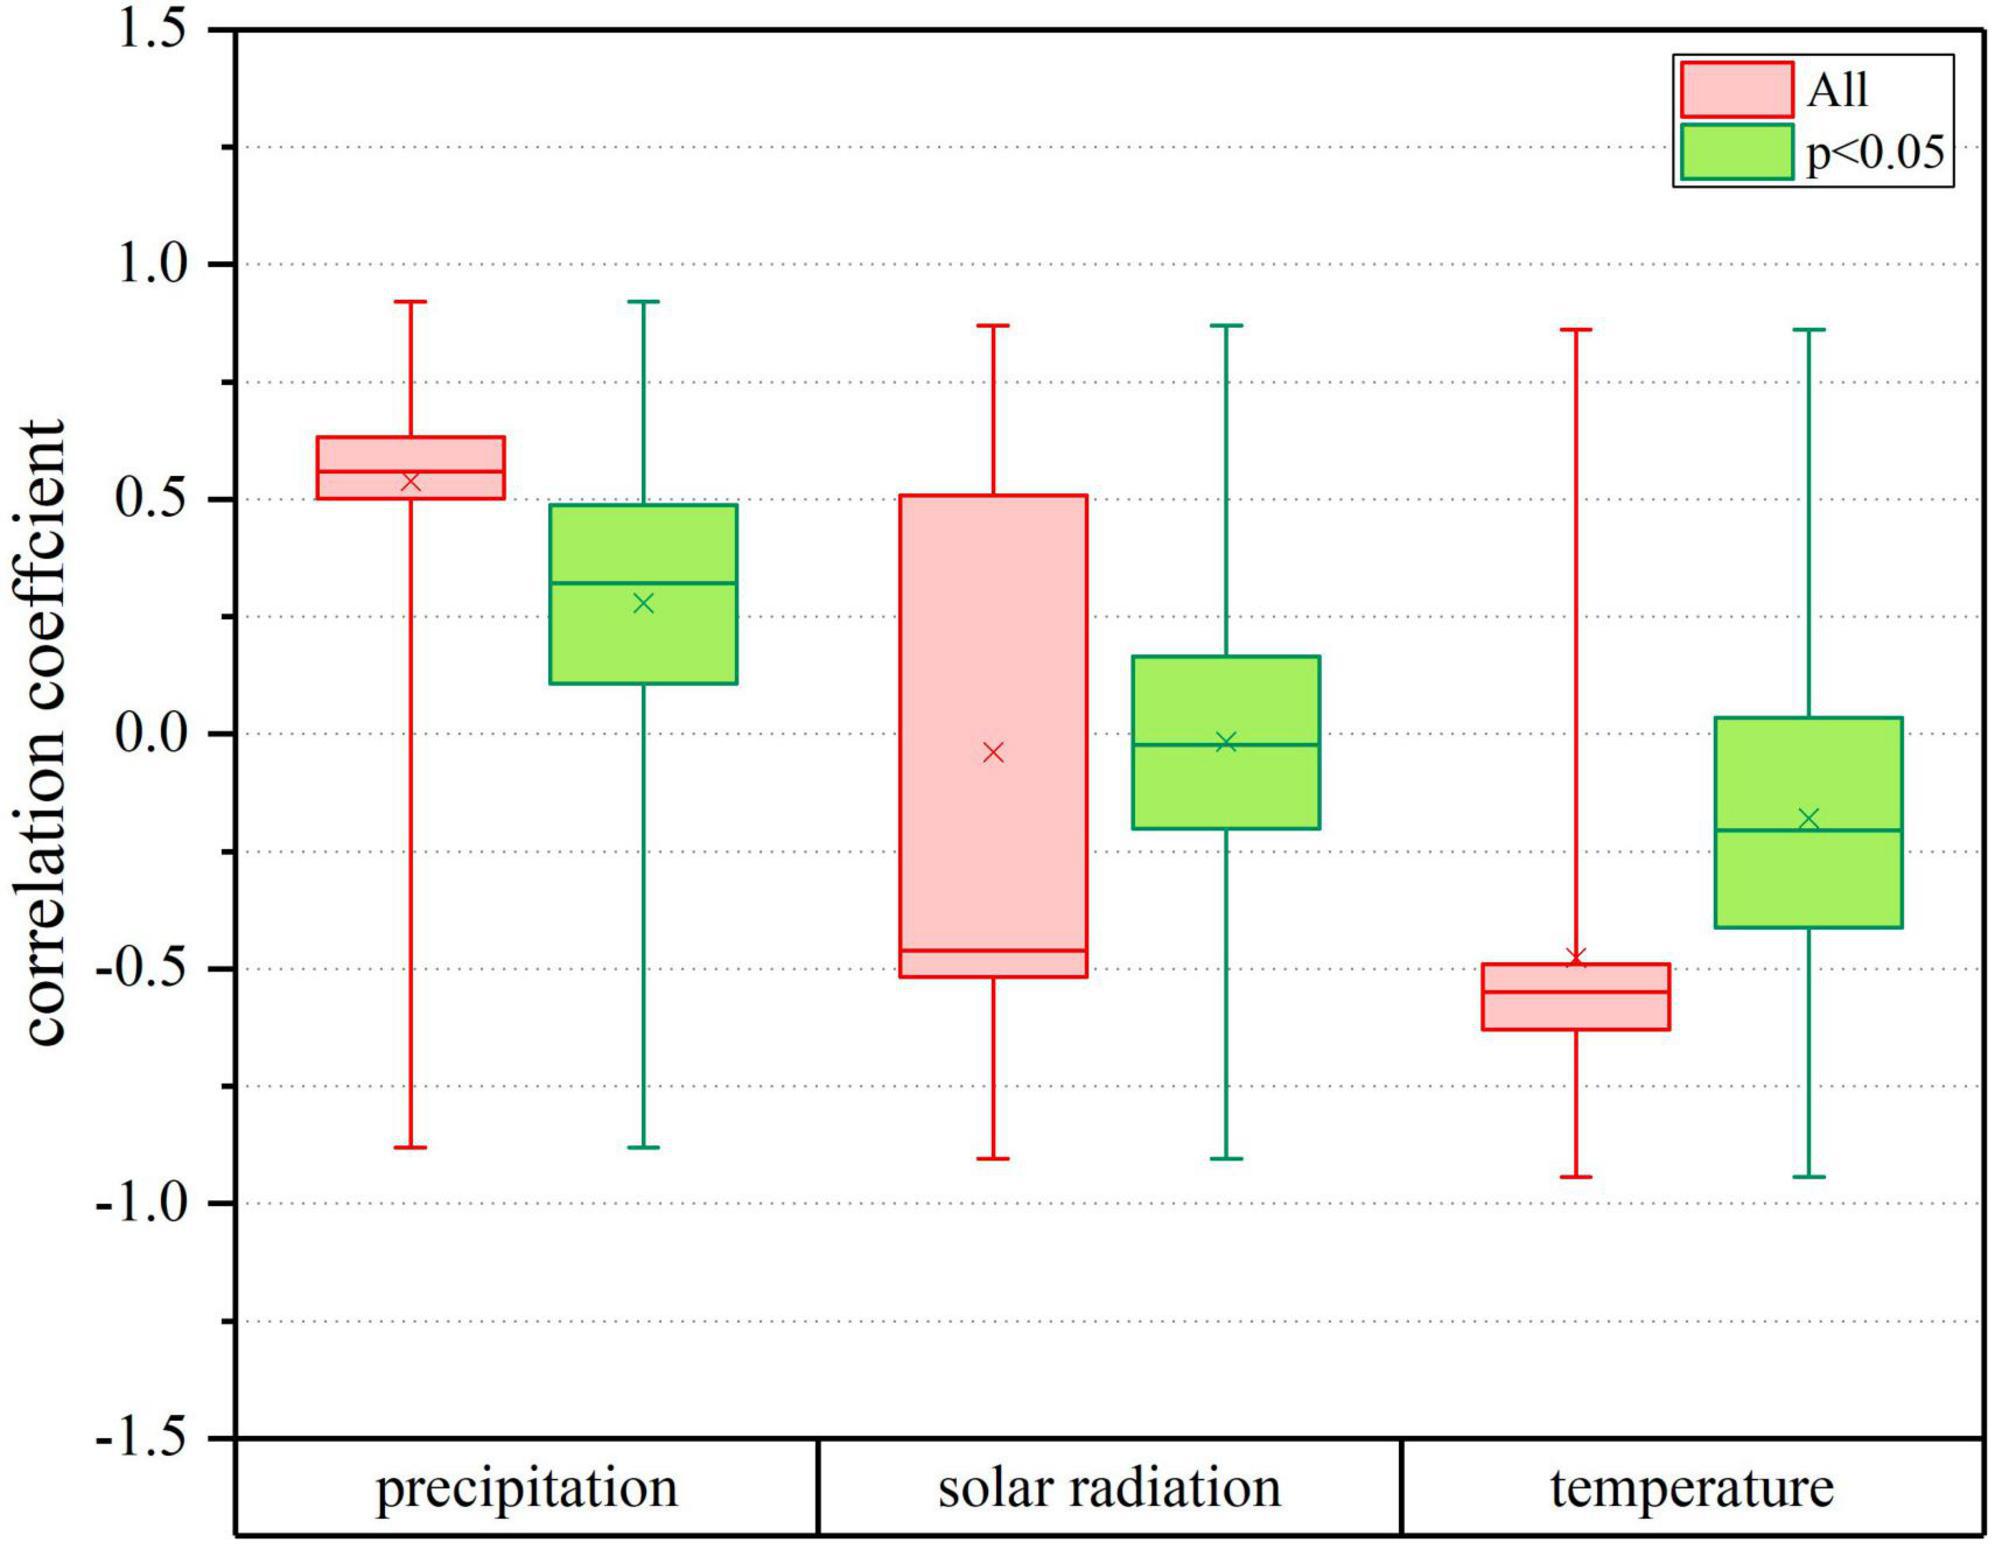
Figure 7. Box-plot of second-order partial correlations between NPP with climate factors.
The median correlation coefficients of vegetation NPP with temperature and solar radiation were −0.55 and −0.46, respectively, while the two medians that passed the significance test were −0.20 and −0.02, respectively (Figures 6B, C, 7). For 71.95% of East Africa, NPP had a negative correlation with temperature, of 20.19% had a significant negative correlation (p < 0.05), mainly distributed in Kenya and the northeastern, central and eastern coastal areas of Tanzania. Regions with a significant positive correlation with temperature accounted for 2.04% and was located in central and western Uganda, as well as southern and southwestern Tanzania (Figure 6E). Furthermore, NPP has a weak correlation with solar radiation. Specifically, the proportion of area with a significant negative correlation between NPP and solar radiation is 3.38%, and the proportion with a significant positive correlation is 2.91% (Figure 6F).
Correlation coefficients measure the degree of correlation between vegetation NPP and climatic factors, but do not distinguish the relative contribution of each climatic factor to annual variations in NPP. Therefore, based on Eq. 7, the partial derivative method is used to quantify the contribution of each climate factor to the NPP changes (Figures 8A–C). From 2000 to 2020, the contributions of precipitation, temperature and solar radiation on vegetation NPP trend in East Africa were 2.02, −1.09, and 0.31 g C⋅m–2⋅a–1, respectively (Table 2). Specifically, in 87.45% of the study area, precipitation presented a positive contribution to the NPP trend. Regions with large contributions were mainly distributed in midwestern and southwestern Kenya, northern Uganda, and western, northeastern, and southeastern Tanzania. Temperature mainly presented a negative contribution to the NPP trend, accounting for 73.46% of the whole study area, mainly concentrated in Kenya and Tanzania. Positive contributions of solar radiation to NPP changes mainly have been observed in northeastern and western Tanzania, southwestern Kenya, and western and northwestern Uganda. For all countries, precipitation made a greater positive contribution than that of temperature and solar radiation. Temperature made the greatest negative contributions to NPP changes in Kenya (−1.73 g C⋅m–2⋅a–1) and Tanzania (−1.24 g C⋅m–2⋅a–1). Overall, vegetation growth in East Africa is most affected by precipitation.
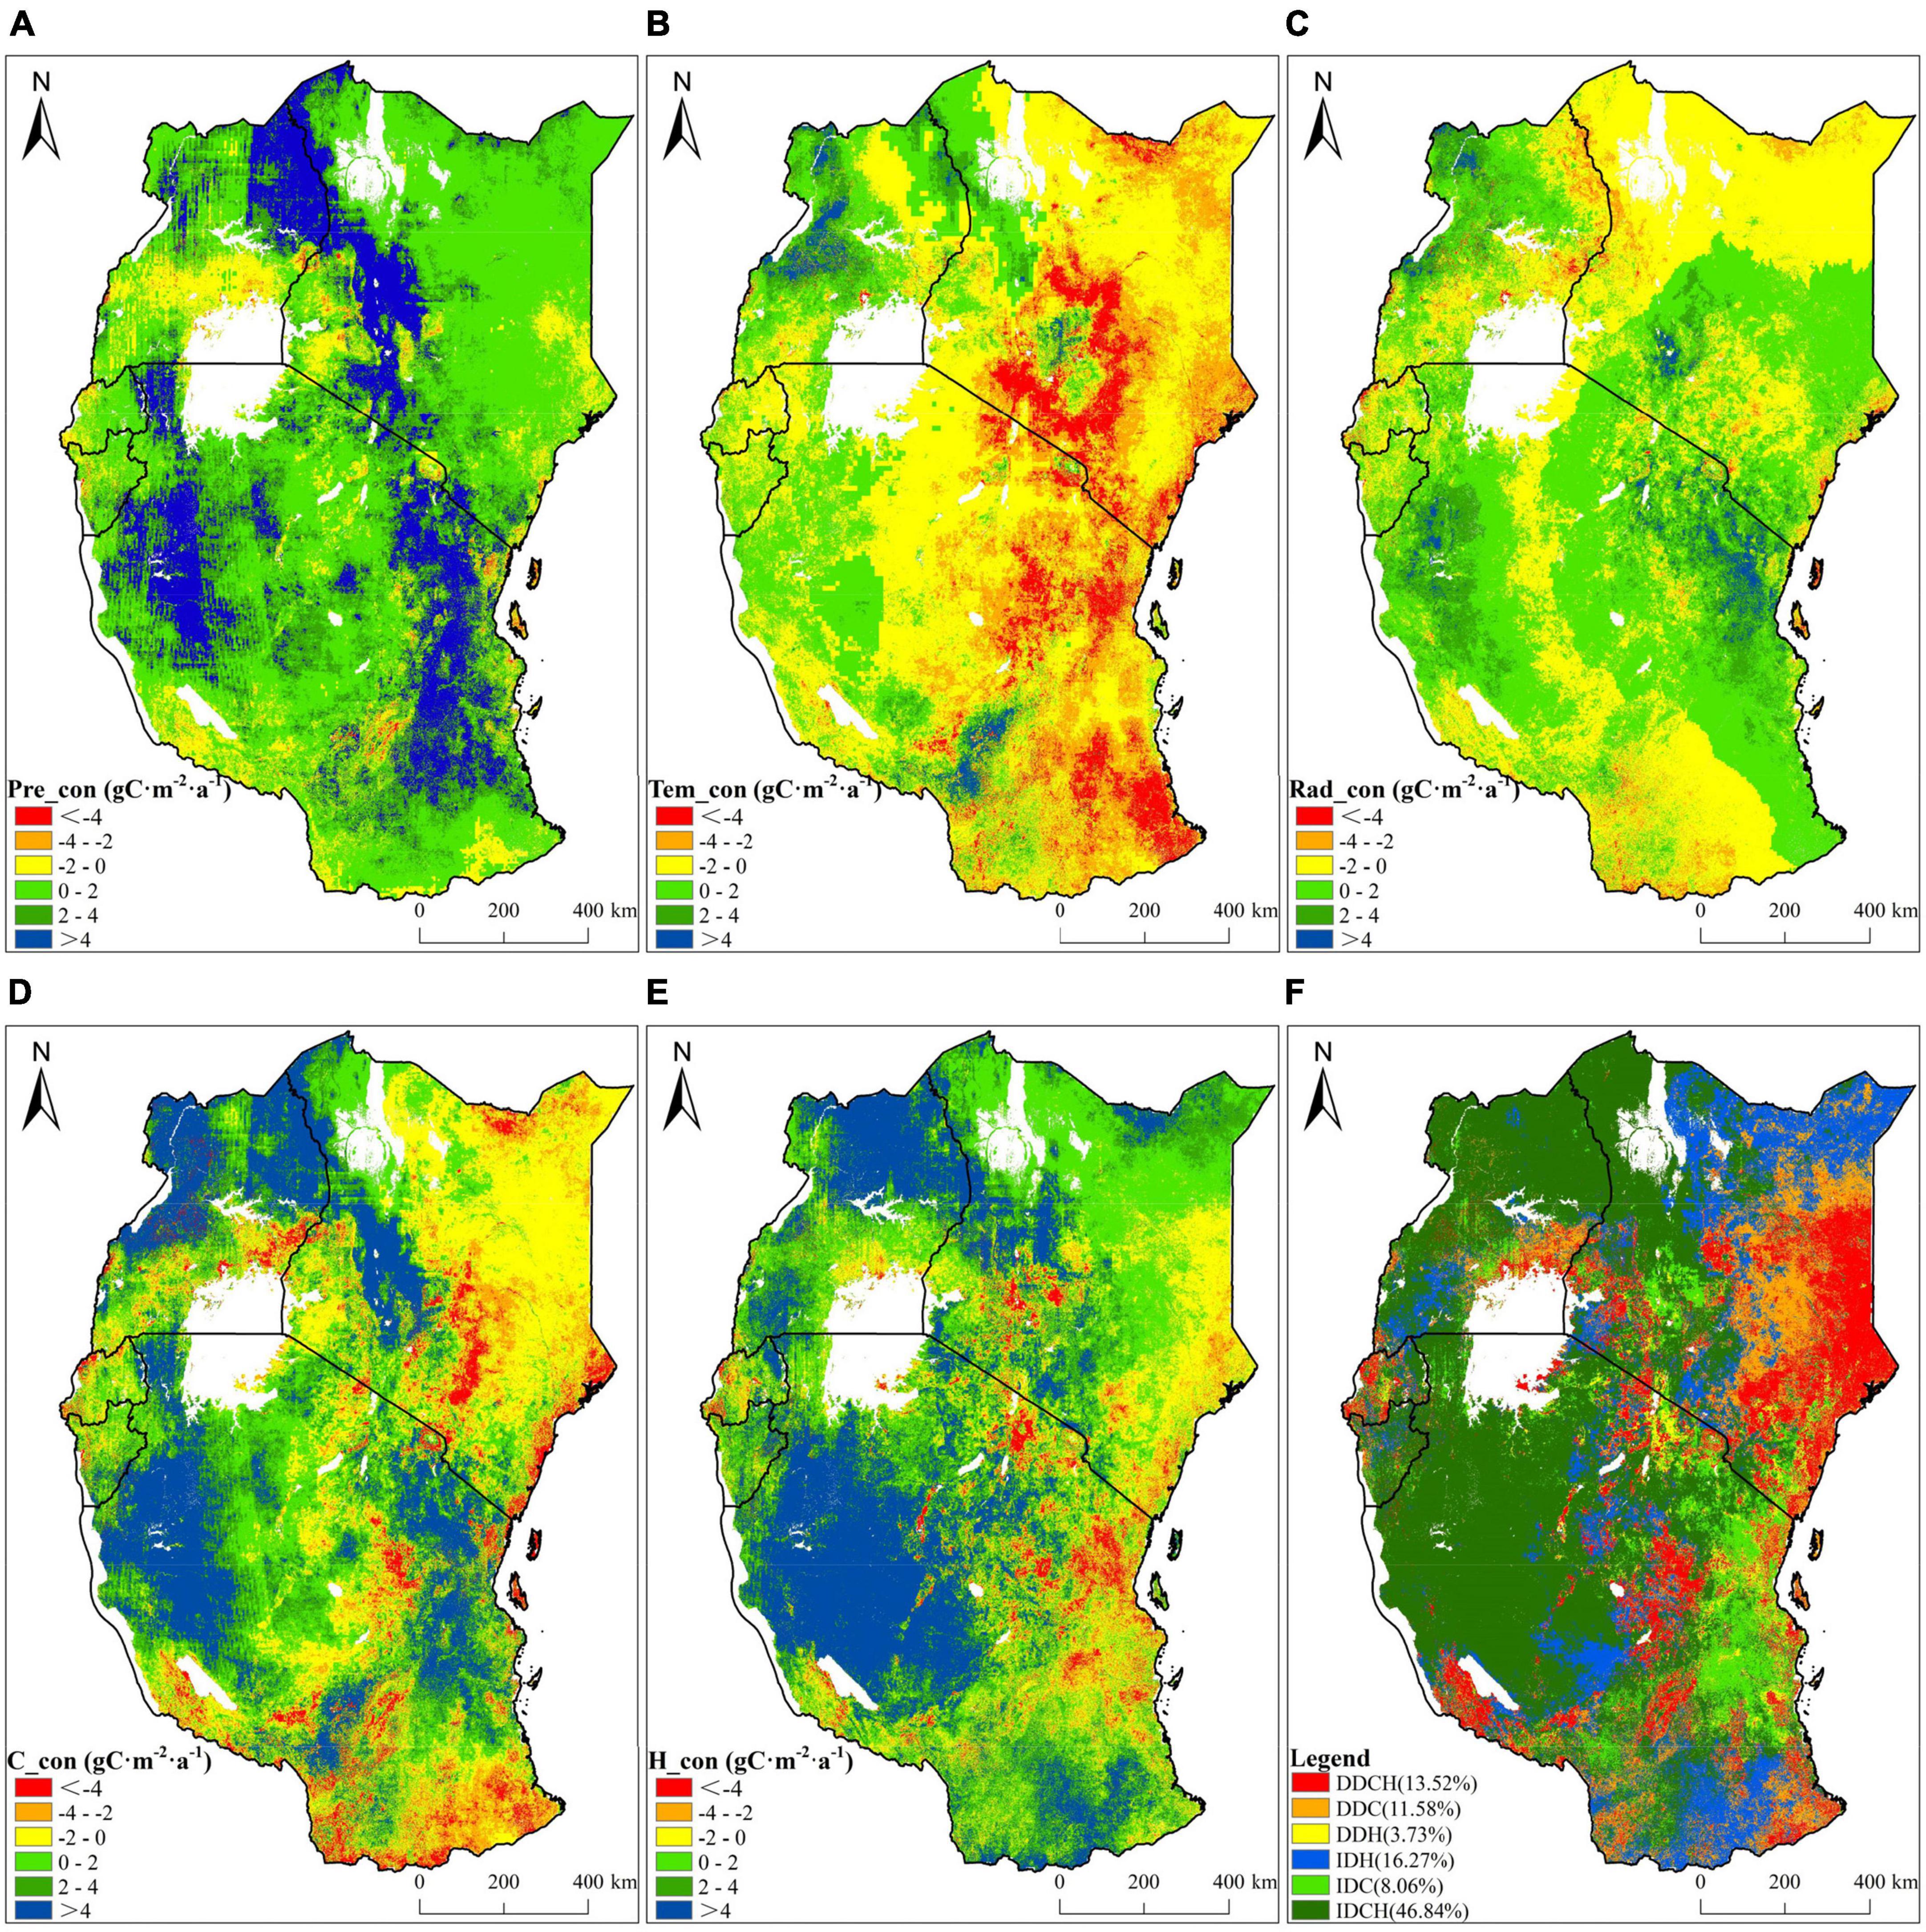
Figure 8. Spatial distribution of relative contributions of climate and anthropogenic activities to NPP changes, including (A) precipitation, (B) temperature, (C) solar radiation, (D) climate factors, (E) human activities, and (F) relative impacts of climate change and human activities.
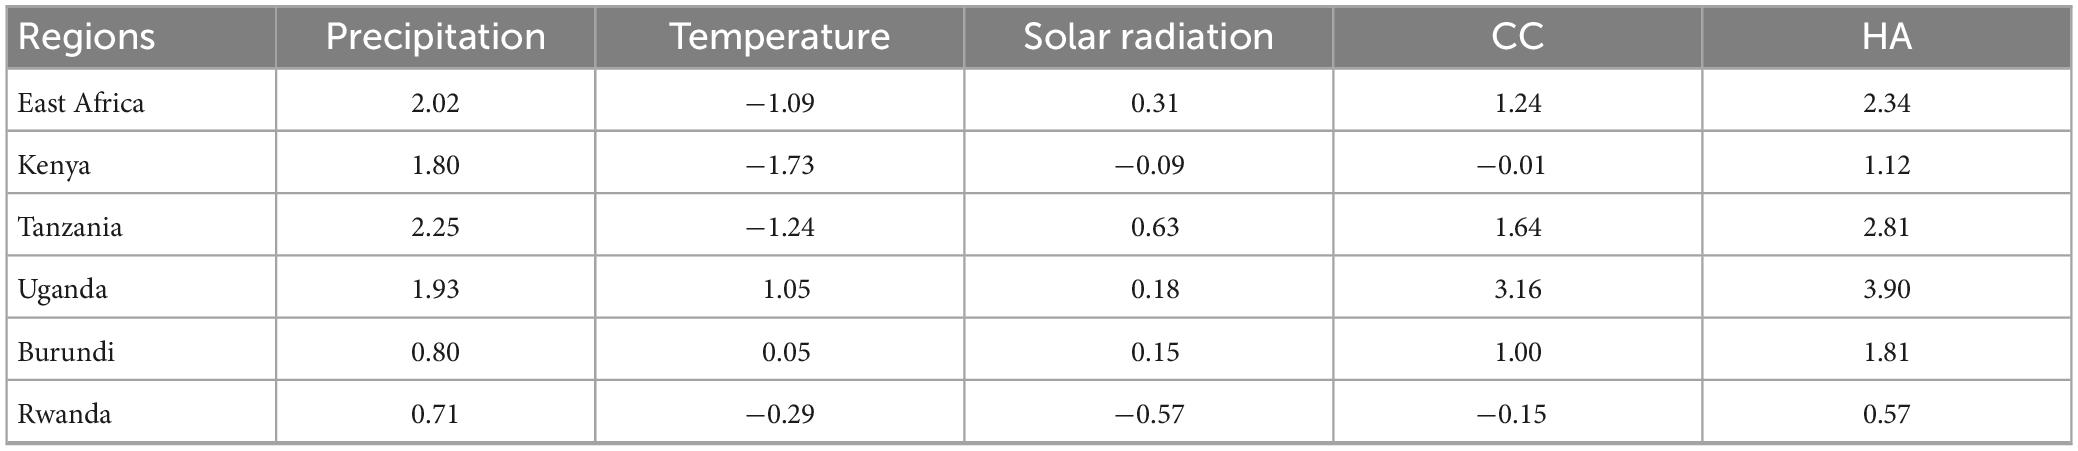
Table 2. Statistical analysis of the contributions of climatic and human factors to NPP changes (g C⋅m–2⋅a–1).
In addition to climatic factors, anthropogenic disturbances to vegetation dynamics cannot be ignored. The cumulative contributions of climate change and human factors to NPP trend were obtained (Figures 8D, E). The inter-annual growth rate of vegetation NPP was 3.58 g C⋅m–2⋅a–1, with a contribution of 1.24 g C⋅m–2⋅a–1 from climate change and 2.34 g C⋅m–2⋅a–1 from human activities (Table 2). It can be seen that human activities and climate change are jointly contributing to the trend of vegetation greening in East Africa, and that the contribution of human activities (65.36%) is higher than that of climate change (34.64%). Human activities contributed positively to NPP changes in most of East Africa, with the largest positive contribution concentrated in western Tanzania and northern Uganda. Moreover, human activities made a strong negative contribution to NPP changes in northern and eastern Tanzania, southwestern and southeastern Kenya, and western Rwanda (Figure 8E).
On the basis of the different scenarios designed in Table 1, the relative impacts of climate change and human activities to NPP changes were assessed (Figures 8F, 9). Increased NPP due to the combined contribution of human activities and climate change accounted for 46.84% of the study area, primarily in western and northern Tanzania, northern Uganda, and midwestern and northern Kenya. Areas with vegetation NPP increase promoted by human activities accounted for 16.27% of the total study area, and mainly distributed in northeastern and southwestern Kenya, southwestern Uganda, and southern Tanzania. The regions with vegetation NPP increase induced by climate change accounted for 8.06% of the total study area, which mainly located in eastern Tanzania and midwestern Kenya. For NPP decrease, the climate-dominated NPP decreased area occupied 11.58% of the total study area, and 13.52% of the study area was induced by the combined effects of the climatic and human factors, which mostly distributed in eastern and southwestern Kenya, eastern and central Uganda, western Rwanda, and northern, western, and central Tanzania. Human-dominated NPP decrease occupied an area of 3.73% of the study area, which mostly occurred in northern and eastern Tanzania, central Uganda, southern Rwanda, and southeastern Kenya (Figure 8F).
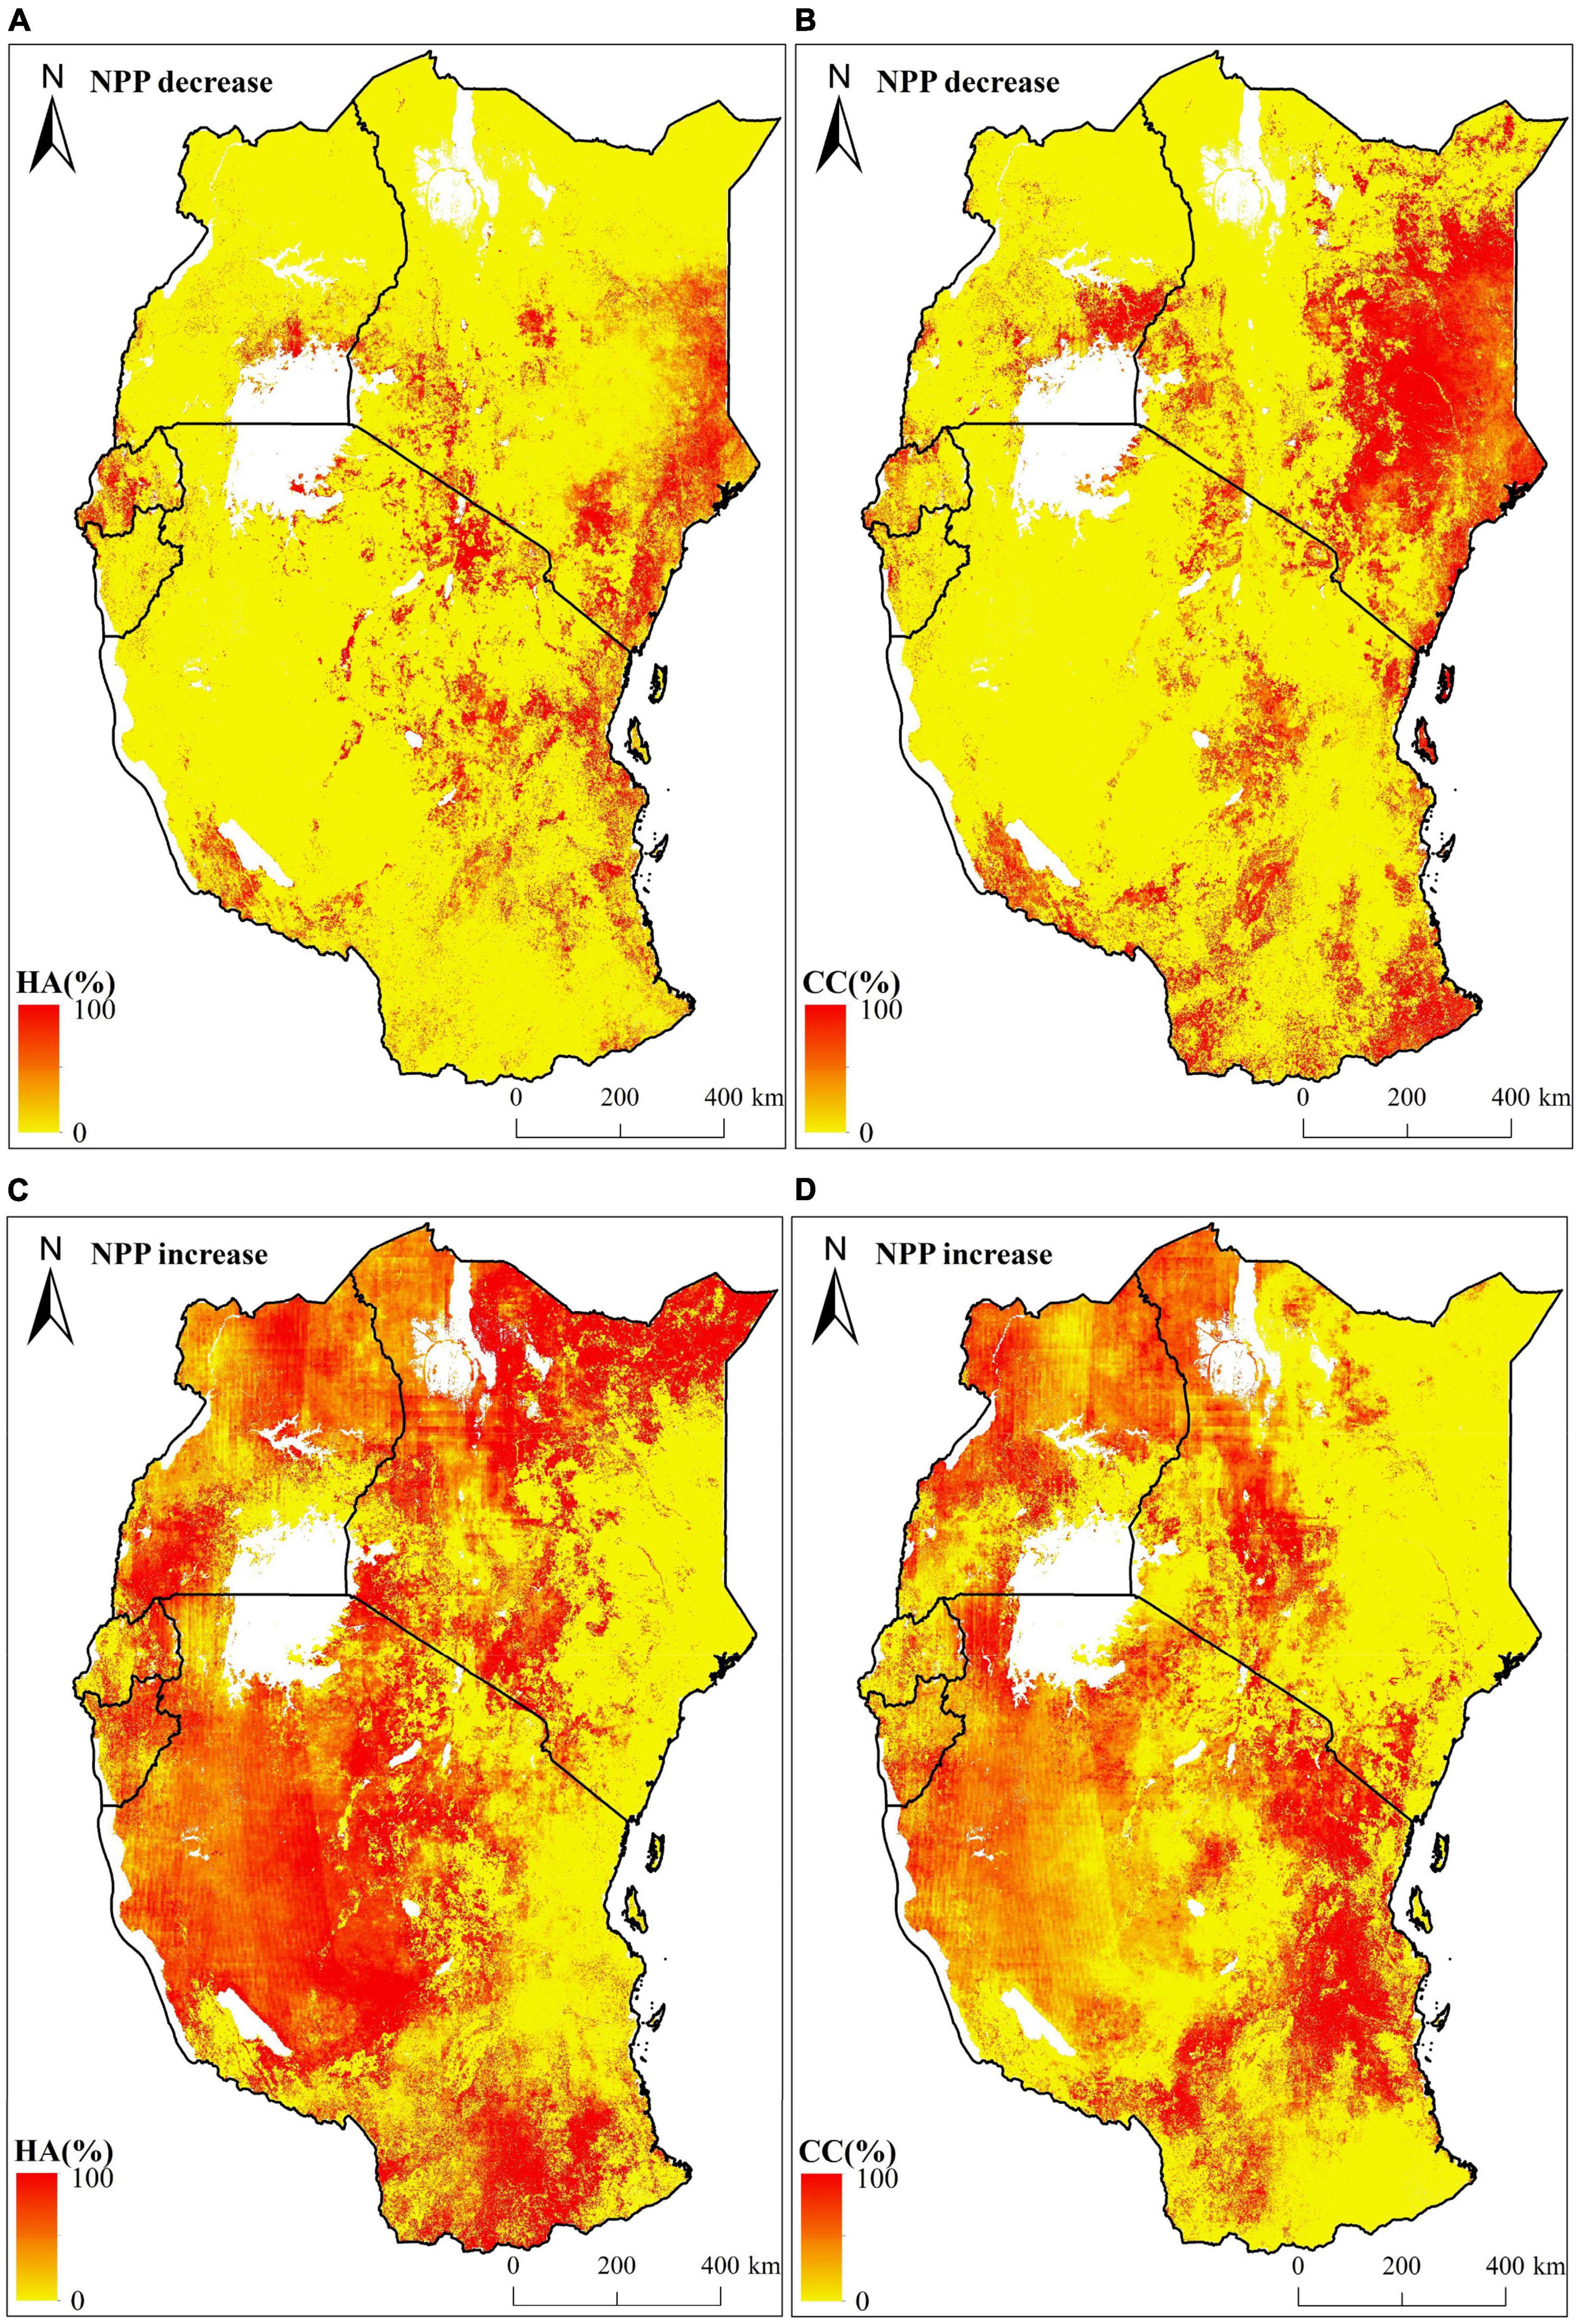
Figure 9. Spatial distribution of the contribution rates of (A,C) human activities (HA) and (B,D) climate change (CC) to NPP changes.
Figure 9 shows the contribution rates of climate change and human activities to NPP changes. The contribution rate to NPP increase of human activities (59.60%) was larger than that of climate change (40.40%) in East Africa. For NPP decrease, the contribution rate of climate change (67.48%) was larger than that of human activities (32.52%). Overall, human activities were the dominant factor affecting the NPP increase, while climate change was the dominant factor in the decrease of NPP.
The inter-annual variation in NPP observed in this study may be the result of the combined effects of climate change and human activities. The vegetation NPP in East Africa significantly increased by 4.16 g C/m2/a over the past 21 years, confirming an improvement in vegetation growth of East Africa (Tong et al., 2019). And the spatiotemporal heterogeneity could be found across East Africa. For instance, NPP in parts of the regions (mainly in northern Uganda, western Tanzania, and midwestern Kenya) significantly increased since increased precipitation and some positive human activities such as afforestation and agricultural technology (Gebrechorkos et al., 2020; Akinyemi and Speranza, 2022). This result is consistent with Ugbaje et al. (2017) and Tong et al. (2019) who found that NPP significantly increased in northern Uganda and midwestern Kenya from 2000 to 2014 and 2000 to 2015, respectively. Vegetation NPP was observed significantly decreased in eastern Kenya, central Uganda, and western Tanzania, which is inconsistent with Ugbaje et al. (2017). The inconsistency is probably because of time lag effect due to the differences in time intervals in this study (2000–2020) compared to Ugbaje et al. (2017) – 2000–2014.
Climate change is undoubtedly a critical factor in vegetation variation. Studies have shown that the most important climatic factors affecting vegetation productivity are precipitation, temperature, and solar radiation (Teng et al., 2020; Ge et al., 2021). According to the results of the study, these three climate factors all affect the vegetation NPP changes in East Africa, which is also consistent with previous studies (Jones et al., 2018; Measho et al., 2022). However, these contributions vary spatially. The responses of vegetation NPP to climate variables are likely to vary depending on the combinations of thermal condition and moisture availability (Liu et al., 2019b). Due to the complex topography and circulation, the distribution of precipitation in Africa is spatially different, resulting in uneven dry and wet conditions (Guo et al., 2022). In Figures 6A, 8A, precipitation is the main climatic factor affecting the growth of vegetation in arid and semi-arid regions, such as northern Kenya and western Tanzania. Nevertheless, higher temperatures have been found to inhibit vegetation growth in these regions (Figures 6B, 8B). This could be due to the fact that in arid and semi-arid areas where water is the most crucial factor for vegetation growth, increased temperatures may promote stronger evaporation, exacerbate drought stress, and lead to degradation of vegetation (Luo et al., 2018). These findings are consistent with the previous studies (Liu et al., 2019b; Tong et al., 2019; Umuhoza et al., 2023). Our results were also consistent with the study by Bai et al. (2008), which pointed out that grassland aboveground NPP was positively correlated with precipitation and increased significantly with increasing precipitation across grassland ecosystems in arid and semiarid ecosystems. The negative correlation between NPP and precipitation is predominantly distributed in the vicinity of Lake Victoria, Lake Kivu, and Lake Rukwa, where water resources are abundant and water availability is no longer the major constraint to vegetation development. Yet, higher levels of precipitation can lead to a decrease in both sunshine hours and solar radiation, which hinders vegetation photosynthesis and diminishes productivity (Ge et al., 2021). This is consistent with Schuur et al. (2001), who found that surplus precipitation could induce the decrease of solar radiation inputs and shortage of soil oxygen availability, which may decrease NPP in humid areas. Vegetation NPP and temperature are significantly positively correlated in central and western Uganda, southern and southwestern Tanzania, and surrounding areas of Mount Kenya and Kilimanjaro, where temperature acts as a constraint on vegetation growth in this area. Rising temperatures promote vegetation growth and lead to extended growth seasons, resulting in the accumulation of dry matter in these regions (Bai et al., 2020; Li et al., 2021). Liang et al. (2015) analyzed the impact of climate variability on NPP dynamics in China and similarly found that vegetation NPP controlled by temperature was mainly observed in regions where vegetation growth might be non-restricted by water availability. This is consistent with Pan et al. (2015) who found that the dominant driving climate factor for NPP variations varies among various regions in Africa.
In recent years, the impact of human activities on vegetation changes has gradually increased (Ge et al., 2021). Therefore, it is crucial to precisely measure the impact of human activities on changes in vegetation. Similar to climate change, the effects of human activities on vegetation change are spatially heterogeneous. Human activities displayed significant positive effects on NPP changes in western and northwestern Tanzania, northern and southwestern Uganda, eastern Rwanda, and midwestern Kenya, indicating that farming, afforestation, and biodiversity conservation had favorable effects on vegetation growth (Bullock et al., 2021; Akinyemi and Speranza, 2022). This is consistent with the findings of Akinyemi and Speranza (2022) who found that reforestation was carried out in Tanzania, northern Uganda and Rwanda. Areas where human activities negatively impacted vegetation NPP were mainly found in the northern, southwestern, and eastern Tanzania and southwestern and southeastern Kenya. These effects are potentially due to deforestation, overgrazing, and construction land expansion (Ugbaje et al., 2017; Lunyolo et al., 2021). Chen et al. (2022) found that shifting agriculture and commodity-driven deforestation were preeminent in Sub-Saharan Africa. Abera et al. (2022) found that Kenya meets more than 70% of the national energy needs by clearing forests for wood fuel. In this research, climate change and human activities contributed 40.40% and 59.60%, respectively, to vegetation NPP increase in East Africa. The spatial distribution of the relative contributions of climate change and human activities is inconsistent with the findings of Tong et al. (2019). The reason for this may be because Tong et al. (2019) only focused on grassland, while this study focused on all vegetation types. In addition, Tong et al. (2019) calculated Potential NPP through Thornthwaite memorial model, which may bring certain uncertainties. Zhang and Huang (2019) suggested that anthropogenic disturbances had a stronger impact on global vegetation dynamics compared to climate change. This is in line with the widely accepted consensus that anthropogenic disturbances significantly affect the ecology of Earth’s surface (IPCC, 2021; Li et al., 2021).
This study still has some shortcomings, which come from the data and method. The NPP data used in this study come from remote sensing data. Although this dataset is the latest version of MODIS data, it is still the indirect remote sensing data for model simulation. The input variables of the model will bring uncertainty to the data set, which may affect the results of this study (Pan et al., 2021; Bejagam and Sharma, 2022; Ma et al., 2022). Climate data used in this study come from the CHIRPS dataset, ERA5-Land analysis dataset, and TerraClimate dataset, which have low spatial resolution, which can also have an impact on the findings of this study (Shen et al., 2022; Xuan and Rao, 2023). The partial derivative method simplifies the nonlinear relationship between NPP and impact factors into a linear relationship, but disregards the intricate interplays between climate change and human activities, thus compromising the accuracy of the study (Chen et al., 2020; Bejagam and Sharma, 2022). The effects of climate on vegetation are also complex, and this article ignores the time-lag and cumulative effects of climate factors (Liu et al., 2021; Gu et al., 2022). Setting the residual error to the anthropogenic effect on vegetation dynamics may ignore the effects of factors such as CO2 fertilization effects, nitrogen deposition and fires on vegetation productivity (Chen et al., 2020; Qu et al., 2020). Moreover, the impacts of human activities were considered as a whole in this study. Nevertheless, it remains crucial to quantify the effects of various human activities (Pei et al., 2021; Gu et al., 2022).
This study analyzed the spatiotemporal changes in vegetation NPP across East Africa from 2000 to 2020 and quantified the responses of different driving factors to the vegetation dynamics.
Temporally, the average NPP showed a fluctuating upward trend at a rate of 4.16 g C/m2/a. Spatially, the average NPP exhibited obvious spatial heterogeneity, and the distribution in Kenya is the most uneven, followed by Tanzania. The spatial distribution pattern of the NPP variation coefficient was similar to that of the NPP mean, with the higher the mean value, the more stable it is. 71.06% of the study area indicated an increasing trend in vegetation NPP, and 31.44% of which reaching a statistically significant level. The median partial correlation coefficients of vegetation NPP with precipitation, temperature, and solar radiation were 0.32, −0.2, and −0.02, respectively. Vegetation NPP exhibited a prevalent positive correlation with precipitation within 83.26% of the study area. Conversely, NPP was mainly negatively correlated with temperature (71.95%). The correlation between NPP and solar radiation was not significant in the vast majority of the regions (93.71%).
The contributions of precipitation, temperature, and solar radiation to the inter-annual trend of NPP were 2.02, −1.09, and 0.31 g C/m2/a, respectively. Precipitation exerted the most significant impact on the inter-annual variation of NPP, being the dominant climate factor. Climate change and human activities contributed 1.24 and 2.34 g C/m2/a to the inter-annual variation of NPP, respectively. Human activities (59.60%) contributed more toward vegetation NPP increase than climate change (40.40%) in East Africa, while climate change (67.48%) predominantly caused vegetation NPP decrease compared with human activities (32.52%). These findings can provide new evidence for the in-depth understanding of ecosystem stability and carbon cycle in East Africa, and can also provide decision-making reference and scientific assistance for biodiversity conservation and ecological environment protection in East Africa.
The original contributions presented in this study are included in this article/supplementary material, further inquiries can be directed to the corresponding author.
MX: Conceptualization, Data curation, Investigation, Methodology, Software, Writing – original draft, Writing – review & editing. ZZ: Funding acquisition, Supervision, Writing – review & editing. YW: Validation, Writing – review & editing. BL: Validation, Writing – review & editing.
The author(s) declare financial support was received for the research, authorship, and/or publication of this article. This work was supported by the National Key Research and Development Plan, Ministry of Science and Technology of China (MSTC), People’s Republic of China (Grant No. 2018YFE0105900), and Youth Fund of National Natural Science Foundation Projects (42301227).
The authors declare that the research was conducted in the absence of any commercial or financial relationships that could be construed as a potential conflict of interest.
All claims expressed in this article are solely those of the authors and do not necessarily represent those of their affiliated organizations, or those of the publisher, the editors and the reviewers. Any product that may be evaluated in this article, or claim that may be made by its manufacturer, is not guaranteed or endorsed by the publisher.
Abera, T. A., Heiskanen, J., Maeda, E. E., Hailu, B. T., and Pellikka, P. K. E. (2022). Improved detection of abrupt change in vegetation reveals dominant fractional woody cover decline in Eastern Africa. Remote Sens. Environ. 271:112897.
Akinyemi, F. O., and Speranza, C. I. (2022). Agricultural landscape change impact on the quality of land: An African continent-wide assessment in gained and displaced agricultural lands. Int. J. Appl. Earth Obs. 106:102644.
Alvarado, R., Tillaguango, B., Dagar, V., Ahmad, M., Isık, C., Mendez, P., et al. (2021). Ecological footprint, economic complexity and natural resources rents in Latin America: empirical evidence using quantile regressions. J. Clean. Prod. 318:128585.
Ayugi, B., Dike, V., Ngoma, H., Babaousmail, H., Mumo, R., and Ongoma, V. (2021a). Future changes in precipitation extremes over East Africa based on CMIP6 models. Water 13:2358.
Ayugi, B., Ngoma, H., Babaousmail, H., and Karim, R. (2021b). Evaluation and projection of mean surface temperature using CMIP6 models over East Africa. J. Afr. Earth Sci. 181:104226.
Bai, Y., Wu, J., Xing, Q., Pan, Q., Huang, J., Yang, D., et al. (2008). Primary production and rain use efficiency across a precipitation gradient on the Mongolia Plateau. Ecology 89, 2140–2153. doi: 10.1890/07-0992.1
Bai, Y. F., Guo, C. C., Degen, A. A., Ahmad, A. A., Wang, W. Y., Zhang, T., et al. (2020). Climate warming benefts alpine vegetation growth in Three-River Headwater Region, China. Sci. Total Environ. 742:140574. doi: 10.1016/j.scitotenv.2020.140574
Bejagam, V., and Sharma, A. (2022). Impact of climatic changes and anthropogenic activities on ecosystem net primary productivity in India during 2001–2019. Ecol. Inform. 70:101732.
Bullock, E. L., Healey, S. P., Yang, Z., Oduor, P., Gorelick, N., Omondi, S., et al. (2021). Three decades of land cover change in East Africa. Land 10, 1–15.
Cao, D., Zhang, J., Zhang, T., and Yao, F. (2023). Spatiotemporal variations and driving factors of global terrestrial vegetation productivity gap under the changing of climate, CO2, landcover and N deposition. Sci. Total Environ. 880:162753. doi: 10.1016/j.scitotenv.2023.162753
Caputo, J., Beier, C. M., Groffman, P. M., Burns, D. A., and Beall, F. D. (2016). Effects of harvesting forest biomass on water and climate regulation services: A synthesis of long-term ecosystem experiments in eastern North America. Ecosystems 19, 271–283.
Chen, J., Shao, Z., Huang, X., Zhuang, Q., Dang, C., Cai, B., et al. (2022). Assessing the impact of drought-land cover change on global vegetation greenness and productivity. Sci. Total Environ. 852:158499. doi: 10.1016/j.scitotenv.2022.158499
Chen, T., Bao, A., Jiapaer, G., Guo, H., Zheng, G., Jiang, L., et al. (2019). Disentangling the relative impacts of climate change and human activities on arid and semiarid grasslands in Central Asia during 1982–2015. Sci. Total Environ. 653, 1311–1325. doi: 10.1016/j.scitotenv.2018.11.058
Chen, T., Tang, G., Yuan, Y., and Guo, H. (2020). Unraveling the relative impacts of climate change and human activities on grassland productivity in Central Asia over last three decades. Sci. Total Environ. 743:140649. doi: 10.1016/j.scitotenv.2020.140649
Ge, W., Deng, L., Wang, F., and Han, J. (2021). Quantifying the contributions of human activities and climate change to vegetation net primary productivity dynamics in China from 2001 to 2016. Sci. Total Environ. 773:145648. doi: 10.1016/j.scitotenv.2021.145648
Gebrechorkos, S. H., Hülsmann, S., and Bernhofer, C. (2020). Analysis of climate variability and droughts in East Africa using highresolution climate data products. Glob. Planet Change 186:103130.
Gu, Y., Pang, B., Qiao, X., and Xu, D. (2022). Vegetation dynamics in response to climate change and human activities in the Hulun Lake basin from 1981 to 2019. Ecol. Indic. 136:108700.
Guo, X., Zhang, Z., Zhang, X., Bi, M., and Das, P. (2022). Landscape vulnerability assessment driven by drought and precipitation anomalies in sub-Saharan Africa. Environ. Res. Lett. 18:064035.
Haile, G. G., Tang, Q., Hosseini-Moghari, S. M., and Liu, X. (2020). Projected impacts of climate change on drought patterns over East Africa. Earth Future 8:e2020EF001502. doi: 10.1038/s41598-023-44115-5
IPCC (2021). Climate Change 2021: the Physical Science Basis, the Working Group I Contribution to the Sixth Assessment Report. Geneva: IPCC.
Jiang, H., Xu, X., Guan, M., Wang, L., Huang, Y., and Jiang, Y. (2020). Determining the contributions of climate change and human activities to vegetation dynamics in agro-pastural transitional zone of northern China from 2000 to 2015. Sci. Total Environ. 718:134871. doi: 10.1016/j.scitotenv.2019.134871
Jones, M. O., Running, S. W., Kimball, J. S., Robinson, N. P., and Allred, B. W. (2018). Terrestrial primary productivity indicators for inclusion in the National Climate Indicators System. Clim. Change 163, 1855–1868. doi: 10.1002/eap.1768
Kalisa, W., Igbawua, T., Henchiri, M., and Ali, S. (2019). Assessment of climate impact on vegetation dynamics over East Africa from 1982 to 2015. Sci. Rep. 9:16865. doi: 10.1038/s41598-019-53150-0
Kimani, M. W., Hoedjes, J. C. B., and Su, Z. (2017). An assessment of satellite-derived rainfall products relative to ground observations over East Africa. Remote Sens. 9:430.
Li, Y., Zheng, Z., Qin, Y., and Rong, P. (2021). Relative contributions of natural and man-made factors to vegetation cover change of environmentally sensitive and vulnerable areas of China. J. Clean. Prod. 321:128917.
Liang, W., Yang, Y., Fan, D., Guan, H., Zhang, T., Long, D., et al. (2015). Analysis of spatial and temporal patterns of net primary production and their climate controls in China from 1982 to 2010. Agric. For. Meteorol. 204, 22–36.
Liu, H., Jiao, F., Yin, J., Li, T., Gong, H., Wang, Z., et al. (2020). Nonlinear relationship of vegetation greening with nature and human factors and its forecast – A case study of Southwest China. Ecol. Indic. 111:106009.
Liu, N., Ding, Y., and Peng, S. (2021). Temporal effects of climate on vegetation trigger the response biases of vegetation to human activities. Glob. Ecol. Conserv. 31:e01822.
Liu, X., Pei, F., Wen, Y., Li, X., Wang, S., Wu, C., et al. (2019a). Global urban expansion offsets climate-driven increases in terrestrial net primary productivity. Nat. Commun. 10:5558. doi: 10.1038/s41467-019-13462-1
Liu, Y., Yang, Y., Wang, Q., and Du, X. (2019b). Evaluating the responses of net primary productivity and carbon use efficiency of global grassland to climate variability along an aridity gradient. Sci. Total Environ. 652, 671–682. doi: 10.1016/j.scitotenv.2018.10.295
Liu, Y., Liu, H., Chen, Y., Gang, C., and Shen, Y. (2022). Quantifying the contributions of climate change and human activities to vegetation dynamic in China based on multiple indices. Sci. Total Environ. 838:156553. doi: 10.1016/j.scitotenv.2022.156553
Lunyolo, L. D., Khalifa, M., and Ribbe, L. (2021). Assessing the interaction of land cover/land use dynamics, climate extremes and food systems in Uganda. Sci. Total Environ. 753:142549. doi: 10.1016/j.scitotenv.2020.142549
Luo, Z., Wu, W., Yu, X., Song, Q., Yang, J., Wu, J., et al. (2018). Variation of net primary production and its correlation with climate change and anthropogenic activities over the Tibetan plateau. Remote Sens. 10:1352.
Ma, B., Jing, J., Liu, B., Wang, Y., and He, H. (2023). Assessing the contribution of human activities and climate change to the dynamics of NPP in ecologically fragile regions. Glob. Ecol. Conserv. 42:e02393.
Ma, R., Xia, C., Liu, Y., Wang, Y., Zhang, J., Shen, X., et al. (2022). Spatiotemporal change of net primary productivity and its response to climate change in temperate grasslands of China. Front. Plant Sci. 13:899800. doi: 10.3389/fpls.2022.899800
Measho, S., Chen, B., Pellikka, P., Guo, L., Zhang, H., Cai, D., et al. (2022). Assessment of vegetation dynamics and ecosystem resilience in the context of climate change and drought in the horn of Africa. Remote Sens. 13:1668.
Pan, N., Wang, S., Liu, Y., Hua, T., Zhang, J., and Fu, B. (2021). Quantifying responses of net primary productivity to agricultural expansion in drylands. Land. Degrad. Dev. 32, 2050–2060.
Pan, S., Dangal, S. R. S., Tao, B., Yang, J., and Tian, H. (2015). Recent patterns of terrestrial net primary production in Africa influenced by multiple environmental changes. Ecosyst. Health Sust. 1:18.
Pan, T., Zou, X., Liu, Y., Wu, S., and He, G. (2017). Contributions of climatic and non-climatic drivers to grassland variations on the Tibetan Plateau. Ecol. Eng. 108, 307–317.
Pei, H. W., Liu, M. Z., Jia, Y. G., Zhang, H. J., Li, Y. L., and Xiao, Y. X. (2021). The trend of vegetation greening and its drivers in the Agro-pastoral ecotone of northern China, 2000–2020. Ecol. Indic. 129:108004.
Qu, S., Wang, L., Lin, A., and Yu, D. (2020). Distinguishing the impacts of climate change and anthropogenic factors on vegetation dynamics in the Yangtze River Basin, China. Ecol. Indic. 108:105724.
Schuur, E. A. G., Chadwick, O. A., and Matson, P. A. (2001). Carbon cycling and soil carbon storage in mesic to wet Hawaiian montane forests. Ecology 82, 3182–3196.
Shen, X., Liu, Y., Zhang, J., Wang, Y., Ma, R., Liu, B., et al. (2022). Asymmetric impacts of diurnal warming on vegetation carbon sequestration of marshes in the Qinghai Tibet Plateau. Global Biogeochem. Cy. 36:e2022GB007396.
Song, Y., Jiao, W., Wang, J., and Wang, L. (2022). Increased global vegetation productivity despite rising atmospheric dryness over the last two decades. Earth Future 10, 1–16.
Teng, M., Zeng, L., Hu, W., and Wang, P. (2020). The impacts of climate changes and human activities on net primary productivity vary across an ecotone zone in Northwest China. Sci. Total Environ. 714:136691. doi: 10.1016/j.scitotenv.2020.136691
Tong, L., Liu, Y., Wang, Q., and Zhang, Z. (2019). Relative effects of climate variation and human activities on grassland dynamics in Africa from 2000 to 2015. Ecol. Inform. 53:100979.
Ugbaje, S. U., Odeh, I. O., Bishop, T. F. A., and Li, J. (2017). Assessing the spatio-temporal variability of vegetation productivity in Africa: quantifying the relative roles of climate variability and human activities. Int. J. Digit Earth 10, 879–900.
Umuhoza, J., Jiapaer, G., Tao, Y., Jiang, L., Zhang, L., Gasirabo, A., et al. (2023). Analysis of fluctuations in vegetation dynamic over Africa using satellite data of solar-induced chlorophyll fluorescence. Ecol. Indic. 146:109846.
Wei, X., Yang, J., Luo, P., and Lin, L. (2022). Assessment of the variation and influencing factors of vegetation NPP and carbon sink capacity under different natural conditions. Ecol. Indic. 138:108834.
Wu, D., Piao, S., Zhu, D., Wang, X., Ciais, P., Bastos, A., et al. (2020). Accelerated terrestrial ecosystem carbon turnover and its drivers. Glob. Chang. Biol. 26, 5052–5062.
Xuan, W., and Rao, L. (2023). Spatiotemporal dynamics of net primary productivity and its influencing factors in the middle reaches of the Yellow River from 2000 to 2020. Front. Plant Sci. 14:1043807. doi: 10.3389/fpls.2023.1043807
Yan, Y., Liu, X., Wen, Y., and Ou, J. (2019). Quantitative analysis of the contributions of climatic and human factors to grassland productivity in northern China. Ecol. Indic. 103, 542–553.
Yang, S., Liu, J., Wang, C., Zhang, T., Dong, X., and Liu, Y. (2022). Vegetation dynamics influenced by climate change and human activities in the Hanjiang River Basin, central China. Ecol. Indic. 145:109586.
Yin, L., Dai, E., Zheng, D., Wang, Y., Ma, L., and Tong, M. (2020). What drives the vegetation dynamics in the Hengduan Mountain region, southwest China: Climate change or human activity? Ecol. Indic. 112:106013.
Zhang, X. L., and Huang, X. R. (2019). Human disturbance caused stronger influences on global vegetation change than climate change. PeerJ 7:e7763. doi: 10.7717/peerj.7763
Zhang, Y., Zhang, C., Wang, Z., Chen, Y., Gang, C., An, R., et al. (2016). Vegetation dynamics and its driving forces from climate change and human activities in the Three-River Source Region, China from 1982 to 2012. Sci. Total Environ. 564, 210–220. doi: 10.1016/j.scitotenv.2016.03.223
Zhou, J., Jia, L., Menenti, M., Hoek, M., Lu, J., Zheng, C., et al. (2021). Characterizing vegetation response to rainfall at multiple temporal scales in the Sahel-Sudano-Guinean region using transfer function analysis. Remote Sens. Environ. 252:112108.
Keywords: net primary productivity, climate change, human activities, attribution analysis, East Africa
Citation: Xu M, Zhang Z, Wang Y and Liu B (2024) Quantifying the contributions of climatic and human factors to vegetation net primary productivity dynamics in East Africa. Front. For. Glob. Change 6:1332631. doi: 10.3389/ffgc.2023.1332631
Received: 03 November 2023; Accepted: 11 December 2023;
Published: 05 January 2024.
Edited by:
Yan Li, Nanjing Forestry University, ChinaReviewed by:
Xiangjin Shen, Chinese Academy of Sciences (CAS), ChinaCopyright © 2024 Xu, Zhang, Wang and Liu. This is an open-access article distributed under the terms of the Creative Commons Attribution License (CC BY). The use, distribution or reproduction in other forums is permitted, provided the original author(s) and the copyright owner(s) are credited and that the original publication in this journal is cited, in accordance with accepted academic practice. No use, distribution or reproduction is permitted which does not comply with these terms.
*Correspondence: Zhenke Zhang, emhhbmd6a0BuanUuZWR1LmNu
Disclaimer: All claims expressed in this article are solely those of the authors and do not necessarily represent those of their affiliated organizations, or those of the publisher, the editors and the reviewers. Any product that may be evaluated in this article or claim that may be made by its manufacturer is not guaranteed or endorsed by the publisher.
Research integrity at Frontiers
Learn more about the work of our research integrity team to safeguard the quality of each article we publish.