 Jiaming Wang
 Heming Liu
 Qingsong Yang
 Guochun Shen
 Xuyang Zhu
95% of researchers rate our articles as excellent or good
Learn more about the work of our research integrity team to safeguard the quality of each article we publish.
Find out more
ORIGINAL RESEARCH article
Front. For. Glob. Change , 06 December 2023
Sec. Forest Growth
Volume 6 - 2023 | https://doi.org/10.3389/ffgc.2023.1309660
This article is part of the Research Topic Response of Plant Functional Traits to Environments and Their Roles in Ecosystem Processes View all 8 articles
Forest functionality is generally considered a byproduct of forest diversity. Perhaps unsurprisingly, many researchers associate increasing multi-functionality with increasing diversity. Diversity, however, is an often-overused word that may describe a host of features, including the diversity of species, functional trait and structure. Furthermore, variable environmental features (such as topography) influence the interaction between forest plants and their function. Incorporating complex topography (like that associated with tropical and subtropical forests) into estimates of forest functionality is challenging and highly uncertain. In this paper, we applied structural equation models to disentangle the relative importance of topography and different components of what might be considered “plant diversity” to forest multifunctionality using repeated census of a 20-ha subtropical forest plot. We found that multifunctionality was principally influenced by structural diversity more so than either species composition or functional trait diversity. In our SEM model approach, we observed variations in topography could account for about 30% of variation in multifunctionality. Furthermore, variations in topography could indirectly influence forest multifunctionality by changing species composition, functional trait diversity, and structural diversity. Our work highlights the importance of topography and forest structure in regulating subtropical forest multifunctionality on the local scale. This suggests future subtropical forest management should focus on regulating forest structure. Namely, our results suggest land managers must take topography (and the complex interaction between topography and plant diversity) into account in order to build robust and multifunctional forests.
Every ecosystem provides multiple functions (Byrnes et al., 2014; Yuan et al., 2020). Many syntheses have emphasized the significance of plant diversity for maintaining ecosystem functioning, though a number of these syntheses limit their analysis to biomass or productivity as the sole functional response variable. This limited approach seriously hinders the understanding of the comprehensive characteristics of ecosystem functions (Ratcliffe et al., 2017; Garland et al., 2021; Chen et al., 2022). As we change our understanding of forests and become increasingly capable of quantitatively evaluating the multiple services each forest may provide, the concept of connection ecosystem “multifunctionality” to diversity has emerged (Hector and Bagchi, 2007; Felipe-Lucia et al., 2018; Jing and He, 2021).
Diversity itself, however, is a complex topic, which includes species diversity and composition, functional trait diversity and composition, and structural diversity (Gadow, 1999; Pommerening, 2002; Ali, 2019; Ali et al., 2019; Pommerening and Grabarnik, 2019; Schuldt et al., 2019; Yuan et al., 2020). Researchers have studied the connection between plant species diversity and ecosystem multifunctionality (Zavaleta et al., 2010; Jing et al., 2015) and the role functional diversity plays in supporting multifunctionality (Bagousse-Pinguet et al., 2019; Huang et al., 2019; van der Plas, 2019). In general, we suggest that net effect of species diversity on functionality relies on how specific species compositions or species trait combinations strongly influence ecosystem functions (selection effect; Loreau and Hector, 2001; Ali, 2017). As a result, some suggest that functional trait diversity may better predict ecosystem functions because communities with contrasting functional trait species increase the overall resource utilization through greater complementarity and weaken competition-complementary effects (van der Plas, 2019).
In addition, the structure of plant community can play an important role in maintaining forest multifunctionality (Yuan et al., 2020; Sanaei et al., 2021). In forests with high structural diversity, functionality might be improved through niche complementarity (such as the support of several different tree species which each occupy a unique range of light niches), on the other hand, however, functionality might also be reduced through competitive exclusion and a lack of niche complementarity – such as would be evidenced by increased light competition (Ali, 2019). Structural diversity of plant communities has been found to play both weaker and stronger roles in regulating multifunctionality than either the effect of species diversity or functional trait diversity—suggesting that each forest likely deals with its own unique constraints on functionality (Li et al., 2020; Yuan et al., 2020; Sanaei et al., 2021). Researches have disentangled the various influences of each form of diversity (species diversity, functional diversity, and structural diversity) on individual functions such as productivity (Forrester and Bauhus, 2016; Ren, 2021; Ren et al., 2021), though it remains unclear which plant diversity component is the major driver of ecosystem multifunctionality in forests.
To further complicate issues, diversity is powerfully influenced by topography in natural ecosystems (Ratcliffe et al., 2017; Yuan et al., 2020). Topography strongly influences microclimate and soil hydrology (Girardin et al., 2014; Jucker et al., 2018), and thus shapes environmental conditions on the local scale, which in turn influence plant growth, plant diversity, and, consequently, ecosystem function (Lin et al., 2012; Prado-Junior et al., 2016). For example, in valleys, forests tend to develop more complex structures due to strong competition in light, which leads to higher biomass and productivity, but lower regeneration (Ediriweera et al., 2008; Coomes et al., 2009; Prado-Junior et al., 2016; Ali, 2019). Similarly, however, a valley is also more predisposed to flooding or river formation, reducing the living space of plants, thus resulting in lower biomass, productivity and regeneration (Punchi-Manage et al., 2013; Xu et al., 2015; Guo et al., 2016). Even more specialized work has suggested that, more canopy gap is favorable for deciduous tree species in valleys, which may lead to higher nutrient stocks for trees which likely influence their individual and community level function (Xie et al., 2012; Tuo et al., 2019). Thus, identifying how topography affects forest multifunctionality is critical to understand the underlying mechanisms of forest multifunctionality. These studies indicate topography often has a positive effect on some functions, but has a negative on other functions. However, the effect of topography on forest multifunctionality remains far from clear.
Though subtropical forests have a global importance for providing key ecosystem services, most studies on multifunctionality have based on grassland ecosystems and temperate forests (Schuldt et al., 2018). While, previous studies showed subtropical forests are often with complex topography and have high plant diversity (Song et al., 2005; Ouyang et al., 2021). Therefore, we aim to explore how topography and different plant diversity components affect forest multifunctionality in a subtropical forest system, and link topography and different plant diversity components with forest multifunctionality (FM) using structural equation models (SEMs). We test two hypotheses: (1) structural diversity is more important for FM than species diversity/ composition or functional trait diversity; (2) topography has a nonnegligible effect on FM. Our study will provide useful guidance to subtropical forest restoration and management.
The study was performed in Tiantong National Forest Park (29°48′N, 121°47′E), which is typical of the subtropical evergreen broadleaved forests found in eastern China (Yang et al., 2011). We conducted our sampling work on a 20 ha (500 m × 400 m) permanent forest plot (hereafter called Tiantong plot) that was established in 2010. The region has a mean annual precipitation of 1374.7 mm, and a mean annual temperature is 16.2°C (Yang et al., 2016). Soils are varied in texture from sandy to a silty clay loam, and soil pH ranges from 4.4 to 5.1 (Song and Wang, 1995). The Tiantong plot is one component of broader the Forest Global Earth Observatory (ForestGEO) network.1
In 2010, the inaugural census of the plot identified 94,603 individuals with a stem diameter at breast height (DBH) ≥ 1 cm which belonged to 152 species, 94 genera and 51 families. The three dominant plant families represented at the site are Theaceae, Lauraceae, and Fagaceae (Yang et al., 2011). In 2015, a re-census of the plot was conducted. During the two censuses, scientists recorded 27,837 trees present in both censes with DBH ≥ 5 cm, 85,704 trees present in both censes with DBH between 1 and 5 cm, and 58,547 newly recruited trees (DBH did not reach 1 cm in the first census, but reached 1 cm in the re-census) were found. Following a standard field protocol (Condit, 1998), the 20-ha plot was divided into 500 subplots (20 × 20 m), in which the four corner elevations of each subplot were measured using a total station instrument. Then elevation of each subplot (ranging from 304.3 to 602.9 m; Figure 1) was the average of four corner elevations (Harms et al., 2001). The other two topographic variables, slope (ranging from 13.8° to 50.3°) and terrain convexity (ranging from −5.8 to 6.9 m), were estimated using the elevation data.
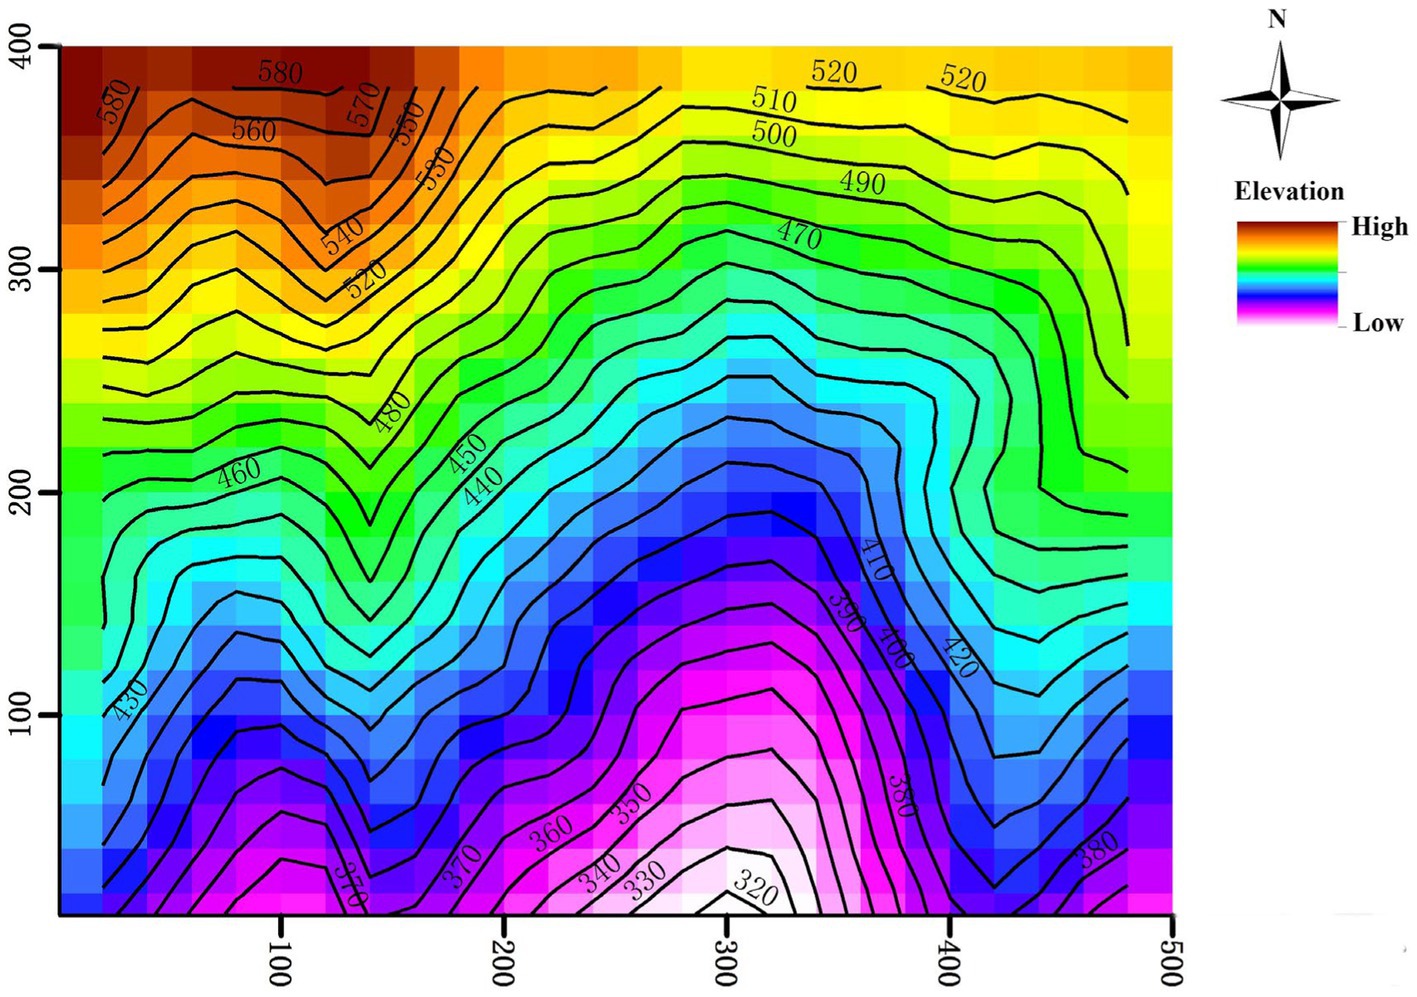
Figure 1. Topography of the Tiantong 20-ha permanent forest plot.
We used eight forest functions related to production, regeneration, nutrient cycling and carbon stock (Ratcliffe et al., 2017; Li et al., 2020) to represent forest multifunctionality (FM): aboveground biomass (AGB), woody productivity (Pro), litter production (Lit), sapling growth (Gro), sapling recruitment (Rec), soil organic carbon stock (SOCstock), soil nitrogen stock (SNstock), and soil phosphorus stock (SPstock). We quantified the aboveground biomass (AGB) as the biomass of all trees with DBH ≥ 5 cm. The AGB of individual trees was calculated using a general allometric equation (Chave et al., 2014) which incorporates an on site-specific environment stress factor, tree DBH (cm), and species’ wood density (ρ, g·cm−3). Several studies using data from this site have proved the equation can reliably be used to predict biomass in this setting (Ali, 2017; Ali et al., 2019). We use mean annual AGB increments from 2010 to 2015 (Ren, 2021; Ren et al., 2021) to determine woody biomass production. To estimate the litter production, we placed 187 traps in the 20-ha plot at a spacing of >28.8 m, in a relatively regular pattern, in August 2008 (Wang, 2013), and collected litter twice every month. The continuous litter monitoring data from January 2011 to December 2018 was used to calculate mean annual litter production. Sapling “growth” was expressed as the growth of trees with 1 cm ≤ DBH < 5 cm (Ratcliffe et al., 2017; van der Plas et al., 2018). Similarly, sapling recruitment was expressed as the number of saplings with DBH less than 1 cm in 2010 but who grew to be greater than 1 cm DBH by the second sample in 2015 (Condit et al., 1999; Bin et al., 2016). We assumed that the stock of organic carbon in soil was equivalent to that in the 0–10 cm soil layer (Guo and Gifford, 2002; Li et al., 2015; Bleam, 2016) and calculated it by soil bulk density, soil organic carbon and soil sampling depth (Mann, 1986). Similarly, we assumed ecosystem soil nitrogen and phosphorus stock were equivalent to nitrogen and phosphorus stock in the 0–10 cm soil layer (Guo and Gifford, 2002; Tuo et al., 2019). After removing samples which were missing data or obvious outliers, we were left with 163 subplots (with traps in their center) as the research object.
To calculate FM, we used two methods: an averaging approach, and a threshold approach (Byrnes et al., 2014; Jing et al., 2015; Schuldt et al., 2018). These two approaches are the most widely used (Hölting et al., 2019). The averaging approach provides an intuitive and simple way to evaluate changes in many ecosystem functions simultaneously. Its results are easy to interpret, while it has some weaknesses such as the assumption in the calculation that a decrease in one function can be compensated by an increase in another function (Byrnes et al., 2014). The threshold approach provides a powerful and flexible method, which captures the number of ecosystem functions performing well even if there are trade-offs and interactions between functions, while it has some disadvantages such as it cannot reflect the degree to which functions exceed or are below the threshold (Byrnes et al., 2014; Xu et al., 2016). Because each of these two approaches has strengths and weaknesses (Xu et al., 2016; Schuldt et al., 2018), they can better understand FM when used together (Jing et al., 2015; Xu et al., 2016). In the averaging approach, each single ecosystem function is first standardized with a Z-score and then averaged as described by Maestre et al. (2012). In the threshold-based approach, multifunctionality is viewed as an index, and “functionality” was estimated in the sense that values of a certain function must exceed a threshold in order to be considered functional (Byrnes et al., 2014). In the absence of a general criterion for when a function is considered functional, the 50% threshold analogous to EC50 (concentration giving 50% maximum effect in ecotoxicology) was suggested to be sufficient for the community to sustain a single function (Gamfeldt et al., 2008). Therefore, to establish these thresholds, eight forest functions were scaled to range from 0 to 1 [f(x) = (x – min(x))/(max(x) – min(x))], (Gamfeldt and Roger, 2017), then we used the threshold value of 50% in order to represent FM (Zirbel et al., 2019; Yuan et al., 2020).
In March 2011, soil samples were collected by following the standard method of John et al. (2007). In each of the 500 subplots (20 × 20 m), we took soil sample starting from the southwest corner. Two additional samples at 2 m, 5 m, or 8 m in a random compass direction were also taken. Thus, 1,292 soil samples covering the entire Tiantong plot were collected to capture fine-scale variation in soil properties (Supplementary Figure S1). From the soil samples, we estimated soil bulk density (SBD), soil organic carbon (SOC), soil total nitrogen (TN), total phosphorus (TP), and pH (Bao, 2000; Lu, 2000). SOC was determined by potassium dichromate oxidation (K2Cr2O7-H2SO4). TN, TP and pH were determined using an Elemental Analyzer (vario MICRO cube, Elmentar), a flow-injection autoanalyzer (Skalar, Netherlands), and a Metterler Toledo pH meter, respectively (Yang et al., 2016). For the above-mentioned 163 subplots, the actual soil condition of each subplot was estimated using a standard block kriging approach based on the initial soil samples. Then, SOC, TN and TP were used to calculate SOCstock, SNstock, and SPstock, respectively.
We calculated species diversity, species composition, functional trait diversity, trait composition (community-weighted means of functional trait), and structural diversity to represent multiple plant diversity using only trees with DBH ≥ 5 cm in 2000s. Species richness (S) and PieLou’s evenness index (J) were used to represent species diversity within each of the 163 subplots. Species composition was expressed as the first three axes of principal component analysis on species’ relative basal area data (Ali, 2017; Schuldt et al., 2018), and the first axe (PC1) and the third axe (PC3) were found to be associated with increased forest multifunctionality.
In order to calculate functional trait diversity, seven functional traits were selected, including mean leaf area (MLA), specific leaf area (SLA), leaf dry matter content (LDMC), leaf nitrogen content (LNC), leaf phosphorus content (LPC), twig wood density (TWD), and potential maximum DBH (a unique constant for each species; maxDBH). These functional traits were closely related to life history strategies, species competition, niche partitioning strategies, species coexistence and forest dynamics (Perez-Harguindeguy et al., 2013; Li et al., 2015; Kunstler et al., 2016). To quantify multi-trait functional trait diversity, we used functional dispersion (FDis). FDis can be considered a measure of the mean distance in multidimensional trait space of individual trees to the centroid of all trees, so that a high FDis score suggests high degree of dissimilarity among trees within a forest community (Laliberté and Legendre, 2010; Chiang et al., 2016). The community-weighted means (CWM) of each trait was calculated as the mean trait value within each subplot, weighted by species’ relative basal area (Garnier et al., 2004), so that we would ultimately have community-weighted means of MLA, SLA, LDMC, LNC, LPC, TWD, and maxDBH, represented by CWMMLA, CWMSLA, CWMLDMC, CWMLNC, CWMLPC, CWMTWD, and CWMmaxDBH, respectively.
In this study, stand density-the number of trees in a subplot (Density), the coefficient of variation for tree DBH (DBHCV), and the number of DBH classes (DBHclass) of each subplot were used to represent structural diversity (Ali, 2017). Stand density can represent the intensity of tree-tree interactions (Forrester and Bauhus, 2016). Trees were classified a DBH class based on every 5 cm interval of DBH (5, 1,015) … … [85, ∞) so that DBH class was of high resolution and could be used to better predict structural diversity. DBHCV might be considered a measure of tree size “inequality,” computed as the ratio of the standard deviation of all diameters to the mean diameter in each quadrat (Brassard et al., 2008).
To avoid multicollinearity among different components of plant diversity, highly correlated components of plant diversity were excluded (namely, anything with an R > 0.7; Yuan et al., 2020). For instance, FDis and CWMMLA were highly correlated (R = 0.72), FDis was selected in the following analyses, because of its better predictive power for FM compared with CWMMLA. According to this rule, S, J, species composition (PC1 and PC3), FDis, Density, DBHCV, DBHclass, CWMLPC, CWMTWD and CWMmaxDBH were the predictors we ultimately selected to model FM.
Then, to examine the effects of above components of plant diversity on FM, two series of multiple linear regressions were performed, i.e., one using an averaging approach and another which used a 50% threshold level to determine if a given plot met the necessary threshold to be considered “multifunctional” (FMA and FMt50, respectively). For FMA and FMt50, we regression analysis with every possible combination of model parameters, and selected models based on AIC score (though we adjusted scores to better capture the small sample size (ΔAICc ≤ 2). For the selected models, to address model uncertainty a model averaging approach was used (Anderson and Burnham, 2004), which was conducted with R package “MuMIn.”
Finally, we used structural equation models to evaluate both direct and indirect effects of topographic factors and the components of plant diversity on FM, which were selected from the above optimal regression model. To compare the relative contribution of different factors on FM, the standardization coefficient of each path in the model was used to express the relative importance of different factors on FM (Fox, 2006). In addition, due to the experimental design of the study (20 ha forest plot), we used Moran’s I test to test the influence of spatial autocorrelation on FM (Bivand et al., 2011; Yuan et al., 2020) and did not found strong spatial autocorrelation (clumping) among subplot (Supplementary Figure S2).
Elevation was positively correlated with S (R2 = 0.05, p < 0.01; Figure 2), J (R2 = 0.03, p < 0.05), species composition PC1 (R2 = 0.12, p < 0.001) and species composition PC3 (R2 = 0.18, p < 0.001), Density (R2 = 0.12, p < 0.001), and CWMTWD (R2 = 0.24, p < 0.001), though interestingly elevation was negatively correlated with both DBHCV (R2 = 0.25, p < 0.001) and DBHclass (R2 = 0.14, p < 0.001)– suggesting that higher plots tended to be overall less structurally complex. Convexity was positively related to species composition PC1 (R2 = 0.45, p < 0.001; Figure 2), species composition PC3 (R2 = 0.05, p < 0.01), Density (R2 = 0.28, p < 0.001), CWMTWD (R2 = 0.1, p < 0.001), and CWMmaxDBH (R2 = 0.08, p < 0.001), but was negatively related to CWMLPC (R2 = 0.02, p < 0.05), DBHCV (R2 = 0.07, p < 0.001), and FDis (R2 = 0.19, p < 0.001). Slope was positive with S (R2 = 0.04, p < 0.05; Figure 2) and Density (R2 = 0.07, p < 0.001), but negative with CWMLPC (R2 = 0.04, p < 0.01). Elevation and convexity could explain 20% of PC3 variation, convexity can explain 18% of variation in FDis, and the combined influence of elevation and convexity can explain 29% of DBHCV (Figures 3, 4).
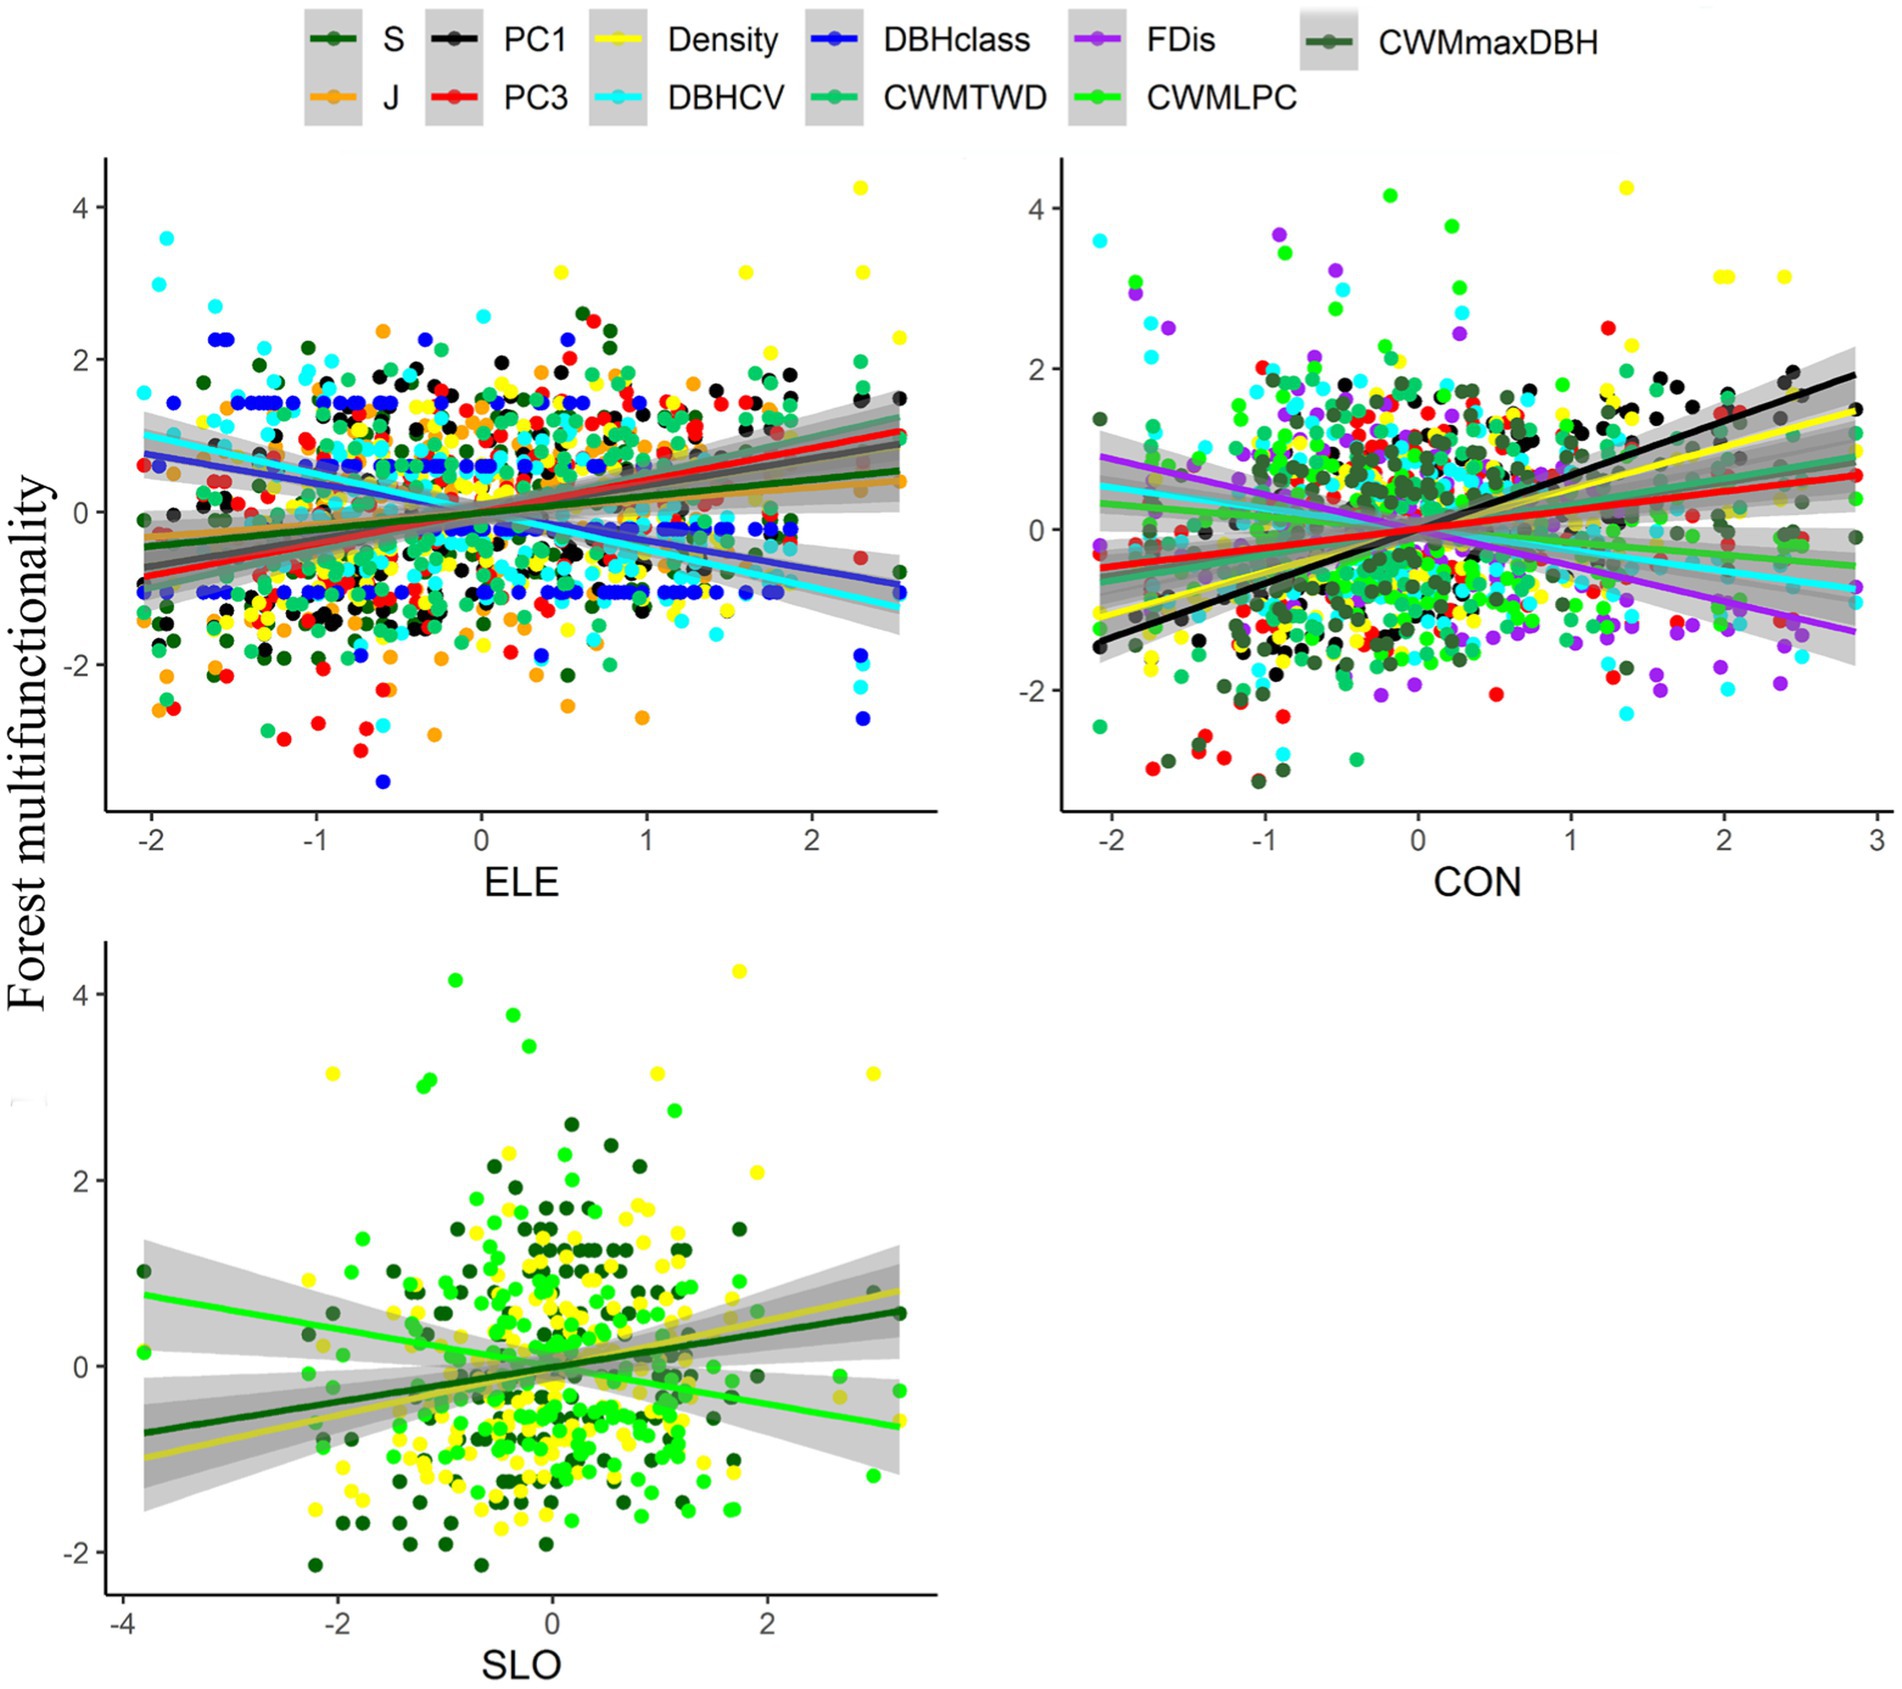
Figure 2. Relationships between topographic factors and different components of plant diversity based on simple linear regression models. Only significant relationships are shown. Shaded lines indicate 95% confidence intervals. ELE is elevation, CON is convexity, and SLO is slope. PC1 is species composition PC1, PC3 is species composition PC3, FDis is functional dispersion, CWMLPC is community-weighted means of leaf phosphorus content, CWMmaxDBH is community-weighted means of maximum potential DBH, Density is stand density, DBHCV the is coefficient of variation in DBH of trees, and DBHclass is the number of DBH classes.
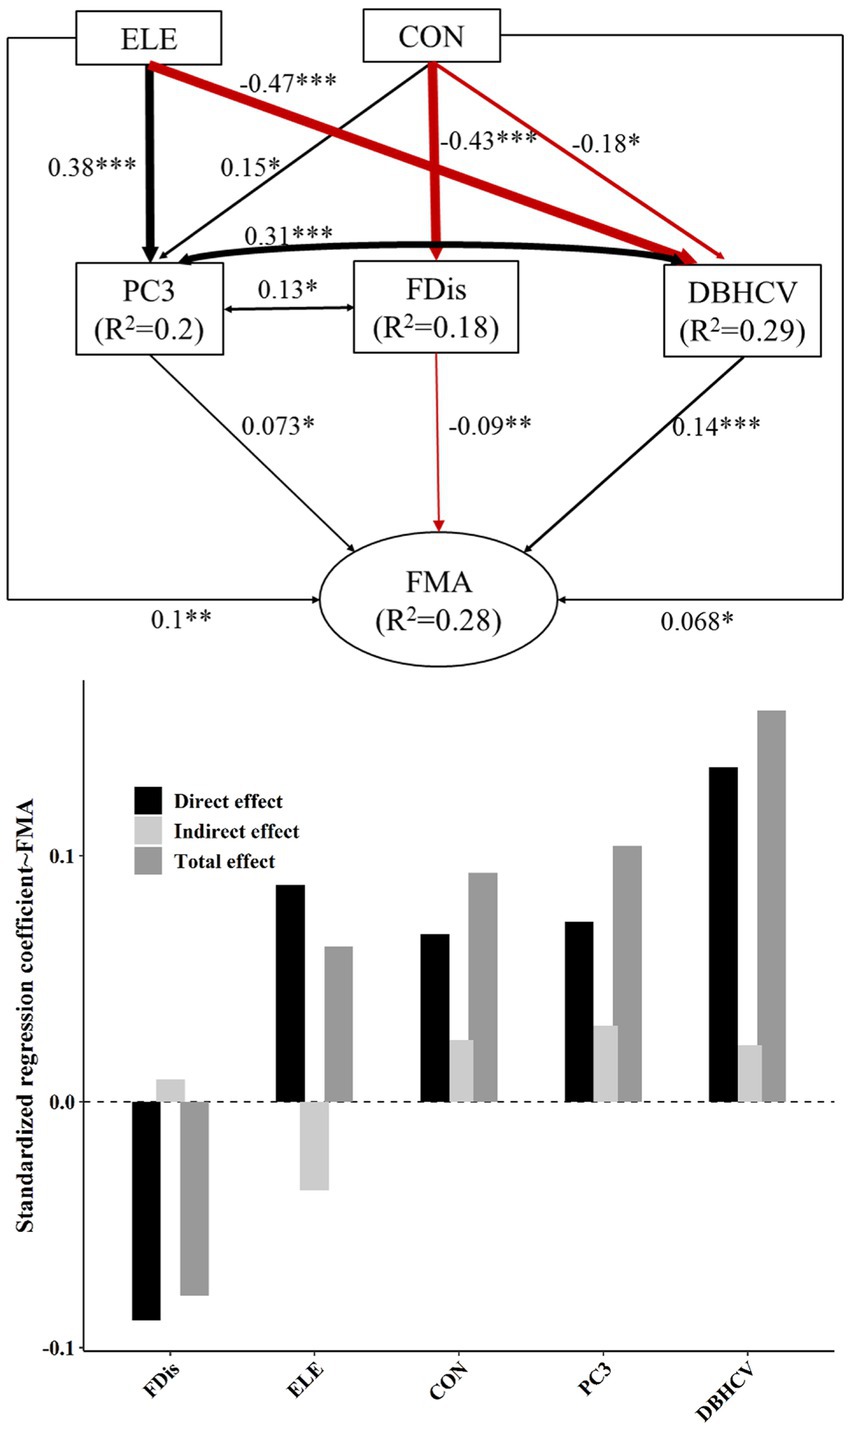
Figure 3. The top panel of this figure shows our best-fit structural equation model linking topographic factors and different components of plant diversity with FMA. Black and red solid arrows represent significant positive and significant negative effects, respectively. Values near arrows represent standardized coefficients (*p < 0.05; **p < 0.01; ***p < 0.001). Model fitting: CFI = 1, RMSEA = 0, SEMR = 0.013, p = 0.769. The lower panel shows the standardized effect of each factor. The darkest bars are used to describe direct effects, and the lightest bars indirect effects. The intermediate gray bar represents the net effect.
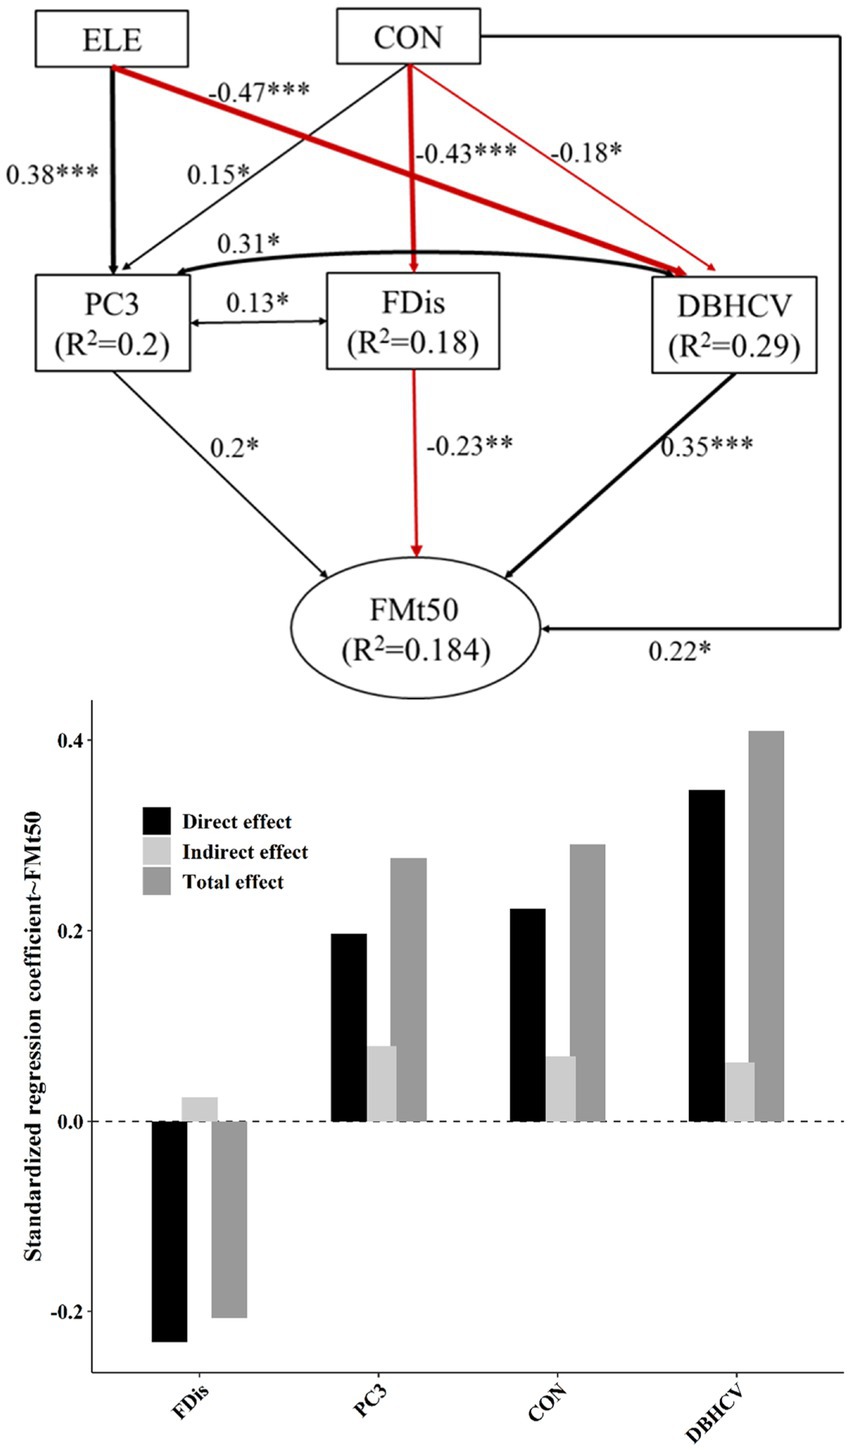
Figure 4. The top panel of this figure shows best-fit structural equation model linking topographic factors and different components of plant diversity with FMt50. Black and red solid arrows represent significant positive and significant negative effects, respectively. Values near arrows represent standardized coefficients (*p < 0.05; **p < 0.01; ***p < 0.001). Model fitting: CFI = 1, RMSEA = 0, SEMR = 0.018, p = 0.668. The lower panel shows the standardized effect of each factor. The darkest bars are used to describe direct effects, and the lightest bars indirect effects. The intermediate gray bar represents the net effect.
If we considered the averaging approach (FMA), increasing multifunctionality was associated with increased elevation (R2 = 0.05, p < 0.01; Figure 5), convexity (R2 = 0.08, p < 0.001), PC1 (R2 = 0.07, p < 0.001), PC3 (R2 = 0.11, p < 0.001), CWMmaxDBH (R2 = 0.12, p < 0.001), and DBHclass (R2 = 0.04, p < 0.01). FMA was negatively associated with increasing FDis (R2 = 0.12, p < 0.001) and CWMLPC (R2 = 0.04, p < 0.05). Interestingly, the threshold approach (FMt50) showed some similarities (Figure 5), namely that FM tended to increase with increasing convexity (R2 = 0.05, p < 0.01), PC1 (R2 = 0.03, p < 0.05), PC3 (R2 = 0.04, p < 0.01), CWMmaxDBH (R2 = 0.08, p < 0.001), DBHCV (R2 = 0.05, p < 0.01), and DBHclass (R2 = 0.06, p < 0.01), though it also found multifunctionality was lower when J (R2 = 0.04, p < 0.05) and FDis (R2 = 0.06, p < 0.01) increased.
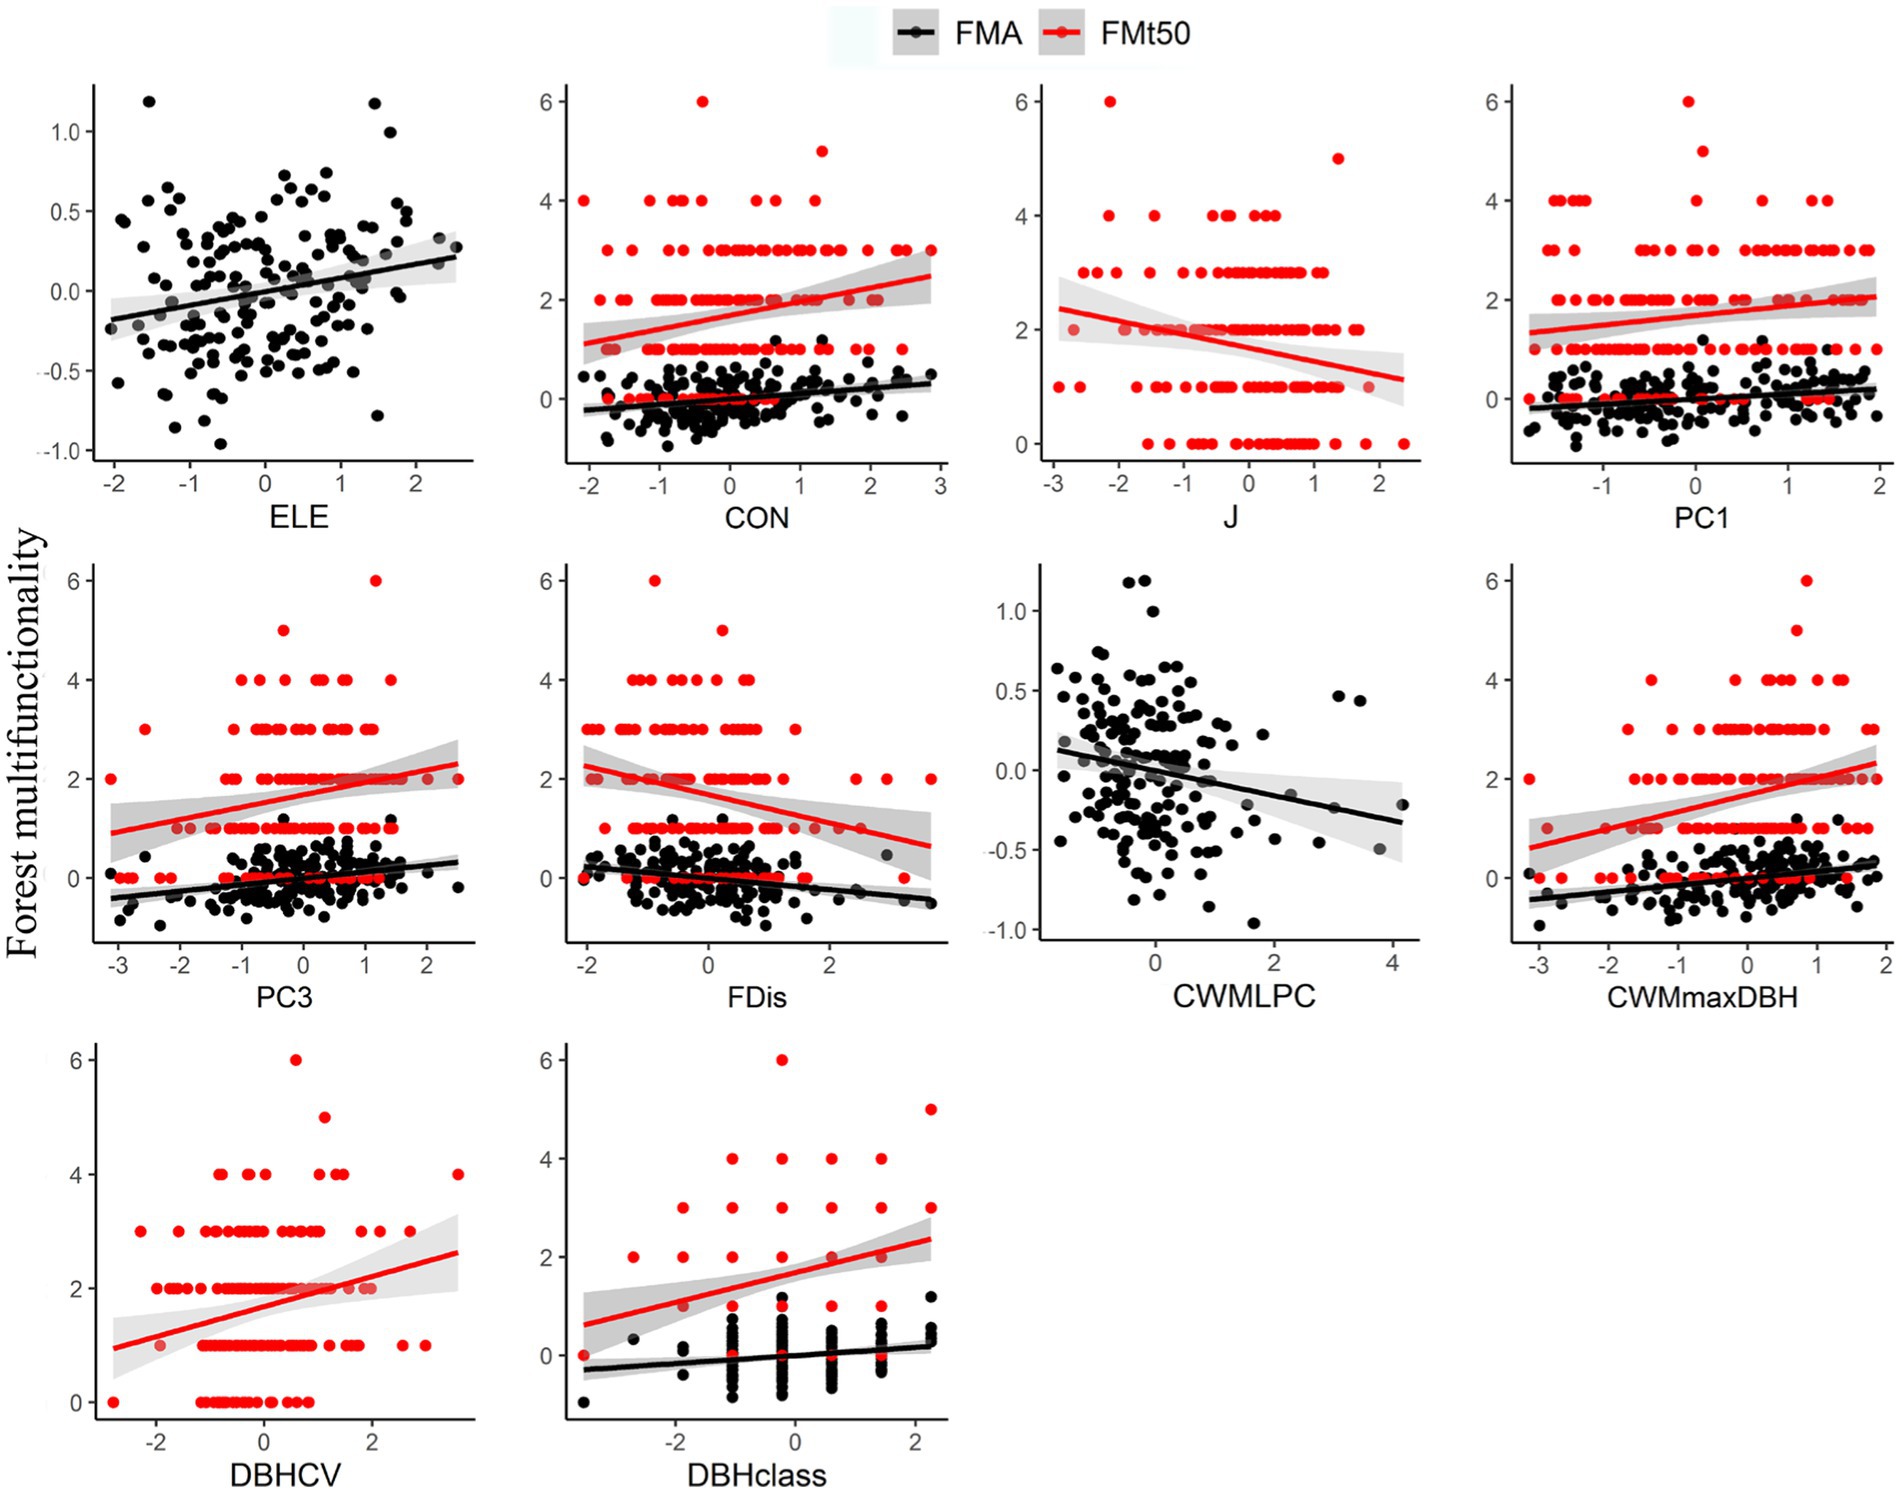
Figure 5. Relationships between topographic factors, different components of plant diversity and forest multifunctionality based on linear regression models. Only significant relationships are shown. Shaded lines indicate 95% confidence intervals. ELE is elevation, and CON is convexity. PC1 is species composition PC1, PC3 is species composition PC3, FDis is functional dispersion, CWMLPC is community-weighted means of leaf phosphorus content, CWMmaxDBH is community-weighted means of maximum potential DBH, Density is stand density, DBHCV is the coefficient of variation in DBH of trees, and DBHclass is the number of DBH classes.
Topography and plant diversity explained 28% of FMA variation and 18.4% of FMt50 variation (Figures 3, 4). In both settings, DBHCV and PC3 had significant positive effects on forest multifunctionality, whereas FDis had a negative effect on forest multifunctionality. In both scenarios, we observed that increasingly convexity indirectly drove up forest multifunctionality by affecting species composition, functional trait diversity and structural diversity. In addition, elevation had a significant positive effect on FMA. In general, the effect of structural diversity on FMA and FMt50 was higher than that of species composition or functional trait diversity (Figure 6). The effect of topography on FMA and FMt50 accounted for 31.3% and 24.6% of the total effect, respectively (Figure 6), and roughly ¼ of the relative influence of topography was contained in the indirect relationships between topography and species composition, functional trait diversity, and structural diversity (occupying about ¼ of topography’s effect; Figures 3, 4).
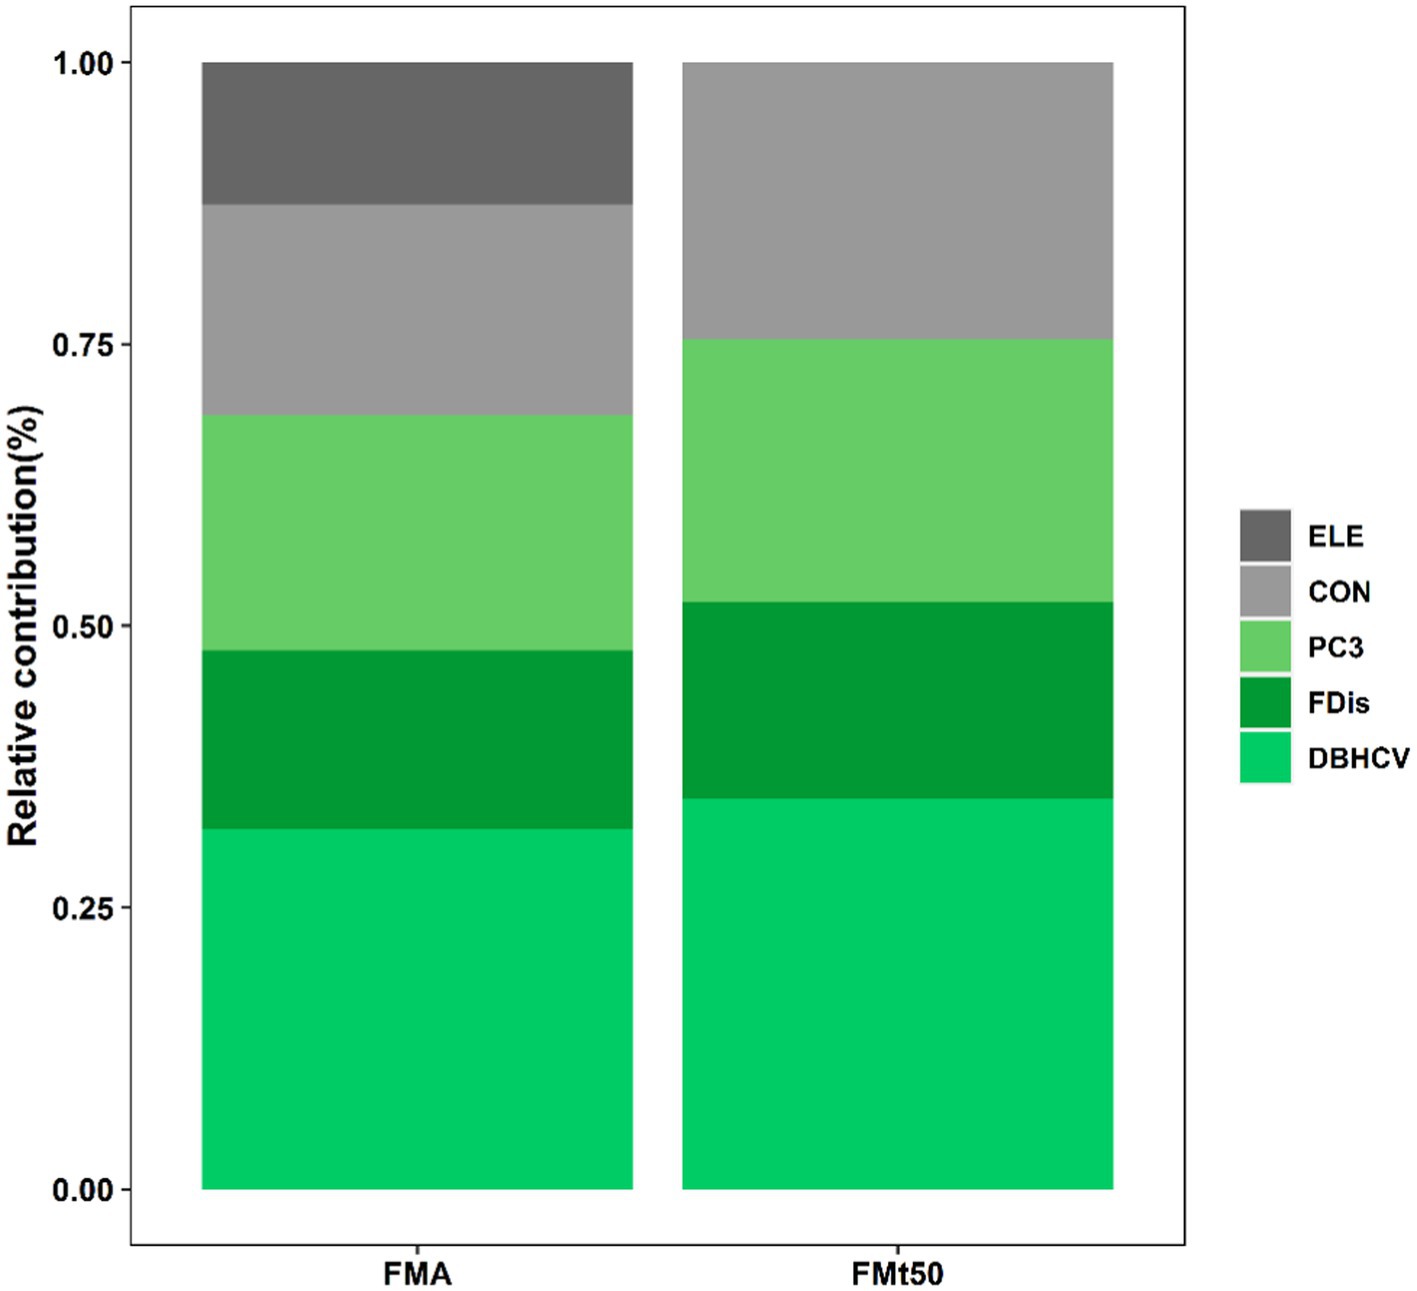
Figure 6. Relative contributions of topography (gray bars) and different components of plant diversity (green bars) on forest multifunctionality at averaged and 50% threshold levels (Based on total effects). ELE is elevation, CON is convexity, PC3 is species composition PC3, FDis is functional dispersion, and DBHCV is the coefficient of variation in DBH of trees.
In both temperate forests and subtropical coniferous forests, studies have shown that increasing species richness is associated with higher overall ecosystem multifunctionality (Van der Plas et al., 2018; Yuan et al., 2020; Li et al., 2021; Sanaei et al., 2021). Conversely, in our study, species richness had no significant effect on forest multifunctionality. This may be due to the overall higher species richness in subtropical evergreen broad-leaved forests than either temperate forests or subtropical coniferous forests, so that increasing species richness at our site may lead to functional redundancy (Gamfeldt et al., 2008), which may explain the non-significant relationship between species richness and forest multifunctionality. The idea that increasing richness has diminishing returns on ecosystem function in highly diverse forests is corroborated other research connecting richness to productivity (Chen et al., 2020). Furthermore, the effects of species richness on ecosystem multifunctionality may also depend on species composition and spatial distribution patterns (Maestre et al., 2012). For example, in a human-modified tropical landscape, Lohbeck et al. (2016) found that species richness played a limited role for forest multifunctionality, but species dominance mattered.
Selection effect suggest that the characteristics of dominant species drive ecosystem function (Tilman et al., 1997, 2001; Díaz et al., 2007; Urgoiti et al., 2022), measured by species composition or community weight mean of functional traits. In this study, species composition (PC3) had a significant positive effect on forest multifunctionality, and functional dispersion had a significant negative effect on forest multifunctionality, indicating that the characteristics of dominant species, namely, the selection effect, drove the multifunctionality of the Tiantong subtropical forest. This is consistent with the findings of Schuldt et al. (2018) in adjacent areas and may be related to the environmental background of Tiantong plot. Given the connection between the dominant species and the overall function, we are drawn to think on the several environmental filtering steps that would have resulted in such a functional-similar demography. Several reasons (p-limitation, an intense typhoon season, and remarkably complex elevation) abound. In Tiantong plot, the PC3 axis of species composition were strongly correlated with the dominant species such as Cinnamomum subavenium, Lithocarpus harlandii and Choerospondias axillaris (Supplementary Figure S3), and PC3 was also significantly positively correlated with the community-weighted means of maximum potential DBH and negatively correlated with the community-weighted means of leaf P content (Supplementary Figure S4). Therefore, PC3 represented the combination of large DBH dominant species with lower leaf P content. These species have a higher intrinsic growth rate, which will beneficial for productivity and litter (Poorter and Bongers, 2006; Poorter et al., 2008; Ali, 2017). In addition, the low phosphorus requirement of these species may drive positive feedback in recruitment and reduce the influence of competition on understory saplings (Haussmann et al., 2010; Díaz et al., 2016), thus driving the improvement of forest multifunctionality. Similar to our results, in arid ecosystems, strong environmental filtering enabled species with smaller leaf area and specific leaf area to be filtered into ecological niches; therefore, such species drove changes in ecosystem functions (Yang et al., 2023).
Structure variation may be interpreted as a measure of niche complementarity in space and resource utilization (Ali, 2017; Tan et al., 2017). Some studies have found that the structural diversity represented by the coefficient of DBH variation is associated with increased overall heterogeneity of trees both vertically and laterally as was found to covary with niche complementarity among trees (Ali, 2017; Yuan et al., 2020), suggesting increases in DBHCV increase ecosystem functionality. Our results showed that the structural diversity represented by the coefficient of DBH variation had the strongest promoting effect on forest multifunctionality among all the factors, indicating that the increase of tree size heterogeneity is not only beneficial to aboveground biomass accumulation (Ali, 2017) but also very important for the improvement of the whole function of subtropical forest. On the one hand, in communities with higher structural diversity, trees of different sizes enhance the utilization of canopy space and capture of light resources, and ecosystem functionality is generally thought to be the inverse of utilization—where multifunctionality increases as resources are utilized (Fahey et al., 2015; Yuan et al., 2020; Zheng, 2022). On the other hand, in communities with high structural diversity, trees may enhance underground niche differentiation, expand tree root distribution in both horizontal and vertical directions, improve the efficiency of tree utilization of soil water and nutrients, and thus improve ecosystem functions (Ma and Chen, 2017; Brum et al., 2019). While other studies also found that too complex structure led to the lack of light within the forest, the competition between the upper layer trees and the regeneration layer trees was fierce, and the structural diversity had no significant relationship or significantly negative correlation with ecosystem functions (Ali, 2019).
The various interactions between structural diversity and functionality suppose there is another element which further complicates our understanding. Accordingly, the missing piece may be derived from species diversity (Zhang and Chen, 2015; Ali, 2017). In communities with high species diversity, the canopies of different species occupy different positions in the canopy space, thus forming a dense canopy with obvious vertical stratification and improving the structural diversity of trees (Williams et al., 2017; Ren, 2021). Through the structural equation models, our study found that structural diversity was significantly positive with PC3. It suggests that the influence of structural diversity on ecosystem multifunctionality due to presence or absence of large trees associated with lower leaf phosphorus content. At the same time, the results emphasized that the combination of large DBH dominant species with lower leaf phosphorus content not only drove the change of forest ecosystem multifunctionality but also was an important driving force for forest structure change (Ouyang et al., 2016; Zhu et al., 2021). Li et al. (2021) found in the study of Yunnan Pine that trees with high structural diversity made more effective use of canopy space and drove the improvement of ecosystem multifunctionality by promoting coexistence.
Our findings indicated that topography played an important role in subtropical forest ecosystem multifunctionality. In natural communities, especially in climax communities, species interact with the environment for a long time and adapt to local topographic conditions, thus forming specific community composition and structure and further influencing forest functions (Zhu et al., 2021). The results of this study indicated that topography could indirectly influence species composition, functional trait diversity, and forest structure, further influencing overall functionality. Topography determines the redistribution of solar radiation, water, soil, and the extent and intensity of natural disturbances (Abrams et al., 1986; Takyu et al., 2003), which are closely related to plant growth, and thus ultimately regulate multifunctionality (Kubota et al., 2004; Ediriweera et al., 2008; Liu et al., 2012; Hou et al., 2014; Zhu et al., 2021). The principal difference between a high and low elevation site within our setting may be mainly due to wind. Typhoons occurred frequently in this study area, the intensity of a typhoon’s influence on a tree is much higher at higher elevations than in naturally protected valleys and lowlands (Zhang et al., 2013). Structural diversity (DBHCV and DBHclass) also decreased significantly with increasing elevation, though both sapling trees and stand density increased significantly. At higher elevations, species composition changed, and though both aboveground biomass and productivity decreased, sapling growth and sapling recruitment was better (Supplementary Figures S5–S12).
The effects of convexity on plant diversity and forest multifunctionality may be related to runoff erosion, landslide, stability, and topsoil thickness (Zhang et al., 2013; Girardin et al., 2014; Fei, 2016). Thicker and more stable soil layers in the ridge (compared with gullies and steep slopes) are favorable for large-diameter dominant species combination with lower leaf phosphorus content (PC3), thus providing higher forest multifunctionality, implying that constructing forests through plant diversity for high multifunctionality should pay attention to topography.
Our study shows topography and structural diversity play important roles in natural ecosystem multifunctionality in a subtropical evergreen broad-leaved forest. Topography can drive forest multifunctionality through species composition, functional trait diversity and structural diversity. Among plant diversity components, the effect of structural diversity on forest multifunctionality was higher than that of species composition or functional traits. Our results suggest that regulating structural diversity is an effective measure to promote subtropical forest multifunctionality in forest management, and constructing forests with different plant diversity according to topography is also helpful for forest multifunctionality.
The raw data supporting the conclusions of this article will be made available by the authors, without undue reservation.
JW: Conceptualization, Data curation, Formal analysis, Investigation, Methodology, Visualization, Writing – original draft, Writing – review & editing. HL: Methodology, Software, Writing – review & editing. QY: Writing – review & editing, Data curation, Investigation. GS: Writing – review & editing, Methodology, Software. XZ: Writing – review & editing, Data curation, Investigation. YX: Data curation, Investigation, Writing – review & editing. XW: Writing – review & editing, Conceptualization, Funding acquisition, Project administration, Resources, Supervision, Validation.
The author(s) declare financial support was received for the research, authorship, and/or publication of this article. This study was supported by the National Science and Technology Basic Resources Survey Project (2019FY1016052).
The authors would like to thank Daniel Petticord at the University of Cornell for his assistance with English language and grammatical editing of the manuscript.
The authors declare that the research was conducted in the absence of any commercial or financial relationships that could be construed as a potential conflict of interest.
All claims expressed in this article are solely those of the authors and do not necessarily represent those of their affiliated organizations, or those of the publisher, the editors and the reviewers. Any product that may be evaluated in this article, or claim that may be made by its manufacturer, is not guaranteed or endorsed by the publisher.
The Supplementary material for this article can be found online at: https://www.frontiersin.org/articles/10.3389/ffgc.2023.1309660/full#supplementary-material
Abrams, M. D., Knapp, A. K., and Hulbert, L. C. (1986). A ten-year record of aboveground biomass in a Kansas tallgrass prairie: effects of fire and topographic position. Am. J. Bot. 73, 1509–1515. doi: 10.1002/j.1537-2197.1986.tb10897.x
Ali, A. (2017). The forest strata-dependent relationships among environment, biodiversity and aboveground biomass in a subtropical forest in Tiantong, Zhejiang Province. Ph.D. thesis, East China Normal University, Shanghai.
Ali, A. (2019). Forest stand structure and functioning: current knowledge and future challenges. Ecol. Indic. 98, 665–677. doi: 10.1016/j.ecolind.2018.11.017
Ali, A., Chen, H. Y., You, W. H., and Yan, E. R. (2019). Multiple abiotic and biotic drivers of aboveground biomass shift with forest stratum. For. Ecol. Manage. 436, 1–10. doi: 10.1016/j.foreco.2019.01.007
Anderson, D., and Burnham, K. (2004). Model selection and multi-model inference. New York: Springer-Verlag.
Bagousse-Pinguet, Y., Soliveres, S., Gross, N., Torices, R., Berdugo, M., and Maestre, F. T. (2019). Phylogenetic, functional, and taxonomic richness have both positive and negative effects on ecosystem multifunctionality. Proc. Natl. Acad. Sci. U. S. A. 116, 8419–8424. doi: 10.1073/pnas.1815727116
Bin, Y., Spence, J., Wu, L., Li, B., Hao, Z., Ye, W., et al. (2016). Species-habitat associations and demographic rates of forest trees. Ecography 39, 9–16. doi: 10.1111/ecog.00787
Bivand, R., Anselin, L., Berke, O., Bernat, A., Carvalho, M., Chun, Y., et al. (2011). Spdep: Spatial dependence: Weighting schemes, statistics and models. R package version 0.5–31.
Brassard, B. W., Chen, H. Y., Wang, J. R., and Duinker, P. N. (2008). Effects of time since stand-replacing fire and overstory composition on live-tree structural diversity in the boreal forest of Central Canada. Can. J. For. Res. 38, 52–62. doi: 10.1139/X07-125
Brum, M., Vadeboncoeur, M. A., Ivanov, V., Asbjornsen, H., Saleska, S., Alves, L. F., et al. (2019). Hydrological niche segregation defines forest structure and drought tolerance strategies in a seasonal Amazon forest. J. Ecol. 107, 318–333. doi: 10.1111/1365-2745.13022
Byrnes, J. E., Gamfeldt, L., Isbell, F., Lefcheck, J. S., Griffin, J. N., Hector, A., et al. (2014). Investigating the relationship between biodiversity and ecosystem multifunctionality: challenges and solutions. Methods Ecol. Evol. 5, 111–124. doi: 10.1111/2041-210X.12143
Chave, J., Réjou-Méchain, M., Búrquez, A., Chidumayo, E., Colgan, M. S., Delitti, W. B., et al. (2014). Improved allometric models to estimate the aboveground biomass of tropical trees. Glob. Chang. Biol. 20, 3177–3190. doi: 10.1111/gcb.12629
Chen, Y., Huang, Y., Niklaus, P. A., Castro-Izaguirre, N., Clark, A. T., Bruelheide, H., et al. (2020). Directed species loss reduces community productivity in a subtropical forest biodiversity experiment. Nat. Ecol. Evol. 4, 550–559. doi: 10.1038/s41559-020-1174-x
Chen, W., Wang, J., Chen, X., Meng, Z., Xu, R., Duoji, D., et al. (2022). Soil microbial network complexity predicts ecosystem function along elevation gradients on the Tibetan plateau. Soil Biol. Biochem. 172:108766. doi: 10.1016/j.soilbio.2022.108766
Chiang, J. M., Spasojevic, M. J., Muller-Landau, H. C., Sun, I. F., Lin, Y., Su, S. H., et al. (2016). Functional composition drives ecosystem function through multiple mechanisms in a broadleaved subtropical forest. Oecologia 182, 829–840. doi: 10.1007/s00442-016-3717-z
Condit, R. (1998). Tropical forest census plots: Methods and results from Barro Colorado Island, Panama and a comparison with other plots. Dordrecht: Springer Science & Business Media.
Condit, R., Ashton, P. S., Manokaran, N., LaFrankie, J. V., Hubbell, S. P., and Foster, R. B. (1999). Dynamics of the forest communities at Pasoh and Barro Colorado: comparing two 50-ha plots. Philos. Trans. R. Soc. B-Biol. Sci. 354, 1739–1748. doi: 10.1098/rstb.1999.0517
Coomes, D. A., Kunstler, G., Canham, C. D., and Wright, E. (2009). A greater range of shade-tolerance niches in nutrient-rich forests: an explanation for positive richness-productivity relationships? J. Ecol. 97, 705–717. doi: 10.1111/j.1365-2745.2009.01507.x
Díaz, S., Kattge, J., Cornelissen, J. H., Wright, I. J., Lavorel, S., Dray, S., et al. (2016). The global spectrum of plant form and function. Nature 529, 167–171. doi: 10.1038/nature16489
Díaz, S., Lavorel, S., de Bello, F., Quétier, F., Grigulis, K., and Robson, T. M. (2007). Incorporating plant functional diversity effects in ecosystem service assessments. Proc. Natl. Acad. Sci. U. S. A. 104, 20684–20689. doi: 10.1073/pnas.0704716104
Ediriweera, S., Singhakumara, B. M. P., and Ashton, M. S. (2008). Variation in canopy structure, light and soil nutrition across elevation of a Sri Lankan tropical rain forest. For. Ecol. Manage. 256, 1339–1349. doi: 10.1016/j.foreco.2008.06.035
Fahey, R. T., Fotis, A. T., and Woods, K. D. (2015). Quantifying canopy complexity and effects on productivity and resilience in late-successional hemlock-hardwood forests. Ecol. Appl. 25, 834–847. doi: 10.1890/14-1012.1
Fei, X. Y. (2016). Study on factors affecting the stem growth in an evergreen broadleaved forest in Zhejiang Tiantong. M.S. thesis, East China Normal University, Shanghai.
Felipe-Lucia, M. R., Soliveres, S., Penone, C., Manning, P., van der Plas, F., Boch, S., et al. (2018). Multiple forest attributes underpin the supply of multiple ecosystem services. Nat. Commun. 9:4839. doi: 10.1038/s41467-018-07082-4
Forrester, D. I., and Bauhus, J. (2016). A review of processes behind diversity-productivity relationships in forests. Curr. For. Rep. 2, 45–61. doi: 10.1007/s40725-016-0031-2
Fox, J. (2006). Teacher’s conrner: structural equation Modeling with the sem package in R. Struct. Equ. Modeling 13, 465–486. doi: 10.1207/s15328007sem1303_7
Gamfeldt, L., Hillebrand, H., and Jonsson, P. R. (2008). Multiple functions increase the importance of biodiversity for overall ecosystem functioning. Ecology 89, 1223–1231. doi: 10.1890/06-2091.1
Gamfeldt, L., and Roger, F. (2017). Revisiting the biodiversity-ecosystem multifunctionality relationship. Nat. Ecol. Evol. 1, 1–7. doi: 10.1038/s41559-017-0168
Garland, G., Banerjee, S., Edlinger, A., Miranda Oliveira, E., Herzog, C., and Wittwer, R. (2021). A closer look at the functions behind ecosystem multifunctionality: a review. J. Ecol. 109, 600–613. doi: 10.1111/1365-2745.13511
Garnier, E., Cortez, J., Billès, G., Navas, M. L., Roumet, C., Debussche, M., et al. (2004). Plant functional markers capture ecosystem properties during secondary succession. Ecology 85, 2630–2637. doi: 10.1890/03-0799
Girardin, C. A., Farfan-Rios, W., Garcia, K., Feeley, K. J., Jørgensen, P. M., Murakami, A. A., et al. (2014). Spatial patterns of above-ground structure, biomass and composition in a network of six Andean elevation transects. Plant Ecol. Divers. 7, 161–171. doi: 10.1080/17550874.2013.820806
Guo, L. B., and Gifford, R. M. (2002). Soil carbon stocks and land use change: a meta analysis. Glob. Chang. Biol. 8, 345–360. doi: 10.1046/j.1354-1013.2002.00486.x
Guo, Y., Wang, B., Xiang, W., Ding, T., Lu, S., Huang, F., et al. (2016). Responses of spatial pattern of woody plants’ basal area to topographic factors in a tropical karst seasonal rainforest in Nonggang, Guangxi, southern China. Biodivers. Sci. 24, 30–39. doi: 10.17520/biods.2015207
Harms, K. E., Condit, R., Hubbell, S. P., and Foster, R. B. (2001). Habitat associations of trees and shrubs in a 50-ha neotropical forest plot. J. Ecol. 89, 947–959. doi: 10.1111/j.1365-2745.2001.00615.x
Haussmann, N. S., McGeoch, M. A., and Boelhouwers, J. C. (2010). Contrasting nurse plants and nurse rocks: the spatial distribution of seedlings of two sub-Antarctic species. Acta Oecol. Int J. Ecol. 36, 299–305. doi: 10.1016/j.actao.2010.02.001
Hector, A., and Bagchi, R. (2007). Biodiversity and ecosystem multifunctionality. Nature 448, 188–190. doi: 10.1038/nature05947
Hölting, L., Beckmann, M., Volk, M., and Cord, A. F. (2019). Multifunctionality assessments-more than assessing multiple ecosystem functions and services? A quantitative literature review. Ecol. Indic. 103, 226–235. doi: 10.1016/j.ecolind.2019.04.009
Hou, Z. J., Zhao, C. Z., Dong, X. G., Li, Y., Zhang, Q., and Ma, X. L. (2014). Responses of spatial pattern of aboveground biomass of natural grassland to terrain at different scales in northern slope of Qilian Mountains. Chin. J. Ecol. 2014, 10–15. doi: 10.13292/j.1000-4890.20131220.0037
Huang, X., Su, J., Li, S., Liu, W., and Lang, X. (2019). Functional diversity drives ecosystem multifunctionality in a Pinus yunnanensis natural secondary forest. Sci. Rep. 9, 6979–6978. doi: 10.1038/s41598-019-43475-1
Jing, X., and He, J. S. (2021). Relationship between biodiversity, ecosystem multifunctionality and multiserviceability: literature overview and research advances. Chin. J. Plant Ecol. 45, 1094–1111. doi: 10.17521/cjpe.2020.0154
Jing, X., Sanders, N. J., Shi, Y., Chu, H., Classen, A. T., Zhao, K., et al. (2015). The links between ecosystem multifunctionality and above-and belowground biodiversity are mediated by climate. Nat. Commun. 6, 1–8. doi: 10.1038/ncomms9159
John, R., Dalling, J. W., Harms, K. E., Yavitt, J. B., Stallard, R. F., Mirabello, M., et al. (2007). Soil nutrients influence spatial distributions of tropical tree species. Proc. Natl. Acad. Sci. U. S. A. 104, 864–869. doi: 10.1073/pnas.0604666104
Jucker, T., Bongalov, B., Burslem, D. F., Nilus, R., Dalponte, M., Lewis, S. L., et al. (2018). Topography shapes the structure, composition and function of tropical forest landscapes. Ecol. Lett. 21, 989–1000. doi: 10.1111/ele.12964
Kubota, Y., Murata, H., and Kikuzawa, K. (2004). Effects of topographic heterogeneity on tree species richness and stand dynamics in a subtropical forest in Okinawa Island, southern Japan. J. Ecol. 92, 230–240. doi: 10.1111/j.0022-0477.2004.00875.x
Kunstler, G., Falster, D., Coomes, D. A., Hui, F., Kooyman, R. M., Laughlin, D. C., et al. (2016). Plant functional traits have globally consistent effects on competition. Nature 529, 204–207. doi: 10.1038/nature16476
Laliberté, E., and Legendre, P. (2010). A distance-based framework for measuring functional diversity from multiple traits. Ecology 91, 299–305. doi: 10.1890/08-2244.1
Li, S., Huang, X., Lang, X., Shen, J., Xu, F., and Su, J. (2020). Cumulative effects of multiple biodiversity attributes and abiotic factors on ecosystem multifunctionality in the Jinsha River valley of southwestern China. For. Ecol. Manage. 472:118281. doi: 10.1016/j.foreco.2020.118281
Li, S., Liu, W., Lang, X., Huang, X., and Su, J. (2021). Species richness, not abundance, drives ecosystem multifunctionality in a subtropical coniferous forest. Ecol. Indic. 120:106911. doi: 10.1016/j.ecolind.2020.106911
Li, S., Su, J., Liu, W., Lang, X., Huang, X., Jia, C., et al. (2015). Changes in biomass carbon and soil organic carbon stocks following the conversion from a secondary coniferous forest to a pine plantation. PloS One 10:e0135946. doi: 10.1371/journal.pone.0135946
Lin, D., Lai, J., Muller-Landau, H. C., Mi, X., and Ma, K. (2012). Topographic variation in aboveground biomass in a subtropical evergreen broad-leaved forest in China. PloS One 7:e48244. doi: 10.1371/journal.pone.0048244
Liu, H. F., Xue, D. Y., and Sang, W. G. (2012). Effect of topographic factors on the relationship between species richness and aboveground biomass in a warm temperate forest. Ecol Environ Sci 21, 1403–1407.
Lohbeck, M., Bongers, F., Martinez-Ramos, M., and Poorter, L. (2016). The importance of biodiversity and dominance for multiple ecosystem functions in a human-modified tropical landscape. Ecology 97, 2772–2779. doi: 10.1002/ecy.1499
Loreau, M., and Hector, A. (2001). Partitioning selection and complementarity in biodiversity experiments. Nature 412, 72–76. doi: 10.1038/35097128
Lu, R. K. (2000). Analytical methods of soil agrochemistry. Beijing: China Agricultural Science and Technology Press.
Ma, Z., and Chen, H. Y. (2017). Effects of species diversity on fine root productivity increase with stand development and associated mechanisms in a boreal forest. J. Ecol. 105, 237–245. doi: 10.1111/1365-2745.12667
Maestre, F. T., Castillo-Monroy, A. P., Bowker, M. A., and Ochoa-Hueso, R. (2012). Species richness effects on ecosystem multifunctionality depend on evenness, composition and spatial pattern. J. Ecol. 100, 317–330. doi: 10.1111/j.1365-2745.2011.01918.x
Mann, L. K. (1986). Changes in soil carbon storage after cultivation. Soil Sci. 142, 279–288. doi: 10.1097/00010694-198611000-00006
Ouyang, S., Xiang, W., Gou, M., Chen, L., Lei, P., Xiao, W., et al. (2021). Stability in subtropical forests: the role of tree species diversity, stand structure, environmental and socio-economic conditions. Glob. Ecol. Biogeogr. 30, 500–513. doi: 10.1111/geb.13235
Ouyang, S., Xiang, W., Wang, X., Zeng, Y., Lei, P., Deng, X., et al. (2016). Significant effects of biodiversity on forest biomass during the succession of subtropical forest in South China. For. Ecol. Manage. 372, 291–302. doi: 10.1016/j.foreco.2016.04.020
Perez-Harguindeguy, N., Diaz, S., Garnier, E., Lavorel, S., Poorter, H., Jaureguiberry, P., et al. (2013). New handbook for standardised measurement of plant functional traits worldwide. Aust. Bot. 61, 167–234. doi: 10.1071/BT12225_CO
Pommerening, A. (2002). Approaches to quantifying forest structures. Forestry 75, 305–324. doi: 10.1093/forestry/75.3.305
Pommerening, A., and Grabarnik, P. (2019). Individual-based methods in forest ecology and management. Cham: Springer.
Poorter, L., and Bongers, F. (2006). Leaf traits are good predictors of plant performance across 53 rain forest species. Ecology 87, 1733–1743. doi: 10.1890/0012-9658(2006)87[1733:LTAGPO]2.0.CO;2
Poorter, L., Wright, S. J., Paz, H., Ackerly, D. D., Condit, R., Ibarra-Manríquez, G., et al. (2008). Are functional traits good predictors of demographic rates? Evidence from five neotropical forests. Ecology 89, 1908–1920. doi: 10.1890/07-0207.1
Prado-Junior, J. A., Schiavini, I., Vale, V. S., Arantes, C. S., van der Sande, M. T., Lohbeck, M., et al. (2016). Conservative species drive biomass productivity in tropical dry forests. J. Ecol. 104, 817–827. doi: 10.1111/1365-2745.12543
Punchi-Manage, R., Getzin, S., Wiegand, T., Kanagaraj, R., Savitri Gunatilleke, C. V., Nimal Gunatilleke, I. A. U., et al. (2013). Effects of topography on structuring local species assemblages in a Sri Lankan mixed dipterocarp forest. J. Ecol. 101, 149–160. doi: 10.1111/1365-2745.12017
Ratcliffe, S., Wirth, C., Jucker, T., van Der Plas, F., Scherer-Lorenzen, M., Verheyen, K., et al. (2017). Biodiversity and ecosystem functioning relations in European forests depend on environmental context. Ecol. Lett. 20, 1414–1426. doi: 10.1111/ele.12849
Ren, S. Y. (2021). Responses of plant diversity-productivity relationship to canopy gap disturbance in Tiantong evergreen broad-leaved forest. Ph.D. thesis, East China Normal University, Shanghai.
Ren, S., Yang, Q., Liu, H., Shen, G., Zheng, Z., Zhou, S., et al. (2021). The driving factors of subtropical mature forest productivity: stand structure matters. Forests 12:998. doi: 10.3390/f12080998
Sanaei, A., Ali, A., Yuan, Z., Liu, S., Lin, F., Fang, S., et al. (2021). Context-dependency of tree species diversity, trait composition and stand structural attributes regulate temperate forest multifunctionality. Sci. Total Environ. 757:143724. doi: 10.1016/j.scitotenv.2023.163391
Schuldt, A., Assmann, T., Brezzi, M., Buscot, F., Eichenberg, D., Gutknecht, J., et al. (2018). Biodiversity across trophic levels drives multifunctionality in highly diverse forests. Nat. Commun. 9:2989. doi: 10.1038/s41467-018-05421-z
Schuldt, A., Ebeling, A., Kunz, M., Staab, M., Guimarães-Steinicke, C., Bachmann, D., et al. (2019). Multiple plant diversity components drive consumer communities across ecosystems. Nat. Commun. 10:1460. doi: 10.1038/s41467-019-09448-8
Song, Y. C., Chen, X. Y., and Wang, X. H. (2005). Studies on evergreen broad-leaved forests of China: a retrospect and prospect. J. East China Norm. Univ. Nat. Sci. 1, 1–8.
Song, Y. Q., and Wang, X. R. (1995). Vegetation and flora of Tiang tong national forest park, Zhejiang Province, China. Shanghai: Shanghai Science and Technical Literature Press.
Takyu, M., Aiba, S. I., and Kitayama, K. (2003). Changes in biomass, productivity and decomposition along topographical gradients under different geological conditions in tropical lower montane forests on mount Kinabalu, Borneo. Oecologia 134, 397–404. doi: 10.1007/s00442-002-1115-1
Tan, L. Z., Fan, C. Y., and Fan, X. H. (2017). Relationships between species diversity or community structure and productivity of woody-plants in a broad-leaved Korean pine forest in Jiaohe, Jilin, China. Chin. J. Plant Ecol. 41, 1149–1156. doi: 10.17521/cjpe.2016.0321
Tilman, D., Naeem, S., Knops, J., Reich, P., Siemann, E., Wedin, D., et al. (1997). Biodiversity and ecosystem properties. Science 278, 1865–1869. doi: 10.1126/science.278.5345.1865c
Tilman, D., Reich, P. B., Knops, J., Wedin, D., Mielke, T., and Lehman, C. (2001). Diversity and productivity in a long-term grassland experiment. Science 294, 843–845. doi: 10.1038/s41467-023-40809-6
Tuo, B., Tian, W. B., Guo, C., Xu, M. S., Zheng, L. T., Su, T., et al. (2019). Latitudinal variation in soil carbon, nitrogen and phosphorus pools across island forests and shrublands in eastern China. Chin. J. Appl. Ecol. 30, 2631–2638. doi: 10.13287/j.1001-9332.201908.017
Urgoiti, J., Messier, C., Keeton, W. S., Reich, P. B., Gravel, D., and Paquette, A. (2022). No complementarity no gain-net diversity effects on tree productivity occur once complementarity emerges during early stand development. Ecol. Lett. 25, 851–862. doi: 10.1111/ele.13959
van der Plas, F. (2019). Biodiversity and ecosystem functioning in naturally assembled communities. Biol. Rev. 94, 1220–1245. doi: 10.1111/brv.12499
Van der Plas, F., Ratcliffe, S., Ruiz-Benito, P., Scherer-Lorenzen, M., Verheyen, K., Wirth, C., et al. (2018). Continental mapping of forest ecosystem functions reveals a high but unrealised potential for forest multifunctionality. Ecol. Lett. 21, 31–42. doi: 10.1111/ele.12868
Wang, Z. H. (2013) The temporal and spatial distribution characteristics of litter production in an evergreen broad-leaved forest in Tiantong, Zhejiang Province, Eastern China. M.S. thesis, East China Normal University, Shanghai.
Williams, L. J., Paquette, A., Cavender-Bares, J., Messier, C., and Reich, P. B. (2017). Spatial complementarity in tree crowns explains overyielding in species mixtures. Nat. Ecol. Evol. 1:0063. doi: 10.1038/s41559-016-0063
Xie, Y., Ma, Z., Yang, Q., Fang, X., Zhang, Z., Yan, E., et al. (2012). Coexistence mechanisms of evergreen and deciduous trees based on topographic factors in Tiantong region, Zhejiang Province, eastern China. Biodivers. Sci. 20, 159–167. doi: 10.3724/SP.J.1003.2012.09242
Xu, Y., Franklin, S. B., Wang, Q., Shi, Z., Luo, Y., Lu, Z., et al. (2015). Topographic and biotic factors determine forest biomass spatial distribution in a subtropical mountain moist forest. For. Ecol. Manage. 357, 95–103. doi: 10.1016/j.foreco.2015.08.010
Xu, W., Ma, Z., Jing, X., and He, J. (2016). Biodiversity and ecosystem multifunctionality: advances and perspectives. Biodivers. Sci. 24, 55–71. doi: 10.17520/biods.2015091
Yang, Q., Ma, Z., Xie, Y., Zhang, Z., Wang, Z., Liu, H., et al. (2011). Community structure and species composition of an evergreen broadleaved forest in Tiantong's 20 ha dynamic plot, Zhejiang Province, eastern China. Biodivers. Sci. 19, 215–223. doi: 10.3724/SP.J.1003.2011.09013
Yang, Q. S., Shen, G. C., Liu, H. M., Wang, Z. H., Ma, Z. P., Fang, X. F., et al. (2016). Detangling the effects of environmental filtering and dispersal limitation on aggregated distributions of tree and shrub species: life stage matters. PloS One 11:e0156326. doi: 10.1371/journal.pone.0156326
Yang, Y., Wei, W., Wang, L., and Liu, Z. M. (2023). Relationship between plant diversity, productivity and environmental factors at a transect scale in the dryland of China. Acta Ecol. Sin. 43, 1–9.doi: 10.5846/stxb202202110335
Yuan, Z., Ali, A., Ruiz-Benito, P., Jucker, T., Mori, A. S., Wang, S., et al. (2020). Above-and below-ground biodiversity jointly regulate temperate forest multifunctionality along a local-scale environmental gradient. J. Ecol. 108, 2012–2024. doi: 10.1111/1365-2745.13378
Zavaleta, E. S., Pasari, J. R., Hulvey, K. B., and Tilman, G. D. (2010). Sustaining multiple ecosystem functions in grassland communities requires higher biodiversity. Proc. Natl. Acad. Sci. U. S. A. 107, 1443–1446. doi: 10.1073/pnas.0906829107
Zhang, Y., and Chen, H. Y. (2015). Individual size inequality links forest diversity and above-ground biomass. J. Ecol. 103, 1245–1252. doi: 10.1111/1365-2745.12425
Zhang, Z. G., Ma, Z. P., Liu, H. M., Zeng, Z. M., Xie, Y. B., Fang, X. F., et al. (2013). Topographic distribution patterns of forest gap within an evergreen broad-leaved forest in Tiantong region of Zhejiang Province, eastern China. Chin. J. Appl. Ecol. 24, 621–625.
Zheng, L. T. (2022). Impacts of herbaceous plants on the relationship between tree functional diversity and aboveground productivity in a young experimental forest. Ph.D. thesis, East China Normal University, Shanghai.
Zhu, Q., Liao, K., Lai, X., and Lv, L. (2021). Scale-dependent effects of environmental factors on soil organic carbon, soil nutrients and stoichiometry under two contrasting land-use types. Soil Use Manage. 37, 243–256. doi: 10.1111/sum.12695
Zhu, J., Wu, A., Zou, S., Xiong, X., Liu, S., Chu, G., et al. (2021). Relationships between tree diversity and biomass/productivity and their influence factors in a lower subtropical evergreen broad-leaved forest. Biodivers. Sci. 29, 1435–1446. doi: 10.17520/biods.2021014
Keywords: topography, species composition, functional trait diversity, structural diversity, forest multifunctionality
Citation: Wang J, Liu H, Yang Q, Shen G, Zhu X, Xu Y and Wang X (2023) Topography and structural diversity regulate ecosystem multifunctionality in a subtropical evergreen broad-leaved forest. Front. For. Glob. Change. 6:1309660. doi: 10.3389/ffgc.2023.1309660
Edited by:
Wensheng Bu, Jiangxi Agricultural University, ChinaCopyright © 2023 Wang, Liu, Yang, Shen, Zhu, Xu and Wang. This is an open-access article distributed under the terms of the Creative Commons Attribution License (CC BY). The use, distribution or reproduction in other forums is permitted, provided the original author(s) and the copyright owner(s) are credited and that the original publication in this journal is cited, in accordance with accepted academic practice. No use, distribution or reproduction is permitted which does not comply with these terms.
*Correspondence: Xihua Wang, eGh3YW5nQGRlcy5lY251LmVkdS5jbg==
Disclaimer: All claims expressed in this article are solely those of the authors and do not necessarily represent those of their affiliated organizations, or those of the publisher, the editors and the reviewers. Any product that may be evaluated in this article or claim that may be made by its manufacturer is not guaranteed or endorsed by the publisher.
Research integrity at Frontiers
Learn more about the work of our research integrity team to safeguard the quality of each article we publish.