 Songheng Jin1,2†
 Yi Chi1†
 Xueqin Li1
 Pengzhou Shu1Mengxun Zhu3Zheng Yuan1,2
 Yang Liu1
 Wenjing Chen4
 Yini Han1*
- 1Jiyang College, Zhejiang A&F University, Zhuji, China
- 2State Key Laboratory of Subtropical Silviculture, Zhejiang A&F University, Hangzhou, China
- 3Ecological Technology Research Institute, CIECC, Beijing, China
- 4School of Arts and Design, Nanjing Vocational University of Industry Technology, Nanjing, China
Introduction: Climate is crucial factor influencing species distribution, and with global climate change, the potential geographic distribution of species will also alter. In this study, three subtropical tree species (Cunninghamia lanceolata, Pinus taiwanensis, and Quercus glauca) of great ecological values were selected as research objects.
Methods: We applied a maximum entropy (MaxEnt) to predict their potential distributions under different climate scenarios in both present and future conditions based on 37 environmental factors. Jackknife test was used in key factors affecting species distribution. In addition, we explored the key environmental variables that affect their distributions and revealed the evolutionary patterns and migration trends of these tree species under future climate.
Results: The main findings are as follows: (1) Winter temperature, winter precipitation, and annual temperature range are identified as the key environmental variables affecting the potential geographic distribution of the three tree species; moreover, precipitation-related factors have a greater impact than temperature-related factors; (2) Currently suitable habitats for these three tree species are primarily located in subtropical China with decreasing suitability from south to north; (3) Under future climate conditions, the area of potentially suitable habitat for C. lanceolata continues to expand, while P. taiwanensis and Q. glauca tend to experience a reduction due to increasing greenhouse gas emissions over time; and (4) The centroid of suitable habitat for C. lanceolata shifts northward under future climate change, while the centroid of P. taiwanensis and Q. glauca move southward along with shrinking suitable habitat area.
Discussion: Our predictions highlight a high risk of habitat loss of Q. glauca under climate change, recommending management and conservation references for these three commonly used afforestation species under current and future climate change scenarios in China.
1 Introduction
Human activities have resulted in a surge in greenhouse gas emissions, leading to a substantial escalation in global average temperature. As industrialization progresses, there will be continued global warming, with projections indicating that the average increase is expected to surpass 1.5°C in the next two decades (Li et al., 2017) and extreme events becoming more frequent (IPCC, 2018). Regional variations exist in terms of warming levels, with China’s landmass anticipated to experience a higher temperature rise compared to the global average, with projected increases ranging from 1.3 to 5.0°C by century-end (Wang et al., 2017). Numerous studies have demonstrated that climate profoundly impacts species distribution and adaptive capacity, potentially resulting in reduced suitable habitats and biodiversity loss while also to develop new physiological traits for climate adaptation (Bowling et al., 2020; Wang et al., 2020; He et al., 2021). Consequently, predicting the potential geographic distribution of species under climate change has emerged as a prominent research topic within biogeography, ecology, and global change studies (Zhao et al., 2021). By employing models to assess potential species distribution under diverse climate scenarios, it becomes possible not only to comprehend their ecological requirements but also unveil dynamic changes occurring within their potential ranges. This holds significant implications for biogeographic and plant ecology concerning understanding species distribution evolution and responding effectively to climate change challenges (He, 2015).
Climate change, like extreme drought, high temperature, etc., has increasingly effects on typical subtropical plant (Zu et al., 2021; Ni et al., 2023; WMO, 2023). Cunninghamia lanceolata (Lamb.) Hook., Pinus taiwanensis Hayata and Quercus glauca Thunb as common native tree species in subtropical regions of China are widely applied because of their high economic, ecological and ornamental values (Du et al., 2019). C. lanceolata is renowned for its rapid growth, high productivity, and lightweight yet durable wood. Additionally, it possesses aromatic properties and exhibits resistance to insect and decay, making it a vital commercial timber species in China and a significant contributor to the country’s timber industry (Wang, 2013). P. taiwanensis thrives in cool and moist environments, primarily found in the mid-mountain areas of Zhejiang, Taiwan, Fujian and other subtropical regions (Xu et al., 2022). The wood of P. taiwanensis is straight-gained and of superior quality, displaying reduced susceptibility to pests and diseases while exhibiting high strength and hardness. It is well-suited for producing large-diameter timber and serves as an important species for both timber production and afforestation purposes (Song et al., 2008). Q. glauca has a wide distribution range spanning from northern regions such as Henan and Gansu to southern areas including Hainan Island; thus, dominating evergreen broad-leaved forests with China’s subtropical regions. With its exceptional economic values as an excellent timber tree species, Q. glauca also fulfills crucial ecological functions by serving as an important pioneer species for vegetation restoration (Wang et al., 2015). These common tree species in China’s subtropical region not only serve as significant wood resources but also play pivotal roles in both economic development and ecological conservation endeavors. However, global climate change has been impacting plant survival, reproduction, and ecological habits, resulting in alterations to the geographic distribution of tree species. This phenomenon may have profound implications on their future productivity (Doxford and Freckleton, 2012; Matías et al., 2017). In this context, predicting the potential distribution of these tree species under different current and future climate scenarios, and exploring the major environmental factors influencing their distribution will provide theoretical references for the conservation and sustainable management of common tree species in subtropical China under climate change.
Species Distribution Models (SDMs) are effective tools for predicting the potential geographic distribution of species under climate change, playing a crucial role in studying species’ ecological evolution and conservation planning (Kozak et al., 2008; Lu et al., 2021). Although various SDMs such as generalizations linear models (GLMs), Bioclimatic models, random forest (RF), and MaxEnt have been employed for species distribution predictions, the latter consistently outperforms other models in terms of tolerance and predictive accuracy (Phillips et al., 2006; Elith and Leathwick, 2009; Elith et al., 2011). This method is straightforward, requiring only known species distribution data and environmental variables for predictions (Zhao et al., 2021). Furthermore, it has lower sample size requirements compared to other models, enabling accurate predictions even with limited distribution data available (Pearson et al., 2007). As a result of its superior performance and flexibility in handing limited data availability issues, which has gained widespread popularity in research focused on predicting suitable geographic distributions of species with promising outcomes (Yang et al., 2013; Li et al., 2016; Kim et al., 2020).
In this study conducted within China, we utilized the MaxEnt along with ArcGIS software to investigate three common tree species, i.e., C. lanceolata, P. taiwanensis, and Q. glauca. Based on their realistic distributions and related environmental variables we predicted the potential suitable habitats as well as centroid shifts of these tree species under different current and future climate scenarios. The main objectives encompassed: (1) predicting the potential geographic distributions of the three tree species under current climate scenarios; (2) identifying major environmental factors affecting the potential distributions of the three species; and (3) predicting the potential geographic distributions of these three tree species under different climate scenarios in the future and exploring changes in their potential distributions, to facilitate the management and conservation of different tree species under climate change.
2 Materials and methods
2.1 Collecting and processing species occurrence data
The tree species occurrence records used in this study were obtained from the Global Biodiversity Information Facility (GBIF)1 and the National Plant Specimen Resource Center (CVH).2 Only records within China were retained for integration. To ensure accurate prediction results and avoid over-aggregation of distribution points, one distribution record was selected in each 2.5′ × 2.5′ grid after eliminating invalid and duplicate records. Ultimately, we collated and obtained 349 distribution points for C. lanceolata, 196 distribution points for P. taiwanensis, and 685 distribution points for Q. glauca to construct the model (Figure 1).
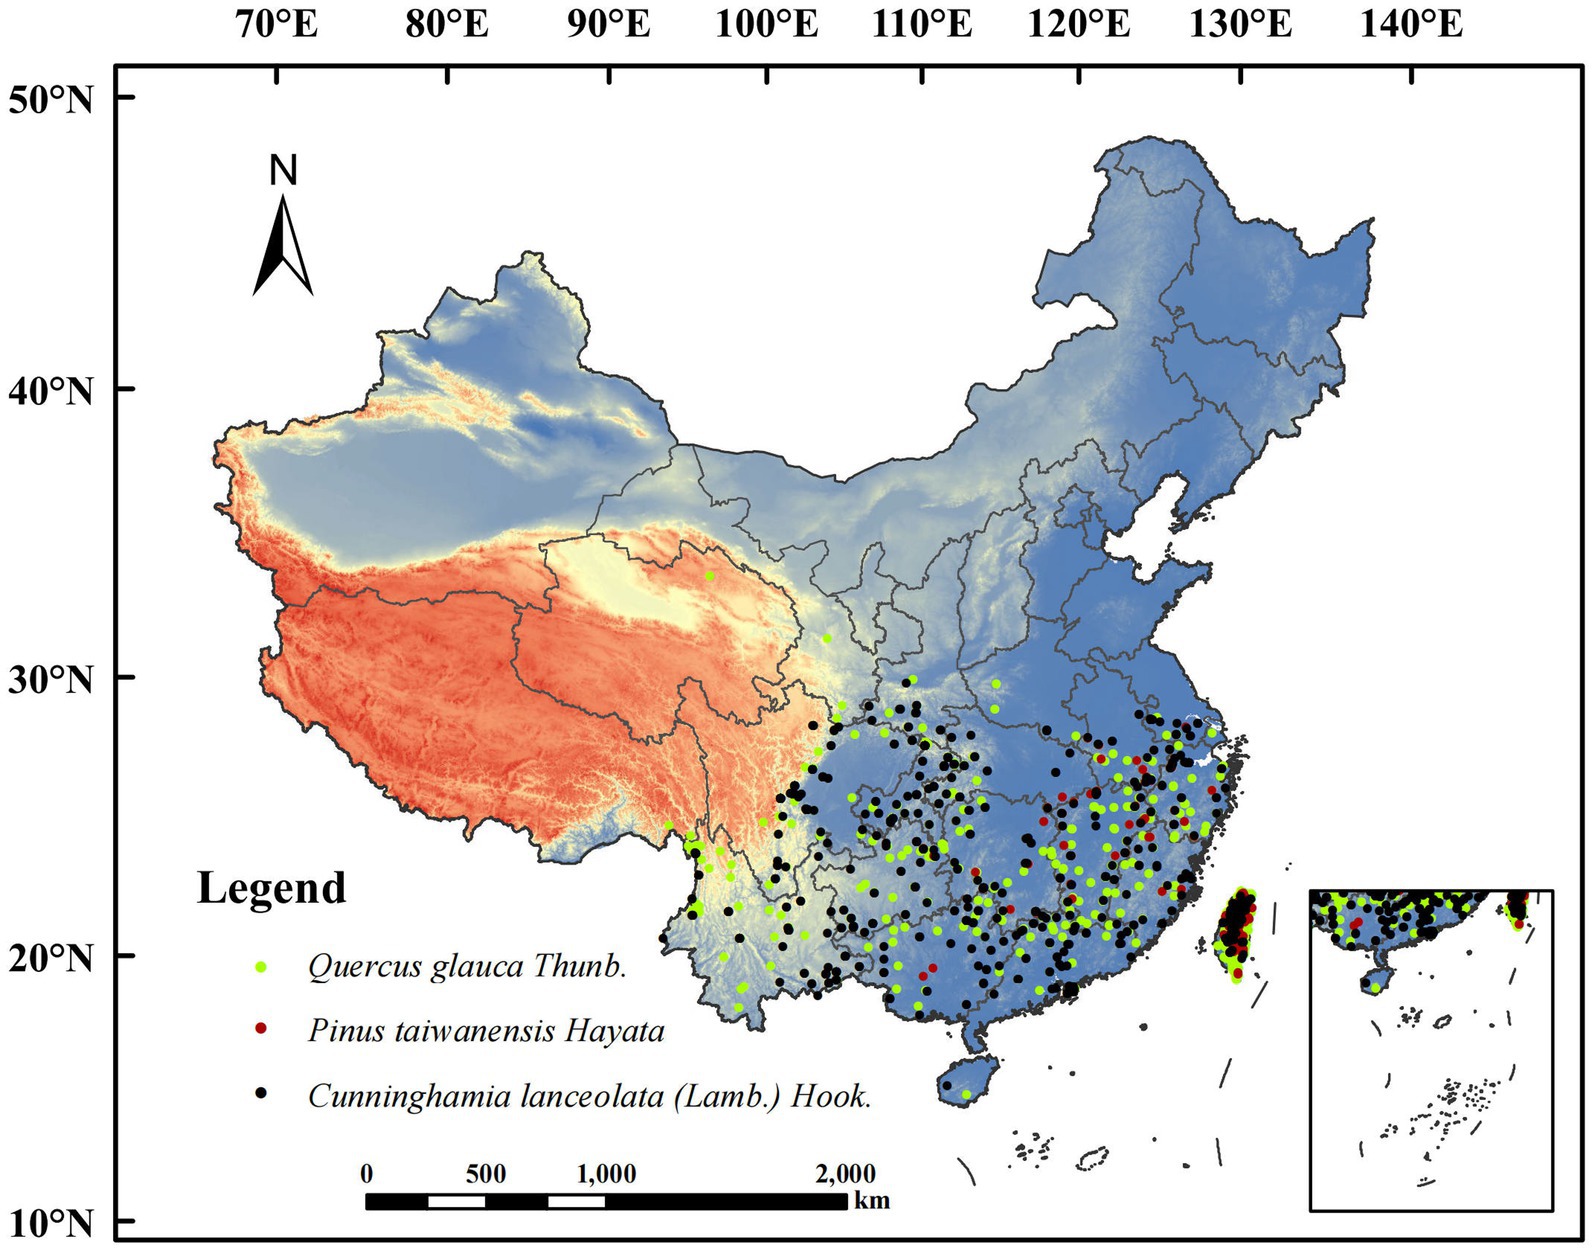
Figure 1. The realistic distribution of different tree species.
2.2 Collecting and processing environmental variables
A total of 37 environmental factors were selected for the study (Table 1), including: (1) topographic factors derived from elevation, slope, and aspect data from the Geospatial Data Cloud3; (2) soil factors comprising 15 basic soil indicators sourced from the Harmonized World Soil Database4; and (3) climate factors encompassing 19 bioclimatic variables obtained from the Worldclim database5, which included current (1970–2000) and future (2050s, 2090s) climate scenarios. For future scenarios, bioclimatic data for the 2050s represented the average from 2041 to 2060, and the data for the 2090s represented the average from 2,081 to 2,100. The future climate data (2050s, 2090s) was based on simulations using the BCC-CSM2-MR climate system model known for its robust performance in reproducing anomalous precipitation patterns in eastern China and exhibiting high spatial correlation to realistically simulate precipitation anomalies in this region (Xin et al., 2020). The emission pathways considered were SSP1-2.6 and SSP5-8.5 climate scenarios representing low greenhouse gas emission level sustainability scenario and a scenario with higher levels of greenhouse gas emissions, respectively (Eyring et al., 2016). All three types of environmental data were uniformly adjusted to a resolution of 2.5′ × 2.5′ using ArcGIS software, followed by conversion to ASC format for identification by the MaxEnt.
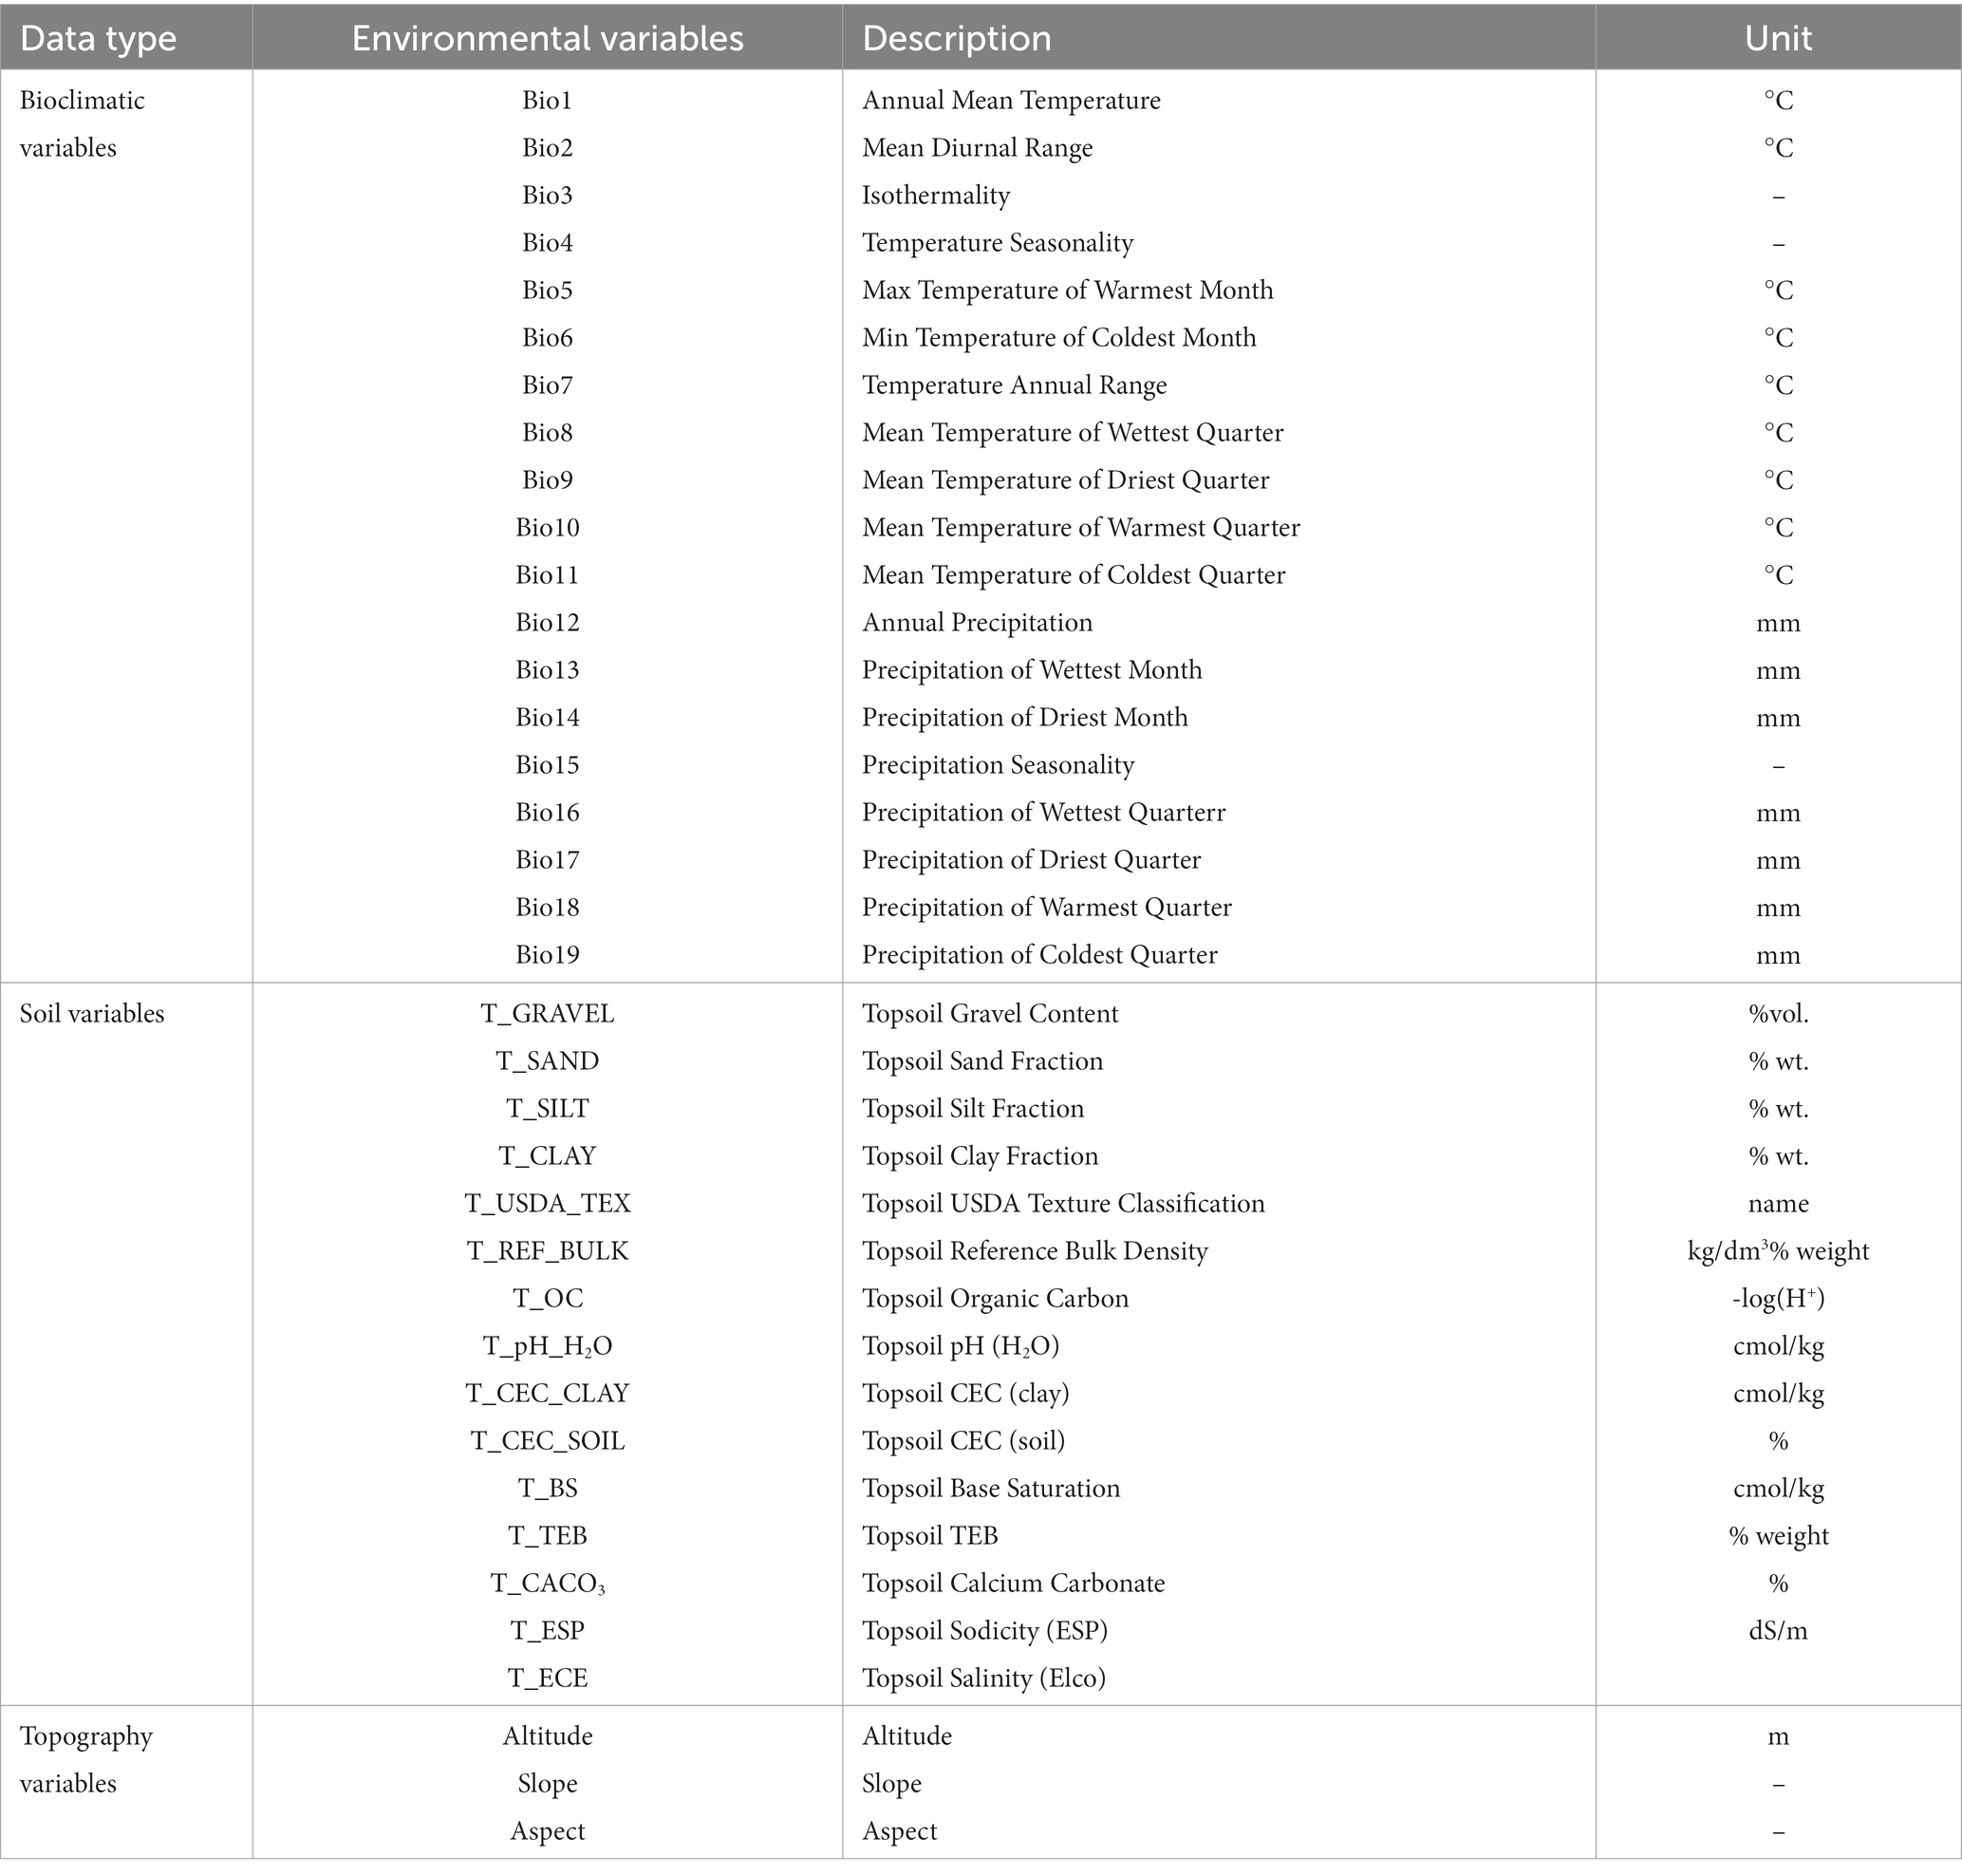
Table 1. Environmental variables used for the initial construction of the Maxent model.
Multicollinearity among environmental factors can lead to overfitting and uncertainty in the prediction results (Graham, 2003). To optimize model performance, careful selection of environmental variables is essential. Firstly, we used 37 environmental variables to construct the model and eliminated those with a contribution rate below 1%. Subsequently, the remaining environmental variables underwent Pearson correlation analysis; only those with correlation coefficients less than 0.8 were retained, however, if 2 or more environmental variables had correlation coefficients ≥0.80, preference was given to those with higher contribution rates (Zhao et al., 2020). Finally, the selected environmental variables were incorporated in to the MaxEnt for final modeling.
2.3 Parameterization and accuracy verification
We imported geographic distribution data (in CSV format) and environmental data (in ASC format) of different tree species into the MaxEnt for modeling and repeated 10 times. 75% of the distribution data were used as training data and the remaining 25% were used as test data (Phillips, 2008). The replicated run type was set to “Cross-validate” with a maximum iterations limit of 500. In addition, the output format was set to “Logistic” and saved it in “asc” file type. To explore the main environmental variables affecting tree species distribution, we employed the Jackknife method to assess their importance and analyzed their impact on tree species distribution by creating response curves (Narouei-Khandan et al., 2016).
The evaluation of the model prediction results is an essential part of the model simulation process. In this study, we used the area under the receiver operating characteristic curve (ROC), commonly referred as AUC value (area under curve), as a metric for assessing the predictive performance of the model (Qin et al., 2017). The AUC values were confined within the range of [0.5, 1], with higher values indicating stronger model accuracy. It is generally considered that 0.5 < AUC ≤ 0.7 indicate poor model performance and low confidence, 0.7 < AUC ≤ 0.9 signify moderate model performance, and 0.9 < AUC ≤ 1 denote excellent model performance and high confidence levels (Peterson et al., 2011).
2.4 Classification of suitable habitats
The predictions of the model are expressed as the probability of species occurrence in the predicted area (P), representing habitat suitability on a scale from 0 to 1. We categorized the model’s suitability into four classes: unsuitable habitat (p < 0.1), poorly suitable habitat (0.1 ≤ p < 0.3), moderately suitable habitat (0.3 ≤ p < 0.5), and highly suitable habitat (0.5 ≤ p < 1) (Zhao et al., 2021). These categories are visually represented using distinct colors.
We used the SDM Toolbox in ArcGIS to visualize changes in tree species habitat under different climate scenarios and compare them with current distributions (Brown, 2014; Hu et al., 2017). The results were subsequently classified into three categories: decreased area, increased area, and invariant area (Liu et al., 2022). In addition, we calculated the centroids of suitable habitats under both present and future climate scenarios, and derived their migration distance.
3 Results
3.1 Model accuracy and key environmental variables
The AUC values for the three tree species were generated to evaluate model performance (Figure 2). The AUC values for C. lanceolata, P. taiwanensis, and Q. glauca were 0.904, 0.979, and 0.924 respectively, indicating excellent performance of the model with high confidence in predicting their potential geographic distribution.
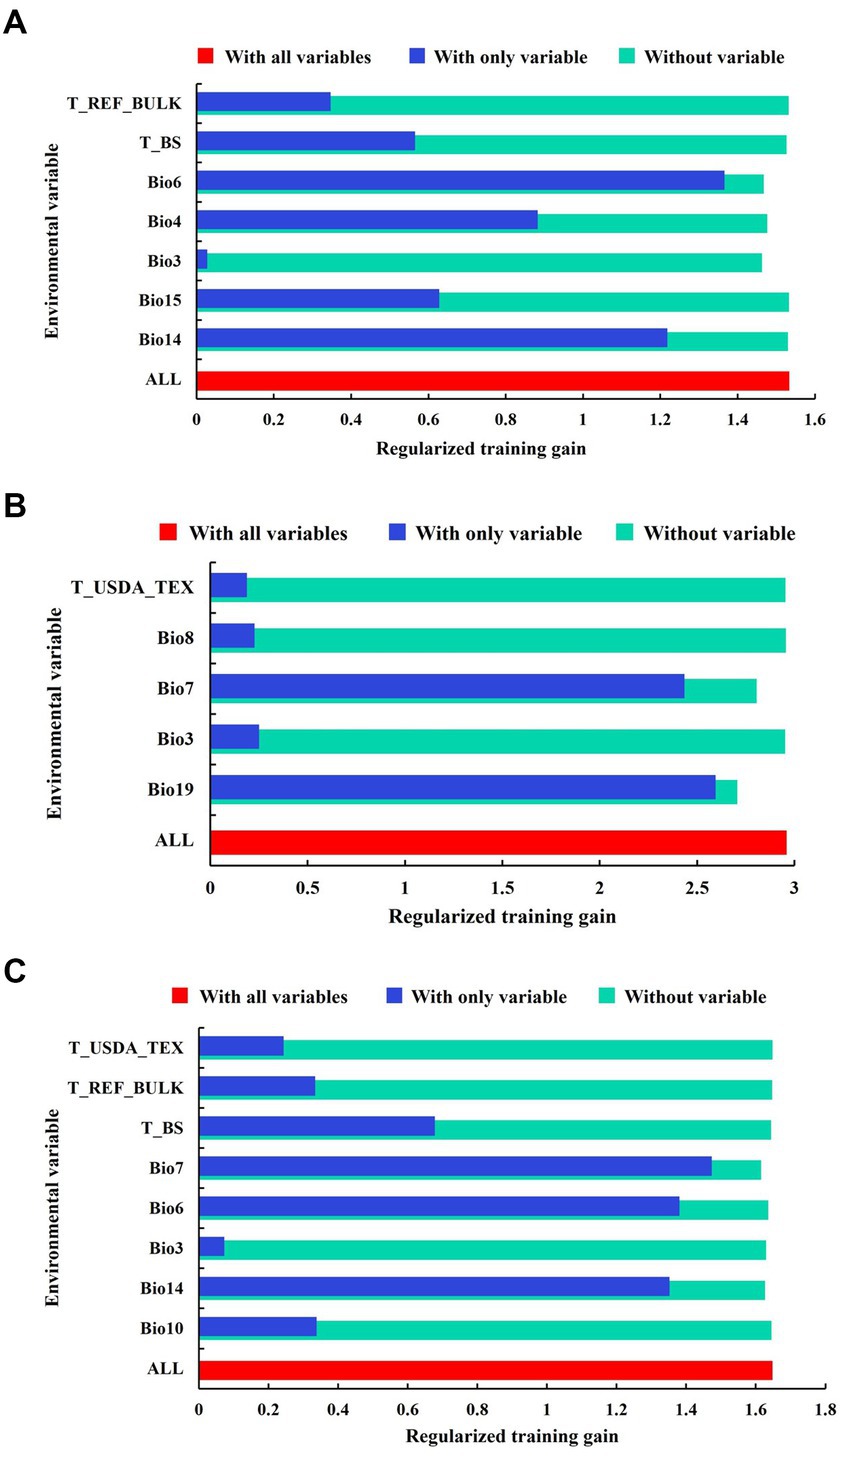
Figure 2. Jackknife test of each environmental variable on the potential distribution of C. lanceolata (A), P. taiwanensis (B), and Q. glauca (C). (“T_REF_BULK” is topsoil reference bulk density; “T_BS” is topsoil base saturation; “T_USDA_TEX” is topsoil USDA texture classification; “Bio8” is mean temperature of wettest quarter; “Bio7” is annual temperature range; “Bio6” is minimum temperature of the coldest month; “Bio4” is temperature seasonality; “Bio3” is isothermality; “Bio14” is precipitation of the driest month; “Bio15” is precipitation seasonality; “Bio10” is mean temperature of the warmest quarter; “Bio19” is precipitation of coldest quarter).
The jackknife test conducted to assess the importance of environmental variables revealed certain variables had significant contributions to each species’ distribution models: (1) For C. lanceolata, the minimum temperature of the coldest month (Bio6) accounted for 26.2% variation; precipitation of the driest month (Bio14) contributed 60.1% variation; temperature seasonality (Bio4) explained 6.8% variation; and precipitation seasonality (Bio15) accounted for 0.7% variation. These variables collectively contributed up to an impressive cumulative contribution of 93.8% (Table 2 and Figure 2A). (2) For P. taiwanensis, precipitation of the coldest quarter (Bio19) was responsible for a substantial portion at around 66.8% variation; annual temperature range (Bio7) explained 29.6% of variation; isothermality (Bio3) contributed to only a minor portion at around 2.1%; and mean temperature of the wettest quarter (Bio8) accounted for only a small proportion at around 0.5%. These variables combined resulted in a cumulative contribution as high as 99.0% (Table 2 and Figure 2B). (3) For Q. glauca, precipitation of the driest month (Bio14) had the major influence with 64.8% variation; annual temperature range (Bio7) was found to explain 21.7% variation; minimum temperature of the coldest month (Bio6) contributed to 8.0% variation; and topsoil base saturation (T_BS), although having a low impact, still played a role by contributing 1.2% variation. These four variables have cumulative contributions of 95.7% (Table 2 and Figure 2C).
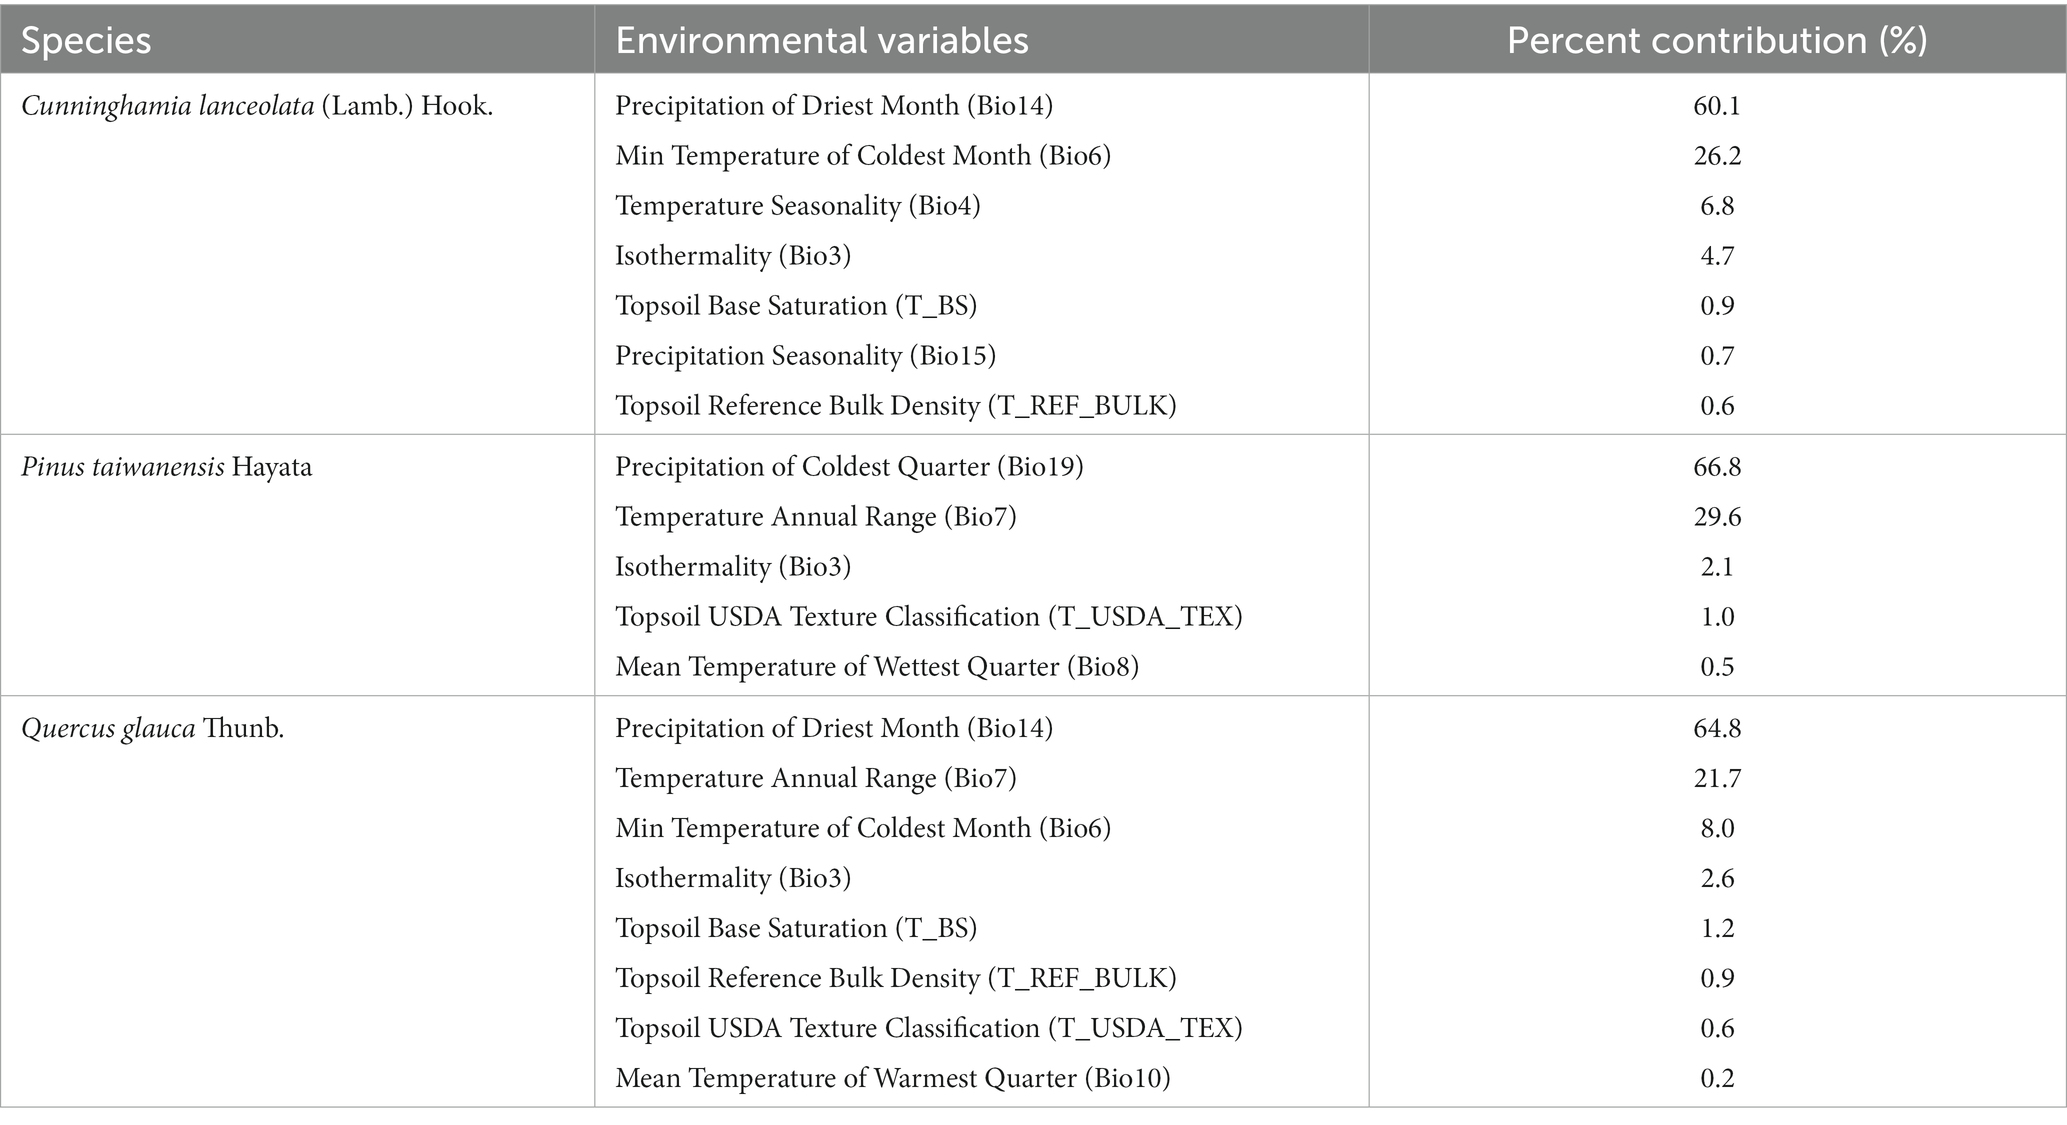
Table 2. Contribution of each environmental variable to the potential distribution of different tree species.
The above environmental variables were identified as the primary factors affecting the potential distribution of the three tree species, and their response curves were derived by modeling. By utilizing the response curves, we obtained a suitable range for the main environmental variables (p > 0.5). For C. lanceolata, Bio6 ranged from 3.21 to 13.57°C, Bio14 ranged from 18.83 to 194.70 mm, Bio4 ranged from 314.14 to 587.71, and Bio15 ranged from 42.40 to 72.51. For P. taiwanensis, Bio19 ranged from 232.92 to 698.50 mm, Bio7 ranged from 8.21 to 18.57°C, Bio3 ranged from 32.67 to 40.14, and Bio8 ranged from 10.87 to 19.07°C. For Q. glauca, Bio7 ranged from 6.33 to 20.15°C, Bio6 ranged from 6.29 to 23.45°C, Bio14 from 38.95 to 222.2 mm, and T_BS ranged from 18.99 to 45.90% (Figure 3).
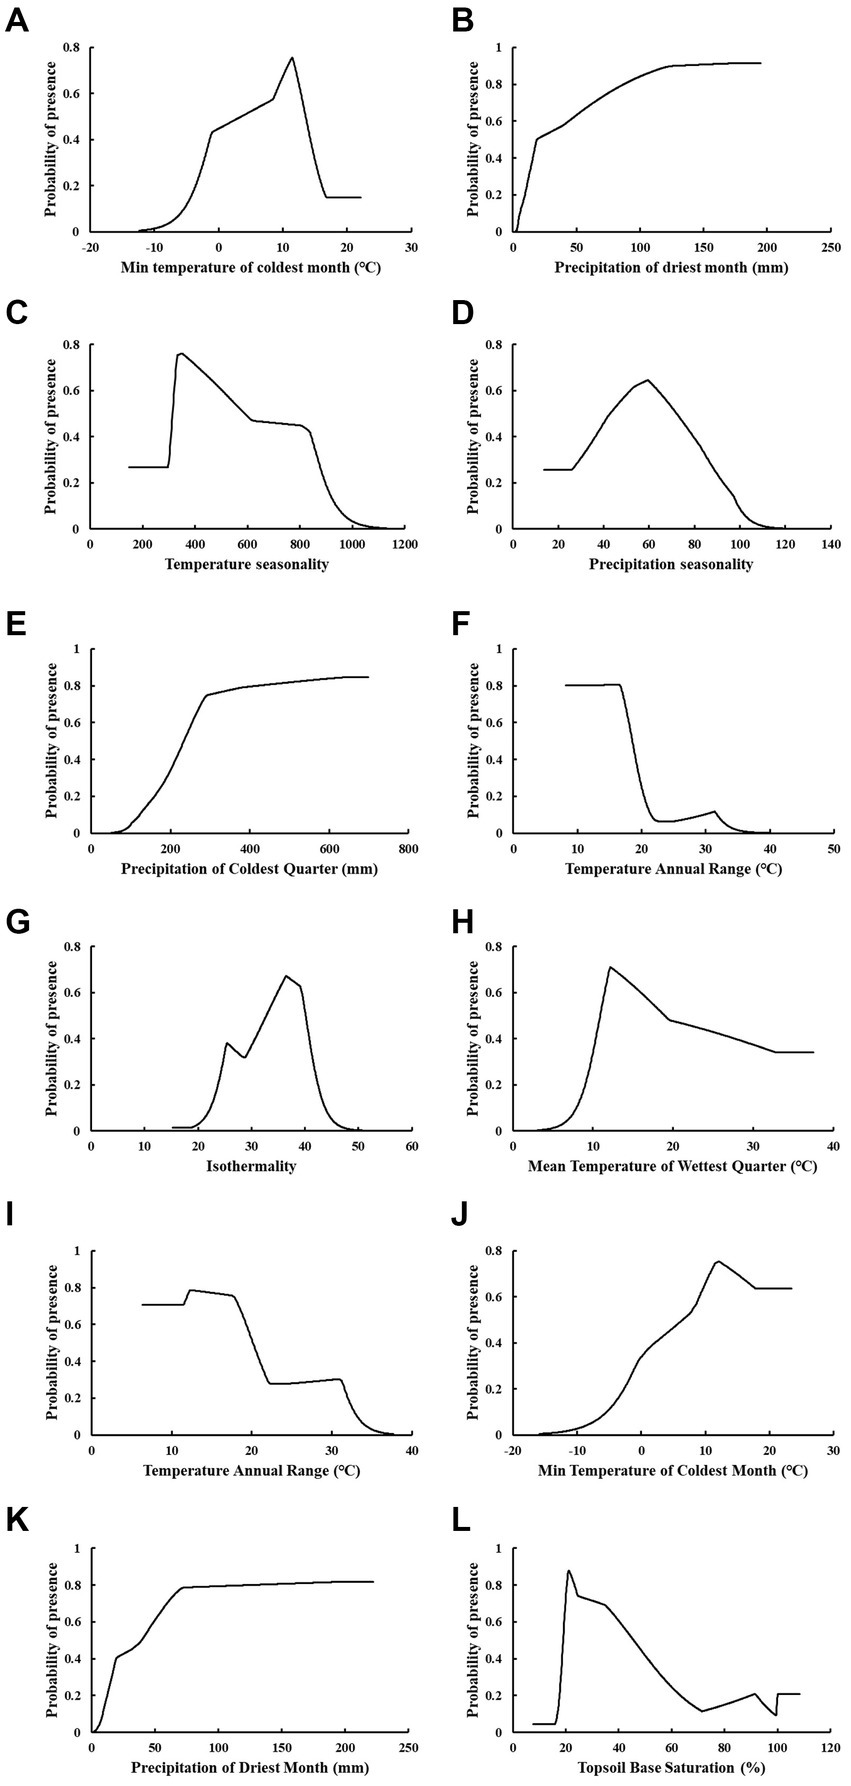
Figure 3. Response curves of the main environmental variables of C. lanceolata (A–D), P. taiwanensis (E–H), and Q. glauca (I–L).
3.2 Potential distribution under current climate conditions
According to the model simulations, the total area of suitable habitat for C. lanceolata under current climate conditions was 226.36 × 10⁴ km2, accounting for 23.58% of the whole study area. The highly suitable habitat was mainly concentrated in Guangdong, Guangxi, Taiwan, and western Chongqing, with an area of 38.29 × 10⁴ km2. The moderately suitable habitat was mainly concentrated in Guizhou, Hunan, Jiangxi, Zhejiang, Fujian, eastern Sichuan, central and southern Hubei, Anhui, and southern Jiangsu, with an area of 138.41 × 10⁴ km2 (Figure 4A). The total suitable habitat for P. taiwanensis was 69.92 × 10⁴ km2, accounting for 7.28% of the whole study area. The highly suitable habitat was mainly concentrated in most areas of Taiwan, with an area of 2.02 × 10⁴ km2. The moderately suitable habitat was smaller, mainly concentrated in northeastern Jiangxi, and central Taiwan, with an area of 0.87 × 10⁴ km2 (Figure 4B). The total suitable habitat of Q. glauca was 223.78 × 10⁴ km2, accounting for 23.31% of the whole study area. The area of highly suitable habitat was mainly concentrated in Taiwan and southern Hainan, with an area of 4.34 × 10⁴ km2. The moderately suitable habitat was mainly concentrated in Guangdong, Guangxi, Hunan, Jiangxi, Zhejiang, Fujian, southern Hainan, and southern Anhui, with a coverage area of 91.97 × 10⁴ km2 (Figure 4C).
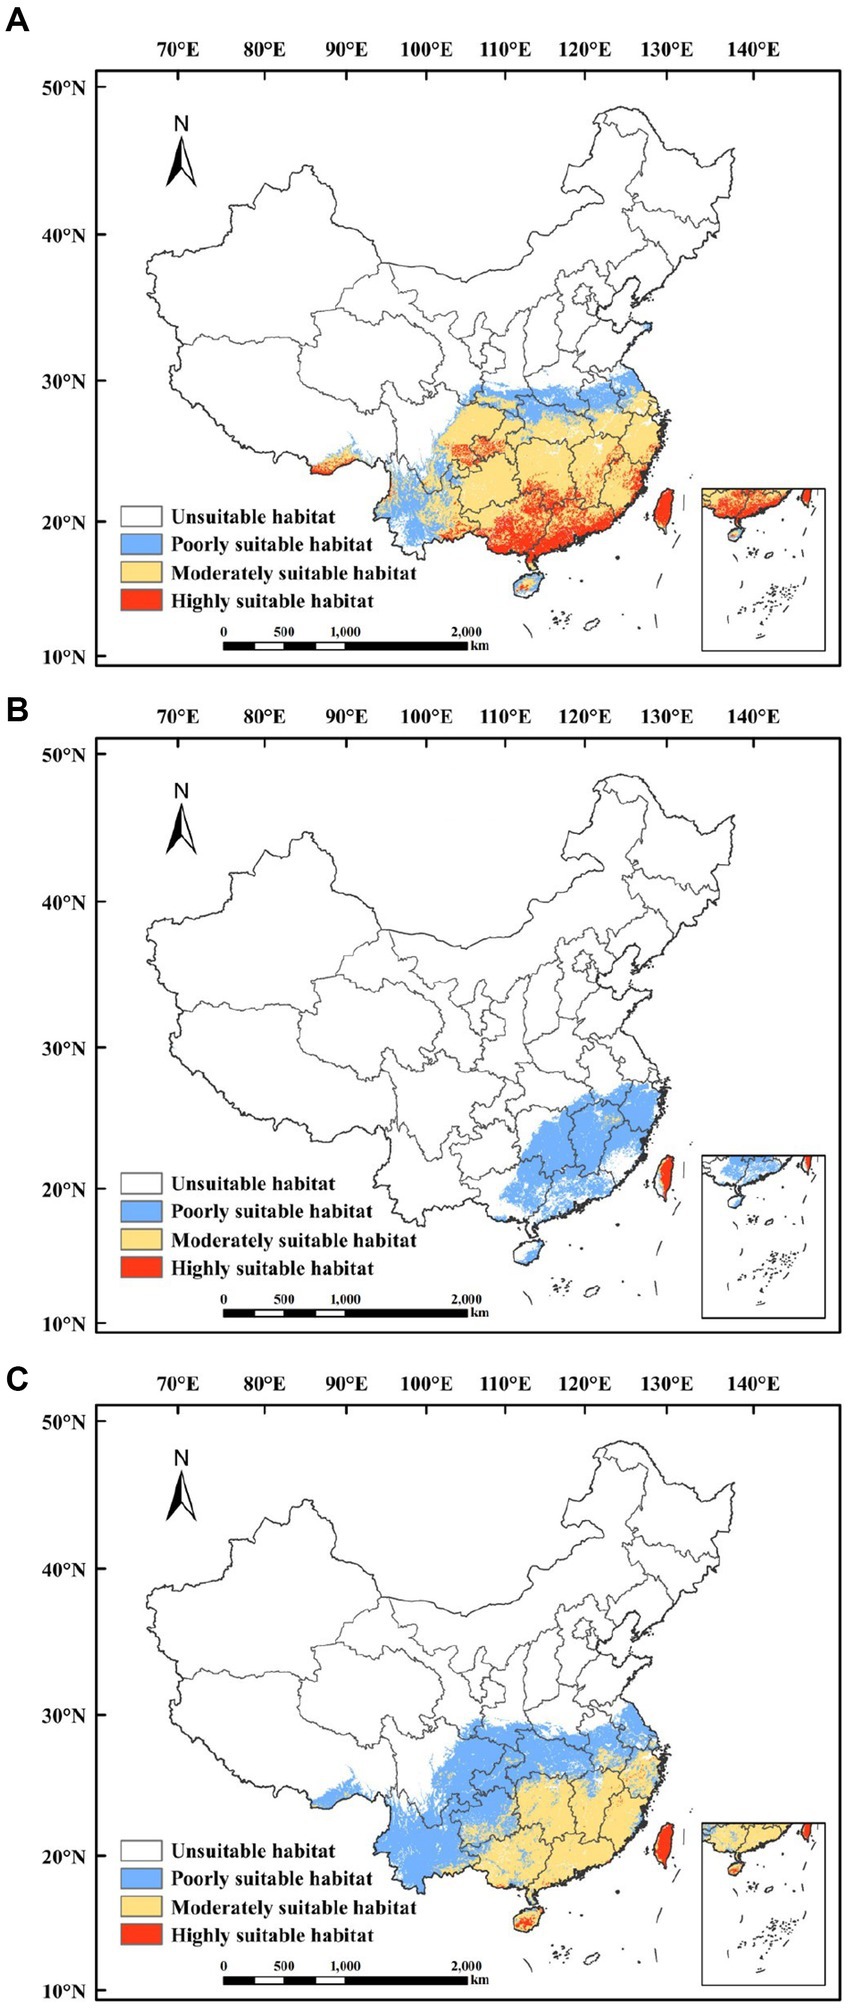
Figure 4. Potential suitable habitats for C. lanceolata (A), P. taiwanensis (B), and Q. glauca (C) in the current period.
3.3 Potential distribution under future climate conditions
We the potential suitable habitats for the three different tree species have been identified in the 2050s and 2090s under the climate scenarios of SSP1-2.6 and SSP5-8.5, respectively (Figure 5). Under the SSP1-2.6 climate scenario, C. lanceolata exhibited a total suitable habitat area of 239.32 × 10⁴ km2 in the 2050s, accounting for approximately 24.93% of the study area extent. The highly suitable habitat covered an area of 26.78 × 10⁴ km2 while moderately suitable habitat spanned across an area of 150.46 × 10⁴ km2 during this period. By the end of the century (2090s), C. lanceolata’s total suitable habitat expanded to cover an area measuring at around 253.05 × 10⁴ km2, accounting for 26.36% of the study area. The areas of highly suitable habitat and moderately suitable habitat were 48.04 × 10⁴ km2 and 145.10 × 10⁴ km2, respectively. Under the SSP5-8.5 climate scenario, the total suitable habitat area of C. lanceolata in the 2050s was 259.19 × 10⁴ km2, accounting for 27.0% of the study area. The areas of highly suitable habitat and moderately suitable habitat were 35.71 × 10⁴ km2 and 154.85 × 10⁴ km2, respectively. By the 2090s, the total suitable habitat area was 261.49 × 10⁴ km2, accounting for 27.24% of the study area. The areas of highly suitable habitat and moderately suitable habitat were 10.56 × 10⁴ km2 and 151.16 × 10⁴ km2, respectively.
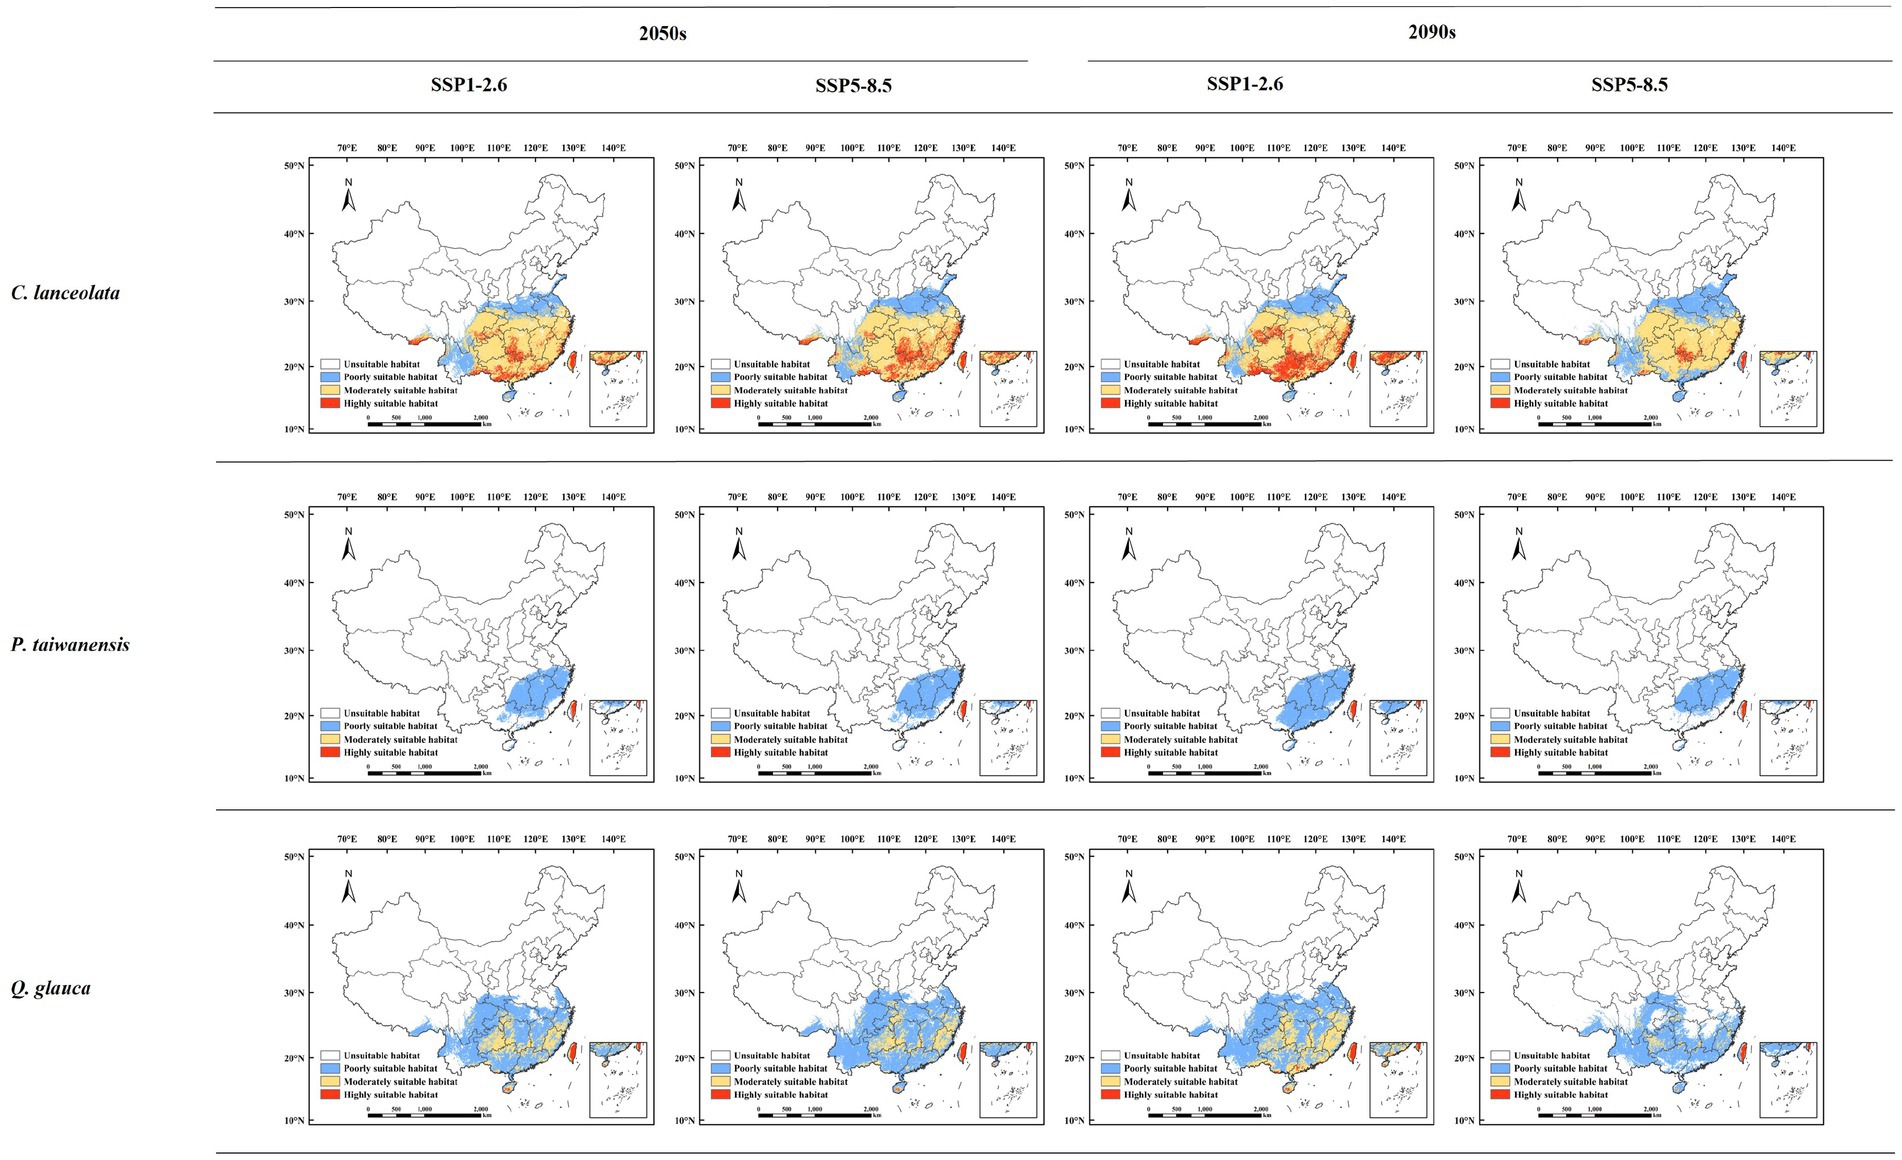
Figure 5. Potential suitable habitats for different tree species under future climatic scenarios.
Under the SSP1-2.6 climate scenario, the total suitable habitat area for P. taiwanensis in the 2050s was 66.82 × 10⁴ km2, accounting for 6.96% of the study area. The areas of highly suitable habitat and moderately suitable habitat were 1.68 × 10⁴ km2 and 0.45 × 10⁴ km2, respectively. By the 2090s, the total suitable habitat area was 80.59 × 10⁴ km2, accounting for 8.39% of the study area. The areas of highly suitable habitat and moderately suitable habitat were 1.97 × 10⁴ km2 and 0.48 × 10⁴ km2, respectively. Under the SSP5-8.5 climate scenario, the total suitable habitat area of P. taiwanensis in the 2050s was 68.18 × 10⁴ km2, accounting for 7.10% of the study area. The areas of highly suitable habitat and moderately suitable habitat were 1.87 × 10⁴ km2 and 0.41 × 10⁴ km2, respectively. By the 2090s, the total suitable habitat area was 60.99 × 10⁴ km2, accounting for 6.35% of the study area. The areas of highly suitable habitat and moderately suitable habitat were 1.66 × 10⁴ km2 and 0.40 × 10⁴ km2, respectively.
Under the SSP1-2.6 climate scenario, the total suitable habitat area for Q. glauca in the 2050s was 207.48 × 10⁴ km2, accounting for 21.61% of the study area. The areas of highly suitable habitat and moderately suitable habitat were 2.69 × 10⁴ km2 and 49.81 × 10⁴ km2, respectively. By the 2090s, the total suitable habitat area was 234.22 × 10⁴ km2, accounting for 24.40% of the study area. The areas of highly suitable habitat and moderately suitable habitat were 3.74 × 10⁴ km2 and 70.63 × 10⁴ km2, respectively. Under the SSP5-8.5 climate scenario, the total suitable habitat area of Q. glauca in the 2050s was 231.37 × 10⁴ km2, accounting for 24.10% of the study area. The areas of highly suitable habitat and moderately suitable habitat were 2.50 × 10⁴ km2 and 48.23 × 10⁴ km2, respectively. By the 2090s, the total suitable habitat area was 164.17 × 10⁴ km2, accounting for 17.10% of the study area. The areas of highly suitable habitat and moderately suitable habitat were 1.79 × 10⁴ km2 and 15.18 × 10⁴ km2, respectively.
3.4 Changes in potential habitat under future climate conditions
Under the SSP1-2.6 climate scenario, the projected increase in the area of C. lanceolata in the 2050s was estimated to be 16.64 × 10⁴ km2, while the decrease accounted for 3.98 × 10⁴ km2, accounting for 6.59 and 1.58% of the total suitable area, respectively (Figure 6). By the 2090s, the increased area and decreased area were predicted to be about 26.86 × 10⁴ km2 and 0.22 × 10⁴ km2, accounting for 10.08 and 0.08% of the total suitable area, respectively. Under the SSP5-8.5 climate scenario, the predicted increased area in the 2050s was 33.15 × 10⁴ km2 and the decreased area was 0.03 × 10⁴ km2, accounting for 12.14 and 0.01% of the total suitable area, respectively. By the 2090s, the increased area and decreased area were predicted to be about 37.52 × 10⁴ km2 and 2.62 × 10⁴ km2, accounting for 13.66 and 0.95% of the total suitable area, respectively.
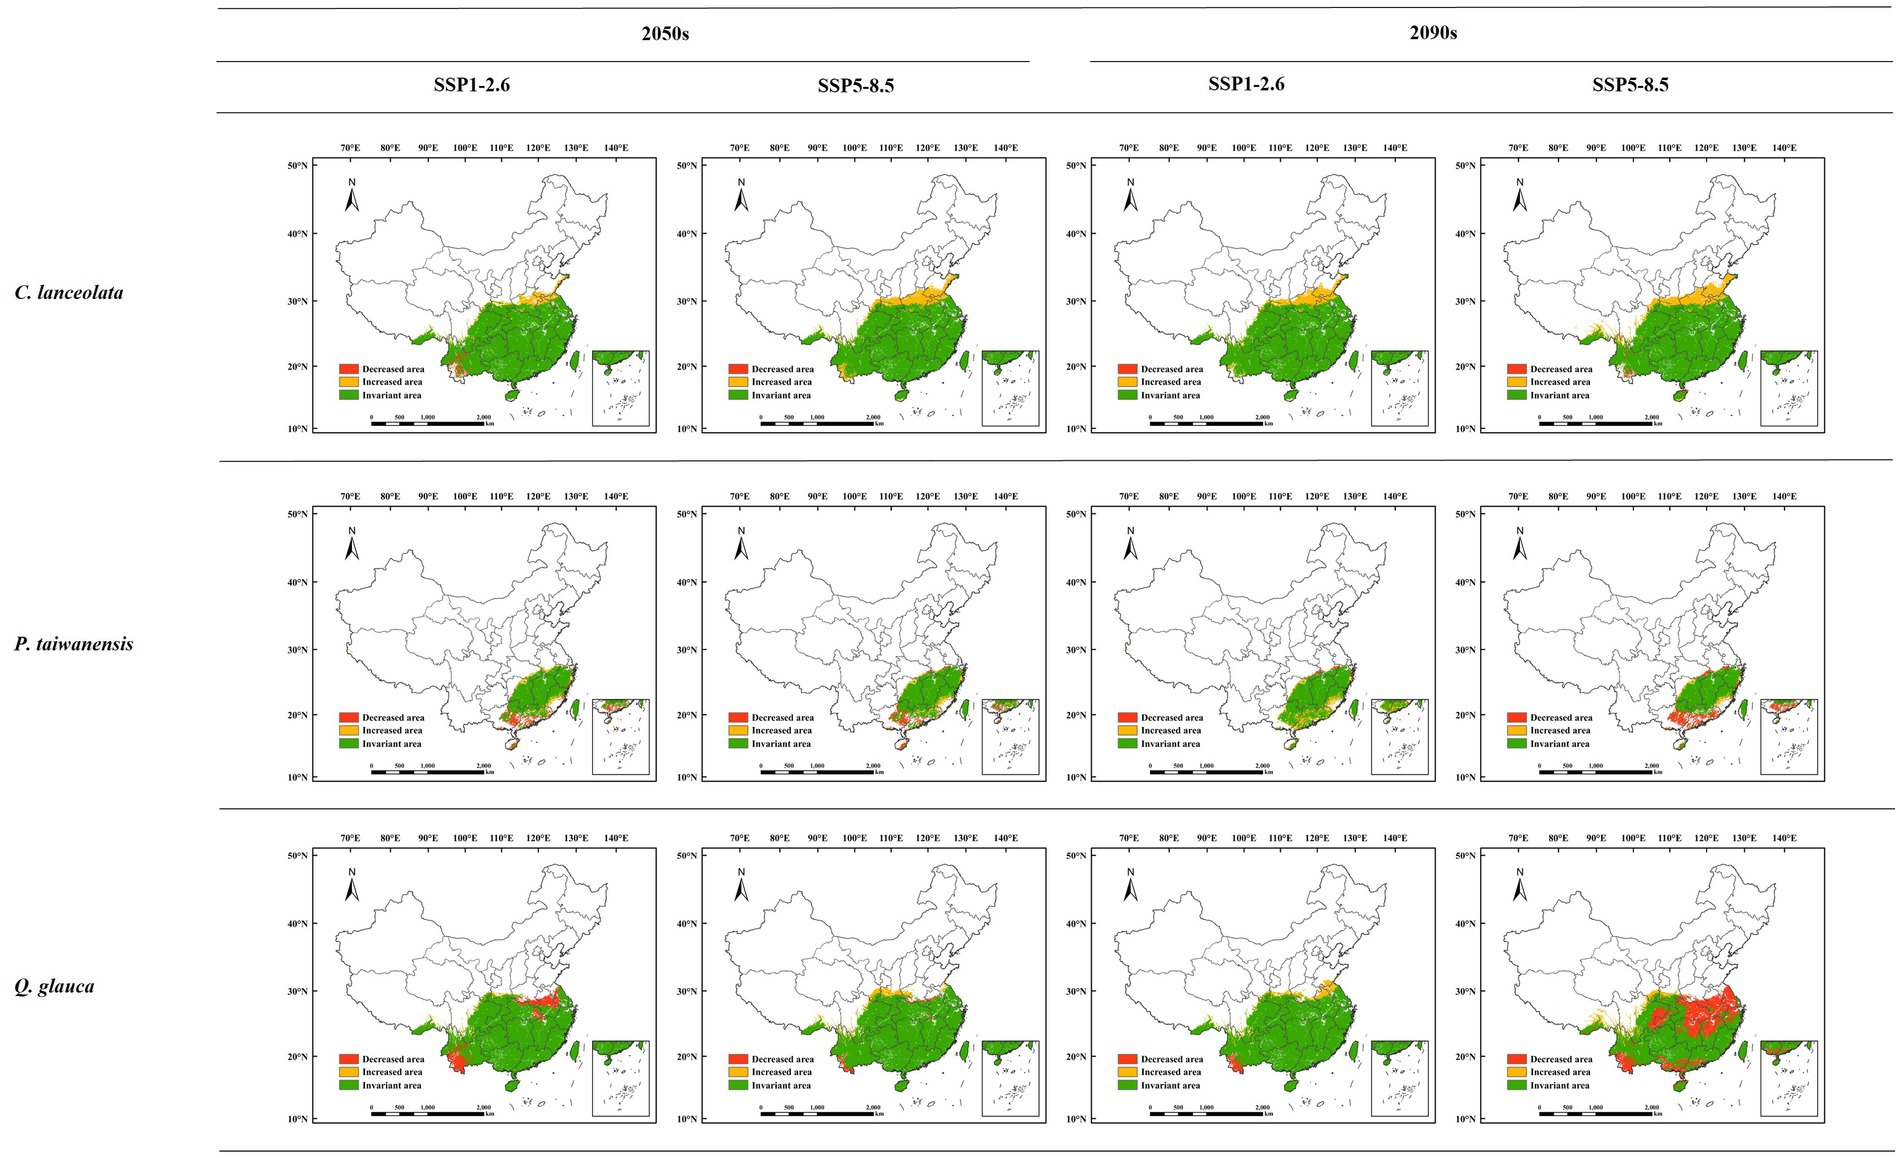
Figure 6. Changes in the potential suitable habitat for different tree species under future climate scenarios.
Under the SSP1-2.6 climate scenario, the predicted expansion of P. taiwanensis in the 2050s was 6.02 × 10⁴ km2, while the decreased area was 9.69 × 10⁴ km2, accounting for 8.39 and 13.51% of the total suitable area, respectively. By the 2090s, it is anticipated that there will be an increase in area by about 13.31 × 10⁴ km2 and 1.60 × 10⁴ km2, accounting for 15.28 and 1.84% of the total suitable area, respectively. Under the SSP5-8.5 climate scenario, the predicted increased area in the 2050s was 6.31 × 10⁴ km2 and the decreased area was 8.39 × 10⁴ km2, accounting for 8.60 and 11.44% of the total suitable area, respectively. By the 2090s, the increased area and decreased area were predicted to be about 4.74 × 10⁴ km2 and 14.69 × 10⁴ km2, accounting for 7.24 and 22.44% of the total suitable area, respectively.
Under the SSP1-2.6 climate scenario, the projected expansion of Q. glauca in the 2050s was estimated to be 4.93 × 10⁴ km2, and the decreased area was 22.1 × 10⁴ km2, accounting for 2.24% and 10.03 of the total suitable area, respectively. By the 2090s, the increased area and decreased area were predicted to be about 15.06 × 10⁴ km2 and 4.86 × 10⁴ km2, accounting for 6.08 and 1.96% of the total suitable area, respectively. Under the SSP5-8.5 climate scenario, the predicted increased area in the 2050s was 12.47 × 10⁴ km2 and the decreased area was 5.02 × 10⁴ km2, accounting for 5.09 and 2.05% of the total suitable area, respectively. By the 2090s, the increased area and decreased area were predicted to be about 13.26 × 10⁴ km2 and 75.83 × 10⁴ km2, accounting for 7.58 and 43.33% of the total suitable area, respectively.
3.5 Trends in potential habitat centroids under future climate conditions
The centroids and migration distances for the total suitable habitats of the three tree species were calculated using ArcGIS for different periods and different climate scenarios (Figure 7). Under the SSP1-2.6 climate scenario, the centroid of suitable habitat for C. lanceolata initially shifted 62.23 km northeast to 110.58°E, 28.22°N (2050s), followed by a subsequent movement of 12.5 km northwest to 110.5°E, 28.31°N (2090s). While, under the SSP5-8.5 climate scenario, the centroid of suitable habitat exhibited a northward shift of 68.56 km to 110.35°E, 28.34°N (2050s) and then further moved northeast by an additional distance of 36.22 km to 110.51°E, 28.64°N (2090s).
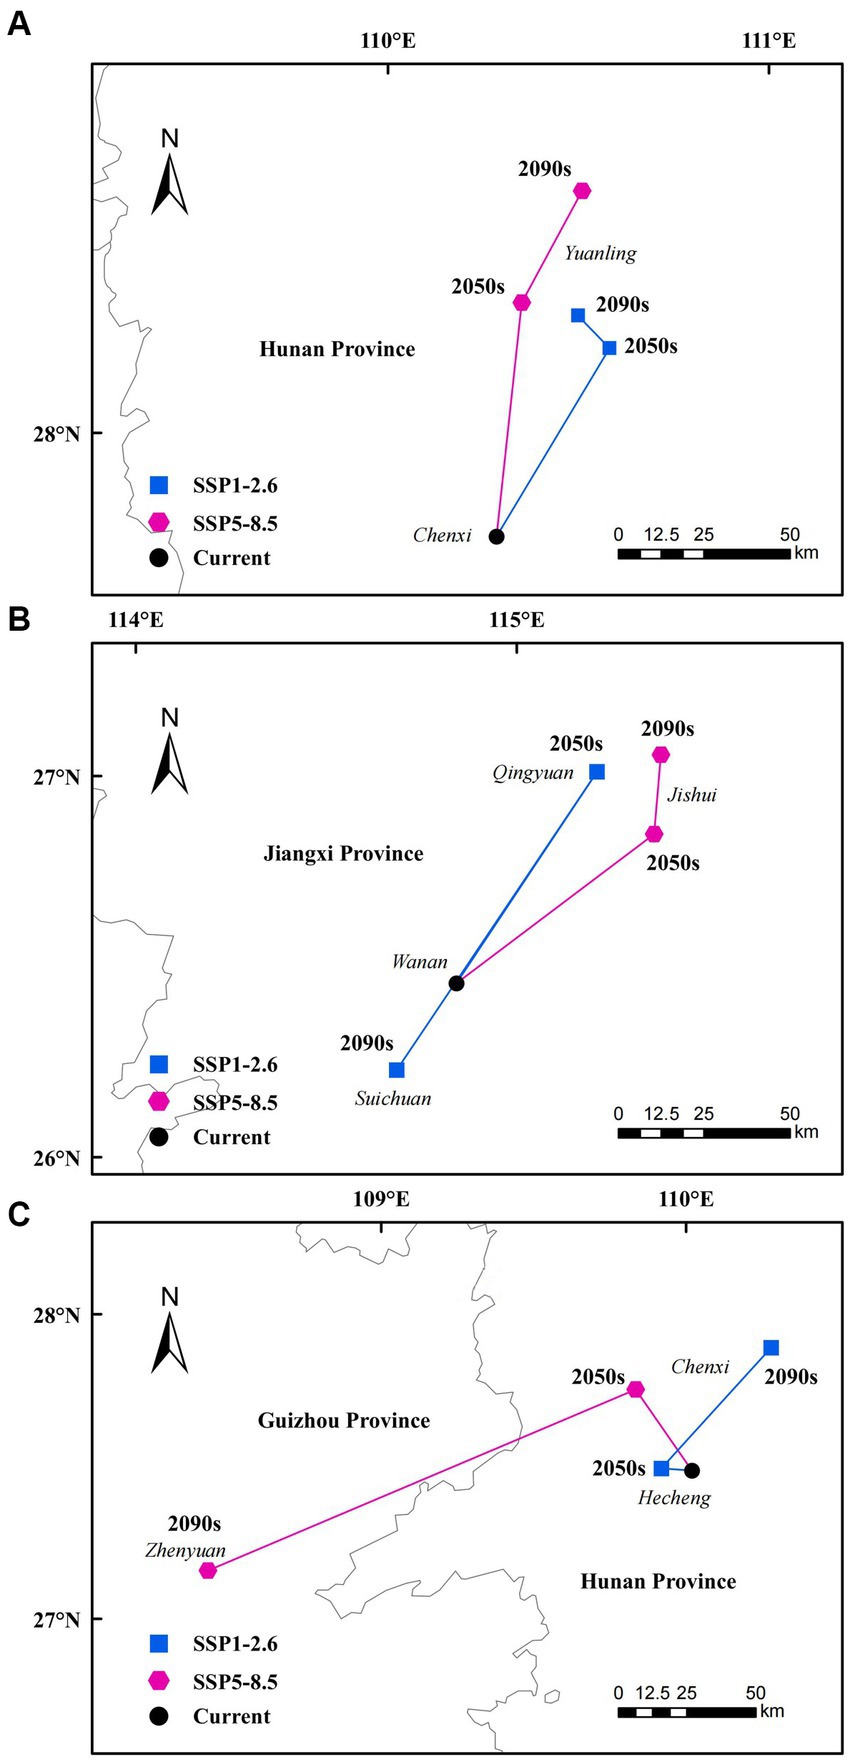
Figure 7. Total suitable habitat centroid distribution shifts for different tree species under climate change [C. lanceolata (A), P. taiwanensis (B), and Q. glauca (C)].
For P. taiwanensis, the centroid of suitable habitat under the SSP1-2.6 climate scenario firstly moved 71.79 km northeast to 115.21°E, 27.01°N (2050s), and then 101.63 km southwest to 114.69°E, 26.23°N (2090s). Under the SSP5-8.5 climate scenario, the centroid of suitable habitat shifted 67.6 km northeast to 115.36°E, 26.85°N (2050s) and then 23.16 km north to 115.38°E, 27.06°N (2090s).
For Q. glauca, the centroid of suitable habitat under the SSP1-2.6 climate scenario first moved 9.87 km northwest to 109.92°E, 27.5°N (2050s), and then 56.69 km northeast to 110.28°E, 27.89°N (2090s). Under the SSP5-8.5 climate scenario, the centroid of suitable habitat shifted 34.7 km northwest to 109.84°E, 27.75°N (2050s) and then 153.8 km southwest to 108.43°E, 27.16°N (2090s).
4 Discussion
4.1 Model accuracy analysis
Although all 19 bioclimatic factors have been widely used as environmental variables in the MaxEnt models for predicting species distribution and invasive species dispersal, they cannot fully capture the complex processes influencing species distributions (Thuiller et al., 2019). The selection of variables significantly influences the accuracy of species distribution modeling (Araújo and Guisan, 2006; Fourcade et al., 2017). Some studies ignore redundant information from highly correlated variables introduced in the modeling process, which may reduce the prediction accuracy (Duflot et al., 2018). This study improved prediction accuracy by calculating the contribution of each variable to the MaxEnt and eliminate highly correlated variables using Pearson correlation analysis. This approach effectively removed environmental variables with small contributions or high correlations. In addition, all three studied species had AUC values above 0.9, which further ensured the reliability of our results.
4.2 Main environmental variables affecting the distribution of different tree species
Based on the results of the importance evaluation of environmental variables, it is evident that climatic variables have a greater influence on the potential geographic distribution of each tree species compared to soil and topographic variables. The response curves of environmental variables were utilized to demonstrate the impact of major environmental factors on the potential geographic distribution of each tree species. The findings revealed that higher temperature and adequate precipitation were pivotal environmental variables influencing tree species distribution, particularly temperature (Bio6) and precipitation (Bio14) in winter, with the annual range of temperature (Bio7) exhibiting a stronger influence. Research has indicated that the large-scale landscape distribution of species is closely related to the temperature extremes and variations (Renne et al., 2019). Low winter temperatures can result in leaf tip wilting, reduced bud and root activity, thereby affecting plant growth potential and nutrient uptake in subsequent years (Körner, 1998; Huang et al., 2021). Additionally, soil freezing due to low temperatures reduces effective water availability while increasing resistance for plant roots to absorb water. Moreover, thicker winter snow can delay germination and shorten the growing seasons due to significant heat being used for snow melting upon spring arrival (Fritts, 2012). Conversely, higher winter temperatures can prevent frost damage to foliar tissues and ensure normal metabolic activities of trees. They also extend the growing season due to earlier germination, and enhancing photosynthetic efficiency which benefits tree growth (Northcote and Hartman, 2008; Chen et al., 2016). Furthermore, a suitable temperature range plays a crucial role in tree growth as increased temperatures during the growing season promote the soil microorganism’s activity along with nutrients decomposition and transformation processes. This leads to heightened metabolic activities within plants facilitating nutrient uptake while promoting cell division as well as earlywood annual ring growth (Cullen et al., 2001; Sergio et al., 2007).
On the other hand, trees consume a substantial amount of soil moisture during their growth process, and abundant winter precipitation can increase soil moisture content. This is beneficial for the accumulation of carbohydrates in trees, thereby providing more nutritional support for cambial activity and promoting early-season radial growth in the following year (Jiao et al., 2021). Simultaneously, we evaluated the contribution rates of major environmental variables and determined that factors related to precipitation have a more significant impact than those related to temperature. This finding aligns with previous researches, which suggest that precipitation exerts a stronger influence on the potential distribution of tree species compared to temperature (Zhang et al., 2018; Jiang et al., 2019). Currently, drought-induced limitations on tree growth patterns are widely observed. Seeds can only germinate when they absorb sufficient water, and both long-term and short-term water scarcity can constrain seed germination as well as hinder tree growth and development (Han and Ding, 2012). Increased precipitation facilitates the availability of soil water, mitigates drought-induced damage to plants, and promotes their growth. Therefore, precipitation should be considered a pivotal environmental variable affecting the potential distribution of tree species.
4.3 Analysis of potential suitable habitat for the current period
The results indicate that suitable habitats for various tree species are primarily concentrated in subtropical regions of China located south of the Qinling Mountains–Huaihe River Line; gradually extending toward the northern and northwestern parts with diminishing suitability. The Qinling Mountains–Huaihe River Line serves as a boundary between China’s warm temperate and subtropical regions while also demarcating humid from semi-humid zones with distinct climatic characteristics in the north versus south area. Predominantly characterized by subtropical monsoons or subtropical monsoon humid climates featuring hot summers, mild winters, and distinct four seasons (Xu et al., 2019). The warm and humid climate factors may be the primary drivers influencing the distribution of C. lanceolata and Q. glauca. Additionally, P. taiwanensis, a deep-rooted species, exhibits a preference for cool and moist alpine climate with high relative humidity. In this study, P. taiwanensis was predominantly found in the mid-mountain region of Zhejiang, Fujian, Hunan, and Taiwan provinces, which aligns with its affinity for cool and well-lit habitats (Song et al., 2008). Moreover, the model-predicted potential suitable habitats for different tree species demonstrated a high-level agreement with the actual distribution, thereby confirming the accuracy of model predictions.
4.4 Analysis of potential suitable habitat for the future period
Under future climate change scenarios, there is generally an observed trend toward northward migration in the geographic distribution of suitable habitats for various tree species along with varying degrees of range expansion. Studies suggest that climate change will not only affect the size but may also the shifts in distribution ranges of these species (Bertrand et al., 2011; Chen et al., 2011). Long-term climate observations indicate alterations in regional temperature as well as changes in t precipitation patterns due to global warming (Zhao et al., 2021). In future projections, annual average precipitation in China is expected to increase by 0–20%, particularly more pronounced in northern and northwestern regions; meanwhile temperatures are expected to rise significantly by 2.7–2.9°C on an annual basis across China as a whole (Jiang and Fu, 2012). Moreover, under the high greenhouse gas emission scenario of SSP5-8.5, temperature increases are even more substantial further promoting northward migration of tree species (Li et al., 2019; Xie et al., 2021). In the future, during different periods (2050s, 2090s) under different climate scenarios (SSP1-2.6 and SSP5-8.5), significant additions to suitable habitats for C. lanceolata can be anticipated primarily located within the northern and northwestern regions of China. These areas are experiencing the impact of climate change, resulting in an overall expansion of suitable habitat area for tree species that shifting toward higher latitudes, consistent with their preference for warm and moist conditions. In the context of global warming, rising temperatures may pose a threat to suitable habitats and genetic diversity for certain heat-sensitive tree species in northern regions. Conversely, heat-tolerant species like C. lanceolata are expected to significantly benefit from future climate change as their suitable habitats potentially expand further with rising temperatures (Hagen et al., 2007; Lyons et al., 2010).
The predictive results indicate that, under future climate change scenarios, there is a projected increase in potential suitable habitats for P. taiwanensis and Q. glauca to some extent initially. However, over time and with escalating greenhouse gas emissions, the reduction in suitable habitat areas for these species will continue expanding even surpassing any newly added area. Fragmentation of suitable habitats has intensified while their centroids have shifted toward lower latitudes due to the suitable habitats loss, indicating that the adaptative mechanisms of these two tree species may not be sustainable under ongoing future climate warming trends (Zhang et al., 2020). The decline in suitability for P. taiwanensis and Q. glauca primarily occurs at low altitudes suggesting a tendency for their potential suitable habitats to shift toward higher altitudes instead. Similarly, consistent with our findings, Zou et al. (2018) investigated the impact of climate change on the distribution pattern of Malus baccata and observe significant reduction in its suitable habitat at higher altitudes. Jayasinghe and Kumar (2019) predicted that, compared to higher altitudes, the potential distribution of Camellia sinensis will further diminish in lower altitude areas in the future. It is worth noting that under future climate scenarios, there has been a noticeable decrease in the suitable habitat area for Q. glauca in southern Yunnan. These regions are geographically obstructed by the Ailao and Wuliang Mountains, impeding the southward intrusion of cold air streams while being influenced by warm and humid oceanic airflows. Consequently, this results in less distinct seasons, increased precipitation levels, lower annual average temperatures, and smaller annual temperature fluctuations, which do not align with Q. glauca current preferences for heat and humidity conditions (Wu et al., 2022). As a result of this factors combined with future climate change trends, it is likely that Q. glauca’s natural distribution will gradually disappear from southern Yunnan. Furthermore, high greenhouse gas emission scenario SSP5-8.5 projections indicate a deceleration in growth rate for suitable habitats of C. lanceolata along with decreased newly added area. Studies suggest that a moderate temperature increase can promote the tree growth and development; however when temperatures exceed their optimal range high temperatures can become limiting factors for plant growth (Liu et al., 2018). Additionally, the degree and pace of global warming remain highly uncertain (Thomas et al., 2004; Li et al., 2015), and different climate scenarios may yield varying trends regarding predictive results from the MaxEnt model simulations. Climate change can either promote species’ adaptation to non-native climatic conditions leading to an expansion of their distribution ranges or conversely resulting in diminished suitable habitats causing contraction of distribution ranges (Petitpierre et al., 2016). Mckenney et al. (2007) predicted the response of 130 tree species in North America to future climate change, revealing that on average, the distribution of all species is predicted to decrease by 12 and 58%, with their ranges shifting northward by approximately 700 km and 330 km. Engler et al. (2011) analyzed the impact of climate change on the distribution areas of 2,632 plant species in major European mountain ranges and found that between the mid-to-late 21st century (2,070–2,100), an estimated range loss exceeding 80% is expected for approximately 36–55% of alpine plants and 19–46%. Overall, future climate change remains highly uncertain, potentially resulting in habitat expansion, migration, or contraction among different species and significantly affecting the geographical distribution (Petitpierre et al., 2016).
4.5 Species conservation recommendations and uncertainties
Climate is an important aspect influencing global change, characterized by the escalating temperatures, changing precipitation patterns, and an increase in extreme weather events. Moreover, climate change profoundly impacts species growth, reproduction, phenology, and geographical distribution at the regional scale (Edwards, 2010). Although current biodiversity conservation measures are typically based on existing species distributions, they face mounting challenges as climate change intensifies. Therefore, comprehending alterations in species’ suitable distribution areas under future climate change and implementing targeted conservation measures early on are imperative to enhance the effectiveness of biodiversity preservation (Zhao et al., 2021). Considering climate extremes alongside the predictions generated by the MaxEnt in this study provides reasonable grounds to suspect that the potential suitable habitats of tree species will be jeopardized in the near future. Therefore, it is essential to promote rational utilization of tree species resources in different suitable habitats within the context of climate change. The potential distribution modeled in this study serves as an vital reference for devising conservation strategy for tree species while effectively safeguarding their potential suitable habitats (Carroll et al., 2017). For highly suitable habitats, adopting an efficient operational approach is necessary to meet diverse resources to ensure ecological benefits. Meanwhile, strengthening protection efforts for current period’s suitable habitats of tree species becomes crucial to minimize further shrinkage caused by adverse effects of climate change (Chen et al., 2022).
This study mainly investigated the impact of future climate change on the tree species distribution, without considering other constraints on their migration. Previous studies have highlighted climate as decisive factors influencing species’ potential geographic range across various spatial scales (Wen et al., 2016), while other factors such as land use, interspecific interactions, and human activities may also exert some degree of impact on species distribution (Zhang et al., 2021, 2022). However, there is currently a lack of suitable scenario models to quantitatively describe future changes in these influencing factors, making it challenging to integrate all factors into a unified model for simulating tree species’ potential distribution (Guan et al., 2022). As we did not account for these factors, the predicted potential distributions and migration distances predicted for future periods might have been overestimated. Therefore, future studies should consider incorporating these additional factors to obtain a more accurate pattern of tree species’ distribution. Nonetheless, this study provides insights into the direction of tree species’ migration trend in the future period and offers valuable references for their introduction, cultivation practices, and development of sustainable resource conservation strategies.
5 Conclusion
Based on the actual distribution of C. lanceolata, P. taiwanensis, and Q. glauca, along with relevant environmental variables, we employed a species distribution model (MaxEnt) to predict their potential suitable habitats in China. Under the prevailing climatic conditions, the potential suitable habitats of the three tree species are mainly distributed in the subtropical region located south of the Qinling Mountains–Huaihe River Line. The potential distribution of these tree species is predominantly influenced by temperature and precipitation, with soil and topography variables exerting a relatively minor impact. Under future climatic scenarios, the potential area of suitable habitat for all three tree species exhibits varying degrees of expansion under RCP 2.6. However, over time and with increasing greenhouse gas emissions (RCP 8.5), there is a declining trend observed in the suitable habitat areas for P. taiwanensis and Q. glauca obviously. While the centroids of the suitable habitats for these three tree species are shifting northward, P. taiwanensis and Q. glauca demonstrate a tendency toward southward migration as the suitable habitat areas diminishes in 2090s. In conclusion, our study elucidates on the potential geographic distribution and migration tendency of these three commonly afforestation trees (C. lanceolata, P. taiwanensis, and Q. glauca), enabling an important reference for their future management, conservation, and choice of priority afforestation area.
Data availability statement
The raw data supporting the conclusions of this article will be made available by the authors, without undue reservation.
Author contributions
SJ: Funding acquisition, Writing – original draft. YC: Writing – original draft. XL: Investigation, Validation, Writing – review & editing. PS: Writing – review & editing, Data curation. MZ: Data curation, Writing – review & editing. ZY: Data curation, Writing – review & editing, Investigation. YL: Data curation, Writing – review & editing, Methodology. WC: Writing – review & editing, Funding acquisition, Investigation. YH: Writing – review & editing, Conceptualization, Methodology.
Funding
The author(s) declare financial support was received for the research, authorship, and/or publication of this article. This work was supported by the National Key Research and Development Program of China (2019YFE0118900), National Natural Science Foundation of China (31971641), the Natural Science Foundation of Zhejiang Province (LQ22C160002 and LQ19C160011), and Jiyang College of Zhejiang A&F University under Grant (05251700031). Start-up Fund for New Talented Researchers of Nanjing Vocational University of Industry Technology (YK23-08-01).
Conflict of interest
The authors declare that the research was conducted in the absence of any commercial or financial relationships that could be construed as a potential conflict of interest.
Publisher’s note
All claims expressed in this article are solely those of the authors and do not necessarily represent those of their affiliated organizations, or those of the publisher, the editors and the reviewers. Any product that may be evaluated in this article, or claim that may be made by its manufacturer, is not guaranteed or endorsed by the publisher.
Footnotes
References
Araújo, M. B., and Guisan, A. (2006). Five (or so) challenges for species distribution modelling. J. Biogeogr. 33, 1677–1688. doi: 10.1111/j.1365-2699.2006.01584.x
Bertrand, R., Lenoir, J., Piedallu, C., Riofrio-Dillon, G., de Ruffray, P., Vidal, C., et al. (2011). Changes in plant community composition lag behind climate warming in lowland forests. Nature 479, 517–520. doi: 10.1038/nature10548
Bowling, L. C., Cherkauer, K. A., Lee, C. I., Beckerman, J. L., Brouder, S., Buzan, J. R., et al. (2020). Agricultural impacts of climate change in Indiana and potential adaptations. Clim. Chang. 163, 2005–2027. doi: 10.1007/s10584-020-02934-9
Brown, J. L. (2014). SDMtoolbox: a python-based GIS toolkit for landscape genetic, biogeographic and species distribution model analyses. Methods in Ecology and Evolution. 5.
Carroll, C., Roberts, D. R., Michalak, J. L., Lawler, J. J., Nielsen, S. E., Stralberg, D., et al. (2017). Scale-dependent complementarity of climatic velocity and environmental diversity for identifying priority areas for conservation under climate change. Glob. Chang. Biol. 23, 4508–4520. doi: 10.1111/gcb.13679
Chen, D., Fang, K., Li, Y., Dong, Z., Zhang, Y., and Zhou, F. (2016). Response of Pinus taiwanensis growth to climate changes at its southern limit of Daiyun Mountain, mainland China Fujian Province. Sci. China Earth Sci. 59, 328–336. doi: 10.1007/s11430-015-5188-1
Chen, I.-C., Hill, J. K., Ohlemüller, R., Roy, D. B., and Thomas, C. D. (2011). Rapid range shifts of species associated with high levels of climate warming. Science 333, 1024–1026. doi: 10.1126/science.1206432
Chen, Y.-G., XG, L., Chen, Y.-H., Cheng, W.-X., JG, D., Zhong, Q.-L., et al. (2022). Identification of the potential distribution area of Cunninghamia lanceolata in China under climate change based on the MaxEnt model. J. Appl. Ecol. 33, 1207–1214. doi: 10.13287/j.1001-9332.202205.024
Cullen, L. E., Palmer, J. G., Duncan, R. P., and Stewart, G. H. (2001). Climate change and tree-ring relationships of Nothofagus menziesii tree-line forests. Can. J. For. Res. 31, 1981–1991. doi: 10.1139/x01-127
Doxford, S. W., and Freckleton, R. P. (2012). Changes in the large-scale distribution of plants: extinction, colonisation and the effects of climate. J. Ecol. 100, 519–529. doi: 10.1111/j.1365-2745.2011.01902.x
Du, C., Wang, Q., Zeng, Y., Tan, X., Liu, X., and Xu, Y. (2019). Study on cultivation regionalization and climate features of Cunninghamia lanceolata in Hubei province. J. Cent. S. Univ. For. Technol. 39, 5–10.
Duflot, R., Avon, C., Roche, P., and Bergès, L. (2018). Combining habitat suitability models and spatial graphs for more effective landscape conservation planning: an applied methodological framework and a species case study. J. Nat. Conserv. 46, 38–47. doi: 10.1016/j.jnc.2018.08.005
Edwards, P.N. (2010). A vast machine: computer models, climate data, and the politics of global warming. Cambridge: The MIT Press.
Elith, J., and Leathwick, J. R. (2009). Species distribution models: ecological explanation and prediction across space and time. Annu. Rev. Ecol. Evol. Syst. 40, 677–697. doi: 10.1146/annurev.ecolsys.110308.120159
Elith, J., Phillips, S. J., Hastie, T., Dudík, M., Chee, Y. E., and Yates, C. J. (2011). A statistical explanation of Max Ent for ecologists. Divers. Distrib. 17, 43–57. doi: 10.1111/j.1472-4642.2010.00725.x
Engler, R., Randin, C. F., Thuiller, W., Dullinger, S., Zimmermann, N. E., Araújo, M. B., et al. (2011). 21st century climate change threatens mountain flora unequally across Europe. Glob. Chang. Biol. 17, 2330–2341. doi: 10.1111/j.1365-2486.2010.02393.x
Eyring, V., Bony, S., Meehl, G. A., Senior, C. A., Stevens, B., Stouffer, R. J., et al. (2016). Overview of the coupled model intercomparison project phase 6 (CMIP6) experimental design and organization. Geosci. Model Dev. 9, 1937–1958. doi: 10.5194/gmd-9-1937-2016
Fourcade, Y., Besnard, A. G., and Secondi, J. (2017). Paintings predict the distribution of species, or the challenge of selecting environmental predictors and evaluation statistics. Glob. Ecol. Biogeogr. 27, 245–256. doi: 10.1111/geb.12684
Graham, M. H. (2003). Confronting multicollinearity in ecological multiple regression. Ecology 84, 2809–2815. doi: 10.1890/02-3114
Guan, L., Yang, Y., Jiang, P., Mou, Q., Gou, Y., Zhu, X., et al. (2022). Potential distribution of Blumea balsamifera in China using Max Ent and the ex situ conservation based on its effective components and fresh leaf yield. Environ. Sci. Pollut. Res. 29, 1–17. doi: 10.1007/s11356-022-18953-1
Hagen, S. B., Jepsen, J. U., Ims, R. A., and Yoccoz, N. G. (2007). Shifting altitudinal distribution of outbreak zones of winter moth Operophtera brumata in sub-arctic birch forest: a response to recent climate warming? Ecography 30, 299–307. doi: 10.1111/j.2007.0906-7590.04981.x
Han, W., and Ding, G. (2012). The responses of water stress on germination of Pinus massoniana seeds from different provenance. Seed. 31, 81–86. doi: 10.16590/j.cnki.1001-4705.2012.09.079
He, Y. (2015). Simulation the geographic distribution of five Lindera species and analysis their dominant climatic factors. Xi’an: North West Agriculture and Forestry University.
He, Y., Huang, W., Zhao, X., Lv, P., and Wang, H. (2021). Review on the impact of climate change on plant diversity. J. Desert Res. 41:59. doi: 10.7522/j.issn.1000-694X.2020.00104
Hu, Q., Dong, B., Pan, X. B., Wang, X. X., and Zhang, X. T. (2017). Spatiotemporal variation and causes analysis of dry-wet climate at different time scales in north China plain. Chin. J. Agrometeorol. 38:267e277.
Huang, X., Dai, D., Xiang, Y., Yan, Z., Teng, M., Wang, P., et al. (2021). Radial growth of Pinus massoniana is influenced by temperature, precipitation, and site conditions on the regional scale: a meta-analysis based on tree-ring width index. Ecol. Indic. 126:107659. doi: 10.1016/j.ecolind.2021.107659
IPCC. (2018). Intergovernmental Panel on Climate Change Special Report on Global Warming of 1.5°C. Switzerland.
Jayasinghe, S. L., and Kumar, L. (2019). Modeling the climate suitability of tea [Camellia sinensis (L.) O. Kuntze] in Sri Lanka in response to current and future climate change scenarios. Agric. For. Meteorol. 272-273, 102–117. doi: 10.1016/j.agrformet.2019.03.025
Jiang, D., and Fu, Y. (2012). Climate change over China with a 2°C global warming. J. Atmos. Sci. 36, 234–246. doi: 10.3878/j.issn.1006-9895.2011.11074
Jiang, Y., Li, M., Liu, Y., and Liu, F. (2019). Impact of climate change on suitable habitats of Pinus massoniana in Hunan Province. J. Nanjing For. Univ. 62:94. doi: 10.3969/j.issn.1000-2006.201805040
Jiao, L., Xue, R., Qi, C., Chen, K., and Liu, X. (2021). Comparison of the responses of radial growth to climate change for two dominant coniferous tree species in the eastern Qilian Mountains, northwestern China. Int. J. Biometeorol. 65, 1823–1836. doi: 10.1007/s00484-021-02139-4
Kim, D.-I., Park, I.-K., Bae, S.-Y., Fong, J. J., Zhang, Y.-P., Li, S.-R., et al. (2020). Prediction of present and future distribution of the Schlegel’s Japanese gecko (Gekko japonicus) using MaxEnt modeling. J. Ecol. Environ. 44, 1–8. doi: 10.1186/s41610-020-0147-y
Körner, C. (1998). A re-assessment of high elevation treeline positions and their explanation. Oecologia 115, 445–459. doi: 10.1007/s004420050540
Kozak, K. H., Graham, C. H., and Wiens, J. J. (2008). Integrating GIS-based environmental data into evolutionary biology. Trends Ecol. Evol. 23, 141–148. doi: 10.1016/j.tree.2008.02.001
Li, J., Chang, H., Liu, T., and Zhang, C. (2019). The potential geographical distribution of Haloxylon across Central Asia under climate change in the 21st century. Agric. For. Meteorol. 275, 243–254. doi: 10.1016/j.agrformet.2019.05.027
Li, J., Liu, F., Xue, Y., Zhang, Y., and Li, D. (2017). Assessing vulnerability of giant pandas to climate change in the Qinling Mountains of China. Ecol. Evol. 7, 4003–4015. doi: 10.1002/ece3.2981
Li, G., Xu, G., Guo, K., and Du, S. (2016). Geographical boundary and climatic analysis of Pinus tabulaeformis in China: insights on its afforestation. Ecol. Eng. 86, 75–84. doi: 10.1016/j.ecoleng.2015.10.032
Li, R., Xu, M., Wong, M. H. G., Qiu, S., Sheng, Q., Li, X., et al. (2015). Climate change-induced decline in bamboo habitats and species diversity: implications for giant panda conservation. Divers. Distrib. 21, 379–391. doi: 10.1111/ddi.12284
Liu, X., Nie, Y., and Wen, F. (2018). Seasonal dynamics of stem radial increment of Pinus taiwanensis Hayata and its response to environmental factors in the Lushan Mountains, Southeastern China. Forests 9:387. doi: 10.3390/f9070387
Liu, J., Xu, Y., Sun, C., Wang, X., Zheng, Y., Shi, S., et al. (2022). Distinct ecological habits and habitat responses to future climate change in three east and southeast Asian Sapindus species. Forest Ecology and Management. 507.
Lu, Y., Liu, H., Chen, W., Yao, J., Huang, Y., Zhang, Y., et al. (2021). Conservation planning of the genus Rhododendron in Northeast China based on current and future suitable habitat distributions. Biodivers. Conserv. 30, 673–697. doi: 10.1007/s10531-020-02110-6
Lyons, J., Stewart, J., and Mitro, M. (2010). Predicted effects of climate warming on the distribution of 50 stream fishes in Wisconsin, USA. J. Fish Biol. 77, 1867–1898. doi: 10.1111/j.1095-8649.2010.02763.x
Matías, L., Linares, J. C., Sánchez-Miranda, Á., and Jump, A. S. (2017). Contrasting growth forecasts across the geographical range of scots pine due to altitudinal and latitudinal differences in climatic sensitivity. Glob. Chang. Biol. 23, 4106–4116. doi: 10.1111/gcb.13627
Mckenney, D. W., Pedlar, J. H., Lawrence, K., Campbell, K., and Hutchinson, M. F. (2007). Potential impacts of climate change on the distribution of North American trees. Bioscience 57, 939–948. doi: 10.1641/B571106
Narouei-Khandan, H. A., Halbert, S. E., Worner, S. P., and van Bruggen, A. H. C. (2016). Global climate suitability of citrus huanglongbing and its vector, the Asian citrus psyllid, using two correlative species distribution modeling approaches, with emphasis on the USA. Eur. J. Plant Pathol. 144, 655–670. doi: 10.1007/s10658-015-0804-7
Ni, Y., Wenfa, X., Jianfeng, L., Zunji, J., Li Maihe, X., Jin, L. L., et al. (2023). Radial growth-climate correlations of Pinus massoniana in natural and planted forest stands along a latitudinal gradient in subtropical central China. Agric. For. Meteorol. 334:109422. doi: 10.1016/j.agrformet.2023.109422
Northcote, T.G., and Hartman, G. (2008). Fishes and forestry: worldwide watershed interactions and management. John Wiley & Sons: Oxford.
Pearson, R. G., Raxworthy, C. J., Nakamura, M., and Townsend Peterson, A. (2007). Predicting species distributions from small numbers of occurrence records: a test case using cryptic geckos in Madagascar. J. Biogeogr. 34, 102–117. doi: 10.1111/j.1365-2699.2006.01594.x
Peterson, A.T., Soberón, J., Pearson, R.G., Anderson, R.P., Martínez-Meyer, E., Nakamura, M., et al. (2011). Ecological niches and geographic distributions (MPB-49). Princeton: Princeton University Press.
Petitpierre, B., McDougall, K., Seipel, T., Broennimann, O., Guisan, A., and Kueffer, C. (2016). Will climate change increase the risk of plant invasions into mountains? Ecol. Appl. 26, 530–544. doi: 10.1890/14-1871
Phillips, S. J. (2008). Transferability, sample selection bias and background data in presence-only modelling: a response to Peterson et al. (2007). Ecography 31, 272–278. doi: 10.1111/j.0906-7590.2008.5378.x
Phillips, S. J., Anderson, R. P., and Schapire, R. E. (2006). Maximum entropy modeling of species geographic distributions. Ecol. Model. 190, 231–259. doi: 10.1016/j.ecolmodel.2005.03.026
Qin, A., Liu, B., Guo, Q., Bussmann, R. W., Ma, F., Jian, Z., et al. (2017). Maxent modeling for predicting impacts of climate change on the potential distribution of Thuja sutchuenensis Franch., an extremely endangered conifer from southwestern China. Glob. Ecol. Conserv. 10, 139–146. doi: 10.1016/j.gecco.2017.02.004
Renne, R. R., Schlaepfer, D. R., Palmquist, K. A., Bradford, J. B., Burke, I. C., and Lauenroth, W. K. (2019). Soil and stand structure explain shrub mortality patterns following global change–type drought and extreme precipitation. Ecology 100:e02889. doi: 10.1002/ecy.2889
Sergio, R., Annie, D., Tommaso, A., and Vinicio, C. (2007). Evidence of threshold temperatures for xylogenesis in conifers at high altitudes. Oecologia 152, 1–12. doi: 10.1007/s00442-006-0625-7
Song, P., Hong, W., Cheng-Zhen, W. U., Xi-Sheng, H. U., Feng, L., and Lan, B. (2008). Spatial distribution pattern of natural Pinus taiwanensis population in Shouning County. Acta Agric. Univ. Jiangxiensis 5, 829–832. doi: CNKI:SUN:JXND.0.2008-05-016
Thomas, C. D., Cameron, A., Green, R. E., Bakkenes, M., Beaumont, L. J., Collingham, Y. C., et al. (2004). Extinction risk from climate change. Nature 427, 145–148. doi: 10.1038/nature02121
Thuiller, W., Guéguen, M., Renaud, J., Karger, D. N., and Zimmermann, N. E. (2019). Uncertainty in ensembles of global biodiversity scenarios. Nat. Commun. 10, 1–9. doi: 10.1038/s41467-019-09519-w
Wang, X. (2013). The study of cost-benefit and carbon sinks supply between Forest fir and Masson pine-data based on three southern provinces. Hangzhou: Zhejiang A&F University.
Wang, L., Qiao, C., Shi, Y., and Song, Y. (2015). Effect of different treatments on the germination of Cyclobalanopsis glauca seeds. For. Sci. Technol. 34–36. doi: 10.13456/j.cnki.lykt.2015.05.011
Wang, R., Yang, H., Wang, M., Zhang, Z., Huang, T., Wen, G., et al. (2020). Predictions of potential geographical distribution of Diaphorina citri (Kuwayama) in China under climate change scenarios. Sci. Rep. 10, 9202–9209. doi: 10.1038/s41598-020-66274-5
Wang, S., Zhang, Y., Guo, L., and Lai, M. (2017). Characteristics of temperature change and forecast of future trend in Inner Mongolia, 1981-2010. Meteorol. Environ. Sci. 40, 114–120. doi: 10.16765/j.cnki.1673-7148.2017.04.016
Wen, Z., Zhang, J., and Zhang, M. (2016). Geographical distribution and prediction on potential distribution areas of Chinese endemic species Salsola junatovii. J. Plant Resour. Environ. 25, 81–87. doi: 10.3969/j.issn.1674-7895.2016.01.10
WMO (2023). State of the climate in Asia 2022 report. Geneva: World Meteorological Organization. 1–29. Available at: https://library.wmo.int/
Wu, F., Zhu, P., and Ji, K. (2022). Response of masson pine (Pinus massoniana) distribution pattern to future climate change. J. Nanjing For. Univ. 46, 196–204. doi: 10.12302/j.issn.1000-2006.202008019
Xie, C., Huang, B., Jim, C. Y., Han, W., and Liu, D. (2021). Predicting differential habitat suitability of Rhodomyrtus tomentosa under current and future climate scenarios in China. For. Ecol. Manag. 501:119696. doi: 10.1016/j.foreco.2021.119696
Xin, X., Wu, T., Zhang, J., Yao, J., and Fang, Y. (2020). Comparison of CMIP6 and CMIP5 simulations of precipitation in China and the East Asian summer monsoon. Int. J. Climatol. 40, 6423–6440. doi: 10.1002/joc.6590
Xu, J., Wang, H., Zhao, M., Shi, S., Zhang, Y., and Shi, J. (2022). Reconstructing mean temperature of April-July in 1809-2018 based on tree-ring of Pinus taiwanensis in the Tianmu Mountain, East China. Chin. J. Appl. Ecol. 33, 2347–2355. doi: 10.13287/j.1001-9332.202209.005
Xu, D., Zhuo, Z., Wang, R., Ye, M., and Pu, B. (2019). Modeling the distribution of Zanthoxylum armatum in China with MaxEnt modeling. Glob. Ecol. Conserv. 19:e00691. doi: 10.1016/j.gecco.2019.e00691
Yang, X.-Q., Kushwaha, S., Saran, S., Xu, J., and Roy, P. (2013). Maxent modeling for predicting the potential distribution of medicinal plant, Justicia adhatoda L. in lesser Himalayan foothills. Ecol. Eng. 51, 83–87. doi: 10.1016/j.ecoleng.2012.12.004
Zhang, J.-H., Li, K.-J., Liu, X.-F., Yang, L., and Shen, S.-K. (2021). Interspecific variance of suitable habitat changes for four alpine Rhododendron species under climate change: implications for their reintroductions. Forests 12:1520. doi: 10.3390/f12111520
Zhang, L., Li, Y., Ren, H., Wang, L., Zhu, W., and Zhu, L. (2020). Changes in the distribution of cycads in the context of climate change and its significance as an indicator of the subtropical northern boundary of China. Geogr. Res. 39:12. doi: CNKI:SUN:DLYJ.0.2020-04-016
Zhang, J., Liu, J., Yu, K., Zeng, Q., Zheng, W., Ai, J., et al. (2018). Prediction of geographical distribution of main conifer species under climate change in Sanming City. J. Fujian Agric. For. Univ. 47, 74–81. doi: 10.13323/j.cnki.j.fafu(nat.sci.).2018.01.012
Zhang, L., Zhu, L., Li, Y., Zhu, W., and Chen, Y. (2022). Maxent modelling predicts a shift in suitable habitats of a subtropical evergreen tree (Cyclobalanopsis glauca (Thunberg) Oersted) under climate change scenarios in China. Forests 13:126. doi: 10.3390/f13010126
Zhao, Y., Deng, X., Xiang, W., Chen, L., and Ouyang, S. (2021). Predicting potential suitable habitats of Chinese fir under current and future climatic scenarios based on Maxent model. Eco. Inform. 64:101393. doi: 10.1016/j.ecoinf.2021.101393
Zhao, H., Zhang, H., and Xu, C. (2020). Study on Taiwania cryptomerioides under climate change: MaxEnt modeling for predicting the potential geographical distribution. Glob. Ecol. Conserv. 24:e01313. doi: 10.1016/j.gecco.2020.e01313
Zou, X., Peng, Y., Wang, L., Li, Y., Zhang, W., and Liu, X. (2018). Impact of climate change on the distribution pattern of Malus baccata (L.) Borkh in China since the Last Glacial Maximum. Plant Sci. J. 36, 676–686. doi: 10.11913/PSJ.2095-0837.2018.50676
Keywords: Cunninghamia lanceolata, Pinus taiwanensis, Quercus glauca, potential distribution, MaxEnt model, climate change, suitable habitat
Citation: Jin S, Chi Y, Li X, Shu P, Zhu M, Yuan Z, Liu Y, Chen W and Han Y (2023) Predicting the response of three common subtropical tree species in China to climate change. Front. For. Glob. Change. 6:1299120. doi: 10.3389/ffgc.2023.1299120
Edited by:
Mykola Kutia, Bangor University, United KingdomReviewed by:
Gopal Shukla, Uttar Banga Krishi Viswavidyalaya, IndiaRajendra Mohan Panda, University of South Florida, United States
Copyright © 2023 Jin, Chi, Li, Shu, Zhu, Yuan, Liu, Chen and Han. This is an open-access article distributed under the terms of the Creative Commons Attribution License (CC BY). The use, distribution or reproduction in other forums is permitted, provided the original author(s) and the copyright owner(s) are credited and that the original publication in this journal is cited, in accordance with accepted academic practice. No use, distribution or reproduction is permitted which does not comply with these terms.
*Correspondence: Yini Han, aGFueWluaUB6YWZ1LmVkdS5jbg==
†These authors have contributed equally to this work