 Qian Zhang
 Rong Wang
95% of researchers rate our articles as excellent or good
Learn more about the work of our research integrity team to safeguard the quality of each article we publish.
Find out more
ORIGINAL RESEARCH article
Front. For. Glob. Change , 12 October 2023
Sec. Forests and the Atmosphere
Volume 6 - 2023 | https://doi.org/10.3389/ffgc.2023.1259500
Although Chinese society has transformed into the digital age, carbon peaking and neutrality are still important starting points for implementing the national strategy of green and low-carbon integrated growth in the Yangtze River Delta (YRD) of China. With data from 41 cities in YRD from 2005 to 2019, this paper empirically analyzes the carbon emission reduction effects from dual perspectives of forest resource endowment and low-carbon pilot policy in the digital age. The findings include: (1) Forest resources are indeed conducive to reducing carbon emissions. However, when considering the carbon sequestration effect of forests, a nonlinear U-shaped relationship exists between forest resource abundance and net carbon emissions per GDP. (2) Low-carbon city pilot policies are effective in reducing carbon emissions. (3) Low-carbon pilot policies perform better in smart cities, resource-based cities, and cities with abundant forest resources, showing significant heterogeneity. Forests can be relied on to assist in carbon emission reduction in the short term, but in the long term, a forest ecosystem with biodiversity is needed to achieve low-carbon sustainable development. This article provides some experience and references for building green and carbon-neutral cities for YRD in the digital age.
As part of the UNFCCC, the 27th Conference of the Parties (COP27) pointed out that the current climate challenge facing the world is relatively severe (Naylor and Ford, 2023). UNESCO also believes that the current trend of emission reduction is unable to limit the increase in global average temperature within 1.5°C compared to pre-industrial levels. Carbon dioxide removal technology is not the best solution to climate problems right now (Ho, 2023). All industries should carry out in-depth emission reduction efforts to keep the rise in temperature within 1.5°C (Welsby et al., 2021). China is also actively implementing the Paris Agreement. Intending to reach carbon peaking and carbon neutrality, China is advancing various tasks in an orderly manner and actively creating a green and low-carbon atmosphere (Gao, 2016). The carbon emissions per GDP in China fell by 3.8% in 2021 compared to 2020, and by at least 50% since 2005. China has vigorously developed Internet-related industries since 2015 (Zhang et al., 2021). The development of digitalization provides an opportunity for low-carbon development (She and Wu, 2022). Digitalization can change the traditional social and economic forms through the use of innovative technologies, thereby reducing energy consumption intensity and relieving the pressure of climate change (Balogun et al., 2020). In China, digital development can be a practical means to achieve carbon neutrality (Wang et al., 2023).
The YRD region has thoroughly implemented the strategic goals of low-carbon and digital development. China’s YRD region has the highest density of low-carbon pilot projects (Xia et al., 2022). As part of the National Carbon Neutrality Strategy, the YRD region is committed to creating a national demonstration area for green and low-carbon development (Li et al., 2023). The YRD region mainly includes Shanghai, Jiangsu, Zhejiang, and Anhui provinces, with a total of 41 cities (Hou et al., 2021; see details in Figure 1). Ecological green integrated development aims to coordinate economic development with carbon emission control and to form a carbon reduction pattern (Xu et al., 2022). The region’s carbon emissions increased overall. During the period 1997–2019, total CO2 emissions increased by 521.61 million tons to 1614.19 million tons. Although the YRD region had the greatest reduction in carbon emission intensity, reaching 19.65% from 2005 to 2019, the problem of unbalanced resource and economic development always exists. For the harmonious coexistence of man and nature, the Yangtze River Delta Ecological Green Integrated Development Demonstration Zone has issued and adhered to ecological priority and green development. Forests can also act as carbon sinks and reduce carbon emissions by improving their function (Luyssaert et al., 2008). Forest resources have the dual role of alleviating climate change and increasing forestry output value (Lin and Ge, 2019a). In the YRD region, forest carbon sinks increased overall from 2005 to 2019. There were 46.55 million tons of forest carbon sinks in 2005, and 53.21 million tons in 2019.
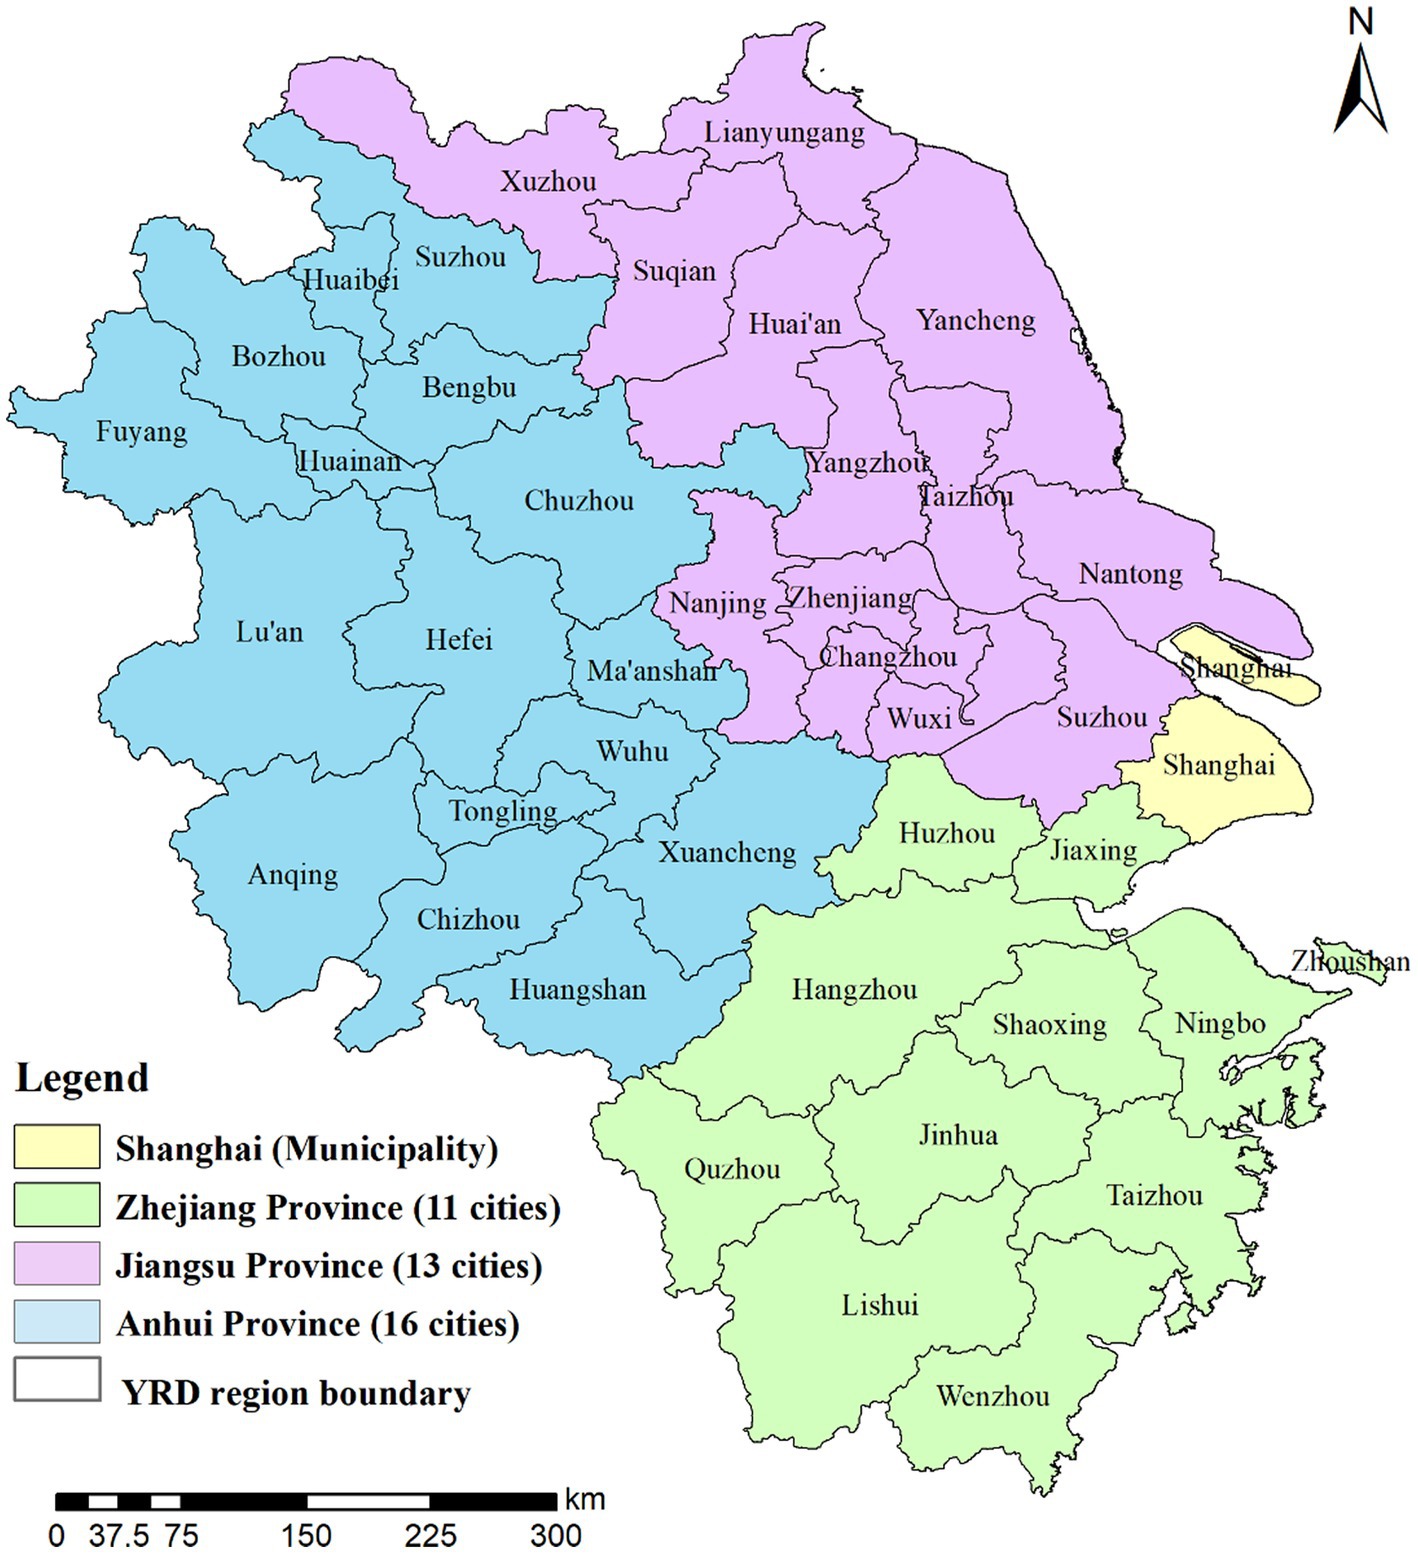
Figure 1. Study area. Reproduced from Zhang et al. (2020) and Zhang Q. et al. (2022).
The research questions of this study include: (1) Under the background of digitalization, given the dual attributes of carbon source and carbon sink of forest resources, do forest resources contribute to carbon emission reduction in the YRD region? (2) Does the low-carbon city pilot policy help achieve carbon emission reduction in the YRD region? (3) Given the differences in resource endowments and smart city development levels, is there any significant heterogeneity in the low-carbon pilot policy for the cities in the YRD region? Therefore, the purpose of this research is to empirically analyze the carbon emission reduction effect in YRD under the background of digitalization from the dual perspectives of forest resource endowment and low-carbon pilot policies. Additionally, green and sustainable development countermeasures and suggestions are proposed based on current development characteristics.
Achieving the Paris Agreement’s temperature target of 1.5–2.0°C requires reducing carbon emissions in the atmosphere (Terhaar et al., 2022). At the same time, the removal of carbon from the atmosphere should also be increased. Global warming and sustainable development have forced the transformation of the energy system, gradually replacing fossil fuels with clean, efficient, and sustainable energy sources (Bogdanov et al., 2021). Over the past few decades, fossil fuels have contributed to the increase in China’s carbon emissions. Consumption of renewable resources is critical to reducing carbon emissions, and natural resource consumption is stimulating the continuous increase of carbon emissions (Li et al., 2022). Forests are a potentially scalable method for reducing atmospheric carbon and sequestering it in biomass and soil (Busch et al., 2019). During the period 2020–2050, China’s forest vegetation will be able to absorb about 22% of the carbon dioxide emitted by fossil fuel combustion (Qiu et al., 2020).
Among the most effective carbon sinks, forests are effective at storing, conserving, and substituting carbon (Nunes et al., 2020). As carbon sinks, forests often limit climate change by offsetting carbon emissions (Pugh et al., 2019). Carbon capture, storage, and utilization is a key technology for mitigating climate change. Large-scale carbon storage requires the establishment of a carbon transportation network to achieve a certain emission reduction target. Pipelines are more suitable to reduce carbon emissions in northeastern, north, and northwestern parts of China (Wei et al., 2022). During carbon sequestration, trees absorb and store carbon dioxide from the atmosphere, reducing emissions and costs. Sequestering carbon through afforestation is considered the most cost-effective method. Consequently, forests contribute significantly to reducing carbon emissions (Richards and Stokes, 2004; Raihan et al., 2019). Forest biomass or fuel can save 9–38% of annual carbon dioxide emissions by replacing fossil fuels. In comparison to gasoline, bio-methanol reduces carbon emissions by 8–35% (Suntana et al., 2009).
Forest carbon sinks help China balance its economic development and alleviate the effects of climate change (Zhang et al., 2023). The economic value of forest carbon sinks is primarily derived from reducing emissions and costs. When the Chinese economy maintains a medium-low growth rate, carbon sinks in the national carbon trading market will reduce carbon emissions more efficiently (Lin and Ge, 2019b). Global warming must be kept below 2°C by setting carbon prices and carbon caps at levels that allow reductions (Santos, 2022). Due to the high cost of carbon sequestration, landowners primarily sequester large amounts of carbon in forests by increasing forest land and extending rotation periods (Sohngen and Mendelsohn, 2003). Forest resource harvest rotation in China has a significant impact on carbon storage. Short rotation lengths resulted in the lowest simulated carbon stocks, while longer rotation lengths resulted in relatively higher carbon stocks (Jiang et al., 2002). Various combinations of price incentives for carbon sequestration and forest bioenergy expansion, which can reduce marginal abatement costs and increase mitigation potential in the short term, have been explored in a dynamic structural model. However, long-term carbon sequestration costs increase (Baker et al., 2019). The amount of carbon removed from reforestation would increase by about 5.6% under a fixed carbon price. Reforestation can reduce emissions 7.2–9.6 times more than avoided deforestation. It offers more low-cost emission reduction opportunities than preventing deforestation (Busch et al., 2019). In addition, risks associated with economics and climate are heavily influencing carbon sequestration’s social cost (Cai and Lontzek, 2019).
Based on the analysis of China’s Three-North Shelterbelt Project (TNSP), forests are able to sequester carbon well, but the amount of carbon accumulated fluctuates greatly, showing an overall downward trend. Sequestering carbon in forests is economically beneficial since a small amount of monetary investment yields a large amount of benefits (Chu et al., 2019). Due to phenological events occurring in early spring and late autumn, forests consume more carbon through photosynthesis than they release through respiration, and the timing of these events influences an ecosystem’s function. As a result of climate changes, carbon sequestration will likely be enhanced in the present and the future, thereby slowing global warming (Keenan et al., 2014).
Based on a regional tree species analysis of China’s commercial forests under the constraints of logging and afforestation, China’s annual carbon sequestration is estimated to be able to offset 5% of anthropogenic greenhouse gas emissions by 2019. Additionally, social and economic factors such as carbon prices and deforestation have a greater impact on carbon sinks (Liu F. et al., 2023). By adopting carbon pricing policies, CO2 emissions can be reduced and regional income gaps can be narrowed (Zhang W.-W. et al., 2022). However, the willingness of cities to engage in carbon offset trading depends on a variety of factors, including urbanization level, understanding of carbon sequestration, educational level, and familiarity with market mechanisms (Poudyal et al., 2010).
The goal of reducing carbon emissions by utilizing forest resources has to be properly supervised and managed, even though forests can absorb carbon in the atmosphere through carbon sinks (Jin et al., 2020). Carbon sequestration by forests is declining. However, with proper management and monitoring, 100–200 Tg C per year of forest carbon can still be sequestered (Birdsey et al., 2006). Nevertheless, the impact of tropical forests on carbon storage is unknown. In scenario simulations, species composition has an important impact on carbon storage capacity (Bunker et al., 2005). Forestry stores the most carbon, and low harvesting will increase biodiversity indicators, such as dead wood and old forest areas (Heinonen et al., 2017). Therefore, through biodiversity conservation, it is possible to maximize the co-benefits of greenhouse gas mitigation (Rahman et al., 2021).
Due to climate policies that encourage the enhancement of forest carbon, forest ecosystems have been remodeled into carbon forestry. There is a serious threat to the potential of forests to benefit both nature and people (Ojha et al., 2019). The loss of biodiversity and climate change are causing an environmental crisis. Forests in tropical regions are most vulnerable to these crises. Climate change mitigation policies that reduce carbon dioxide caused by deforestation and degradation are often considered a win-win strategy (Phelps et al., 2012). However, some scholars have found that the coverage of forest resources has no significant impact on carbon emissions reduction (Xuan et al., 2020).
In direct proportion to global carbon emissions, deforestation contributes 6–17% of carbon emissions (Friel et al., 2009). As forests are cleared, carbon stored in leaves, branches, and roots is released into the atmosphere. Carbon dioxide in the atmosphere is primarily emitted by deforestation in the tropics. However, forest carbon storage varies spatio-temporally primarily due to natural and human disturbances (Baccini et al., 2012). The main cause of forest carbon emissions is deforestation. Climate change may cause the forest’s carbon sink function to cease. Consequently, reducing wood harvesting and ending deforestation are key strategies for mitigating climate change (Le Noë et al., 2021). Moreover, forest degradation results in three times more carbon loss than deforestation (Qin et al., 2021).
Forests are important sources and sinks of carbon, contributing to climate change (Köhl et al., 2015). There is a potential for tropical forests to become carbon sources in the future, mainly because of forest loss and the impact of climate change on their ability to absorb excess atmospheric carbon (Mitchard, 2018). Tree biomass sequesters carbon through climate change, which results in a faster increase in growing stocks due to increased tree growth. The effects of large forests can only be achieved with large areas of forest. Therefore, forest carbon balance highly depends on the rational use of forest resources (Eggers et al., 2008).
CO2 concentrations in the atmosphere can affect the global climate system. Carbon dioxide is sequestered from the atmosphere by forests as part of the carbon cycle. Higher carbon concentrations promote plant growth through a “fertilization effect” (Drake et al., 2016). There are, however, other factors that can limit plant growth, such as pollution or nutrient deficiencies. Consequently, existing forests will not increase carbon storage in response to increased atmospheric carbon concentrations (Beedlow et al., 2004). Forest carbon stocks are the most commonly overlooked factor in assessing forest carbon emissions (Ter-Mikaelian et al., 2015). Plants absorb a great deal of CO2 from the atmosphere. Due to a lag in tree mortality, forest carbon stocks may increase only temporarily. Thus, the current stimulation of tree growth will eventually result in a lagged increase in mortality, which will eventually lead to carbon gains (Brienen et al., 2020).
Reforestation has potential and value, but it should be carefully considered as one of the best ways to reduce carbon emissions from humans (Taylor and Marconi, 2020). However, there is the problem of carbon leakage that cannot be ignored. When the amount of carbon released elsewhere destroys the direct carbon benefits, forest carbon sequestration leakage happens. The carbon leakage effect should not be ignored when using forests to mitigate carbon emissions. Forest carbon sink leakage is heavily influenced by specific activities and regions (Murray et al., 2004).
China has been focusing on low-carbon policies to reduce city-level emissions (Liu and Qin, 2016). Using the method of Propensity Score Matching-Difference in Differences (PSM-DID), it was verified that the low-carbon city pilots significantly increased the actual performances of local enterprises with data from 285 Chinese prefectures from 2005 to 2015. By implementing a low-carbon pilot policy, enterprises can achieve emissions reductions and high-quality growth (Chen et al., 2021). According to the Difference in Differences (DID) model and the spatial DID model, low-carbon city pilots have enhanced carbon emission efficiency by 1.7%. According to the scenario analysis, low-carbon city pilots increased carbon emission efficiency by 1%, resulting in an 8.37 million tons reduction in carbon emissions (Yu and Zhang, 2021).
In a study of 282 Chinese cities from 2004 to 2018, it was verified that the pilot program can significantly reduce carbon emissions, and urban heterogeneity is evident. Additionally, low-carbon pilot policies help reduce carbon dioxide emissions through resource allocation, energy conservation, and technological innovation (Du et al., 2022). Data at the enterprise level in China shows that low-carbon pilot projects are effective at reducing coal consumption and intensity (Zhou et al., 2022). However, it is found that urban low-carbon pilots with high levels of innovation perform better in terms of urban heterogeneity (Zhang H. et al., 2022). Additionally, resource-based cities have a greater effect on reducing emissions (Zeng et al., 2023). According to the cost–benefit analysis of the pilot policy, the annual dioxide emissions of low-carbon pilot cities are reduced by 2.72 percent. In contrast, the related economic losses from 2013 to 2017 amounted to approximately 1.19 trillion yuan. By upgrading industrial structures and promoting technological innovation, the pilot cities can improve total factor productivity (Huo et al., 2022).
The setting of carbon reduction targets can facilitate the diffusion and learning of low-carbon city policies between different cities (Song et al., 2021). The promotion of low-carbon urban development is essential to reducing dioxide emissions. At different stages of urban development, different factors influence carbon emissions. Taking the capital of China, Beijing, as an example, the driving forces of such an increase in carbon emissions between 1991 and 2004 were economic aggregate and population size, while the real driving force behind reductions was industrial structure. From 2004 to 2022, economic performance contributed the most to the increase in carbon emissions, followed by total population and accessibility to energy (Shen et al., 2018). Government, enterprises, non-governmental organizations, and citizens are the main participants in the governance framework of low-carbon cities. The main framework for target-based low-carbon urban governance can also be used for other cities (Liu et al., 2018).
Despite some reductions in carbon emissions as a result of the pilot policy, insufficient market-oriented measures and supportive policies will impede the creation of truly low-carbon cities (Khanna et al., 2014). Even though the low-carbon pilot policy has the potential to reduce carbon emissions, improving carbon emission efficiency will take longer. Compared to China’s western regions, eastern cities are more affected by the pilot policy, thereby adding to the urban division between the eastern and western regions (Fu et al., 2021). Green total factor productivity increased significantly after the low-carbon pilot policy was carried out in the first year, but its effects gradually waned in subsequent years (Liu et al., 2020). According to panel data collected from 49 cities between 2005 and 2018, it has been quantitatively tested that the low-carbon pilot policy has failed to meet the goals and expectations, with the policy itself increasing carbon intensity by 15–20%. This unintended outcome is likely caused by the construction of initial infrastructure and the development of the economic circle, and the decarbonization process will subsequently increase carbon intensity (Feng et al., 2021).
The continuous advancement of digitalization has provided the basis for the development of smart cities and provided new opportunities for economic development (Krishnan et al., 2020). Carbon dioxide emissions are concentrated in cities and must be controlled in cities (Huang et al., 2022). By combining low-carbon pilots with smart cities, the emission reduction effect is better, and it far exceeds that of single pilot cities. In the long run, low-carbon pilot policies will mainly rely on big data, high technology, and industrial innovation to reduce carbon emissions (Zhang and Fan, 2023). As scarce resources and high-tech innovation become more prevalent, smart city construction will increasingly become a technology-based solution for efficient, affordable, and sustainable urban living. As part of the agenda of environmental sustainability, smart cities will also reduce carbon dioxide (Cavada et al., 2016). Essentially, smart cities are a new kind of urban development model that supports green urban development. The construction of smart cities often promotes sustainable development through urban planning, smart infrastructure construction, and smart governance (Cheng et al., 2022).
Investing in smart cities can indeed improve urban carbon emissions efficiency, and this promotion effect on the low-carbon economy will gradually increase over time (Qiu et al., 2021). Smart cities help build low-carbon economies by optimizing government functions, improving governance efficiency, and implementing openness, especially for large cities (Fan et al., 2021). A smart city’s primary purpose is to reduce per capita carbon emissions through improved energy efficiency, and this is more apparent in cities where the administrative level is higher and green innovation is more prevalent (Guo et al., 2022). When working with big data to reduce emissions in a smart ecosystem, the government may face various challenges (Giest, 2017).
Through the development of smart technologies, smart cities reduce emissions related to transportation and education, thereby reducing household indirect carbon emissions (Wu, 2022). When residents combine energy saving, money saving, changing consumption behavior, and reducing carbon emissions, they will consciously develop a low-carbon lifestyle and reduce the family’s carbon footprint (Hurst et al., 2020). Besides, smart transportation can not only curb transport-related carbon emissions but also greatly curb dioxide emissions in non-traffic sectors. Furthermore, smart transportation affects carbon dioxide emissions indirectly through traffic scale, structure, and technical factors (Zhao et al., 2022). Through the analysis of 279 cities in China from 2008 to 2018, it is verified that smart cities can significantly reduce pollutant emissions and energy intensity, thereby promoting the development of an urban green economy (Liu K. et al., 2023).
Existing literature provides good theoretical and practical support for this research. However, few studies are conducted from the double dual perspective of natural resources and man-made policy. There are several possible marginal contributions of this research. First of all, this study clarified the controversy of forest natural resources as carbon source and carbon sink through empirical analysis, and scientifically analyzed the impact of forest resource abundance on carbon emissions based on fully considering the dual attributes of forest as carbon sink and carbon source. In addition, based on the panel data of 41 cities in the YRD region from 2007 to 2019, this paper empirically tests whether natural resource endowment and low-carbon pilot policies can help reduce carbon emissions from the dual perspectives of resources and policies by using econometric models. Third, to strengthen the urban ecological spatial layout and conform to the trend of urban digital and low-carbon development, this paper uses the Difference in Difference in Differences (DDD) method to test whether the carbon emission reduction effect of low-carbon city pilot policies has significant heterogeneity in resource endowment and smart city construction. Also, this paper provides some experience and reference for the YRD region to realize green transformation development in the digital age.
Forest resources reduce emissions primarily by absorbing carbon dioxide from the atmosphere. In addition to being carbon sinks and sources, forest resources need to be managed properly to reduce carbon emissions effectively. It is not enough to reduce carbon emissions using nature-based solutions. Minimizing carbon emissions effectively requires a synergistic approach. Cities are responsible for the majority of carbon emissions during urban development. Low-carbon city pilots examine heterogeneity in three ways: whether the city is resource-based, smart, or forest-rich. In this paper, according to the practice of previous scholars (Ding et al., 2006), as long as the forest coverage rate exceeds 30%, it is considered a city with abundant forest resources. The paper thus proposes three hypotheses:
Hypothesis 1: Forest resources inhibit carbon emissions, but considering the dual attributes of forest carbon sinks and carbon sources, there is a nonlinear relationship between forest resources and net carbon emissions.
Hypothesis 2: Low-carbon city pilots have significant policy effects on carbon emissions reduction.
Hypothesis 3: The policy effect of low-carbon city pilots has significant urban heterogeneity, and the effect is better in smart cities, resource-based cities, and cities with richer forest resources. The research framework for this paper can be seen in Figure 2.
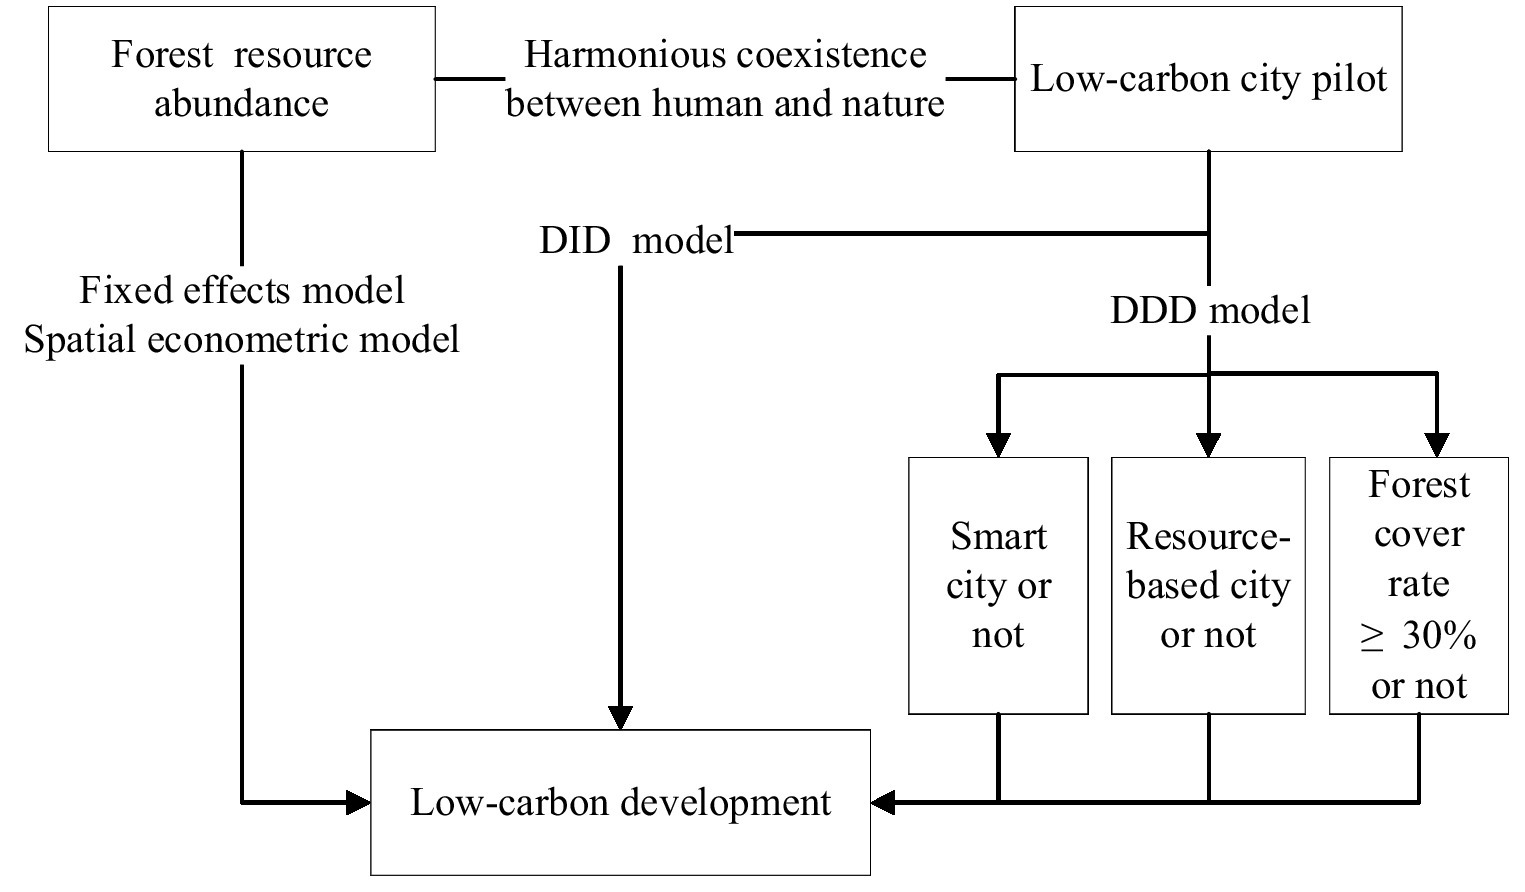
Figure 2. Research framework.
In order to examine the impact of forest resources abundance in YRD on carbon emissions, using 41 cities in this region from 2005 to 2019, a double fixed effect model was established as follows:
Where formula (1) represents a linear model, and formula (2) represents a nonlinear model. Carbon in those functions represents the emissions of carbon dioxide per GDP, FC represents the forest coverage rate, FC2 represents the square of the forest coverage rate, i represents the city in YRD, t represents the year, represents the individual effect of the city, represents the period effect, and represents random error term.
Two types of spatial weight are selected. Queen contiguity spatial weight refers to the fact that as long as there are common edges or points between two regions, they are geographically adjacent. There is also a distance weight matrix derived from the longitude-latitude distance formula (Zhang Q. et al., 2022). It is calculated as follows:
Where represents the distance from the sample set to the local point i. stands for fixed value . is equal to the radius of the earth and the value is 6378.1 km. Gaussian distance weight matrix is represented as follows:
Where the centroid distance between regions i and j is indicated by dij, and b is bandwidth.
Spatial autocorrelation must first be determined. Spatial autocorrelation measures the degree of interdependence between data at a given location and data at other locations, which is a basic feature used to measure geographic data (Getis, 2008). Spatial interactions and spatial diffusion primarily influence this degree of interdependence. Geographic statistics can be assessed using Moran’s index (Getis, 2007). This paper mainly tests Moran’s index for the dependent variable. All Moran’s indices exceed 0 and are less than 1, and are significant at the level of less than 10%, suggesting spatial autocorrelation exists, and spatial distance can influence regional behavior.
This paper also performs the LM test as a first step in verifying Moran’s index. Spatial lag and spatial error effects of the explained variable carbon emissions per GDP are both significant at the 1% level, indicating an absence of spatial lag and spatial error (Baltagi and Bresson, 2011). Therefore, the linear and nonlinear spatial Durbin model (SDM) and spatial autocorrelation model (SAR) are, respectively, constructed to analyze the specific effects of forest resources on carbon emissions. Here are the settings for the model.
Where formulas (5, 6) are linear SDM and SAR models, respectively, and formulas (7, 8) are nonlinear SDM and SAR models, respectively. represents spatial weighting matrix between adjacent cities, individual i and j are 1,2,…,n, and the time t is 1,2…,t. Control variables are represented by Cont, and other variables have meanings consistent with benchmark models (refer to section 3.2).
The above analysis examines the impact of urban low-carbon development from the standpoint of natural resource endowments. However, environmental-friendly and low-carbon development remains a crucial battlefield for cities to reduce carbon emissions. In this paper, the low-carbon city pilot policy in 2012 is used as an exogenous impact variable to examine the policy’s effect on carbon emissions. This is how the model is set:
Where Postt means if it belongs to a year or after a low-carbon city program is implemented, then it takes 1, if not it takes 0. Treati means that whenever a city belongs to the pilot program, it takes 1, meaning the treatment group; otherwise, it takes 0, meaning the control group. The coefficient β measures how low-carbon city policies influence carbon emissions. Other variables follow the meaning of the baseline model.
The problem with the difference-in-differences method is that, along with low-carbon pilot policies, there may be other factors affecting carbon emissions, which may bias the results. As such, this paper builds a DDD model to examine urban heterogeneity (Tang et al., 2021).
The YRD region is characterized by high levels of innovation and digitalization. A smart city’s impact on carbon emissions is explored in this part by constructing the DDD model in the following way.
Where SM acts as a dummy variable. When the city belongs to the smart city, SM is 1, otherwise it is 0. If the coefficient of is significantly positive, it suggests that compared with more advanced smart city construction, low-carbon pilot cities work better on reducing CO2 emissions than cities with a lower level of smart city construction. Other variables are in line with the baseline model.
A city’s industrial structure is greatly determined by its resource endowment. Specifically, this part examines the impact of resource-based cities on carbon emissions and constructs the DDD model as follows.
Where Rcity acts as a dummy variable. When the city is classified as a resource-based city, Rcity is assigned a value of 1, otherwise it is 0. If the coefficient of is statistically significant, it indicates that low-carbon pilot policies are more effective in resource-based cities. As for other variables, they are consistent with the baseline model.
In the short term, reforestation remains the most economical method of reducing carbon emissions. From the perspective of forest resources, combined with low-carbon pilot policies, this part verifies the emission reduction effect of forest resources, and constructs the DDD model as follows.
Where Fra is a dummy variable. When the coverage rate of forest resources is greater than or equal to 30%, Fra is 1, otherwise it is 0. If the coefficient of is significantly positive, it means the pilot program reduces emissions better in cities with abundant forest resources than in cities with scarce forest resources. The baseline model predicts other variables.
Low-carbon development in social development requires more than just reducing carbon emissions. Taking economic development into account is also important. Thus, carbon emissions per GDP serve as the explained variable, and forest cover rate is used as the main explanatory variable. At the same time, economic indicators, environmental indicators, and institutional indicators are selected as control variables to ensure the rationality and credibility of the model results as much as possible. Table 1 lists the data source and variables.
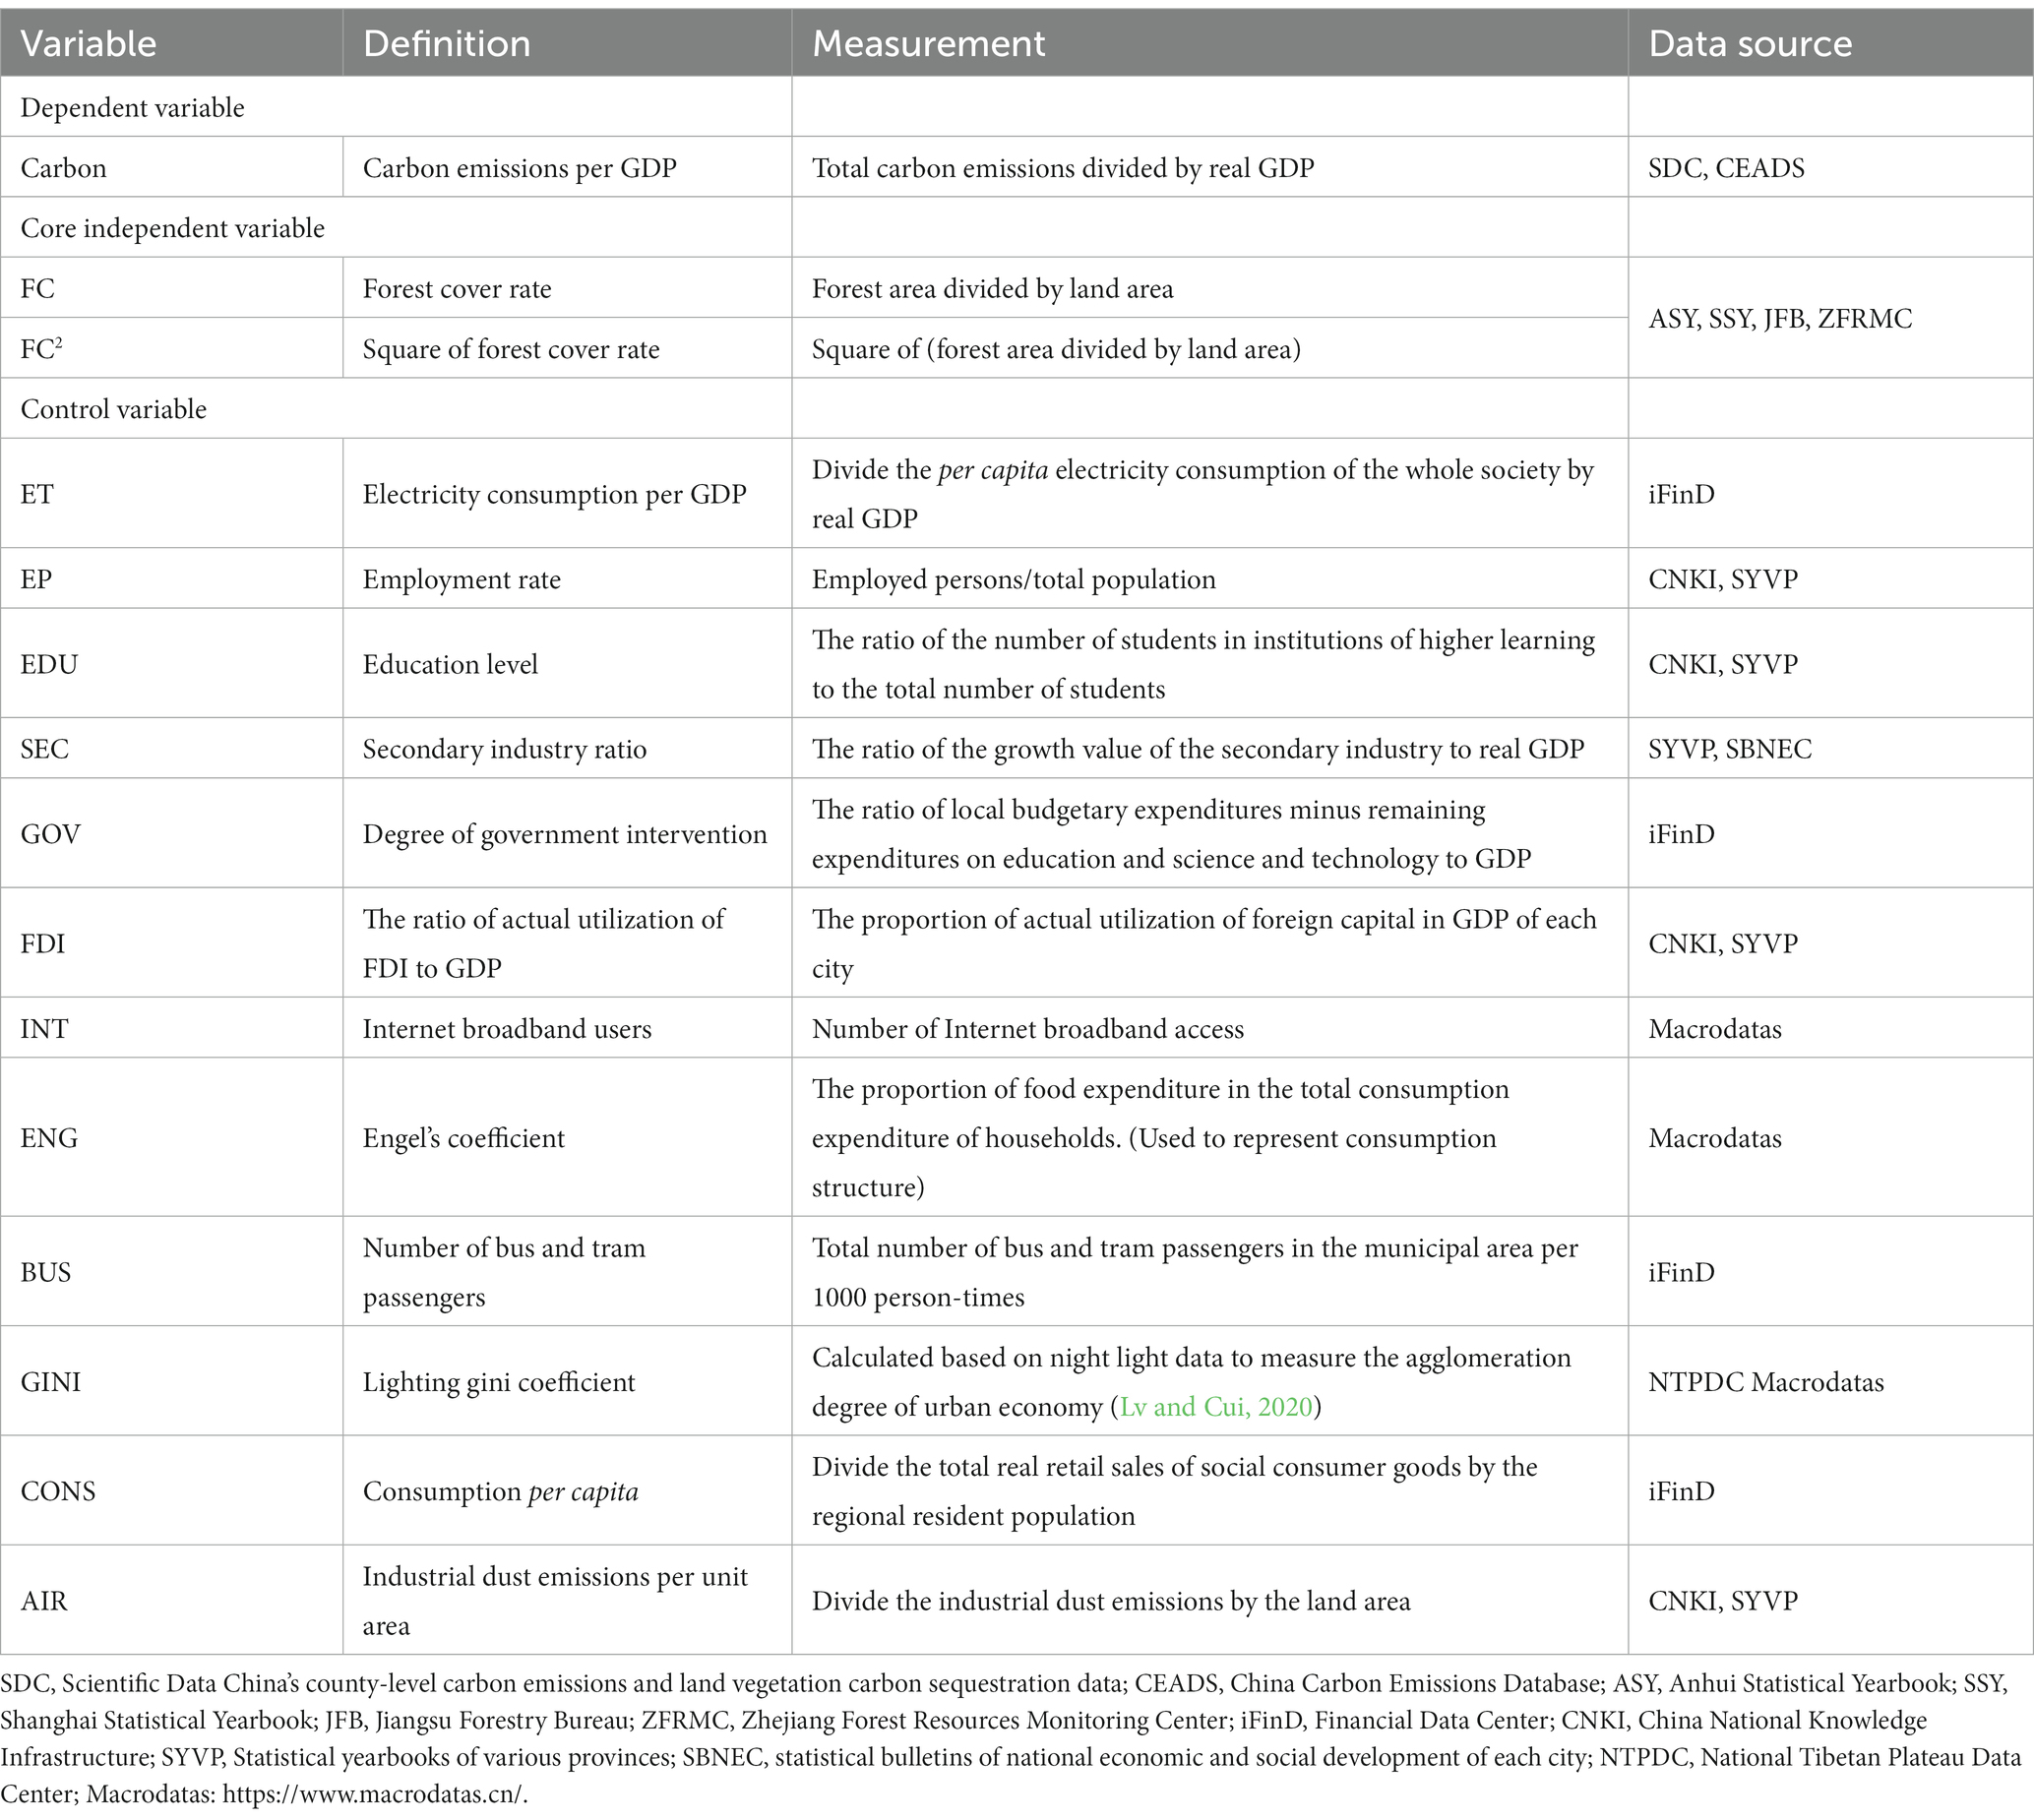
Table 1. Data source and variables.
Moreover, this paper presents estimates of net carbon emissions per GDP (Ncarbon) excluding forest carbon sequestration. In the calculation of forest carbon storage, many studies rely on forest coverage or forest area (Sun and Liu, 2019). With the forest area data in YRD, this paper analyzes the forest carbon sink capacity from 2005 to 2019. The net ecosystem productivity of vegetation (i.e., carbon sink) is a measure of how much carbon dioxide enters the ecosystem from the atmosphere. The calculation does not include carbon emissions from vegetation respiration. Here is the formula for calculating vegetation net ecosystem productivity (Yi et al., 2015).
Where Cnep refers to the net ecosystem productivity of the forest ecosystem, which reflects the total carbon sink absorbed by the forest ecosystem every year. Cveg is the net production per unit area of vegetation, that is, the annual carbon sink absorbed by the forest per unit area, which is taken as 3.81thm−2a−1 (Xie et al., 2008); Aveg is the vegetation area. Forest area is calculated from forest coverage rate and land area. The net carbon emission per GDP is mainly the carbon emission per GDP minus forest carbon sinks.
This paper uses data from 41 cities in YRD from 2005 to 2019 to examine the abundance of forest resources and how low-carbon pilot policies reduce carbon emissions. Moreover, it proposes strategies that take natural resources and policies into account for sustainable development. Each variable is described in Table 2. In order to remove the influence of each variable’s dimension, all variables are standardized.
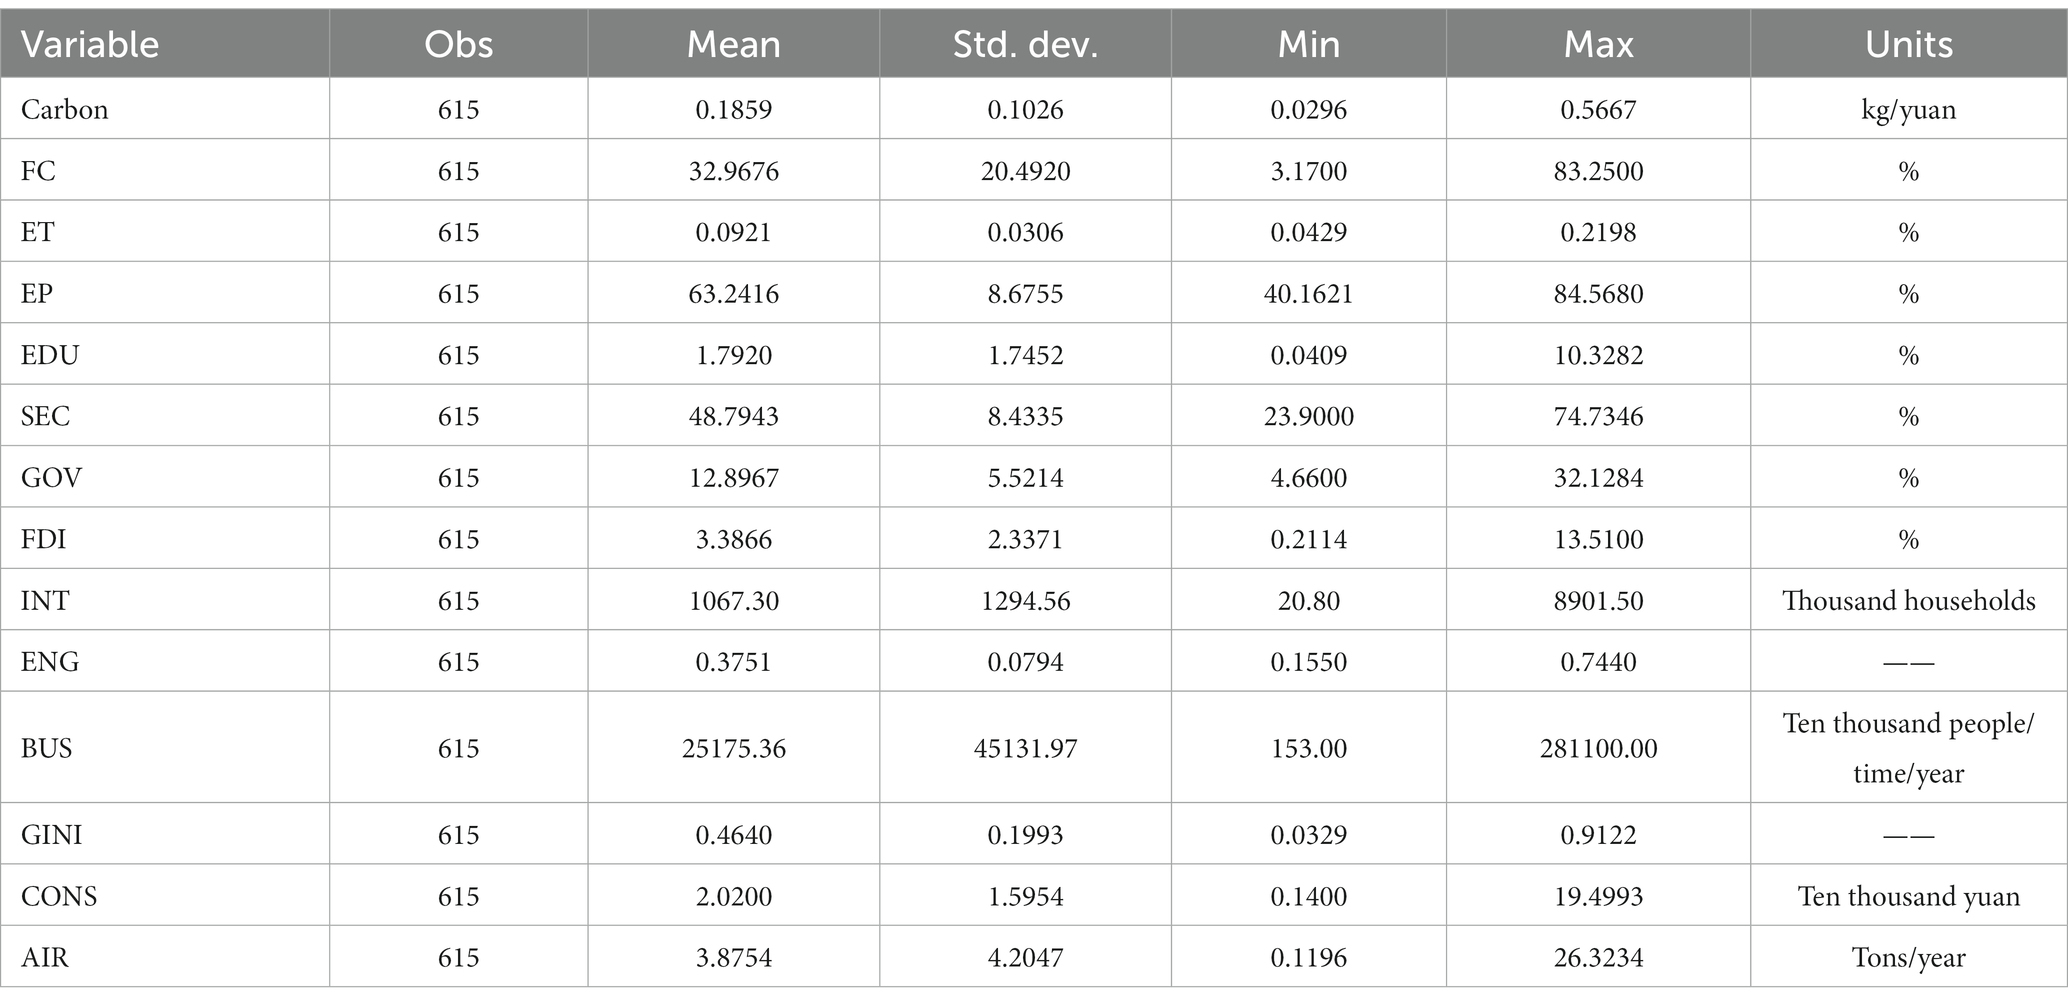
Table 2. Descriptive statistics of variables.
Table 3 is the correlation analysis of each variable. In the table, almost all the correlation coefficients are less than 0.6, implying that there is little correlation between variables.
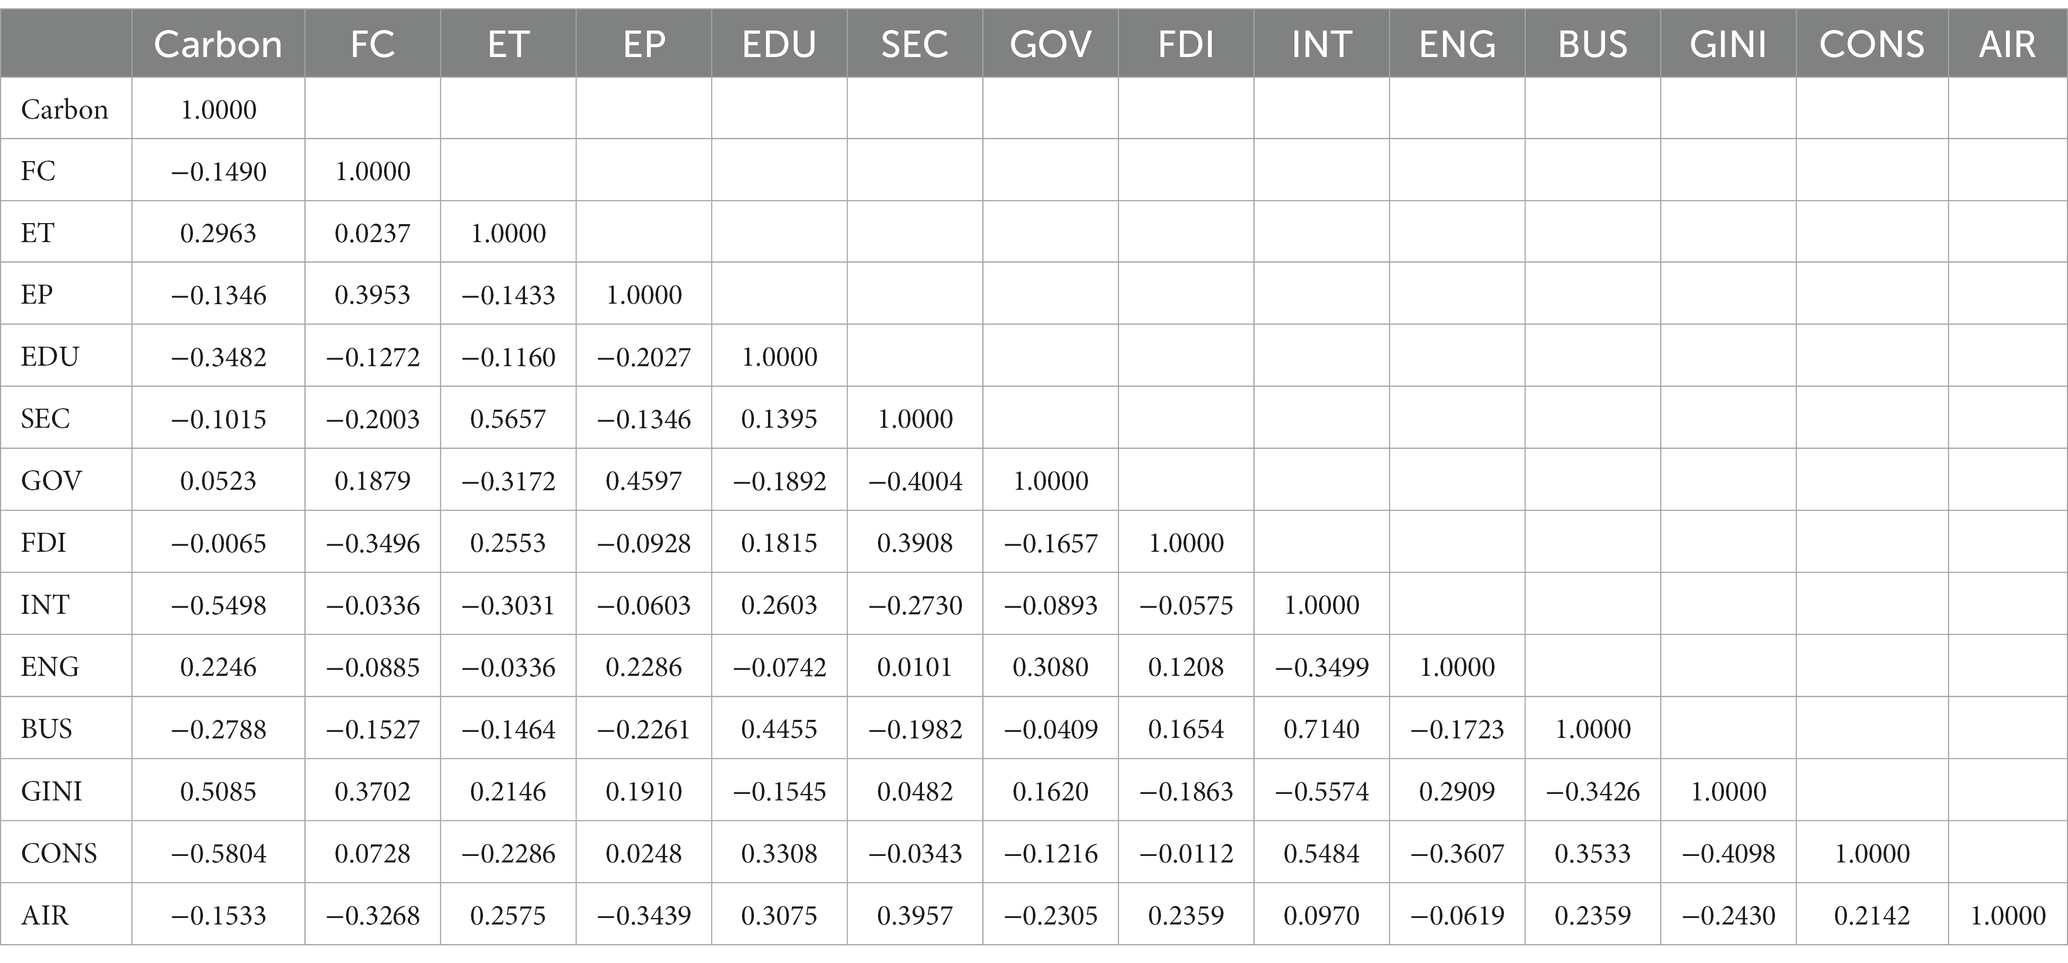
Table 3. Correlation analysis of all variables.
Table 4 shows each variable’s multicollinearity analysis. In order to determine if variables are multicollinear, variance inflation factors (VIF) and tolerance (TOL) are commonly used. Multicollinearity is generally considered to be more serious if the VIF is greater than 10. The VIF and TOL results revealed no multicollinearity between variables, as the VIF and TOL averages are only 2.09 and 0.52, respectively.
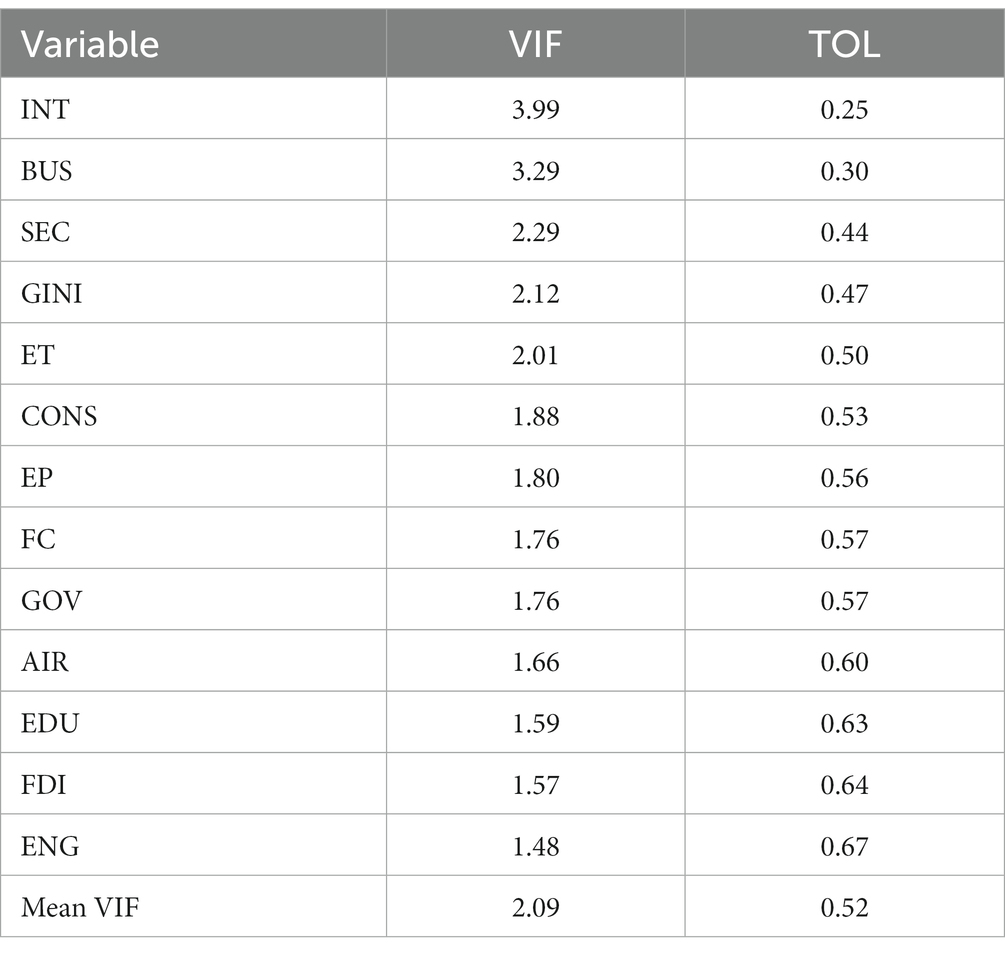
Table 4. Multicollinearity analysis of variables.
The Hausman test was performed in this paper, and the p value indicated that a fixed effect model was appropriate. Table 5 shows that forest resources can reduce carbon emissions, and FC is negatively correlated with carbon emissions. Models (1) and (2) in Table 5 are linear double-fixed-effect models. Carbon emissions per GDP and net emissions per GDP are negatively related to forest resources, while net emissions have a greater impact. Models (3) and (4) in Table 5 are non-linear double-fixed effect models. Forest resources have a U-shaped trend on net carbon emissions per GDP, indicating that the coverage of forests reduces net carbon emissions and promotes them. Forests can indeed sequester carbon, but they can also release carbon. This has a lot to do with the structure and diversity of the forest (Malhi et al., 2002). Whether forests can continue to absorb carbon and get rid of carbon-neutral attributes has a lot to do with the management model of forest resources. In addition, forests can provide net ecosystem productivity (Luyssaert et al., 2008).
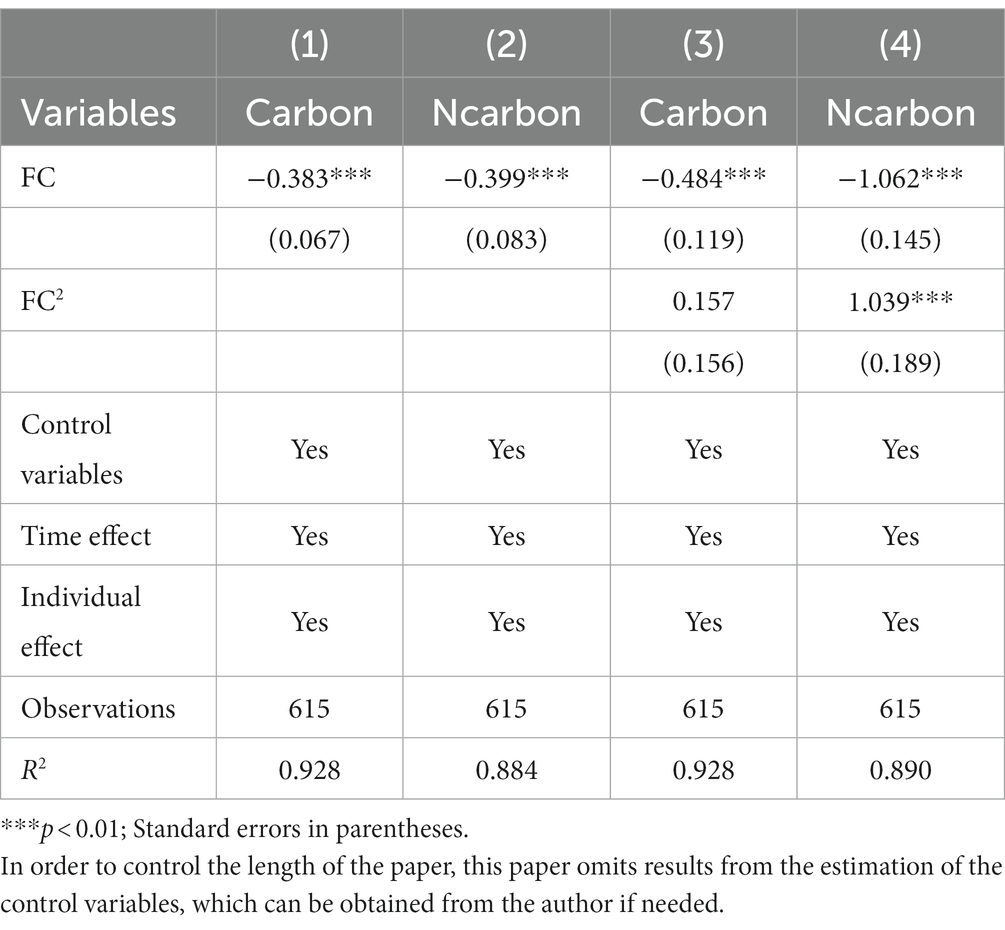
Table 5. Estimation results of the panel model.
SDM and SAR, both fixed effect models, consider the spatial factor. The spatial weights are based on the Queen contiguity weight matrix. According to the linear spatial SDM and SAR models, forest resources reduce carbon emissions. The U-shaped trend of forest resources and carbon emissions per GDP has not been verified using nonlinear spatial SDM and SAR models. However, forest resources do affect carbon emissions per GDP (see Table 6 for more details).
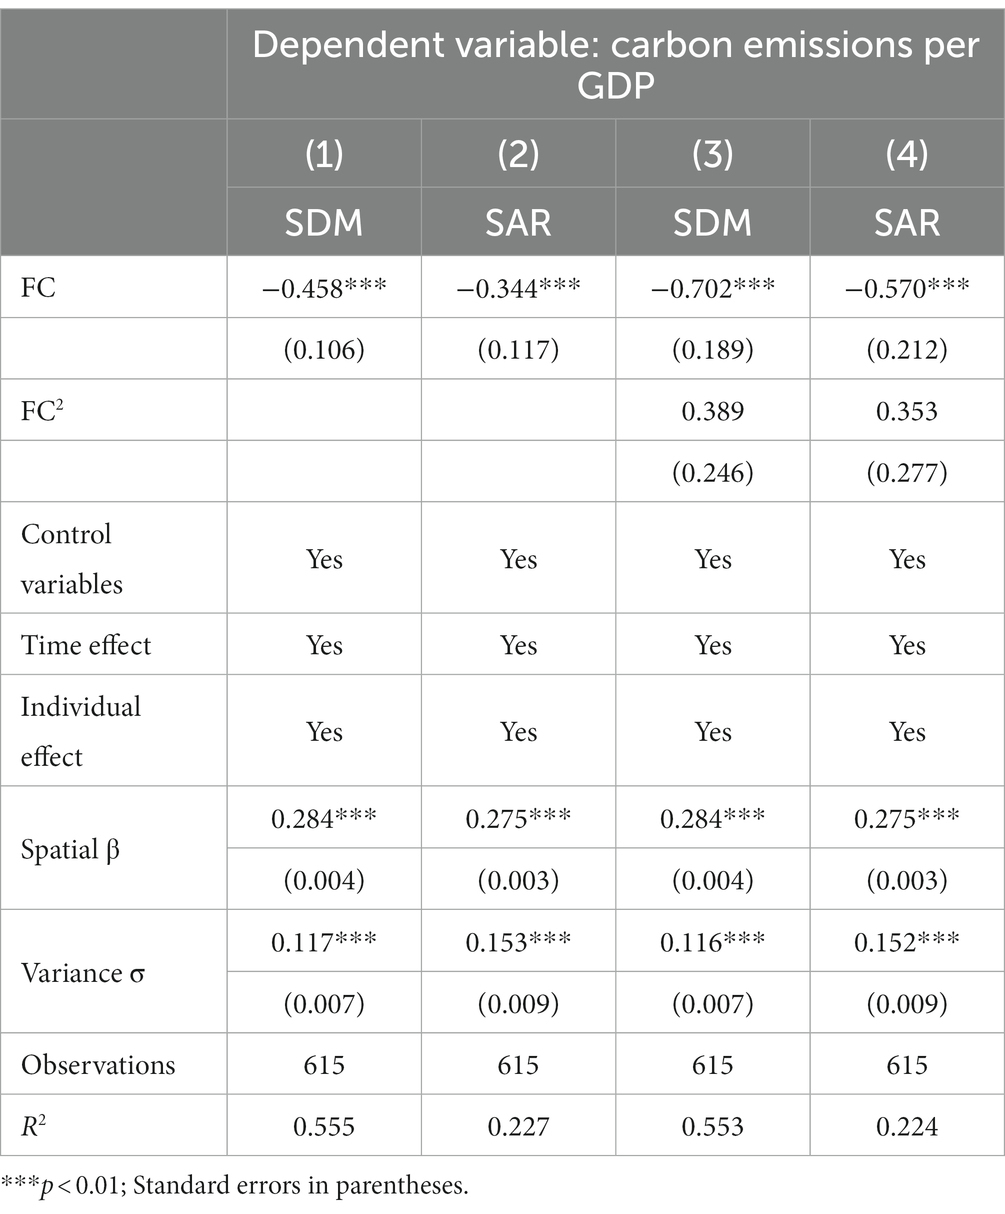
Table 6. Estimation results of SDM and SAR models for carbon emissions per GDP.
The spatial weight still adopts the Queen contiguity weight matrix. As shown in Table 7, under the linear spatial SDM and SAR models, forest resources are found to act as an inhibitor of carbon emissions. Nonlinear spatial SDM and SAR models indicate a U-shaped association between forest resources and net carbon emissions per GDP, with forest resources first inhibiting and then promoting net carbon emissions per GDP. Not all forests lead directly to carbon neutrality. Forests absorb atmospheric carbon dioxide through photosynthesis, thereby lowering or slowing down the increase of carbon dioxide in the air. This relatively reduces the pressure on carbon emissions (Malhi et al., 2002). However, if the forest is cut down, encounters fire, or dies naturally, the carbon dioxide stored in the tree can decompose and be released into the air, and the forest will become a carbon source from a carbon sink. In addition, forests will reduce snow cover in winter but will absorb more solar radiation, which is not conducive to mitigating climate warming (De Frenne et al., 2021).
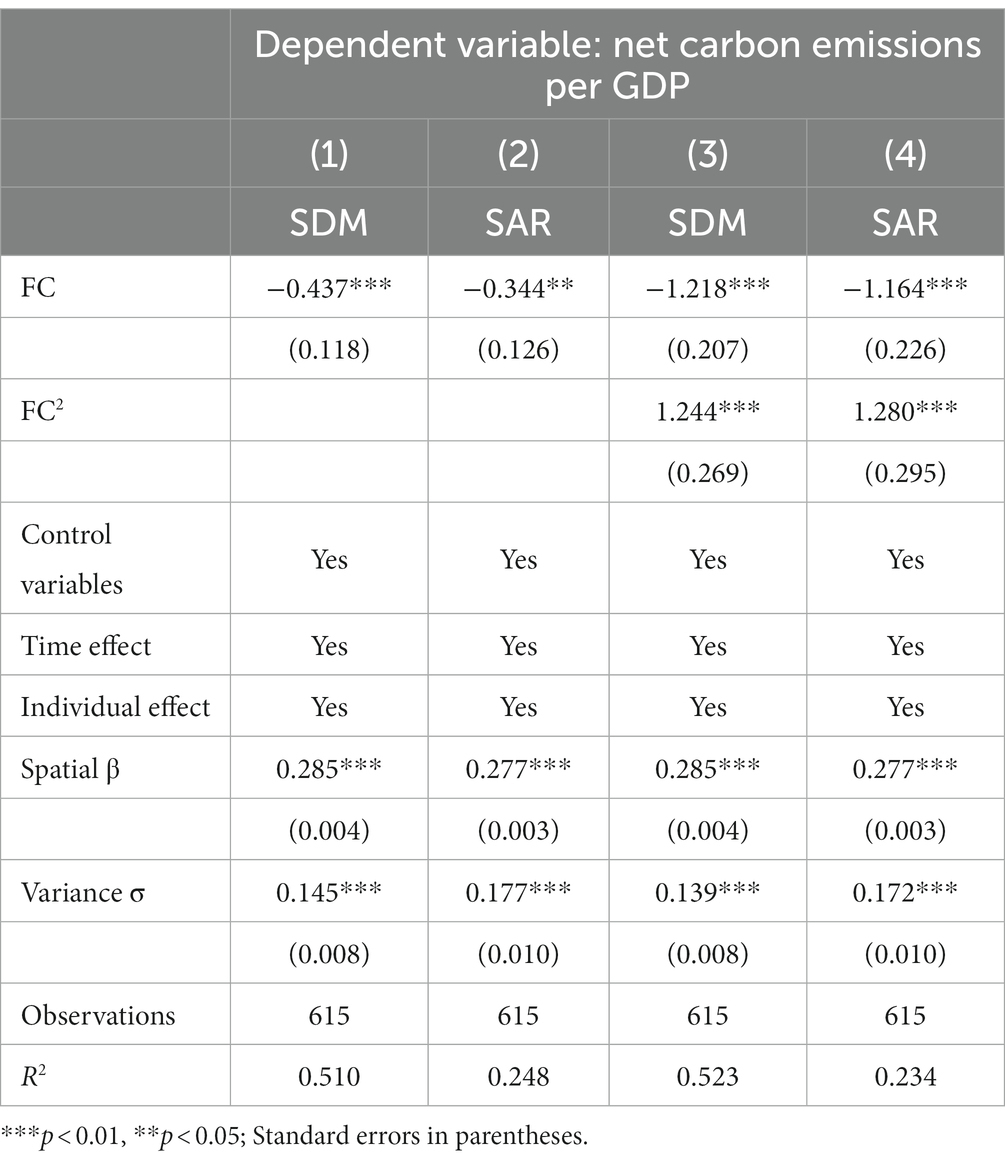
Table 7. Estimation results of SDM and SAR models for net carbon emissions per GDP.
1. All explanatory variables are lagged by one period
For robustness check, this paper lags all the explanatory variables in the non-spatial model for one period. The models (1) and (2) in Table 8 are linear double fixed effect models. Net emissions per GDP are negatively correlated and have a greater impact on net carbon emissions. Models (3) and (4) are non-linear double fixed effect models. The results show that forest resources have a U-shaped trend on the net carbon emissions per GDP, the forest coverage rate shows a restraining effect on net emissions and then shows a promoting effect on net emissions. The estimation results remain almost the same.
1. Substitution of explanatory variables
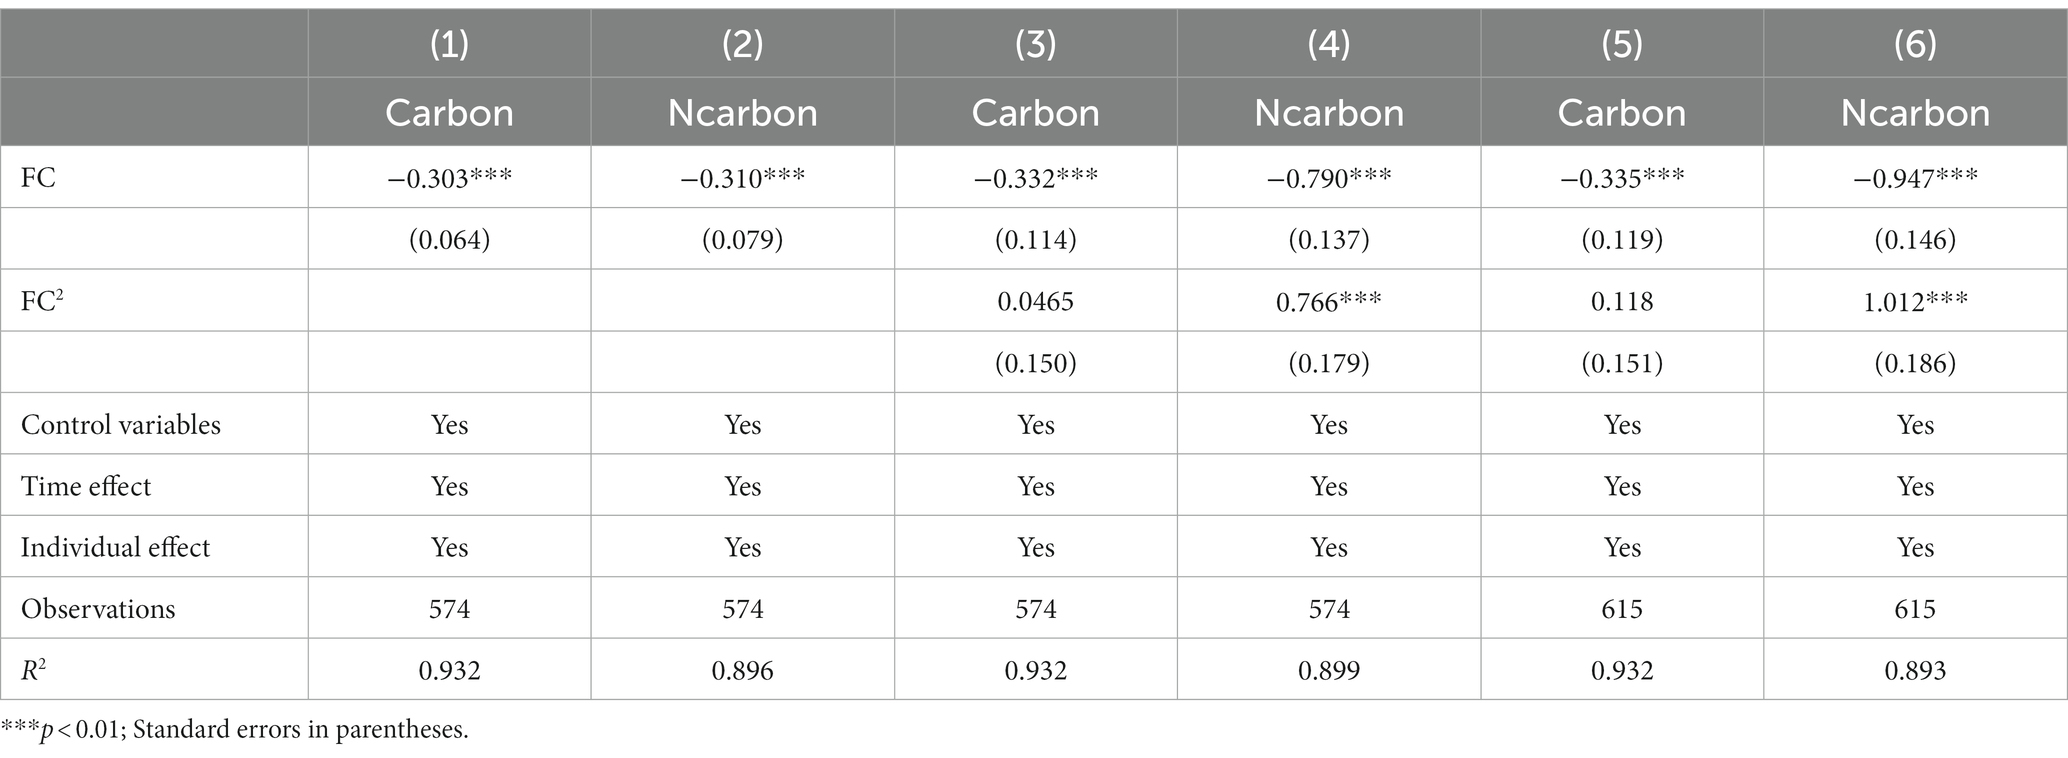
Table 8. Robustness test results of non-spatial models.
The method of replacing explanatory variables is also used to confirm the estimations’ robustness, and the Gini coefficient of light is replaced with the urbanization rate. The models (5) and (6) in Table 8 are nonlinear double fixed effect models. Carbon emissions per GDP are negatively related to forest resources, but net carbon emissions per GDP show a U-shaped trend.
1. Replace the spatial weighting matrix
In this part, the Queen contiguity spatial weight matrix is changed to the longitude-latitude distance spatial weight matrix. Other variables remain unchanged. The linear model results show that forest resources are inhibitory to the carbon emissions per GDP. The nonlinear model shows that the U-shaped trend of forest resources on carbon emissions per GDP has not been verified (see details in Table 9).
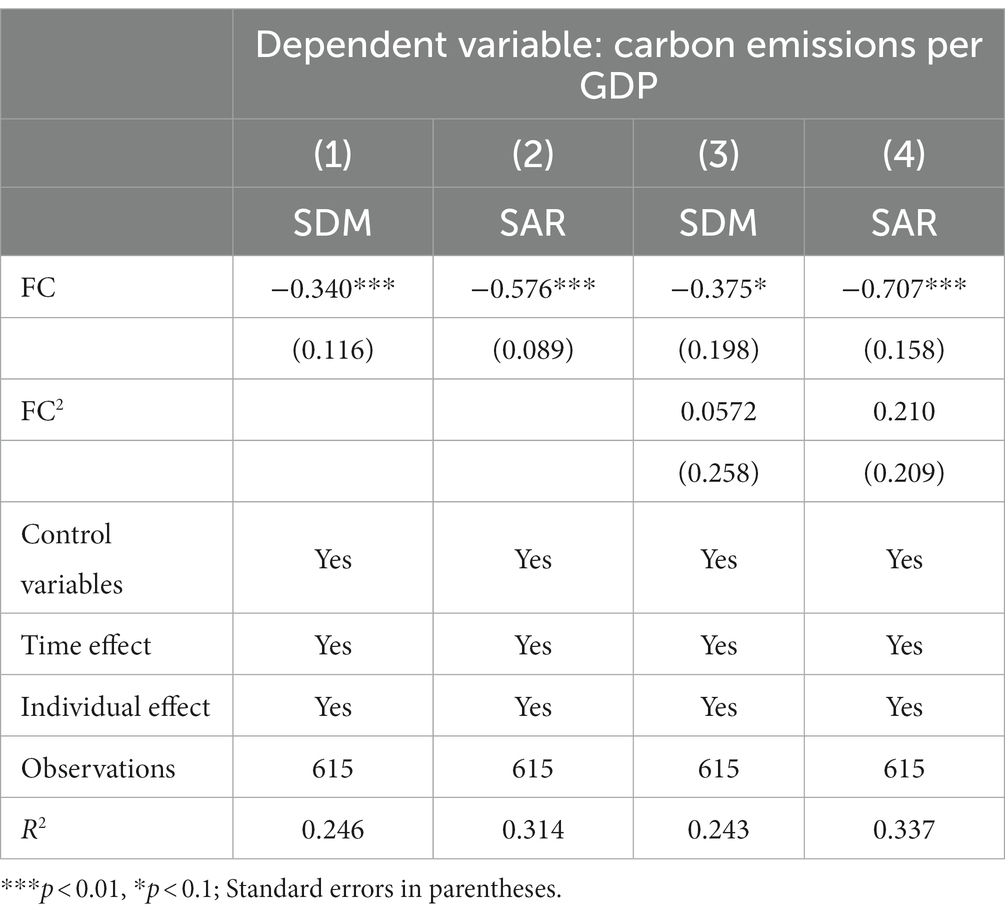
Table 9. Robustness test results of the spatial model (Carbon emissions per GDP).
Results of the linear model indicate that forest resources reduce net carbon emissions per GDP. As shown by the nonlinear model, forest resources first inhibit and then promote net carbon emissions per GDP. The U-shaped relationship between forest resources and net carbon emissions has been demonstrated (see details in Table 10).
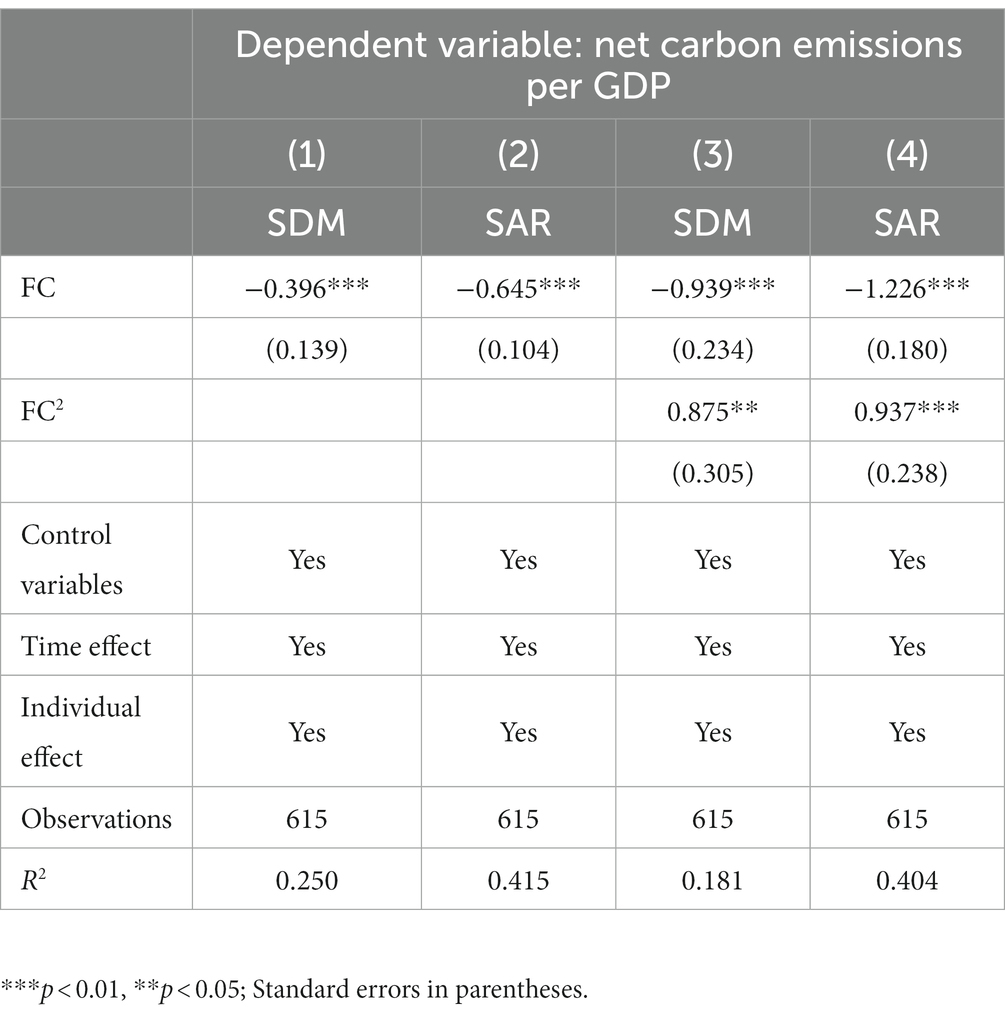
Table 10. Robustness test results of the spatial model (Net carbon emissions per GDP).
To test whether low-carbon cities can reduce carbon emissions, six low-carbon pilot cities have been selected, namely Chizhou, Huai’an, Ningbo, Suzhou (Jiangsu), Wenzhou, and Zhenjiang. The treatment group consists of these 6 cities, while the control group consists of the remaining cities. 2012 is the cut-off point for the policy implementation. With a DID model, we find that low-carbon policies are effective at reducing carbon emissions in the YRD region (see column 1 in Table 11).
Figure 3 shows the parallel trend test. One of the premises used in the DID method is that there should be no significant difference or a common growth trend in carbon emissions before policy implementation between low-carbon pilot cities and cities without low-carbon pilot cities. It can be seen that prior to and following the year of policy implementation (2012), no significant difference occurred in the carbon emissions of the two types of cities before the implementation of the policy, indicating that the assumption of parallel trends is satisfied.
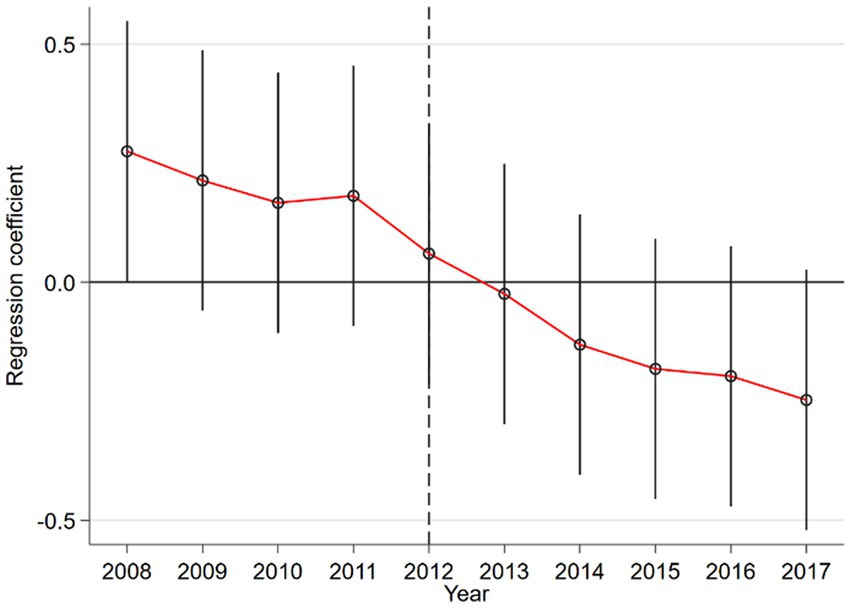
Figure 3. Parallel trend test diagram.
This paper uses two methods for placebo testing. First, implement the policy 1 year earlier, that is, in 2011. The pilot cities remain unchanged, and there is no significant regression result, indicating that the original policy is effective. Second, two random groups were created, and the permute command was used to repeat the sampling 1,000 times. After the dependent variable was randomly generated, the result was no longer significant. The regression results were estimated in columns (2) and (3) in Table 11. As a result, there is a relatively good implementation effect for the low-carbon pilot policy.
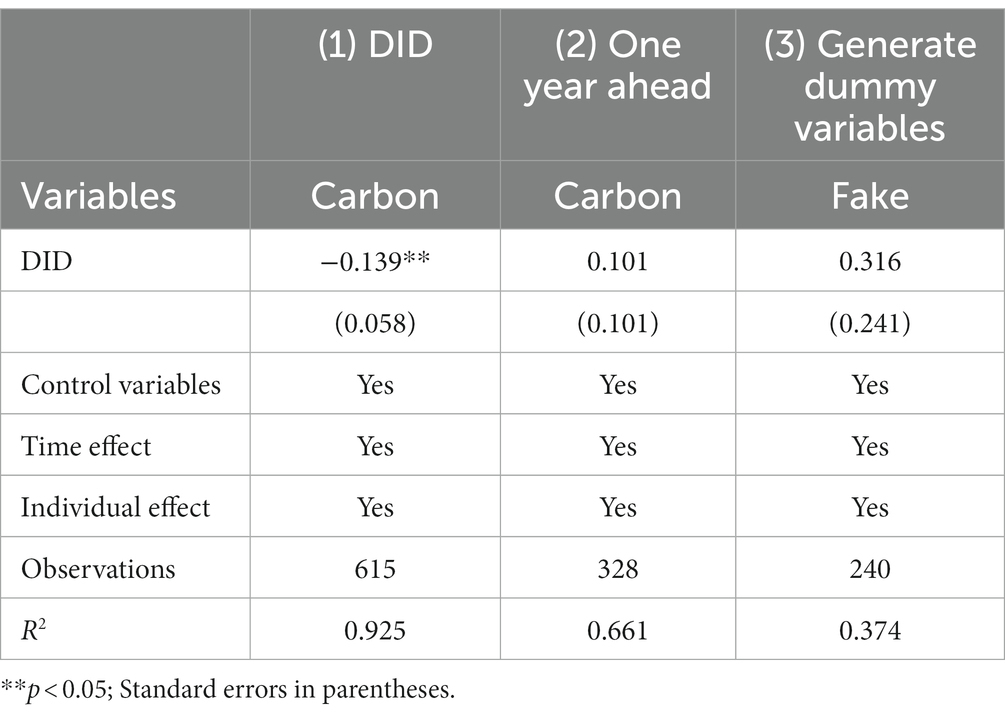
Table 11. Estimation results of DID model.
Figure 4 is a plot of estimated coefficients using kernel density distributions for the placebo test. According to the two-sided test, the estimated results of the model are less likely to be influenced by unobservable factors. In line with what would be expected from a placebo test, the coefficients have a normal distribution. The above arguments all show that the model results are robust.
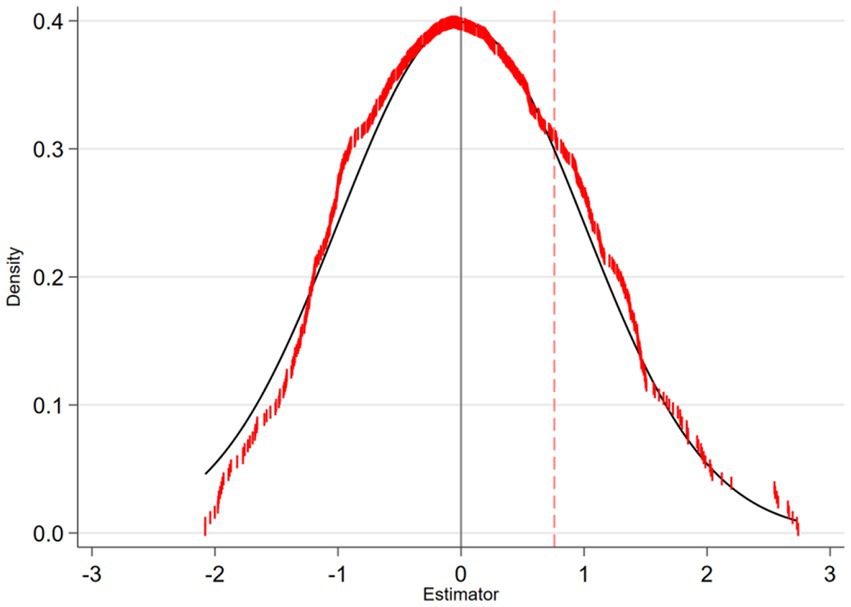
Figure 4. Kernel density map.
It is well-known that cities are carbon-intensive areas. Considering the different digital development trends and urban resource endowments in the YRD region, this paper examines the heterogeneity of the effect of low-carbon pilot policies from three aspects: smart city (SM) or not, resource-based city (Rcity) or not, and forest resource-rich city (Fra) or not.
Models (1) and (2) in Table 12 show the results of the low-carbon pilot policy effect heterogeneity in smart cities. The results show that coefficients associated with the Post*Treat interaction term are all negative. However, the coefficient for triple differences is significantly positive. It shows that, in comparison with cities with high levels of smart city construction, low-carbon pilot cities have a relatively greater effect on reducing carbon emissions than cities with low levels of smart city construction, and their effect on net carbon emissions is more obvious. Smart city policies will indirectly reduce household, transportation, and education-related carbon emissions (Wu, 2022). In addition, smart cities are more inclined to industrial innovation, market-oriented innovation, and digital innovation, which are more conducive to improving the efficiency of carbon emission reduction (Zhang and Fan, 2023).
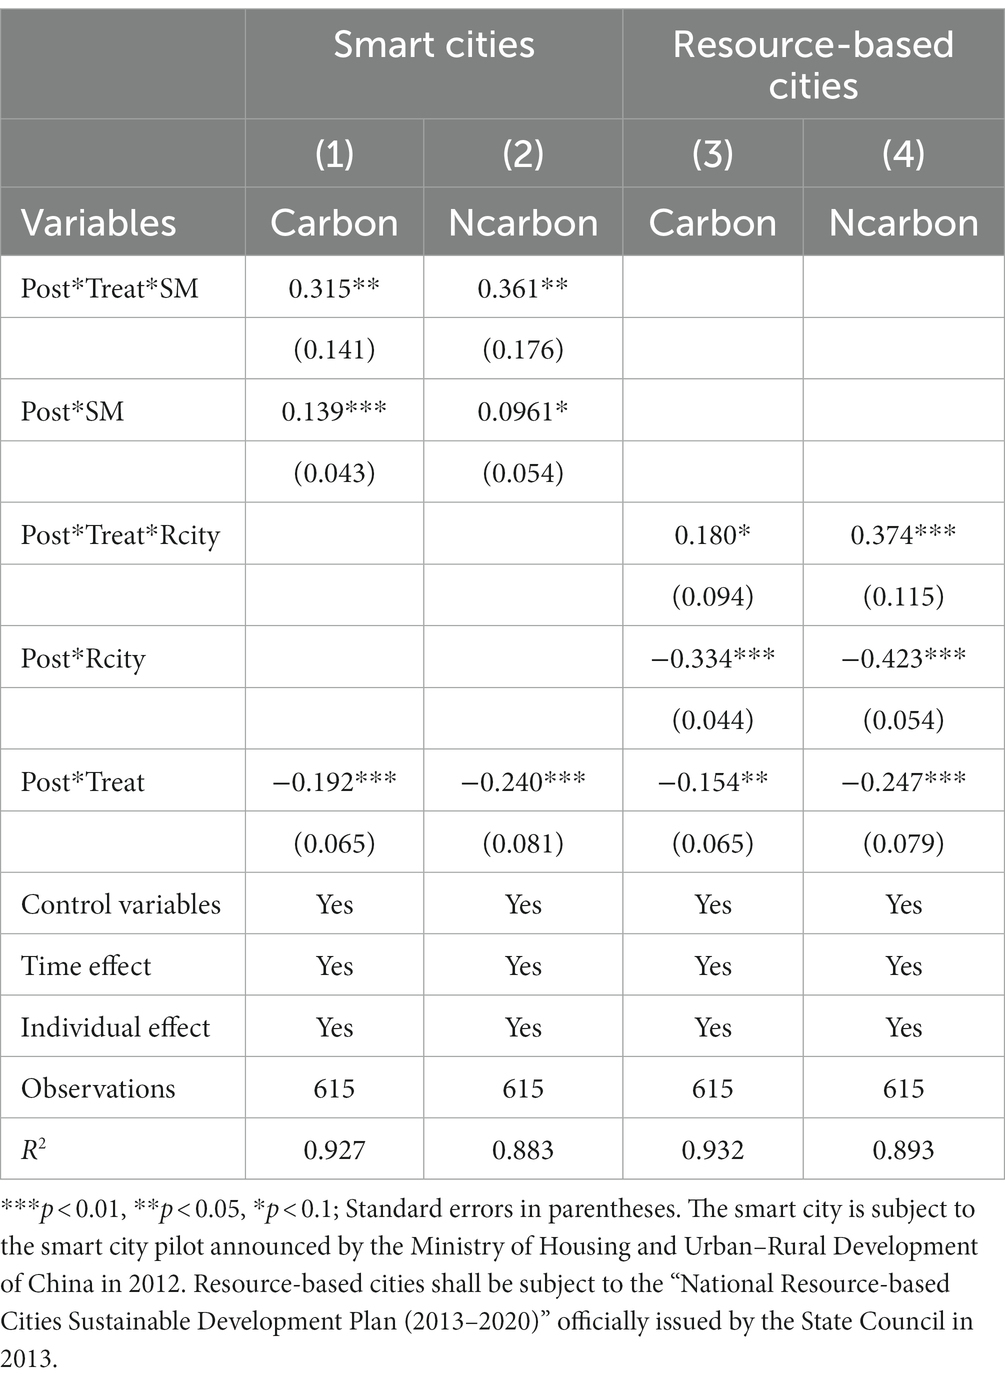
Table 12. DDD estimation results of smart cities and resource-based cities.
Models (3) and (4) in Table 12 show the results of the low-carbon pilot policy effect heterogeneity in resource-based cities. The results show that the implementation effect of low-carbon pilot policies in resource-based cities is better than that in non-resource-based cities. This may be due to resource-based cities’ dependence on resources and the lock-in of industrial structure, which makes these cities more sensitive to low-carbon development policies, and then achieve sustainable development through this policy (Zhang H. et al., 2022).
Models (1) and (2) in Table 13 show the estimation results of the cities with abundant forest resources. The following is whether the forest coverage rate is abundant or not. If the forest coverage rate is greater than or equal to 30%, it is 1, it is 0 if the forest coverage rate is less than 30% (Ding et al., 2006). Using the DDD model, the results are as follows. The Post*Treat coefficients are all negative, but the coefficients of the triple differences show a significant positive effect, indicating the low-carbon pilot program is more effective in places with rich forest resources. Since forest resources are abundant, they can provide an ideal environment for the development of low-carbon societies (Liao et al., 2021).

Table 13. Estimation results of the cities with abundant forest resources.
The robustness of the model estimation results was checked by substituting variables. In the models (3) and (4) of Table 13, the variable Gini coefficient of lighting was replaced by the urbanization rate. It shows forests can offer a good environment for low-carbon development because of their abundance. In this paper, the BUS variable in the model is replaced by the Road variable, which is the square meter area of urban roads per capita each year. The results also remained largely unchanged (see the results in Table 14).
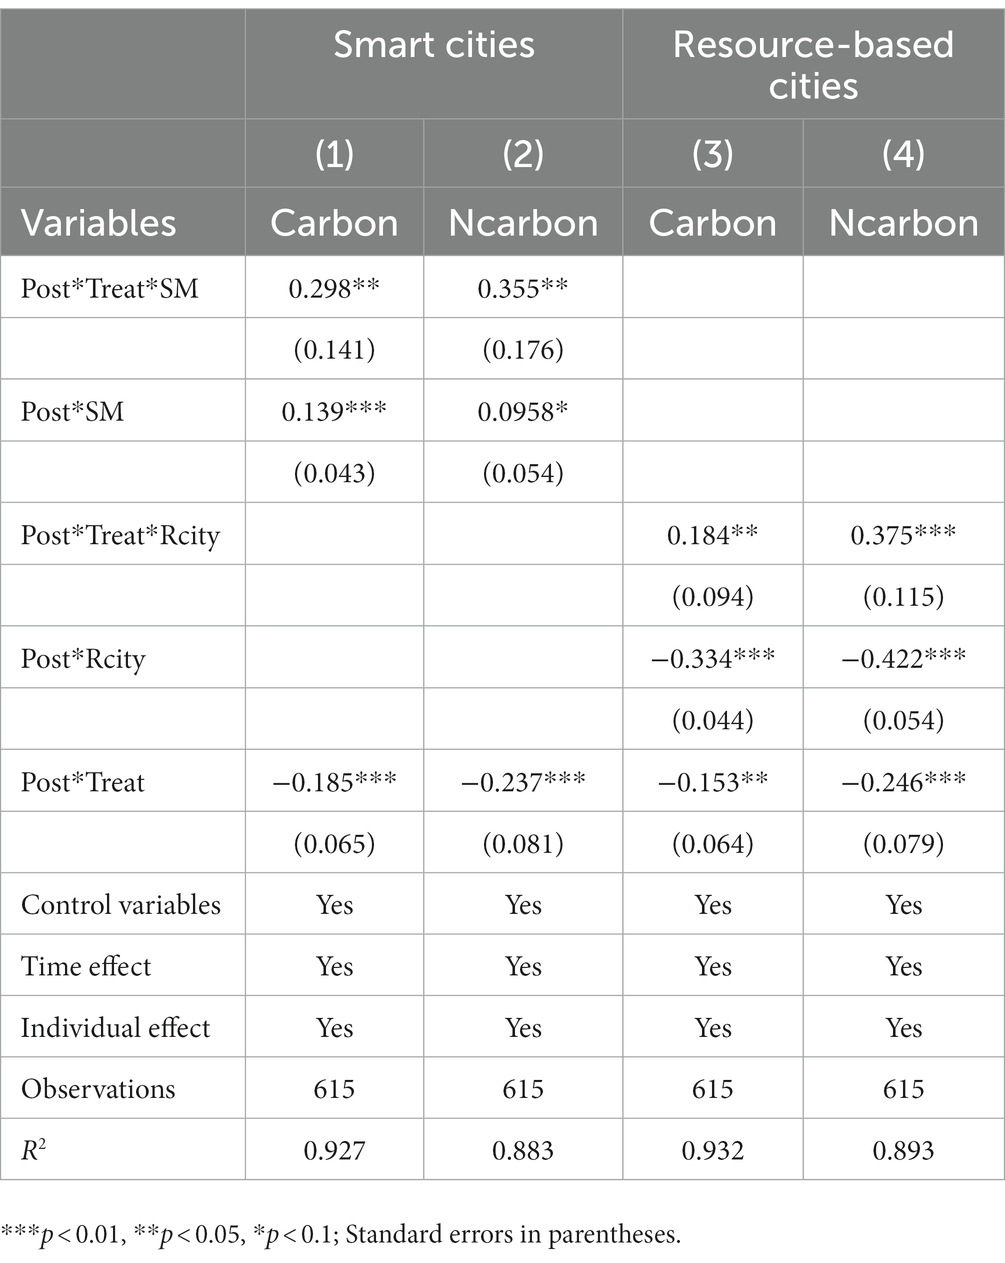
Table 14. Robust test for triple differences.
Based on panel data from 41 cities in the YRD from 2005 to 2019, from the dual perspectives of resources and policies, this paper first analyzes the impact of forest resources on carbon emissions by using a double fixed effect model and a spatial econometric model. Then, with the DID Model, this paper analyzes the policy effects of low-carbon city pilots in the YRD region on carbon emission reduction. Later, the DDD model is employed to assess the heterogeneity of low-carbon city pilots in smart cities, resource-based cities, and forest-rich cities. The empirical results are proven to be robust. Here are the findings of the hypotheses proposed in the paper:
1. Although forest resources inhibit carbon emissions, they also act as carbon sinks and sources, resulting in a nonlinear relationship between forest resources and net carbon emissions. There is a profound effect of forest resources on carbon emissions (Pugh et al., 2019). However, taking into account the impact of forest carbon sequestration, forest resources have a greater impact on net emissions. Forest resources are nonlinearly related to net carbon emissions per GDP, and forest coverage suppresses net emissions at first and then promotes them. The U-shaped trend shows that forest resources will promote carbon emissions when they reach a certain level. This also fully demonstrates the carbon-neutral nature of forests (Köhl et al., 2015), and carbon sequestration has a social cost (Taylor and Marconi, 2020). The early contribution of forests to carbon emissions is worth looking forward to. However, in the long run, we should pay attention to the biodiversity ecosystem services of forests, which is the essence of sustainable green and low-carbon development.
2. Cities that implement low-carbon policies reduce their carbon emissions significantly (Chen et al., 2021). According to empirical results, low-carbon pilot policy’s influence coefficient on carbon dioxide emissions is −0.139 and significant at 5%, indicating a significant reduction in carbon dioxide emissions by the policy. The low-carbon city pilot policy reduces CO2 emissions primarily through green technology innovation, energy efficiency improvements, and modern industrial systems establishments (Huo et al., 2022). Compliance with the severity of environmental regulations will force enterprises to improve productivity and competitiveness (Porter and Linde, 1995). Ultimately, this will result in the advancement of low-carbon environmental protection technologies and technological advancement in enterprises.
3. There is significant urban heterogeneity in the policy effects of low-carbon city pilots, and the effects are better in smart cities, resource-based cities, and forest-rich cities. When compared with cities with higher levels of smart city construction, low-carbon pilot cities are more effective at reducing carbon emissions than cities with low levels of smart city construction, and their effect on net emissions is more obvious (Zhang and Fan, 2023). Smart city construction is the fundamental way out for green transformation. The implementation of a fully intelligent urban energy distribution system will improve the efficiency of urban governance, resulting in a reduction in carbon emissions and an increase in energy efficiency. For resource-based cities, the effect of low-carbon pilot policies in resource-based cities is better than that in non-resource-based cities. Low-carbon pilot policies work better in forest-rich cities and have a greater impact on net carbon emissions (Zeng et al., 2023). It is common for resource-based cities to reduce high-energy and high-pollution energy consumption through technologies, innovation, and industrial transformation, as well as reducing greenhouse gas emissions. Low-carbon pilot policies can improve the policy effect of carbon emission reduction by promoting renewable energy technologies to have a positive impact on clean energy technologies (Qu et al., 2023).
Through the analysis of forest resources and low-carbon pilot policies in YRD, the article tries to prove that from the perspective of resources and policies, man and nature can coexist harmoniously, and enable cities to develop sustainable low-carbon. Moreover, this paper shows that forest resources have dual attributes as carbon sinks and carbon sources, and relying only on forest resources for carbon emission reduction will present certain challenges. Therefore, achieving low-carbon development that co-exists with nature will require a combination of policies to promote the low-carbon transition in the region’s industries, transportation, foreign trade and other sectors. In addition, the findings of this study show that forest resources do have the effect of carbon reduction, but the characteristics of forest resources themselves are carbon neutral so forest resources can absorb and emit carbon. In addition, low-carbon pilot policies are indeed effective, and the policy works better in smart cities, resource-based cities, and cities with rich forest resources. Therefore, this paper proposes the following policy implications to help the low-carbon transformation development of the YRD region.
Forest resources should be fully protected and used effectively, while land use should be rationally planned. Because forest resources can reduce carbon emissions if they are used rationally and efficiently, and their carbon-neutral properties must be taken into consideration. Governments should properly protect forest resources and improve their condition through sustainable resource use to combat air pollution, mitigate climate change, and reduce carbon emissions. Forests can bring a lot of biomass energy, and the use of biomass energy can effectively control fossil energy consumption, to achieve the goal of pollution and emission control. Protecting forests contributes to sustainable ecosystem diversity and stability. At the same time, land use types and spatial structures should be optimized, and classified management should be carried out for low-carbon development and ecological diversity (Liu et al., 2022). However, the carbon sequestration function of forests can be relied on to assist in carbon emission reduction temporarily. In the long run, a forest ecosystem with biodiversity is needed to truly achieve low-carbon sustainable development.
The government should actively promote the low-carbon city pilot policy, and make the industrial layout low-carbon. Low-carbon pilot policies should be developed in coordination with ecological development, energy conservation and emission reduction, and environmental protection. Policymakers should timely introduce and improve industrial, fiscal and taxation, financial support, and technology promotion policies to promote low-carbon development. In order to control carbon emissions, the first step should be to develop a target responsibility system and refine the evaluation mechanism. Second, establish a system for monitoring and managing carbon emissions, compile an inventory of corporate carbon emissions, and develop a platform for carbon trading. The third step is to create a low-carbon industrial system and optimize the industrial structure, such as developing a low-carbon intelligent transportation system and a green tourism industry focusing on forest health. The fourth step is to advocate low-carbon life and consumption patterns and to deepen awareness of low-carbon living.
In terms of urban governance, the two major trends of digitalization and low carbonization must be accurately grasped, to empower the construction of smart cities with digitalization and improve the capacity and level of urban governance. Digital development can help the green and low-carbon transformation of cities and achieve low-carbon development through digital platforms, data elements, and technology. As cities become more low-carbon, digitalization and greenization will inevitably go hand-in-hand. The construction of smart cities can reduce emissions and conserve energy in production, consumption, supply, and all-round life scenarios to a greater extent. Meanwhile, the construction of a city’s smart management platform can optimize the city’s carbon emission activities and force the healthy development of the economy, thereby improving the management efficiency of carbon emissions, reducing unnecessary energy waste, and maximizing resource efficiency. What needs to be done now should be to decrease carbon emissions, rationally plan land use, and improve energy efficiency to truly achieve carbon emission reduction (Ho, 2023). Therefore, specific carbon emission reduction measures must be combined with the actual situation and adapted to local conditions to finally achieve environmentally friendly development.
The original contributions presented in the study are included in the article/supplementary material, further inquiries can be directed to the corresponding author.
QZ: Data curation, Methodology, Writing – original draft, Writing – review & editing. RW: Conceptualization, Formal analysis, Writing – review & editing.
The author(s) declare financial support was received for the research, authorship, and/or publication of this article. This study was supported by the High-level Cultivation Project of Nanjing Xiaozhuang University (Grant No. 2022NXY15), the Major Applied Research Project of Jiangsu Provincial Federation of Philosophy and Social Sciences (Grant No. 2023SJZD129), and the National Social Science Fund of China (Grant No. 21BJY085).
Thanks to the editors and reviewers for their valuable comments.
The authors declare that the research was conducted in the absence of any commercial or financial relationships that could be construed as a potential conflict of interest.
All claims expressed in this article are solely those of the authors and do not necessarily represent those of their affiliated organizations, or those of the publisher, the editors and the reviewers. Any product that may be evaluated in this article, or claim that may be made by its manufacturer, is not guaranteed or endorsed by the publisher.
Baccini, A., Goetz, S. J., Walker, W. S., Laporte, N. T., Sun, M., Sulla-Menashe, D., et al. (2012). Estimated carbon dioxide emissions from tropical deforestation improved by carbon-density maps. Nat. Clim. Chang. 2, 182–185. doi: 10.1038/nclimate1354
Baker, J. S., Wade, C. M., Sohngen, B. L., Ohrel, S., and Fawcett, A. A. (2019). Potential complementarity between forest carbon sequestration incentives and biomass energy expansion. Energy Policy 126, 391–401. doi: 10.1016/j.enpol.2018.10.009
Balogun, A.-L., Marks, D., Sharma, R., Shekhar, H., Balmes, C., Maheng, D., et al. (2020). Assessing the potentials of digitalization as a tool for climate change adaptation and sustainable development in urban centres. Sustain. Cities Soc. 53:101888. doi: 10.1016/j.scs.2019.101888
Baltagi, B. H., and Bresson, G. (2011). Maximum likelihood estimation and Lagrange multiplier tests for panel seemingly unrelated regressions with spatial lag and spatial errors: an application to hedonic housing prices in Paris. J. Urban Econ. 69, 24–42. doi: 10.1016/j.jue.2010.08.007
Beedlow, P. A., Tingey, D. T., Phillips, D. L., Hogsett, W. E., and Olszyk, D. M. (2004). Rising atmospheric CO2 and carbon sequestration in forests. Front. Ecol. Environ. 2, 315–322. doi: 10.1890/1540-9295(2004)002[0315,RACACS]2.0.CO;2
Birdsey, R., Pregitzer, K., and Lucier, A. (2006). Forest carbon management in the United States. J. Environ. Qual. 35, 1461–1469. doi: 10.2134/jeq2005.0162
Bogdanov, D., Ram, M., Aghahosseini, A., Gulagi, A., Oyewo, A. S., Child, M., et al. (2021). Low-cost renewable electricity as the key driver of the global energy transition towards sustainability. Energy 227:120467. doi: 10.1016/j.energy.2021.120467
Brienen, R. J. W., Caldwell, L., Duchesne, L., Voelker, S., Barichivich, J., Baliva, M., et al. (2020). ‘Forest carbon sink neutralized by pervasive growth-lifespan trade-offs. Nat. Commun. 11:4241. doi: 10.1038/s41467-020-17966-z
Bunker, D. E., DeClerck, F., Bradford, J. C., Colwell, R. K., Perfecto, I., Phillips, O. L., et al. (2005). Species loss and aboveground carbon storage in a tropical forest. Science 310, 1029–1031. doi: 10.1126/science.1117682
Busch, J., Engelmann, J., Cook-Patton, S. C., Griscom, B. W., Kroeger, T., Possingham, H., et al. (2019). ‘Potential for low-cost carbon dioxide removal through tropical reforestation. Nat. Clim. Change 9, 463–466. doi: 10.1038/s41558-019-0485-x
Cai, Y., and Lontzek, T. S. (2019). The social cost of carbon with economic and climate risks. J. Polit. Econ. 127, 127, 2684–2734. doi: 10.1086/701890
Cavada, M., Hunt, D. V. L., and Rogers, C. D. F. (2016). Do smart cities realise their potential for lower carbon dioxide emissions? Proc. Inst. Civil Eng. Eng. Sustain. 169, 243–252. doi: 10.1680/jensu.15.00032
Chen, H., Guo, W., Feng, X., Wei, W., Liu, H., Feng, Y., et al. (2021). The impact of low-carbon city pilot policy on the total factor productivity of listed enterprises in China. Resour. Conserv. Recycl. 169:105457. doi: 10.1016/j.resconrec.2021.105457
Cheng, Z., Wang, L., and Zhang, Y. (2022). Does smart city policy promote urban green and low-carbon development? J. Clean. Prod. 379:134780. doi: 10.1016/j.jclepro.2022.134780
Chu, X., Zhan, J., Li, Z., Zhang, F., and Qi, W. (2019). Assessment on forest carbon sequestration in the three-north shelterbelt program region, China. J. Clean. Prod. 215, 382–389. doi: 10.1016/j.jclepro.2018.12.296
De Frenne, P., Lenoir, J., Luoto, M., Scheffers, B. R., Zellweger, F., Aalto, J., et al. (2021). Forest microclimates and climate change: importance, drivers and future research agenda. Glob. Chang. Biol. 27, 2279–2297. doi: 10.1111/gcb.15569
Ding, W., Chen, F., and Nan, Z. (2006). A quantitative research on the forestry endowment and poverty in Gansu Province. J. Arid Land Resour. Environ. 20, 152–155.
Drake, B., Hanson, D. T., Lowrey, T. K., and Sharp, Z. D. (2016). The carbon fertilization effect over a century of anthropogenic CO2 emissions: higher intracellular CO2 and more drought resistance among invasive and native grass species contrasts with increased water use efficiency for woody plants in the US southwest. Glob. Chang. Biol. 23, 782–792. doi: 10.1111/gcb.13449
Du, M., Feng, R., and Chen, Z. (2022). Blue sky defense in low-carbon pilot cities: a spatial spillover perspective of carbon emission efficiency. Sci. Total Environ. 846:157509. doi: 10.1016/j.scitotenv.2022.157509
Eggers, J., Lindner, M., Zudin, S., Zaehle, S., and Liski, J. (2008). Impact of changing wood demand, climate and land use on European forest resources and carbon stocks during the 21st century. Glob. Chang. Biol. 14, 2288–2303. doi: 10.1111/j.1365-2486.2008.01653.x
Fan, S., Peng, S., and Liu, X. (2021). Can smart city policy facilitate the low-carbon economy in China? A quasi-natural experiment based on pilot city. Complexity 2021:9963404. doi: 10.1155/2021/9963404
Feng, T., Lin, Z., du, H., Qiu, Y., and Zuo, J. (2021). Does low-carbon pilot city program reduce carbon intensity? Evidence from Chinese cities. Res. Int. Bus. Financ. 58:101450. doi: 10.1016/j.ribaf.2021.101450
Friel, S., Dangour, A. D., Garnett, T., Lock, K., Chalabi, Z., Roberts, I., et al. (2009). Public health benefits of strategies to reduce greenhouse-gas emissions: food and agriculture. Lancet 374, 2016–2025. doi: 10.1016/S0140-6736(09)61753-0
Fu, Y., He, C., and Luo, L. (2021). Does the low-carbon city policy make a difference? Empirical evidence of the pilot scheme in China with DEA and PSM-DID. Ecol. Indic. 122:107238. doi: 10.1016/j.ecolind.2020.107238
Gao, Y. (2016). China’s response to climate change issues after Paris climate change conference. Adv. Clim. Chang. Res. 7, 235–240. doi: 10.1016/j.accre.2016.10.001
Getis, A. (2007). Reflections on spatial autocorrelation. Reg. Sci. Urban Econ. 37, 491–496. doi: 10.1016/j.regsciurbeco.2007.04.005
Getis, A. (2008). A history of the concept of spatial autocorrelation: a geographer’s perspective. Geogr. Anal. 40, 297–309. doi: 10.1111/j.1538-4632.2008.00727.x
Giest, S. (2017). Big data analytics for mitigating carbon emissions in smart cities: opportunities and challenges. Eur. Plan. Stud. 25, 941–957. doi: 10.1080/09654313.2017.1294149
Guo, Q., Wang, Y., and Dong, X. (2022). Effects of smart city construction on energy saving and CO2 emission reduction: evidence from China. Appl. Energy 313:118879. doi: 10.1016/j.apenergy.2022.118879
Heinonen, T., Pukkala, T., Mehtätalo, L., Asikainen, A., Kangas, J., and Peltola, H. (2017). Scenario analyses for the effects of harvesting intensity on development of forest resources, timber supply, carbon balance and biodiversity of Finnish forestry. Forest Policy Econ. 80, 80–98. doi: 10.1016/j.forpol.2017.03.011
Ho, D. T. (2023). Carbon dioxide removal is not a current climate solution — we need to change the narrative. Nature 616:9. doi: 10.1038/d41586-023-00953-x
Hou, Y., Zhang, K., Zhu, Y., and Liu, W. (2021). Spatial and temporal differentiation and influencing factors of environmental governance performance in the Yangtze River Delta, China. Sci. Total Environ. 801:149699. doi: 10.1016/j.scitotenv.2021.149699
Huang, X., Chen, S., Xiong, D., Xu, C., and Yang, Z. (2022). Analysis and prediction of influence factors of green computing on carbon cycle process in smart city. Comput. Intell. Neurosci. 2022:7546742. doi: 10.1155/2022/7546742
Huo, W., Qi, J., Yang, T., Liu, J., Liu, M., and Zhou, Z. (2022). Effects of China’s pilot low-carbon city policy on carbon emission reduction: a quasi-natural experiment based on satellite data. Technol. Forecast. Soc. Chang. 175:121422. doi: 10.1016/j.techfore.2021.121422
Hurst, W., Tekinerdogan, B., and Kotze, B. (2020). ‘Perceptions on smart gas meters in smart cities for reducing the carbon footprint. Smart Cities 3, 1173–1186. doi: 10.3390/smartcities3040058
Jiang, H., Apps, M. J., Peng, C., Zhang, Y., and Liu, J. (2002). Modelling the influence of harvesting on Chinese boreal forest carbon dynamics. For. Ecol. Manag. 169, 65–82. doi: 10.1016/S0378-1127(02)00299-2
Jin, L., Yi, Y., and Xu, J. (2020). Forest carbon sequestration and China’s potential: the rise of a nature-based solution for climate change mitigation. China Econ. J. 13, 200–222. doi: 10.1080/17538963.2020.1754606
Keenan, T. F., Gray, J., Friedl, M. A., Toomey, M., Bohrer, G., Hollinger, D. Y., et al. (2014). Net carbon uptake has increased through warming-induced changes in temperate forest phenology. Nat. Clim. Chang. 4, 598–604. doi: 10.1038/nclimate2253
Khanna, N., Fridley, D., and Hong, L. (2014). China’s pilot low-carbon city initiative: a comparative assessment of national goals and local plans. Sustain. Cities Soc. 12, 110–121. doi: 10.1016/j.scs.2014.03.005
Köhl, M., Lasco, R., Cifuentes, M., Jonsson, Ö., Korhonen, K. T., Mundhenk, P., et al. (2015). Changes in forest production, biomass and carbon: results from the 2015 UN FAO global forest resource assessment. For. Ecol. Manag. 352, 21–34. doi: 10.1016/j.foreco.2015.05.036
Krishnan, B., Arumugam, S., and Maddulety, K. (2020). Critical success factors for the digitalization of smart cities. Int. J. Technol. Manag. Sustain. Dev. 19, 69–86. doi: 10.1386/tmsd_00016_1
Le Noë, J., Erb, K. H., Matej, S., Magerl, A., Bhan, M., and Gingrich, S. (2021). ‘Altered growth conditions more than reforestation counteracted forest biomass carbon emissions 1990–2020. Nat. Commun. 12:6075. doi: 10.1038/s41467-021-26398-2
Li, Y., Alharthi, M., Ahmad, I., Hanif, I., and Ul Hassan, M. (2022). Nexus between renewable energy, natural resources and carbon emissions under the shadow of transboundary trade relationship from South East Asian economies. Energ. Strat. Rev. 41:100855. doi: 10.1016/j.esr.2022.100855
Li, W., Chen, Z., Li, M., Zhang, H., Li, M., Qiu, X., et al. (2023). Carbon emission and economic development trade-offs for optimizing land-use allocation in the Yangtze River Delta, China. Ecol. Indic. 147:109950. doi: 10.1016/j.ecolind.2023.109950
Liao, L., Zhao, C., Li, X., and Qin, J. (2021). Towards low carbon development: the role of forest city constructions in China. Ecol. Indic. 131:108199. doi: 10.1016/j.ecolind.2021.108199
Lin, B., and Ge, J. (2019a). Carbon sinks and output of China’s forestry sector: an ecological economic development perspective. Sci. Total Environ. 655, 1169–1180. doi: 10.1016/j.scitotenv.2018.11.219
Lin, B., and Ge, J. (2019b). Valued forest carbon sinks: how much emissions abatement costs could be reduced in China. J. Clean. Prod. 224, 455–464. doi: 10.1016/j.jclepro.2019.03.221
Liu, F., Hu, M., Huang, W., Chen, C. X., and Li, J. (2023). Future carbon sequestration and timber yields from Chinese commercial forests under shared socioeconomic pathways. Forests 14:153. doi: 10.3390/f14010153
Liu, K., Meng, C., Tan, J., and Zhang, G. (2023). Do smart cities promote a green economy? Evidence from a quasi-experiment of 253 cities in China. Environ. Impact Assess. Rev. 99:107009. doi: 10.1016/j.eiar.2022.107009
Liu, J., Peng, K., Zuo, C., and Li, Q. (2022). Spatiotemporal variation of land-use carbon emissions and its implications for low carbon and ecological civilization strategies: evidence from Xiamen-Zhangzhou-Quanzhou metropolitan circle, China. Sustain. Cities Soc. 86:104083. doi: 10.1016/j.scs.2022.104083
Liu, W., and Qin, B. (2016). Low-carbon city initiatives in China: a review from the policy paradigm perspective. Cities 51, 131–138. doi: 10.1016/j.cities.2015.11.010
Liu, T., Wang, Y., Song, Q., and Qi, Y. (2018). Low-carbon governance in China – case study of low carbon industry park pilot. J. Clean. Prod. 174, 837–846. doi: 10.1016/j.jclepro.2017.10.339
Liu, C., Zhou, Z., Liu, Q., Xie, R., and Zeng, X. (2020). Can a low-carbon development path achieve win-win development: evidence from China’s low-carbon pilot policy. Mitig. Adapt. Strateg. Glob. Chang. 25, 1199–1219. doi: 10.1007/s11027-019-09897-y
Luyssaert, S., Schulze, E. D., Börner, A., Knohl, A., Hessenmöller, D., Law, B. E., et al. (2008). Old-growth forests as global carbon sinks. Nature 455, 213–215. doi: 10.1038/nature07276
Lv, C., and Cui, Y. (2020). Research on the regional inequality and temporal-spatial convergence of high-quality development in China. J. Quant. Tech. Econ. 9, 62–79. doi: 10.13653/j.cnki.jqte.2020.09.004
Malhi, Y., Meir, P., and Brown, S. (2002). Forests, carbon and global climate. Philos. Trans. R. Soc. London, Ser. A 360, 1567–1591. doi: 10.1098/rsta.2002.1020
Mitchard, E. T. A. (2018). The tropical forest carbon cycle and climate change. Nature 559, 527–534. doi: 10.1038/s41586-018-0300-2
Murray, B. C., McCarl, B. A., and Lee, H.-C. (2004). Estimating Leakage from Forest carbon sequestration programs. Land Econ. 80, 109–124. doi: 10.2307/3147147
Naylor, A. W., and Ford, J. (2023). Vulnerability and loss and damage following the COP27 of the UN framework convention on climate change. Reg. Environ. Chang. 23:38. doi: 10.1007/s10113-023-02033-2
Nunes, L. J. R., Meireles, C. I. R., Pinto Gomes, C. J., and Almeida Ribeiro, N. M. C. (2020). Forest contribution to climate change mitigation: management oriented to carbon capture and storage. Climate 8:21. doi: 10.3390/cli8020021
Ojha, H., Maraseni, T., Nightingale, A., Bhattarai, B., and Khatri, D. (2019). Rescuing forests from the carbon trap. Forest Policy Econ. 101, 15–18. doi: 10.1016/j.forpol.2019.01.007
Phelps, J., Webb, E., and Adams, W. (2012). Biodiversity co-benefits of policies to reduce forest-carbon emissions. Nat. Clim. Change 2, 497–503. doi: 10.1038/nclimate1462
Porter, M. E., and Linde, C. V. D. (1995). Toward a new conception of the environment-competitiveness relationship. J. Econ. Perspect. 9, 97–118. doi: 10.1257/jep.9.4.97
Poudyal, N. C., Siry, J. P., and Bowker, J. M. (2010). Urban forests’ potential to supply marketable carbon emission offsets: a survey of municipal governments in the United States. Forest Policy Econ. 12, 432–438. doi: 10.1016/j.forpol.2010.05.002
Pugh, T. A. M., Arneth, A., Kautz, M., Poulter, B., and Smith, B. (2019). Important role of forest disturbances in the global biomass turnover and carbon sinks. Nat. Geosci. 12, 730–735. doi: 10.1038/s41561-019-0427-2
Qin, Y., Xiao, X., Wigneron, J. P., Ciais, P., Brandt, M., Fan, L., et al. (2021). Carbon loss from forest degradation exceeds that from deforestation in the Brazilian Amazon. Nat. Clim. Chang. 11, 442–448. doi: 10.1038/s41558-021-01026-5
Qiu, Z., Feng, Z., Song, Y., Li, M., and Zhang, P. (2020). Carbon sequestration potential of forest vegetation in China from 2003 to 2050: predicting forest vegetation growth based on climate and the environment. J. Clean. Prod. 252:119715. doi: 10.1016/j.jclepro.2019.119715
Qiu, S., Wang, Z., and Liu, S. (2021). The policy outcomes of low-carbon city construction on urban green development: evidence from a quasi-natural experiment conducted in China. Sustain. Cities Soc. 66:102699. doi: 10.1016/j.scs.2020.102699
Qu, F., Xu, L., and He, C. (2023). Leverage effect or crowding out effect? Evidence from low-carbon city pilot and energy technology innovation in China. Sustain. Cities Soc. 91:104423. doi: 10.1016/j.scs.2023.104423
Rahman, M. M., Zimmer, M., Ahmed, I., Donato, D., Kanzaki, M., and Xu, M. (2021). Co-benefits of protecting mangroves for biodiversity conservation and carbon storage. Nat. Commun. 12:3875. doi: 10.1038/s41467-021-24207-4
Raihan, A., Begum, R. A., Mohd Said, M. N., and Abdullah, S. M. S. (2019). A review of emission reduction potential and cost savings through Forest carbon sequestration. Asian J. Water Environ. Pollut. 16, 1–7. doi: 10.3233/AJW190027
Richards, K., and Stokes, C. (2004). A review of forest carbon sequestration cost studies: a dozen years of research. Clim. Chang. 63, 1–48. doi: 10.1023/B:CLIM.0000018503.10080.89
Santos, G. (2022). Climate change policy and carbon pricing. Energy Policy 168:112985. doi: 10.1016/j.enpol.2022.112985
She, Q., and Wu, L. (2022). The carbon emission reduction effect of digital economy development. Econ. Survey 39, 14–24. doi: 10.15931/j.cnki.1006-1096.2022.05.008
Shen, L., Wu, Y., Lou, Y., Zeng, D., Shuai, C., and Song, X. (2018). What drives the carbon emission in the Chinese cities?—a case of pilot low carbon city of Beijing. J. Clean. Prod. 174, 343–354. doi: 10.1016/j.jclepro.2017.10.333
Sohngen, B., and Mendelsohn, R. (2003). An optimal control model of Forest carbon sequestration. Am. J. Agric. Econ. 85, 448–457. doi: 10.1111/1467-8276.00133
Song, Q., Liu, T., and Qi, Y. (2021). Policy innovation in low carbon pilot cities: lessons learned from China. Urban Clim. 39:100936. doi: 10.1016/j.uclim.2021.100936
Sun, W., and Liu, X. (2019). Review on carbon storage estimation of forest ecosystem and applications in China. For. Ecosyst. 7:4. doi: 10.1186/s40663-019-0210-2
Suntana, A. S., Vogt, K. A., Turnblom, E. C., and Upadhye, R. (2009). Bio-methanol potential in Indonesia: forest biomass as a source of bio-energy that reduces carbon emissions. Appl. Energy 86, S215–S221. doi: 10.1016/j.apenergy.2009.05.028
Tang, K., Zhou, Y., Liang, X., and Zhou, D. (2021). The effectiveness and heterogeneity of carbon emissions trading scheme in China. Environ. Sci. Pollut. Res. 28, 17306–17318. doi: 10.1007/s11356-020-12182-0
Taylor, S. D., and Marconi, S. (2020). Rethinking global carbon storage potential of trees. A comment on Bastin et al. (2019). Ann. For. Sci. 77, 1–7. doi: 10.1007/s13595-020-0922-z
Terhaar, J., Frölicher, T. L., Aschwanden, M. T., Friedlingstein, P., and Joos, F. (2022). Adaptive emission reduction approach to reach any global warming target. Nat. Clim. Change 12, 1136–1142. doi: 10.1038/s41558-022-01537-9
Ter-Mikaelian, M. T., Colombo, S. J., and Chen, J. (2015). The burning question: does forest bioenergy reduce carbon emissions? A review of common misconceptions about forest carbon accounting. J. For. 113, 57–68. doi: 10.5849/jof.14-016
Wang, H., Li, Y., Lin, W., and Wei, W. (2023). How does digital technology promote carbon emission reduction? Empirical evidence based on e-commerce pilot city policy in China. J. Environ. Manag. 325:116524. doi: 10.1016/j.jenvman.2022.116524
Wei, Y.-M., Li, X. Y., Liu, L. C., Kang, J. N., and Yu, B. Y. (2022). A cost-effective and reliable pipelines layout of carbon capture and storage for achieving China’s carbon neutrality target. J. Clean. Prod. 379:134651. doi: 10.1016/j.jclepro.2022.134651
Welsby, D., Price, J., Pye, S., and Ekins, P. (2021). Unextractable fossil fuels in a 1.5°C world. Nature 597, 230–234. doi: 10.1038/s41586-021-03821-8
Wu, S. (2022). Smart cities and urban household carbon emissions: a perspective on smart city development policy in China. J. Clean. Prod. 373:133877. doi: 10.1016/j.jclepro.2022.133877
Xia, L., Zhang, G., Liu, L., Zhan, M., Feng, M., Kong, P., et al. (2022). Observation of atmospheric CO2 and CO in a low-carbon pilot city: insight into CO2 sources and regional transport. Atmos. Pollut. Res. 13:101585. doi: 10.1016/j.apr.2022.101585
Xie, H., Chen, X., Lin, K., and Hu, A. (2008). The ecological footprint analysis of fossil energy and electricity. Acta Ecol. Sin. 28, 1729–1735.
Xu, G., Dong, H., Xu, Z., and Bhattarai, N. (2022). China can reach carbon neutrality before 2050 by improving economic development quality. Energy 243:123087. doi: 10.1016/j.energy.2021.123087
Xuan, D., Ma, X., and Shang, Y. (2020). Can China’s policy of carbon emission trading promote carbon emission reduction? J. Clean. Prod. 270:122383. doi: 10.1016/j.jclepro.2020.122383
Yi, B., Han, J., Zhou, X., Yang, F., Meng, X., Cao, W. X., et al. (2015). Spatiotemporal pattern of carbon sources and sinks in Yangtze River Delta region. Chin. J. Appl. Ecol. 26, 973–980. doi: 10.13287/j.1001-9332.2015.0011
Yu, Y., and Zhang, N. (2021). Low-carbon city pilot and carbon emission efficiency: quasi-experimental evidence from China. Energy Econ. 96:105125. doi: 10.1016/j.eneco.2021.105125
Zeng, S., Jin, G., Tan, K., and Liu, X. (2023). Can low-carbon city construction reduce carbon intensity? Empirical evidence from low-carbon city pilot policy in China. J. Environ. Manag. 332:117363. doi: 10.1016/j.jenvman.2023.117363
Zhang, Y., Cao, W., and Zhang, K. (2020). Mapping urban networks through inter-firm linkages: the case of listed companies in Yangtze River Delta, China. J. Geosci. Environ. Prot. 8, 23–36. doi: 10.4236/gep.2020.83003
Zhang, Y., Chen, J., Han, Y., Qian, M., Guo, X., Chen, R., et al. (2021). The contribution of fintech to sustainable development in the digital age: ant forest and land restoration in China. Land Use Policy 103:105306. doi: 10.1016/j.landusepol.2021.105306
Zhang, X., and Fan, D. (2023). Collaborative emission reduction research on dual-pilot policies of the low-carbon city and smart city from the perspective of multiple innovations. Urban Clim. 47:101364. doi: 10.1016/j.uclim.2022.101364
Zhang, H., Feng, C., and Zhou, X. (2022). Going carbon-neutral in China: does the low-carbon city pilot policy improve carbon emission efficiency? Sustain. Prod. Consum. 33, 312–329. doi: 10.1016/j.spc.2022.07.002
Zhang, Q., Tang, D., and Boamah, V. (2022). Exploring the role of forest resources abundance on economic development in the Yangtze River Delta region: application of spatial Durbin SDM model. Forests 13:1605. doi: 10.3390/f13101605
Zhang, Q., Wang, R., Tang, D., and Boamah, V. (2023). The role and transmission mechanism of forest resource abundance on low-carbon economic development in the Yangtze River Delta region: insights from the COP26 targets. Resour. Policy 85:103944. doi: 10.1016/j.resourpol.2023.103944
Zhang, W.-W., Zhao, B., Jiang, Y. Q., Nie, Y. Y., Sharp, B., Gu, Y., et al. (2022). Co-benefits of regionally-differentiated carbon pricing policies across China. Clim. Pol. 2022, 1–14. doi: 10.1080/14693062.2022.2119198
Zhao, C., Wang, K., Dong, X., and Dong, K. (2022). Is smart transportation associated with reduced carbon emissions? The case of China. Energy Econ. 105:105715. doi: 10.1016/j.eneco.2021.105715
Keywords: Yangtze River Delta region, forest resource endowment, low-carbon pilot policy, reduction of carbon emissions, digital age
Citation: Zhang Q and Wang R (2023) Carbon emission reduction effects in Yangtze River Delta from the dual perspectives of forest resource endowment and low-carbon pilot policy in the digital age. Front. For. Glob. Change. 6:1259500. doi: 10.3389/ffgc.2023.1259500
Edited by:
Armin Hansel, University of Innsbruck, AustriaReviewed by:
Benh Peng, Nanjing University of Information Science and Technology, ChinaCopyright © 2023 Zhang and Wang. This is an open-access article distributed under the terms of the Creative Commons Attribution License (CC BY). The use, distribution or reproduction in other forums is permitted, provided the original author(s) and the copyright owner(s) are credited and that the original publication in this journal is cited, in accordance with accepted academic practice. No use, distribution or reproduction is permitted which does not comply with these terms.
*Correspondence: Qian Zhang, emhhbmdxaWFuQG5qeHpjLmVkdS5jbg==
Disclaimer: All claims expressed in this article are solely those of the authors and do not necessarily represent those of their affiliated organizations, or those of the publisher, the editors and the reviewers. Any product that may be evaluated in this article or claim that may be made by its manufacturer is not guaranteed or endorsed by the publisher.
Research integrity at Frontiers
Learn more about the work of our research integrity team to safeguard the quality of each article we publish.