 Janez Kermavnar
 Lado Kutnar
 Aleksander Marinšek
95% of researchers rate our articles as excellent or good
Learn more about the work of our research integrity team to safeguard the quality of each article we publish.
Find out more
ORIGINAL RESEARCH article
Front. For. Glob. Change , 23 November 2023
Sec. Forests and the Atmosphere
Volume 6 - 2023 | https://doi.org/10.3389/ffgc.2023.1236842
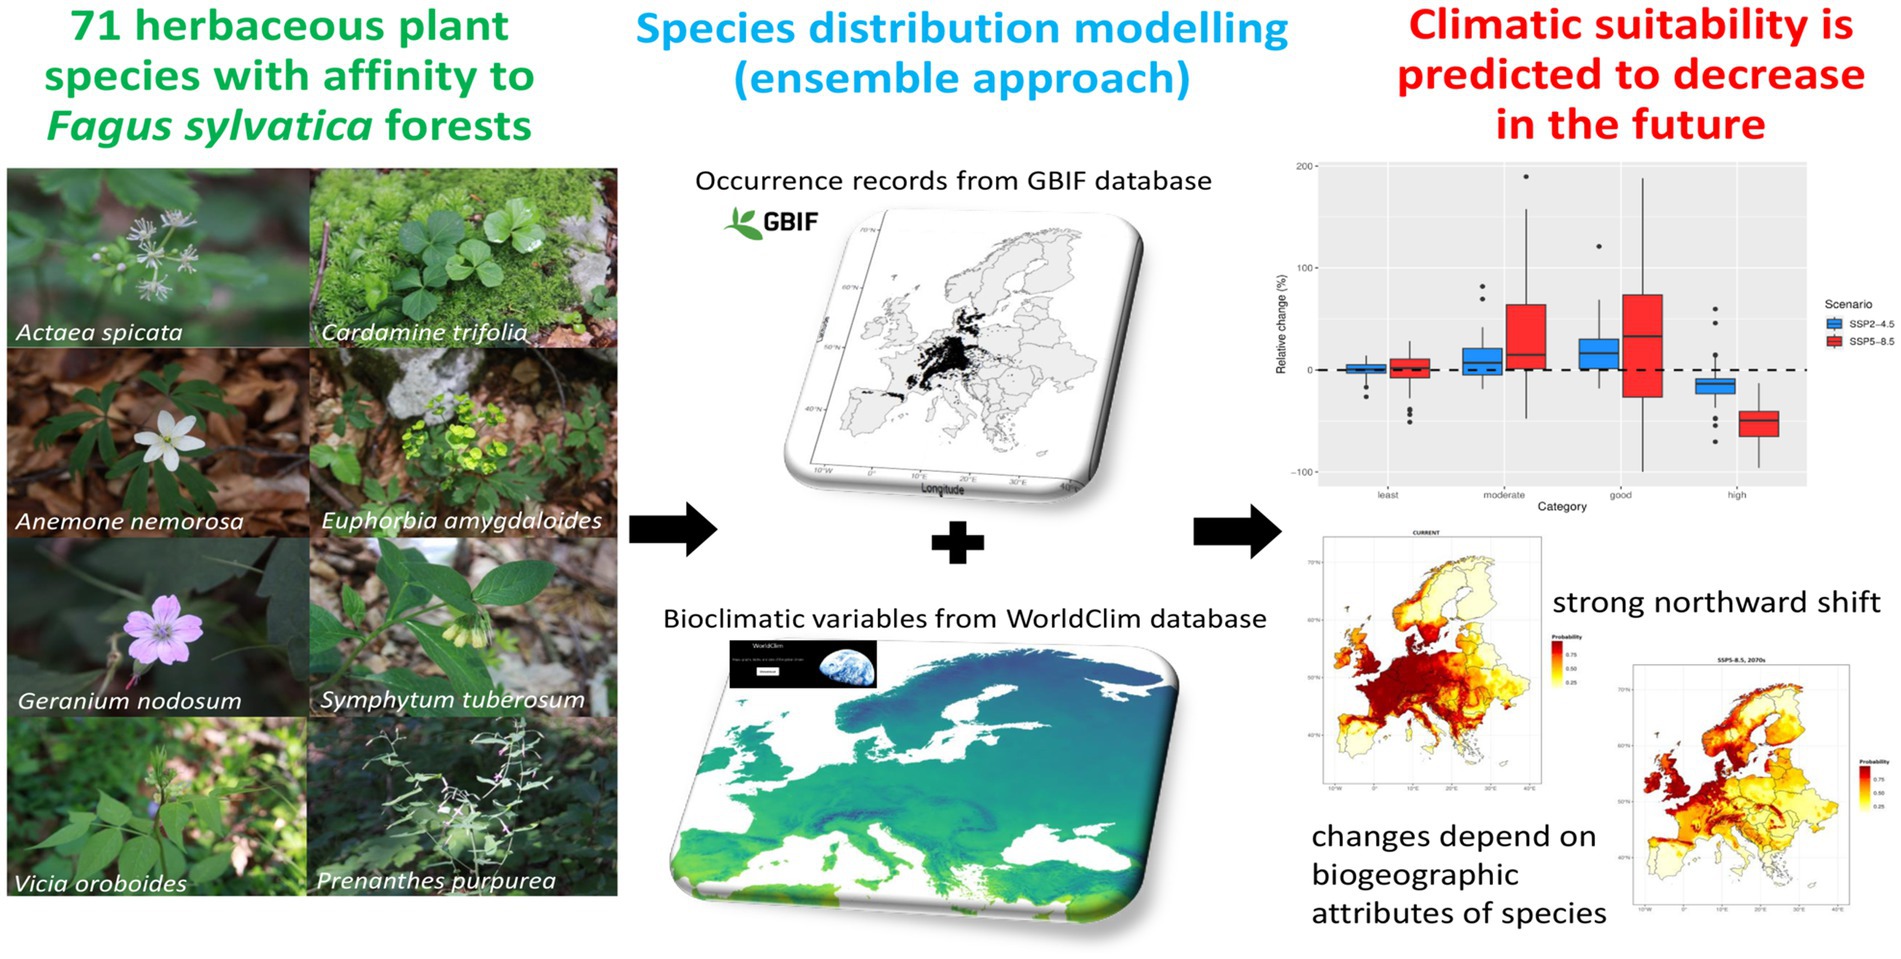
Introduction: Herbaceous plant species constitute an essential element of the flora of European beech (Fagus sylvatica) forests. There is increasing evidence that rapidly changing climate is likely to modify the spatial distribution of plant species. However, we lack understanding of the impact that climate change might have on beech forest herbs across the European continent. We investigated the possible effects of predicted increasing rates of global warming and altered precipitation regimes on 71 forest herbs closely associated with beech forests, but with varying biogeographic and climatic niche attributes.
Methods: By using a total of 394,502 occurrence records and an ensemble of species distribution models (SDMs), we quantified the potential current distribution and future (2061-2080) range shifts in climatic suitability (expressed as occurrence probability, OP) according to two climate change scenarios (moderate SSP2-4.5 and severe SSP5-8.5).
Results: Overall, precipitation of the warmest quarter and temperature seasonality were the most influential predictors in shaping current distribution patterns. For SSP5-8.5 scenario, all studied species experienced significant reductions (52.9% on average) in the total size of highly suitable areas (OP >0.75). However, the magnitude and directions of changes in the climatic suitability were highly species-specific; few species might even increase OP in the future, particularly in case of SSP2-4.5 scenario. The SDMs revealed the most substantial decline of climatic suitability at the trailing edges in southern Europe. We found that climatic suitability is predicted to show unidirectional northward shift and to move toward higher elevations. The gain/loss ratio was generally higher for narrow-ranged species compared to widespread taxa.
Discussion: Our findings are contextualized with regards to potential confounding factors (dispersal limitation, microclimatic buffering) that may mitigate or accelerate climate change impacts. Given the low long-distance migration ability, many beech forest herbs are unlikely to track the velocity with which macroclimatic isotherms are moving toward higher latitudes, making this species group particularly vulnerable to climate change.
Graphical Abstract
The Earth’s climate is changing on an exponential scale due to human impact (Bednar-Friedl et al., 2022; IPCC, 2022). Climate change has been recognized as one of the top-ranking global threats to the biodiversity of natural habitats (Sala et al., 2000), with a profound influence on species’ range expansion and contraction. Rapidly rising temperatures, alterations of precipitation regimes and increasing frequency of extreme weather events are causing significant changes in the abiotic environment for plant species. Because macroclimate act as a major determinant controlling plant distributions on a large geographical scale, ecological consequences of global climate change include range size shifts toward higher latitudes and elevations (Lenoir and Svenning, 2015) and a progressive spread of warm-tolerant plants or retreat of species inhabiting colder climates (Kuhn and Gégout, 2019). Future projections of plant diversity suggest its significant decline due to climate change (Thuiller et al., 2005).
European beech (Fagus sylvatica L.) forests are forming the potential natural vegetation of large parts of central and western Europe as well as of humid sites in south-European mountain systems (Marinšek et al., 2013; Willner et al., 2017). Beech-dominated forests are among the most widespread forest types in temperate Europe, giving a prevailing appearance to current vegetation on calcareous and silicious bedrocks from the submontane to the upper montane belt (Bohn et al., 2004; Willner et al., 2023). The distribution in the north is mainly limited by low temperature, while in the south, a deficit of precipitation limits beech distribution (Houston Durrant et al., 2016; Leuschner, 2020). Beech forest habitats harbor a characteristic set of herbaceous plant species in the herb layer (Willner et al., 2023). Understory herbs comprise the largest part of temperate beech forest plant diversity; up to 90% of forest plant diversity is concentrated in the herb layer (Gilliam, 2007; Campetella et al., 2020; Kermavnar et al., 2022; Azaryan et al., 2023). Owing to the mesophilous nature of beech forests avoiding too dry and too wet sites (Leuschner and Ellenberg, 2017) and relatively high requirements of the understory herbs for soil moisture and air humidity (Leuschner and Lendzion, 2009), this forest type might be negatively impacted by changing macroclimate. In the study coming from Romanian Carpathians (García-Duro et al., 2021), forests dominated by Fagus sylvatica were most vulnerable to climate change, with drought periods associated with large mortality events. Moreover, beech regeneration showed a reduction of its distribution in the dry-warm range (Axer et al., 2021). Increasing dieback of beech and other co-occurring tree species induced by heatwaves and drought stress (Margalef-Marrase et al., 2020; Lloret et al., 2022) is assumed to have strong effect on plant species assemblages because these communities show high degree of association with Fagus sylvatica and forest stand properties in beech-dominated ecosystems.
The composition and diversity of herb-layer vegetation in beech forests is largely determined by various factors, among which climatic (temperature, precipitation) and soil parameters play a crucial role at broader spatial scales (Leuschner and Ellenberg, 2017). Apart from abiotic factors, the importance of historical processes shaping the current distribution of forest herbs and species pools in Europe (Jiménez-Alfaro et al., 2018) and temperate deciduous forests in eastern North America (Erlandson et al., 2021) has been repeatedly emphasized. These studies suggested that post-glacial range formations contributing to present day geographic distributions of many forest plant species are mainly a result of limited dispersal (Willner et al., 2009; Bellemare and Moeller, 2014; Willner et al., 2023).
Understanding and forecasting species’ geographic distributions in the face of climate change is one of the central priorities in biodiversity science. Climate niche-based models have been used extensively, with remarkable success, in understanding the influence of climate change on potential distribution of species. Substantial effort has been put into developing modelling approaches to forecast range shifts that are more process-based. However, the research progress in predicting species’ geographic distributions is still insufficient. Range dynamics of plant species in the face of climate change tend to be complex and multifactorial. Due to complexity of natural and social factors and uncertainties associated with climate change scenarios, species’ distribution shifts are difficult to predict. The distributions of many terrestrial organisms are currently shifting in latitude or elevation in response to changing climate (Chen et al., 2011). Individual species vary greatly in their rates of change, suggesting that the range shift of each species depends on multiple internal species traits and external drivers of change. As climate warming is expected to accelerate during the 21st century, plant migrations and tolerance to climatic stresses will probably be insufficient to absorb this impact posing threats to the sustainability of forest plant communities (Bertrand et al., 2016). Climate-driven range dynamics are likely to include population declines or regional extinctions for many plant species, particularly in more southerly areas and along species’ warm-margin distribution limits (Bellemare and Moeller, 2014).
What characteristics make forest herbs particularly vulnerable to climate change? Forest herbaceous species exemplify a group of organisms with very specific habitat requirements and low dispersal potential (Skov and Svenning, 2004; Svenning et al., 2008). These forest specialists adapted to stable microclimate of closed forest stands are often positioned more on a stress-tolerating end of strategy spectrum and are poor competitors (Valladares et al., 2016). Many forest herbs have life-history traits (e.g., heavy diaspores, low seed production, lack of morphological adaptations for long-distance seed dispersal via suitable dispersal agents; Van der Veken et al., 2007) that may limit the rate at which they can migrate in response to changing climate. The unique ecology and biogeographic history of forest plants may predispose them to climate-related vulnerabilities (Bellemare and Moeller, 2014). The velocity of macroclimatic warming and changes in precipitation regimes is much higher than their colonization rate to new, climatically more suitable areas (Van Daele et al., 2021). In addition, important risk factors in the face of modern climate change are species with limited geographic distributions, such as endemics and other ranged-restricted species (Erlandson et al., 2021).
How climate change is affecting forest plant species and understory communities is usually evaluated with observational research (resurvey of permanent vegetation plots, e.g., Richard et al., 2021) and controlled experiments (e.g., De Frenne et al., 2011; Govaert et al., 2021; Sanczuk et al., 2022a) or studies using species distribution models (e.g., Skov and Svenning, 2004; Sanczuk et al., 2022b). Species distribution (ecological niche) modelling, a family of powerful statistical methods based on the correlative relationship between species’ occurrence records and selected GIS layers of spatially explicit predictors, is now widely applied in macroecological studies (Lembrechts et al., 2019; Sillero et al., 2021) Species distribution models (SDMs) have emerged as a novel approach to forecast regional- and global-scale changes in species distributions (Fourcade et al., 2018). Recently, mapping range dynamics with SDMs has become a common tool in predicting the potential future occurrence patterns under climate change scenarios (Marmion et al., 2009; Greiser et al., 2020). Combined with field-based inventories of forest vegetation, SDMs can offer complementary information regarding extinction risk assessment, particularly on broader spatial and temporal scales.
The response of understory herbs to climate change is of high relevance for future forest biodiversity but little effort has been made so far to predict potential climate-driven range shifts and whether these dynamics might depend on species’ biogeography or ecological strategies (Svenning and Skov, 2006). Previous studies using SDMs focused on only one species (Van Daele et al., 2021; Sanczuk et al., 2022a) or limited number of forest herbs within geographically limited extent (Sanczuk et al., 2022b). To our knowledge, the studies of Skov and Svenning (2004) and Svenning and Skov (2006) represent important exceptions in this aspect. However, their selection included 36 north-nemoral forest herb species inhabiting various forest types and they analyzed coarse distribution data using bioclimatic envelope models (Pearson and Dawson, 2003). Recent advances in methodological approaches have emphasized the application of ensemble techniques with different SDM methods in investigating the potential range dynamics of plant species.
Continental-scale species distribution modelling approach was used in this study to predict potential distributional shifts for 71 herbaceous plant species across European forest biomes using two climate change scenarios. The selected species are considered as diagnostic species having an ecological optimum in European Fagus sylvatica forests (reference list compiled by Willner et al., 2009). This selection deliberately included widespread forest herbs as well as species with central geographic distribution in the Alpine-Dinaric beech forests because species in southern parts of Europe are presumed to be more vulnerable to climate change due to the vicinity of Mediterranean climate and associated decrease in summer precipitation. We addressed the following research questions: (i) Are beech forest plant species predicted to lose or gain climatic suitability in Europe in the future? (ii) Is the climatic suitability of selected species shifting toward higher latitudes and/or elevations? (iii) Can the potential range shifts be explained by species’ biogeographic and climatic niche attributes? It is important to provide additional insights into how will forest herbs behave in the southern edges of distributional range and how they could be maintained there. While high-elevation mountainous areas with complex topography will likely provide crucial refugia for heat- and drought-sensitive forest herbs in the future, the peripheral southern distribution populations of Fagus sylvatica (especially in the southern European Peninsulas) can function also as reservoirs for understory species less tolerant to winter cold.
We selected 71 herbaceous plant species which are closely associated with European beech forests, representing 64.5% of the total pool of 110 European beech forest herb species (according to Willner et al., 2009). The selected set of herbaceous species is representative of beech forests and covers different niches. Beech forest herbs represent ecologically and functionally distinctive species group with the highest contribution to plant diversity in beech forests. Our non-random species selection was based on the differences in geographic range sizes. We intentionally focused on widespread species which cover large parts of the range of Fagus sylvatica forests and herbaceous species with limited geographic distribution. The European-scale distribution of beech forest herbs is characterized by marked biogeographical patterning. Many of selected narrow-ranged species (present in less than 10 regions) are usually clustered around the glacial refugia of beech in SE and S Europe but almost entirely absent in central, western and northern Europe (Bohn et al., 2004). Distributional patterns of these species are often characterized by disjunctions and high variability in geographic distribution among individual species (Willner et al., 2023). Studying responses of such forest plant species is relevant because their ranges may be limited by colonization capacity rather than climate or other environmental factors and they might be subjected to higher risk of extinction. Owing to post-glacial dispersal limitations, distribution of some species is restricted to the Dinaric Mountains, the Alps and adjacent regions and can thus be considered as so-called Illyrian floristic elements (Trinajstić, 1995; Willner et al., 2009). This group of diagnostic species show relatively high fidelity to the alliance Aremonio-Fagion (Illyrian beech forests; Marinšek et al., 2013). The Illyrian-Dinaric region (mostly Slovenia and Croatia) includes the core and pronounced diversity hotspot of the European forest flora and vegetation (Večeřa et al., 2019). Like the beech itself, many of its herbaceous companions survived glacial periods in refuges in the Illyrian-Dinaric region from which they spread out in the postglacial period particularly toward the north (Bohn et al., 2004). Their current ranges also seem to be the product of stochastic and unpredictable dispersal mechanisms, including erratic long-distance events (Willner et al., 2023).
The relatively wide spectrum of range sizes and range locations allowed us to explore potential differences in predicted range shifts in relation to biogeographic patterns. The selected forest herbs were defined as species with high affinity to forest habitat (sensu Heinken et al., 2022) and can thus be perceived as forest specialists. In terms of ecological requirements, these shade-tolerant species can be categorized as mesophilous plants as they require sufficient soil moisture, relative humidity and soil nutrient content. A full list of selected plant species is given in Supplementary Table 1. Nomenclature follows the Euro+Med PlantBase.1
We collected data on the current geographical distribution of studied species across Europe (33° N to 72° N and 10° W to 40° E). This area was divided into grids of 2.5 arc-minute resolution, with a total of 1,145,760 raster cells across the entire study area (more than 6.4 million km2). Presence-only occurrences for all beech forest plant species, and their taxonomic synonyms, were extracted from the Global Biodiversity Information Facility (GBIF) repository (accessed in October–November 2022).2 Mahecha et al. (2021) concluded that crowd-sourced plant occurrence data provide a reliable description of macroecological gradients. We initially compiled a list of all occurrence records using the rgbif R package (Chamberlain, 2021). Then, screening and filtering of observations was made in sequential cleaning protocol. First, we excluded observations noted before 1970 because they are out of present climatic periods (i.e., 1970–2000 according to the WorldClim database definition). Records that were duplicated (identical latitude and longitude values) and evidently inaccurate (e.g., located in a body of water, had a zero coordinate or were likely to be a decimal conversion error) were removed using the CoordinateCleaner R package (Zizka et al., 2019).
In the next step, we additionally restricted the extent of occurrence data. We georeferenced the spatial map of the 40 European regions [i.e., operational phytosociological units provided by Willner et al. (2009)] using QGIS software version 3.18.3 We manually created precise spatial polygon for each region and then species’ occurrences present only in regions with either “1”, “+” or “r” [see the species-by-region matrix in Willner et al. (2009)] were clipped by masking in QGIS. This procedure omitted a substantial share of presence points but improved the reliability and quality of occurrence data. This filtering was especially important for some narrow-ranged beech forest species that were reported as naturalized in regions outside their natural distribution range (e.g., cultivation in gardens). Owing to such a conservative approach, we ensure the most precise result possible, and we believe it provides a reasonable assessment of native distribution of the selected plant species.
Freely available sources of presence records come with the important caveat that they are sampled non-randomly. Therefore, we accounted for sampling bias and spatial autocorrelation. The problem of geographically uneven sampling effort, resulting from varied data coverage in public repositories, is frequent in species distribution data and influences the quality of modelling (Boria et al., 2014; Cornwell et al., 2019). It was shown that the crowd-sourced data particularly under-sample areas of low population density (Mahecha et al., 2021). To avoid errors caused by uneven sampling and pseudo-replication (both contributing to the risk of model overfitting), we reduced the spatial autocorrelation of cleaned occurrence data by rasterizing the study area and limiting occurrence records to only one per grid raster cell. A grid of 2.5′ × 2.5′ (ca. 5 × 5 km) cell size covering the entire land surface within the study area was adopted, and one occurrence record closest to each grid’s center was kept while the remaining points were deleted. This grid size is suitable for continental-scale models and has been used in recent studies dealing with plant species (e.g., Xie et al., 2022; Puchałka et al., 2023a). Obtaining more uniform density of distribution points was essentially needed for some widespread species with high occurrence density concentrated in more densely populated regions (i.e., Central and Western Europe), which could influence the results by multiplying the weight of spatially clustered observations. Spatial thinning of species occurrence records was performed using the spThin R package (Aiello-Lammens et al., 2015).
After data cleaning, cross-checking and resampling, the original dataset of observations was on average reduced by more than 60%. In total, the whole procedure yielded 394,502 geolocated occurrence records for all species, ranging from 71 (Cardamine waldsteinii Dyer) to 13,860 (Polygonatum multiflorum L.). Many publications have argued about the appropriate sample size for better quality of SDM. Model accuracy reduction begins when the data is less than 30 while some stated that the minimum species presence observation required to achieve acceptable accuracy is 50 after which accuracy declines (Wisz et al., 2008; Merow et al., 2014; Guisan et al., 2017). The number of validated presence points used in the modelling for each species is given in Supplementary Table 1.
The current and future distributions of species were characterized by a range of climate variables. Raster layers for 19 bioclimatic variables (BIO1-19) were downloaded from WordClim database version 2.1 (Fick and Hijmans, 2017)4 at 2.5 arc-minute spatial resolution using the “worldclim” function in the geodata R package (Hijmans et al., 2022a). This set of variables (explained in Supplementary Table 2) describing annual trends, seasonality and other variation in temperature and precipitation data from 1970 to 2000 has been widely employed in simulating species distributions and associated ecological modelling. We did not include other variables describing habitat (soil type, land use), as at the continental scale climate is the main constraint determining plant species distributions (Pearson and Dawson, 2003; Skov and Svenning, 2004).
In order to forecast changes in the future climatic suitability, bioclimatic variables projected for the pre-defined period 2061–2080 (2070s) were retrieved from WorldClim 2.1 under two different Shared Socioeconomic Pathways (SSPs): SSP2-4.5 and SSP5-8.5. The used future decennium is a common practice and has been widely employed in simulating species distributions and associated ecological modelling (range shifts averaged over 2061–2080). SSPs represent upgraded climate projections based on Representative Concentration Pathways (IPCC, 2022) that reflect the link between socioeconomic development patterns and climate-change risks (Kriegler et al., 2012). According to more optimistic SSP2-4.5 scenario (analogous to RCP4.5), the radiative forcing would stabilize at 4.5 W m−2, CO2 concentration in the atmosphere would increase to 650 ppm and global warming would be within 1.0–2.6°C by the end of the 21st century. This is a scenario predicting intensive economic growth, but assuming emission reduction. Under pessimistic SSP5-8.5 scenario (analogous to RCP8.5), CO2 concentration of 1,350 ppm would be high enough to produce a radiative forcing of 8.5 W m−2 and an average temperature increase of 2.6–4.8°C by year 2100 (Riahi et al., 2017). This is a scenario of intensive economic growth with intensive use of fossil fuels (IPCC, 2022). Future climatic projections were derived for three General Circulation Models (GCMs) developed within the Coupled Model Intercomparison Project Phase 6 (CMIP6): CNRM-CM6-1, HadGEM-GC31-LL and IPSL-CM6A-LR. These GCMs were selected based on their bioclimatic data availability and the variability in the precipitation projection (Fajardo et al., 2020). We averaged (unweighted) final model predictions for each SSP scenario across all three GCMs to account for uncertainty in future climate predictions related to the GCMs and to provide a more robust forecasts of range shifts (Araújo and New, 2007). The function “cmip6” in the geodata R package (Hijmans et al., 2022a) served for downloading of downscaled and calibrated CMIP6 latest climate data for projected future climates (spatial resolution was 2.5 min of a degree). All the bioclimatic layers were processed using the same extent, cell size and projection system (WGS84 geographic coordinate system).
The main logic behind the species distribution modelling is in the association between species’ occurrences and environmental predictors. Model inputs are a layer with presence data (spatial points) and rasterized climatic variables, while model output is a raster layer with predicted occurrence probabilities across the modeled spatial extent. In the case of bioclimatic models, the returned continuous index can be interpreted as the climatic suitability (climatic niche optimum) of the species studied. We fitted species distribution model (SDM) for each plant species using the workflow described in the following steps.
i. In order to associate climatic data from the stacked raster object with the point species occurrence data, we extracted information to each of the points using “extract” function in raster package (Hijmans et al., 2022b).
ii. Relatively strong correlations between the 19 bioclimatic variables could affect the simulation results. Preselection of predictor variables is thus required to lessen the multicollinearity issue. This was done with test-based stepwise procedure based on variance inflation factor (VIF) using the “vifstep” function in the usdm R package (Naimi, 2022). Highly collinear variables with VIF > 10 were excluded using the “exclude” function in the usdm package.
iii. The structure of species distribution model was specified with the “sdmData” function in the sdm package (Naimi and Araújo, 2016). This was done by distinguishing the training dataset (species occurrences), the predictor variables (selected climatic parameters as described in previous step) and a set of randomly generated background (pseudo-absence) points from all the points across the study extent not taken as presences. The number of pseudoabsences was not generic and was equal to the number of species occurrence records, following recommendations by Barbet-Massin et al. (2012).
iv. To define the model formulation, the “sdm” function in the sdm package (Naimi and Araújo, 2016) was adopted. The defining model components were the data (species presence and pseudo-absence data as well as the predictor variables), four statistical modelling methods (generalized linear model – GLM, generalized additive models – GAM, boosted regression trees – BRT and random forest – RF) and customized settings for data evaluation. Subsampling technique was used for data partitioning, with 10 replicates for each method. In each run, three blocks were used for training and the remaining one for validation (i.e., test percentage in subsampling was 25%). This split allowed us to prevent overfitting when validating the model using the training set. We used the “predict” function in the sdm package which produces a raster object with predictions from several fitted models.
v. The ensemble modelling approach was employed to minimize the bias and additionally provide a relative assessment of the relevance of each predictor variable across all selected modelling algorithms as well as to improve the general prediction performance (Guisan et al., 2017; Hao et al., 2020). The ensemble forecasting was done by using the “ensemble” function in the sdm package. Fitted models were merged into a final ensemble prediction by estimating the weighted average suitability based on the true skill statistic (TSS) of individual model. This means that the models with higher accuracy were upweighted in final predictions.
vi. The modelling output for each species was a raster map with predicted occurrence probabilities across grid cells, ranging between 0 and 1. This projected geographic range can be interpreted as the climatic optimum of the species studied (or as its climatic niche). Final models were evaluated for the discriminating capacity (i.e., ability to correctly classify presences and absences) by two commonly used metrics: the AUC (area under the receiver operating characteristic curve) and the TSS (true skill statistic). While the former reflects the model performance according to its sensitivity and specificity, the latter is advantageous because it is not affected by the size of the validation set or the prevalence of the species (Allouche et al., 2006). Larger AUC and TSS values indicate a higher accuracy of the prediction results, i.e., model quality.
During the SDM process, the relative importance (in %) of bioclimatic predictors as range-defining variables for the current potential distribution was assessed based on training dataset, using the function “getVarImp” in the sdm package (Naimi and Araújo, 2016). In the Results section, we report the number of times a bioclimatic variable was included in models, its total contribution (summed % across all species) and its average importance (summed % divided by the number of times a variable was included in models). For each species, we also graphically inspected the climatic niche (two-dimensional environmental space constrained by two top ranked bioclimatic variables based on relative importance) and the response curves to bioclimatic predictors. The functions “niche” and “rcurve,” respectively, implemented in the sdm package, were used for this purpose. Higher values on the response curves correspond to a higher probability of species occurrence and suitability of climate.
We first mapped the occupied areas of each beech forest plant species across Europe, i.e., the distribution of current and future climatic suitability. To quantitatively analyze the magnitude and direction of geographic range shifts, all raster layers produced by ensemble modelling were subjected to different calculations. We computed the changes in the area of climatically suitable habitat by extracting the values of occurrence probability (hereafter OP) from each pixel (i.e., 2.5′ × 2.5′ grid cell). The continuous OP values ranging between 0 and 1 were classified into four classes: least potential (OP <0.25), moderate potential (0.25–0.5), high potential (0.5–0.75) and highest potential (>0.75). The relative change in the total area (in km2) across Europe from current to future distribution models was calculated for these probability classes, separately for each climate change scenario.
We then applied a threshold-based classification of our model prediction for easy computations across different climate scenarios and the range shift analysis. The selection of the threshold value for the prediction of species occurrence with presence-only data can have a large impact on range centroid estimates (Nenzén and Araújo, 2011). The species-specific threshold (reported in Supplementary Table 1; ranging from 0.155 to 0.790) for converting the predicted occurrence probabilities into presence or absence of each species at a site (further referred to as occurrence threshold, OT) was defined such that it optimized the true skill statistic (Liu et al., 2005). It is important to note that in our approach, this species-specific OT value represent a cut-off according to which cells with OP above threshold represent climatically more suitable areas and cells with OP below threshold represent climatically less suitable sites. Grid cells with OP greater than OT were assigned a value of “1” (representing areas with high/moderate climatic suitability) and pixels with OP lower than OT were assigned a value of “0” (representing less favorable climatic conditions). Based on these binary values, different types of changes in climatic suitability were delimited. We were able to obtain information on gained areas (0 → 1; number of currently occupied pixels with OP below OT, but future OP increased above OT) and lost areas (1 → 0; OP in the current model is above OT, but OP in the future model dropped below OT). Raster cells with no change in OP across OT were considered as stable or climatically unsuitable areas. The ratio between gains and losses (summed area in km2) across Europe from current to future distribution models was calculated, separately for each climate change scenario.
We analyzed shifts in spatial distribution patterns for each species and each climate change scenario. Relative change between current range centroid (perceived as center of gravity) and future distribution centroid was approximated by calculating averages of latitude and longitude across all grid cells with OP > OT. To detect the direction and distance of species range shifts under future conditions, we determined the centroids of current and future binary presence-absence maps (defined in the previous paragraph) using the R package rgeos (Bivand et al., 2022) with the “gCentroid” function. Gained and lost areas were additionally compared in terms of elevation. Elevatr R package (Hollister and Shah, 2022) was used for extraction of elevation values based on pixel coordinates. Patterns in elevation were separately analyzed for two latitudinal belts: latitudes below 50° (low) and latitudes above 50° (high). This was cut-off was used because the majority of high-elevational mountainous systems (the Alps, the Carpathians, the Dinaric Mountains, the Apennines, the Pyrenees) is concentrated in southern and mid-latitude Europe and averaging elevations of gained and lost areas across entire study area would likely lead to biased results. All described analyses along latitudinal, longitudinal and elevation gradients were performed to test whether future climatic suitability show expected northward shift and trends toward higher elevations. The differences between gained and lost areas in terms of latitude, longitudinal and elevation were tested with non-parametric Wilcoxon rank-sum tests.
Information on the ecological traits of species (e.g., range size or range filling capacity) might improve predictions of climate-driven range shifts (Estrada et al., 2016). Species’ traits are promising candidates for explaining variation among species in geographical range shifts. Coupling traits to expansions and contractions of species’ ranges could provide a mechanistic understanding of the processes driving changes in latitudinal and elevational distributions. Sufficient number of selected plant species (n = 71) allowed us to statistically explore the relationship between species-level changes in climatic suitability and species’ attributes related to biogeography and climatic niche (Table 1), which were used as predictors of modeled range shifts under climate change. We opted for temperatures and precipitations collected during the growing season (April – September) because they are more important drivers of forest plant species distribution than annual values (Lenoir et al., 2013; Macek et al., 2019). Overall, we tested whether the magnitude of change (gain/loss ratio) in climatic suitability depended on plant attributes, because biogeographic characteristics and ecological requirements might influence the species response to future climate change. Range size (in our study proxied by number of regions) seems particularly relevant in this context. For herbaceous species, Van der Veken et al. (2007) demonstrated that seed dispersal mode, seed production and seed bank longevity exhibited significant associations with geographic range characteristics, including area of occupancy.
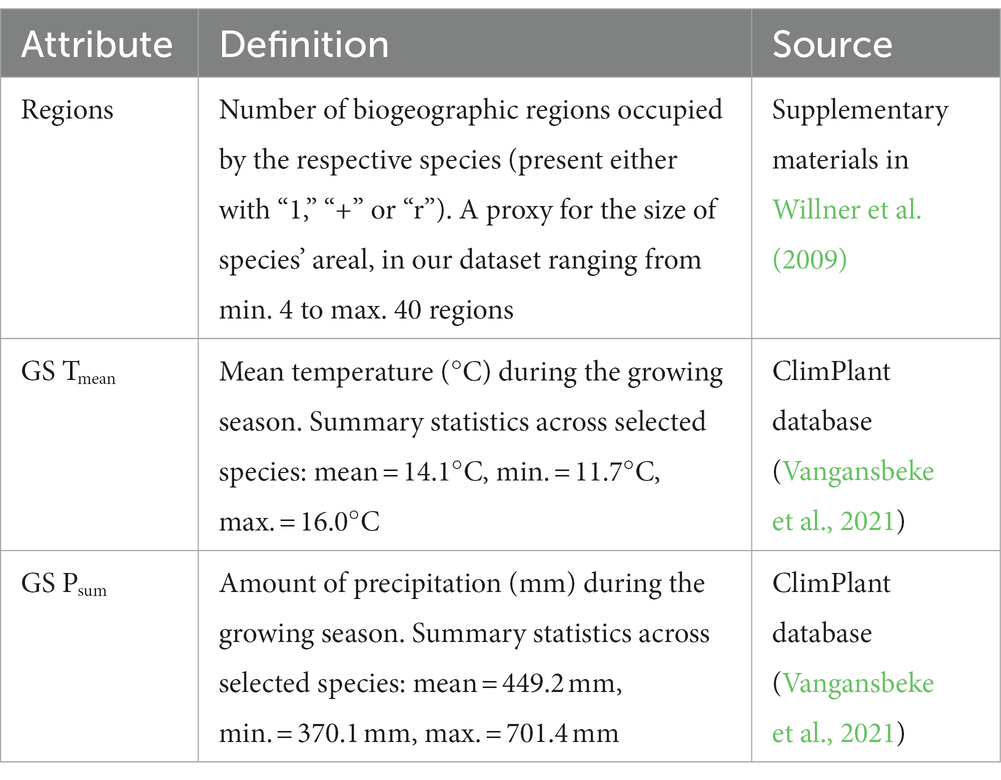
Table 1. Plant attributes used as predictors of modeled range shifts.
As a response variable, the log-transformed ratio between gained and lost areas was used. We assessed the dependence of the gain/loss ratio on selected plant attributes by using Generalized Additive Models in the mgcv library (Wood, 2020). This statistical method allows for non-linear responses and more flexible estimation of the relationship between explanatory factors and response variables. We applied univariate structure with no interaction terms and restricted maximum likelihood method. Variance explained by predictors (plant attributes) were expressed as deviance explained (%). The significance of smooth terms was evaluated with F statistics. Included explanatory and dependent variables did not violate assumptions behind the applied method.
All analyses described were carried out in R statistical software version 4.1.1 (R Core Team, 2021).
The AUC (area under the receiver operating characteristic curve) values of current distribution models were above 0.90 (mean for ensemble approach: 0.94; Table 2), which indicates high accuracy of the models and good discrimination ability in accurately identifying the potential distribution of a species (Elith et al., 2006). Most TSS (true skill statistic) values were > 0.75 (Table 2), indicating that models generally performed well. In terms of predictive power, different species distribution modelling algorithms used in our study can be ranked as follows (starting with best performing): RF, GAM, BRT and GLM (Table 2).
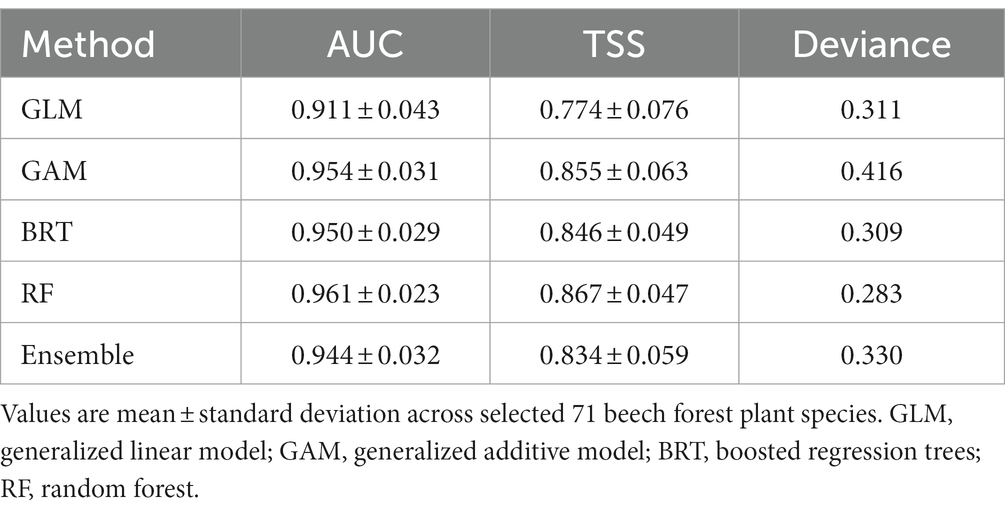
Table 2. Model performance of four modelling algorithms (GLM, GAM, BRT, RF) based on area under the receiver operating characteristic curve (AUC) and the true skill statistic (TSS) scores.
The number of bioclimatic variables included in the models for current distribution varied between species, ranging from six to nine (Supplementary Table 1). More than half of the ensemble models were parameterized with eight variables. Among 19 WorldClim bioclimatic variables, some of the predictors were frequently included in the models but with overall low relative importance [e.g., mean temperature of wettest quarter (BIO8) and precipitation seasonality (BIO15)]. Some common climatic predictors emerged among models for different species. When summed and averaged across the whole set of selected species, the most important predictors with highest contribution were precipitation of warmest quarter (BIO18) and temperature seasonality (BIO4) (Table 3). The former variable was an important determinant of current distribution for 52 species while the latter proved significant for 34 species. Based on response curves (data not shown), we recognized a common pattern in species response along these two predictors. The occurrence probability of species increased along the gradient of precipitation amount of the warmest quarter. A hump-shaped curve was the most frequent relationship between occurrence probability and temperature seasonality. Most species prefer smaller oscillations of annual temperature and lower precipitation seasonality. Temperature annual range (BIO7; the mean importance across 25 species was 26.9%) and amount of annual precipitation (BIO12; the mean importance across 8 species was 44.5%) were also significant contributors to the current distributional ranges of beech forest species (Table 3). The relative importance of bioclimatic variables for all species is displayed in Supplementary Figure 1. Precipitation of warmest quarter (BIO18) was more important for range-restricted herbs whereas temperature seasonality (BIO4) was recognized as better predictor for widespread species (Supplementary Figure 2).
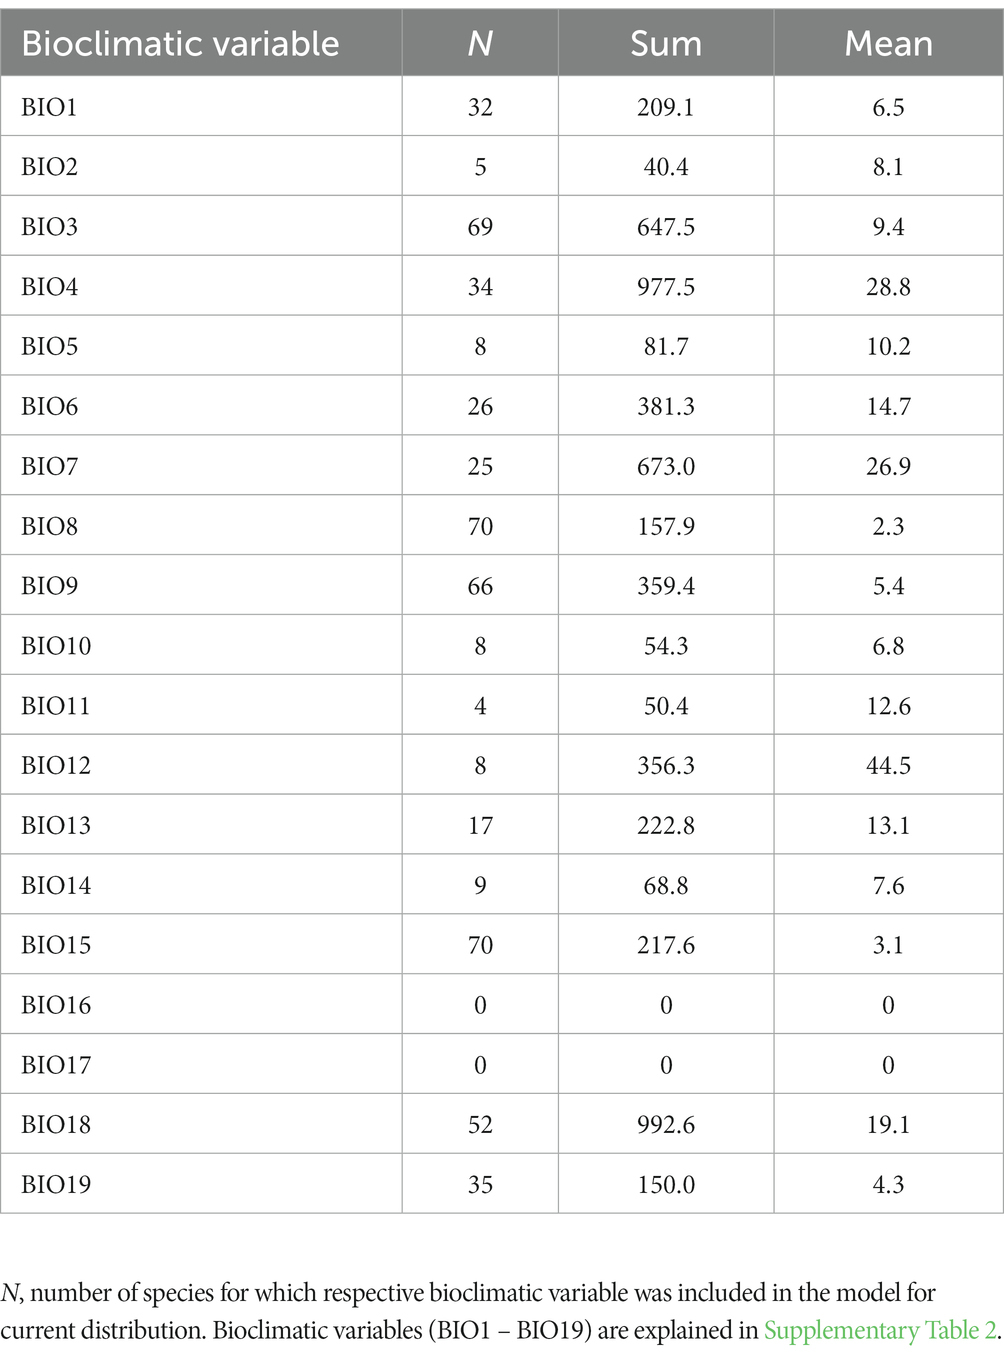
Table 3. Relative importance (%) of bioclimatic variables summed (Sum; cumulative contribution) and averaged (Mean) across 71 beech forest plant species.
Compared with the potential distribution area under the current climate, suitable habitats for beech forest plant species would change significantly under two climate change scenarios in the 2070s. The projections of occurrence probability (OP) changes revealed that climatic suitability for many forest herbs is likely to decrease in the future. Under the SSP2-4.5 scenario, majority of species will increase the area of high (0.5 < OP <0.75) and moderate climatic suitability (0.25 < OP <0.5) but are predicted to experience reduction in highly suitable areas (OP >0.75) (Table 4). However, for 11 species models predicted an increase of the total area in this category. Under the SSP5-8.5 scenario, similar changes in climatic suitability were predicted, although with greater magnitude compared to SSP2-4.5. The most striking result was that total areas of all 71 selected species are predicted to decline in the category of high climatic suitability (OP >0.75), with an average decrease amounting to 53% (Table 4).
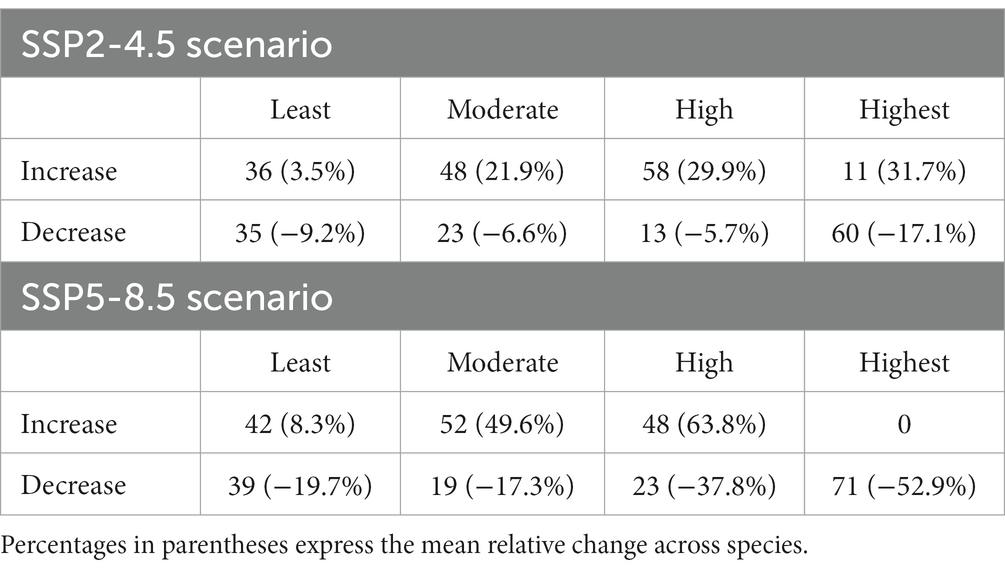
Table 4. The number of species with increase and decrease in occurrence probability (OP) for each category: least potential (OP <0.25), moderate potential (OP 0.25–0.5), high potential (OP 0.5–0.75), highest potential (OP >0.75).
When comparing gained and lost areas of climatic suitability based on occurrence threshold (OT) for individual species, we found a large degree of variation among individual beech forest herbs. In the case of SSP2-4.5 scenario, 18 species showed higher gains than losses (Figure 1). The five top-ranked species according to the gain/loss ratio were Epimedium alpinum (ratio: 9.95), Hieracium transylvanicum (5.26), Omphalodes verna (4.78), Lamium orvala (3.40) and Anemone trifolia (2.06). In contrast, forest herbs with the lowest gain vs. loss ratio were Prenanthes purpurea (ratio: 0.15), Lysimachia nemorum (0.17), Ranunculus lanuginosus (0.24), Cardamine pentaphyllos (0.26) and Euphorbia amygdaloides (0.27). Across all species, differences in gains and losses of climatic suitability were highly significant for this climate change scenario (Wilcoxon test value of p <0.001).
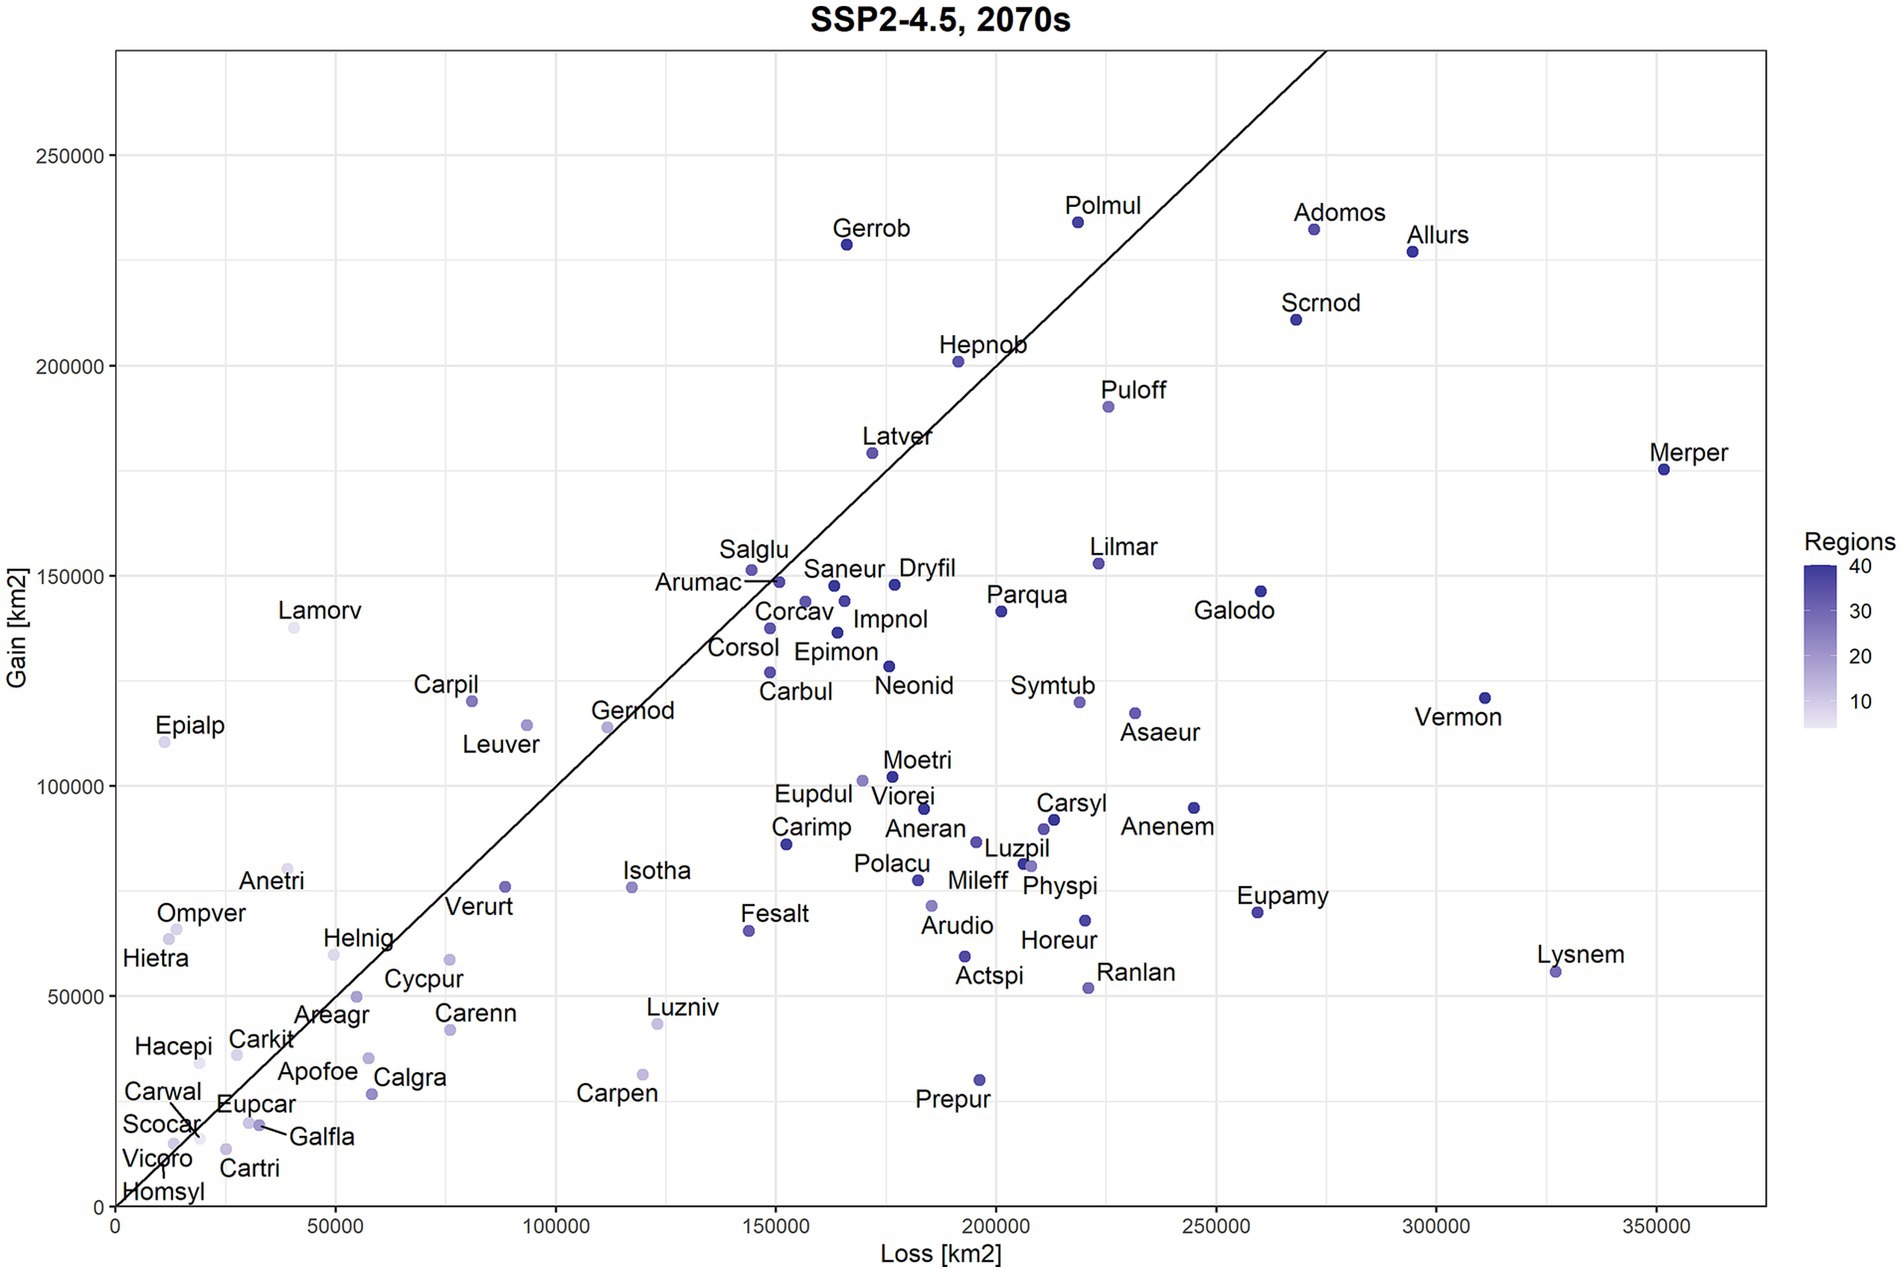
Figure 1. Comparison of lost (x-axis) and gained (y-axis) areas (km2 across the entire spatial extent of our study) for 71 beech forest plant species according to the SSP2-4.5 scenario and the period 2061–2080 (2070s). Species positioned below the diagonal line are projected to have more losses than gains in the future while models for species above this line predicted larger gains than losses in more climatically suitable area (occurrence probability higher than species-specific threshold). Colour gradation for datapoints denotes the number of regions (according to Willner et al., 2009) in which species is present (as a proxy for current range size). Species names are coded as follows: Actspi = Actaea spicata, Adomos = Adoxa moschatellina, Allurs = Allium ursinum, Anenem = Anemone nemorosa, Aneran = Anemone ranunculoides, Anetri = Anemone trifolia, Apofoe = Aposeris foetida, Areagr = Aremonia agrimonoides, Arumac = Arum maculatum, Arudio = Aruncus dioicus, Asaeur = Asarum europaeum, Calgra = Calamintha grandiflora, Carbul = Cardamine bulbifera, Carenn = Cardamine enneaphyllos, Carimp = Cardamine impatiens, Carkit = Cardamine kitaibelii, Carpen = Cardamine pentaphyllos, Cartri = Cardamine trifolia, Carwal = Cardamine waldsteinii, Carpil = Carex pilosa, Carsyl = Carex sylvatica, Corcav = Corydalis cava, Corsol = Corydalis solida, Cycpur = Cyclamen purpurascens, Dryfil = Dryopteris filix-mas, Epimon = Epilobium montanum, Epialp = Epimedium alpinum, Eupamy = Euphorbia amygdaloides, Eupcar = Euphorbia carniolica, Eupdul = Euphorbia dulcis, Fesalt = Festuca altissima, Galfla = Galeobdolon flavidum, Galodo = Galium odoratum, Gernod = Geranium nodosum, Gerrob = Geranium robertianum, Hacepi = Hacquetia epipactis, Helnig = Helleborus niger, Hepnob = Hepatica nobilis, Hietra = Hieracium transylvanicum, Homsyl = Homogyne sylvestris, Horeur = Hordelymus europaeus, Impnol = Impatiens noli-tangere, Isotha = Isopyrum thalictroides, Lamorv = Lamium orvala, Latver = Lathyrus vernus, Leuver = Leucojum vernum, Lilmar = Lilium martagon, Luzniv = Luzula nivea, Luzpil = Luzula pilosa, Lysnem = Lysimachia nemorum, Merper = Mercurialis perennis, Mileff = Milium effusum, Moetri = Moehringia trinervia, Neonid = Neottia nidus-avis, Ompver = Omphalodes verna, Parqua = Paris quadrifolia, Physpi = Phyteuma spicatum, Polmul = Polygonatum multiflorum, Polacu = Polystichum aculeatum, Prepur = Prenanthes purpurea, Puloff = Pulmonaria officinalis, Ranlan = Ranunculus lanuginosus, Salglu = Salvia glutinosa, Saneur = Sanicula europaea, Scocar = Scopolia carniolica, Scrnod = Scrophularia nodosa, Symtub = Symphytum tuberosum, Vermon = Veronica montana, Verurt = Veronica urticifolia, Vicoro = Vicia oroboides, Viorei = Viola reichenbachiana.
According to the SSP5-8.5 scenario, great majority of studied forest herbs exhibited substantial losses in total area of more suitable habitats (OP > OT) across Europe (Figure 2). On average, losses exceeded gains by 59%. Only four species (Hieracium transylvanicum, Omphalodes verna, Epimedium alpinum, Cardamine kitaibelii) had gain/loss ratio above 1, indicating that the newly suitable area for these species was larger than the area that become unsuitable. The greatest potential contraction of climatically suitable areas was calculated for Cyclamen purpurascens (ratio: 0.03), Prenanthes purpurea (0.03), Aruncus dioicus (0.05), Ranunculus lanuginosus (0.08) and Euphorbia carniolica (0.09). Differences in gains and losses of climatic suitability were highly significant for this climate change scenario (Wilcoxon test value of p <0.001).
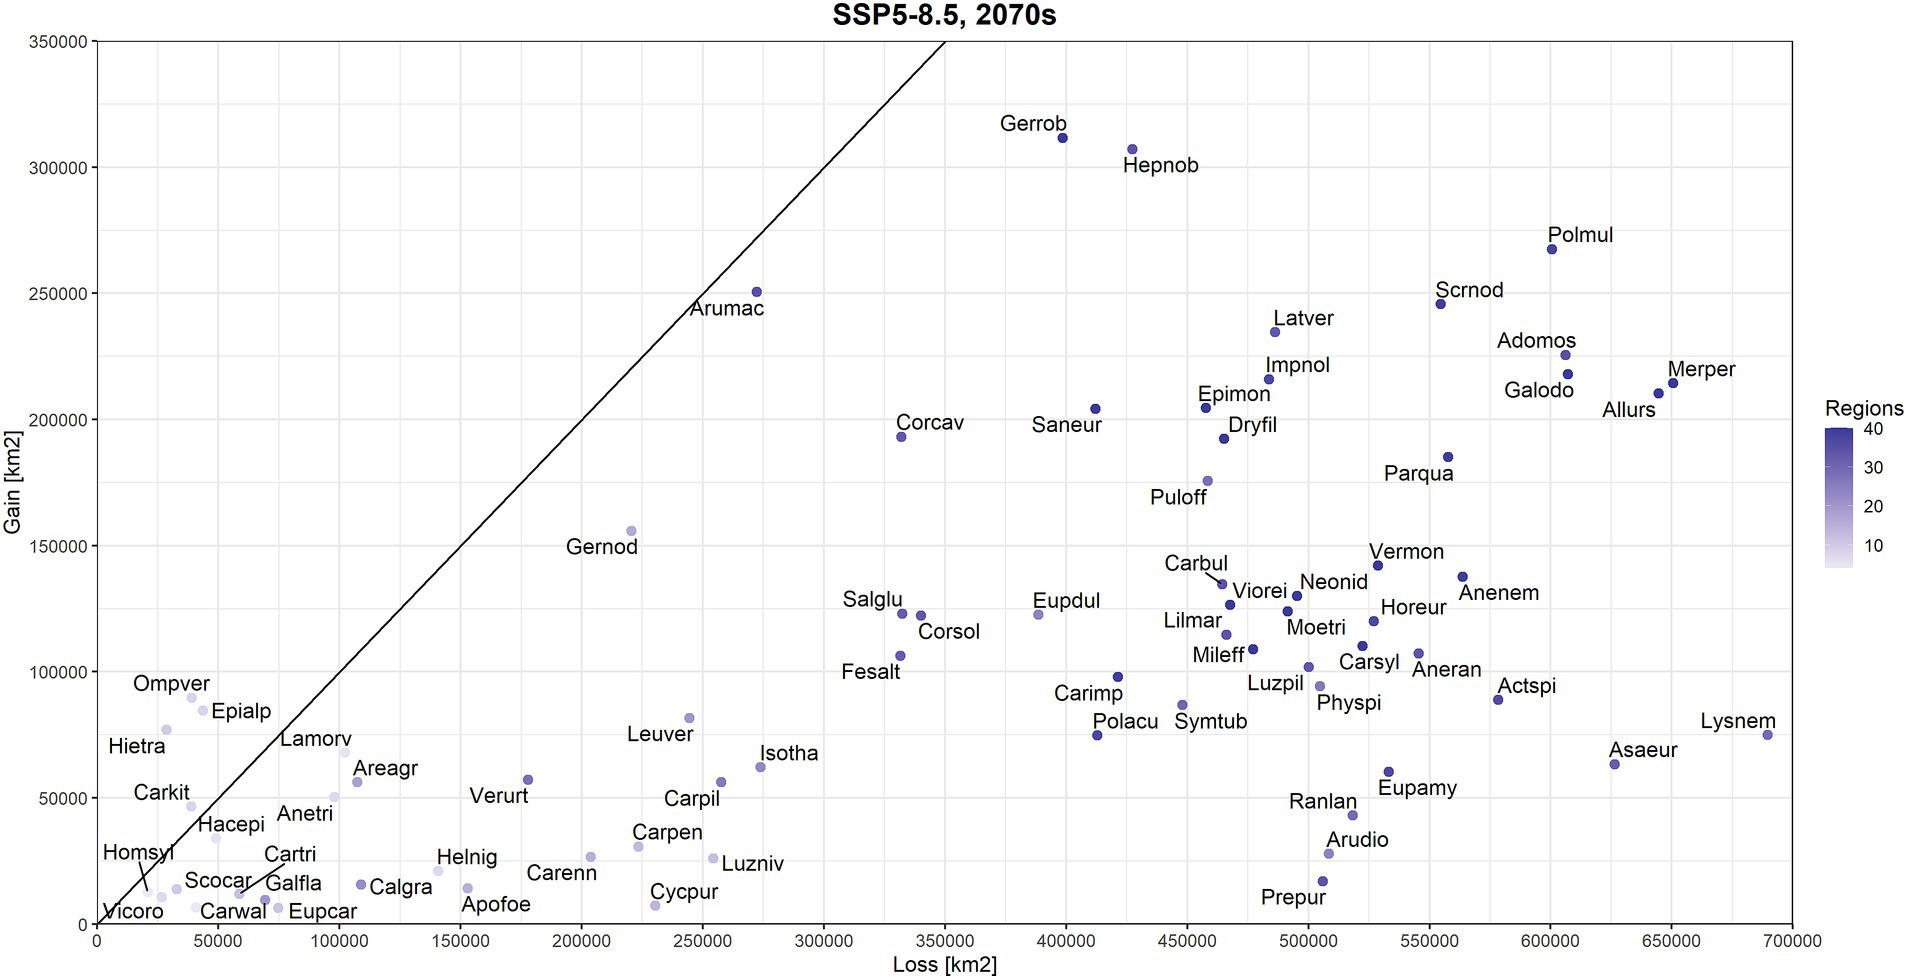
Figure 2. Comparison of lost (x-axis) and gained (y-axis) areas (km2 across the entire spatial extent of our study) for 71 beech forest plant species according to the SSP5-8.5 scenario and the period 2061–2080 (2070s). Species positioned below the diagonal line are projected to have more losses than gains in the future while models for species above this line predicted larger gains than losses in more climatically suitable area (occurrence probability higher than species-specific threshold). Colour gradation for datapoints denotes the number of regions (according to Willner et al., 2009) in which species is present (as a proxy for current range size). Species names are coded the same as in Figure 1.
For the practical illustration purposes, we show several examples (Figures 3–6) of climatic suitability changes for each climate change scenario, using examples of one widespread beech forest plant species and one species with more narrow distributional range in Europe.
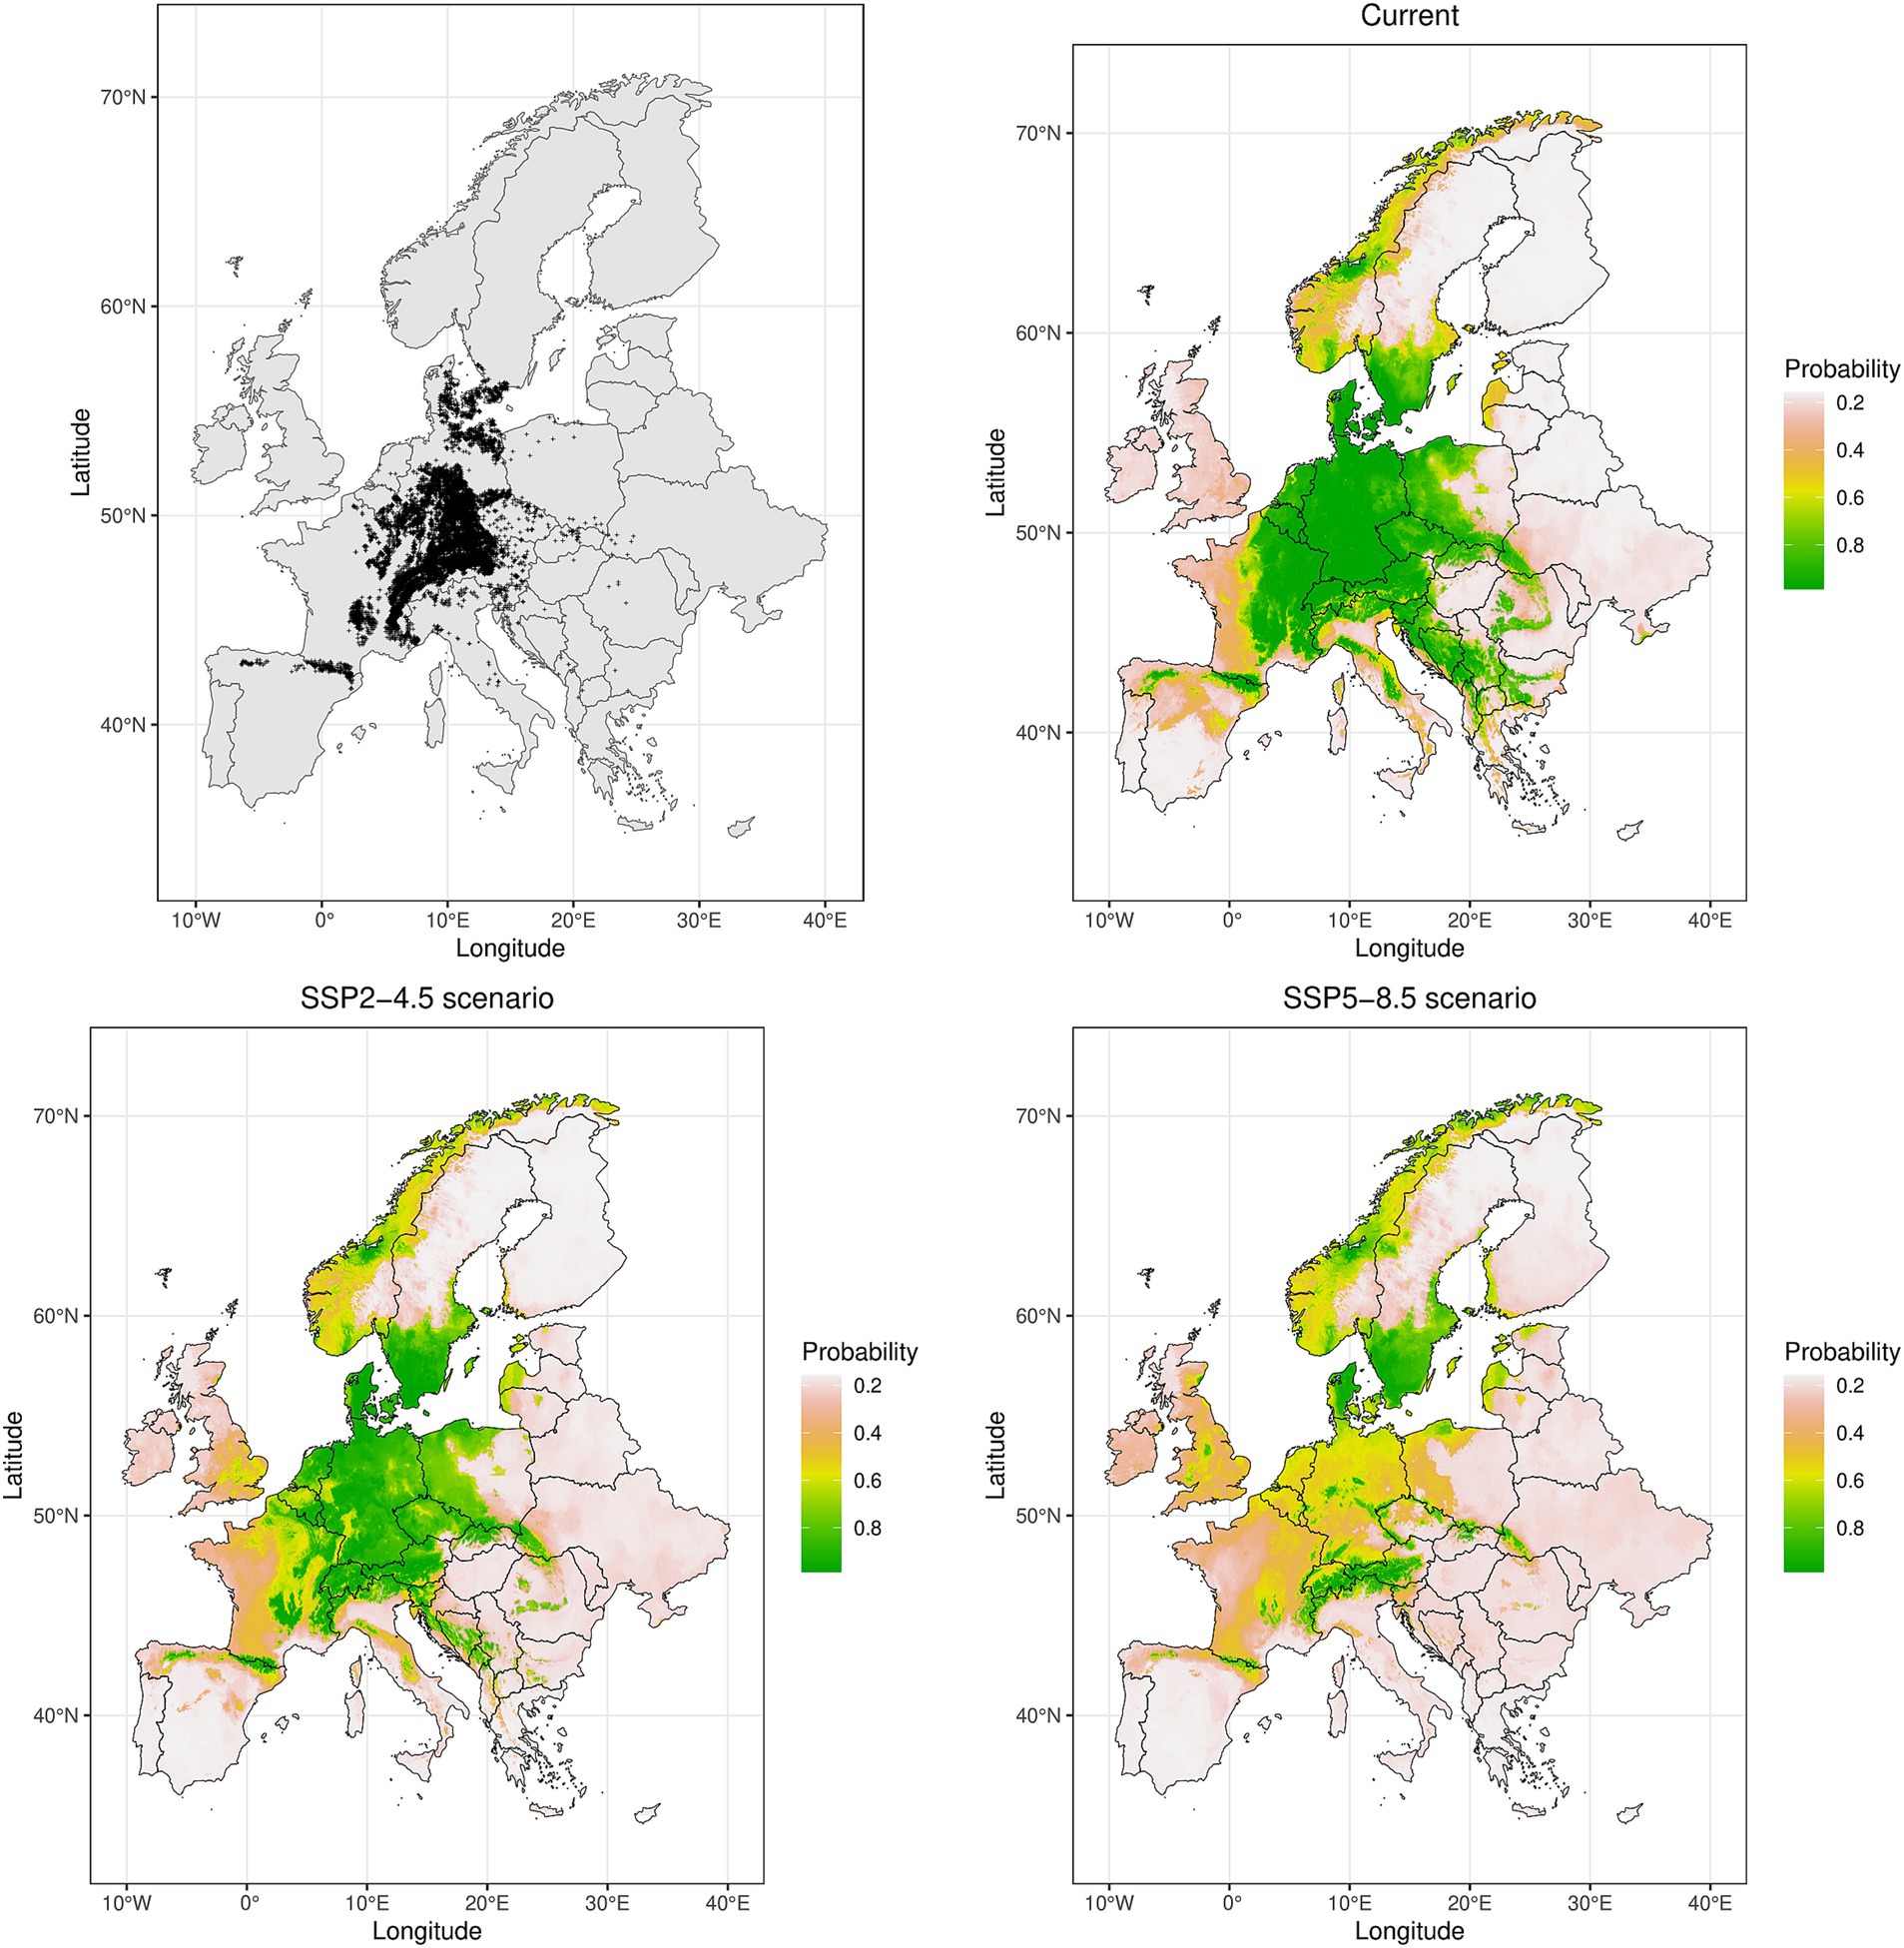
Figure 3. Spatial maps showing the locations of used occurrence records (n = 9,194) and ensemble model predictions with current distribution (1970–2000) and potential future (2070s) ranges under the two climatic scenarios (SSP2-4.5 and SSP5-8.5), expressed as probability of occurrence for Actaea spicata, a widespread beech forest species present in 36 regions (operational phytosociological units) according to Willner et al. (2009).
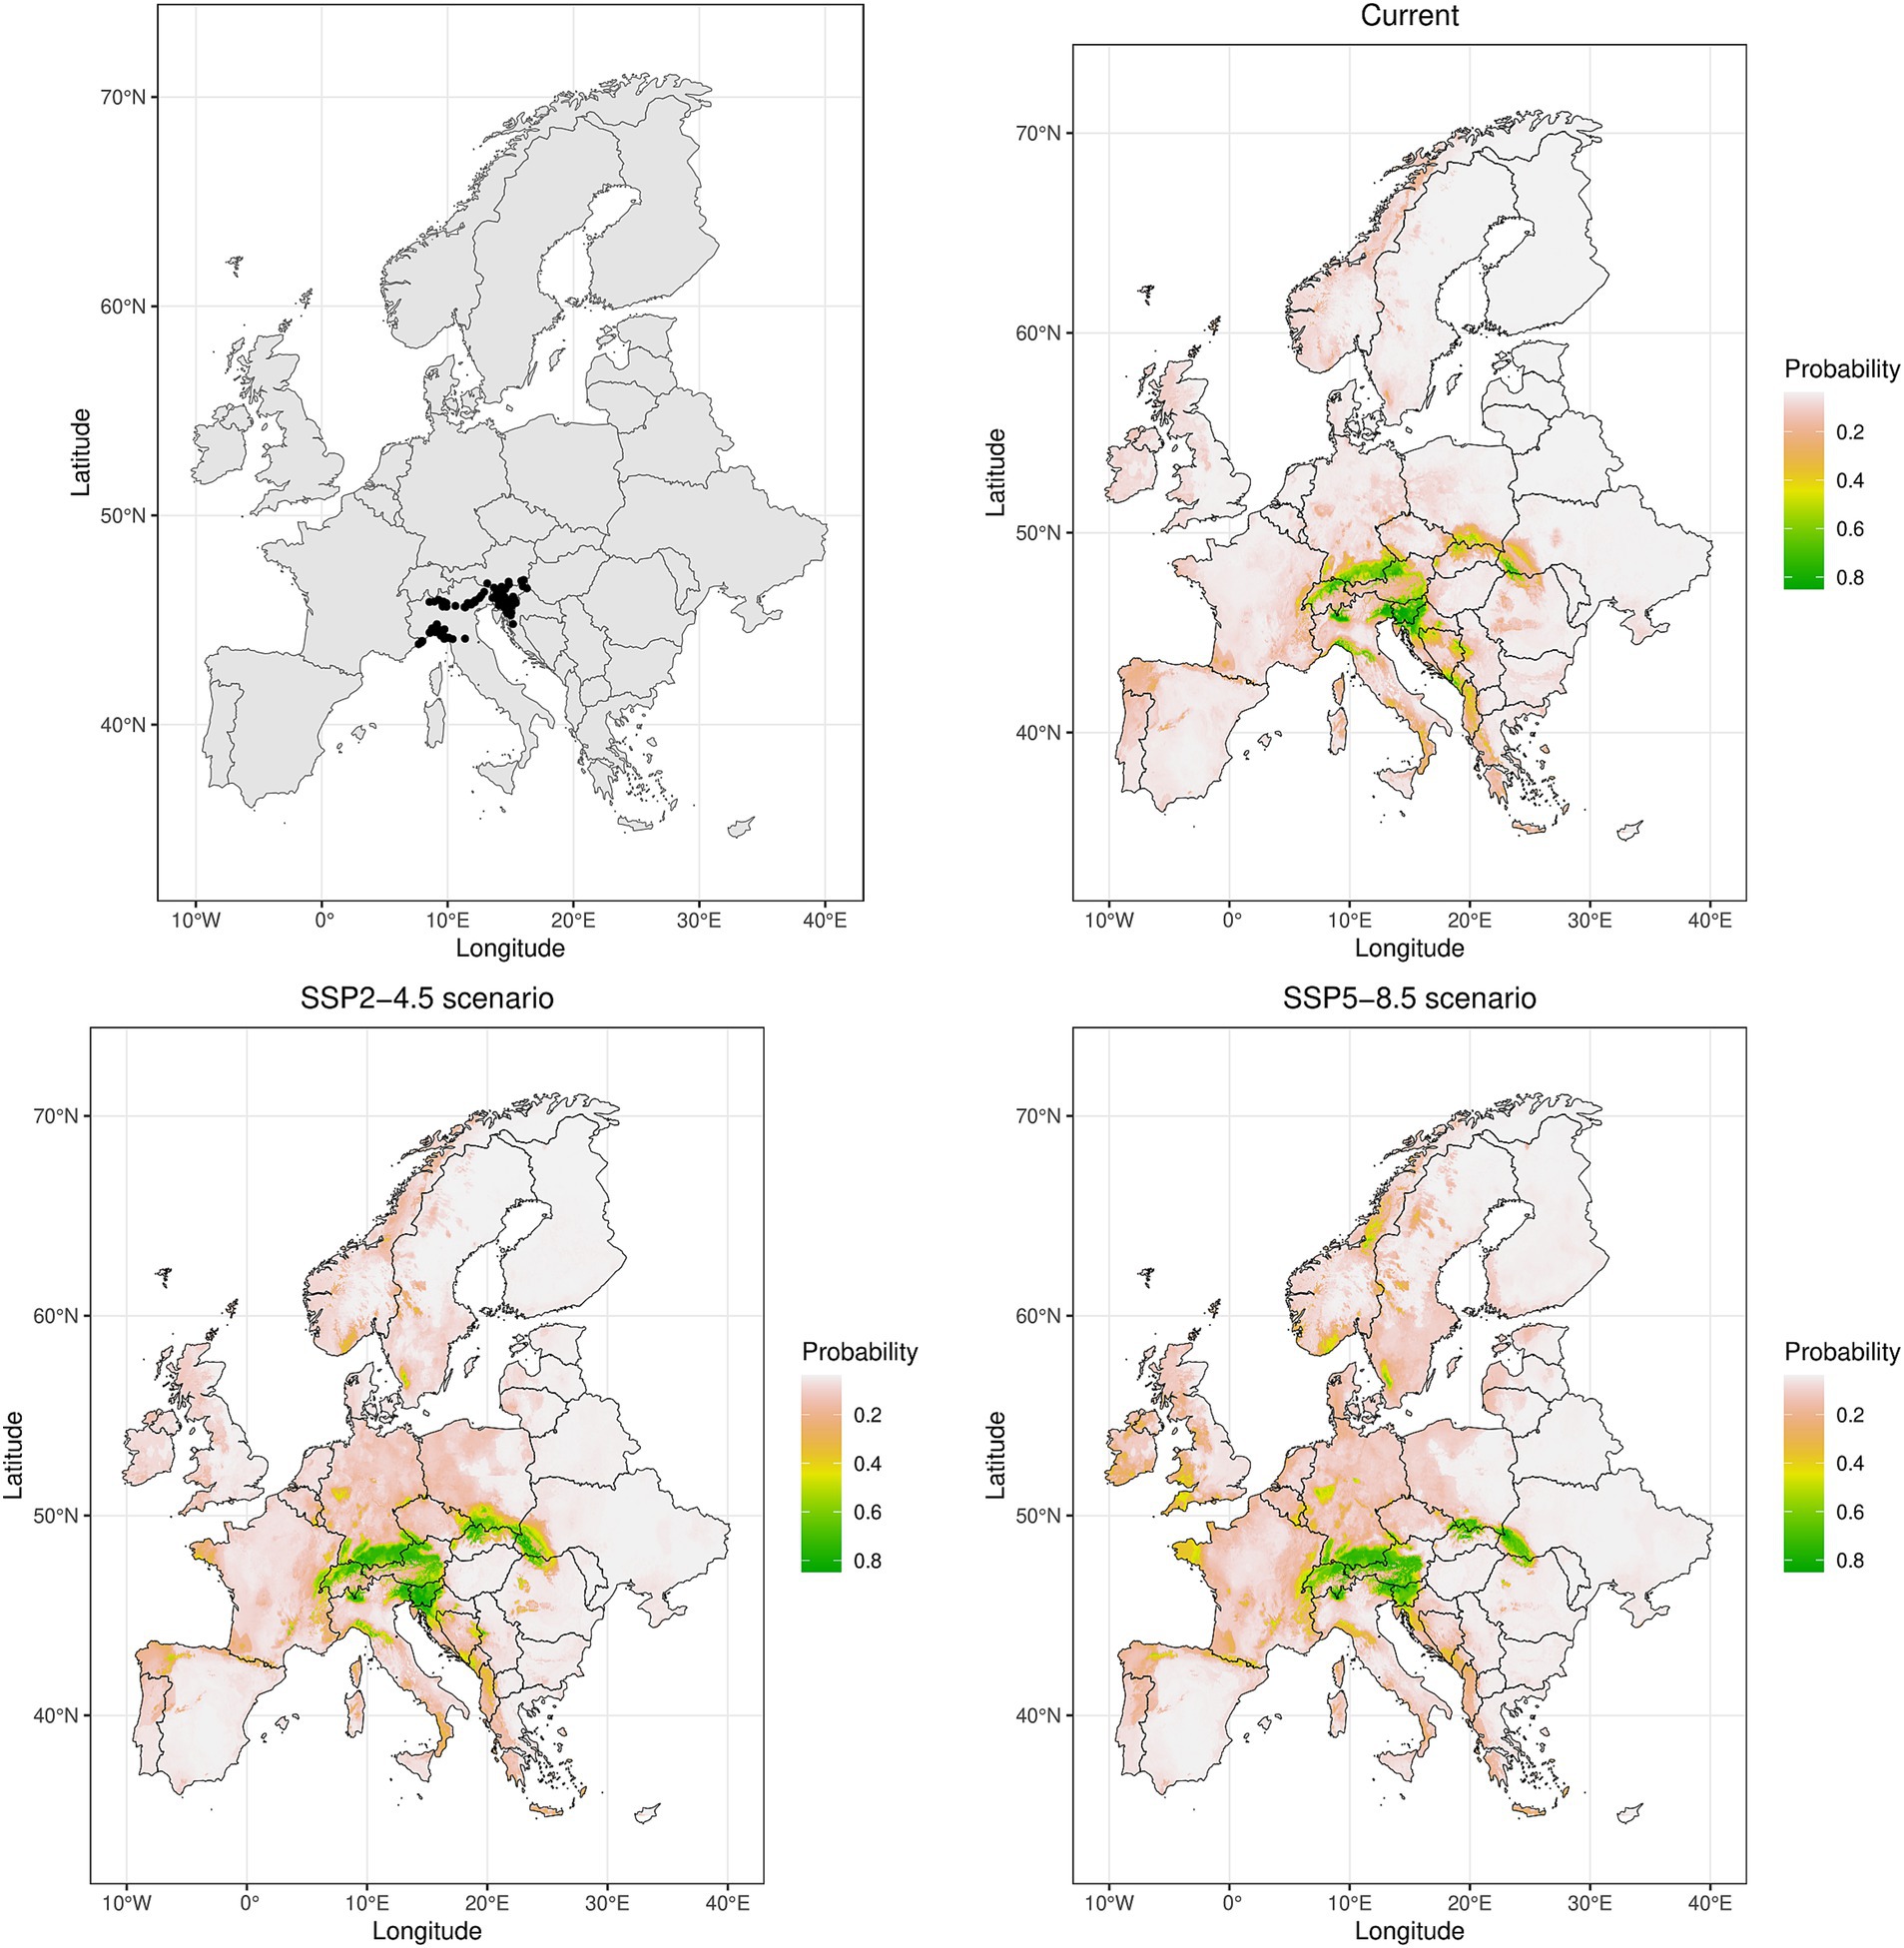
Figure 4. Spatial maps showing the locations of used occurrence records (n = 191) and ensemble model predictions with current distribution (1970–2000) and potential future (2070s) ranges under the two climatic scenarios (SSP2-4.5 and SSP5-8.5), expressed as probability of occurrence for Omphalodes verna, a narrow-ranged beech forest herb present in 8 regions (operational phytosociological units) according to Willner et al. (2009).
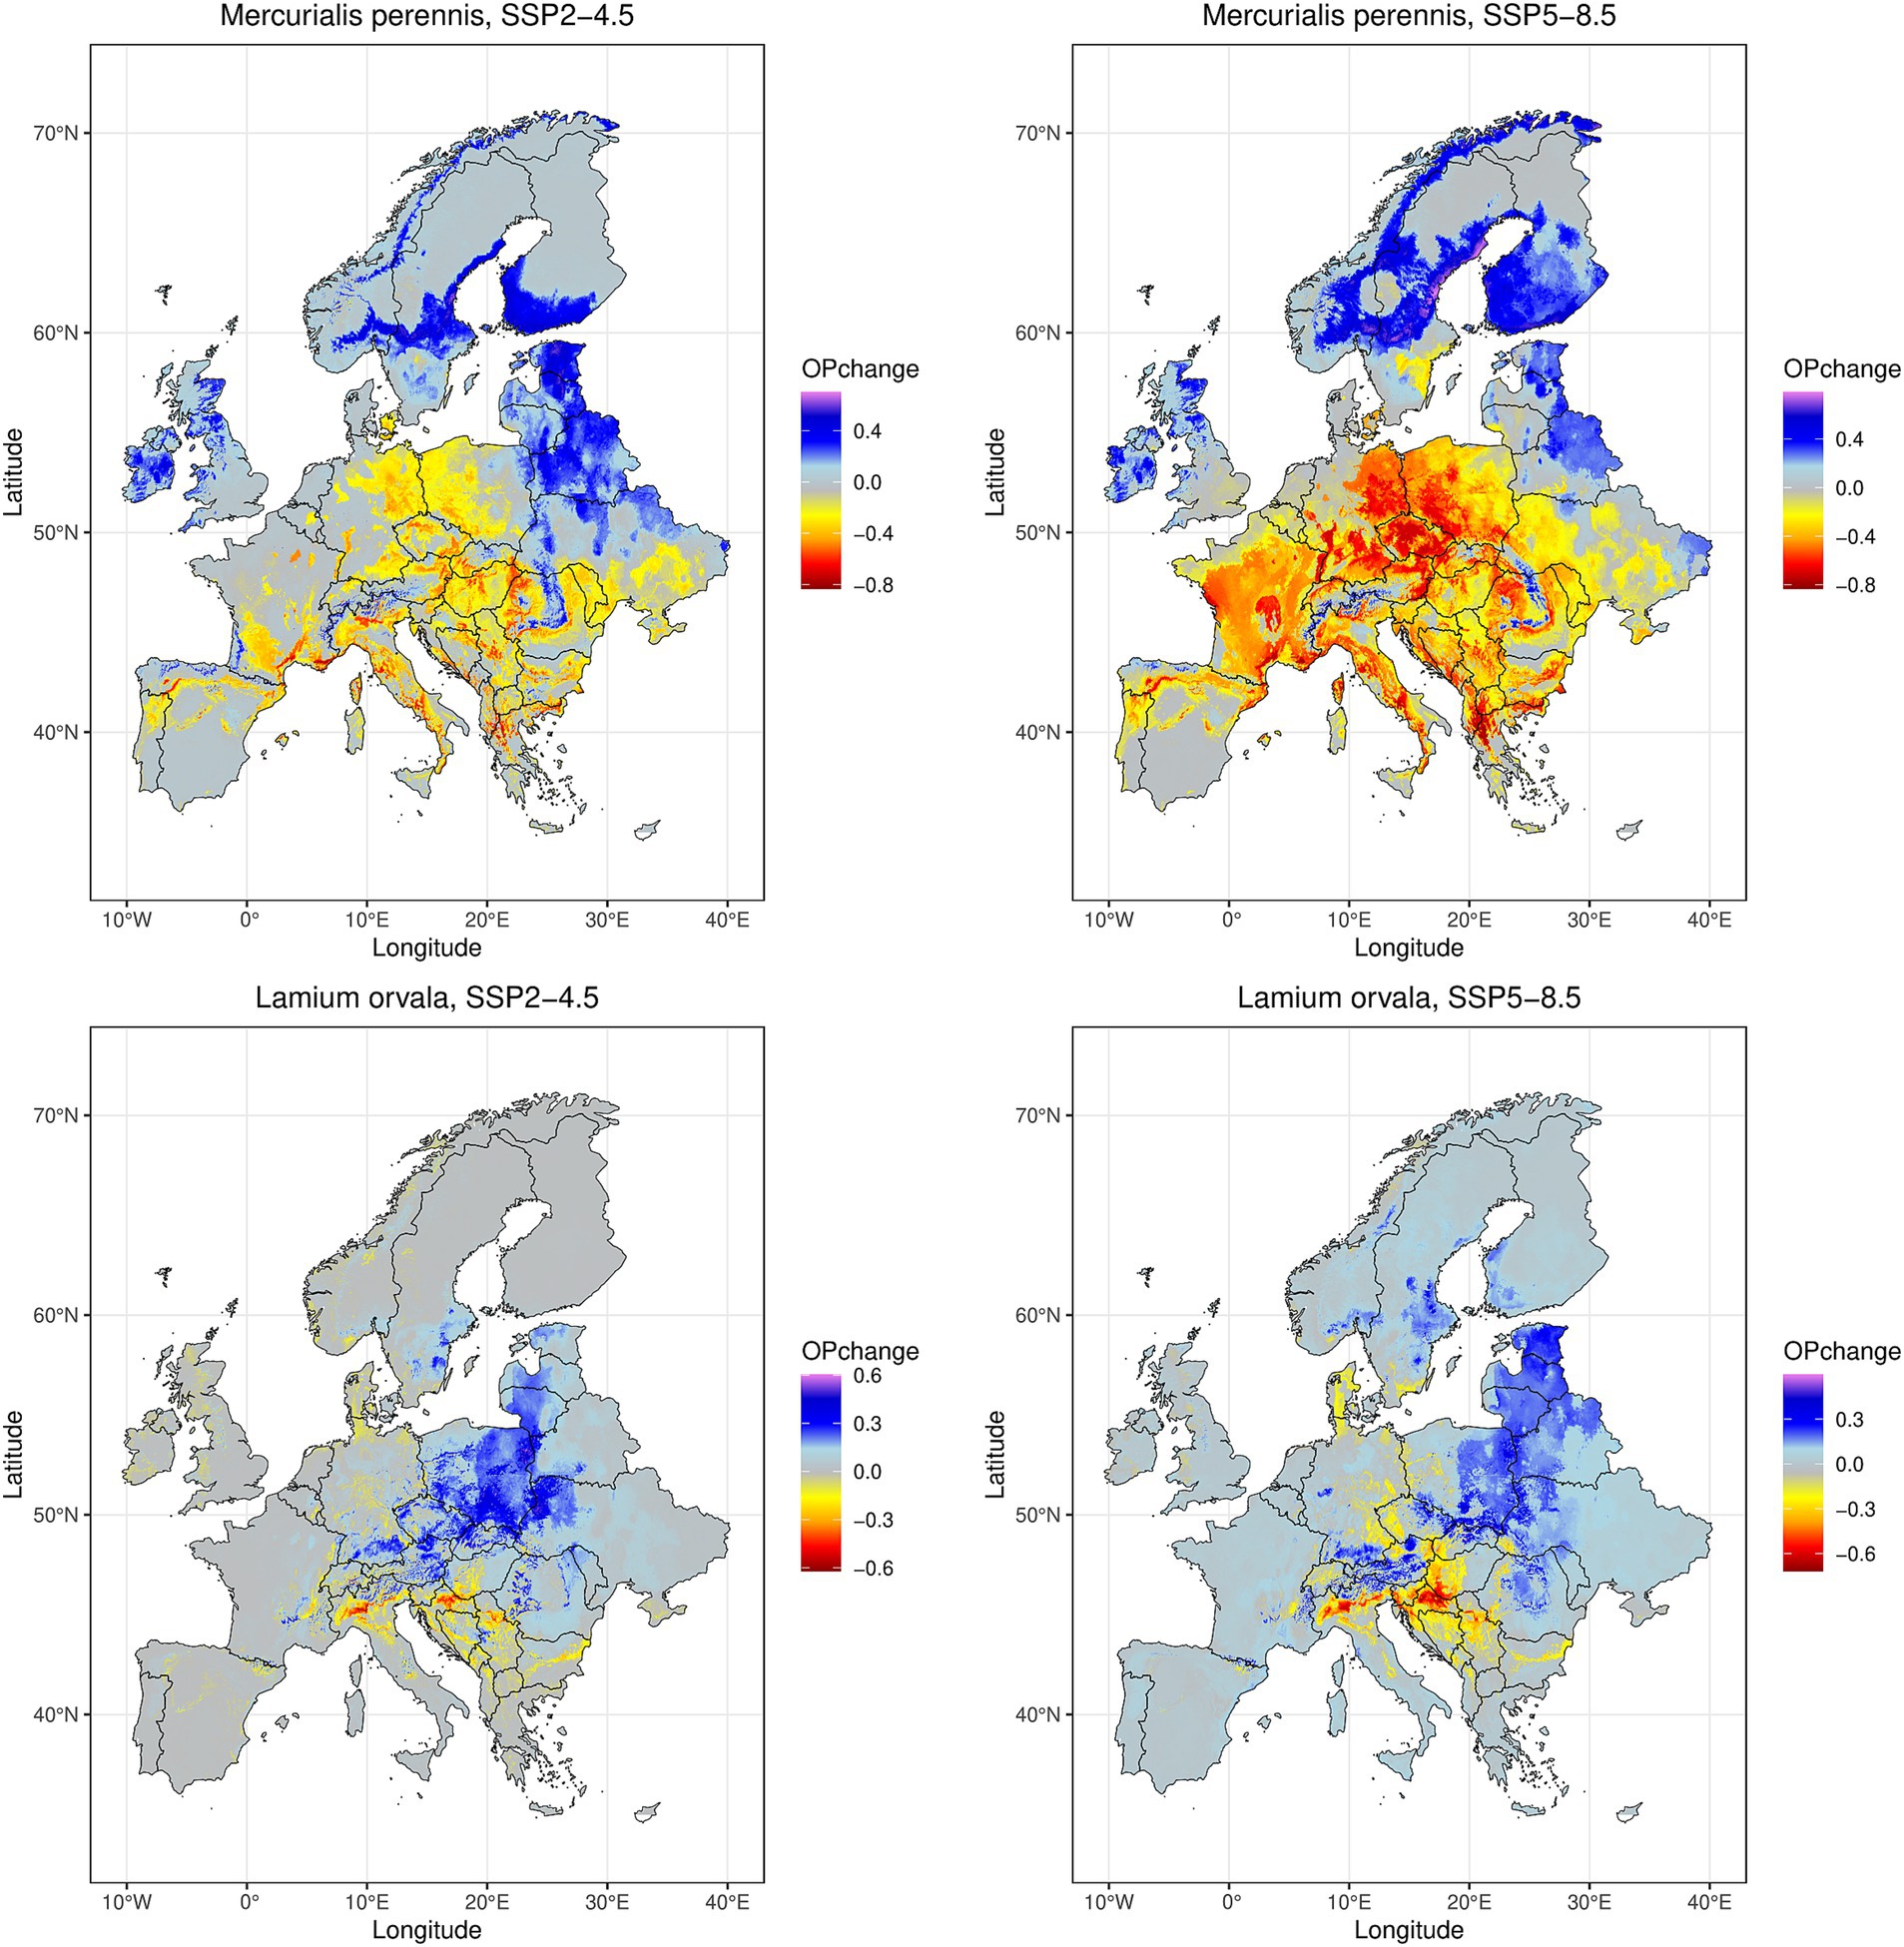
Figure 5. Changes in modeled future (2070s) climatic suitability relative to the current suitability under two different climate change scenarios (SSP2-4.5 in left column and SSP5-8.5 in right column) for a widespread beech forest species Mercurialis perennis (present in 40 regions, top row) and a narrow-ranged herb Lamium orvala (present in 5 regions, bottom row). OPchange = change in occurrence probability.
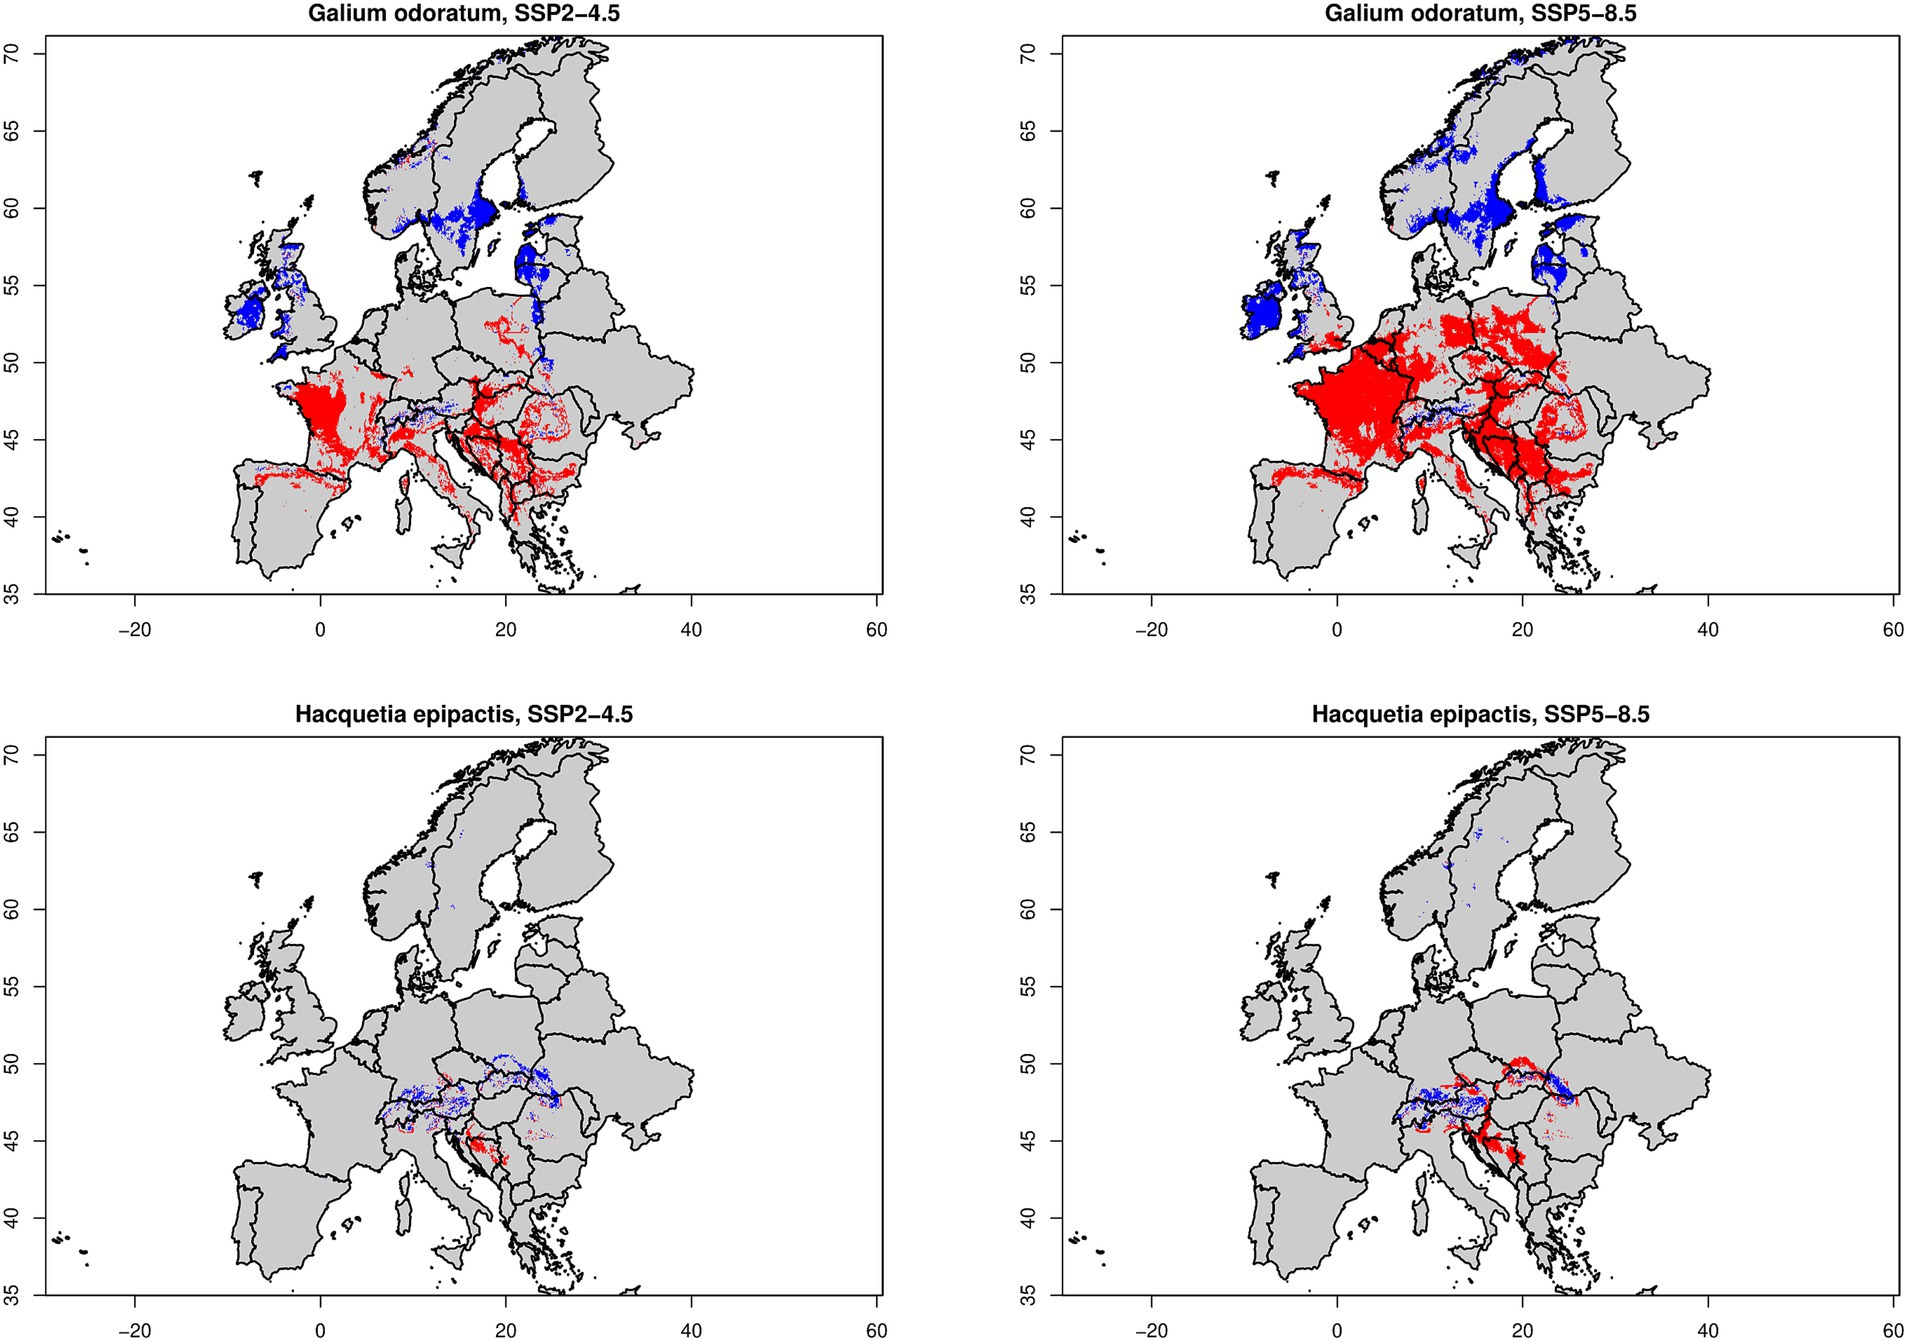
Figure 6. Modeled losses and gains for widespread beech forest species Galium odoratum (top row) and for narrow-ranged species Hacquetia epipactis (bottom row) according to two climate change scenarios (SSP2-4.5 in left column and SSP5-8.5 in right column). Red colour corresponds to lost areas (i.e., current occurrence probability is higher than occurrence threshold [Galodo = 0.767, Hacepi = 0.339] but future OP is below this threshold value) whereas blue colour represents gained areas (i.e., current occurrence probability is lower than OT but future OP is above this threshold value).
The distribution patterns of selected forest herbs under the current climate were only partly in agreement with the actual occurrence records (see examples for Sanicula europaea, Cardamine enneaphyllos and Vicia oroboides reported in Supplementary Figure 3). This suggests that there are climatically suitable areas in Europe not yet occupied by studied species. The discrepancy between modeled potential range and observation-derived realized distribution was generally larger for narrow-ranged species than for widespread species (Supplementary Figure 3).
For majority of species, the projected loss of climatic suitability was most severe in the Mediterranean, more continental south-eastern (Balkan Peninsula) and also central Europe, whereas habitat gains were most prevalent in the northern (Scandinavia), north-western (the British Isles) and north-eastern (Baltic countries) parts of Europe (Figures 3–6). For some species, even high-latitude boreal Fennoscandia were forecasted to meet the criteria of their climatic optimum. When such changes in range centroids of the more suitable areas (probability of occurrence > OT) were quantitatively analyzed, we observed that without exception, all selected species are predicted to shift their ranges northwards. The latitude of the distributional centroid shifted 132.0 ± 67.7 km (mean ± stand. deviation) northwards under the SSP2-4.5 scenario and 294.5 ± 166.9 km under the SSP5-8.5 scenario. Longitudinal shifts of ranges were evidently less consistent. For 40 out of 71 species, distributional centroid is predicted to move to more Atlantic regions under the SSP2-4.5 scenario and westward shift is likely to happen for 49 species under the SSP5-8.5 scenario. Latitudinal range (the difference between northern and southern distributional limits) was predicted to shrink on average by 4.6% (SSP2-4.5) and by 9.6% (SSP5-8.5). Longitudinal range (the difference between western and eastern distributional limits) will on average increase or remain about the same for 42 and 40 species under SSP2-4.5 and SSP5-8.5, respectively.
In the case of SSP2-4.5 scenario, the mean latitude of gained areas was 52.9 ± 2.7° (mean ± stand. deviation across all species) and the mean latitude of lost areas was 46.4 ± 1.2° (Figure 7). The mean longitude of gained areas was 12.1 ± 3.8° and the mean longitude of lost areas was 13.1 ± 2.6°. For SSP5-8.5 scenario, the mean latitude of gained areas was 55.3 ± 3.8° across all species and the mean latitude of lost areas was 47.4 ± 1.0° (Figure 7). The mean longitude of gained areas was 10.1 ± 4.5° and the mean longitude of lost areas was 12.5 ± 2.8°. This means that gained areas were on average located 721 km (SSP2-4.5) and 877 km (SSP5-8.5), respectively, more toward north of Europe compared to lost areas. These differences between gained and lost areas in latitude were highly significant for both climate change scenarios (Wilcoxon test value of p <0.001) but not in case of longitude due to high variability among species (future climatic suitability shifted either westward or eastward).
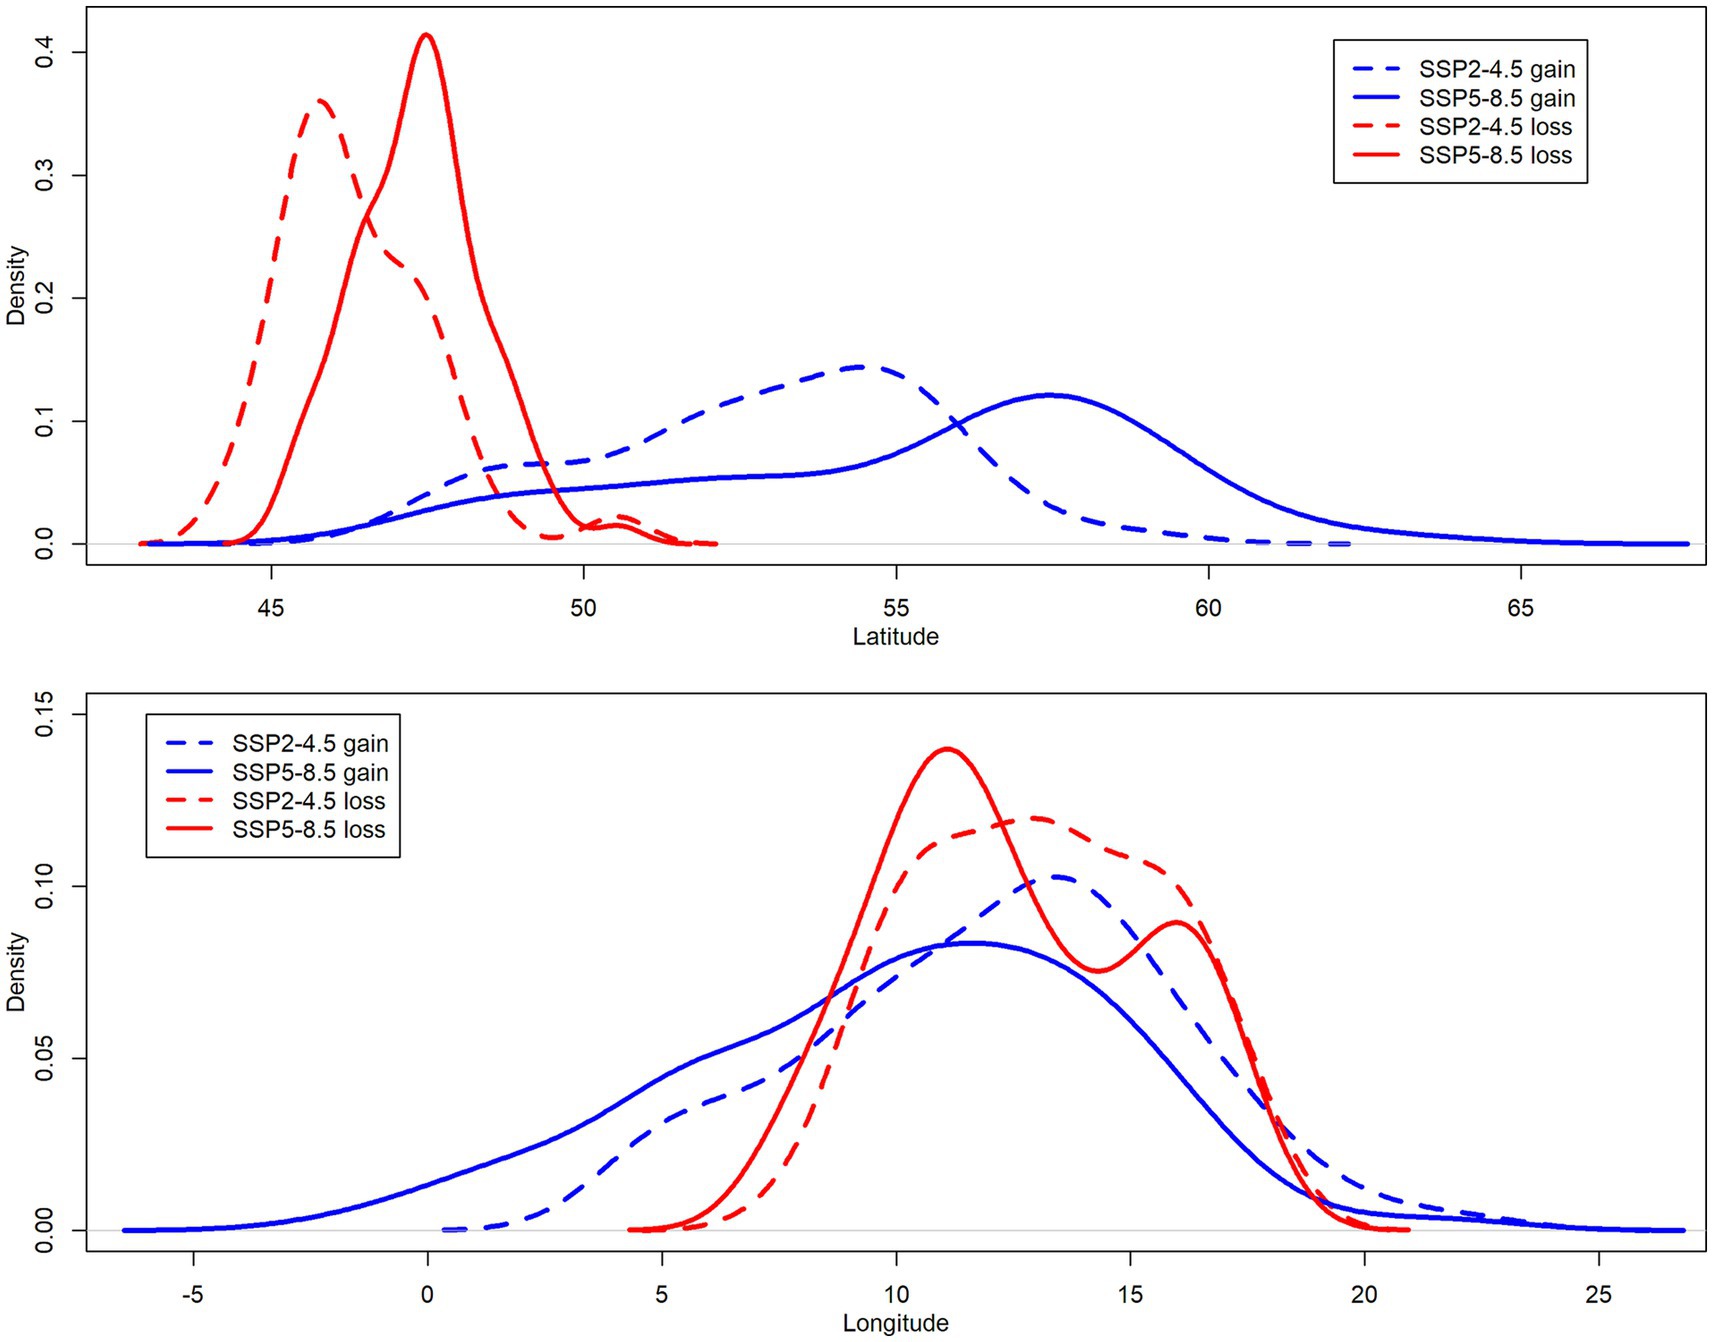
Figure 7. Density plots derived from kernel density estimation for gained (blue) and lost (red) areas along latitudinal (top panel) and longitudinal (bottom panel) gradient. Line type denotes climate change scenario; dashed line for SSP2-4.5 and solid line for SSP5-8.5. All density curves are based on averaged values (centroids) extracted from SDMs for 71 beech forest plant species.
Gained and lost areas for selected species differed also in terms of elevation. For SSP2-4.5 scenario, the mean elevation of gained areas across the entire study extent was 424.1 ± 213.2 m and the mean elevation of lost areas was 521.5 ± 139.4 m. For SSP5-8.5 scenario, the mean elevation of gained areas across the entire study extent was 497.4 ± 295.8 m and the mean elevation of lost areas was 481.6 ± 122.8 m. However, when the study area was split into two belts (high latitudes above 50° vs. low latitudes below 50°), clear differences in elevation appeared (Figure 8). At high latitudes, elevations of gained and lost areas were quite similar (i.e., ranging from 200 to 300 m). In contrast, gained areas at low latitudes exhibited much higher elevations compared to lost areas. In the case of SSP2-4.5 scenario, the mean elevation of gained areas reached 928.5 ± 253.0 m whereas the mean elevation of lost areas was 560.7 ± 145.2 m. For SSP5-8.5 scenario, the mean elevation of gained areas reached 1362.8 ± 429.6 m but the mean elevation of lost areas was much lower (548.1 ± 110.4 m; Figure 8). These elevational differences between gained and lost areas were highly significant for both climate change scenarios (Wilcoxon test value of p <0.001).
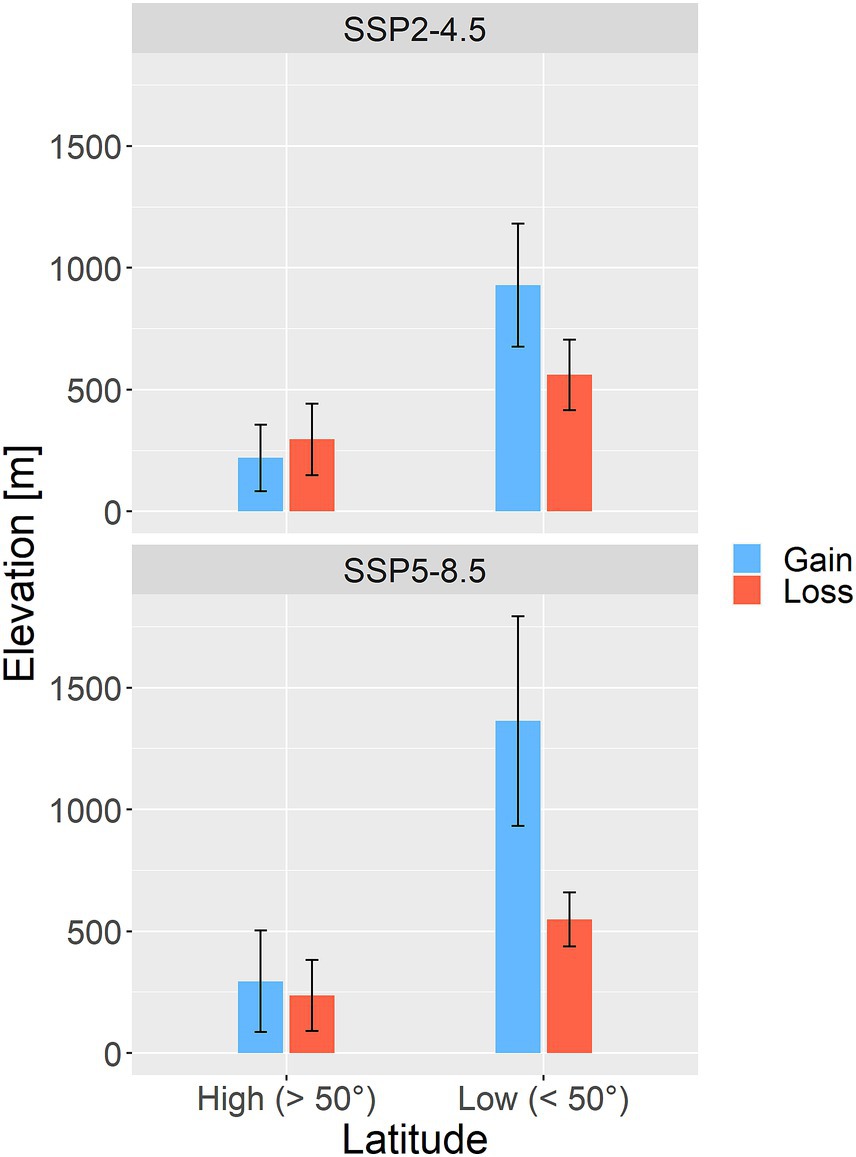
Figure 8. Elevation of gained (blue) and lost (red) areas, separately for high latitude belt (> 50°) and low latitude belt (< 50°). Upper panel is for SSP2-4.5 scenario and bottom panel represent SSP5-8.5 scenario. Bars represent mean value and error bars represent standard deviation.
The gain/loss ratio showed significant response to the “Regions,” which is a biogeographic attribute and a proxy for areal size. Narrow-ranged species had in general higher gain/loss ratios compared to more widespread species (Figure 9), a pattern that can be partly inferred from previous outputs (see Figures 1, 2). In the case of SSP5-8.5, the relationship changed more toward a U-shaped curve, suggesting that the lowest gain/loss ratio was experienced by species with intermediate areal sizes. The explanatory variable representing amount of precipitation during the growing season (GS Psum) was negatively correlated (Spearman rank correlation: −0.75, value of p <0.01) with the attribute Regions and hence excluded from the final generalized additive model. There was also a tendency for more thermophilic species (taxa from warmer climates with higher GS Tmean values) having higher gain/loss ratio, but this relationship was not statistically significant (Figure 9).
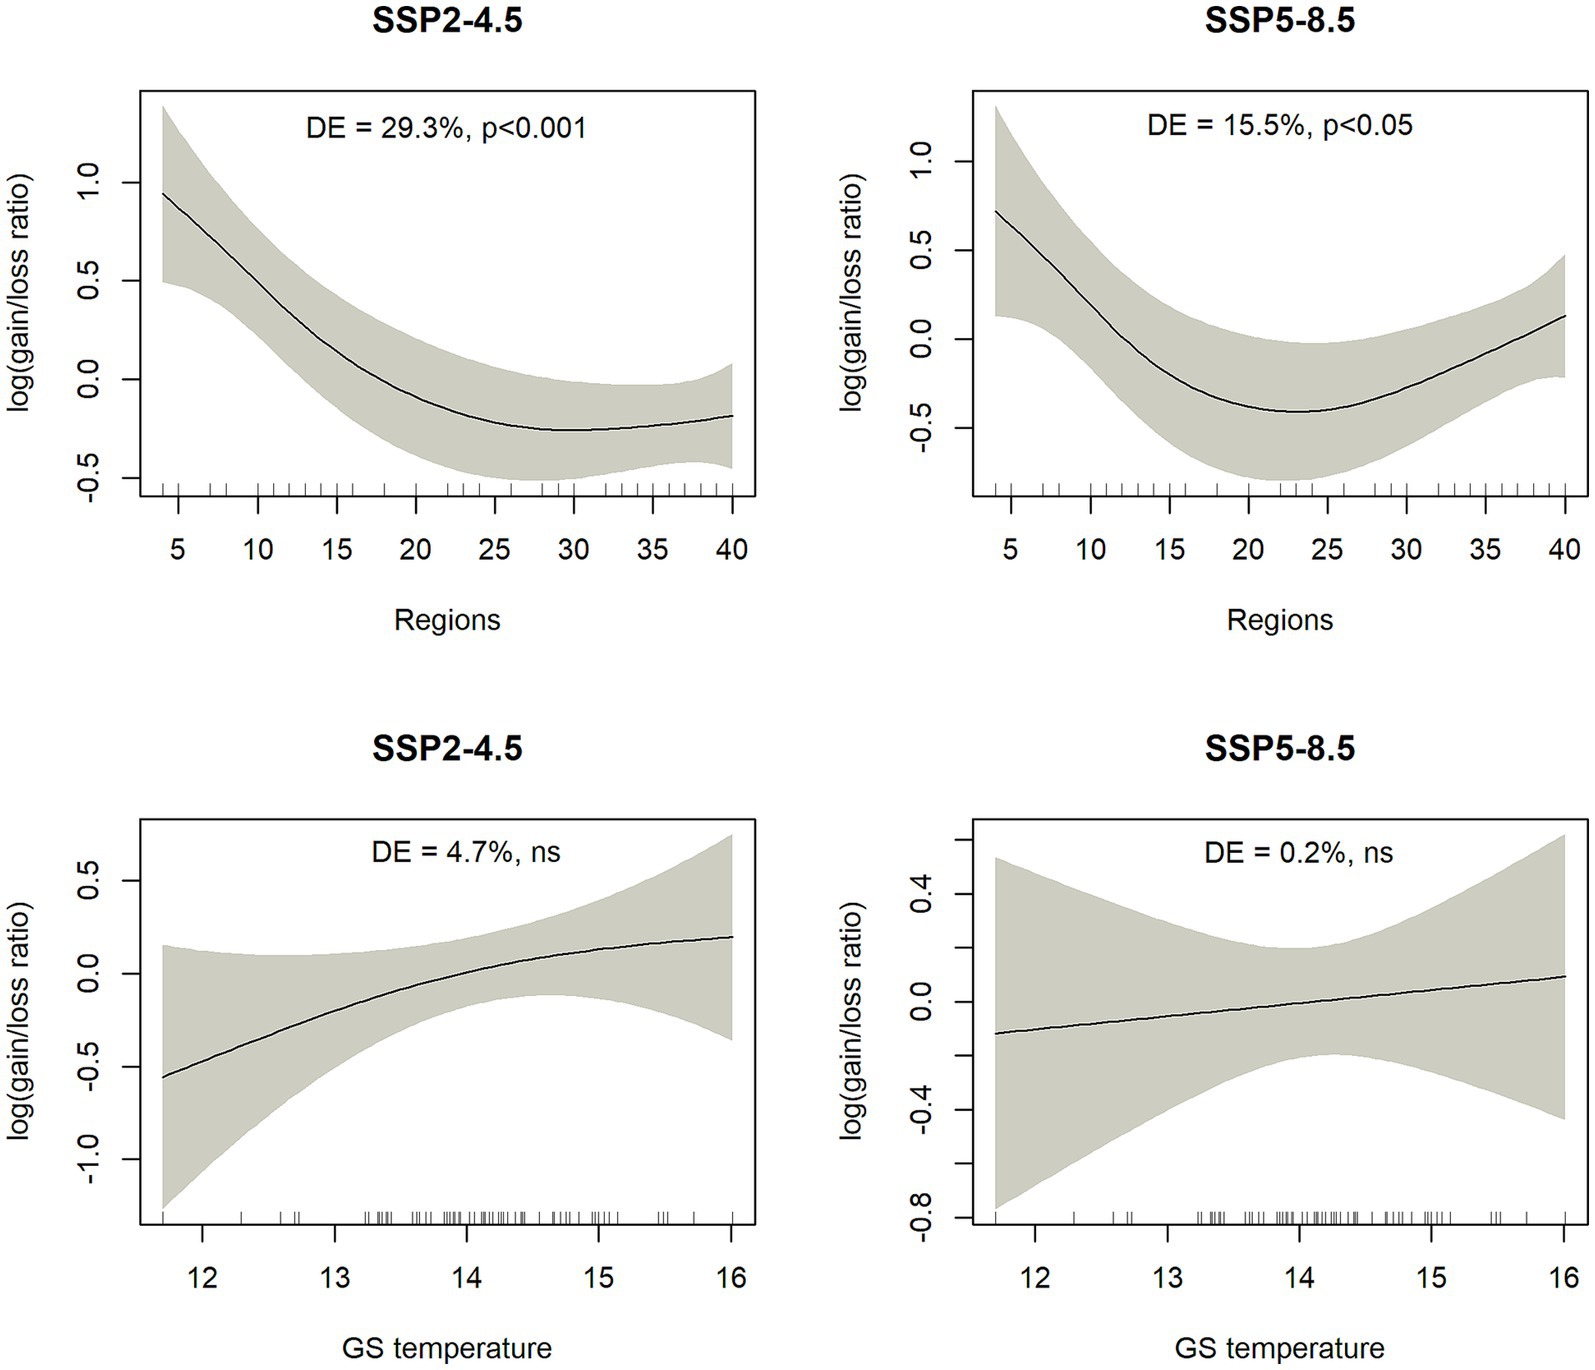
Figure 9. Outputs of generalized additive models describing the relationship between log-transformed gain/loss ratio and one attribute related to biogeography (Regions, a proxy for areal size) and one to climatic niche (GS temperature = mean temperature during growing seasons). A positive gain/loss ratio means that species is predicted to gain more area compared to lost area. The left column is for SSP2-4.5 scenario and the right column is for SSP5-8.5 scenario. DE – % deviance explained by the generalized additive model.
Global climate change may cause species to become poorly matched to their environments, potentially inducing shifts in the distributions of populations and altering species’ geographic ranges. This study addressed potential impacts of climatic change on the distribution of beech forest plant species in Europe. Both scenarios (SSP2-4.5 and SSP5-8.5) showed that future climate change will overall decrease the availability of potential climatic niches. We show that in general, future climate is predicted to become less suitable for beech forest plant species within a period of ~50 years. Changes in climatic suitability were of higher magnitude in case of SSP5-8.5 scenario whereas less severe changes in magnitude and direction were projected by application of the SSP2-4.5 scenario. Although many of analyzed species frequently co-occur in beech-dominated communities and records used in modelling showed some degree of overlap, our results suggest relatively high idiosyncratic responses of individual species to climate change projections, which might be related to differences in biogeography, functional traits and phylogeny.
For 26 forest herbs found across Europe, Skov and Svenning (2004) reported high variability in the response of plant species to climate change scenarios. The predicted effects spanned from almost complete range elimination to substantial gains in climatically suitable areas. This finding is in agreement with our results and points to the importance of evaluating species responses individually. The divergent response of forest herbs to climate change was also documented by Sanczuk et al. (2022b) and Puchałka et al. (2023b). Studied species may respond differently to climate change despite similar current distributions and climatic variables affecting their potential distribution. Compared to previous studies (e.g., Skov and Svenning, 2004), our research entails a large number of beech forest species with varying size of geographic range. This study does not go beyond the standard application of SDMs to uncover new patterns that govern range shifts of beech forest herbs, but it is an improvement in terms of species coverage compared to similar other studies. The substantial number of selected species (71) moved our study from descriptive to exploratory. It also uses a more analytical approach by quantifying magnitude and direction of future range shifts in relation to climatic niches of selected species. Moreover, we applied an ensemble technique with several different SDM methods, and we used a combination of different global climate models.
For the majority of selected forest plant species, SDMs showed that potential climatic range is larger than their current natural distribution. The current suitability models have captured not only the areas currently occupied by species but also the potential habitats having similar climatic conditions at present that are likely to support their populations. Plant taxa that are predicted to experience the greatest proportional losses in their climatically suitable area within their currently realized range tend to be more narrow-ranged herbs. Species vary a lot in the degree to which they occupy present climatically suitable areas in Europe. Many forest species are absent from large areas with suitable climate and thus could be said to have poor range-filling capacity (Skov and Svenning, 2004; Erlandson et al., 2021). Svenning et al. (2008) demonstrated that many plant species native to the nemoral European understory fill only part of their potential range, explained by dispersal limitation since the last glacial maximum. These patterns reflect the fact that glaciation had major influence on distribution and that some of selected beech forest plant species are poor dispersers with low colonizing ability.
The projections of the ensemble SDMs suggested that gained areas are expected to be located at higher latitudes and toward high-elevation regions. A decrease in potential climatic suitability is especially profound at species warm range margins (southern Europe). The potential range is likely to also become greatly more fragmented and only a few isolated suitable areas will remain at latitudes below 50°. The pattern of responses to future climate change was similar among species with a predominantly widespread distributional range. There were declines in suitable habitats at the southern range edge (Mediterranean and adjacent temperate regions) and simultaneous expansions into the northern Europe (nemoral and boreal Fennoscandia, British Isles). Mountains (Alps, Carpathians) maintained or increased in predicted climatic suitability for most plant species. However, this was not true for Dinaric Mountains as majority of taxa showed significant decline in this area. Climate models predict that the Mediterranean region will experience a particularly marked increase in aridity during the 21st century when compared to other regions. Increasing summer droughts likely reduce the vitality of more mesophilous taxa.
This generally confirms hypothesized spatial shifts in climatic suitability and is supported by similar trends documented by Skov and Svenning (2004). However, the longitudinal shifts in their study suggested a more eastern tendency whereas range centroids of climatic suitability of more than half of beech forest herbs in our case are expected to move toward west. This can be partly explained by the more mesophilous character of beech forest herbs, preferring a more oceanic climate with less oscillations in climatic parameters.
Our results point to differential range changes under future climate scenarios. Comparison between two future scenarios (moderate SSP2-4.5 and severe SSP5-8.5) reveal that differences were mainly in the magnitude of response of species whereas direction of response was relatively similar for majority of analyzed parameters (distribution patterns, latitudinal and elevations shifts). In general, changes in predicted climatic suitability were more drastic in the case of SSP5-8.5 scenario. All species studied are predicted to experience more range losses under more pessimistic scenarios. This is in line with the study of Puchałka et al. (2023b). Under SSP2-4.5 scenario, few species might even increase OP in the future, indicating that moderate climate warming could be beneficial for some species and expand the potential range of beech forest herbs. In contrast, for SSP5-8.5 scenario, all studied species experienced significant reductions (52.9% on average) in the total size of climatic highly suitable areas (OP >0.75), suggesting that extreme climate change is likely to bring notable range shrinkage. This result provides additional evidence that too high temperatures are not suitable for forest herbs, an observation consistent with previous analyses. Interestingly, we found that plant attributes were better predictors of modeled shifts in OP for moderate scenario (Figure 9). This could indicate that under more severe scenarios, characteristics of species might be less important because extreme climate changes have the ability to disrupt established species-environment relationships.
Our analysis suggests that the magnitude of change in climatic suitability might depend on biogeographic attributes and realized climatic niches of investigated species. Species that were predicted to experience the greatest proportional gains in their climatically suitable area, are concentrated in the southern and south-eastern part of beech forest distribution (e.g., Epimedium alpinum, Hieracium transylvanicum, Omphalodes verna). The predicted increase of narrow-ranged species might be linked to their low range-filling capacity (suitable habitats are not occupied due to dispersal limitations). Skov and Svenning (2004) also reported that some species with low ratio between realized and potential suitability might respond with increased probability of occurrence in the future.
Species with greater dispersal ability, reproductive rate and wider ecological niches should be more likely to expand into new regions under climate change. By comparing gained and lost areas of the modeled raster layers, we observed that some (but not all) range-restricted plant species are likely to gain more suitable climate space by 2070s, while for widespread species losses generally exceeded gains in climatic suitability. One might conclude that narrow-ranged species will benefit more compared to widespread species. However, such conclusions should be interpreted with caution. In fact, we suggest that narrow-ranged species are likely to be more vulnerable to climate change due to a high mismatch between places where species are currently present and places where they can thrive in the future. Specifically, substantial geographic disjunctions are likely to develop between the locations of many small-ranged species’ current ranges and the locations of climatically similar areas in the future. Such disjunctions between present and future habitat areas are less likely for widespread species, where at least some portions of these broadly distributed species’ ranges are likely to remain climatically suitable into the future, buffering against climate-driven threats. Range contraction of forest herbs, coupled with habitat fragmentation, will increase their risk of extinction.
The dominant bioclimatic variables governing the potential distribution of selected species were precipitation of warmest quarter (BIO18) and temperature seasonality (BIO4). Puchałka et al. (2023b) similarly found high dependence of geographical distribution patterns of spring geophytes on the precipitation of warmest quarter. BIO4 > 700–750 indicated strongest decline in OP for most of the species and BIO18 200–300 mm suggested steepest increase in OP according to the response curves. However, the relative importance of bioclimatic predictors differed between widespread (BIO4 was more important) and narrow-ranged species (BIO18 had overall larger contribution). The higher importance of temperature seasonality for widespread species confirms that increased climatic seasonality seems to be more important as a limiting factor at the northern border of the current distribution (species sensitive to frost) and widespread species might suffer more with changes in continentality and higher seasonality. Conversely, narrow-ranged and Illyrian species with southern distribution midpoint are presumably more demanding in terms of summer precipitation and thus more influenced by summer droughts. This could potentially explain their divergent repose to climate change scenarios because global circulation models used in our study predict more severe changes in temperature (warming and increase in seasonal and yearly fluctuations) compared to precipitation regimes. Summer droughts in the future may be particularly severe for species that prefer moist soils (Puchałka et al., 2023b).
The observed dichotomy between generalist widespread forest herbs vs. narrow-ranged herbs, with more strict traits, is one of the core findings of our study. It offers a practical recommendation for future simulation and empirical research which should investigate whether species’ responses to climate change will be modulated by different biogeographic attributes or strategies of adaptation (e.g., annual vs. perennial species, specific plant life forms such as geophytes).
All studies based on SDMs are inherently associated with several sources of uncertainty and some degree of data limitations. The difficulty of projecting range dynamics for rare plant species is scarce occurrence data, which might decrease accuracy of SDMs. In this study, we present quantitative analysis of possible changes in geographic distribution of climatic suitability across Europe, i.e., probability of occurrence was modeled exclusively based on bioclimatic predictors. Therefore, our results should not be interpreted as actual changes in ranges of the species but strictly in terms of potential realized (macro)climatic niches. Furthermore, we did not include any other explanatory variables (e.g., soil, topography, land cover) as projecting them together with the future climate layers may influence model performance and reliability of modelling outputs (Thuiller et al., 2005). More accurate predictions of species responses to future climate change could be obtained by integrating dispersal ability and habitat fragmentations (Dullinger et al., 2015; Van Daele et al., 2021).
Models predicted high degree of displacement between currently occupied areas and climatically suitable sites in the future. This means that forest herbs will have to migrate toward north and/or higher elevation in response to climate change. However, the capacity of forest herbs to track rapid climate change via geographic range shifts has been repeatedly questioned (Honnay et al., 2002; Beauregard and de Blois, 2016). Forest herbs have evolved certain traits that make these species more adapted to local persistence than to disperse in space. Selected species are typically perennial shade-tolerators, with long life cycles and seed dispersal mechanisms adapted primarily to local movement rather than long-distance dispersal (Van der Veken et al., 2007). Seeds are heavy and frequently have no appendages fostering regular wind or zoochorous dispersal, except for short-distance ant dispersal via elaisomes (Willner et al., 2023) This is true for both widespread and narrow-ranged plant taxa. Various phytosociological evidence suggested that the current distribution ranges of European forest understorey species bear signs of migration lags and incomplete range filling (Skov and Svenning, 2004; Svenning et al., 2008; Willner et al., 2009; Jiménez-Alfaro et al., 2018; Willner et al., 2023). Another important determinant of the distribution of beech forest plant species is the calcium content of the bedrock and associated soil pH. Large areas with acidic bedrock as found in many parts of central, nemoral and boreal climatic zones might pose strong barriers for the northward migration of basophilous forest herbs (Willner et al., 2023). Flat regions found in central and northern parts of Europe with extensive areas of moist soil might pose migration barriers for species adapted to well-drained slopes, even if they were climatically suitable. Biotic interactions (competition) can function as a filter that structure range limits of species (Sanczuk et al., 2022b).
As slow-colonizing forest understory plants are probably not able to rapidly adjust their distribution range following large-scale climate change, the acclimation potential within their actual occupied habitats will likely be key for their short- and long-term persistence (De Frenne et al., 2011). In this context, in situ adaptations of species climatic tolerances is assumed to depend on (i) phenotypic plasticity (intraspecific trait variability) fostering local adaptations for greater persistence and colonization capacity and (ii) microclimatic buffering that may strongly mediate the effects of macroclimate warming. Tree canopies function as a thermal insulator, cooling the understory when ambient temperatures are hot and warming when ambient temperatures are cold (De Frenne et al., 2011; Macek et al., 2019; Richard et al., 2021). It has been recently shown that macroclimate data tend to overestimate range shifts of plants in response to climate change (Maclean and Early, 2023) and that extinction risk from climate change is reduced by microclimatic buffering (Suggitt et al., 2018). However, large-scale forest disturbances have the ability to greatly reduce such effects. Large canopy gaps created by natural or anthropogenic forest disturbances are usually characterized by high vapor pressure deficits. Such situations accompanied with low water-storage capacity of the soil in karst habitats on carbonate bedrocks in many parts of Alps and Dinaric Mountains may be particularly unfavorable environments for natural beech regeneration (Kermavnar et al., 2023) and mesophilous forest herbs sensitive to extreme summer heat and drought (Leuschner and Lendzion, 2009).
On the positive note, buffering effect might be particularly important in mountainous landscapes with high topographic complexity (Rota et al., 2022). Greater topographic heterogeneity can substantially reduce extinction risk from climate change (Suggitt et al., 2018) Microrefugia (e.g., karst dolines; Kermavnar et al., 2021; Bátori et al., 2023) with locally suitable conditions might potentially sustain plant populations even in areas that were predicted as unsuitable. Such effects will play pivotal role in the peripheral southern distribution populations of Fagus sylvatica, especially in the southern European Peninsulas. As outlined by De Lombaerde et al. (2022), we emphasize the critical role of maintaining tree layer canopy cover and specific landforms in karstic terrain for potential mitigation effects under future climate change.
This work illustrates idiosyncratic responses of beech forest species to changing climatic conditions and how the geographic region occupied by a species may be important for predicting shifts in future climatic suitability. Herb-layer plant diversity of European beech forests may be negatively affected by climate change, especially at lower latitudes. Global warming threatens conservation status of beech forest habitat types because many of studied species could lose substantial areas of their range due to climate change. For beech forest herbs, migration will be an important part of the adjustment to a warmer climate, but realization of these potential migrations will require both rare long-distance dispersal events and habitat that is suitable in non-climatic dimensions (e.g., edaphic conditions). Modeled range shifts are certainly beyond necessary rates of migration for most species. Thus, in the next steps, ensemble SMDs could be parameterized with a range of climatic, land use and soil variables.
The results of this study highlight the urgent need for forest management strategies to conserve the habitats of these species by applying less intense, small-scale silvicultural interventions that can preserve forest microclimate. Our study offers baseline information on the impact of climate change on species which can aid in guiding adaptation strategies for forest conservation and management in order to sustain the most diverse part of beech forest vegetation in the future. We recommend that the most promising strategies for safeguarding plant diversity in beech forests are to limit the magnitude of climate change and to reduce other pressures that additionally threaten their survival via appropriate forest management practices.
The original contributions presented in the study are included in the article/Supplementary material, further inquiries can be directed to the corresponding author.
JK, LK, and AM conceived the research and obtained the funding and administrated the project. JK collected the data and analysed the data. LK and AM supervised the work. All authors contributed to the writing of the manuscript. All authors contributed to the article and approved the submitted version.
This study was funded by the Slovenian Research Agency (ARRS/ARIS) – Postdoctoral research project ARRS Z4-4543 and Research program ARRS P4-0107.
We would like to thank to all reviewers for many constructive comments on the earlier version of the manuscript.
The authors declare that the research was conducted in the absence of any commercial or financial relationships that could be construed as a potential conflict of interest.
All claims expressed in this article are solely those of the authors and do not necessarily represent those of their affiliated organizations, or those of the publisher, the editors and the reviewers. Any product that may be evaluated in this article, or claim that may be made by its manufacturer, is not guaranteed or endorsed by the publisher.
The Supplementary material for this article can be found online at: https://www.frontiersin.org/articles/10.3389/ffgc.2023.1236842/full#supplementary-material
Aiello-Lammens, M. E., Boria, R. A., Radosavljevic, A., Vilela, B., and Anderson, R. P. (2015). spThin: an R package for spatial thinning of species occurrence records for use in ecological niche models. Ecography 38, 541–545. doi: 10.1111/ecog.01132
Allouche, O., Tsoar, A., and Kadmon, R. (2006). Assessing the accuracy of species distribution models: prevalence, kappa and the true skill statistic (TSS). J. Appl. Ecol. 43, 1223–1232. doi: 10.1111/j.1365-2664.2006.01214.x
Araújo, M. B., and New, M. (2007). Ensemble forecasting of species distributions. Trends Ecol. Evol. 22, 42–47. doi: 10.1016/j.tree.2006.09.010
Axer, M., Schlicht, R., Kronenberg, R., and Wagner, S. (2021). The potential for future shifts in tree species distribution provided by dispersal and ecological niches: A comparison between beech and oak in Europe. Sustainability 13:13067. doi: 10.3390/su132313067
Azaryan, M., Vajari, K. A., and Amanzadeh, B. (2023). Herb-layer diversity and morphological traits of beech trees (Fagus orientalis L.) in development stages of natural temperate forests. Biologia 78, 101–108. doi: 10.1007/s11756-022-01183-8
Barbet-Massin, M., Jiguet, F., Albert, C. H., and Thuiller, W. (2012). Selecting pseudo-absences for species distribution models: how, where and how many? Methods Ecol. Evol. 3, 327–338. doi: 10.1111/j.2041-210X.2011.00172.x
Bátori, Z., Tölgyesi, C., Li, G., Erdős, L., Gajdács, M., and Kelemen, A. (2023). Forest age and topographic position jointly shape the species richness and composition of vascular plant in karstic habitats. Ann. For. Sci. 80:16. doi: 10.1186/s13595-023-01183-x
Beauregard, F., and de Blois, S. (2016). Rapid latitudinal range expansion at cold limits unlikely for temperate understory forest plants. Ecosphere 7:e01549. doi: 10.1002/ecs2.1549
Bednar-Friedl, B., Biesbroek, R., Schmidt, D. N., Alexander, P., Břrsheim, K. Y., Carnicer, J., et al., (2022): Europe. In: Climate Change 2022: Impacts, Adaptation and Vulnerability. Contribution of Working Group II to the Sixth Assessment Report of the Intergovernmental Panel on Climate Change Cambridge University Press, Cambridge, UK and New York
Bellemare, J., and Moeller, D. A. (2014). “Climate change and Forest herbs of temperate deciduous forests” in The Herbaceous Layer in Forests of Eastern North America. ed. F. Gilliam. 2nd ed (New York: Oxford Academic)
Bertrand, R., Riofrío-Dillon, G., Lenoir, J., Drapier, J., de Ruffray, P., Gégout, C., et al. (2016). Ecological constraints increase the climatic debt in forests. Nat. Commun. 7:12643. doi: 10.1038/ncomms12643
Bivand, R., Rundel, C, and Pebesma, E (2022). Package “rgeos” - Interface to geometry engine - open source (’GEOS’). R package version 0.4-2. Available at: https://CRAN.R-project.org/package=rgeos
Bohn, U., Neuhäusl, R., Gollub, G., Hettwer, C., Neuhäuslová, Z., Raus, Th., Schlüter, H., and Weber, H. (2004): Karte der natürlichen vegetation Europas / map of the natural vegetation of Europe. Maßstab/Scale 1:2 500 000. Münster (Landwirtschaftsverlag).
Boria, R. A., Olson, L. E., Goodman, S. M., and Anderson, R. P. (2014). Spatial filtering to reduce sampling bias can improve the performance of ecological niche models. Ecol. Model. 275, 73–77. doi: 10.1016/j.ecolmodel.2013.12.012
Campetella, G., Chelli, S., Simonetti, E., Damiani, C., Bartha, S., Wellstein, C., et al. (2020). Plant functional traits are correlated with species persistence in the herb layer of old-growth beech forests. Sci. Rep. 10:19253. doi: 10.1038/s41598-020-76289-7
Chamberlain, S., (2021). Rgbif: interface to the global ‘biodiversity’ information facility ‘API’. – R package ver. 0.9.8, Available at: https://CRAN.R-project.org/package=rgbif
Chen, I. C., Hill, J. K., Ohlemüller, R., Roy, D. B., and Thomas, C. D. (2011). Rapid range shifts of species associated with high levels of climate warming. Science 333, 1024–1026. doi: 10.1126/science.1206432
Cornwell, W. K., Pearse, W. D., Dalrymple, R. L., and Zanne, A. E. (2019). What we (don’t) know about global plant diversity. Ecography 42, 1819–1831. doi: 10.1111/ecog.04481
De Frenne, P., Brunet, J., Shevtsova, A., Kolb, A., Graae, B. J., Chabrerie, O., et al. (2011). Temperature effects on forest herbs assessed by warming and transplant experiments along a latitudinal gradient. Glob. Change Biol. 17, 3240–3253. doi: 10.1111/j.1365-2486.2011.02449.x
De Lombaerde, E., Vangansbeke, P., Lenoir, J., Van Meerbeek, K., Lembrechts, J., Rodríguez-Sánchez, F., et al. (2022). Maintaining forest cover to enhance temperature buffering under future climate change. Sci. Total Environ. 810:151338. doi: 10.1016/j.scitotenv.2021.151338
Dullinger, S., Dendoncker, N., Gattringer, A., Leitner, M., Mang, T., Moser, D., et al. (2015). Modelling the effects of habitat fragmentation on climate-driven migration of European forest understorey plants. Divers. Distrib. 21, 1375–1387. doi: 10.1111/ddi.12370
Elith, J., Graham, C. H., Anderson, R. P., Dudík, M., Ferrier, S., Guisan, A., et al. (2006). Novel methods improve prediction of species’ distributions from occurrence data. Ecography 29, 129–151. doi: 10.1111/j.2006.0906-7590.04596.x
Erlandson, S. K., Bellemare, J., and Moeller, D. A. (2021). Limited range-filling among endemic forest herbs of eastern North America and its implications for conservation with climate change. Front. Ecol. Evol. 9:751728. doi: 10.3389/fevo.2021.751728
Estrada, A., Morales-Castilla, I., Caplat, P., and Early, R. (2016). Usefulness of species traits in predicting range shifts. Trends Ecol. Evol. 31, 190–203. doi: 10.1016/j.tree.2015.12.014
Fajardo, J., Corcoran, D., Roehrdanz, P. R., Hannah, L., and Marquet, P. A. (2020). GCM compareR: A web application to assess differences and assist in the selection of general circulation models for climate change research. Methods Ecol. Evol. 11, 656–663. doi: 10.1111/2041-210X.13360
Fick, S. E., and Hijmans, R. J. (2017). WorldClim 2: New 1-km spatial resolution climate surfaces for global land areas. Int. J. Climatol. 37, 4302–4315. doi: 10.1002/joc.5086
Fourcade, Y., Besnard, A. G., and Secondi, J. (2018). Paintings predict the distribution of species, or the challenge of selecting environmental predictors and evaluation statistics. Glob. Ecol. Biogeogr. 27, 245–256. doi: 10.1111/geb.12684
García-Duro, J., Ciceu, A., Chivulescu, S., Badea, O., Tanase, M. A., and Aponte, C. (2021). Shifts in forest species composition and abundance under climate change scenarios in southern Carpathian Romanian temperate forests. Forests 12:1434. doi: 10.3390/f12111434
Gilliam, F. S. (2007). The ecological significance of the herbaceous layer in temperate forest ecosystems. Bioscience 57, 845–858. doi: 10.1641/B571007
Govaert, S., Vangansbeke, P., Blondeel, H., Steppe, K., Verheyen, K., and De Frenne, P. (2021). Rapid thermophilization of understorey plant communities in a 9 year-long temperate forest experiment. J. Ecol. 109, 2434–2447. doi: 10.1111/1365-2745.13653
Greiser, C., Hylander, K., Meineri, E., Luoto, M., and Ehrlén, J. (2020). Climate limitation at the cold edge: contrasting perspectives from species distribution modelling and a transplant experiment. Ecography 43, 637–647. doi: 10.1111/ecog.04490
Guisan, A., Thuiller, W., and Zimmermann, N. E. (2017). Habitat suitability and distribution models – With applications in R. Cambridge University press, 461, Cambridge
Hao, T., Elith, J., Lahoz-Monfront, J. J., and Guillera-Arroita, G. (2020). Testing whether ensemble modelling is advantageous for maximising predictive performance of species distribution models. Ecography 43, 549–558. doi: 10.1111/ecog.04890
Heinken, T., Diekmann, M., Liira, J., Orczewska, A., Schmidt, M., Brunet, J., et al. (2022). The European Forest Plant species list (EuForPlant): concept and applications. J. Veg. Sci. 33:e13132. doi: 10.1111/jvs.13132
Hijmans, R. J., van Etten, J., Sumner, M., Cheng, J., Baston, D., Bevan, D., et al. (2022b).Package “raster”–geographic data analysis and modelling; version 3.4-5. Available at: https://cran.r-project.org/web/packages/raster/index.html
Hijmans, R. J., et al. (2022a). Package “geodata” – download geographic data. Available at: https://cran.r-project.org/web/packages/geodata/index.html
Hollister, J., and Shah, T. (2022). Package “elevatr” - access elevation data from various APIs. Available at: https://cran.r-project.org/web/packages/elevatr/index.html
Honnay, O., Verheyen, K., Butaye, J., Jacquemyn, H., Bossuyt, B., and Hermy, M. (2002). Possible effects of habitat fragmentation and climate change on the range of forest plant species. Ecol. Lett. 5, 525–530. doi: 10.1046/j.1461-0248.2002.00346.x
Houston Durrant, T., Rigo, D.de, and Caudullo, G. (2016). Fagus sylvatica and other beeches in Europe: distribution, habitat, usage and threats. In: J. San-Miguel-Ayanz, D. Rigode, G. Caudullo, T. Houston Durrant, and A. Mauri (Eds.). European Atlas of Forest Tree Species, Publication Office EU, Luxembourg, pp. e012b90+
IPCC (2022). “Summary for Policymakers” in Climate Change 2022: Impacts, Adaptation and Vulnerability. Contribution of Working Group II to the Sixth Assessment Report of the Intergovernmental Panel on Climate Change. eds. H.-O. Pörtner, D. C. Roberts, M. Tignor, E. S. Poloczanska, K. Mintenbeck, and A. Alegría, et al. (Cambridge, UK and New York, NY, USA: Cambridge University Press), 3–33.
Jiménez-Alfaro, B., Girardello, M., Chytrý, M., Svenning, J. C., Willner, W., Gégout, J. C., et al. (2018). History and environment shape species pools and community diversity in European beech forests. Nat. Ecol. Evol. 2, 483–490. doi: 10.1038/s41559-017-0462-6
Kermavnar, J., Eler, K., Marinšek, A., and Kutnar, L. (2021). Post-harvest forest herb layer demography: general patterns are driven by pre-disturbance conditions. For. Ecol. Manag. 491:119121. doi: 10.1016/j.foreco.2021.119121
Kermavnar, J., Kutnar, L., and Marinšek, A. (2022). Variation in floristic and trait composition along environmental gradients in the herb layer of temperate forests in the transition zone between central and SE Europe. Plant Ecol. 223, 229–242. doi: 10.1007/s11258-021-01203-8
Kermavnar, J., Levanič, T., and Kutnar, L. (2023). Stable isotope composition in tree rings of Fagus sylvatica L. saplings reflects environmental variation induced by silviculture and microsite factors. For. Ecol. Manag. 537:120949. doi: 10.1016/j.foreco.2023.120949
Kriegler, E., O’Neill, B. C., Hallegatte, S., Kram, T., Lempert, R. J., Moss, R. H., et al. (2012). The need for and use of socio-economic scenarios for climate change analysis: A new approach based on shared socio-economic pathways. Global Environ. Chang. 22, 807–822. doi: 10.1016/j.gloenvcha.2012.05.005
Kuhn, E., and Gégout, J. C. (2019). Highlighting declines of cold-demanding plant species in lowlands under climate warming. Ecography 42, 36–44. doi: 10.1111/ecog.03469
Lembrechts, J. J., Nijs, I., and Lenoir, J. (2019). Incorporating microclimate into species distribution models. Ecography 42, 1267–1279. doi: 10.1111/ecog.03947
Lenoir, J., Graae, B. J., Aarrestad, P. A., Alsos, I. G., Armbruster, W. S., Austrheim, G., et al. (2013). Local temperatures inferred from plant communities suggest strong spatial buffering of climate warming across northern Europe. Glob. Change Biol. 19, 1470–1481. doi: 10.1111/gcb.12129
Lenoir, J., and Svenning, J. C. (2015). Climate-related range shifts – a global multidimensional synthesis and new research directions. Ecography 38, 15–28. doi: 10.1111/ecog.00967
Leuschner, C. (2020). Drought response of European beech (Fagus sylvatica L.) – A review. Perspect. Plant Ecol. 47:125576. doi: 10.1016/j.ppees.2020.125576
Leuschner, C., and Ellenberg, H. (2017). Ecology of central European forests. Vegetation ecology of Central Europe, 1. Springer, Switzerland.
Leuschner, C., and Lendzion, J. (2009). Air humidity, soil moisture and soil chemistry as determinants of the herb layer composition in European beech forests. J. Veg. Sci. 20, 288–298. doi: 10.1111/j.1654-1103.2009.05641.x
Liu, C., Berry, P. M., Dawson, T. P., and Pearson, R. G. (2005). Selecting thresholds of occurrence in the prediction of species distributions. Ecography 28, 385–393. doi: 10.1111/j.0906-7590.2005.03957.x
Lloret, F., Jaime, L. A., Margalef-Marrase, J., Pérez-Navarro,, and Batllori, E. (2022). Short-term forest resilience after drought-induced die-off in southwestern European forests. Sci. Total Environ. 806:150940. doi: 10.1016/j.scitotenv.2021.150940
Macek, M., Kopecký, M., and Wild, J. (2019). Maximum air temperature controlled by landscape topography affects plant species composition in temperate forests. Landsc. Ecol. 34, 2541–2556. doi: 10.1007/s10980-019-00903-x
Maclean, I. M. D., and Early, R. (2023). Macroclimate data overestimate range shifts of plants in response to climate change. Nat. Clim. Chang. 13, 484–490. doi: 10.1038/s41558-023-01650-3
Mahecha, M. D., Rzanny, M., Kraemer, G., Mäder, P., Seeland, M., and Wäldchen, J. (2021). Crowd-sourced plant occurrence data provide a reliable description of macroecological gradients. Ecography 44, 1131–1142. doi: 10.1111/ecog.05492
Margalef-Marrase, J., Pérez-Navarro, M. A., and Lloret, F. (2020). Relationship between heatwave-induced forest die-off and climatic suitability in multiple tree species. Glob. Change Biol. 26, 3134–3146. doi: 10.1111/gcb.15042
Marinšek, A., Šilc, U., and Čarni, A. (2013). Geographical and ecological differentiation of Fagus forest vegetation in SE Europe. Appl. Veg. Sci. 16, 131–147. doi: 10.1111/j.1654-109X.2012.01203.x
Marmion, M., Parviainen, M., Luoto, M., Heikkinen, R. K., and Thuiller, W. (2009). Evaluation of consensus methods in predictive species distribution modelling. Divers. Distrib. 15, 59–69. doi: 10.1111/j.1472-4642.2008.00491.x
Merow, C., Smith, M. J., Edwards, T. C., Guisan, A., McMahon, S. M., Normand, S., et al. (2014). What do we gain from simplicity versus complexity in species distribution models? Ecography 37, 1267–1281. doi: 10.1111/ecog.00845
Naimi, B. (2022). Package “usdm” - uncertainty analysis for species distribution models. Available at: https://cran.r-project.org/web/packages/usdm/index.html
Naimi, B., and Araújo, M. B. (2016). Sdm: a reproducible and extensible R platform for species distribution modelling. Ecography 39, 368–375. doi: 10.1111/ecog.01881
Nenzén, H. K., and Araújo, M. B. (2011). Choice of threshold alters projections of species range shifts under climate change. Ecol. Model. 222, 3346–3354. doi: 10.1016/j.ecolmodel.2011.07.011
Pearson, R. G., and Dawson, T. P. (2003). Predicting the impacts of climate change on the distribution of species: are bioclimate envelope models useful? Glob. Ecol. Biogeogr. 12, 361–371. doi: 10.1046/j.1466-822X.2003.00042.x
Puchałka, R., Paź-Dyderska, S., Dylewski, L., Czortek, P., Vítkova, M., Sádlo, J., et al. (2023b). Forest herb species with similar European geographic ranges may respond differently to climate change. Sci. Total Environ. 905:167303. doi: 10.1016/j.scitotenv.2023.167303
Puchałka, R., Paź-Dyderska, S., Jagodziński, A. M., Sádlo, J., Vítková, M., Klisz, M., et al. (2023a). Predicting range shifts of alien tree species in Europe. Agric. For. Meteorol. 341:109650. doi: 10.1016/j.agrformet.2023.109650
R Core Team (2021). R: A language and environment for statistical computing ; R Foundation for Statistical Computing: Vienna, Austria
Riahi, K., van, V. D. P., Kriegler, E., Edmonds, J., O’Neill, B. C., Fujimori, S., et al. (2017). The shared socioeconomic pathways and their energy, land use, and greenhouse gas emissions implications: an overview. Global Environ. Chang. 42, 153–168. doi: 10.1016/j.gloenvcha.2016.05.009
Richard, B., Dupouey, J. L., Corcket, E., Alard, D., Archaux, F., Aubert, M., et al. (2021). The climatic debt is growing in the understorey of temperate forests: stand characteristics matter. Glob. Ecol. Biogeogr. 30, 1474–1487. doi: 10.1111/geb.13312
Rota, F., Casazza, G., Genova, G., Midolo, G., Prosser, F., Bertolli, A., et al. (2022). Topography of the Dolomites modulates range dynamics of narrow endemic plants under climate change. Sci. Rep. 12:1398. doi: 10.1038/s41598-022-05440-3
Sala, O. E., Chapin, F. S. III, Armesto, J. J., Berlow, E., Bloomfield, J., Dirzo, R., et al. (2000). Global biodiversity scenarios for the year 2100. Science 287, 1770–1774. doi: 10.1126/science.287.5459.1770
Sanczuk, P., De Lombaerde, E., Haesen, S., Van Meerbeek, K., Luoto, M., Van der Veken, B., et al. (2022b). Competition mediates understorey species range shifts under climate change. J. Ecol. 110, 1813–1825. doi: 10.1111/1365-2745.13907
Sanczuk, P., De Lombaerde, E., Haesen, S., Van Meerbeek, K., Van der Veken, B., Hermy, M., et al. (2022a). Species distribution models and a 60-year-old transplant experiment reveal inhibited forest plant range shifts under climate change. J. Biogeogr. 49, 537–550. doi: 10.1111/jbi.14325
Sillero, N., Arenas-Castro, S., Enriquez-Urzelai, U., Gomes Vale, C., Sousa-Guedes, D., Martínez-Freiría, F., et al. (2021). Want to model a species niche? A step-by-step guideline on correlative ecological niche modelling. Ecol. Model. 456:109671. doi: 10.1016/j.ecolmodel.2021.109671
Skov, F., and Svenning, J. C. (2004). Potential impact of climate change on the distribution of forest herbs in Europe. Ecography 27, 366–380. doi: 10.1111/j.0906-7590.2004.03823.x
Suggitt, A. J., Wilson, R. J., Isaac, N. J. B., Beale, C. M., Auffret, A. G., August, T., et al. (2018). Extinction risk from climate change is reduced by microclimatic buffering. Nat. Clim. Chang. 8, 713–717. doi: 10.1038/s41558-018-0231-9
Svenning, J. C., Normand, S., and Skov, F. (2008). Postglacial dispersal limitation of widespread forest plant species in nemoral Europe. Ecography 31, 316–326. doi: 10.1111/j.0906-7590.2008.05206.x
Svenning, J. C., and Skov, F. (2006). Potential impact of climate change on the northern nemoral forest herb flora of Europe. Biodivers. Conserv. 15, 3341–3356. doi: 10.1007/s10531-005-1345-8
Thuiller, W., Lavorel, S., Araújo, M. B., and Prentice, I. C. (2005). Climate change threatens to plant diversity in Europe. PNAS 102, 8245–8250. doi: 10.1073/pnas.0409902102
Trinajstić, I. (1995). Samoborsko gorje, a refuge of various floral elements between the Alps and the Dinaric mountains. Acta Bot. Croat. 54, 47–62.
Valladares, F., Laanisto, L., Niinemets, Ü., and Zavala, M. A. (2016). Shedding light on shade: ecological perspectives of understorey plant life. Plant Ecol. Divers. 9, 237–251. doi: 10.1080/17550874.2016.1210262
Van Daele, F., Honnay, O., and De Kort, H. (2021). The role of dispersal limitation and reforestation in shaping the distributional shift of a forest herb under climate change. Divers. Distrib. 27, 1775–1791. doi: 10.1111/ddi.13367
Van der Veken, S., Bellemare, J., Verheyen, K., and Hermy, M. (2007). Life-history traits are correlated with geographical distribution patterns of western European forest herb species. J. Biogeogr. 34, 1723–1735. doi: 10.1111/j.1365-2699.2007.01738.x
Vangansbeke, P., Máliš, F., Hédl, R., Chudomelová, M., Vild, O., Wulf, M., et al. (2021). ClimPlant: realized climatic niches of vascular plants in European forest understoreys. Glob. Ecol. Biogeogr. 30, 1183–1190. doi: 10.1111/geb.13303
Večeřa, M., Divíšek, J., Lenoir, J., Jiménez-Alfaro, B., Biurrun, I., Knollová, I., et al. (2019). Alpha diversity of vascular plants in European forests. J. Biogeogr. 46, 1919–1935. doi: 10.1111/jbi.13624
Willner, W., Di Pietro, R., and Bergmeier, E. (2009). Phytogeographical evidence for post-glacial dispersal limitation of European beech forest species. Ecography 32, 1011–1018. doi: 10.1111/j.1600-0587.2009.05957.x
Willner, W., Jiménez-Alfaro, B., Agrillo, E., Biurrun, I., Campos, J. A., Čarni, A., et al. (2017). Classification of European beech forests: a Gordian knot? Appl. Veg. Sci. 20, 494–512. doi: 10.1111/avsc.12299
Willner, W., Wessely, J., Gattringer, A., Moser, D., Záveská, E., Dullinger, S., et al. (2023). Post-glacial range formation of temperate forest understorey herbs – Insights from a spatio-temporally explicit modelling approach. Global Ecol. Biogeogr 32, 1046–1058. doi: 10.1111/geb.13677
Wisz, M. S., Hijmans, R. J., Li, J., Peterson, A. T., Graham, C. H., Guisan, A., et al. (2008). Effects of sample size on the performance of species distribution models. Divers. Distrib. 14, 763–773. doi: 10.1111/j.1472-4642.2008.00482.x
Wood, S. (2020). Package ‘mgcv’–mixed GAM computation vehicle with automatic smoothness estimation. Available at: https://cran.r-project.org/web/packages/mgcv/index.html
Xie, C., Tian, E., Jim, C. Y., Liu, D., and Hu, Z. (2022). Effects of climate-change scenarios on the distribution patterns of Castanea henryi. Ecol. Evol. 12:e9597. doi: 10.1002/ece3.9597
Keywords: species distribution modelling, global warming, range shift, climatic niche, biogeography, Europe
Citation: Kermavnar J, Kutnar L and Marinšek A (2023) More losses than gains? Distribution models predict species-specific shifts in climatic suitability for European beech forest herbs under climate change. Front. For. Glob. Change. 6:1236842. doi: 10.3389/ffgc.2023.1236842
Edited by:
Xiangping Hu, Norwegian University of Science and Technology, NorwayReviewed by:
Ting Hua, Beijing Normal University, ChinaCopyright © 2023 Kermavnar, Kutnar and Marinšek. This is an open-access article distributed under the terms of the Creative Commons Attribution License (CC BY). The use, distribution or reproduction in other forums is permitted, provided the original author(s) and the copyright owner(s) are credited and that the original publication in this journal is cited, in accordance with accepted academic practice. No use, distribution or reproduction is permitted which does not comply with these terms.
*Correspondence: Janez Kermavnar, amFuZXoua2VybWF2bmFyQGdvemRpcy5zaQ==
Disclaimer: All claims expressed in this article are solely those of the authors and do not necessarily represent those of their affiliated organizations, or those of the publisher, the editors and the reviewers. Any product that may be evaluated in this article or claim that may be made by its manufacturer is not guaranteed or endorsed by the publisher.
Research integrity at Frontiers
Learn more about the work of our research integrity team to safeguard the quality of each article we publish.