 Frances Claire Manning1*
 Lip Khoon Kho2,3
 Timothy Charles Hill4
 Tiara Nales Nyawai3
 Elisa Rumpang3
 Yit Arn Teh1*†
- 1Institute of Biological and Environmental Sciences, University of Aberdeen, Aberdeen, United Kingdom
- 2Ministry of Energy and Environmental Sustainability Sarawak, Kuching, Sarawak, Malaysia
- 3Peat Ecosystem and Biodiversity, Biology and Sustainability Research Division, Malaysian Palm Oil Board, Kajang, Malaysia
- 4College of Life and Environmental Sciences, University of Exeter, Exeter, United Kingdom
Oil palm plantations growing on peat soil are associated with high soil CO2 emissions. Oil palm plantations are set up with regular spatial patterns consisting of different surface management microforms: bare soil harvest paths, frond piles, cover plants and drainage ditches. Currently, there is limited understanding about the extent that this spatial variation impacts soil carbon losses, in part due to the challenges of partitioning peat oxidation from total soil respiration. We explored this spatial variation by measuring total soil respiration (Rtot), root density and environmental variables at 210 locations. Measurements were taken along transects going from the base of oil palms into the different microforms. Rtot was partitioned into root respiration (Ra) and heterotrophic respiration (Rh) using two different methods: (i) a “distance from palm” method (which utilizes the fluxes taken from soil with minimal root density) and (ii) a “linear regression” method (which models root density and Rtot, using the regression intercept for Rh). Here, the distance from palm partitioning method gave higher Rh estimates than the linear regression method. Rh varied significantly between the different palms used in the assessment but did not show significant spatial variation aside from this. Rtot and Ra were highest next to the palm and decreased with increasing distance from the palm. Rtot and Ra also showed significant spatial variation between the different surface management microforms, with each giving significantly higher fluxes below the frond piles near the drainage ditches than from below the frond piles near the cover plants. Area-weighted upscaling gave plantation best estimates of Rtot, Rh, Ra of 0.158 ± 0.016, and 0.130 ± 0.036 and 0.029 ± 0.030 g CO2-C m−2 h−1, respectively. We conclude that spatial patterns impact root density, Ra and Rtot fluxes but not Rh fluxes.
1 Introduction
Oil palm (Elaeis guineensis) plantations have been estimated to produce 146 Tg C from plantations annually, accounting for 95% of total emissions from tropical agriculture (Carlson et al., 2017). A large proportion of these emissions can be attributed to oil palm plantations growing on drained tropical peat soils – these agroecosystems have been estimated to have high rates of peat oxidation by heterotrophic respiration (Rh) (Carlson et al., 2017). However, current estimates of oil palm plantation Rh have a wide range from 0.047 to 0.307 g CO2-C m−2 h−1 (mean: 0.152 g CO2-C m−2 h−1; Farmer, 2013; Melling et al., 2013; Dariah et al., 2014; Husnain et al., 2014; Comeau, 2016; Comeau et al., 2016; Hergoualc’h et al., 2017; Ishikura et al., 2018; Matysek et al., 2018; Manning et al., 2019; Cooper et al., 2020). The underlying basis for this extensive range of Rh values is poorly established.
Agricultural systems growing on peat soils often have high CO2 emissions due to lowering the naturally occurring water table to prevent waterlogging the crop’s roots (Philipson and Coutts, 1978; Corley and Tinker, 2008; Melling et al., 2009; McCalmont et al., 2021). This soil drainage accelerates the activity of heterotrophic bacteria, which break down labile components of peat leading to enhanced atmospheric CO2 fluxes (Hoojier et al., 2012). Oil palm (Elaeis guineensis) plantations are no exception (Carlson et al., 2015). South East (SE) Asia has 24.7 Mha of peatlands, of which 4.3 Mha of peatlands have been cultivated for industrial oil palm or Acacia sp. plantations (Page et al., 2011; Miettinen et al., 2016).
Understanding Rh in oil palm plantations is complicated by within plantation spatial variation caused by microsite-level (i.e., <10 m) plant and soil management practices (Manning et al., 2019). Oil palm plantations have a regular, repeating pattern of surface management microforms, consisting of: bare soil harvest paths, piles of decomposing fronds, cover plants and bare soil around the palm where the roots grow – referred to as the palm circle or rhizosphere. Furthermore, oil palm plantations growing on peat soil have drainage ditches at regular intervals (Cook et al., 2018; Manning et al., 2019). These different surface management microforms have different microclimatic and environmental conditions, leading to differences in soil C flux from the microforms (Manning et al., 2019). These spatial patterns complicate estimation of plantation-scale Rh as it has to take into account high variability and potentially increases the sample size needed to constrain plantation-scale flux estimates.
Existing sampling methodologies may not adequately quantify natural variability in soil respiration and therefore the estimation of plantation-scale Rh (Subke et al., 2006). To estimate Rh, total soil respiration (Rtot) must be partitioned into Rh and autotrophic respiration (Ra). A common method to partition Rtot into Rh in oil palm plantations is to take an Rtot measurement at the furthest distance between two or more palms (referred to as the “distance from palm method”), in areas of soil where root density is assumed to be insignificant or so low that it has a negligible effect on total soil respiration (Dariah et al., 2014; Matysek et al., 2018). The distance from palm method produces estimates of Rh that avoids artificially changing the environmental conditions, but may still contain some contribution from Ra. Another method to partition Rh from Rtot is the “linear regression” method (Baggs, 2006; Farmer, 2013). The linear regression method uses linear regression to quantify the correlation between Rtot and root density. Rtot is assumed to be equal to Rh at the point where root density approaches zero. The linear regression method assumes that spatial variations in Rtot within the plantation are due to variation in Ra and that Rh is constant. A third commonly used method is the “physical partitioning method” (Subke et al., 2006). In physical partitioning methods, root-excluding mesh or trenching techniques are used to create root-free areas of soil (Melling et al., 2013; Hergoualc’h et al., 2017). In these physical partitioning methods, Rh is measured directly, but the environmental conditions under which Rh was measured may have been significantly altered by the root exclusion meshes or trenches (Manning, 2019). Finally, “isotopic” methods allow for the quantification of the proportion of Rh in an Rtot measurement, however, these methods are expensive and complex to implement.
This study explores the spatial variations and uncertainties in estimates of Rh from oil palm plantations on tropical peat soils. Sampling was carried out at increasing distances from the base of the palm along transects extending toward different surface management microforms. These surface management microforms are: the bare soil harvest path, beneath frond piles next to the cover plants (frond pile-C), beneath the frond piles next to the drainage ditches (frond pile-D), into cover plants and toward the field drains. Rtot was partitioned into Rh and Ra using two methods: the distance from palm method and the linear regression method. These methods were chosen because they do not alter the soil environment physically, while also being practical and economical to employ. Statistical analyses were used to consider how Rtot varies with environmental variation and variations in surface management practices. Rtot, Rh and Ra were scaled up to plantation level and estimated using two methods: straight mean averaging and area-weighted upscaling. This paper aims to answer the following research questions:
• Do measured Rtot and partitioned Rh and Ra vary significantly between surface management microforms?
• What are plantation-scale estimates of Rtot and the partitioned Rh and Ra?
• What are the errors in Rtot, Rh and Ra if spatial variation is not adequately taken into account?
2 Methods
2.1 Site description
The data were collected during August and September 2014 from the Sebungan oil palm plantation in Sarawak, Malaysia (latitude 003o09’ N, longitude 113o21’ E). Sebungan Estate has been established on 4.0 m deep peat soils broadly classified as histosols (FAO, 2006). The plantation has a tropical climate; the mean annual temperature was 26°C and the mean annual precipitation was approximately 3,000 mm (Cook et al., 2018; McCalmont et al., 2021). The northeast monsoon from October to January has the most rainfall, with a slightly drier southwest monsoon between May and August (Cook et al., 2018).
Prior to planting, the land use was a mixed species swamp forest, which had been heavily logged. The land was converted to a plantation in 2006 and the palms were on their first crop rotation. The palms were 7 years old when measurements began. The plantation was laid out systematically with ~35 ha blocks and drainage ditches every 28 m leading to a larger ditch running down the center of the block. Palms were planted every 8 m in rows that were 8 m apart, leading to a planting density of 160 palms per ha. Within the palm blocks, four different surface management microforms were present and two different drain types (Figure 1):
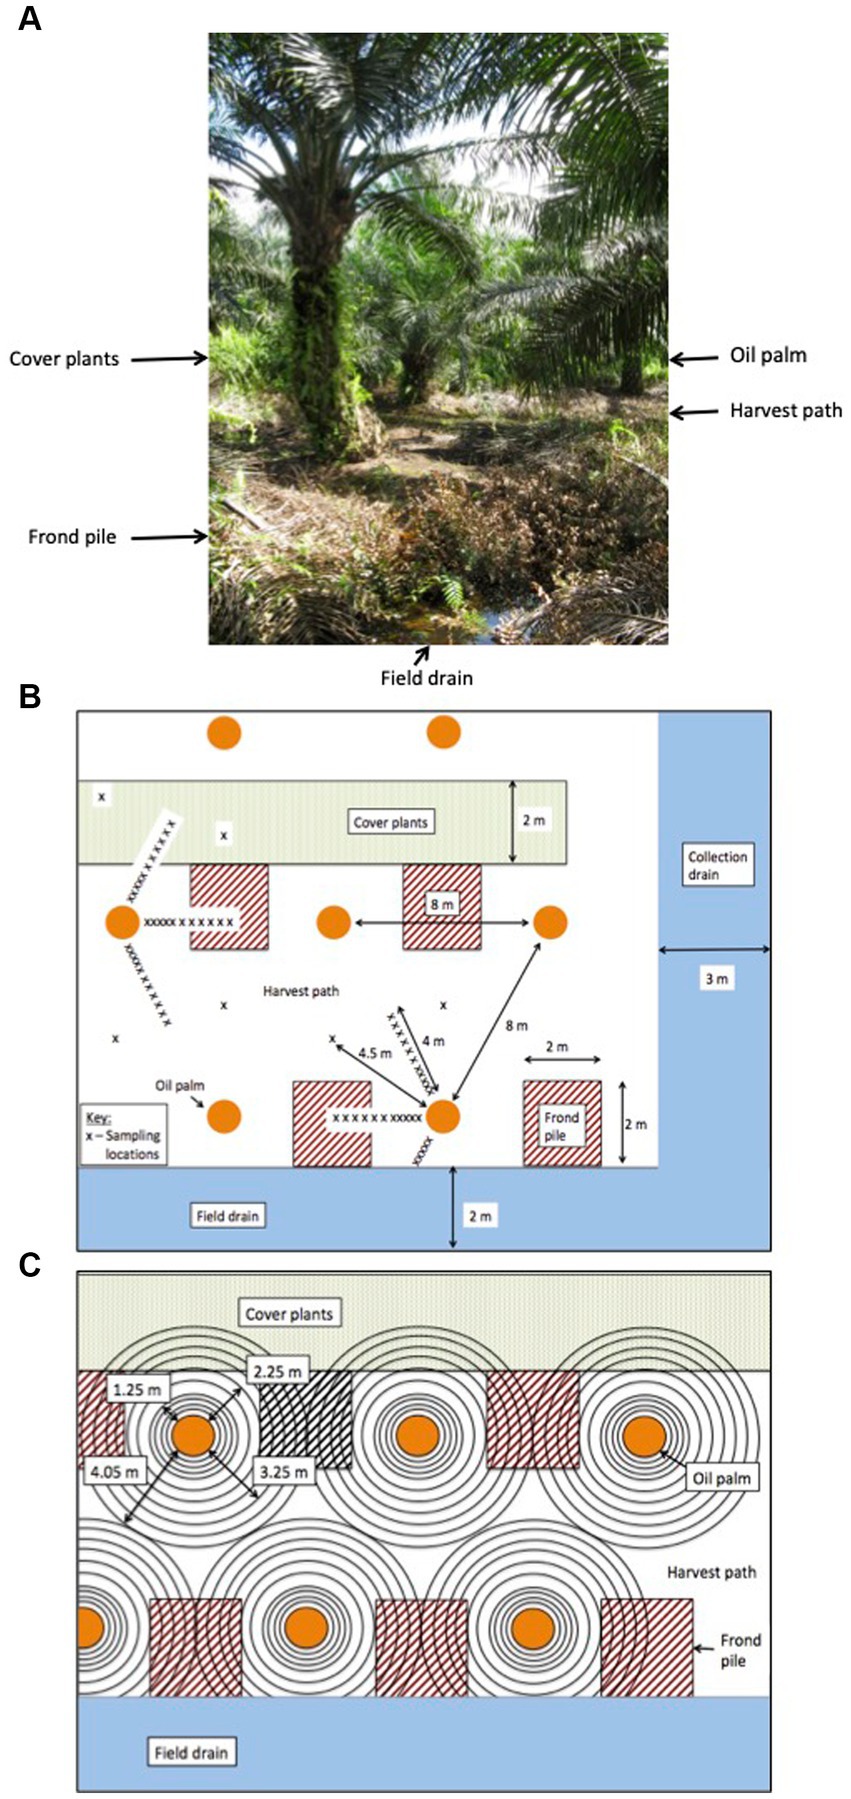
Figure 1. (A) An image of the palm oil plantation (B) the measurement sampling design and (C) a visualisation of the areal rings used for the flux upscaling methodology.
• Palm (fertilizer) circle – the ring of soil around the palm where the majority of oil palm roots grow and the fertilizer is applied. In this paper we refer to this area as the rhizosphere due to the distribution of the roots in this plantation.
• Harvest path – frequently weeded soil between the rows of palms and around the palms to allow access for workers.
• Frond pile – the location of the decomposing, harvested fronds. The analysis in this paper differentiated the frond piles next to the cover plants (frond pile-C) from the frond piles next to the drainage ditches (frond pile-D).
• Cover plants – an area where weeds were left to grow freely.
• Field drains – small 1.5 m wide drains dug every four rows of palms.
• Collection drains – larger 3 m wide drains running down the centre of the plantation blocks.
2.2 Experimental design
Six palms were selected within a 1 ha plot for this experiment. Three palms were located in rows next to the field drains and three palms were located in rows next to the rows of cover plants. At each palm, three sampling transects were set up, with each transect going across a different surface management microform (Figure 1). These transects within each management microform enabled us to determine if the effect of management microform interacted with root density to influence Rtot, Rh and Ra.
2.3 Rtot measurements
Rtot measurements were collected on the 30th and 31st August 2014. Samples were collected at 0, 0.25, 0.5, 0.75, 1, 1.5, 2, 2.5, 3, 3.5, 4 m from the base of each palm. A further sample was taken at a point equidistant from the three nearest palms (i.e., 4.5 m from the palm bases). Flux measurements were performed with a static chamber approach, using 10 cm diameter flux chambers (Livingston and Hutchinson, 1995). Chamber bases were installed in the soil to a depth of 5 cm 4 weeks prior to the commencement of sampling in order to avoid disturbance effects associated with base installation. Rtot measurements were made in triplicate using a PP Systems EGM-4 and SRC-1 chamber (Hansatech Instruments Ltd., Norfolk, UK). For each replicate measurement, CO2 concentrations were measured over a 2 minute enclosure period, with concentrations recorded at 3 second intervals, or until an increase of 50 ppm CO2 had been observed.
2.4 Environmental measurements
Ambient air temperature was measured at the same time as the Rtot measurement using a thermometer (LCD Digital Thermometer, ATP Instrumentation, Leicestershire, UK; precision ±1°C). Soil temperature and soil moisture measurements were taken following the completion of Rtot measurement, adjacent to the collar as in Marthews et al. (2012) and Manning et al. (2019). Soil moisture was measured using an ML3 probe and HH2 moisture meter (Delta-T, Cambridge, UK; precision 1%). Following the chamber measurements for each palm, water table depth (WTD) was determined by digging a hole in the peat in the harvest path to the water table, 2 m away from the palm.
2.5 Root density measurements
After the flux measurements, a 10 cm diameter, 30 cm deep, soil core was collected from each collar. Root dry mass was determined in each soil core using the method developed by Metcalfe et al. (2008), sampling up to 50 min for each soil core. The roots were washed and dried at 70°C to constant weight (Metcalfe et al., 2008). Root density was calculated as mass of dry roots over total volume of core extracted.
2.6 Soil characteristics
Following the extraction of roots, soil samples were dried and sieved to 2 mm. Chemical analyses were performed at the Malaysian Palm Oil Board headquarters in Kuala Lumpur, where soil C and N were measured in a CNS analyzer (Elementar Vario MACRO Cube, Germany), and soil pH was determined (Thermo Orion pH/ORP/cond model 555A, Thermo Fisher Scientific, Chelmsford, MA, USA).
Bulk density was estimated by finding the dry mass of soil with known volumes, sampled from the top 10 cm in the harvest path, frond piles and cover plants with bulk density rings. Soil C and N content were estimated by multiplying the bulk density by the soil C and N for the top 10 cm by 1 m of soil.
2.7 Calculating Rtot chamber fluxes
Rtot fluxes were calculated using R version 2.15.1 GUI 1.521. Here linear regressions were fitted and flux estimates determined (Equation 1) using the method in Marthews et al. (2012):
where ΔC is the change in CO2 over the measurement period (ppm), P is pressure (mb), V is volume (m3), M is the relative molecular mass of CO2, Y is the conversion to upscale the flux to annual emissions, Δt is the duration of the measurement period (s), T is temperature (K), A is surface area (m2) and R is the Universal Gas Constant 8.31432 J mol−1 K−1.
2.8 Estimating Rh and Ra
Rtot was partitioned into Rh and Ra using Equation 2:
Two different methodological approaches were used to estimate the partitioning of Rtot into Rh and Ra:
• Distance from palm – This method considered the pattern of Rtot and root density with distance from the palm on this plantation and assumed Rtot and Rh were equivalent for distances >1 m from the palm, where root density was shown to be minimal and not to vary statistically between datapoints. This method was based on Dariah et al. (2014) and Matysek et al. (2018) who each used a different distance as their Rh estimation due to the root growth in their respective plantations. Ra was estimated using Equation 2.
• Linear regression – This method linearly regressed root density and Rtot. Rh was assumed to be root-free respiration, i.e., at the intercept (Figure 2; Kucera and Kirkham, 1971; Baggs, 2006). Ra was estimated using Equation 2.
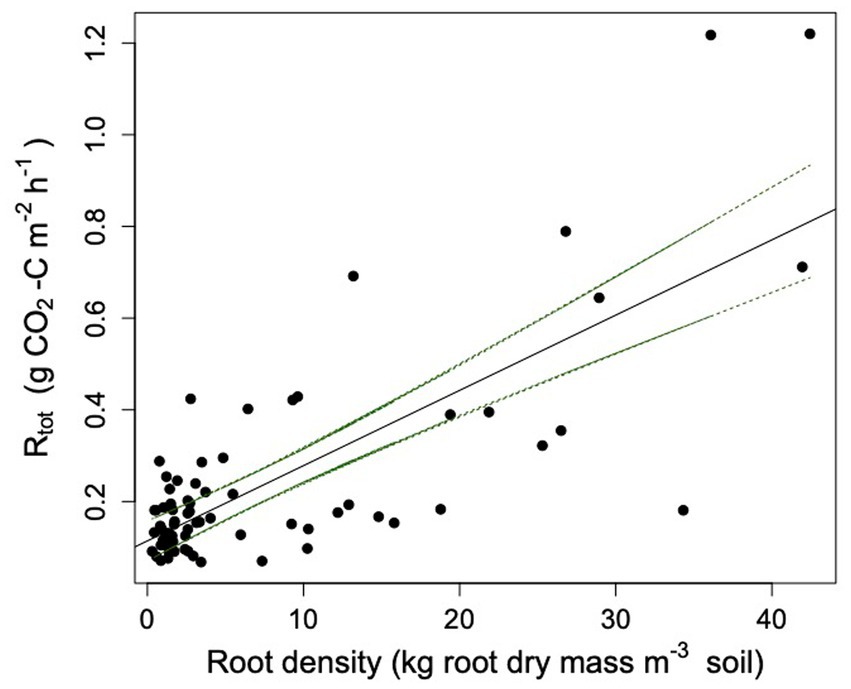
Figure 2. Rtot plotted against root density. The equation for the regression line is: Rtot = 0.016 x root density + 0.114 (r2 = 0.57, p < 0.0001). Confidence intervals are represented by the green dashed line.
For the analysis, the aggregated mean Rtot per distance class per palm and aggregated mean root density per distance class per palm were used, reducing the maximum n = 210 to n = 72. This was done because it had been estimated that the proportional representation of each microform within each distance class ring was equal by creating a spatial model of the oil palm plantation and determining the size of each land cover type.
2.9 Estimating Rh and Ra at individual points
Estimating Rh and Ra at each individual measurement points was modeled using the linear regression in section 2.8. Here, measured root density was substituted into the linear regression equation in order to model Ra. Equation 2 was used to model Rh for each collar.
2.10 Upscaling Rtot, Rh and Ra to plantation scale
Rtot, Rh and Ra fluxes were upscaled to plantation-scale estimates using two different approaches: straight mean averaging and area-weighted upscaling.
2.10.1 Straight mean averaging
Here, plantation mean Rtot was calculated using aggregated means. Firstly, the mean Rtot per distance class per palm was calculated. Secondly the overall mean of these means was estimated. Plantation scale Rh and Ra were calculated using the methods in section 2.8. To keep straight mean averaging results from this study comparable to other studies, it was assumed that the proportional area the drainage ditches took up did not impact the overall plantation results (Table 1).
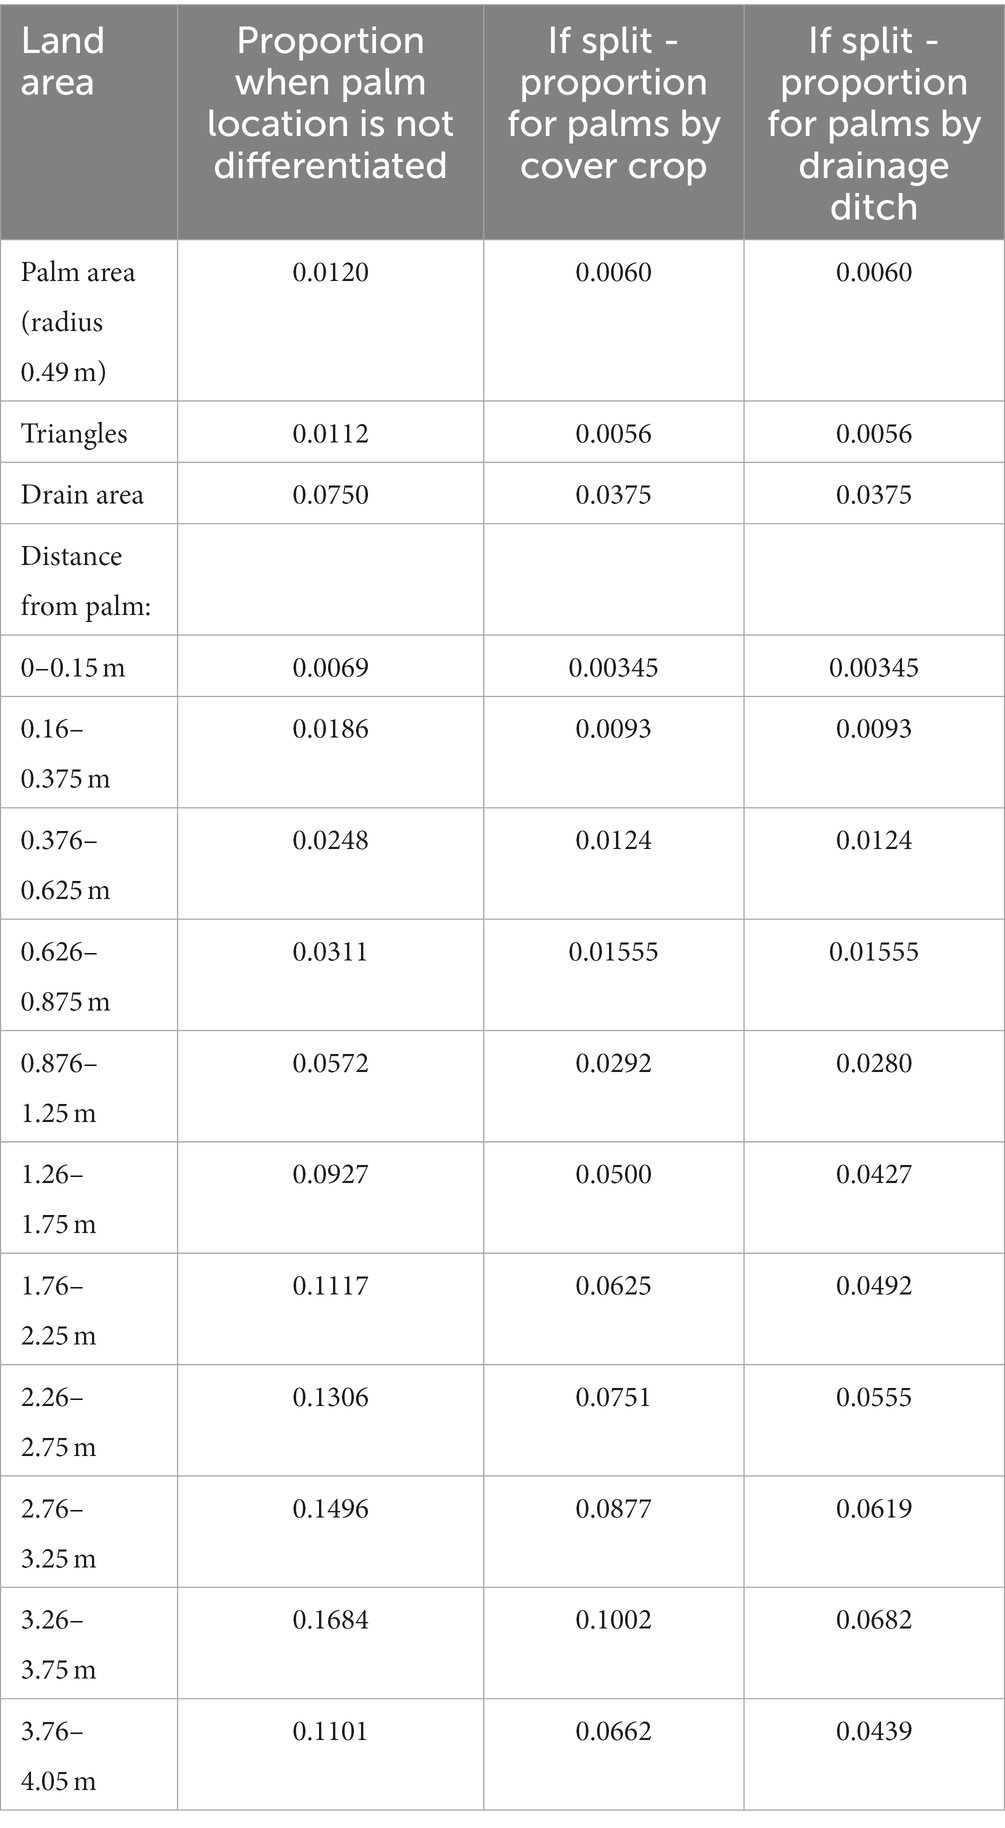
Table 1. The proportional areas for the area-weighted upscaling.
2.10.2 Area-weighted upscaling
Spatial area-weighted estimates of Rtot were performed to derive more accurate plantation-level estimates of soil CO2 fluxes. Here, areal fractions were estimated for each distance class surrounding the palm (0, 0.25, 0.5, 0.75, 1, 1.5, 2, 2.5, 3, 3.5 and 4 m from the palm; Figure 1; Table 1). Mean Rtot was estimated for each fraction and then multiplied by the values in Table 1, which have been calculated to correct for the spatial area of the drainage ditches. The different microforms were also given equal weighting within each ring, due to them taking up equal areal space in this plantation. The scaled Rtot values were then summed to get plantation level fluxes.
Slightly different approaches were used for Rh and Ra:
• Distance from palm – The straight mean averaging Rh estimate was multiplied by 0.91, to take into account the area of the drainage ditches and the area beneath the palms (it was assumed that the gasses produced beneath the palms were either transported to the atmosphere through the surrounding bare soil or through the palm roots as shown with CH4 in Manning et al., 2019). Ra was estimated by subtracting this Rh from the area-weighted upscaling Rtot.
• Linear regression method – The method in section 2.9 was first used to get individual estimates of Rh and Ra by collar. Mean Rh and mean Ra were estimated at each difference distance class. Finally Rh and Ra were spatially weighted, by multiplying the values by the proportions in Table 1, to get the area-weighted upscaling estimates.
2.11 Bootstrapping confidence intervals
The standard deviation was used to determine the confidence intervals (CIs) for the straight mean averaging estimate of Rtot and the straight mean averaging estimate of Rh and Ra calculated using the distance from palm method. It was possible to scale these CI for the distance from palm area-weighted upscaling estimate. Confidence intervals for Rh calculated using the linear regression method were found by estimating confidence intervals for the linear regression line and the estimates at the intercept were used for the Rh estimate. CIs for Ra using the linear regression method were found using the combination of errors technique.
These methods of determining CIs could not be applied to area-weighted upscaling estimates of Rtot or Rh and Ra estimated using the linear regression method. In these instances, CIs were determined by resampling the data in R 10,000 times, repeating the upscaling analysis and determining the 5th and 95th percentile mean estimate. CIs for the distance from palm area-weighted upscaling Ra were found using the combination of errors technique.
2.12 Statistical analyses
All statistical analyses were performed using R version 2.15.1 (see footnote 1). The estimates of Rh and Ra used for statistical analysis were taken from the method described in section 2.9 in order to obtain individual points.
Linear models were used to determine how Rtot, Ra and root density varied with distance from palm and with sampling transect. Tukey HSD tests were used for post hoc analyses, using the ANOVA function in R. Kruskal-Wallis tests were used for Rh. Nemenyi tests using Tukey HSD were used for Kruskal-Wallis post hoc analyses (R package: PMCMR v4.3; Pohlert, 2018). Following each statistical model, the fixed effect (and where necessary also random effect) residuals were considered for normality using Shapiro–Wilk normality tests, heteroscedasticity and equal variance.
Linear models were used to determine whether environmental variables were significantly different between distance from palm or the different surface management microforms. A log transformation was used for soil moisture and Box Cox transformations were used for soil carbon (lambda = 3.9), soil nitrogen (lambda = −2.05), soil C:N (lambda = 1.55) and soil pH (lambda = 3) to achieve normality with the model residuals.
The effects of environmental variation on Rtot were considered using a linear mixed effect model using the nlme package in R (Pinheiro et al., 2017). The fixed effects in the model included soil moisture, soil temperature, air temperature, root density and an interacting fixed effect factor between soil pH and soil surface microform transect. Distance from palm was included as a random effect.
2.13 Quantifying the implications of sampling strategy and effort on estimating soil carbon dynamics
Variation in the plantation-scale estimates of Rtot, Rh and Ra were assessed based on:
1. Partitioning methodology
2. Sample size
3. Sampling design
4. Including and excluding the rhizosphere
5. Including or excluding microforms
In order to assess variation in Rh due to partitioning methodology, the variation in Rh estimates produced in this study was considered. To assess sample size, subsets of the data were resampled from the dataset at sample sizes 5, 10, 20, 35 and the entire dataset. Rtot, Rh and Ra were then estimated using straight mean averaging. Furthermore, a power analysis was applied to the dataset to determine the number of samples needed to accurately estimate Rtot, using the method in Metcalfe et al. (2008). Here Equation 3 was applied to the dataset:
where tα is the statistical significance wanted for the power analysis (here 0.05), CV is the sample coefficient of variation, and D is the specified confidence interval (here 10; Hammond and McCullagh, 1978).
With the intention of assessing variation in Rtot, Rh and Ra due to sampling design, random sampling with straight mean averaging and spatial sampling with area-weighted upscaling were compared. To show the variation in Rtot, Rh and Ra whether the rhizosphere was included or not, plantation-scale estimates of Rtot, Rh and Ra were estimated with and without rhizosphere data. Similarly, to consider whether including or excluding the different surface microform data, plantation-scale estimates of Rtot, Rh and Ra were considered for the different sampling scenarios with the harvest path data only or with the full dataset (Supplementary Tables S1, S2).
3 Results
3.1 Within plantation spatial variability in Rtot, Rh, Ra and root density
3.1.1 Rtot
Mean Rtot was 0.245 ± 0.017 g CO2-C m−2 h−1 (Table 2). Rtot showed significant spatial variation within the oil palm plantation, with measurements ranging from 0.025 to 1.79 g CO2-C m−2 h−1. Rtot varied significantly between the six different palm subplots within the plantation (ANOVA: F = 8.61; d.f. = 5, 169; p < 0.0001).
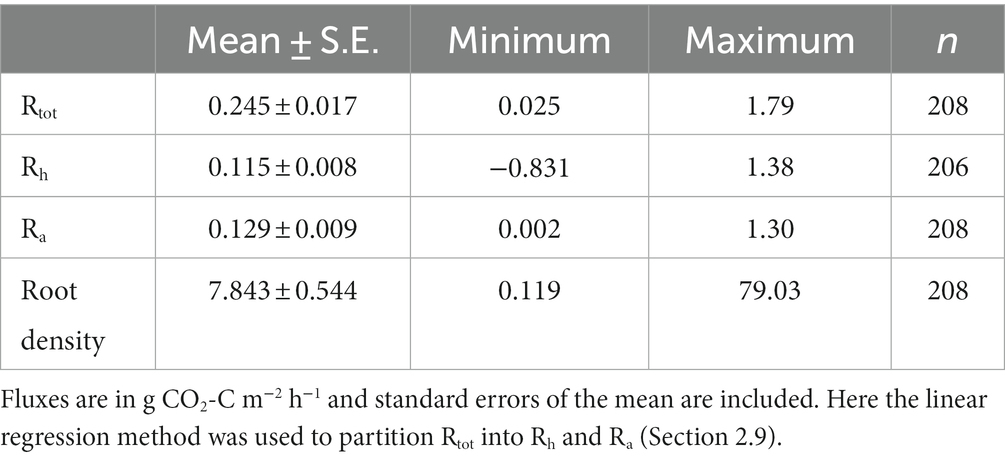
Table 2. Summaries of the mean, minimum, maximum and number of Rtot, Rh, Ra and root biomass measured (Rtot and root biomass) or modeled (Rh and Ra) in this study.
In each subplot, the highest Rtot fluxes were measured next to the palm (Figure 3). Rtot decreased significantly as distance from palm increased (ANOVA: F = 38.36; d.f. = 1, 169; p < 0.0001) until 0.75 m. Thereafter, there was no significant difference in mean Rtot as the distance from palm increased (Figure 3).
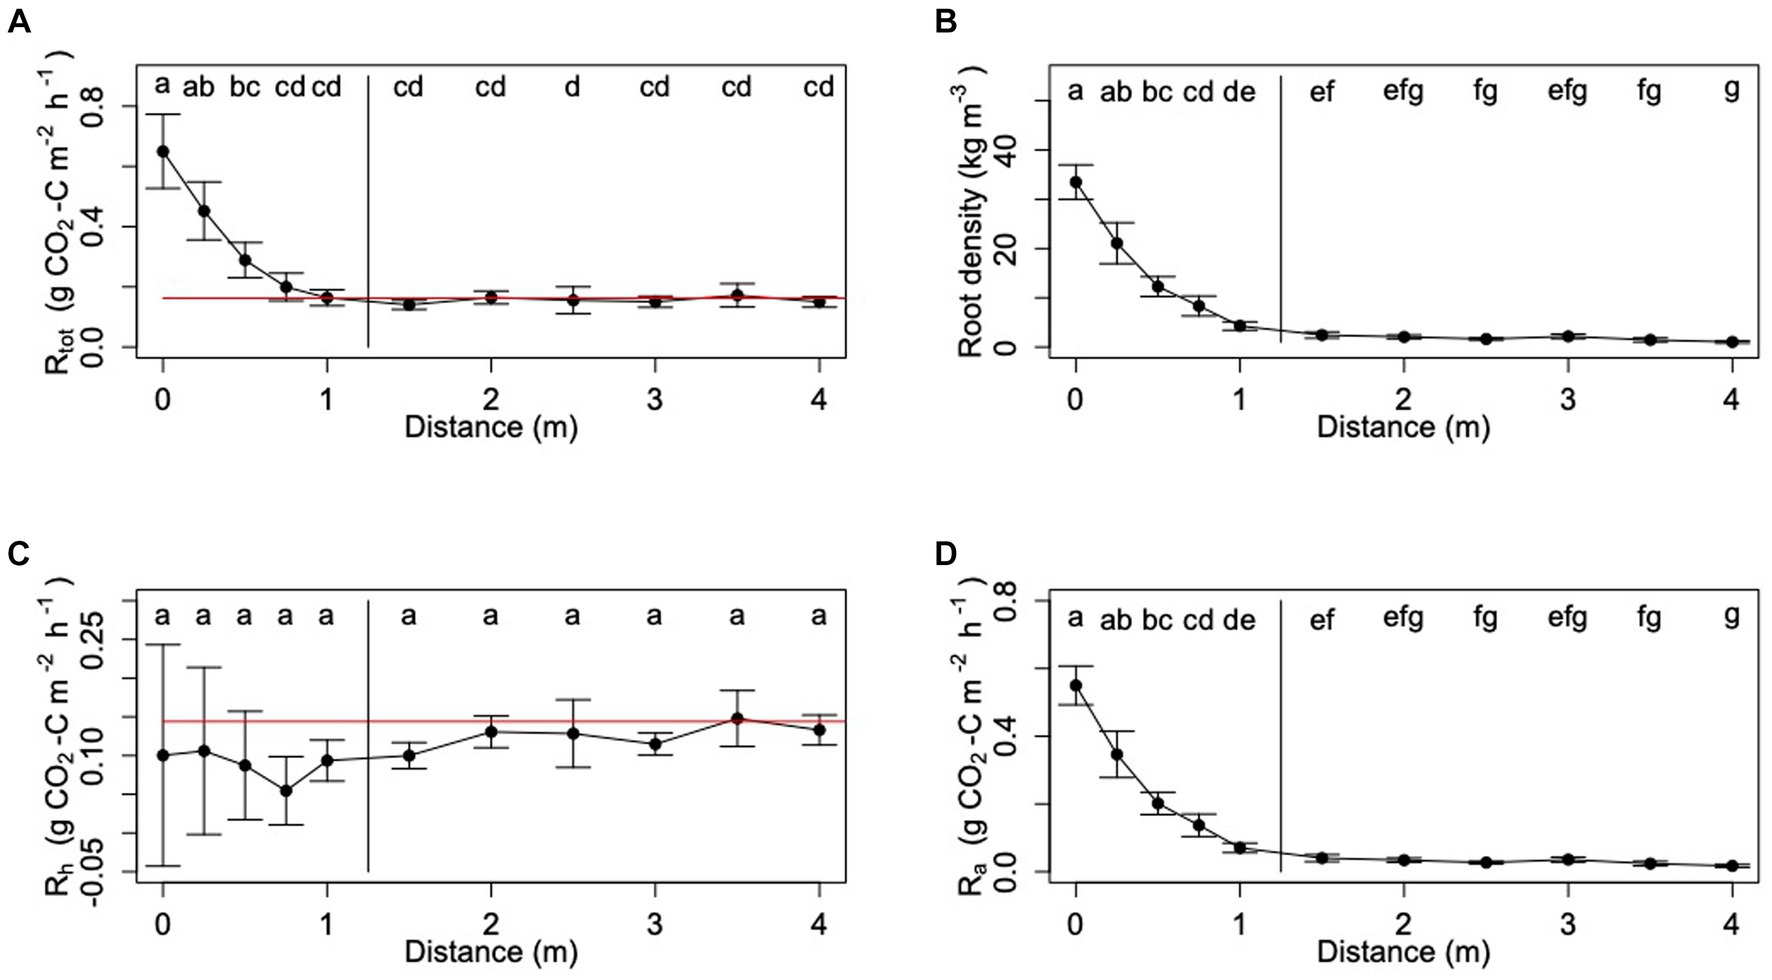
Figure 3. Trends in (A) Rtot, (B) root density, (C) Rh and (D) Ra as a function of distance from palm. For panels (C) and (D), Ra and Rh are estimated using the linear regression equation substitution method. Lower case letters indicate statistically significant differences between means (Tukey-Kramer HSD: p < 0.05).
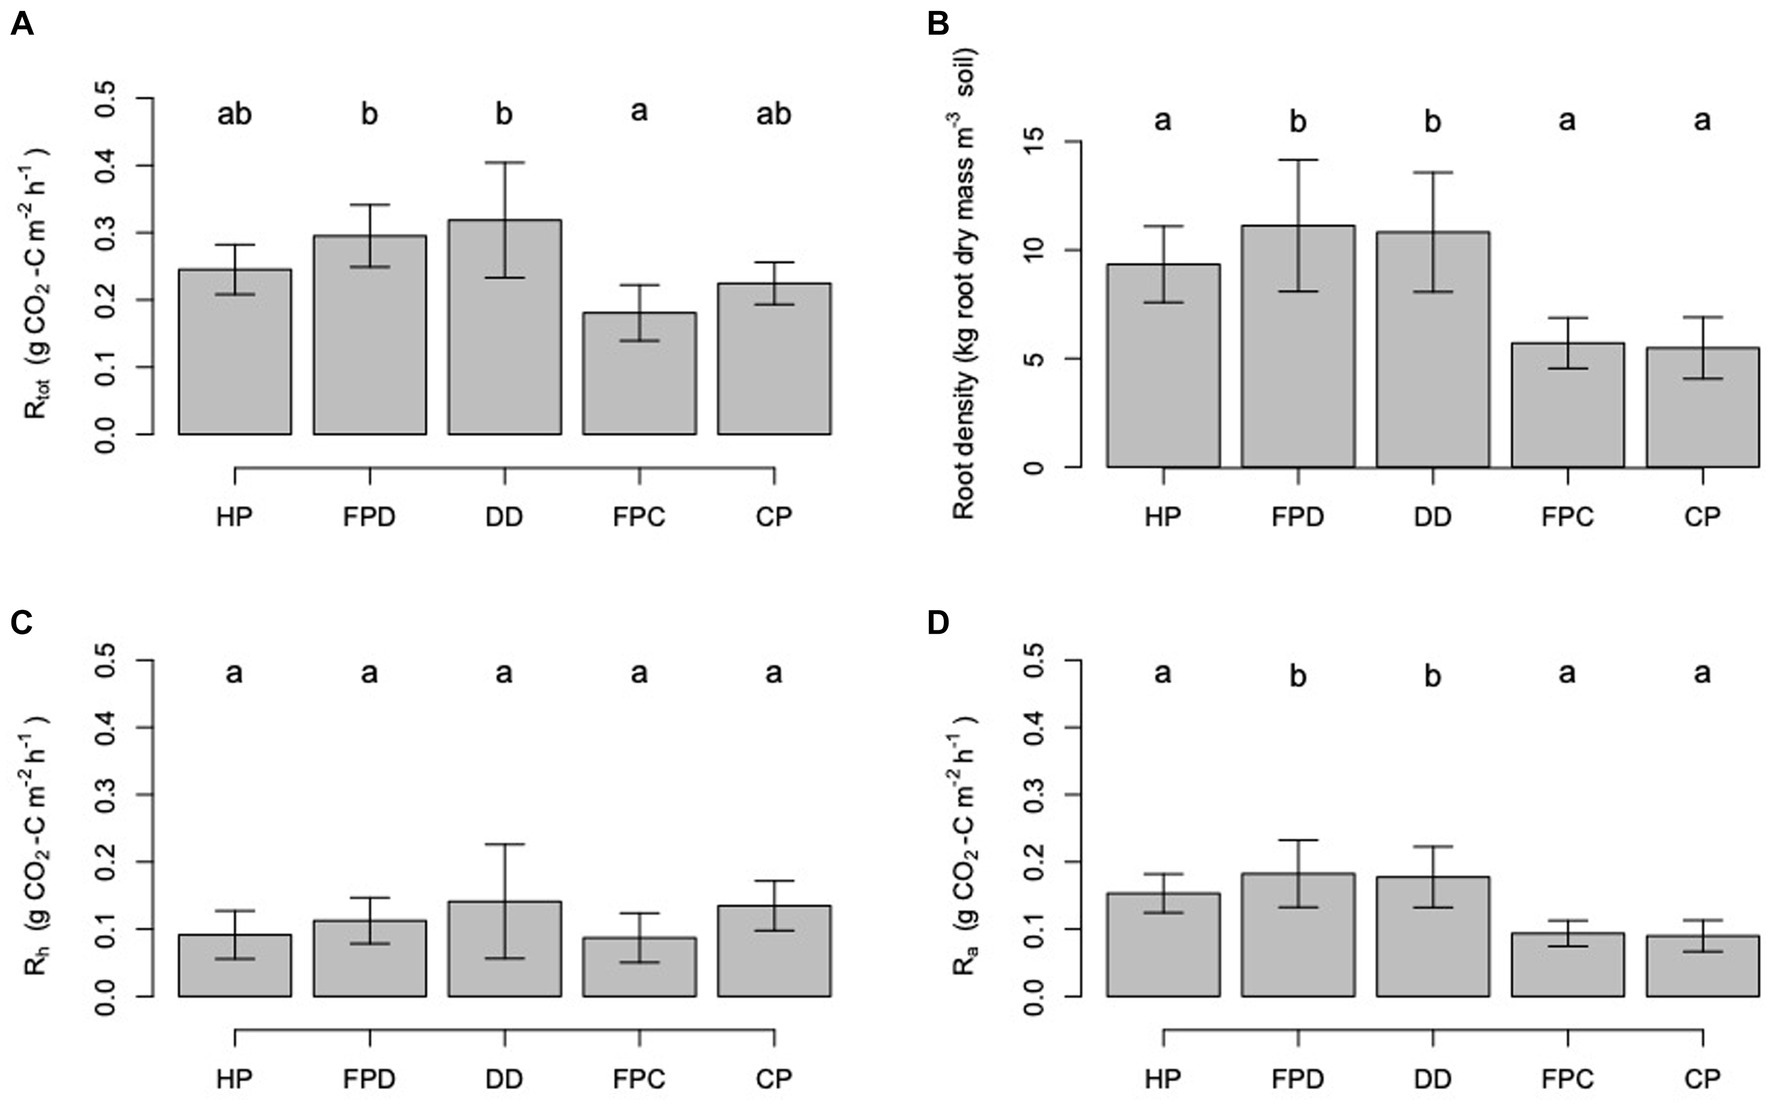
Figure 4. Trends in mean (A) Rtot, (B) root density, (C) Rh and (D) Ra as a function surface microform transect. HP stands for harvest path, FPD stands for frond pile next to the drainage ditch, FPC stands for frond pile next to the cover plants, CP stands for cover plants and DD stands for towards the drainage ditch. Letters signify significant difference between the results. Error bars show the standard errors of the mean.
Rtot varied significantly among the different surface management microforms (ANOVA: F = 2.56; d.f. = 4, 169; p = 0.04; Figure 4). Rtot fluxes were highest measured from the transects going towards the drainage ditches and the frond piles next to the drainage ditches, and lowest from the frond piles next to the cover plants and the cover plants.
Within each surface management microform, Rtot varied significantly with increasing distance from the palm (ANOVA: F = 5.90; d.f. = 4, 169; p = 0.0002; Figure 5). In the harvest path transect, Rtot decreased significantly as distance from palm increased to 1 m, and then Rtot did not vary significantly. In the other transects, Rtot showed decreasing trends with distance from palm until set distances, and then did not vary. These trends were not statistically significant. The distance where Rtot stopped decreasing was 0.75 m distance from the palm in both the transect going towards the frond pile next to the cover plants and the transect going towards the drainage ditch, and 3 m distance from the palm in the transect going towards the frond pile next to the drainage ditch.
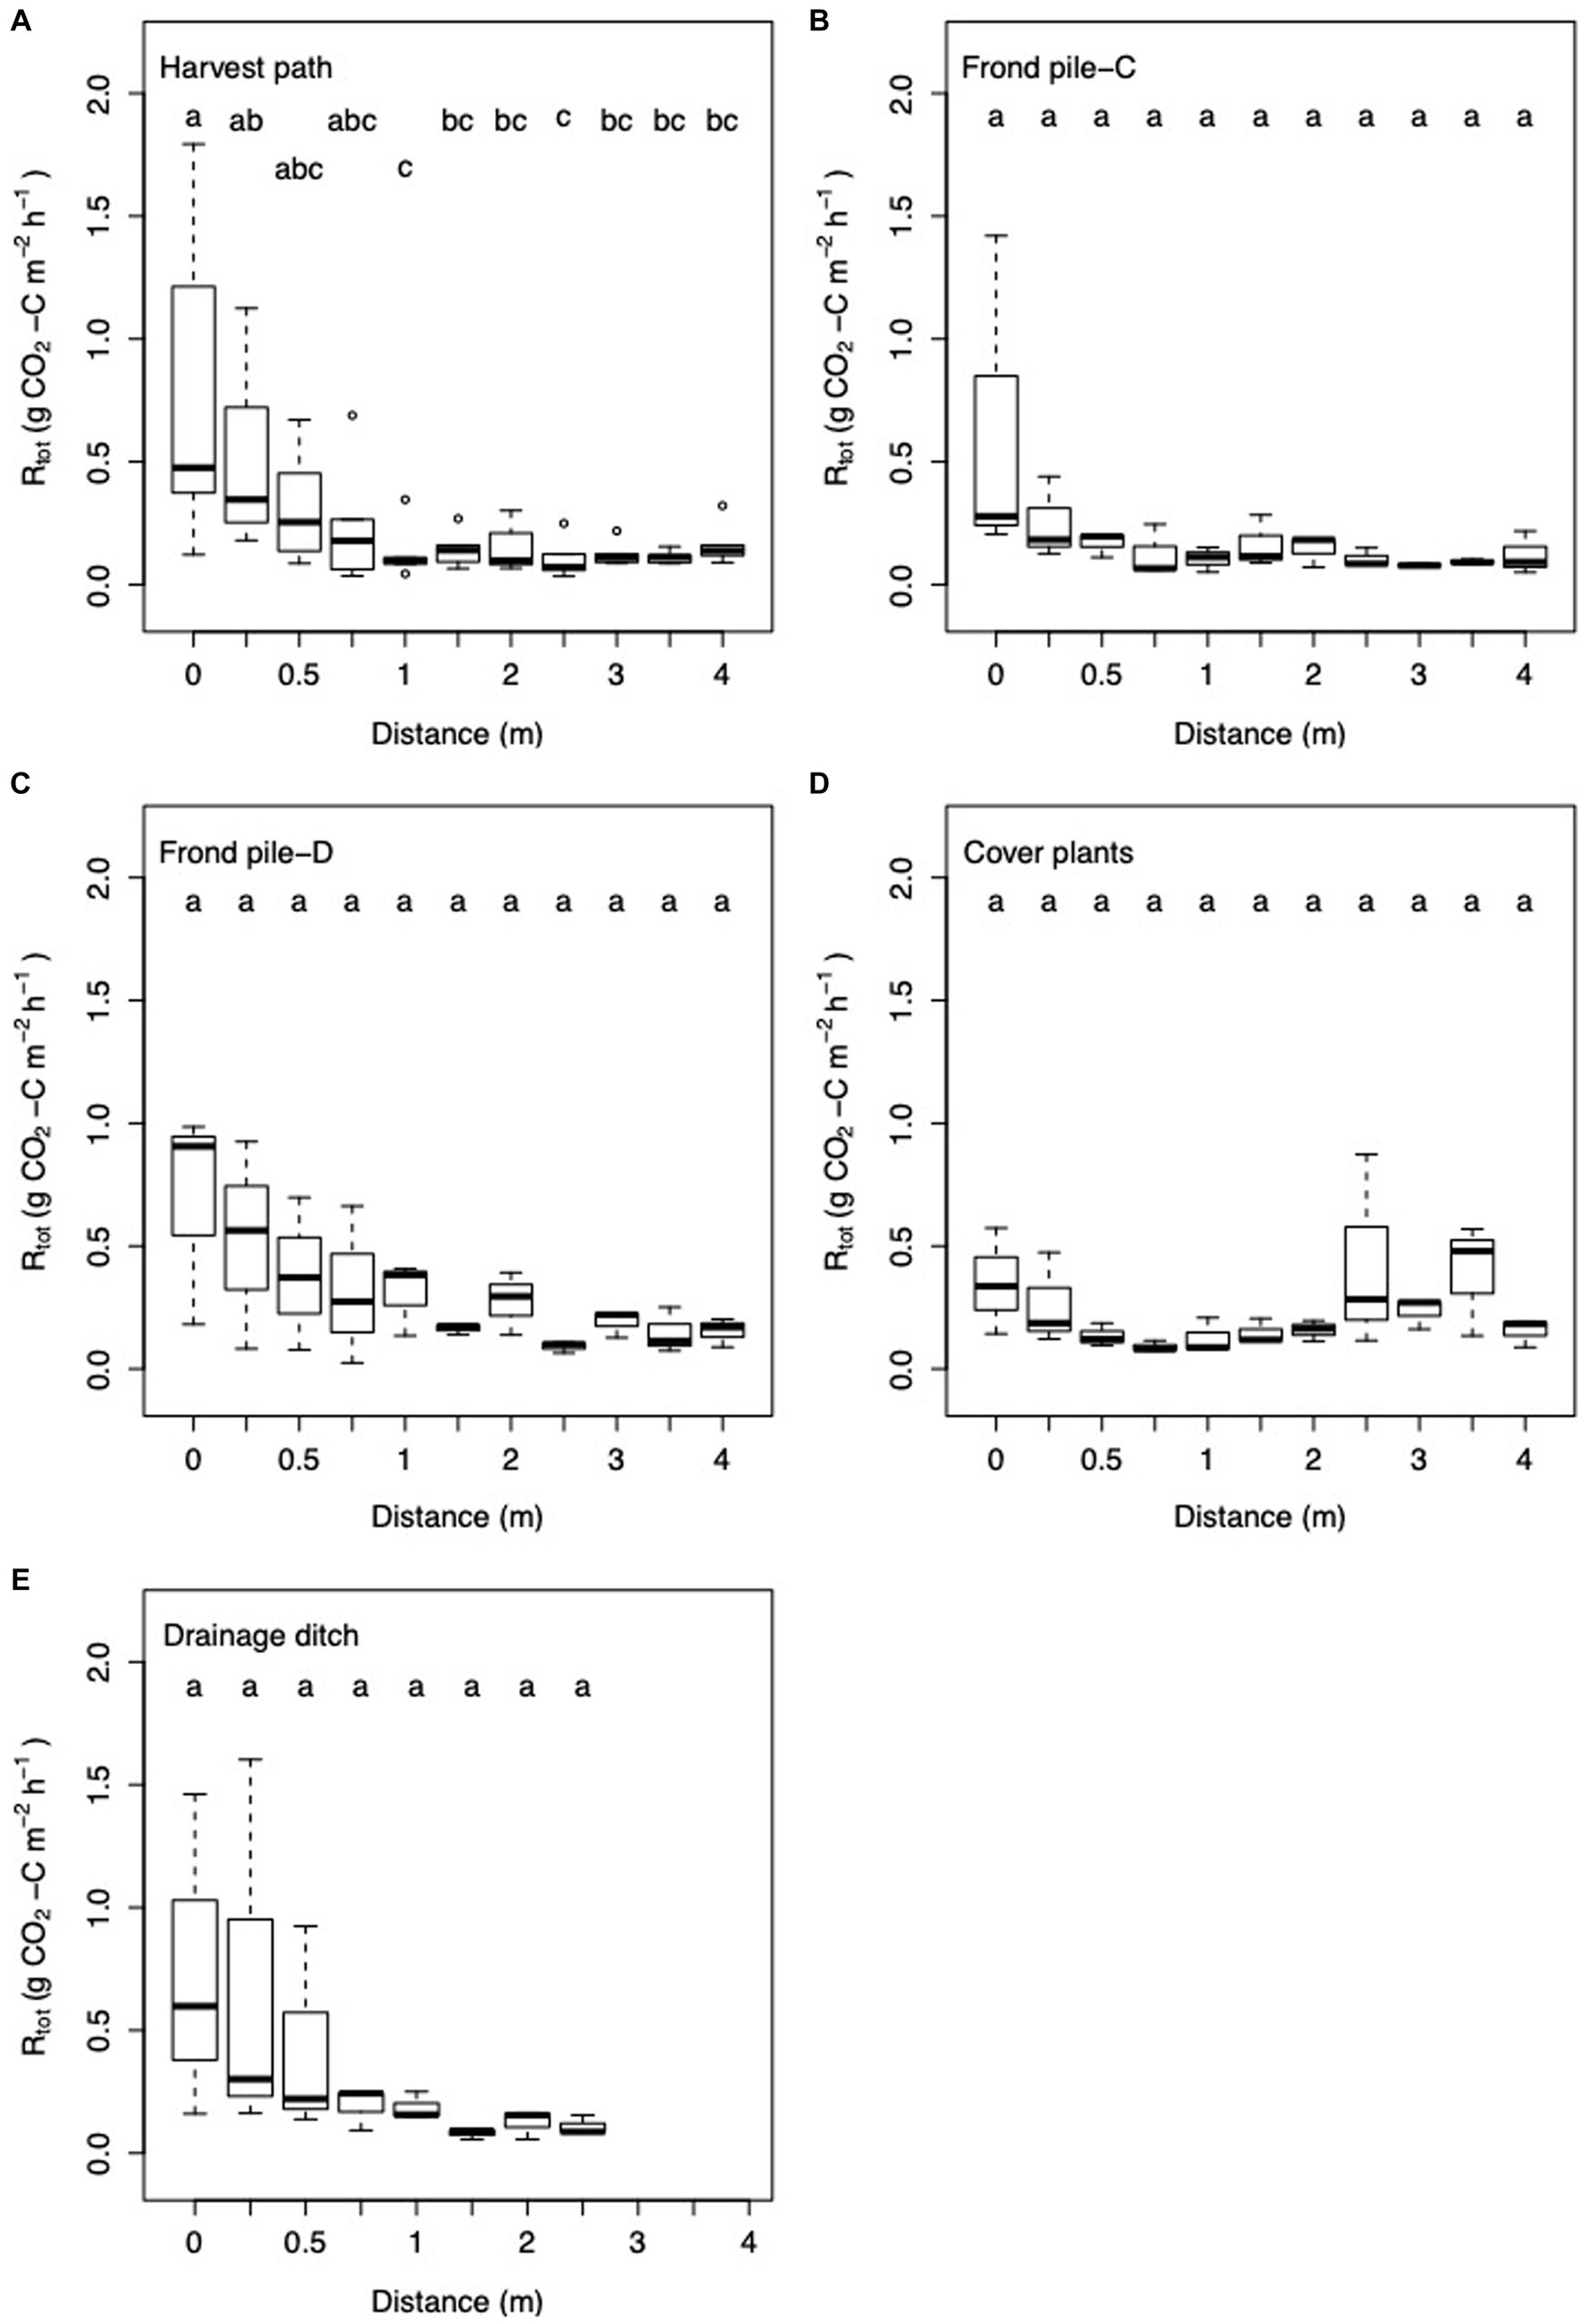
Figure 5. Box and whisker plot of Rtot with increasing distance from palm in the (A) harvest path (n = 64); (B) frond pile next to the cover plants, Frond pile-C (n = 33); (C) frond pile next to the drainage ditch, Frond pile-D (n = 33); (D) cover plants (n = 33); and (E) towards the drainage ditch (n = 24). Letters signify significant difference between the results.
3.1.2 Root density
Sampled oil palm root density varied between 0.119 and 79.03 kg roots m−3 soil with a mean root density of 7.843 ± 0.544 kg roots m−3 soil (Table 2). Root density varied significantly between the six different palms or subplots (ANOVA: F = 6.85, d.f. = 5, 164; p < 0.0001). Root density was greatest next to the palm, with a mean of 33.49 ± 7.36 kg roots m−3 soil measured up to 1 m distance from the palm (Figure 3). Root density decreased with increasing distance from the palm, with significantly less root density at each 0.25 m increment up to 1 m away from a palm (ANOVA: F = 364; d.f. = 1, 164; p < 0.0001). After 1 m, root density did not vary significantly with increasing distance from the palm, giving an average of 1.82 ± 0.30 kg roots m−3 soil from samples taken more than 1 m away from the palm.
Root density varied significantly between the different surface management microforms (ANOVA: F = 6.83; d.f. = 4, 164; p < 0.0001; Figure 4). Root density was highest when sampled from beneath the frond piles next to the drainage ditches. Root density was the lowest when sampled from the frond piles next to the cover plants. In the five different microform transects, root density showed different variation with increasing distance from palm (Figure 6). In each transect, root density was highest at 0 m next to the palm. Comparing the transects, root density was highest at 0 m in the harvest path, drainage ditch and frond pile next to the drainage ditch transects. The frond pile next to the cover plants and cover plants transects had the lowest root density next to the palm. The cover plants transect saw the steepest decline in root density as distance from palm increased, with a slight increase in root density at 4 m distance from the palm.
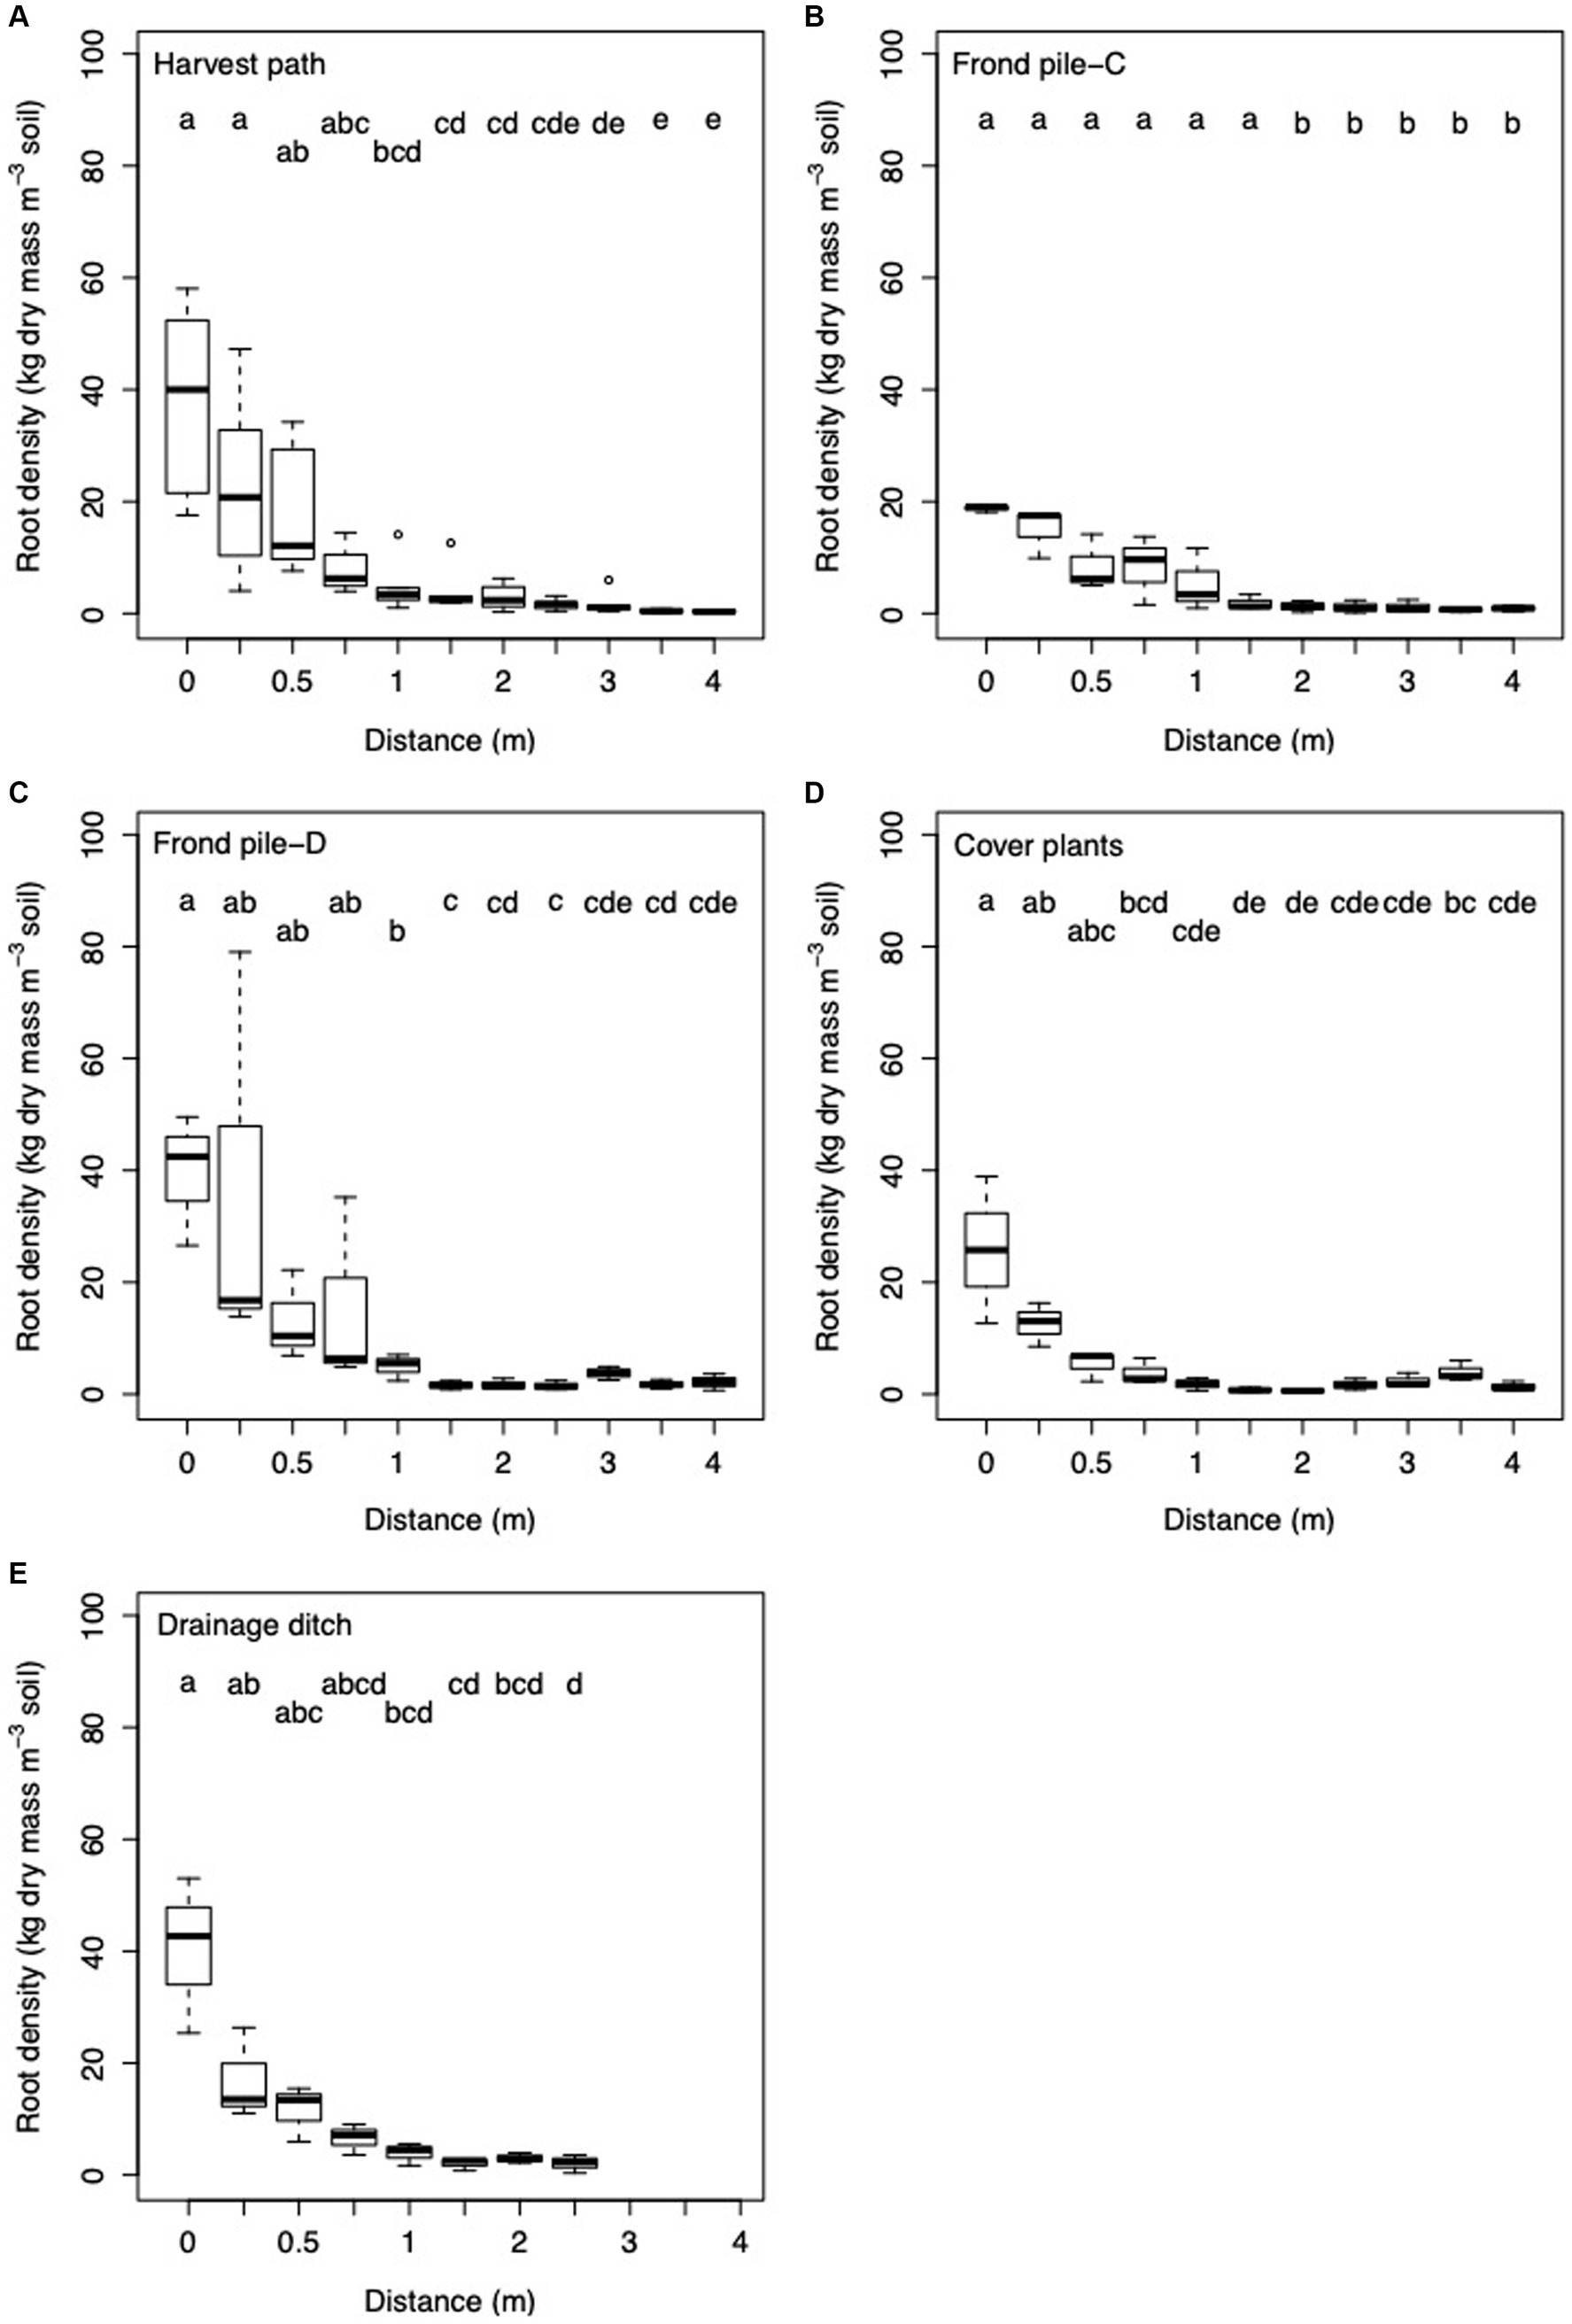
Figure 6. Box and whisker plot of root density with increasing distance from palm in the (A) harvest path (n = 64); (B) frond pile next to the cover plants, Frond pile-C (n = 33); (C) frond pile next to the drainage ditch, Frond pile-D (n = 33); (D) cover plants (n = 33); and (E) towards the drainage ditch (n = 24). Letters signify significant difference between the results.
3.1.3 Heterotrophic respiration (Rh)
Rh estimated using the distance from palm method ranged between 0.147 ± 0.020 g CO2-C m−2 h−1 and 0.162 ± 0.022 g CO2-C m−2 h−1 (Table 3). Rh estimated from the linear regression method ranged between 0.112 ± 0.016 g CO2-C m−2 h−1 and 0.114 ± 0.058 g CO2-C m−2 h−1 (Table 3). Modeling individual Rh using the linear regression gave estimates ranging from −0.831 to 1.380 g CO2-C m−2 h−1, with a mean Rh of 0.115 ± 0.008 g CO2-C m−2 h−1 (Table 2).
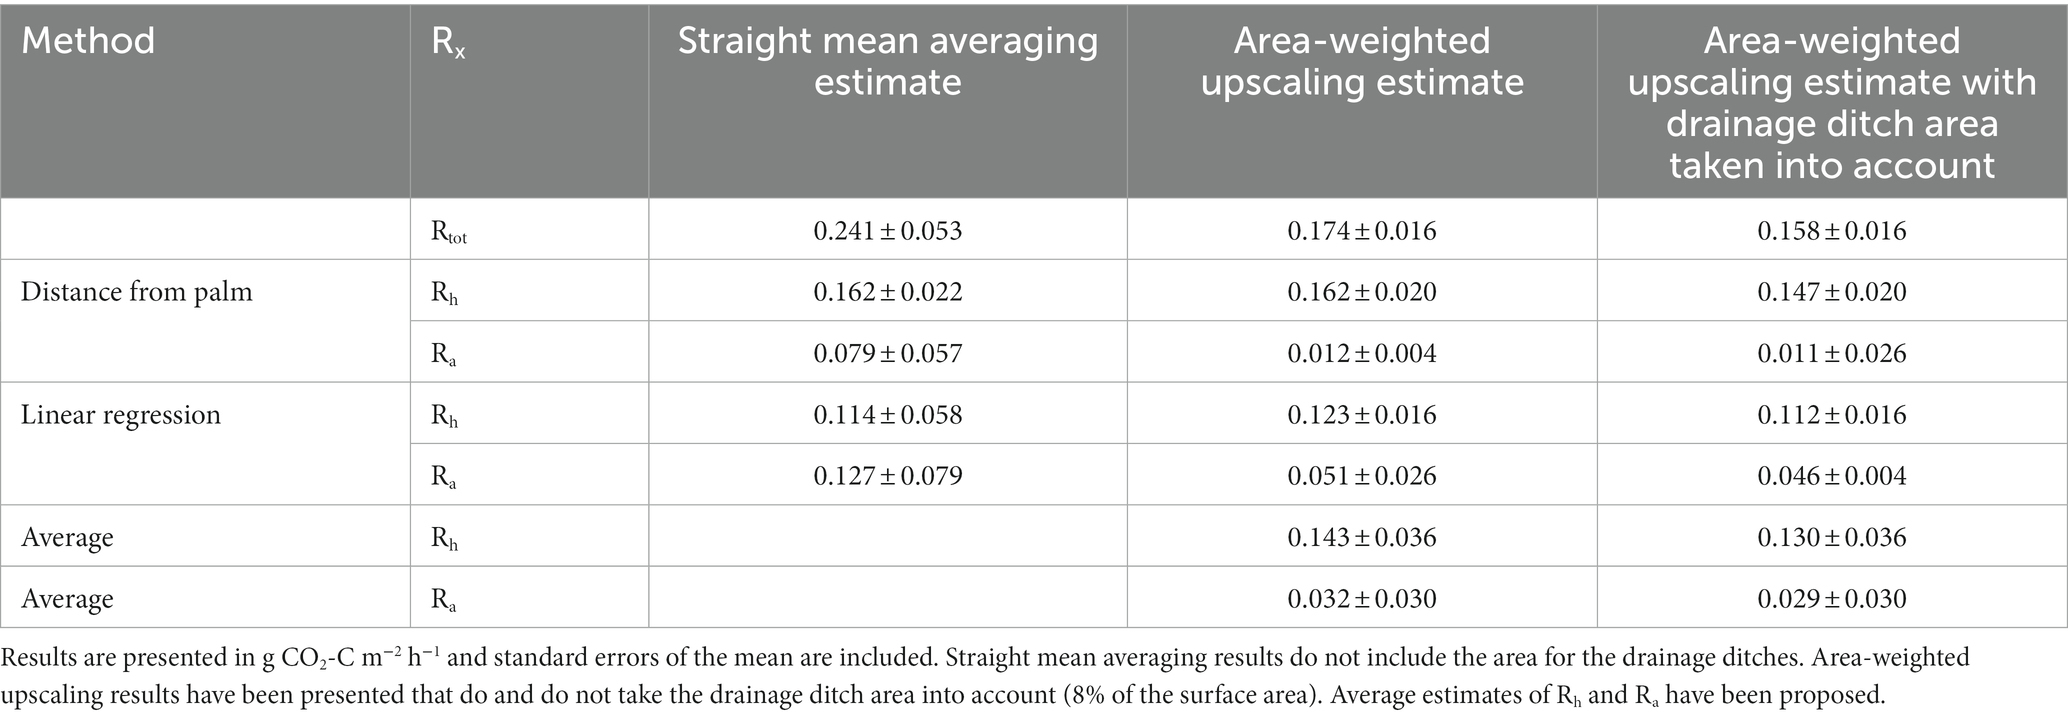
Table 3. Plantation Rtot, Rh and Ra estimates.
Modeled estimates of Rh showed limited spatial variation within the oil palm plantation. Rh varied significantly between the different palm subplots sampled in the oil palm plantation (Kruskal-Wallis: chi-squared = 28.21; d.f. = 5; p < 0.0001). Rh did not vary significantly with distance from palm or between the microforms (Figures 3, 7).
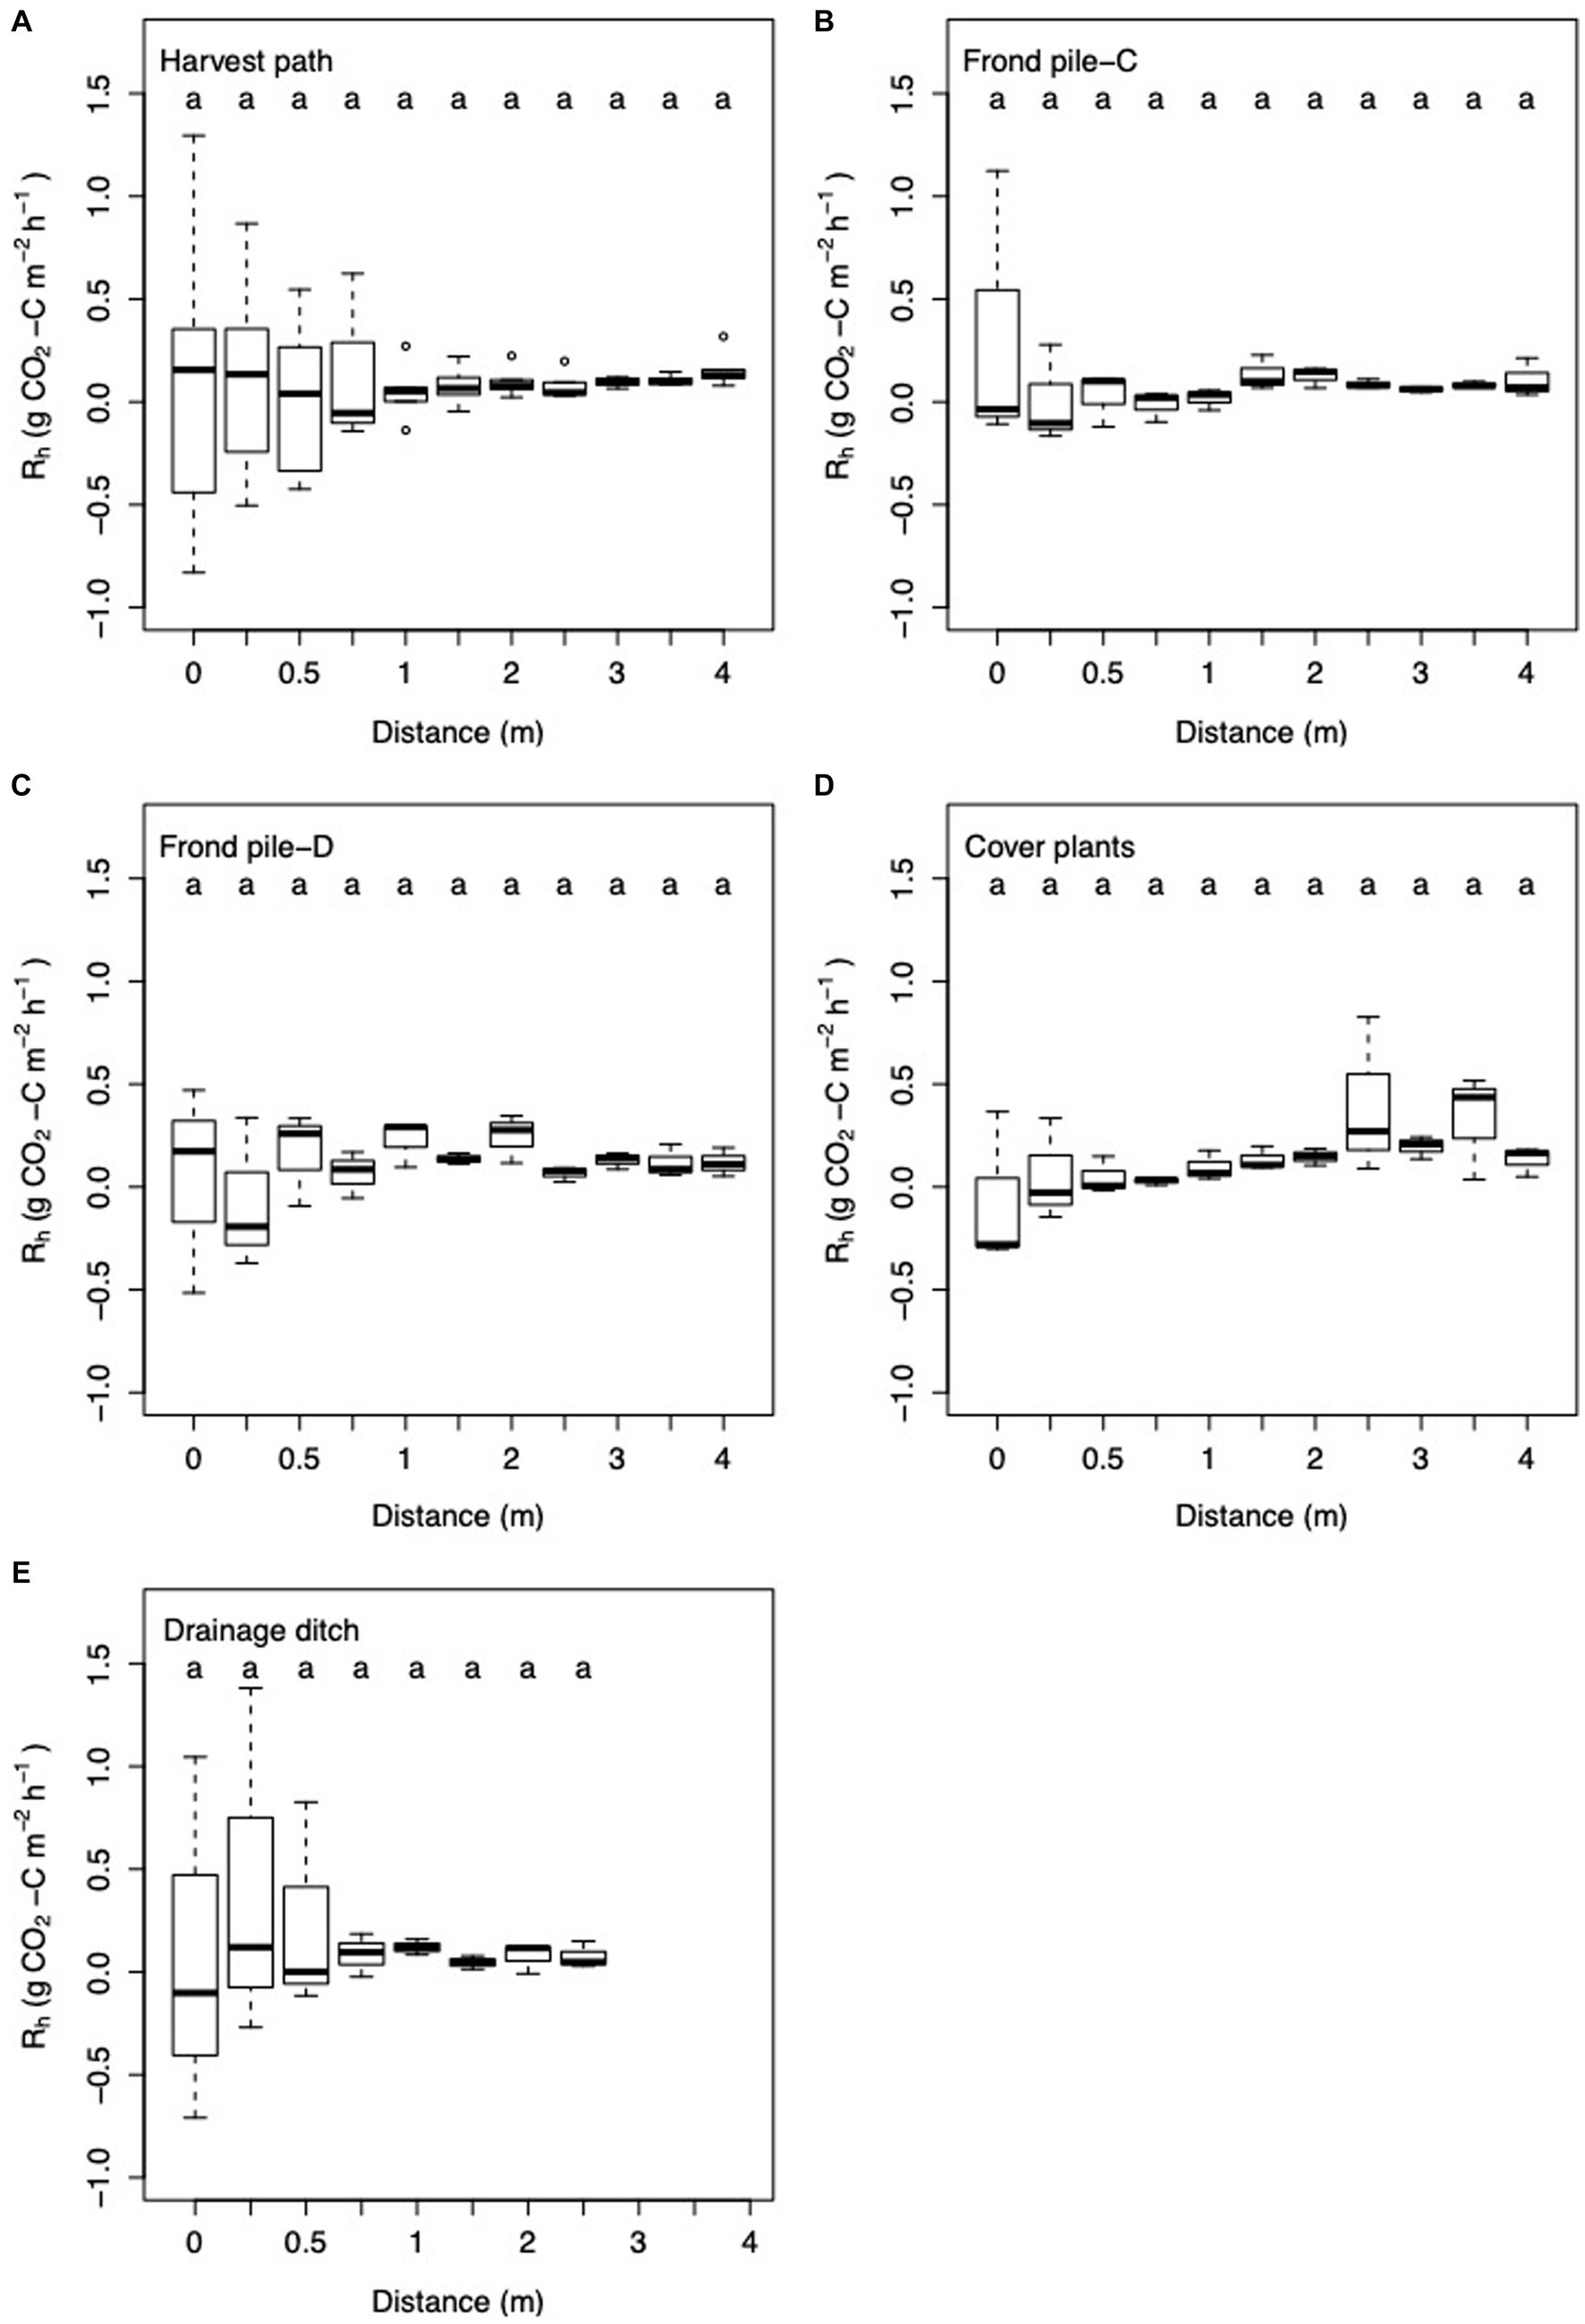
Figure 7. Box and whisker plot of Rh with increasing distance from palm in the (A) harvest path (n = 64); (B) frond pile next to the cover plants, Frond pile-C (n = 33); (C) frond pile next to the drainage ditch, Frond pile-D (n = 33); (D) cover plants (n = 33); and (E) towards the drainage ditch (n = 24). Here the linear regression equation substitution method was used to partition Rtot into Rh and Ra. Letters signify significant difference between the results.
3.1.4 Autotrophic respiration (Ra)
Ra estimated using the distance from palm method ranged between 0.011 ± 0.026 g CO2-C m−2 h−1 and 0.079 ± 0.057 g CO2-C m−2 h−1 (Table 3). Ra estimated from the linear regression method ranged between 0.046 ± 0.004 g CO2-C m−2 h−1 and 0.127 ± 0.079 g CO2-C m−2 h−1 (Table 3). Using the linear regression to model individual Rh and estimating Ra through Equation 2 gave estimates of Rh that varied between 0.002 and 1.297 g CO2-C m−2 h−1 with a mean Ra of 0.129 ± 0.009 g CO2-C m−2 h−1 (Table 2).
Significant spatial variation was seen in Ra measurements. Ra did not vary significantly between the different palm subplots. The highest Ra measurements were taken next to the palm (Figures 3). There were significant reductions in Ra with increasing distance from the palm; the highest Ra fluxes were measured next to the palm and the lowest Ra fluxes were measured after 1 m distance from the palm (ANOVA: F = 364.15; d.f. = 1, 164; p < 0.0001). Ra showed significant variation between the different surface management microform transects (ANOVA: F = 6.84; d.f. = 4, 164; p < 0.0001; Figure 4), with the highest measurements in the frond pile next to the drainage ditch and the drainage ditch transects, and the lowest measurements from the cover plants and the frond pile next to the cover plants transects (Figure 8). Ra was highest next to the palm in the harvest path, frond pile next to the drainage ditch and drainage ditch transects. These transects saw the steepest decline in Ra as distance from palm increased. Ra did vary significantly between the transects outside of the palm rhizosphere (i.e., more than 1 m distance from the palm; ANOVA: F = 8.03; d.f. = 6, 71; p < 0.0001). Here, Ra in the cover plants and the frond pile next to the drainage ditch transects were significantly higher than Ra in the frond pile next to the cover plants transects.
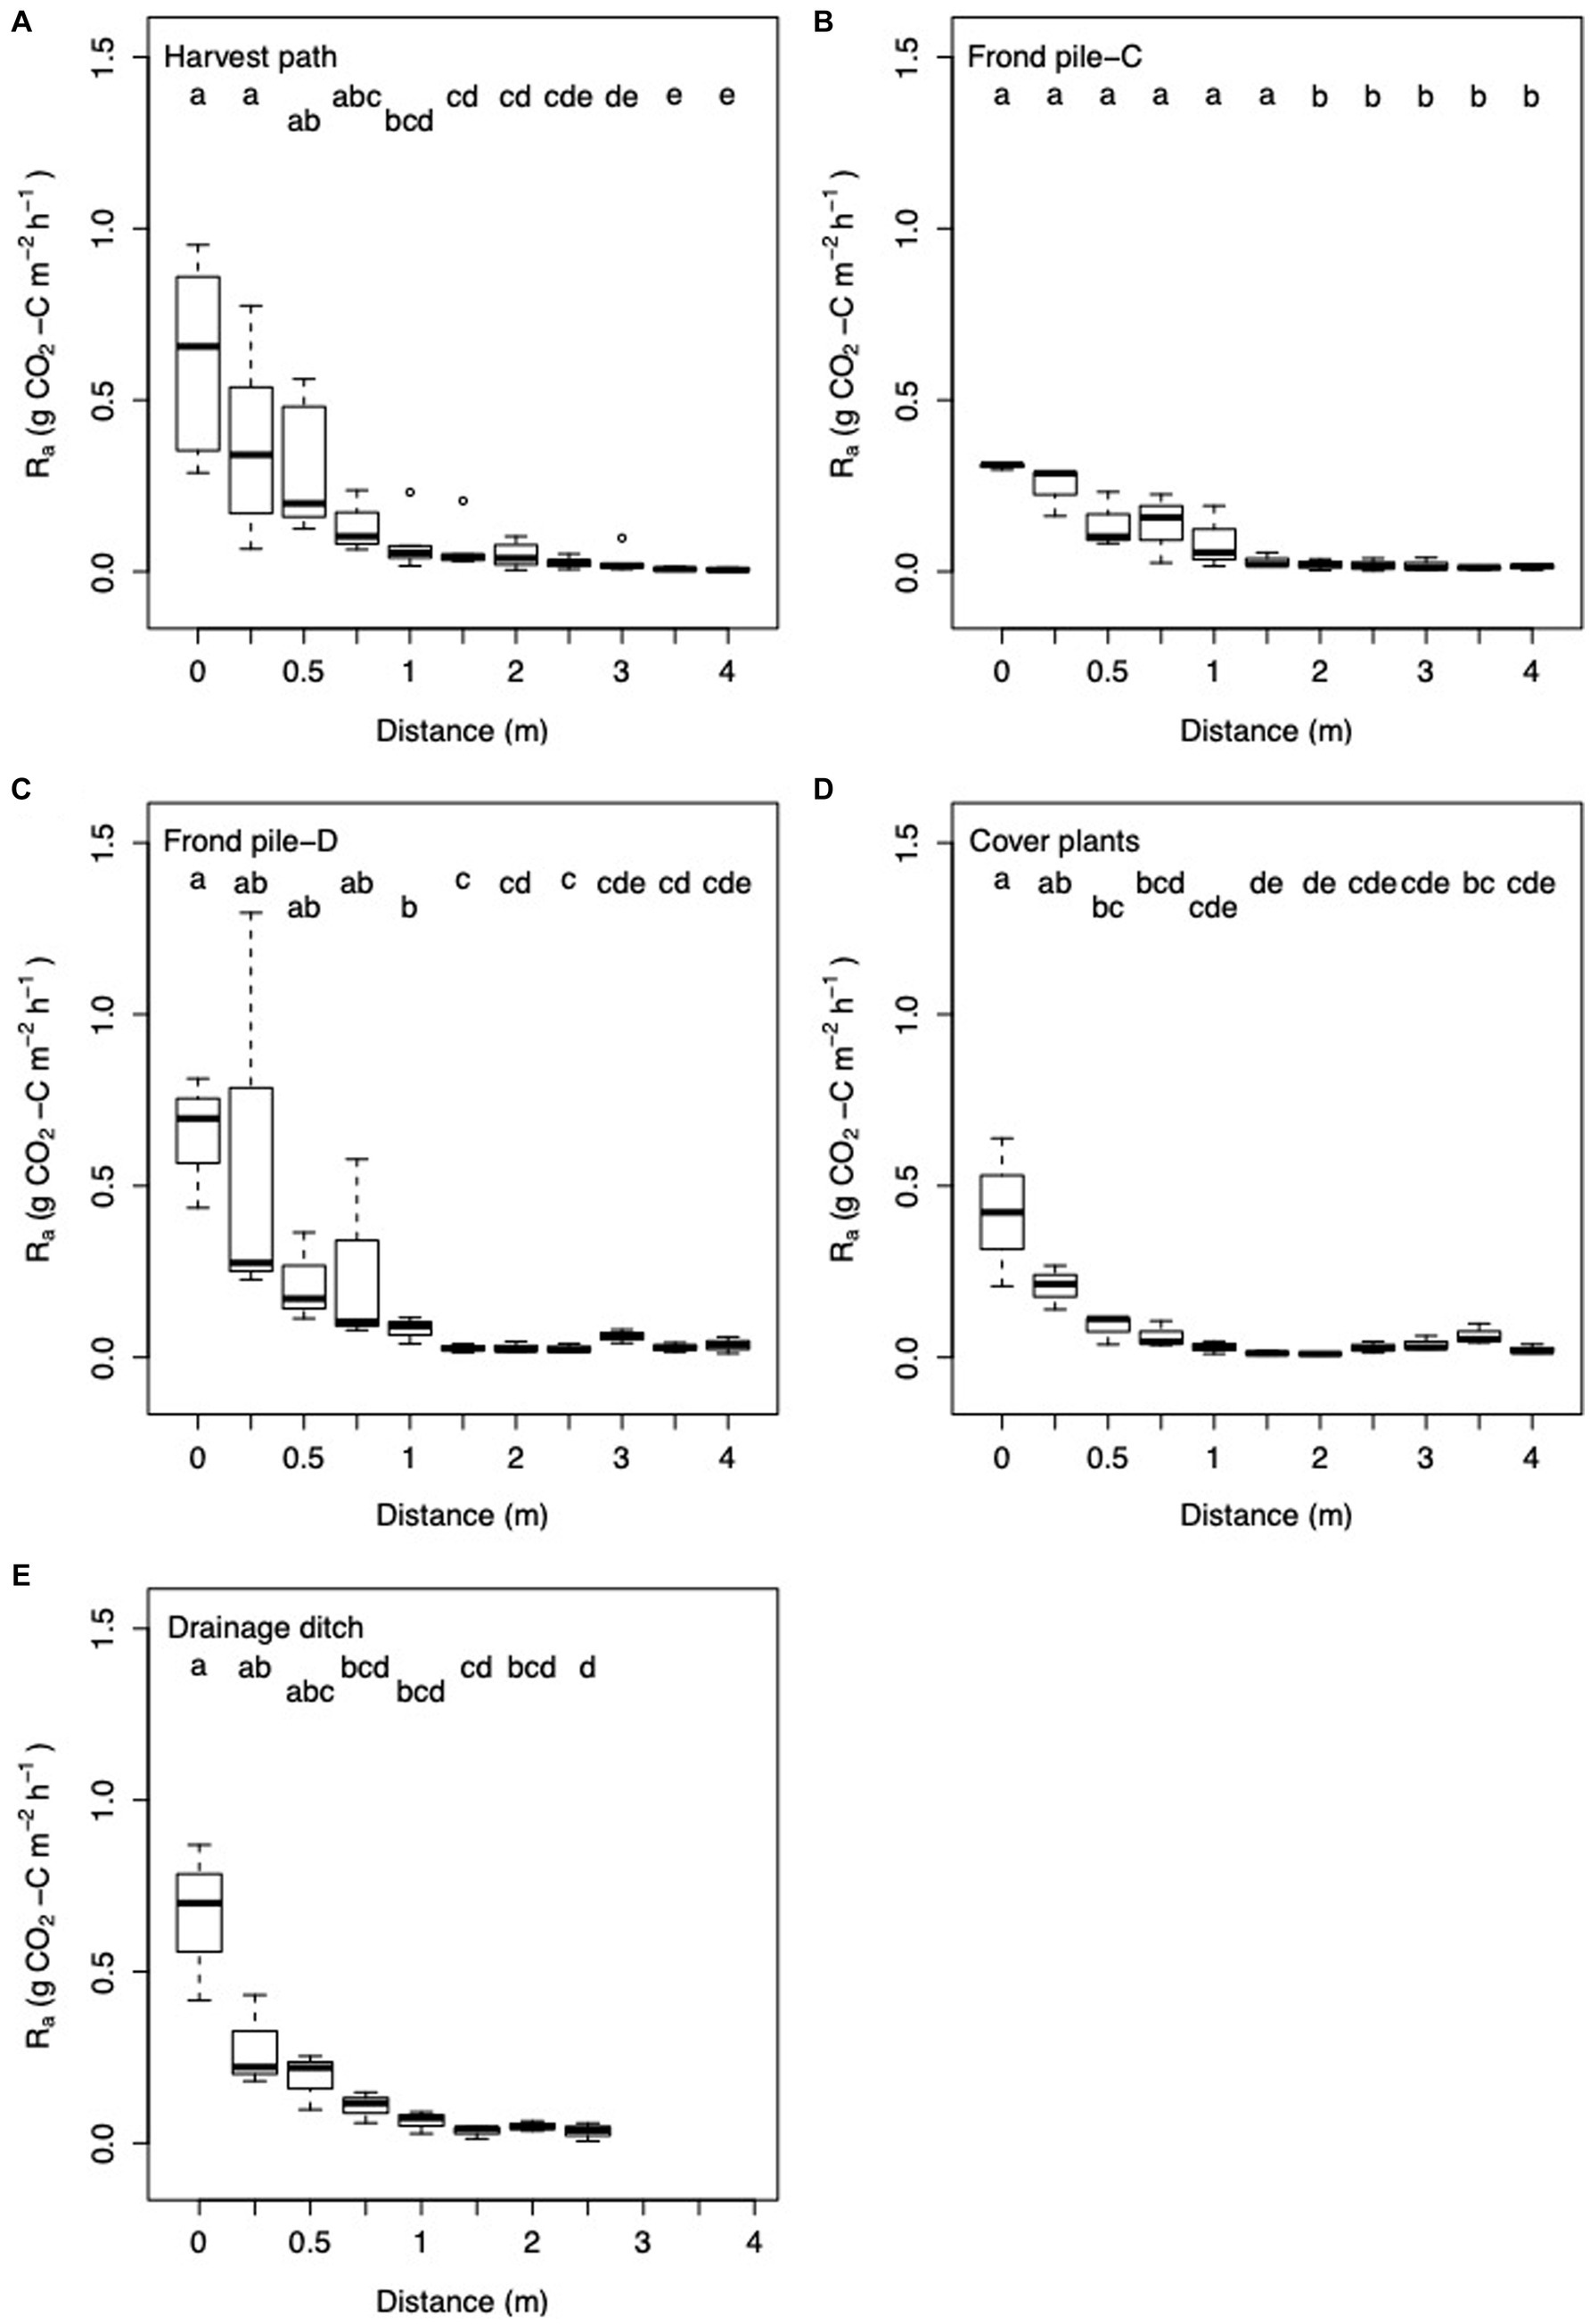
Figure 8. Box and whisker plot of Ra with increasing distance from palm in the (A) harvest path (n = 64); (B) frond pile next to the cover plants, Frond pile-C (n = 33); (C) frond pile next to the drainage ditch, Frond pile-D (n = 33); (D) cover plants (n = 33); and (E) towards the drainage ditch (n = 24). Here the linear regression equation substitution method was used to partition Rtot into Rh and Ra. Letters signify significant difference between the results.
3.2 Effects of environmental variables on Rtot
3.2.1 Variation in environmental variables
WTD ranged from −0.25 m to −0.45 m at the time of the study, with a mean of −0.35 ± 0.03 m. Air temperature ranged from 25.4 °C to 35.9 °C whilst the flux measurements were being taken, with a mean air temperature of 30.0 ± 0.16 °C. Bulk density, soil C, soil N, soil C:N, soil pH, soil moisture and soil temperature are summarized in Table 4. Spatial variation was seen between the different palm subplots for soil temperature, air temperature, soil C, soil C:N, soil N and soil pH (soil temperature: ANOVA: F = 20.00; d.f. 1,163; p < 0.001; air temperature: ANOVA: F = 16.99; d.f. 1,173; p < 0.001; soil C: ANOVA: F = 3.85; d.f. 1,173; p = 0.05; soil N: ANOVA: F = 20.46; d.f. 1,172; p < 0.001; soil C:N: ANOVA: F = 11.65; d.f. 1,176; p < 0.001; soil pH: ANOVA: F = 23.56; d.f. 1,177; p < 0.001). Soil moisture and water table depth did not vary significantly between the different palms.
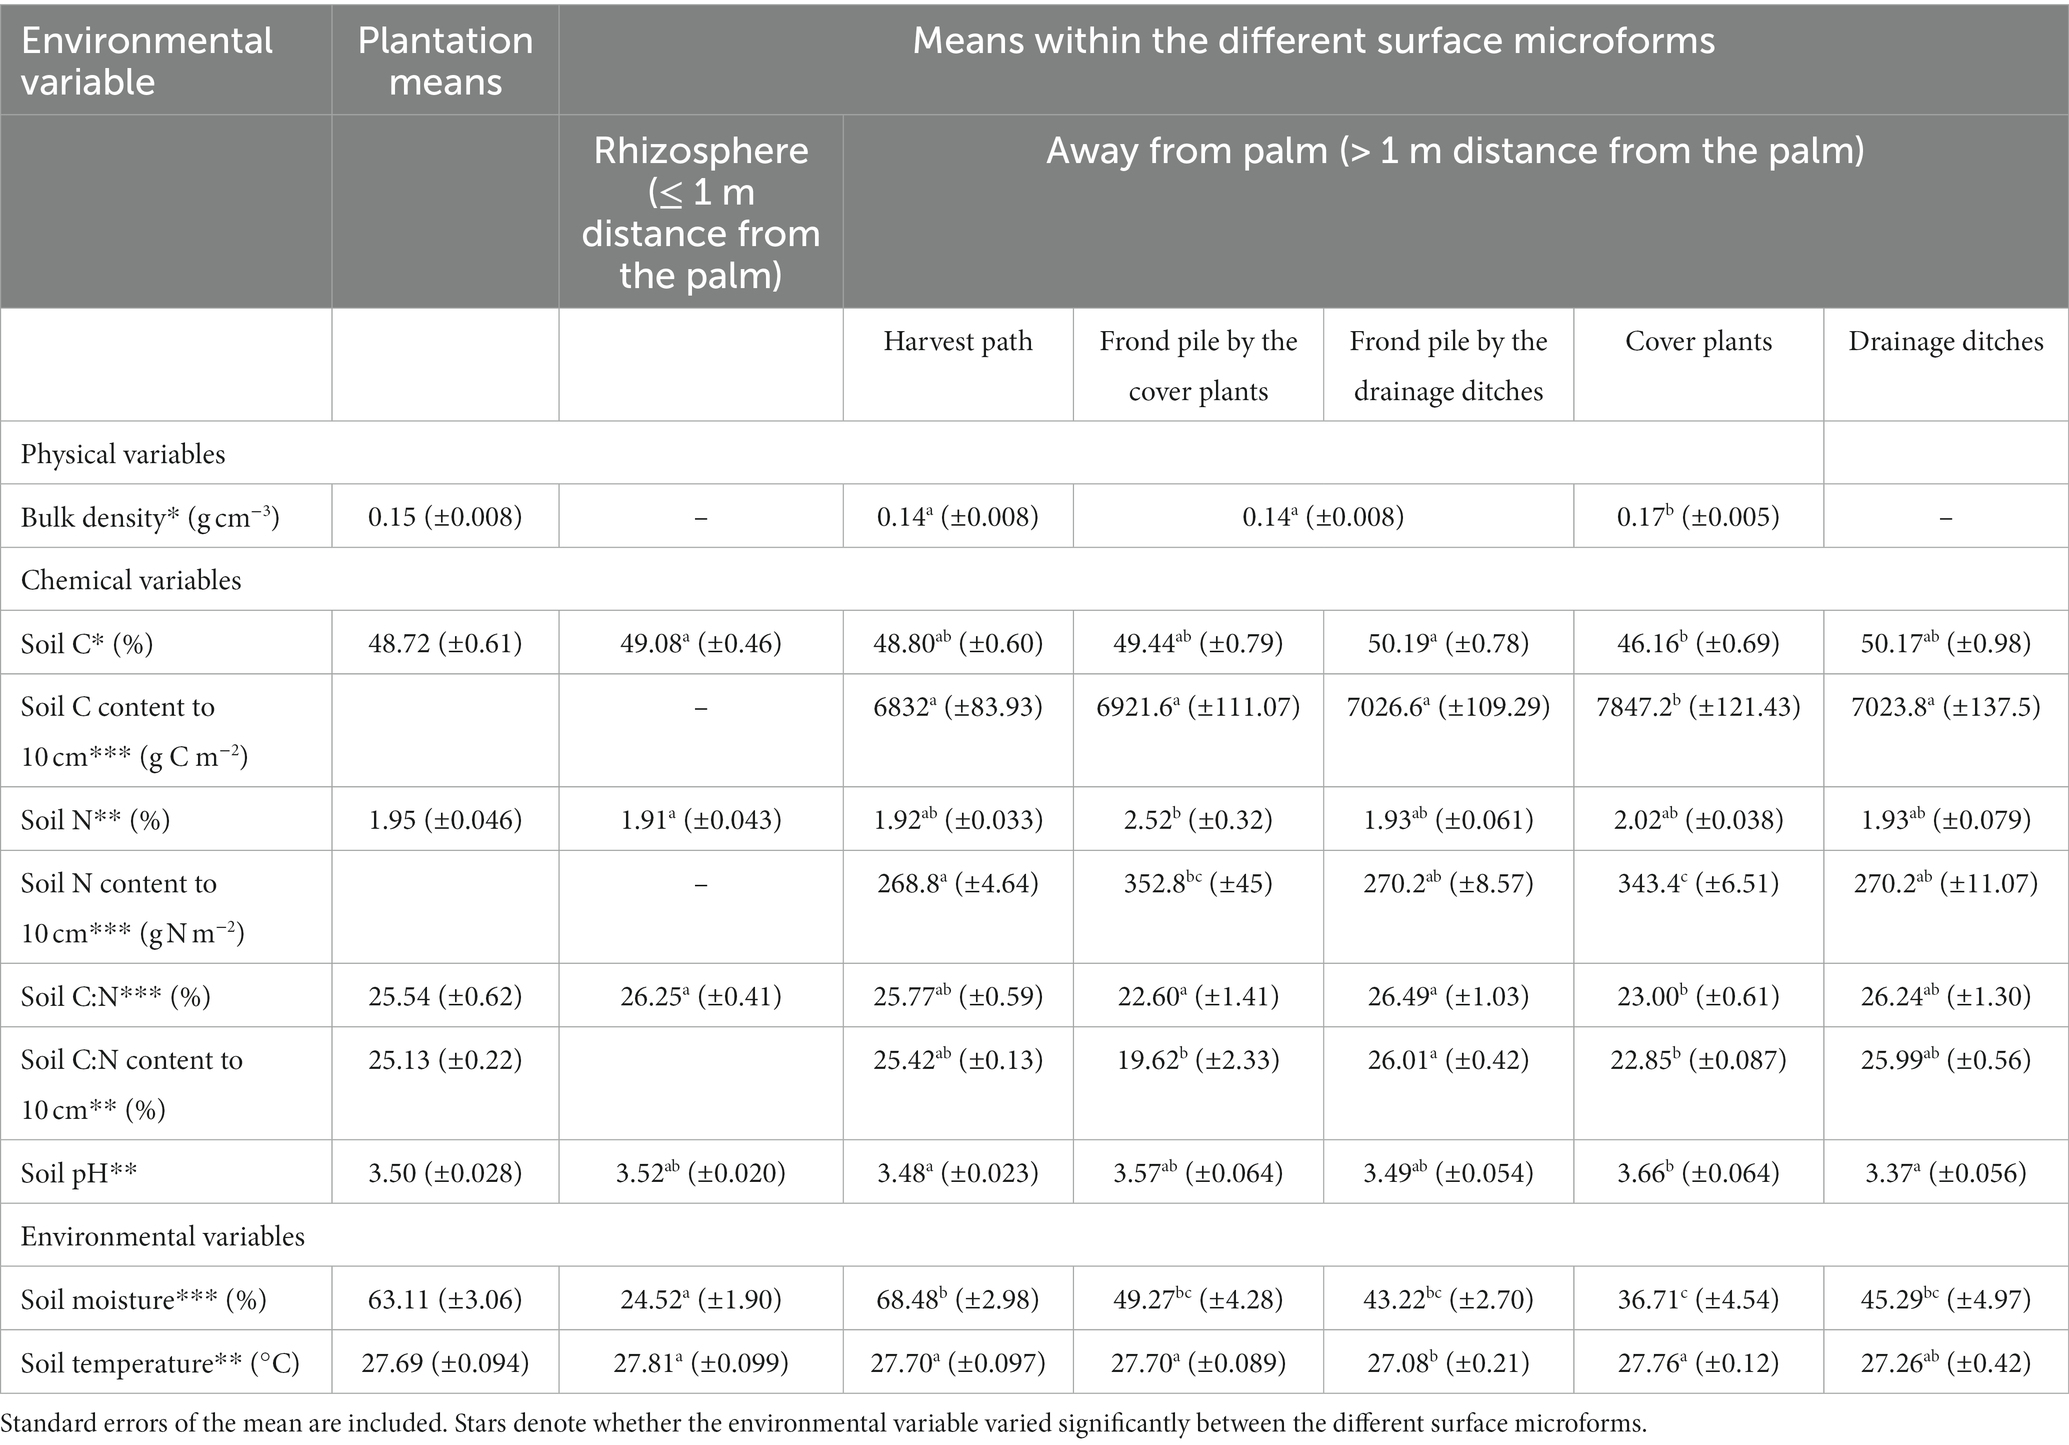
Table 4. Plantation Rtot, Rh and Ra estimates. Results are presented in g CO2-C m−2 h−1 and standard errors of the mean are included. Straight mean averaging results have not been corrected to take the drainage ditch area into account. Area-weighted upscaling results have been presented that do not and do take the proportional area of the oil palm drainage ditches and soil under the palm into account (aka 9 % of the plantation surface area). Average estimates of Rh and Ra have been proposed.
Significant differences were seen between measurements in the rhizosphere and outside the rhizosphere for soil temperature, soil moisture and soil N (Figure 9; Supplementary Table S2; soil temperature: ANOVA: F = 10.39; d.f. 1,163; p = 0.002; soil moisture: ANOVA: F = 131.10; d.f. 1,173; p < 0.001; soil N: ANOVA: F = 5.34; d.f. 1,172; p = 0.002). Soil C, soil C:N and soil pH did not vary significantly between the rhizosphere and outside the rhizosphere.
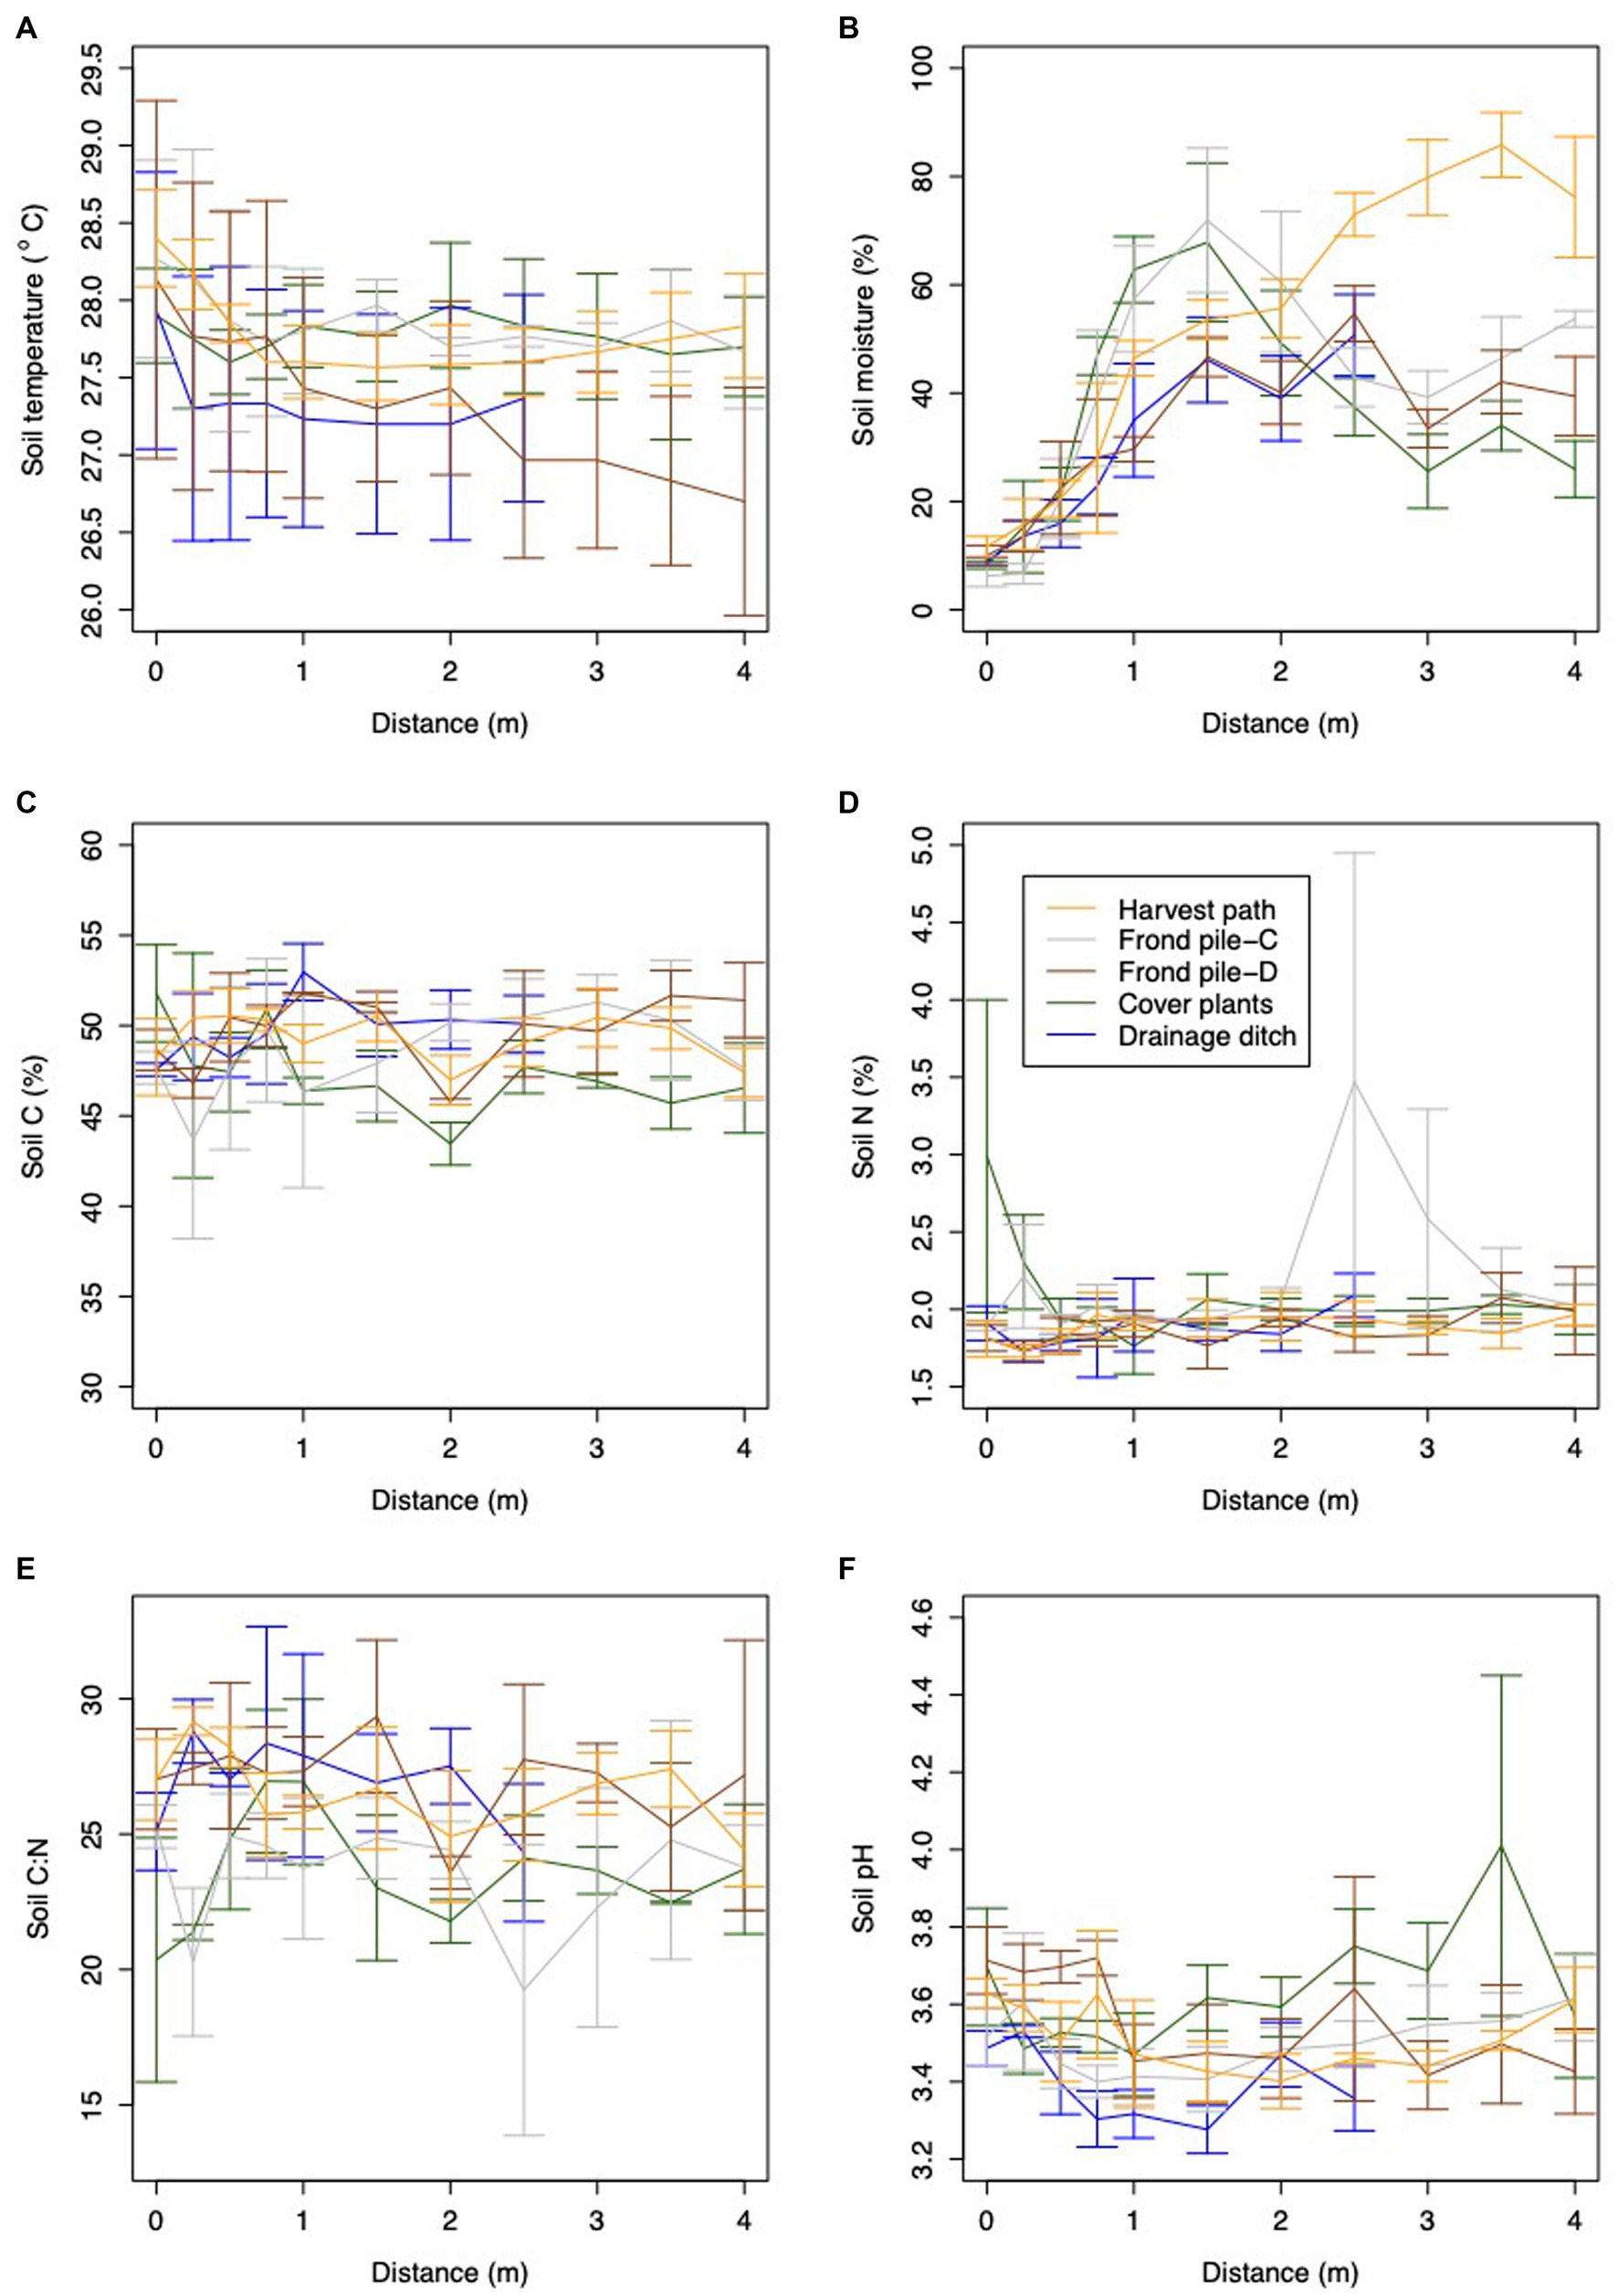
Figure 9. Variation in environmental variables with distance in the different transects, including: (A) soil temperature, (B) soil moisture, (C) soil C, (D) soil N, (E) soil C:N and (F) soil pH. Error bars show the standard error of the mean.
Significant differences were seen between measurements in the different surface microforms for soil temperature, soil moisture, soil N, soil C:N, soil pH and bulk density (Figure 9; Supplementary Table S2; soil temperature: ANOVA: F = 4.72; d.f. 4,163; p = 0.001; soil moisture: ANOVA: F = 4.58; d.f. 4,173; p = 0.002; soil N: ANOVA: F = 4.33; d.f. 4,172; p = 0.002; soil C.N: ANOVA: F = 6.74; d.f. 4,176; p < 0.001; soil pH: ANOVA: F = 7.10; d.f. 4,177; p < 0.001; bulk density: ANOVA: F = 9.22; d.f. = 2, 72; p < 0.001). Soil C did not vary significantly between the different surface microforms. Significant differences were seen between measurements in different surface microforms and between measurements in the rhizosphere and outside the rhizosphere for soil moisture only, with the harvest path having much higher soil moisture than the other surface microforms from 2.5 m distance from the palm (Figure 9; Supplementary Table S2; ANOVA: F = 2.87; d.f. 4,173; p = 0.02).
3.2.2 Relationship between environmental variables and Rtot
Variation in Rtot within the plantation was explained by variation in soil pH, soil temperature, root density, air temperature and soil moisture (Supplementary Tables S3, S4). Rtot was positively related to soil temperature but inversely related to air temperature. The effect size of soil temperature was 10 times greater than that of air temperature, indicating that soil temperature was a stronger driver of Rtot. Rtot increased as soil moisture decreased. Rtot increased as root density increased. There was a significant relationship between Rtot and soil pH and the interaction between soil pH and soil microform. Rtot increased as soil pH increased in all microforms apart from in measurements taken next to the drainage ditches. The largest pH effect was seen in the cover plants, followed by the harvest path, frond pile next to the cover plants, drainage ditch and frond pile next to the drainage ditch transects.
3.3 Plantation-scale estimates of Rtot, Rh and Ra
Best estimates of plantation Rtot, Rh and Ra are presented in Table 3. Straight mean averaging results were higher than estimates based on area-weighted upscaling. Distance from palm gave higher Rh estimates and lower Ra estimates than the linear regression method. Estimates of Ra gave greater changes with upscaling method than Rh estimates.
3.4 Partitioning methodologies, sample size and sampling design influence plantation-scale Rh estimates
Methodological decisions influenced the estimates of Rtot, Rh and Ra. The sample size of data points impacted the final Rtot, Rh and Ra estimated from oil palm plantations on peat soil. A power analysis showed that 35 samples are needed to accurately capture the within-plantation spatial variation in Rtot. Modeling for a reduced sample size gave broader confidence intervals surrounding the Rtot, Rh and Ra estimates (Figure 10). Estimates of plantation Rtot, Rh and Ra were higher in the random sampling designs than in spatially stratified sampling designs. Rtot and Ra gave higher plantation mean estimates and Rh gave lower plantation mean estimates when rhizosphere data were included in plantation means. Plantation Rtot, and Ra were lower and plantation Rh was higher when samples were taken from the harvest path only (Figure 10; Supplementary Tables S1, S2).
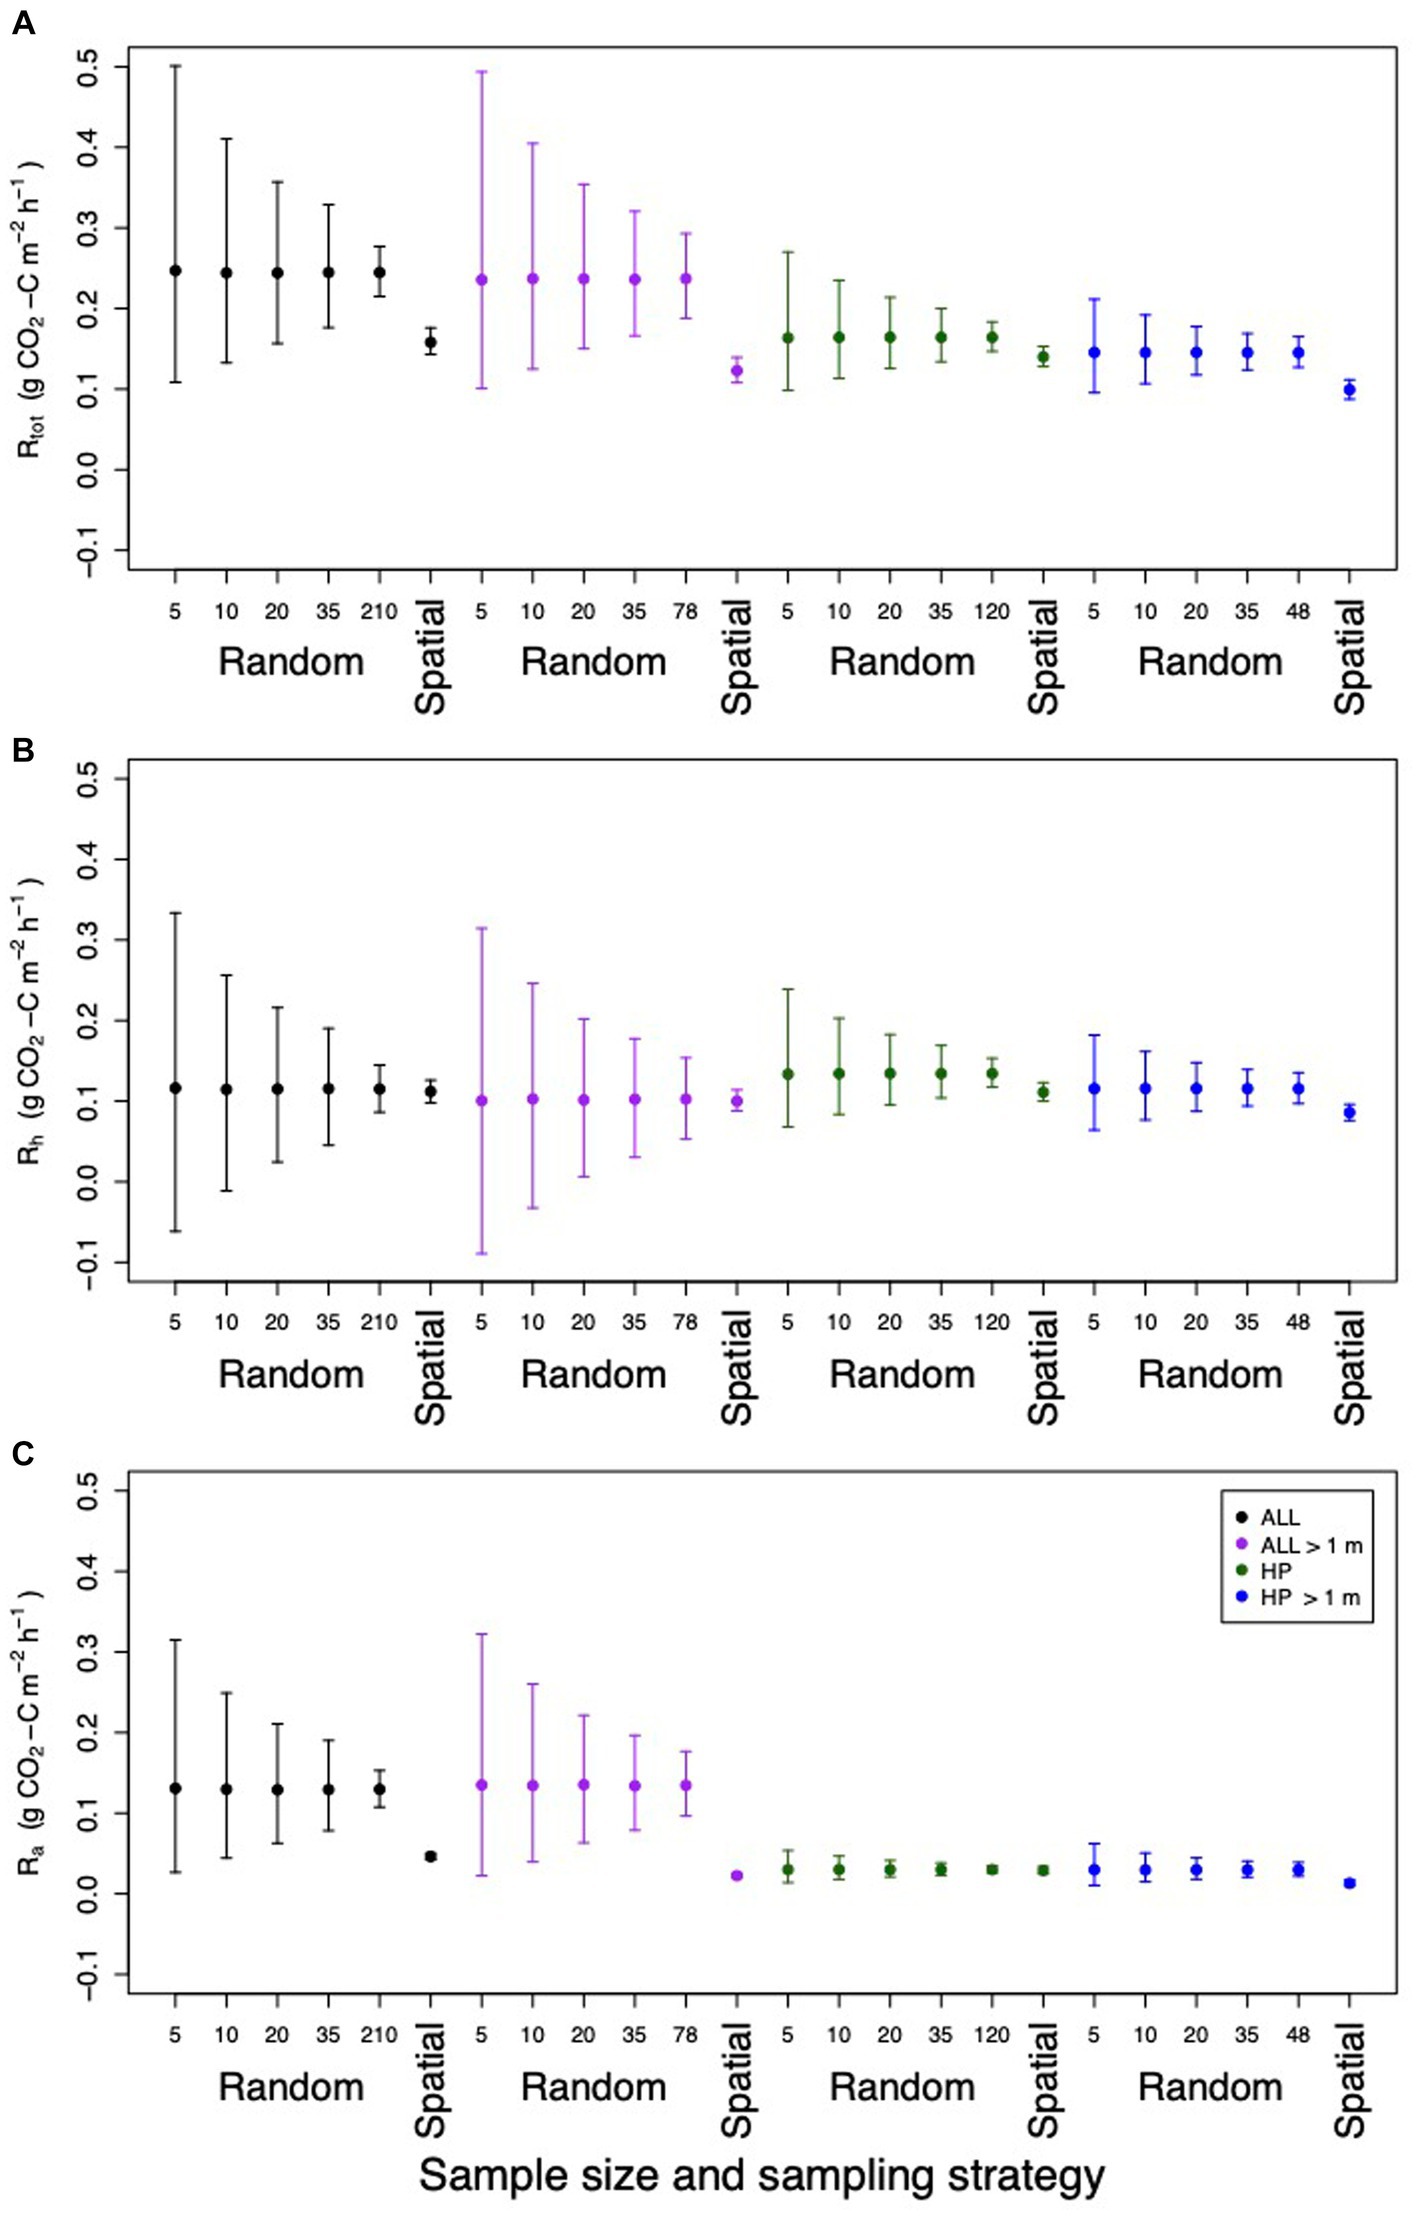
Figure 10. Estimated plantation mean and 95% confidence intervals for (A) Rtot, (B) Rh and (C) Ra when different sample sizes and sampling strategies are used. Results were bootstrapped 10,000 times and then random sampling was applied to 5, 10, 20 and 35 randomly selected samples or the entire dataset. The entire dataset was used in the spatial sampling. This analysis was repeated on all samples (black), samples taken >1 m from the palm (purple), samples taken from the harvest path (green) and samples taken >1 m from the palm in the harvest path (blue).
4 Discussion
4.1 Rh was not impacted by surface management microform or root distribution
Different spatial patterns were seen in the oil palm plantation for Rtot, Rh, Ra and root density. Rh varied significantly between the different subplots, but Rtot and Ra did not. Rtot and Ra showed significant spatial variation based on the experimental design within the subplots but Rh did not. Manning et al. (2019) took monthly repeated measurements from the different microforms at this site over a year and also found no significant difference in Rh between the different microforms, with variation in water table driving Rh dynamics in the plantation. A neighboring plantation did show significant variation in rates of Rh with surface management microform – this second plantation had an open canopy, unlike the study site here, and the frond piles provided shade that reduced the rates of Rh.
4.2 Rtot and Ra showed significant within plantation spatial variation, driven by patterns in root density
First and foremost, root density was highest next to the palm and decreased as distance from the palm increased. Rtot followed the same pattern as root density, with the highest fluxes measured next to the palm. Rtot fluxes also decreased as distance from palm increased. Similar trends have been seen clearly in other studies (Farmer, 2013; Dariah et al., 2014; Matysek et al., 2018). In this study, there was no significant difference in Rtot with increasing distance from palm after 0.75 m. This was slightly different to root density, which had no significant difference with increasing distance from the palm after 1 m distance from the palm. This study therefore defined the rhizosphere in this plantation as ≤1 m distance from the palm. Modeled estimates of Ra followed the same pattern seen by root density. Modeled estimates of Rh showed no significant variation with distance from palm, remaining relatively constant.
Rtot, Ra and root density varied significantly between the different microforms, suggesting that the spatial patterns in respiration fluxes and root density were at least partially determined by the microforms themselves. There was a clear divide in Rtot, Ra and root density depending on whether the measurements were taken nearer the drainage ditch or the cover plants, with consistently higher measurements nearer the drainage ditches than nearer the cover plants. These trends were also seen in the corresponding frond piles, with higher Rtot, Ra and root density in the frond pile next to the drainage ditch (frond pile-D) and lower Rtot, Ra and root density in the frond pile next to the cover plants (frond pile-C). Furthermore, measurements of Rtot, Ra and root density varied next to the palm in the same transects, showing that the change in root density around the palm began at the palm base.
We propose that the uneven distribution of oil palm roots in space was affected by competition between oil palm and cover plant roots. Competition between oil palm roots and other plants has been shown in a greenhouse experiment in Indonesia (Rahmadhani et al., 2020). Here, oil palm saplings were grown in polybags with herbaceous plants (one plant and one sapling per bag) and root growth was inhibited compared to the polybags that had only an oil palm sapling. Oil palm roots themselves compete for space in mineral soil, when palms are planted 8 m apart (Jourdan and Rey, 1997). In this study, there was minimal root density halfway between two palms, suggesting that roots do not grow as far from the palm in peat soil as they do in mineral soil.
4.3 Variation in Rtot is influenced by environmental drivers, as well as root density and distance from palm
Rtot showed significant spatial variation driven by environmental drivers, as well as driven by distance from palm and surface management microform, which may better explain variation in Rh. Soil pH, soil temperature, air temperature and soil moisture all significantly explained variation in Rtot. Soil pH significantly explained variation in Rtot, with different relationships seen in the different surface microforms. Soil pH varied within the plantation (from 3.08 to 4.45), with pH in soil beneath cover plants being higher than elsewhere. The cover crops consisted of leguminous cover crops, such as Mucuna bracteate. These are planted in oil palm plantations on peat for nitrogen fixation and to preserve soil moisture, in order to minimize the risk of peat subsidence and fires (Othman et al., 2012). In this study, total nitrogen was higher in the cover plant microform than in the other surface microforms, suggesting that some of the nitrogen produced by the cover plants entered the peat soil system and increased the pH locally. Nitrogen fertilization with urea has been shown to increase rates of Rh (Comeau et al., 2016). The increase in Rtot in the cover plants may therefore be caused by the increase in ammonium from nitrogen fixation in the legumes increasing rates of Rh, with soil pH acting as an indicator of the process.
Rtot increased significantly as soil temperature increased. Temperature has been shown to increase the rate of respiration due to an increase in activation energy for biochemical reactions (Lloyd and Taylor, 1994). This can be used as a management strategy - shading tropical peat by 90% has been shown to reduce rates of Rh by 30% (Jauhiainen et al., 2014). The relationship between Rtot and soil temperature did not vary with microform in this study, despite the frond pile and cover plants offering shade. Manning et al. (2019) found that soil temperature and Rh varied between soil management microforms when measured over a year. In longer-term studies at other sites, soil temperature has consistently had a significant effect increasing rates of respiration from peat soil, both when roots were present (Farmer, 2013; Sakata et al., 2015) and absent (Comeau, 2016; Hergoualc’h et al., 2017; Ishikura et al., 2018).
Rtot increased significantly as soil moisture decreased. Soil moisture inhibits Rh by preventing heterotrophic micro-organisms from decomposing the peat, due to the absence of oxygen (Hirano et al., 2012; Mishra et al., 2014; Tonks et al., 2017). Longitudinal data from this site showed that all of the surface microforms had higher Rh rates at lower soil moisture levels, with the frond piles having the strongest effects (Manning et al., 2019). Similar trends have been seen at other oil palm plantations on peat soil (Hergoualc’h et al., 2017; Ishikura et al., 2018; Matysek et al., 2018).
Bulk density was significantly higher in the cover plants than in the harvest path or frond piles. Bulk density was not included in the environmental linear mixed effect model in this plantation due to the bulk density being taken, necessarily (because it disturbs the soils), from slightly different locations to the respiration and root measurements. Melling et al. (2013) found higher Rtot measurements when bulk densities were higher. In this plantation, soil bulk density was significantly higher in the cover plants than from the harvest path or frond piles due to compaction of the harvest path by machinery (Melling et al., 2009). It would be expected that there would therefore be an increase in rates of Rtot and Rh in the cover plants at this plantation due to the increase in bulk density.
4.4 Plantation-scale estimates of Rtot, Rh and Ra
The plantation-scale estimates calculated using area-weighted upscaling were decided to give the best estimates of plantation Rtot, Rh and Ra. The best estimate of plantation Rtot in this study was 0.158 ± 0.016 g CO2-C m−2 h−1, the best estimates of Rh ranged from 0.112 ± 0.016 to 0.147 ± 0.020 g CO2-C m−2 h−1, and the best estimates of Ra ranged from 0.011 ± 0.004 to 0.046 ± 0.026 g CO2-C m−2 h−1. These estimates take into account the spatial variation within the oil palm plantation, including scaling to include the proportional area of the drainage ditches. None of these values should be used as annual estimates of Rtot, Ra and Rh fluxes because they were not taken over the year and Rtot and Ra have been shown to have significant temporal variation (Manning et al., 2019).
Two methods were used to partition Rtot into Rh and Ra in order to get these estimates. The lower result comes from the linear regression method, which assumes that the only variation in Rtot is due to variation in Rh and that Ra is fixed. The higher result comes from the distance from palm method, which assumes that the only variation in Rtot is due to variation in Ra and that Rh is fixed. This study has shown that Rtot, root density, Rh and Ra all vary spatially within the plantation. Therefore, the best estimate will lie between these values, with these values providing the upper and lower boundary. We propose that the real value of Rh falls between these two values, i.e., 0.130 ± 0.046 g CO2-C m−2 h−1. The best estimate of Ra therefore lies between the estimates of 0.011 ± 0.026 and 0.046 ± 0.004 g CO2-C m−2 h−1, i.e., 0.029 ± 0.030 g CO2-C m−2 h−1.
Estimates of Rtot, Rh and Ra are similar to other reported estimates of these fluxes in the literature. Published results from chamber measurements of Rtot have a mean of 0.207 ± 0.016 g CO2-C m−2 h−1 and range between 0.085 and 0.365 g CO2-C m−2 h−1 (Murayama and Bakar, 1996; Melling et al., 2005; Farmer, 2013; Melling et al., 2013; Dariah et al., 2014; Husnain et al., 2014; Sakata et al., 2015; Comeau, 2016; Comeau et al., 2016; Hergoualc’h et al., 2017; Ishikura et al., 2018; Matysek et al., 2018; Manning et al., 2019; Cooper et al., 2020).
Published results from chamber measurements of Rh have a mean of 0.152 ± 0.014 g CO2-C m−2 h−1 and range from 0.047 to 0.307 g CO2-C m−2 h−1 and published results from chamber measurements of Ra have a mean of 0.088 ± 0.018 g CO2-C m−2 h−1 and range from 0.001 to 0.290 g CO2-C m−2 h−1 (Farmer, 2013; Melling et al., 2013; Dariah et al., 2014; Husnain et al., 2014; Comeau, 2016; Comeau et al., 2016; Hergoualc’h et al., 2017; Ishikura et al., 2018; Matysek et al., 2018; Manning et al., 2019; Cooper et al., 2020).
4.5 Partitioning methodology and sample size can bias plantation-scale flux estimates
Obtaining accurate estimates of Rtot, Rh and Ra is essential in order to create precise flux estimates for climate modeling and for local to global policy decision-making. Published estimates of Rtot, Rh and Ra vary by factors of 4.3, 6.5 and 290.0, respectively. Five reasons why this range is so large include: (1) different partitioning methodologies, (2) different sample sizes, (3) within plantation spatial variations, (4) within plantation micro-climates and (5) variation in temporal dynamics and seasonality. Here we address some of the errors that can be brought in by not taking the first four reasons into account. The fifth reason is explored in more detail in Manning et al. (2019), where significant variation between Rtot and Ra was driven by temporal changes in environmental drivers at this site.
Firstly, this study considered how two different partitioning methodologies gave different results. Estimates of Rh and Ra measured in this study varied by 30 and 61% respectively, considering the straight mean averaging results, and between 24 and 318% for the area-weighted upscaling results. This is important because Rh is often compared between studies without different partitioning methodologies being considered. We recommend using multiple methods to partition Rtot into Rh and Ra where possible, to reduce experimental bias being interpreted as between site variations. We also recommend that modeling studies take partitioning method into account as a covariate.
Secondly, sample size was explored in this research. Sample sizes for Rtot in the literature range from 3 to 72, with an average of 24 samples (Farmer, 2013; Melling et al., 2013; Dariah et al., 2014; Husnain et al., 2014; Comeau, 2016; Comeau et al., 2016; Hergoualc’h et al., 2017; Ishikura et al., 2018; Matysek et al., 2018; Manning et al., 2019; Cooper et al., 2020). This study showed that changing the sample size of the dataset gave different results for Rtot, Rh and Ra. Using resampling techniques to model the sample size of random sampling from 5 to 10, 20 and 35 samples reduced the confidence intervals of the estimate of Rtot, Rh and Ra, making sure that it was more accurate. A power analysis on the dataset in this study suggested that 35 samples were sufficient to give a precise estimate of plantation-scale Rtot, when the samples were stratified based on distance from palm and surface management microform. This suggests that future sampling designs could have more accuracy with larger sample sizes than the average found in the literature.
Thirdly, within-plantation spatial variation was shown to give significant variation in Rtot, Rh and Ra in this study. Therefore, estimates of Rtot, Rh and Ra could be inaccurate if spatial variation is not taken into account. The high root density around the palm and high Ra fluxes in the rhizosphere had a large influence on plantation-scale estimates of respiration. Modeling the difference in Rtot, Rh and Ra in this study when the rhizosphere was excluded, gave 22, 11 and 50% lower estimates of Rtot, Rh and Ra, respectively. Furthermore, estimates of plantation-scale Rtot reduced by 34% when results were scaled up using area-weighted upscaling as opposed to straight mean averaging. This was due to the large contribution from Ra next to the palm that was overrepresented without weighting. Estimates of Ra reduced by 81 and 64% between straight mean averaging and area-weighted upscaling for the results calculated using the distance from palm method and linear regression method, respectively. Similarly, estimates of Rh reduced by 9 and 2% between straight mean averaging and area-weighted upscaling for the results calculated using the distance from palm method and linear regression method. Taken collectively, these results highlight the importance of the spatial variation caused by the rhizosphere in plantation-scale estimates, particularly for accurate estimates of Rtot and Ra.
Fourthly, within plantation micro-climates (aka the surface management microforms) were investigated in this study and one of the key results from this paper was that Rtot and Ra varied between the different surface management microforms outside of the rhizosphere. Here and in Manning et al. (2019) we show different dynamics in soil organic matter mineralization in the different surface management microforms, highlighting the importance of representing these microforms in the plantation-scale respiration estimates. Our sensitivity analysis shows a reduction in plantation-scale Rtot and Ra and an increase in Rh if samples were taken from the harvest path transect only. Other studies measuring Rtot, Rh and Ra from oil palm plantations have focused on measurements in the harvest path, with the exception of Manning et al. (2019), which may lead to an overestimation in plantation Rh.
5 Conclusion
Rh did not show significant spatial variation in the oil palm plantation but varied significantly between the subplots. This suggested that oil palm root patterns and soil management microforms do not substantially affect variation in Rh. Environmental drivers, including soil temperature and soil moisture, had significant effects on variation in Rtot and may better explain variation in Rh. This snapshot study has not investigated the spatial and temporal trends in environmental drivers and whether this influences the microclimates in the different surface microforms differently, with corresponding impacts on Rh.
Spatial variation in root density drove the variation in Rtot and Ra in an oil palm plantation on peat soil. Rtot, Ra and root density were highest next to the palm and decreased with increasing distance from the palm. Root density showed competition dynamics between oil palm and cover plant roots, with greater root density measured in the rhizosphere in the transects that were growing in directions away from the cover plants. Ra and root density were highest from the drainage ditch and frond pile next to the drainage ditch transects.
Plantation best estimates of Rtot, Rh, Ra were 0.158 ± 0.016, 0.130 ± 0.036 and 0.029 ± 0.030 g CO2-C m−2 h−1, respectively. Area-weighted upscaling gave better estimates of Rtot, Rh and Ra due to weighting the high Rtot and Ra fluxes next to the palm. Not using area-weighted upscaling changed estimates of Rtot, Rh and Ra by 34, 6 and 75%, respectively.
Two different methods were used to partition Rtot into Rh and Ra, the distance from palm method and the linear regression method. Rh measurements were higher from the distance from palm method. Both methods have value and the best estimate will be between the two.
Overall, we show that root competition appears to impact oil palm root growth, which may have implications for productivity and nutrient cycling in agroforestry, intercropping or cover cropping systems. We also show that with plantation spatial dynamics need to be taken into account for the calculation of reliable estimates of Rtot and Ra. We propose that temporal variation in water table, soil moisture and temperature may be more important for variation in Rh than within plantation spatial variation from surface management microforms.
Data availability statement
The raw data supporting the conclusions of this article will be made available by the authors, without undue reservation.
Author contributions
FM designed and conducted the study, performed the data analysis, and wrote the manuscript. TH and YT were integrally involved in the study design, data interpretation, and writing the manuscript. LK was involved in the study design, data collection, field support, and data interpretation. TN and ER were involved in the data collection and field support. All authors contributed to the article and approved the submitted version.
Funding
This project was funded by the Natural Environmental Research Council, UK (grant code: 1368637) and the Malaysian Palm Oil Board (grant code: R010913000).
Acknowledgments
The authors wish to thank the Director-General of the Malaysian Palm Oil Board for permission to publish this study. This study was part of a MPOB-University of Exeter-University of Aberdeen collaborative research program on tropical peat research. The authors would like to thank the Malaysian Palm Oil Board and Sarawak Oil Palm Berhad staff for all of their help and support for this project, without which the research would not have been possible. We are grateful to Norliyana Zin Zawawi, Ham Jonathon, Steward Saging, Xytus Tan, Cecylea Jimmy, Lilyen L. Ukat, Lukas Ellbiey and Frances Pusch for their help with the field work. We are very thankful for the ladies who work for SOP and helped FM sort roots from soil for weeks on end. The authors also acknowledge Laura Kruitbos for her excellent logistical help.
Conflict of interest
The authors declare that the research was conducted in the absence of any commercial or financial relationships that could be construed as a potential conflict of interest.
Publisher’s note
All claims expressed in this article are solely those of the authors and do not necessarily represent those of their affiliated organizations, or those of the publisher, the editors and the reviewers. Any product that may be evaluated in this article, or claim that may be made by its manufacturer, is not guaranteed or endorsed by the publisher.
Supplementary material
The Supplementary material for this article can be found online at: https://www.frontiersin.org/articles/10.3389/ffgc.2023.1236566/full#supplementary-material
Footnotes
References
Baggs, E. M. (2006). Partitioning the components of soil respiration: a research challenge. Plant Soil 284, 1–5. doi: 10.1007/s11104-006-0047-7
Carlson, K. M., Gerber, J. S., Mueller, N. D., Herrero, M., MacDonald, G. K., Brauman, K. A., et al. (2017). Greenhouse gas emissions intensity of global croplands. Nat. Clim. Chang. 7, 63–68. doi: 10.1038/nclimate3158
Carlson, K. M., Goodman, L. K., and May-Tobin, C. C. (2015). Modeling relationships between water table depth and peat soil carbon loss in southeast Asian plantations. Environ. Res. Lett. 10:074006. doi: 10.1088/1748-9326/10/7/074006
Comeau, L. P. (2016) Carbon dioxide fluxes and soil organic matter characteristics on an intact peat swamp forest, a drained and logged forest on peat, and a peatland oil palm plantation. Indonesia: University of Aberdeen
Comeau, L. P., Hergoualc'h, K., Hartill, J., Smith, J., Verchot, L. V., Peak, D., et al. (2016). How do the heterotrophic and the total soil respiration of an oil palm plantation on peat respond to nitrogen fertilizer application? Geoderma 268, 41–51. doi: 10.1016/j.geoderma.2016.01.016
Cook, S., Whelan, M. J., Evans, C. D., Gauci, V., Peacock, M., Garnett, M. H., et al. (2018). Fluvial organic carbon fluxes from oil palm plantations on tropical peatland. Biogeosciences 15, 7435–7450. doi: 10.5194/bg-15-7435-2018
Cooper, H. V., Evers, S., Aplin, P., Crout, N., Dahalan, M. P. B., and Sjogersten, S. (2020). Greenhouse gas emissions resulting from conversion of peat swamp forest to oil palm plantation. Nat. Commun. 11, 1–8. doi: 10.1038/s41467-020-14298-w
Dariah, A., Setiari Marwanto, S., and Agus, F. (2014). Root-and peat-based CO2 emissions from oil palm plantations. Mitig. Adapt. Strateg. Glob. Chang. 19, 831–843. doi: 10.1007/s11027-013-9515-6
FAO (2006) World Reference Base for soil resources 2006: a framework for international classification, Correlation and Communication. Rome
Farmer, J. (2013) Measuring and modeling soil carbon and carbon dioxide emissions from Indonesian peatlands under land use change. University of Aberdeen. United Kingdom
Hammond, R., and McCullagh, P. S. (1978) Quantitative techniques in geography: an introduction. Clarendon Press. Oxford
Hergoualc’h, K., Hendry, D. T., Murdiyarso, D., and Verchot, L. V. (2017). Total and heterotrophic soil respiration in a swamp forest and oil palm plantations on peat in Central Kalimantan, Indonesia. Biogeochemistry 135, 203–220. doi: 10.1007/s10533-017-0363-4
Hirano, T., Segah, H., Kusin, K., Limin, S., Takahashi, H., and Osaki, M. (2012). Effects of disturbances on the carbon balance of tropical peat swamp forests. Glob. Chang. Biol. 18, 3410–3422. doi: 10.1111/j.1365-2486.2012.02793.x
Hoojier, A., Page, S., Jauhiainen, J., Lee, W. A., Lu, X. X., Idris, A., et al. (2012). Subsidence and carbon loss in drained tropical peatlands. Biogeosciences. 9, 1053–1071.
Husnain, H., Wigena, I. G. P., Dariah, A., Marwanto, S., Setyanto, P., and Agus, F. (2014). CO2 emissions from tropical drained peat in Sumatra, Indonesia. Mitig. Adapt. Strateg. Glob. Chang. 19, 845–862. doi: 10.1007/s11027-014-9550-y
Ishikura, K., Hirano, T., Okimoto, Y., Hirata, R., Kiew, F., Melling, L., et al. (2018). Soil carbon dioxide emissions due to oxidative peat decomposition in an oil palm plantation on tropical peat. Agric. Ecosyst. Environ. 254, 202–212. doi: 10.1016/j.agee.2017.11.025
Jauhiainen, J., Kerojoki, O., Silvennoinen, H., Limin, S., and Vasander, H. (2014). Heterotrophic respiration in drained tropical peat is greatly affected by temperature-a passive ecosystem cooling experiment. Environ. Res. Lett. 9:105013. doi: 10.1088/1748-9326/9/10/105013
Jourdan, C., and Rey, H. (1997). Modelling and simulation of the architecture and development of the oil-palm (Elaeis guineensis Jacq.) root system. Plant Soil 190, 235–246. doi: 10.1023/A:1004270014678
Kucera, C., and Kirkham, D. R. (1971). Soil respiration studies in tallgrass prairie in Missouri. Ecology 52, 912–915. doi: 10.2307/1936043
Livingston, G. P., and Hutchinson, G. L. (1995). “Enclosure-based measurement of trace gas exchange: applications and sources of error” in Methods in ecology. Biogenic trace gases: measuring emissions from soil and water. eds. P. A. Matson and R. C. Harriss (Malden, Mass: Blackwell Science), 14–51.
Lloyd, J., and Taylor, J. A. (1994). On the temperature dependence of soil respiration. Funct. Ecol. 8, 315–323. doi: 10.2307/2389824
Manning, FC (2019) Carbon dynamics in oil palm agro-ecosystems. University of Aberdeen, United Kingdom.
Manning, F. C., Kho, L. K., Hill, T. C., Cornulier, T., and Teh, Y. A. (2019). Carbon emissions from oil palm plantations on peat soil. Front. For. Glob. 2:37. doi: 10.3389/ffgc.2019.00037
Marthews, T. R., Metcalfe, D., Malhi, Y., Phillips, O., Huaraca Huasco, W., Riutta, T., et al. (2012) Measuring tropical forest carbon allocation and cycling: a RAINFOR-GEM field manual for intensive census clots (v2.2). Available at:http://gem.tropicalforests.ox.ac.uk/.
Matysek, M., Evers, S., Samuel, M. K., and Sjogersten, S. (2018). High heterotrophic CO2 emissions from a Malaysian oil palm plantations during dry-season. Wetl. Ecol. Manag. 26, 415–424. doi: 10.1007/s11273-017-9583-6
McCalmont, J., Kho, L. K., Teh, Y. A., Lewis, K., Chocholek, M., Rumpang, E., et al. (2021). Short-and long-term carbon emissions from oil palm plantations converted from logged tropical peat swamp forest. Glob. Chang. Biol. 27, 2361–2376. doi: 10.1111/gcb.15544
Melling, L., Chaddy, A., Goh, K. J., and Hatano, R. (2013). Soil CO2 fluxes from different ages of oil palm in tropical peatland of Sarawak, Malaysia as influenced by environmental and soil properties. Acta Hortic. 982, 25–35. doi: 10.17660/ActaHortic.2013.982.2
Melling, L., Chua, K., and Lim, K. (2009) Managing peat soils under oil palm. Available at: http://tropicalpeat.sarawak.gov.my/modules/web/pages.php?mod=download&sub=download_show&id=16
Melling, L., Hatano, R., and Goh, K. J. (2005). Methane fluxes from three ecosystems in tropical peatland of Sarawak, Malaysia. Soil Biol. Biochem. 37, 1445–1453. doi: 10.1016/j.soilbio.2005.01.001
Metcalfe, D., Meir, P., Aragão, L. E. O. C., da Costa, A., Almeida, S., Braga, A., et al. (2008). Sample sizes for estimating key ecosystem characteristics in a tropical terra firme rainforest. For. Ecol. Manag. 255, 558–566. doi: 10.1016/j.foreco.2007.09.026
Miettinen, J., Shi, C., and Liew, S. C. (2016). Land cover distribution in the peatlands of peninsular Malaysia, Sumatra and Borneo in 2015 with changes since 1990. Glob. Ecol. Conserv. 6, 67–78. doi: 10.1016/j.gecco.2016.02.004
Mishra, S., Lee, W. A., Reuben, S., Sudiana, I. M., Idris, A., and Swarup, S. (2014). Microbial and metabolic profiling reveal strong influence of water table and land-use patterns on classification of degraded tropical peatlands. Biogeosciences 11, 1727–1741. doi: 10.5194/bg-11-1727-2014
Murayama, S., and Bakar, Z. A. (1996). Decomposition of tropical peat soils. Jpn. Agric. Res. Q. 30, 145–151.
Othman, H., Darus, F. M., and Hashim, Z. (2012) Best management practices for oil palm cultivation on peat: Mucuna bracteata as ground cover crop. Available at: (http://palmoilis.mpob.gov.my/publications/TOT/TT-501.pdf).
Page, S. E., Rieley, J. O., and Banks, C. J. (2011). Global and regional importance of the tropical peatland carbon pool. Glob. Chang. Biol. 17, 798–818. doi: 10.1111/j.1365-2486.2010.02279.x
Philipson, J. J., and Coutts, M. P. (1978). The tolerance of tree roots to waterlogging: III. Oxygen transport in lodgepole pine and Sitka spruce roots of primary structure. New Phytol. 80, 341–349. doi: 10.1111/j.1469-8137.1978.tb01567.x
Pinheiro, J., Bates, D., DebRoy, S., and Sarkar, D.R Core Team (2017) Nlme: linear and nonlinear mixed effect models. Available at: https://CRAN.R-project.org/package=nlme.
Pohlert, T (2018) Package ‘PMCMR’. Available at: https://cran.r-project.org/web/packages/PMCMR/index.html.
Rahmadhani, T. P., Suwandi, S., and Suparman, S. (2020). Growth responses of oil palm seedling inoculated with Ganoderma boninense under competition with edible herbaceous plants. J. Sci. Agric. 35, 45–49. doi: 10.25081/jsa.2020.v4.6231
Sakata, R., Shimada, S., Arai, H., Yoshioka, N., Yoshioka, R., Aoki, H., et al. (2015). Effect of soil types and nitrogen fertilizer on nitrous oxide and carbon dioxide emissions in oil palm plantations. Soil Sci. Plant Nutr. 61, 48–60. doi: 10.1080/00380768.2014.960355
Subke, J. A., Inglima, I., and Cotrufo, M. F. (2006). Trends and methodological impacts in soil CO2 efflux partitioning: a metaanalytical review. Glob. Chang. Biol. 12, 921–943. doi: 10.1111/j.1365-2486.2006.01117.x
Keywords: oil palm, peat, peat oxidation, heterotrophic respiration, autotrophic respiration
Citation: Manning FC, Kho LK, Hill TC, Nyawai TN, Rumpang E and Teh YA (2024) Spatial variations in heterotrophic respiration from oil palm plantations on tropical peat soils. Front. For. Glob. Change. 6:1236566. doi: 10.3389/ffgc.2023.1236566
Edited by:
Julia Drewer, UK Centre for Ecology and Hydrology (UKCEH), United KingdomReviewed by:
Erin Swails, Center for International Forestry Research (CIFOR), IndonesiaCarole Helfter, UK Centre for Ecology and Hydrology (UKCEH), United Kingdom
Copyright © 2024 Manning, Kho, Hill, Nyawai, Rumpang and Teh. This is an open-access article distributed under the terms of the Creative Commons Attribution License (CC BY). The use, distribution or reproduction in other forums is permitted, provided the original author(s) and the copyright owner(s) are credited and that the original publication in this journal is cited, in accordance with accepted academic practice. No use, distribution or reproduction is permitted which does not comply with these terms.
*Correspondence: Frances Claire Manning, ZnJhbmNlcy5jbGFpcmUubWFubmluZ0BnbWFpbC5jb20=; Yit Arn Teh, WWl0QXJuLlRlaEBuZXdjYXN0bGUuYWMudWs=
†Present address: Yit Arn Teh, School of Natural and Environmental Sciences, Newcastle University, Newcastle upon Tyne, United Kingdom