
95% of researchers rate our articles as excellent or good
Learn more about the work of our research integrity team to safeguard the quality of each article we publish.
Find out more
ORIGINAL RESEARCH article
Front. For. Glob. Change , 01 September 2023
Sec. Forest Hydrology
Volume 6 - 2023 | https://doi.org/10.3389/ffgc.2023.1218005
This article is part of the Research Topic Carbon-Water-Nitrogen Processes and Mechanisms of Agricultural and Forest Ecosystems under Future Climate Change View all 11 articles
 Ruizhi Yang1,2
 Peng Liu1,2*
 Yun Tian1,2Jingyong Ma1,2Yujie Bai1,2Cheng Li1,2Songyu Huang1,2Yanmei Mu1,2
 Muhammad Hayat1,2Sundas Iqbal1,2Haiqun Yu3Feng Zhang3Hong Ma3
Introduction: A warming global climate is expected to perturb the hydrological cycle, resulting in deviations in both frequency and duration of drought and thus being hypothesized to lead to interannual variation in evapotranspiration (ET). Interannual variation in ET in urban forest ecosystems in response to drought remains poorly understood.
Methods: Here, ET in an urban forest reserve in the megalopolis of Beijing was investigated using eddy-covariance measurements collected over six consecutive years (2012–2017).
Results: The mean annual cumulative ET was 462 ± 83mm (±first standard deviation), with a coefficient of variation of 18%. Interannual variation in both annual and monthly ET was shown to be largely controlled by canopy conductance (gs), affected by environmental factors. The main factors affecting interannual variation in monthly ET varied seasonally, namely, soil volumetric water content (VWC) and normalized difference vegetation index (NDVI) in spring, precipitation and soil temperature in summer, and VWC and net radiation (Rn) in autumn. Interannual variation in annual ET was driven largely by spring and mid-summer droughts induced by insufficient precipitation during the non-growing and mid-growing seasons, respectively. Spring drought reduced annual ET by restricting leafing out, shortening growing season length (GSL), and reducing the normalized difference vegetation index (NDVI). The summer drought reduced annual ET by reducing stomatal conductance.
Discussion and conclusion: Results from this study point to the importance of precipitation timing and volume and the soil moisture carry-over effect in controlling interannual variation in ecosystem ET. Irrigation during the early spring and mid-summer is viewed as a practical management measure for sustaining growth and better ecosystem services in urban forests in Northern China.
Global climate models project an increase in climatic variability, including more frequent extreme events in future (e.g., drought, convective and synoptic storms, and heat waves; IPCC, 2014). The devastating effect of climate change is becoming increasingly apparent in Northeastern China (Zhai et al., 2010). An increase in both the severity and frequency of drought is expected to affect the hydrological cycle at regional-to-local scales. These changes may lead to disruptions in the energy balance and ecosystem structure and functioning by, in part, influencing the plant-mediated component of evapotranspiration (ET; Liu et al., 2018). Evapotranspiration, as the second largest constituent of the global hydrological cycle (Liu et al., 1998), shares in the energy and nutrient exchange in ecosystems as well as other important ecological processes (Miao et al., 2009). As a phase change of water, the transformation of liquid water to water vapor consumes energy. This process on large spatial scales can benefit cities by restricting the level of warming attained (Jacobs et al., 2015). Urban forest ecosystems in China, distinguished by their distinct vegetation composition and structures (i.e., from near natural or plantation), have been expanding during the past decades because of the rapid expansion of urban spaces (Jim and Chen, 2009; Chen et al., 2019). Through their reuse, the amount of land use change from agricultural land or forest to urbanized land can be reduced, and the cooling effect of urban forest ET has been becoming critical (Ordónez and Duinker, 2014; Fan et al., 2019). However, many elements of water vapor dynamics in urban forest plantations remain inadequate as they concern the quantitative understanding of interannual variation (IAV) in forest plantations, especially in relation to urban forests. Therefore, understanding the role of environmental drivers in ET is essential to characterize the ecosystem processes and services (Hallegatte and Corfee-Morlot, 2011) as well as for the proper assessment of regional and global water budgets in a changing climate.
Evapotranspiration is still arguably the most uncertain eco-hydrological variable in (i) the development of ecosystem water budgets (Sun et al., 2016) and (ii) the understanding of ecological impacts attributed to extreme climatic events (Vose et al., 2016) as well as the effects of urbanization (Hao et al., 2015). Evapotranspiration is controlled by numerous abiotic and biotic factors, including solar radiation, air and soil temperatures, soil water content, water vapor pressure deficit, leaf area index (LAI), and leaf-level stomatal conductance, which are all predicted to vary over a range of spatiotemporal scales. Earlier studies have reported that ET in forest ecosystems has considerable seasonal IAV. Intra-annual variation in ET and its controlling mechanisms have been documented for many ecosystems around the world (Chen et al., 2018). However, the comprehension of IAV in ET and its controlling mechanisms is currently inadequate (Xu et al., 2014), particularly in urban forests. Generally, very little is known about how the ecosystem-level ET of forest plantations responds annually to climate-induced drought.
Some studies have found that IAV in ET was mostly small relative to the year-to-year variation in annual rainfall. Furthermore, IAV failed to be explained by any single hydrometeorological parameter neither over the summer (May–August) nor annually (Gielen et al., 2010; Launiainen, 2010; Kume et al., 2011; Tsuruta et al., 2016). Others have found that IAV in ET is significant, which could not be ignored. Several climatic factors have been identified as drivers of ET, such as solar energy, temperature, and precipitation, through their effect on plant phenology, growing season length, or canopy structure (Tang et al., 2021; Xiang et al., 2023). Drought-induced soil moisture deficits have been reported to be the most important controlling factor of IAV in the ET of water-limited ecosystems (Wilson and Baldocchi, 2000; Barr et al., 2007; Thomas et al., 2009; Zha et al., 2010; Xue et al., 2012; Saitoh et al., 2013; Vadeboncoeur et al., 2018) largely because it triggers stomatal closure, suppression in leaf development, and changes in phenology in drought-affected plants. Given more extreme changes in the climate system, attaining a mechanistic understanding of the long-term dynamics of ecosystem ET is fundamental to acquiring an accurate prognostication of future water cycling in urban plantations and addressing the consequences of management decisions on the fate of large urban forests.
It is hypothesized that precipitation amount and seasonal distribution coincidental with drought are the most important drivers of IAV in ET. To test this hypothesis, we analyzed a 6-year record (2012–2017) of continuous ET data collected over an urban forest reserve in Beijing, China. The measurement period covered events of extremely low-to-high levels of precipitation as compared to the past 50 years from 1961 to 2010. The specific objectives of the research were to detect the major environmental variables affecting ET annually and to examine the impacts of drought on IAV in ET.
The study site is located in Beijing Olympic Forest Park (40.02°N, 116.38°E), Megalopolis of Beijing, China. It is the largest urban forest park in Asia, with an area of 680 ha and vegetation cover of ~96%. The forest reserve is located in the middle of the northeastern section of the park, an area committed to ecological conservation and reclamation, with no open water or roads in the area. Tourists are restricted from entering our research plot in order to minimize human disturbance. The terrain is flat and uniform. The soil is mainly of the fluvo-aquic type, with soil porosity of 40.3%, pH of 7.8, and an estimated field capacity and permanent wilting point of 26 and 10%, respectively. The site is characterized by a temperate continental monsoon climate. The 50-year annual mean temperature and annual precipitation are 12.5°C and 592 mm, respectively. The seasonal distribution of precipitation is highly uneven, with 80% of annual rainfall falling from June to August. The plant species in the forest reserve are endemic to the North China Plain. Tree species present include Sophora japonica L., Fraxinus chinensis, Pinus tabuliformis, and Platycladus orientalis. The understory consists mainly of Iris tectorum and Dianthus chinensis. The tree stand density in 2015 is recorded to be ~210 stems ha−1, with a mean tree height of 7.7 m and a mean diameter at breast height of 20 cm. The cover ratio of trees-to-shrubs is ~7:3. Shrubs include Prunus davidiana, Amygdalus triloba, Swida alba, and Syzygium aromaticum, with a mean height of 2.8 m. All trees in the reserve have shallow roots with a depth of ~0.08–0.4 m.
Water vapor fluxes were measured at 12 m above the ground surface with an eddy-covariance (EC) system, consisting of a three-dimensional sonic anemometer [CSAT3A; Campbell Scientific, Inc., Logan, UT, USA (CSI)] and a closed-path infrared gas analyzer (model EC155; CSI), which was calibrated once a month. The EC flux measurements began in April 2011. Continuous high-frequency data (at 10 Hz) were collected and processed in the calculation of 30 min fluxes. Fluxes were subsequently recorded on a datalogger (CR3000; CSI).
Hydrometeorological variables, including air and soil temperatures (Ta and Ts, °C), relative humidity (RH, %), net radiation (Rn, W m−2), precipitation (P, mm), and soil volumetric water content (VWC, %) were measured simultaneously. Air temperatures, relative humidity, and net radiation were measured at 12 m above the ground surface. Precipitation was measured within an opening (unvegetated) area near the EC tower. Soil volumetric water content and Ts were measured at a 10 cm depth at five locations around the tower. Data for all hydrometeorological variables were stored on a datalogger (CR3000; CSI). Further details on instrumentation and sampling procedures can be found in Xie et al. (2016) study.
To characterize land cover and temporal changes in the canopy structure in response to climate variations, we used time series processed images (i.e., image-pixel containing the EC tower) of normalized difference vegetation index (NDVI; MOD13Q1 products) at 250 m resolution downloaded from the Earth Observing System Data Gateway. The images were downloaded as 16-day composites covering the entire flux-measurement period from 2012 to 2017.
Post-processing was performed using the EddyPro 4.0.0 software (LI-COR Inc., USA), including spike removal, double coordinate rotation, time delay corrections, frequency response corrections, detrending (block averaging), and flux computation (Burba, 2013). Half-hourly turbulent fluxes and meteorological data were carefully controlled for quality and spurious data points. Outliers were removed following the approach described by Papale et al. (2006). Data gaps were filled using the standard method used by the Fluxnet Canada Research Network (Amiro et al., 2006). Three diagnostic variables, including the surface conductance (gs), the Priestley–Taylor coefficient (α), and the decoupling coefficient (Ω), were used to interpret the relative importance of biophysical control on ET.
Variable gs of a dry surface mostly reflect the stomatal control of plants on ET. The α-coefficient in the Priestley–Taylor model can be viewed as a normalization of ET (Blanken et al., 1997), which provides a comparison of measured ET to climatological expectations. Usually, α ≥ 1 occurs in mesic ecosystems, indicating sufficient water supply so that latent heat fluxes are limited by available energy. In contrast, α < 1 occurs in semiarid and arid ecosystems, where latent heat fluxes are limited by the availability of soil water (Jia et al., 2016). Ω indicates the degree of canopy decoupling from the bulk air, with Ω varying from 0 (completely coupling) to 1 (decoupling), as the biological control on ET becomes weaker as Ω approaches 1.
We estimated gs (mm s−1) by inverting the Penman–Monteith equation (Monteith and Unsworth, 2007), such that
where γ is the psychrometric constant (kPa K−1), Δ is the rate of change of saturation water vapor pressure as a function of Ta (kPa K−1), Rn is the net radiation (W m−2), λE is the latent heat flux (W m−2), G is the soil heat flux (W m−2), ρ is the air density (kg m−3), Cp is the specific heat of air (J kg−1 K−1), and VPD is the water vapor pressure deficit (kPa).
The aerodynamic conductance (ga, in mm s−1; Monteith and Unsworth, 2007) was calculated as
where u* and u are the friction velocity and wind speed, respectively, both given in m s−1. The Priestley–Taylor coefficient (α; Priestley and Taylor, 1972) was calculated from
Ω is calculated as (Jarvis and McNaughton, 1986)
α, Ω, and gs were calculated based on non-gap-filled 30 min data from daytime hours (when PAR > 5 μmol m−2 s−1), during periods when the soils were unfrozen, i.e., when Ts > 0.5°C and for days with no rain. The α, Ω, and gs values were aggregated to daily means and longer periods.
Growing season length (GSL) was determined from the daily mean gross ecosystem production time series, following procedures reported by Zha et al. (2009). Growing seasons spanned DOY (day of the year) 96–303, 104–298, 98–302, 108–302, 97–302, and 94–297 for 2012–2017, respectively. Normally, tree leaf expansion and coloration stages commence in April and October, respectively. According to the seasonal variation in NDVI, we defined March to June as the leaf expansion period, July to September as the leaf-expanded period, and October to November as the leaf coloration period. We defined the period from the previous November to March of the following year as the non-growing season. Following Xie et al. (2016), we defined drought as the occurrence of days when VWC was < 12.5% from March to November, March through May as spring, June through August as summer, and September through November as autumn.
Linear regression was used to examine the relationships between ET and the target biophysical variables (i.e., Rn, Ts, VWC, P, NDVI, and gs) at various timescales. To evaluate the contribution of different phenological phases to the variability in annual ET, the difference between the standard deviation of cumulative ET from a given month or season and its preceding one (DstDev) was calculated to quantify the contribution of each month or season to the observed interannual variability of the ET. All statistical analyses were performed in Matlab (The MathWorks, Natick, MA, USA).
Variation in major environmental factors during the 6 years is shown in Figures 1–3. Compared to the annual analysis, some factors (i.e., monthly Rn, monthly VPD, monthly Ta, monthly Ts, and monthly NDVI) were much more variable during the years 2012–2017 (Figure 2; Tables 1, 2). Interannual variation of monthly mean Rnand monthly mean VPD were highest in June; monthly mean Ts and NDVI were non-negligible in April (Figure 2). By contrast, interannual variation of annual mean Ta, Ts, Rn, VPD, and NDVI were imperceptible (Table 1). Annual mean Ta above the canopy increased from 2012 to 2015 and then decreased slightly over the remaining 3 years (2015–2017). The years after 2014 were all warmer than the 50-year mean of 12.5°C (1961–2010; Table 1), showing a warming climate.
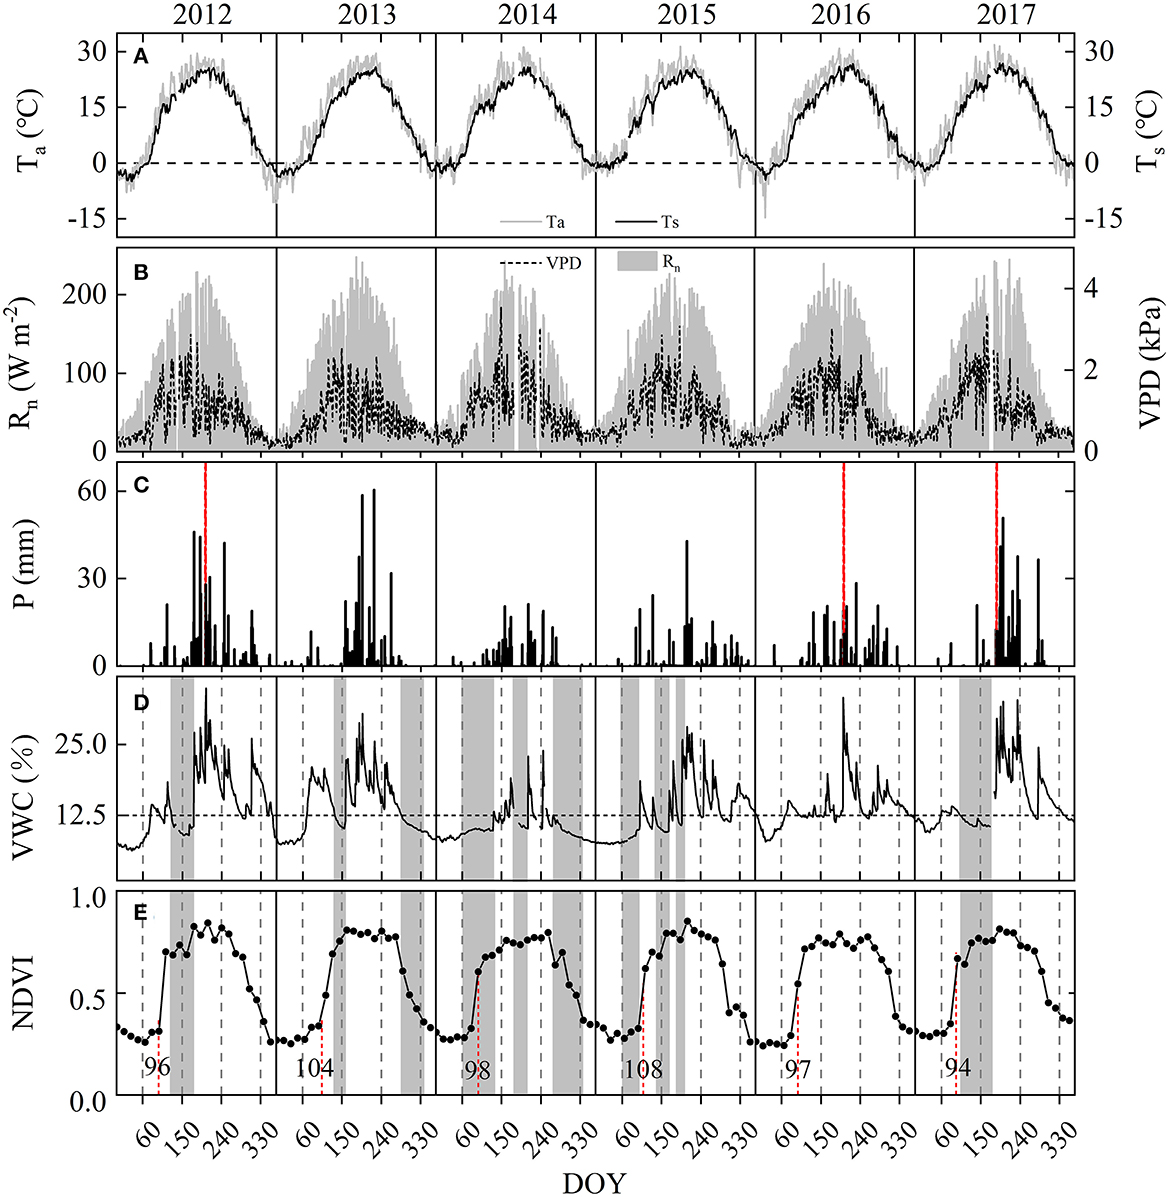
Figure 1. Daily mean. (A) Air temperature (Ta) and soil temperature (Ts), (B) net radiation (Rn) and vapor pressure deficit (VPD), (C) daily precipitation (P), (D) soil volumetric water content (VWC), and (E) normalized difference vegetation index (NDVI) from 2012 to 2017. All data are non-gap-filled data. The red dashed vertical line in plot (C) indicates intensive rainfall events and in plot (E) indicates the onset of the growing season. Gray-shaded bands in plots (D, E) indicate periods of drought (i.e., VWC < 12.5% during spring to autumn).
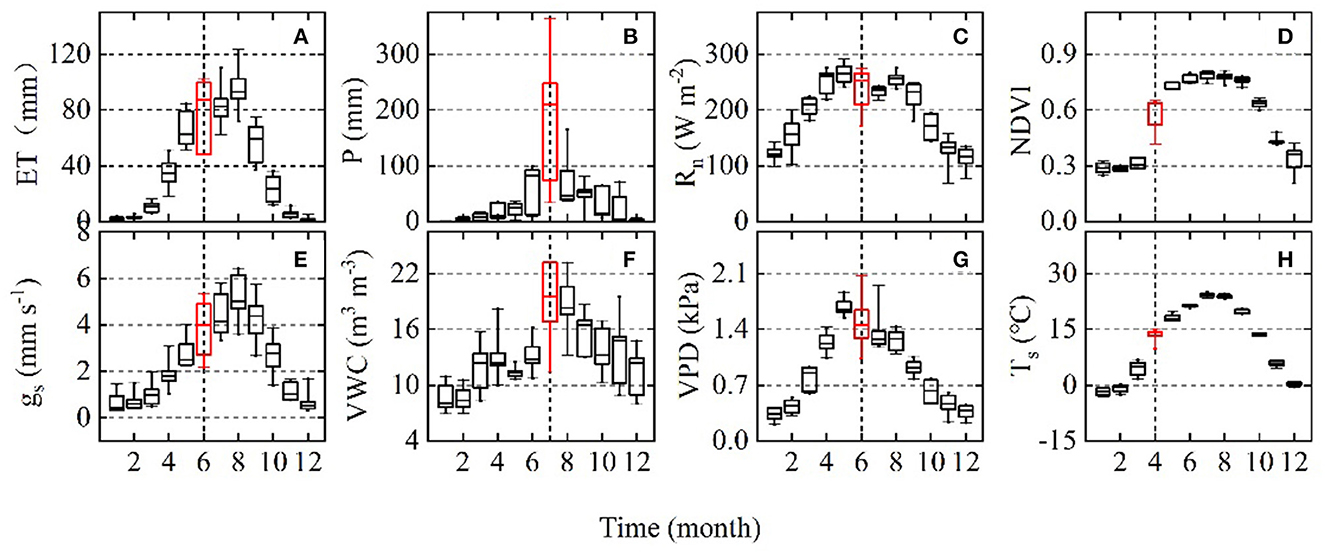
Figure 2. Box plot showing the interannual variation in (A) monthly evapotranspiration (ET), (B) main explanatory variables precipitation (P), (C) net radiation (Rn), (D) normalized difference vegetation index (NDVI), (E) mean daytime surface conductance (gs), (F) soil volumetric water content (VWC), (G) vapor pressure deficit (VPD), and (H) soil temperature (Ts) over the 6-year period (2012-2017). The red marks the part with the most variation.
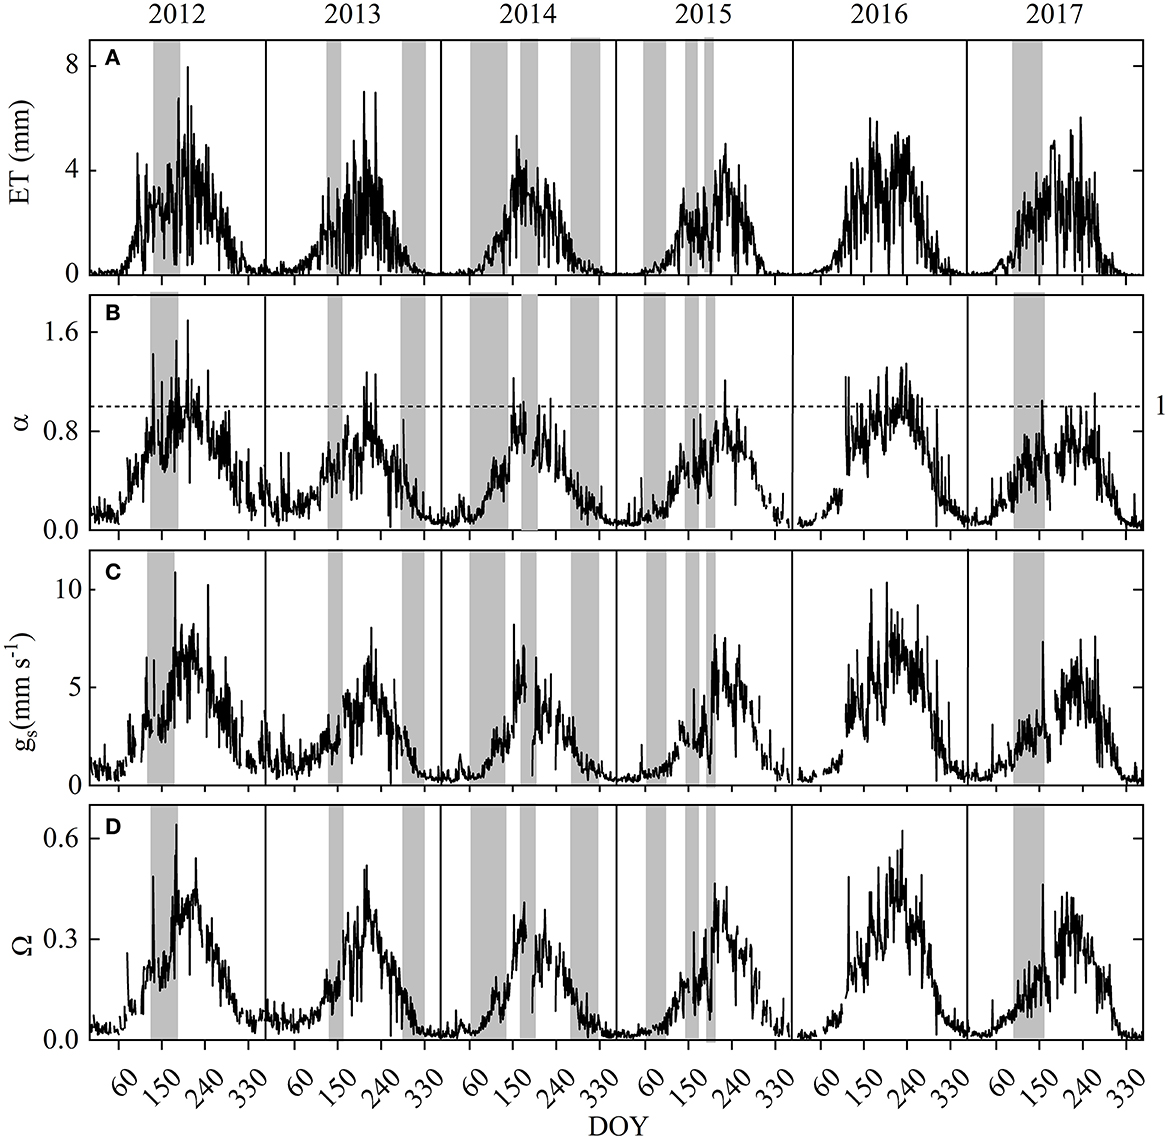
Figure 3. Seasonal variations in site (A) daily evapotranspiration (ET), (B) mean daily daytime Priestley-Taylor coefficient (α), (C) mean daytime surface conductance (gs), and (D) mean daily decoupling coefficient (Ω) for years 2012-2017. Gray-shaded bands indicate periods of drought (i.e., when VWC < 12.5%).
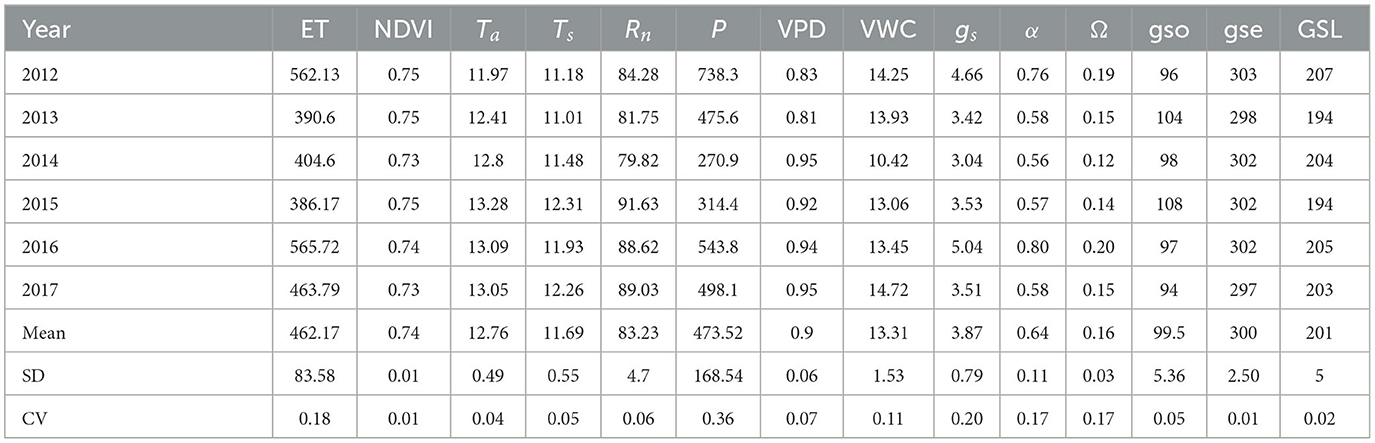
Table 1. Annual mean air temperature (Ta, °C), soil temperature (Ts, °C), net radiation (Rn, W m−2), vapor pressure deficit (VPD, kPa), and soil volumetric water content (VWC, %), annual total precipitation (P, mm), evapotranspiration (ET, mm) and growing-season (from May to October) normalized difference vegetation index (NDVI), midday (10:00–14:00 h, LST = GMT + 8) surface bulk parameters (gs, mm s−1 and α) and growing-season length (GSL, days).
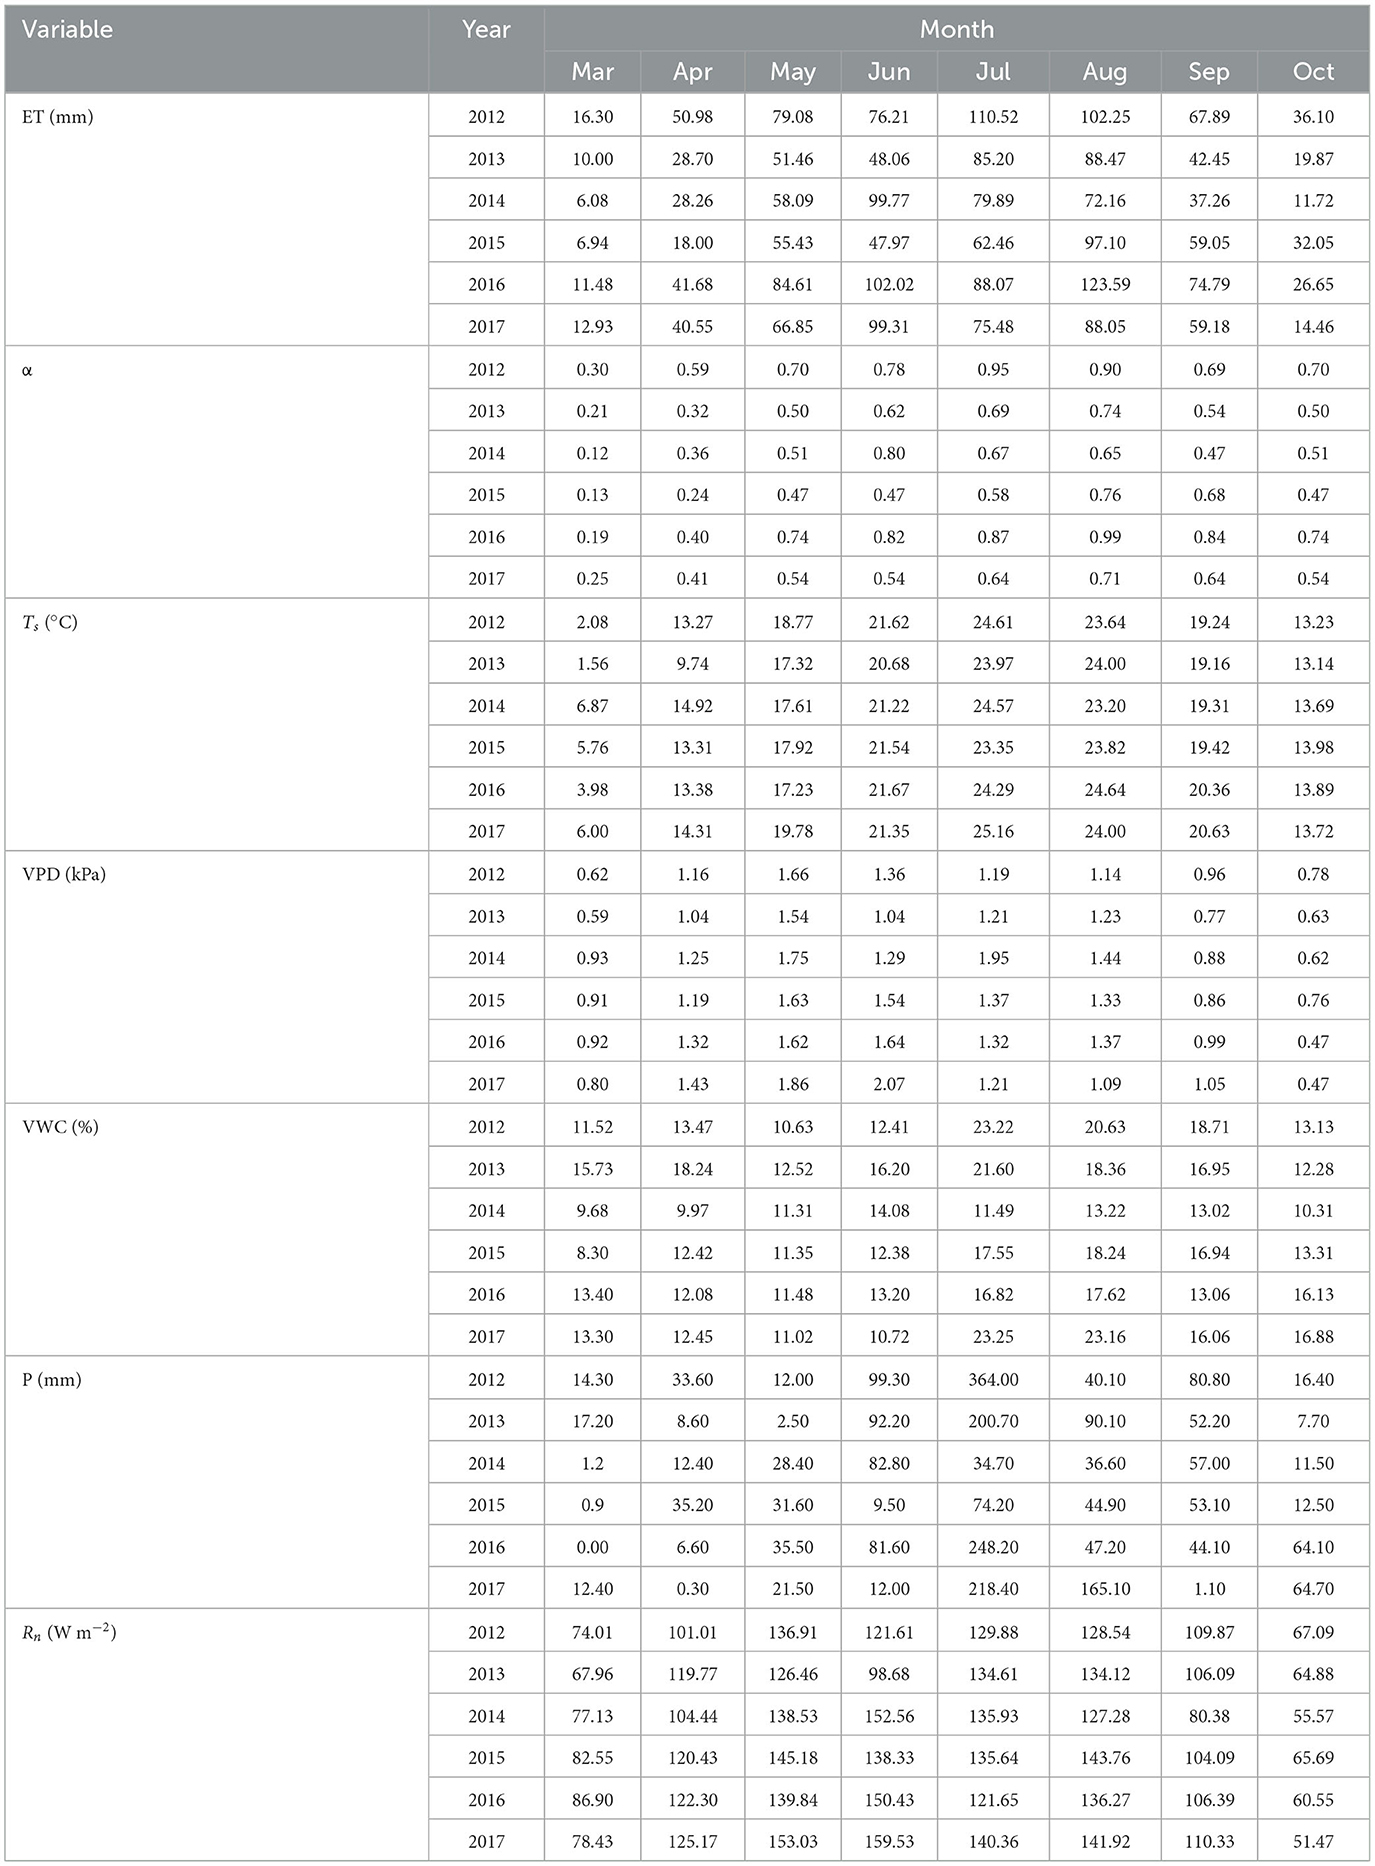
Table 2. Seasonal variation in evapotranspiration (ET), daytime Priestley–Taylor coefficient (α), and main meteorological variables for years 2012–2017.
Precipitation regime and soil volumetric water content (VWC) varied significantly both seasonally and annually at the site (Figures 1C, D, 2B, F; Table 1). The VWC at 10 cm depth varied with soil thaw in early spring and P amount (Figures 1C, D), increasing abruptly in March or June with the start of the rainy season and peaking in the middle of the growing season. Interannual variation in monthly P and monthly mean VWC were highest in July (Figures 2B, F). The mean annual total P was 473.52 ± 168.54 mm, with a CV of 35.6% (Table 1), and the lowest and highest annual mean were 270.9 and 738.3 mm in 2014 and 2012, respectively. The wet year 2012 had many irregular and intensive precipitation events, with 24% of the annual total P falling during a single summer rainfall event (i.e., 176 mm on DOY 203, dashed vertical line in Figure 1C). The year 2016 had one intensive rainfall event with 172.3 mm on DOY 202 (dashed vertical line in Figure 1C), which accounted for approximately 31% of the annual total P. In contrast, annual P in other years was all below the 50-year mean, especially the dry years 2014 and 2015 with 311 and 268 mm (Table 1). The dry year 2014 had the lowest mean annual VWC of 10.4% among the 6 years (Table 1). High spring VWC in 2013 was mainly caused by high non-growing season P (~99 mm) during the preceding year (i.e., 2012; Figures 1C, D).
Soils in late spring to early summer were generally dry over the 6 years (Figure 1D). According to the number of consecutive low VWC days during the growing season, 2012 had one extremely dry soil period (DOY 125–176) in spring, with a mean VWC of 10.0%. The year 2013 had two extremely dry soil periods, one in spring and one during the leaf coloration phase (i.e., DOY 134–157 and 286–334), with a mean VWC of 10.9 and 10.8%, respectively. The dry year 2014 had three extremely dry soil periods, one during each of the leaf expansion, leaf-expanded, and leaf coloration phases (DOY 60–131, 190–210, and 270–330), with a mean VWC of 9.9, 10.5, and 10.1%, respectively. The dry year 2015 had three extremely dry soil periods, two during the leaf-expansion phase and one during the leaf-expanded phase (DOY 60–101, 137–167, and 187–199), with a mean VWC of 8.8, 10.2, and 11.5, respectively. The year 2017 had one dry soil period during the leaf expansion phase (DOY 105–172), with a mean VWC of 11.1%. There was no dry soil period in the year 2016.
Both monthly and annual ET varied significantly among years at the site (Figures 2A, 3A). Interannual variation of monthly ET was highest in June (Figure 2A). Over the 6 years, annual ET was highest in 2016 and lowest in 2015. The mean annual ET was 462.17 ± 83.58 mm, with a CV of 18% (Table 1).
Over the 6 years, monthly ET was positively correlated to P in July (Figure 4A), to Ts in August (Figure 4F), to Rn in September (Figure 4C), and to gs in all months during the leaf-expanded period (with p's < 0.05; Figure 4H). Total ET over the spring and autumn were both positively correlated to mean VWC over the corresponding period (p's < 0.05; Figure 5), with a higher sensitivity in spring than autumn. Over the 6 years, annual ET values were positively correlated to annual total P, especially P in July (Figure 6) and the non-growing season (November through March; n = 5, p < 0.05, R2 = 0.98; Figure 7A).
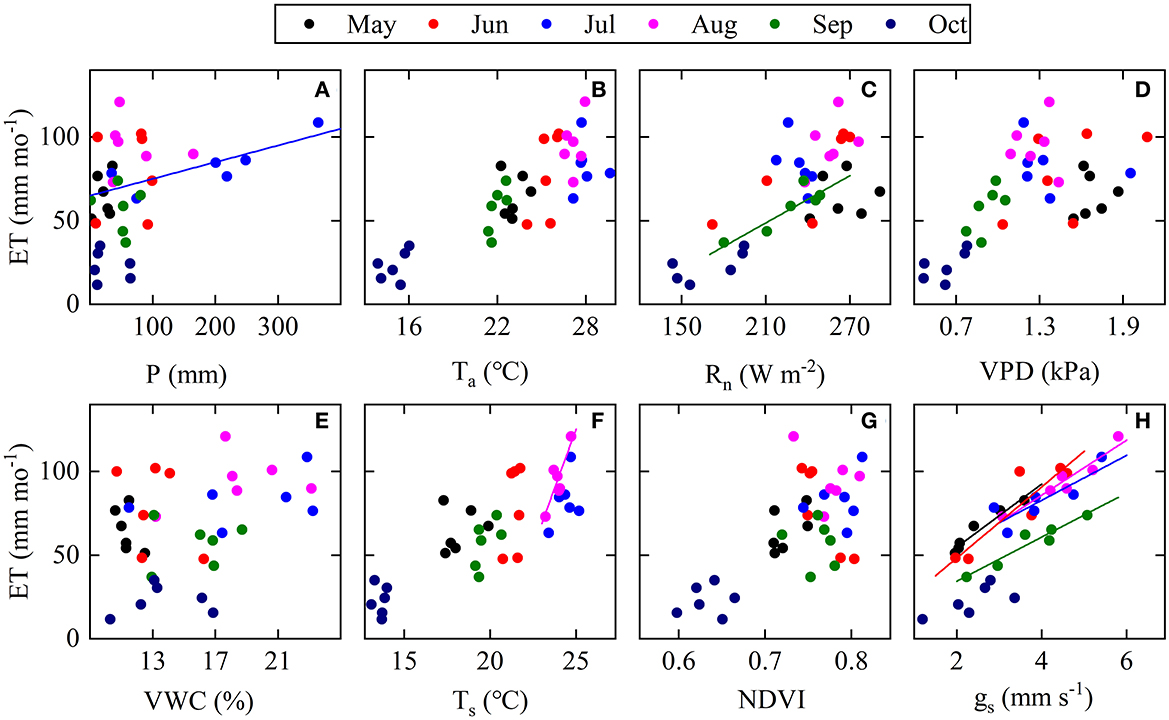
Figure 4. Interannual relationships between monthly ET (mm) and respective main explanatory variables (A) monthly P (mm), (B) monthly mean air temperature (Ta), (C) monthly mean net radiation (Rn), (D) monthly mean vapor pressure deficit (VPD), (E) monthly mean soil volumetric water content (VWC), (F) monthly mean soil temperature (Ts), (G) monthly mean NDVI and (H) monthly mean daytime surface conductance (gs) from May to October across years (2012–2017; n = 6 for each month and n = 36 for each plot). Solid lines are fitted line (p < 0.05) and dash lines are fitted line (p < 0.01).
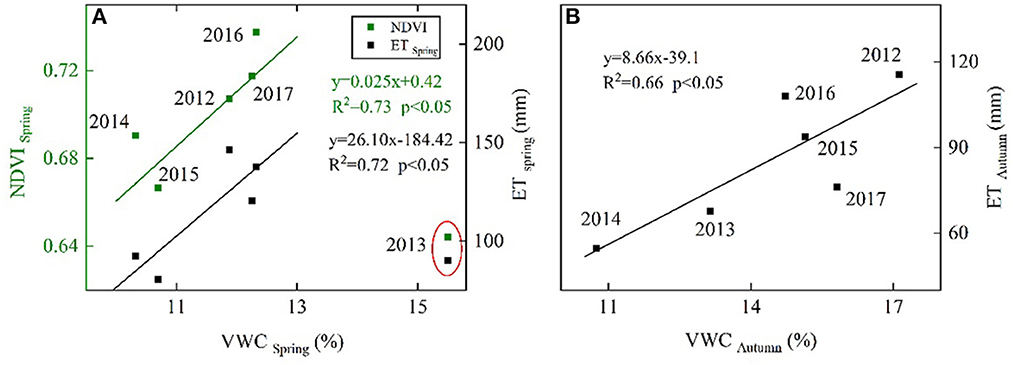
Figure 5. Interannual relationships between (A) ET (mm), NDVI, and VWC during spring (i.e., March to May) and (B) between ET (mm) and VWC (%) during autumn (i.e., September to November). The solid line is the fitted line (p < 0.05).
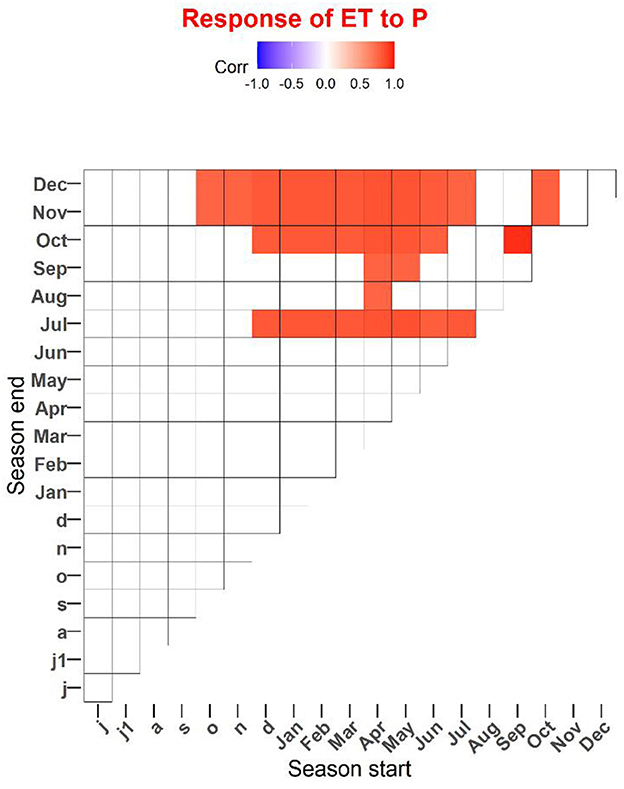
Figure 6. Responses of annual total evapotranspiration (ET) to precipitation (P) across 2012–2017. The figure presents significant correlations between P and ET. The correlations for individual months are shown as diagonal, whereas consecutive seasons starting in a given month extend upward. The blank square indicates correlations that were not significant (p > 0.05). Small and capital letters refer to the previous and current years.
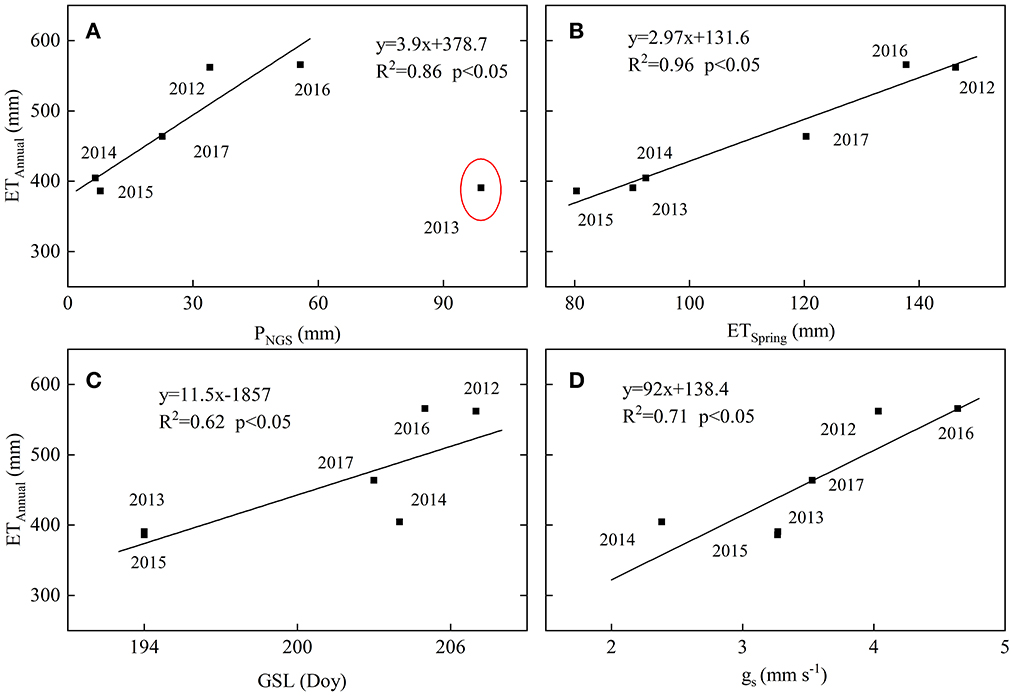
Figure 7. Annual total evapotranspiration (ETAnnual) as a function of (A) non-growing season precipitation (PNGS), (B) spring ET (ETSpring), (C) growing season length (GSL), and (D) growing season canopy conduction (gs) over 2012–2017. The dashed line is the fitted line (p < 0.05).
Cumulative ET showed a seasonal trend similar to cumulative P (Figure 8). Cumulative P exceeded cumulative ET on DOY 203 in 2012 and DOY 182 in 2013, remaining greater than the cumulative ET until the end of the year (Figures 8A, B), yielding annual cumulative difference between P and ET (i.e., P and ET) of 176 and 85 mm, respectively. In contrast, 2014 and 2015 provided cumulative ET greater than cumulative P after DOY 146, yielding annual cumulative P and ET of −135 and −72 mm, respectively (Figures 8C, D). During 2016 and 2017, annual cumulative ET approximately equaled that of P, with most rainfall refilling the soils in mid-summer (Figures 8E, F).
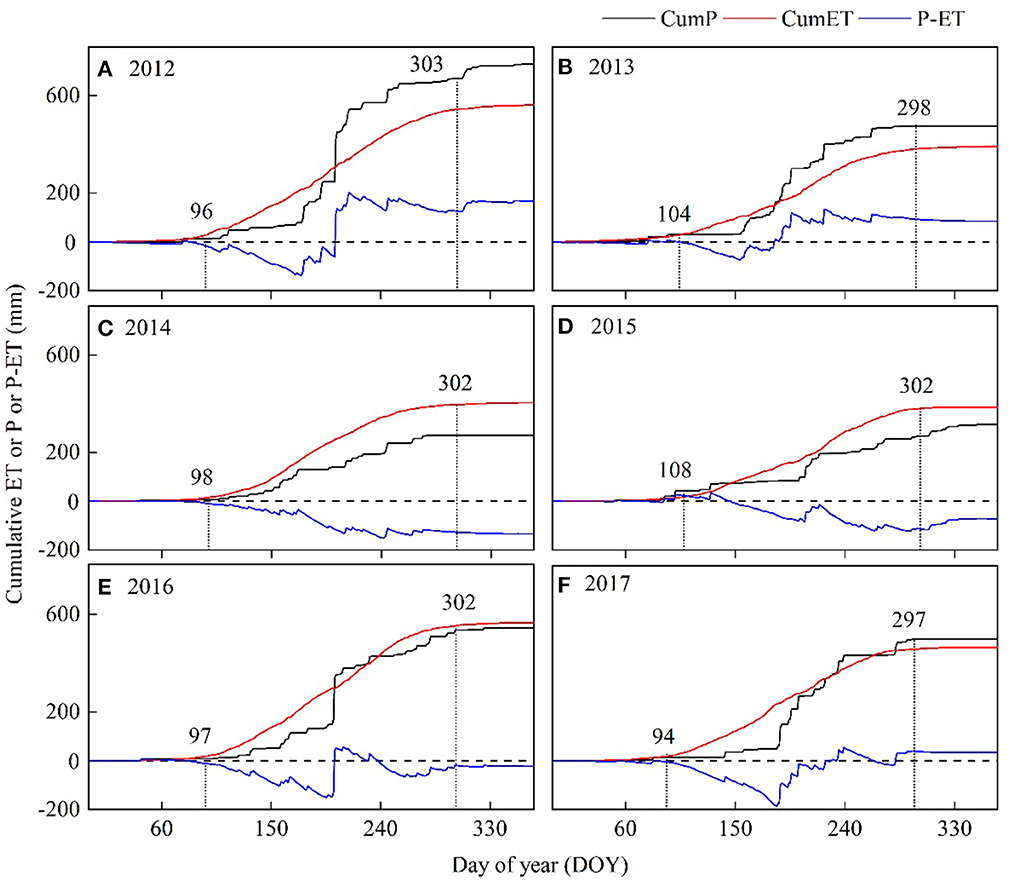
Figure 8. Annual cumulative evapotranspiration (ET, black solid lines), precipitation (P red line), and their differences (P-ET, blue dashed lines) for years 2012-2017. i.e., (A) year 2012, (B) year 2013, (C) year 2014, (D) year 2015, (E) year 2016, and (F) year 2017, respectively. Vertical dot line represents start and end of growing season.
Daily ET decreased during dry periods (Figure 3). Daily α, Ω, and gs displayed a trend similar to that demonstrated by ET. The extended dry spell in 2014–2015 led to an analogous reduction in annual ET, α, Ω, and gs (Table 1), causing a substantial decline in the cumulative difference between P and ET (Figure 8). Mean annual ET for the dry year 2014 and 2015 (~292 mm yr−1) was 30% lower than the non-drought year in 2016 (~565 mm yr−1). Accordingly, the derived parameters α and gs also showed large wet-dry contrasts, with dry vs. wet year reductions of 29% (α), 35% (Ω), and 35% (gs). The shorter duration of spring drought led to annual ET being higher (Figure 9).
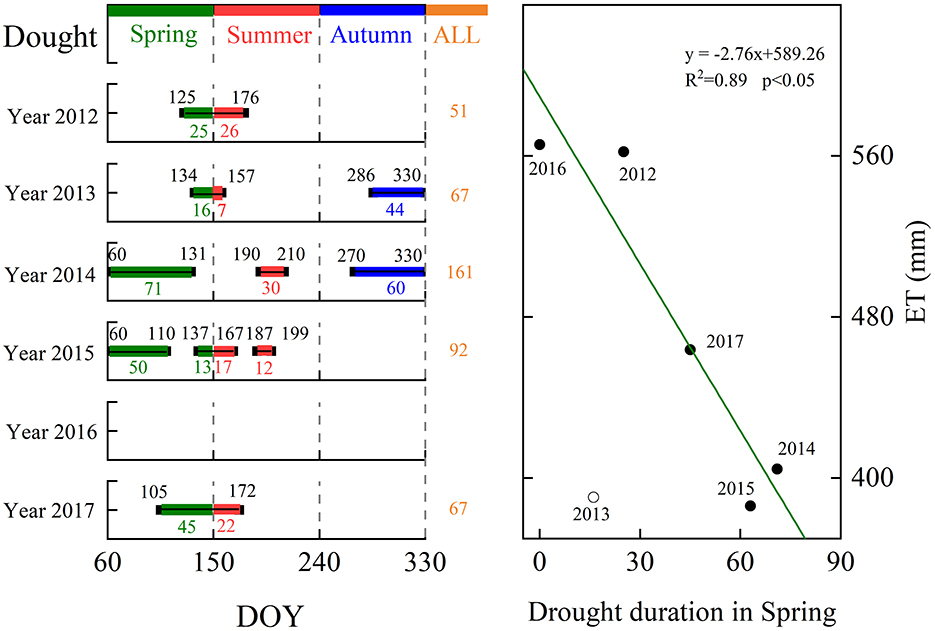
Figure 9. Drought period (seasons) and their duration in days and the interannual relationships between annual ET and the number of dry days in spring over 2012–2017. The dashed line is the fitted line (p < 0.05).
Our study demonstrated that the annual P, especially P in the non-growing season and July controlled the IAV of ET (Figures 6, 7A). This result supports the hypothesis that long-term, local-scale ET is generally sensitive to the IAV of P in water-limited environments (Fatichi and Ivanov, 2014). It was also consistent with previous findings that soil water replenishment through P during the non-growing period of the previous year and mid-growing season significantly affected current-year ET and was largely responsible for the interannual variation observed in ET in temperate forest ecosystems (Ma et al., 2018). Precipitation in different periods may affect annual ET through different mechanisms. Since the water availability in pre- and early-growing seasons was confirmed to be essential for the growth of forests in water-limited regions of temperate China (Wu et al., 2009, 2016), P in the non-growing season and leaf expansion period could primarily affect annual ET by its regulation on canopy development. At our site, we found that P in the non-growing season could provide higher spring soil moisture content that can benefit spring canopy formation (Supplementary Figure S1) and make a higher spring ET (Figure 5A). The result is comparable to the results obtained by previous research, which showed a lag effect of P on ET in temperate China (Xu et al., 2014). Notably, too much P during the non-growing season might lead to a decrease in spring ET. According to some reports, a wet winter can delay the growing season start and affect vegetation growth due to its effect on absorbed radiation energy and growing degree days of boreal forests at high latitudes (>40°N) (Piao et al., 2011; Fu et al., 2014; Yun et al., 2018), it is reasonable to assume that P (99 mm) during the non-growing season of 2012 caused the highest spring VWC but lower Ts, Rn (Table 2), leading to a delayed growing season start and restricted canopy development in early spring (Figures 1E, 5A), reducing days with abundant light and active vegetation, thus a lower spring ET (Figure 5A) of 2013.
After the canopy completed construction (July to September), our result showed that ET was positively related to P in July (ETJulytoSep = 0.27PJul + 184.5, R2 = 0.69, p < 0.05) but not to P during July to September (ETJulytoSep = 0.21PJultoSep+172.1, R2 = 0.50, p = 0.12 > 0.05), indicating that the effect of P in July played a more important role than P in later months in regular ET during the leaf expanded period. This may have occurred for the following reasons. First, as the cumulative P–ET was always negative before July (Figure 8), P in July contains 45% of annual P in mid-summer non-drought years (Figure 5B; Table 2), and it is very important to supply soil water during the leaf expanded period. Our result also showed that P in July could explain 50% of the variation in VWC during the leaf expanded period (n = 6, R2 = 0.5). Second, in instances of a more favorable water supply, ET becomes more constrained by atmospheric demand (Liu et al., 2018), and rainfall may offset the positive effects of available energy on increasing ET (Ryu et al., 2008; Kume et al., 2011). August and September had the highest mean monthly α, and Ω and relatively higher VWC during the 6 years (Figures 1D, 3, 4E; Table 2); more mild, longer duration P might lead to lower Rn and soil temperature, resulting in an uncertain effect of P amount on ET. That is the reason why the forest showed a strong interannual response of monthly ET to P for July but not for other summer months (Figures 4A, 6). Thus, the large variability of P at the onset of the monsoon may lead to IAV in the ET during the whole leaf expanded period in forests of Northern China. The results suggest that ET in our forest may be affected by possible changes in the rainfall regime. These observations together suggested the importance of the amount, intensity, and timing of precipitation control on IAV of ET.
The 6-year study (2012–2017) provided an opportunity to study the interannual responses of ET to drought. Drought events at the site occurred randomly at any phenophases and decreased the ET (Figure 1) whenever they happened. However, the mechanism and extent to which drought-affected annual ET differed with the timing and duration of drought occurrence.
In previous temperate forest studies, soil drought due to seasonal and interannual variations in rainfall could be a determining factor for interannual variations in ET due to stomatal closure or leaf fall (Wilson and Baldocchi, 2000; Thomas et al., 2009). Spring drought has been reported to suppress canopy development in a deciduous temperate forest (Noormets et al., 2008). At our study site, we found that the values of spring NDVI in years with spring drought were lower than the year 2016 (Figures 1E, 5A), while ET during spring had a positive relationship with spring NDVI (p = 0.06, R2 = 0.65) and IAV in annual ET (p < 0.05, R2 = 0.96; Figure 7B). This might indicate that the drought in spring can hinder canopy development and might result in an overall reduction in annual ET. As the photosynthetic structure in the leaf is determined by conditions at the time of leaf development (Kull and Tulva, 2002), the spring drought might have a detrimental effect on the canopy development of the growing season. That appears to be why the mean value of NDVI during the leaf expanding period was positively related to spring NDVI (y = 2.28 x – 0.97, n = 6, R2 = 0.71, p < 0.05). As gs depends on leaf area index (LAI) and leaf-level stomatal conductance, reduced NDVI can lead to suppressed gs, and thus ET (Figure 7D). The drought in spring may also affect annual ET by regulating plant phenology. Some studies found that drought happening in spring or autumn can influence the lifespan of annual deciduous and grassland in temperate regions, thus affecting growing season length and regulating days with active vegetation and IAV in annual ET (Wilson and Baldocchi, 2000; Ryu et al., 2008; Thomas et al., 2009; Zha et al., 2010). Our study also showed that the GSL had a positive influence on annual ET (Figure 7C). The variability of the onset date exceeded that of the end (Figure 8; Table 1) and the variability in the NDVI during the onset of the growing season exceeded that during the end of the growing season (Figure 2D) due to soil water replenishment through P during the summer month and less soil moisture deficit during the autumn (Figures 1C, D). As a result, ET was shown to be more sensitive to the availability of soil moisture during the onset of the greenness period than the transition to the senescence period (Figures 2, 5). Consequently, due to the monsoon circulation features (soil water replenishment through P in summer), the variability in the intensity of drought in spring may play a more important role in regular GSL and annual ET than that in autumn in temperate forest ecosystems. The more intense spring drought may lead to lower annual ET. Our result is that the most severe early spring drought in 2015 came with the lowest VWC in March (Table 2), leading to the latest date of onset, the shortest GSL; adding days with inactive vegetation and the lowest annual ET over 6 years (Figures 1D, E, 7C) can further support this.
We found that low P in mid-summer coincided with extreme drought and low ET during July to September, which occupied 52% of annual ET on average, particularly in 2014 (Figure 1D; Table 2). During the mid-summer, Ta and Rn reached their maxima, and water supply was substantially limited (Figures 1D, 8). Drought during the mid-growing season has been reported to reduce both photosynthetic capacity and transpiration, resulting in inhibited plant growth, earlier canopy senescence, self-protection by stomatal regulation against water losses, and limited ET (Restrepo and Arain, 2005; Yang et al., 2016). At our site, the NDVI showed little variability (Figures 2D, 4G) and decreased slightly during the mid-growing season drought in 2014 and 2015 (Figure 1E). More importantly, we found that lower P coupled with higher Ta and VPD, which can induce higher stomatal closure (Barron-Gafford et al., 2007), lead to suppressed gs and ET (Figures 4A, B, D; Table 2). This result is comparable to the results obtained by previous research, showing that the suppression of ET by summer drought was not related to early canopy senescence but resulted primarily from reductions in stomatal conductance in deciduous forests in temperate regions (Zha et al., 2010).
We conclude that the timing of drought can affect annual ET in different ways and that spring drought primarily affects ET by restricting leafing out and canopy development, while summer drought primarily reduces stomatal conductance in this region. However, to compare the effect of drought in different periods on annual ET, longer (decade scales) time series and a wider range of VWC and P conditions are needed. In fact, the data suggest that the variations of ET during spring appear to have had a smaller contribution to IAV in annual ET in this study (Supplementary Figure S2A) in part because of the smaller proportion of spring ET (< 25%) in the annual total. However, the result that IAV in ET during spring and summer were both the primary factors determining the IAV in annual total ET (Supplementary Figure S2A) and IAV of annual ET being more sensitive to IAV of spring ET (Supplementary Figure S2B) may indicate that the variability in the intensity of drought in spring may have played a more important role in regular annual ET than summer drought. Moreover, the extended duration of the spring drought resulted in reduced annual ET (Figure 9), indicating that, in addition to its immediate negative impact on ET during spring, the spring drought may also have a more prolonged carryover effect on annual ET compared to the summer drought. Some studies have reported that an earlier spring uses the soil water reservoir sooner, which leads to summer drought in the northern hemisphere (Angert et al., 2005). In the context of climate change that less precipitation occurs as winter snow in temperate regions, without enough water supply from winter snowfall and/or seasonally frozen soil (Wu et al., 2018), forests across temperate China might become more vulnerable to changing hydrological processes and intensified drought stress. Thus, irrigation during early spring is viewed as a practical and efficient management measure for sustaining tree growth and ecosystem services in urban forests of Northern China.
We arrived at the following conclusions with regard to our leading hypotheses based on 6 years of EC measurements in an urban forest in Northern China. First, the interannual variation of both annual ET and monthly ET was controlled by gs modified by environmental factors. The interannual variation of annual ET was significantly influenced by non-growing season and mid-growing season precipitation. However, the main controlling factors on the interannual variation of ET differed seasonally, namely, VWC and NDVI in spring, precipitation and Ts in summer, and VWC and Rn in autumn. Second, our results emphasized the importance of the timing and duration of drought in controlling the interannual variation of ET in this urban forest. Drought during the leaf expansion period reduced annual ET by restricting leafing out and canopy development, while drought during the expanded period reduced ET by reducing stomatal conductance. We also found that although autumn droughts may reduce ET, their contribution to the interannual variability of ET is less important than spring and summer droughts. Overall, this study emphasized the importance of the seasonality of the precipitation pattern in controlling interannual variation in ET in urban forests. Irrigation support in early spring and mid-summer is an effective measure for sustaining tree growth and ecosystem services in urban forests of Northern China.
The original contributions presented in the study are included in the article/Supplementary material, further inquiries can be directed to the corresponding author.
RY collected and analyzed data and wrote the manuscript. All authors contributed to the article and approved the submitted version.
This study was supported by the National Key Research and Development Program of China (2020YFA0608100) and grants from the National Natural Science Foundation of China (NSFC, Proj. Nos. 32101588 and 32071842). The U.S. China Carbon Consortium (USCCC) supported this study by providing an opportunity for instructive discussions and exchange' of ideas.
The authors are grateful to JM for his assistance with the field measurements and instrumentation maintenance. The authors would also like to thank the editors and reviewers for their constructive and detailed comments on earlier versions of the manuscript. This work was supported by the Fundamental Research Funds for the Central Universities (2021ZY49).
The authors declare that the research was conducted in the absence of any commercial or financial relationships that could be construed as a potential conflict of interest.
All claims expressed in this article are solely those of the authors and do not necessarily represent those of their affiliated organizations, or those of the publisher, the editors and the reviewers. Any product that may be evaluated in this article, or claim that may be made by its manufacturer, is not guaranteed or endorsed by the publisher.
The Supplementary Material for this article can be found online at: https://www.frontiersin.org/articles/10.3389/ffgc.2023.1218005/full#supplementary-material
Amiro, B. D., Barr, A. G., Black, T. A., Iwashitad, H., Kljun, N., McCaughey, J. H., et al. (2006). Carbon, energy and water fluxes at mature and disturbed forest sites, Saskatchewan, Canada. Agric. For. Meteorol. 136, 237–251. doi: 10.1016/j.agrformet.2004.11.012
Angert, A., Biraud, S., Bonfils, C., Henning, C. C., Buermann, W., Pinzon, J., et al. (2005). Drier summers cancel out the CO2 uptake enhancement induced by warmer springs. Proc. Natl. Acad. Sci.U. S. A. 102, 10823–10827. doi: 10.1073/pnas.0501647102
Barr, A. G., Black, T. A., Hogg, E. H., Griffis, T. J., Morgenstern, K., Kljun, N., et al. (2007). Climatic controls on the carbon and water balances of a boreal aspen forest, 1994–2003. Glob. Change Biol. 13, 561–576. doi: 10.1111/j.1365-2486.2006.01220.x
Barron-Gafford, G. A., Grieve, K. A., and Murthy, R. (2007). Leaf- and stand-level responses of forested mesocosm to independent manipulations of temperature and vapor pressure deficit. New Phytol. 174, 614–625. doi: 10.1111/j.1469-8137.2007.02035.x
Blanken, P. D., Black, T. A., Yang, P. C., Neumann, H. H., Nesic, Z., Staebler, R., et al. (1997). Energy balance and canopy conductance of a boreal aspen forest: partitioning overstory and understory components. J. Geophys. Res. Atmos. 102, 28915–28927. doi: 10.1029/97JD00193
Burba, G. (2013). Eddy Covariance Method for Scientific, Industrial, Agricultural and Regulatory Applications. Lincoln, OR: LI-COR Biosciences.
Chen, C., Park, T., Wang, X. H., Piao, S. L., Xu, B. D., Chaturvedi, R. K., et al. (2019). China and India lead in greening of the world through land-use management. Nat. Sustain. 2, 122–129. doi: 10.1038/s41893-019-0220-7
Chen, Y., Xue, Y., and Hu, Y. (2018). How multiple factors control evapotranspiration in North America evergreen needleleaf forests. Sci. Total Environ. 622–623, 1217–1224. doi: 10.1016/j.scitotenv.2017.12.038
Fan, H. Y., Yu, Z. W., Yang, G. Y., and Liu, Y. T. (2019). How to cool hot-humid (Asian) cities with urban trees? An optimal landscape size perspective. Agric. For. Meteorol. 265, 339–348. doi: 10.1016/j.agrformet.2018.11.027
Fatichi, S., and Ivanov, V. Y. (2014). Interannual variability of evapotranspiration and vegetation productivity. Water Resour. Res. 50, 3275–3294. doi: 10.1002/2013WR015044
Fu, Y. H., Piao, S., and Zhao, H. (2014). Unexpected role of winter precipitation in determining heat requirement for spring vegetation green-up at northern middle and high latitudes. Glob. Change Biol. 20, 3743–3755. doi: 10.1111/gcb.12610
Gielen, B., Verbeeck, H., Neirynck, J., Sampson, D. A., Vermeiren, F., and Janssens, I. A. (2010). Decadal water balance of a temperate Scots pine forest (Pinus sylvestris L.) based on measurements and modelling. Biogeosciences 7, 1247–1261. doi: 10.5194/bg-7-1247-2010
Hallegatte, S., and Corfee-Morlot, J. (2011). Understanding climate change impacts, vulnerability and adaptation at city scale: an introduction. Clim. Change 104, 1–12. doi: 10.1007/s10584-010-9981-8
Hao, L., Sun, G., Liu, Y., Wan, J., Qin, M., Qian, H., et al. (2015). Urbanization dramatically altered the water balances of a paddy fielddominated basin in southern China. Hydrol. Earth Syst. Sci. 19, 3319–3331. doi: 10.5194/hess-19-3319-2015
IPCC (2014). Climate Change 2014–Impacts, Adaptation and Vulnerability: Regional Aspects. Cambridge: Cambridge University Press.
Jacobs, C., Elbers, J., Brolsma, R., Hartogensis, O., and Moors, E. (2015). Assessment of evaporative water loss from Dutch cities. Build. Environ. 83, 27–38. doi: 10.1016/j.buildenv.2014.07.005
Jarvis, P. G., and McNaughton, K. G. (1986). Stomatal control of transpiration: scaling up from leaf to region. Adv. Ecol. Res. 15, 1–49. doi: 10.1016/S0065-2504(08)60119-1
Jia, X., Zha, T. S., Gong, J. N., Wu, B., Zhang, Y. Q., Qin, S. G., et al. (2016). Energy partitioning over a semi-arid shrubland in northern China. Hydrol. Process. 30, 972–985. doi: 10.1002/hyp.10685
Jim, C. Y., and Chen, W. Y. (2009). Ecosystem services and valuation of urban forests in China. Cities 26, 187–194. doi: 10.1016/j.cities.2009.03.003
Kull, O., and Tulva, I. (2002). Shoot structure and growth along a vertical profile within a Populus-Tilia canopy. Tree Physiol. 22, 1167–1175. doi: 10.1093/treephys/22.15-16.1167
Kume, T. N., Tanaka, K., Kuraji, H., Komatsu, N., Yoshifuji, T. M., Saitoh, M., et al. (2011). Ten-year evapotranspiration estimates in a Bornean tropical rainforest. Agric. For. Meteorol. 151, 1183–1192. doi: 10.1016/j.agrformet.2011.04.005
Launiainen, S. (2010). Seasonal and inter-annual variability of energy exchange above a boreal Scots pine forest. Biogeosciences 7, 3921–3940. doi: 10.5194/bg-7-3921-2010
Liu, S. G., Riekerk, H., and Gholz, H. L. (1998). Simulation of evapotranspiration from Florida pine flatwoods. Ecol. Modell. 114, 19–34. doi: 10.1016/S0304-3800(98)00103-3
Liu, X. D., Sun, G., and Mitra, B. (2018). Drought and thinning have limited impacts on evapotranspiration in a managed pine plantation on the southeastern United States coastal plain. Agric. For. Meteorol. 262, 14–23. doi: 10.1016/j.agrformet.2018.06.025
Ma, J., Zha, T., Jia, X., and Tian, Y. (2018). Energy and water vapor exchange over a young plantation in northern China. Agric. For. Meteorol. 263, 334–345. doi: 10.1016/j.agrformet.2018.09.004
Miao, H., Chen, S., Chen, J., Zhang, W., and Zhang, P. (2009). Cultivation and grazing altered evapotranspiration and dynamics in Inner Mongolia steppes. Agric. For. Meteorol. 149, 1810–1819. doi: 10.1016/j.agrformet.2009.06.011
Monteith, J., and Unsworth, M. (2007). Principles of Environmental Physics. Cambridge, MA: Academic Press.
Noormets, A., McNulty, S. G., DeForest, J. L., Sun, G., Li, Q., and Chen, J. (2008). Drought during canopy development has lasting effect on annual carbon balance in a deciduous temperate forest. New Phytol. 179, 818–828. doi: 10.1111/j.1469-8137.2008.02501.x
Ordónez, C., and Duinker, P. N. (2014). Assessing the vulnerability of urban forests to climate change. Environ. Rev. 22, 311–321. doi: 10.1139/er-2013-0078
Papale, D., Reichstein, M., Aubinet, M., Canfora, E., Berhofer, C., Kutsch, W., et al. (2006). Towards a standardized processing of Net Ecosystem Exchange measured with eddy covariance technique: algorithms and uncertainty estimation. Biogeosciences 3, 571–583. doi: 10.5194/bg-3-571-2006
Piao, S. L., Wang, X. H., Ciais, P., Zhu, B., Wang, T., and Liu, J. (2011). Changes in satellite-derived vegetation growth trend in temperate and boreal Eurasia from 1982 to 2006. Glob. Change Biol. 17, 3228–3239. doi: 10.1111/j.1365-2486.2011.02419.x
Priestley, C. H. B., and Taylor, R. J. (1972). On the assessment of surface heat flux and evaporation using large-scale parameters. Monthly Weather Rev. 100, 81–92. doi: 10.1175/1520-0493(1972)100<0081:OTAOSH>2.3.CO;2
Restrepo, N. C., and Arain, M. A. (2005). Energy and water exchanges from a temperate pine plantation forest. Hydrol. Process. 19, 27–49. doi: 10.1002/hyp.5758
Ryu, Y., Baldocchi, D. D., Ma, S., and Hehn, T. (2008). Interannual variability of evapotranspiration and energy exchange over an annual grassland in California. J. Geophys. Res. 113, D09104. doi: 10.1029/2007JD009263
Saitoh, T. M., Tamagawa, I., Muraoka, H., and Kondo, H. (2013). An analysis of summer evapotranspiration based on multi-year observations including extreme climatic conditions over a cool-temperate evergreen coniferous forest, Takayama, Japan. Hydrol. Process. 27, 3341–3349. doi: 10.1002/hyp.9834
Sun, G., Domec, J. C., and Amatya, D. M. (2016). “Forest evapotranspiration: measurement and modelling at multiple scales,” in Forest hydrology: Processes, management and assessment (Wallingford: CABI). 32–50. doi: 10.1079/9781780646602.0032
Tang, Y. K., Jia, C., Wang, L. N., Wen, X. F., and Wang, H. M. (2021). Solar energy dominates and soil water modulates net ecosystem productivity and evapotranspiration across multiple timescales in a subtropical coniferous plantation. Agric. For. Meteorol. 300, 108310. doi: 10.1016/j.agrformet.2020.108310
Thomas, C., Law, B. E., Irvine, J., Martin, J. G., Pettijohn, J. C., and Davis, K. J. (2009). Seasonal hydrology explains interannual and seasonal variation in carbon and water exchange in a semiarid mature ponderosa pine forest in central Oregon. J. Geophys. Res. 114, G04006. doi: 10.1029/2009JG001010
Tsuruta, K., Kosugi, Y., Takanashi, S., and Tani, M. (2016). Inter-annual variations and factors controlling evapotranspiration in a temperate Japanese cypress forest. Hydrol. Process. 30, 5012–5026. doi: 10.1002/hyp.10977
Vadeboncoeur, M. A., Green, M. B., Asbjornsen, H., et al. (2018). Systematic variation in evapotranspiration trends and drivers across the Northeastern United States. Hydrol. Process. 32, 3547–3560. doi: 10.1002/hyp.13278
Vose, J. M., Miniat, C. F., Luce, C. H., Asbjornsen, H., Caldwell, P. V., Campbell, J. L., et al. (2016). Ecohydrological implications of drought for forests in the United States. For. Ecol. Manage. 380, 335–345. doi: 10.1016/j.foreco.2016.03.025
Wilson, K. B., and Baldocchi, D. D. (2000). Seasonal and interannual variability of energy fluxes over a broadleaved temperate deciduous forest in North America. Agric. For. Meteorol. 100, 1–18. doi: 10.1016/S0168-1923(99)00088-X
Wu, X., Li, X., and Liu, H. (2018). Uneven winter snow influence on tree growth across temperate China. Glob. Change Biol. 2019, 25. doi: 10.1111/gcb.14464
Wu, X., Liu, H., Li, X., Liang, E., Beck, P. S., and Huang, Y. (2016). Seasonal divergence in the interannual responses of Northern Hemisphere vegetation activity to variations in diurnal climate. Sci. Rep. 6, 19000. doi: 10.1038/srep19000
Wu, X., Liu, H., Ren, J., He, S., and Zhang, Y. (2009). Water-dominated vegetation activity across biomes in mid-latitudinal eastern China. Geophys. Res. Lett. 36, L04402. doi: 10.1029/2008GL036940
Xiang, J., Hayat, M., Qiu, G. Y., Xiao, W. Y., Xu, X. L., Mao, P., et al. (2023). Assessing the variations of evapotranspiration and its environmental controls over a subalpine wetland valley in China. J. Hydrol. 617, 129058. doi: 10.1016/j.jhydrol.2022.129058
Xie, J., Zha, T., Zhou, C., Jia, X., Yu, H., Yang, B., et al. (2016). Seasonal variation in ecosystem water use efficiency in an urban-forest reserve affected by periodic drought. Agric. For. Meteorol. 221, 142–151. doi: 10.1016/j.agrformet.2016.02.013
Xu, M., Wen, X., Wang, H., Zhang, W., Dai, X., Song, J., et al. (2014). Effects of climatic factors and ecosystem responses on the inter-annual variability of evapotranspiration in a coniferous plantation in subtropical china. PLoS ONE 9, E85593. doi: 10.1371/journal.pone.0085593
Xue, B.-L., Komatsu, H., Kumagai, T., Kotani, A., Otsuki, K., and Ohta, T. (2012). Interannual variation of evapotranspiration in an eastern Siberian larch forest. Hydrol. Process. 26, 2360–2368. doi: 10.1002/hyp.9195
Yang, Y. T., Guan, H. D., Batelaan, O., Mcvicar, T. R., Long, D., Piao, S. L., et al. (2016). Contrasting responses of water use efficiency to drought across global terrestrial ecosystems. Sci. Rep. 6, 23284. doi: 10.1038/srep23284
Yun, J., Jeong, S. J., Ho, C. H., Park, C. E., Park, H., and Kim, J. (2018). Influence of winter precipitation on spring phenology in boreal forests. Glob. Change Biol. 24, 5176–5187. doi: 10.1111/gcb.14414
Zha, T., Alang, B., Garth, V. D. K., Tandy, B., Jharry, M. C., and Lawrenceb, F. (2010). Interannual variation of evapotranspiration from forest and grassland ecosystems in western Canada in relation to drought. Agric. For. Meteorol. 150, 1476–1484. doi: 10.1016/j.agrformet.2010.08.003
Zha, T., Alang, B., Tandy, B., Jharry, M., Bhatti, J., Hawthorne, I., et al. (2009). Carbon sequestration in boreal jack pine stands following harvesting. Glob. Change Biol. 15, 1475–1487. doi: 10.1111/j.1365-2486.2008.01817.x
Keywords: drought, evapotranspiration, interannual variability, precipitation, urban forests
Citation: Yang R, Liu P, Tian Y, Ma J, Bai Y, Li C, Huang S, Mu Y, Hayat M, Iqbal S, Yu H, Zhang F and Ma H (2023) Interannual variation in evapotranspiration in an urban forest reserve with respect to drought. Front. For. Glob. Change 6:1218005. doi: 10.3389/ffgc.2023.1218005
Received: 06 May 2023; Accepted: 08 August 2023;
Published: 01 September 2023.
Edited by:
Heidi Renninger, Mississippi State University, United StatesReviewed by:
Xiaodong Niu, Chinese Academy of Forestry, ChinaCopyright © 2023 Yang, Liu, Tian, Ma, Bai, Li, Huang, Mu, Hayat, Iqbal, Yu, Zhang and Ma. This is an open-access article distributed under the terms of the Creative Commons Attribution License (CC BY). The use, distribution or reproduction in other forums is permitted, provided the original author(s) and the copyright owner(s) are credited and that the original publication in this journal is cited, in accordance with accepted academic practice. No use, distribution or reproduction is permitted which does not comply with these terms.
*Correspondence: Peng Liu, cGVuZ2xpdTAzMTJAYmpmdS5lZHUuY24=
Disclaimer: All claims expressed in this article are solely those of the authors and do not necessarily represent those of their affiliated organizations, or those of the publisher, the editors and the reviewers. Any product that may be evaluated in this article or claim that may be made by its manufacturer is not guaranteed or endorsed by the publisher.
Research integrity at Frontiers
Learn more about the work of our research integrity team to safeguard the quality of each article we publish.