 Yiheng Wang
 Jinsong Zhang1†
 Liang Xue
95% of researchers rate our articles as excellent or good
Learn more about the work of our research integrity team to safeguard the quality of each article we publish.
Find out more
ORIGINAL RESEARCH article
Front. For. Glob. Change , 29 June 2023
Sec. Forest Growth
Volume 6 - 2023 | https://doi.org/10.3389/ffgc.2023.1207270
This article is part of the Research Topic Forest Phenomics: How Does Developing Sensor Technology Improve the Growth of Forest Plantations? View all 5 articles
Pigment content is a critical assessment indicator in the study of plant physiological metabolism, stress resistance, ornamental characteristics, and forest health. Spectral imaging technology is widely used for rapid and non-destructive determination of plant physicochemical parameters. To address the shortcomings of previous models of spectral reflectance prediction of chlorophyll content of needles only from the perspective of traditional algorithms and ignoring physical models, this research integrates variable complexity and refined classification of physical models to validate the increased accuracy of both the conventional partial least squares (PLS) method and the traditional neural network algorithm. The results of the conifer chlorophyll models of Picea koraiensis Nakai with different needle ages based on spectral reflectance and vegetation index parameters showed that the improved nonlinear state transition algorithm-backpropagation (STA-BP) neural network model approach (R2 of 0.73–0.89) and the nonlinear Stacking partial least squares (Stacking-PLS) model approach (R2 of 0. 67–0.85) is slightly more robust than the traditional algorithms nonlinear BP model (R2 of 0.63–0.82) and linear PLS model (R2 of 0.60–0.76). This finding suggests that the nonlinear fitting of chlorophyll content in needles of different needle ages in P. koraiensis Nakai surpasses the traditional linear model fitting methodology. Furthermore, the model fitting of chlorophyll content in conifers of different needle ages outperforms the mixed P. koraiensis Nakai model, suggesting that chlorophyll models using needle refinement classification help to improve model robustness. This study provides data and theoretical support for rapid and non-invasive characterization of physiological and biochemical properties of needles of different needle ages using spectral imaging techniques to predict growth and community structure productivity of forest trees in the coming years.
Data from the ninth National Forest Resources Inventory show that the area of plantation forests in China ranks first in the world at 7,954.28 million hm2 (Cui and Liu, 2020). Picea koraiensis Nakai, an important timber species in northeastern China, has been included in the 13th National Five-Year Plan for the cultivation and management of plantation forests (Zhou L. et al., 2020). This valuable dark coniferous forest species, belonging to the genus Picea A. Dietrich genus, thrives in humid climates. It exhibits relative tolerance to shade, and demonstrates a wide ecological range, significant ecological adaptability, and effective ecological coupling (Lan, 2015). As an important greening and plantation species in northeastern forest areas, P. koraiensis Nakai has ornamental and economic value.
Due to increasing urbanization, rapid development of transportation industry and intensification of industrial pollution, in the context of environmental stress, the irrational distribution of spatial and non-spatial structures of forest stands has caused competition for spatial ecological niches within the main species of P. koraiensis Nakai in plantation forests in northeastern China (Huang et al., 2023), resulting in unhealthy stands and unstable structural characteristics. Leaf pigment content, recognized as an important metric for assessing plant and forest health, has been identified as a trait intrinsically linked to ecosystem structure and relationships within its biodiversity (Miraglio et al., 2019). Phytochromes, with particular emphasis on chlorophyll, serve as the primary determinants of plant photosynthetic rates and primary productivity. These elements are widely used to characterize conditions of plant growth, including nutritional stress, photosynthetic capacity, and aging processes, thereby contributing to biogeochemical and nutrient cycles within ecosystems (Shipley et al., 2006; Ma et al., 2011).
At present, conventional methods used to determine plant physiological and biochemical indices are characterized by their time-consuming nature, excessive complexity and destructive tendencies. In addition, these existing methods require the development of more sophisticated models for accurate representation. Additional research is needed to explore longer time periods and to solve complex multivariate problems. It is an important goal of forestry research to rapidly monitor the structural growth status, inclusion content, health assessment, and other information of large-area forest stands to provide a scientific basis and theoretical support for decision-making in forest production management. The rapid development of sensor technology has made it easier for hyperspectral remote sensing technology to obtain different target reflectance information. Fine spectral resolution can fully reflect the characteristics of subtle changes and differences in vegetation spectra (Tong et al., 2016). The application of hyperspectral remote sensing technology in chlorophyll content retrieval offers advantages such as time-saving, labor-saving, non-destructive measurements, comprehensive coverage, continuous dynamic monitoring, and rapid acquisition and analysis of regional-scale vegetation dynamic changes.
Traditional inversion methods mainly include statistical model methods and physical model inversion methods. The vegetation index method, the most widely used statistical model method, establishes a regression model of vegetation index and chlorophyll content measurement value to perform chlorophyll inversion. Although this method is simple and convenient, it has weak mechanisms and is susceptible to vegetation types, weather, climate, and other objective conditions, resulting in poor universality (Liu et al., 2020). The physical model approach inverts chlorophyll by establishing a correlation between the chlorophyll content value, basic parameters, and canopy reflectance. This method, which has a solid mechanistic basis and reasonable universality, is not constrained by vegetation type. However, its complicated model structure requires a larger number of input parameters (Tawhid and Savsani, 2018). With the growing demand in remote sensing for the refinement of nonlinear physical models, optimized neural networks, which offer significant advantages in nonlinear model fitting, along with improved PLS models, have gradually emerged as a standard approach for the inversion of physiological indicators.
With the proliferation of high-throughput spectral data, the analysis of high-dimensional data and physiological and biochemical indicators, where the characteristic variables exceed the number of samples, has become increasingly critical for forest management. Partial least squares (PLS) is a commonly used technique for high-dimensional data analysis (Wold et al., 1984). However, traditional PLS linear regression models often lack precision when compared to nonlinear relationship fitting (Baffi et al., 1999). The accuracy of traditional PLS models can be improved by stacking integration (Li et al., 2005). The concept of stacking integration is similar to the neural network fitting mode (Akyol, 2020). It allows the selection of models with different regularity terms for integration, thereby improving the sensitivity of the model to parameters and mitigating overfitting. The stacking partial least squares (Stacking-PLS) model can facilitate the nonlinear fitting process from multivariate to multivariate under high-dimensional data conditions (Zheng and Zhang, 2021).
Backpropagation (BP) neural networks, which are multilayer feedforward neural network models trained via error backpropagation algorithms (Wang, 2009), have exceptional multidimensional function mapping capabilities. These capabilities allow them to address complex problems that are beyond the reach of simple perceptrons (Kaviani and Sohn, 2020). However, the initial weight threshold for each neuron in the traditional BP neural network is quantified randomly, leading to slow convergence and unstable models. As a result, the algorithm often easily succumbs to local optima. Currently, many researchers choose traditional optimization algorithms such as genetic algorithms (GA) to optimize BP neural networks (Zhou et al., 2022). However, these traditional optimization algorithms tend to underperform in high-dimensional variables and are prone to problems such as premature convergence (Liu et al., 2011; Zheng et al., 2017). Therefore, in this paper, the state transition algorithm (STA) is employed. This algorithm is less prone to stagnation compared to traditional optimization algorithms and exhibits high scalability for intelligent global optimization (Zhou X. et al., 2020; Han et al., 2021). This improves the accuracy of BP neural network models based on the STA algorithm.
In this experiment, the chlorophyll content and spectral reflectance of P. koraiensis Nakai needles at different ages (annual, biennial, and triennial) were measured. The Savitzky-Golay algorithm (Luo et al., 2005) with a second order polynomial and a window size of 13 was used to calculate the first and second derivatives. Four preprocessing methods were employed: first derivative (FD), second derivative (SD), standard normal variable (SNV) (Bi et al., 2016), and multiple scattering corrections (MSCs) (Garhwal et al., 2020). In addition, eight optimized spectral vegetation indices and the spectral band and vegetation index with the highest correlation coefficient with chlorophyll were incorporated into BP neural network models, traditional PLS modeling methods, improved state transition algorithm-BP neural network (STA-BP) models (Zhou X. et al., 2020), and optimized Stacking-PLS models (Zheng and Zhang, 2021) to construct needle chlorophyll inversion models for different ages of P. koraiensis Nakai. The main research objectives are as follows:
1. To compare the correlation between the four pre-processing methods, optimized spectral indices and chlorophyll content at different needle ages.
2. To evaluate the predictive accuracy of traditional and improved models for needle chlorophyll and mixed needle chlorophyll at different needle ages in P. koraiensis Nakai and to identify the optimal combination model.
3. To investigate the long-term multivariate chlorophyll model and discuss the limitations and drawbacks of traditional PLS and BP models.
4. To provide theoretical support for the future application of remote sensing technology in analyzing physiological and biochemical indicators and evaluating the health status of coniferous forests in Northeast China.
The study was conducted at the Mopan Mountain Training Base located in Jilin City, Jilin Province. This region is characterized by a northern temperate continental climate, with an average annual temperature of 4.5°C, an annual rainfall of 668 mm, a relative humidity of 70%, and a frost-free period of 130 days. The vegetation in this region is part of the Changbai Mountain Flora, which is characterized by a wide variety of wild plants and a forest cover that covers 90% of the area. The main tree species include Juglans mandshurica, Fraxinus mandshurica, P. koraiensis Nakai, and Quercus mongolica. The dominant shrub species are Malus baccata, Schisandra chinensis, and Euonymus alatus, while the dominant herbs are Pteridium aquilinum, Adenocaulon himalaicum, Carex remotiuscula, and Glechoma hederacea. The soil in this region is mainly dark brown loam.
The annual, biennial, and triennial needles of P. koraiensis Nakai plants at the Mopanshan practice site were used in this experiment. High pruning shears facilitated the sampling of needles from 25 to 30 cm diameter plants at the top, middle, and bottom of the canopy. Healthy and undamaged annual, biennial, and triennial needles were collected from four directions: southeast, southwest, northeast, and northwest. Each plant was sampled three times to ensure replication.
For the determination of needle chlorophyll content, a sample of 0.3 g of P. koraiensis Nakai needle was collected, cut into pieces and placed in a mortar. The addition of a small amount of quartz sand and 95% ethanol facilitated the grinding of the mixture into a homogenate. This homogenate was then transferred to a test tube and diluted with 95% ethanol to a final volume of 10 ml. The test tube was sealed and left to soak for 24 h in a dark, light-free environment. The sample was then filtered and the absorbance of the chlorophyll extract was measured at wavelengths of 649 and 665 nm using an Agilent Cary 60 UV-Vis spectrophotometer.
In Equations 1, 2, D665 and D649 are the absorbance of the chlorophyll extracts at 649 and 665 nm, respectively; V is the total volume of the extracts (ml); M is the mass of the needles (g).
Needle reflectance was measured using a Finnish SPECIM handheld intelligent AISA hyperspectral camera with a wavelength range of 400–1,000 nm, spectral resolution of 7 nm, image resolution of 512 × 512 pixels, and 204 spectral bands.
Using K-fold cross-validation, the allocation of samples was such that 80% served as the modeling data set, with the remaining 20% split evenly between the validation and test sets. Data analysis was performed using R software (version 4.2.1). The prospectr package (Mullen and Stokkum, 2007) was used for spectral processing to effectively avoid errors caused by noise and baseline translation (Divya and Gopinathan, 2019). FD and SD spectral calculations were performed using the Savitzky-Golay function (Steinier et al., 1972) with a window size of 13. The standard Normal Variate function and MSC function (Rogers et al., 1995) were used to obtain SNV and MSC spectral data, respectively.
The formula for calculating the first-order difference of the spectra is:
In Equation 4, is the first-order differential of the spectrum in the band from n to n + 1,Rλn + 1 and Rλn are the reflectance values of the original spectrum at n + 1 and n, respectively, and Δλ denotes the interval between wavelengths λn–1 and λn.
The formula for calculating the second-order differential of spectra:
In Equation 5, is the second-order differential of the spectrum in the band from n to n + 1, , are the reflectance values of the original spectrum at n + 1, n, respectively, and Δλ denotes the interval between the wavelengths λn – 1 to λn. Differential processing can effectively eliminate the influence of system error and background noise on the spectral values.
SNV calculation formula:
In Equation 6, xi is the spectral reflectance of the i-th observed value, is the mean, and si is the standard deviation. SNV normalizes each spectrum to eliminate dimensional effects and the influence of variation in the magnitude of the variable, that is, the magnitude of the value (Garhwal et al., 2020).
MSC calculation formula:
In Equation 7, xi is the spectral reflectance of the i-th observed value, xr represents the average of all spectral data as the ideal, and c is a constant term. MSC eliminates scattering levels that cause spectral differences and corrects baseline translation and offset phenomena in spectral data by using ideal spectra.
Using the spectral data acquired by the hyperspectral camera, Carter indices (Ctr1 and Ctr2), Vogelmann indices (VOG1, VOG2, and VOG3), blue/green indices (BGI1 and BGI2), and blue/red indices (BRI2) were selected as the basis for spectral analysis. These indices were chosen with vegetation types and needle physiological characteristics to reflect subtle changes in vegetation physiological indicators and health status (Table 1). The Carter indices refer to the narrow spectral bands near the red (695 nm) and blue (420 nm) regions and the strong chlorophyll absorption bands (760 nm) at the edge of the chlorophyll absorption characteristics in needles (Carter, 1994). The Vogelmann indices, with spectral bands also near the red edge, aim to enhance the pigment signal and correct for leaf water content (Vogelmann et al., 1993). The blue/green and blue/red indices represent the ratio of visible, blue-green, and blue-red light and serve as indicators for early monitoring of needle stress (De Jong et al., 2012).
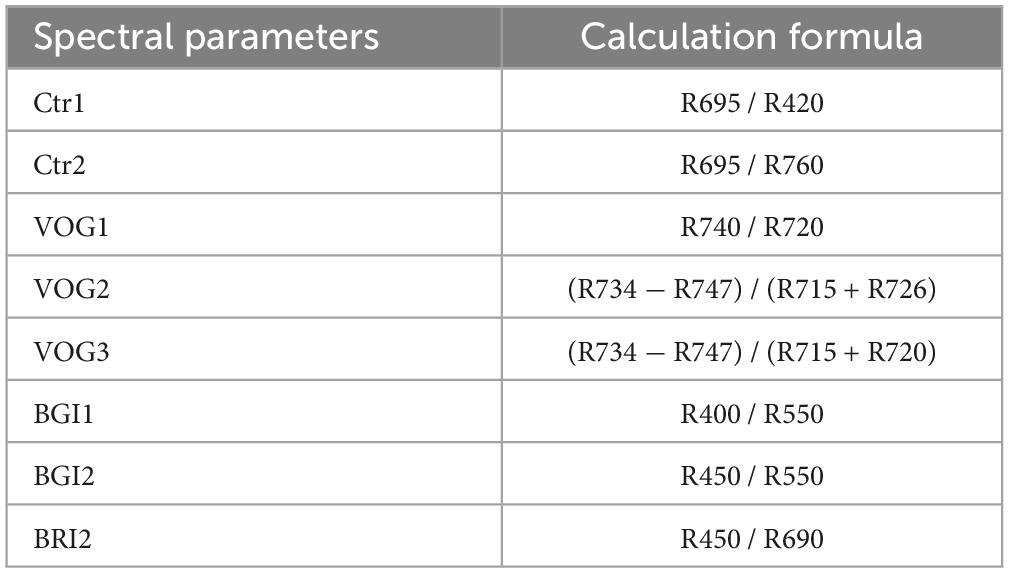
Table 1. Selected vegetation index and calculation method.
The PLS method, which fits individual chemical compositions to reflectance spectra for model calibration, identifies the optimal function of the data by minimizing the sum of squares of the errors (Tran et al., 2014; Li et al., 2019). While previous literature (Wang and Hu, 2006; Karaman et al., 2013; He et al., 2021) has primarily discussed accuracy in the context of linearity and nonlinearity, the fundamental challenge in improving the accuracy of PLSR models lies in their struggle to model and predict long-period, multivariate functions. Despite the difficulty PLSR faces in accounting for issues such as variable correlation, its wide application in modeling statistical analysis and its advantages within a given period and range of variables are undeniable. Therefore, a systematic summary and comparison of traditional modeling approaches is warranted.
Single models often face challenges in fitting complex data and have low anti-interference capabilities. Therefore, integrating multiple models can improve the generalization ability of the model (Dolk and Kottemann, 1993). There are two main strategies for learning integration: Boosting architecture, which builds robust learners through serial connections between base learners, and Bagging architecture, which builds robust learners by constructing multiple independent models through weighting (Grosse-Rhode, 2004; Zhang and Moller-Pedersen, 2013). The concept of stacking integration combines both boosting and bagging strategies. To circumvent problems such as low accuracy, poor robustness, and overfitting of PLS fitting models, this study refines the PLS model fitting process based on the stacking integration concept. In essence, the Stacking-PLS model is a nonlinear PLS regression model that uses the stacking integration concept to explore the nonlinear relationship between independent and dependent variables (Zhang and Moller-Pedersen, 2013). To enhance the generalizability of stacking integration (Figure 1), the dataset in this study is partitioned into a training set (Dtrain) and a test set (Dtest) using K-fold cross-validation (Rooney and Patterson, 2007).
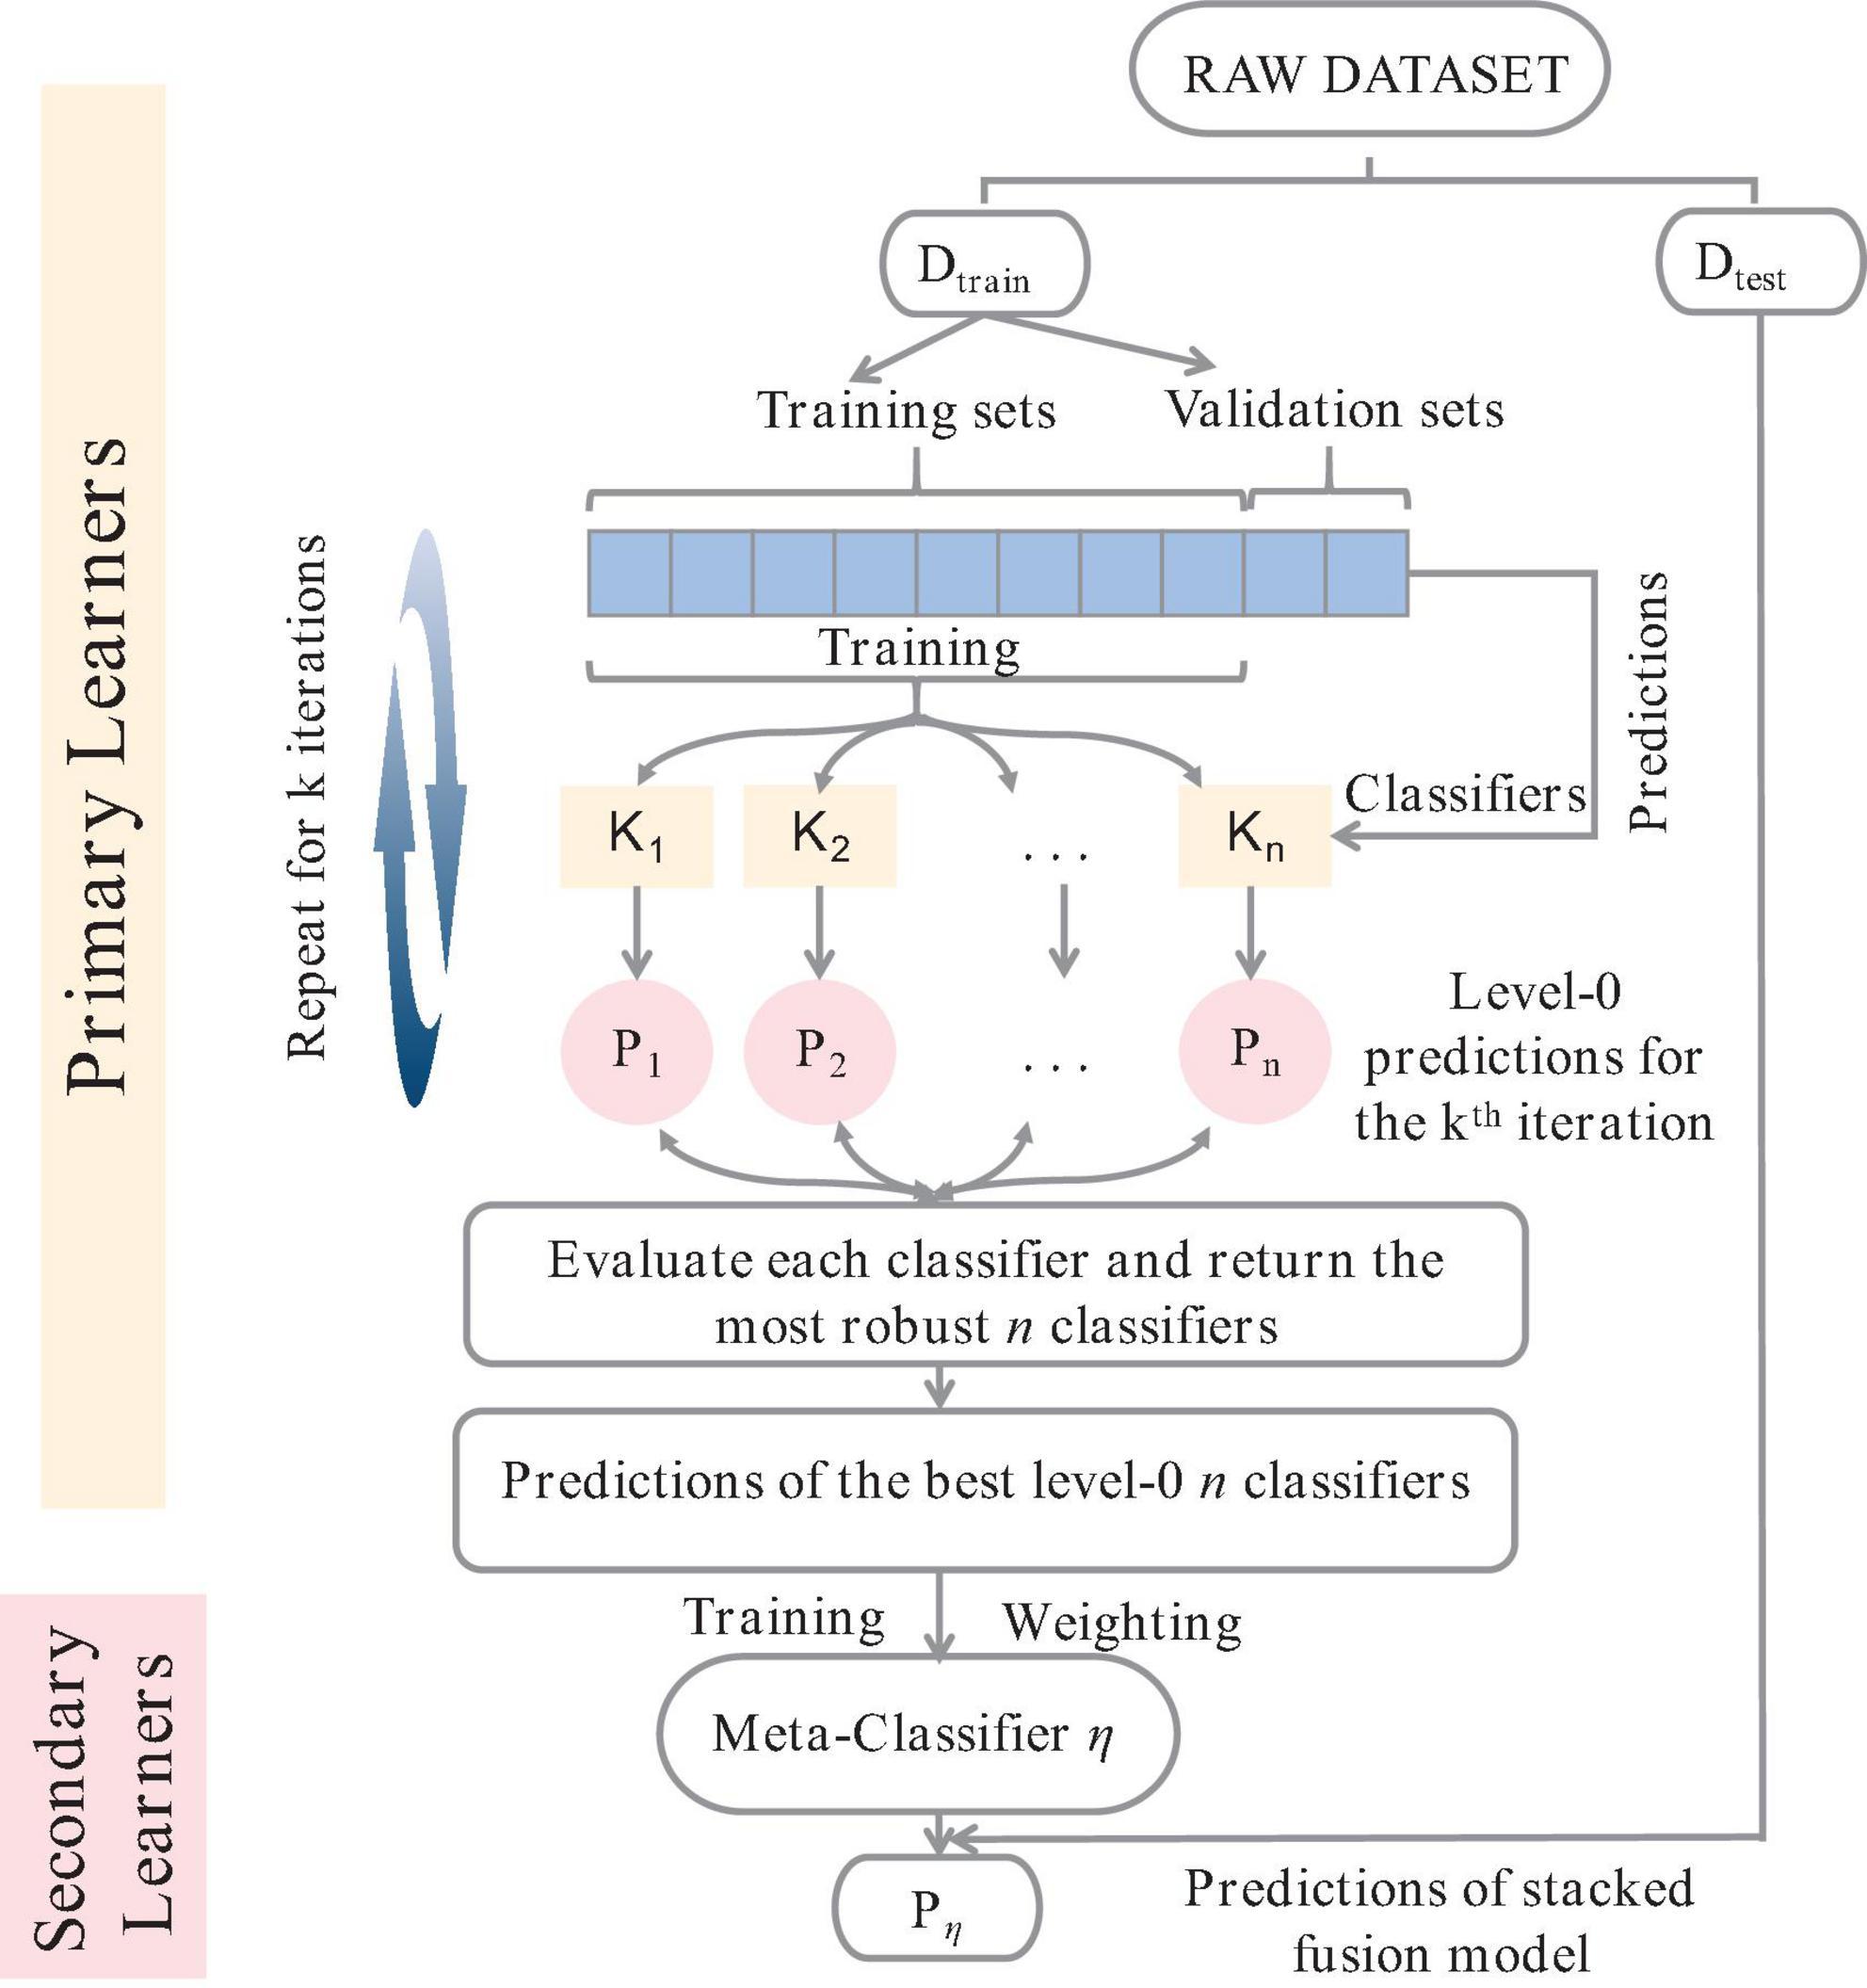
Figure 1. Schematic diagram of stacking integration algorithm.
The BP neural network algorithm, as shown in Figure 2, operates on the principle of minimizing the objective function, which is the squared network error. This minimization is achieved through the gradient descent method, which adjusts network weights and thresholds through backpropagation. The algorithm has self-learning and generalization capabilities that facilitate the handling of complex and nonlinear mapping functions. These capabilities contribute to improved prediction accuracy for problems such as nonlinear function approximation (Keiner and Yan, 1998). The BP neural network, a multilayer feedforward neural network, is trained using the error backpropagation algorithm. This training includes signal feedforward and error backpropagation. The forward process consists of three layers, with neurons in each layer influencing only the state of the next layer. If the output of the training neural network does not meet the desired output value, the error backpropagation process is initiated. This process adjusts the weights and thresholds layer by layer until the expected error range is reached (Faal et al., 2015; Li and Cao, 2019). The BP neural network can streamline the processing of high-throughput data and accurately identify the intricate intrinsic relationships within the data (Huang et al., 2009; Jia et al., 2015). However, the stochastic quantification of the initial weight threshold of the BP neural network can be challenging. When the model is used to predict the refined classification model of chlorophyll content in needles of different ages in red bark spruce, it can easily fall into a partial optimization solution, thus failing to achieve the desired prediction results (Zhou and Cheng, 2014; Wang et al., 2016).
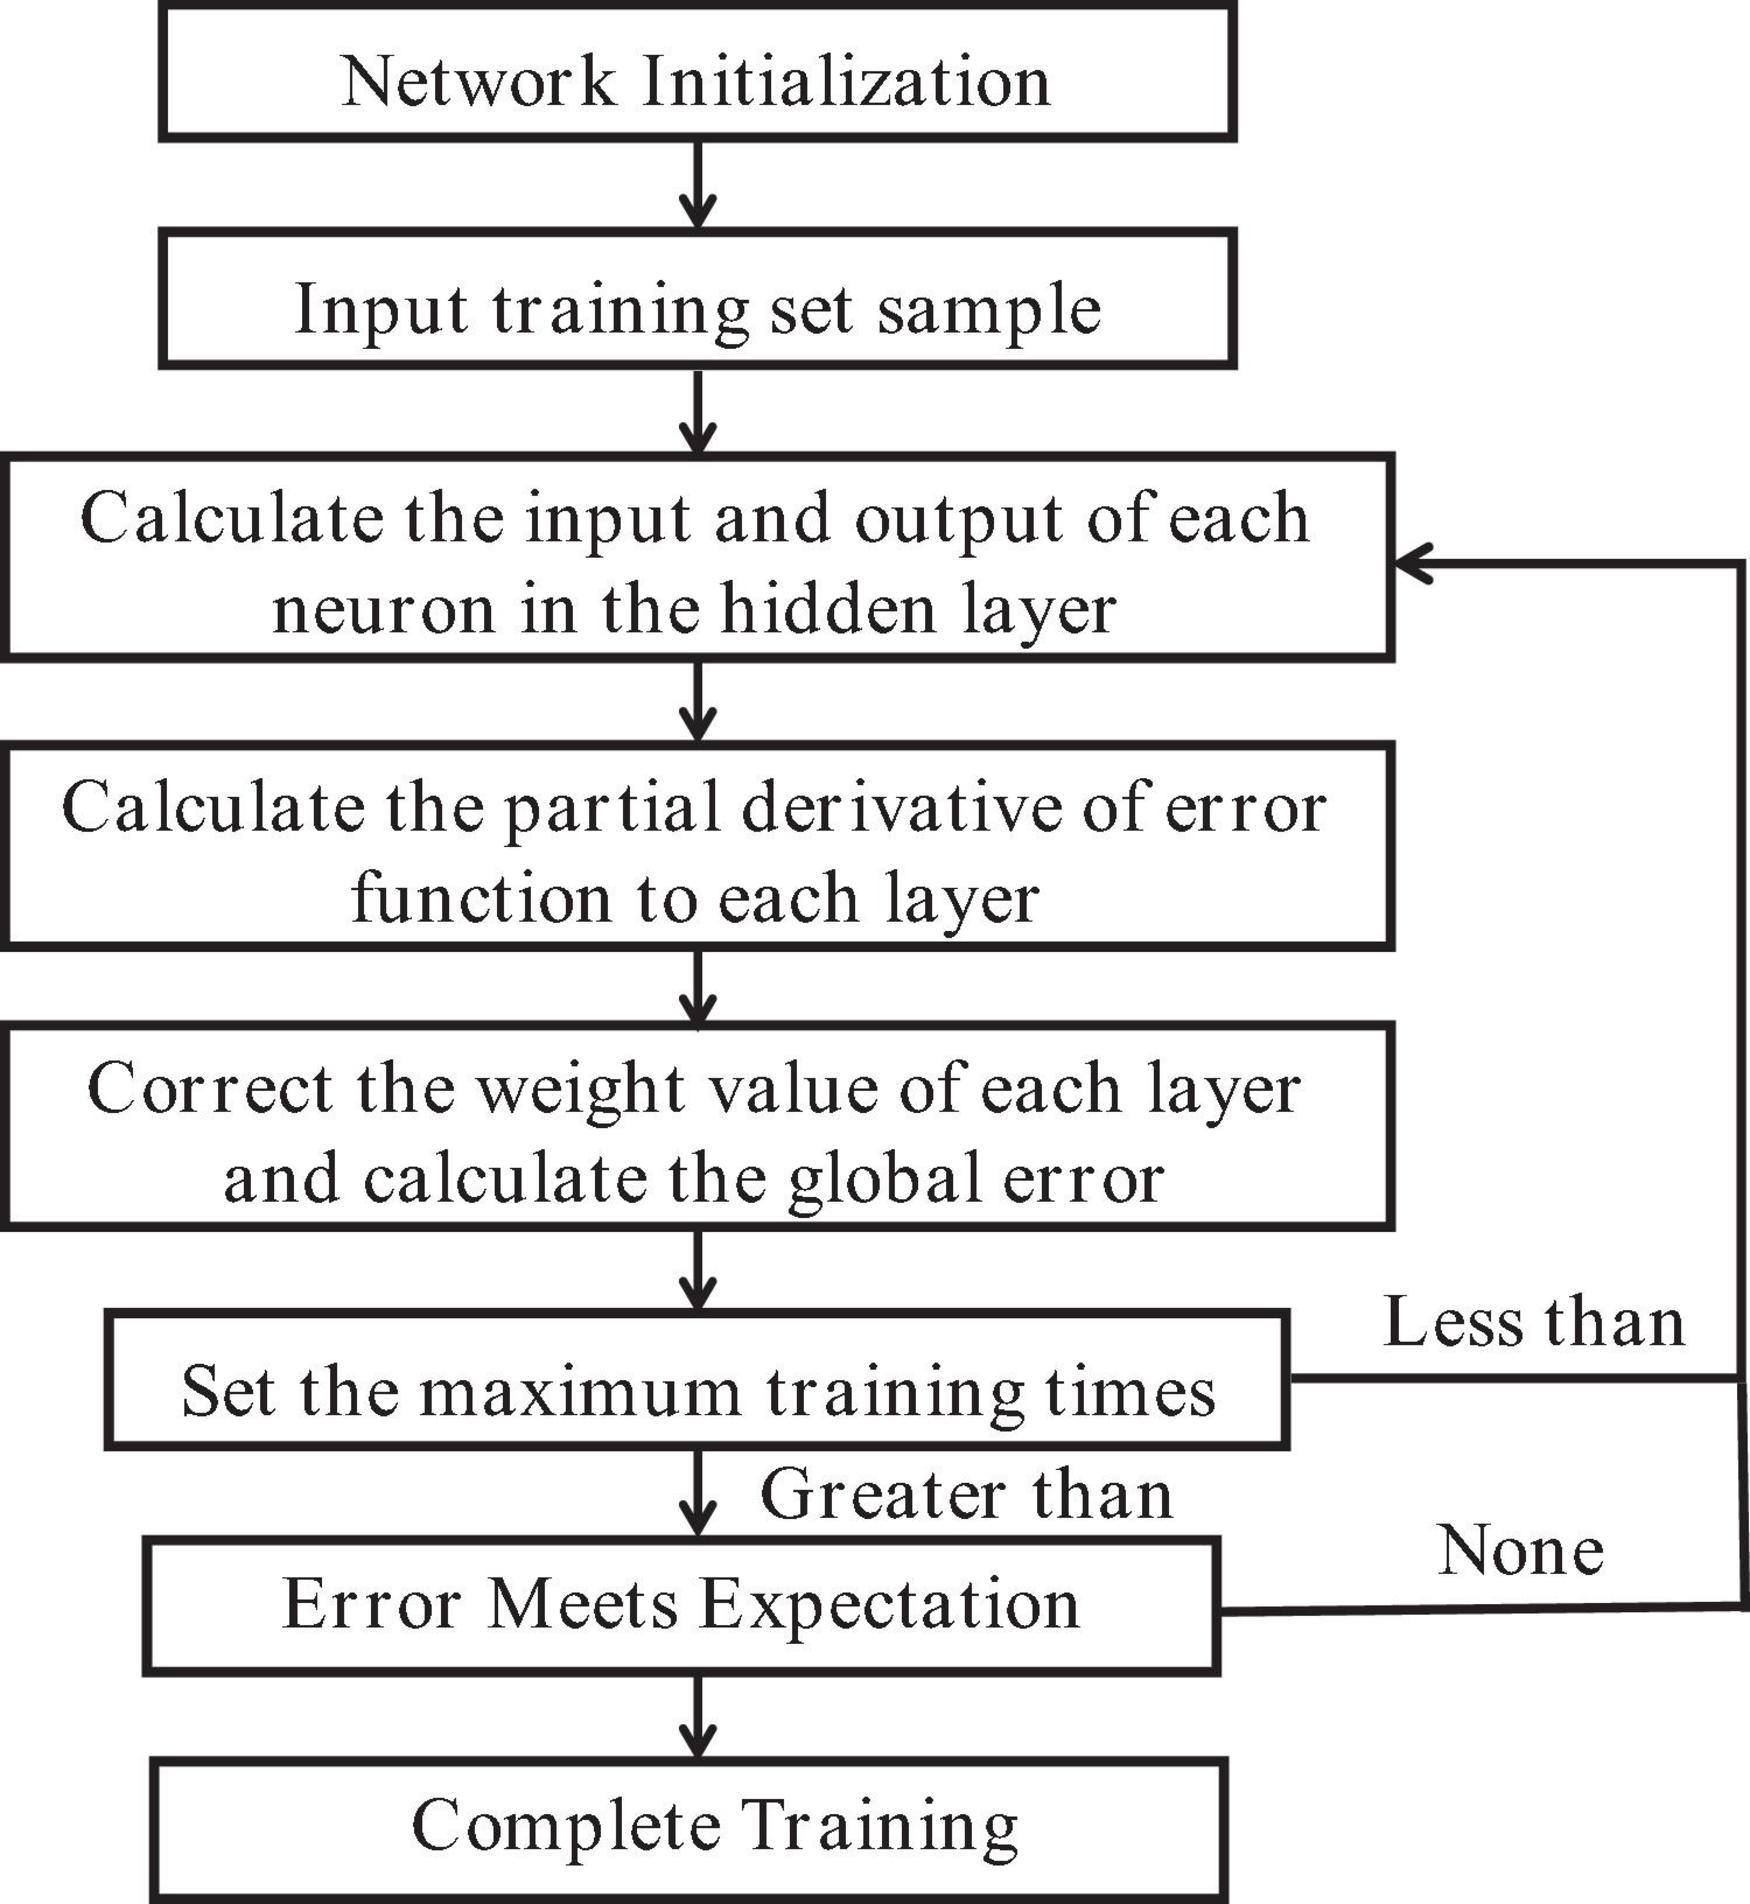
Figure 2. BP neural network model algorithm flow chart.
In this study, the state transition algorithm (STA) is used to improve the BP neural network model (Figure 3), which can integrate local search, global search, and heuristic search into an intelligent global optimization algorithm (Gu et al., 2021; Zou et al., 2022). A statistical approach was used to select the STA parameters, and then a quadratic difference technique was used to enhance their local exploitation and improve the solution accuracy (Hu et al., 2023). The state transfer algorithm uses an alternating rotation mechanism to adapt to different structural type optimization problems, i.e., rotation, telescoping transformation, and axial search are performed alternately, which has the advantage of avoiding wasting too much time on local search when the global optimal solution domain is not reached, thus increasing the activity of the search process.
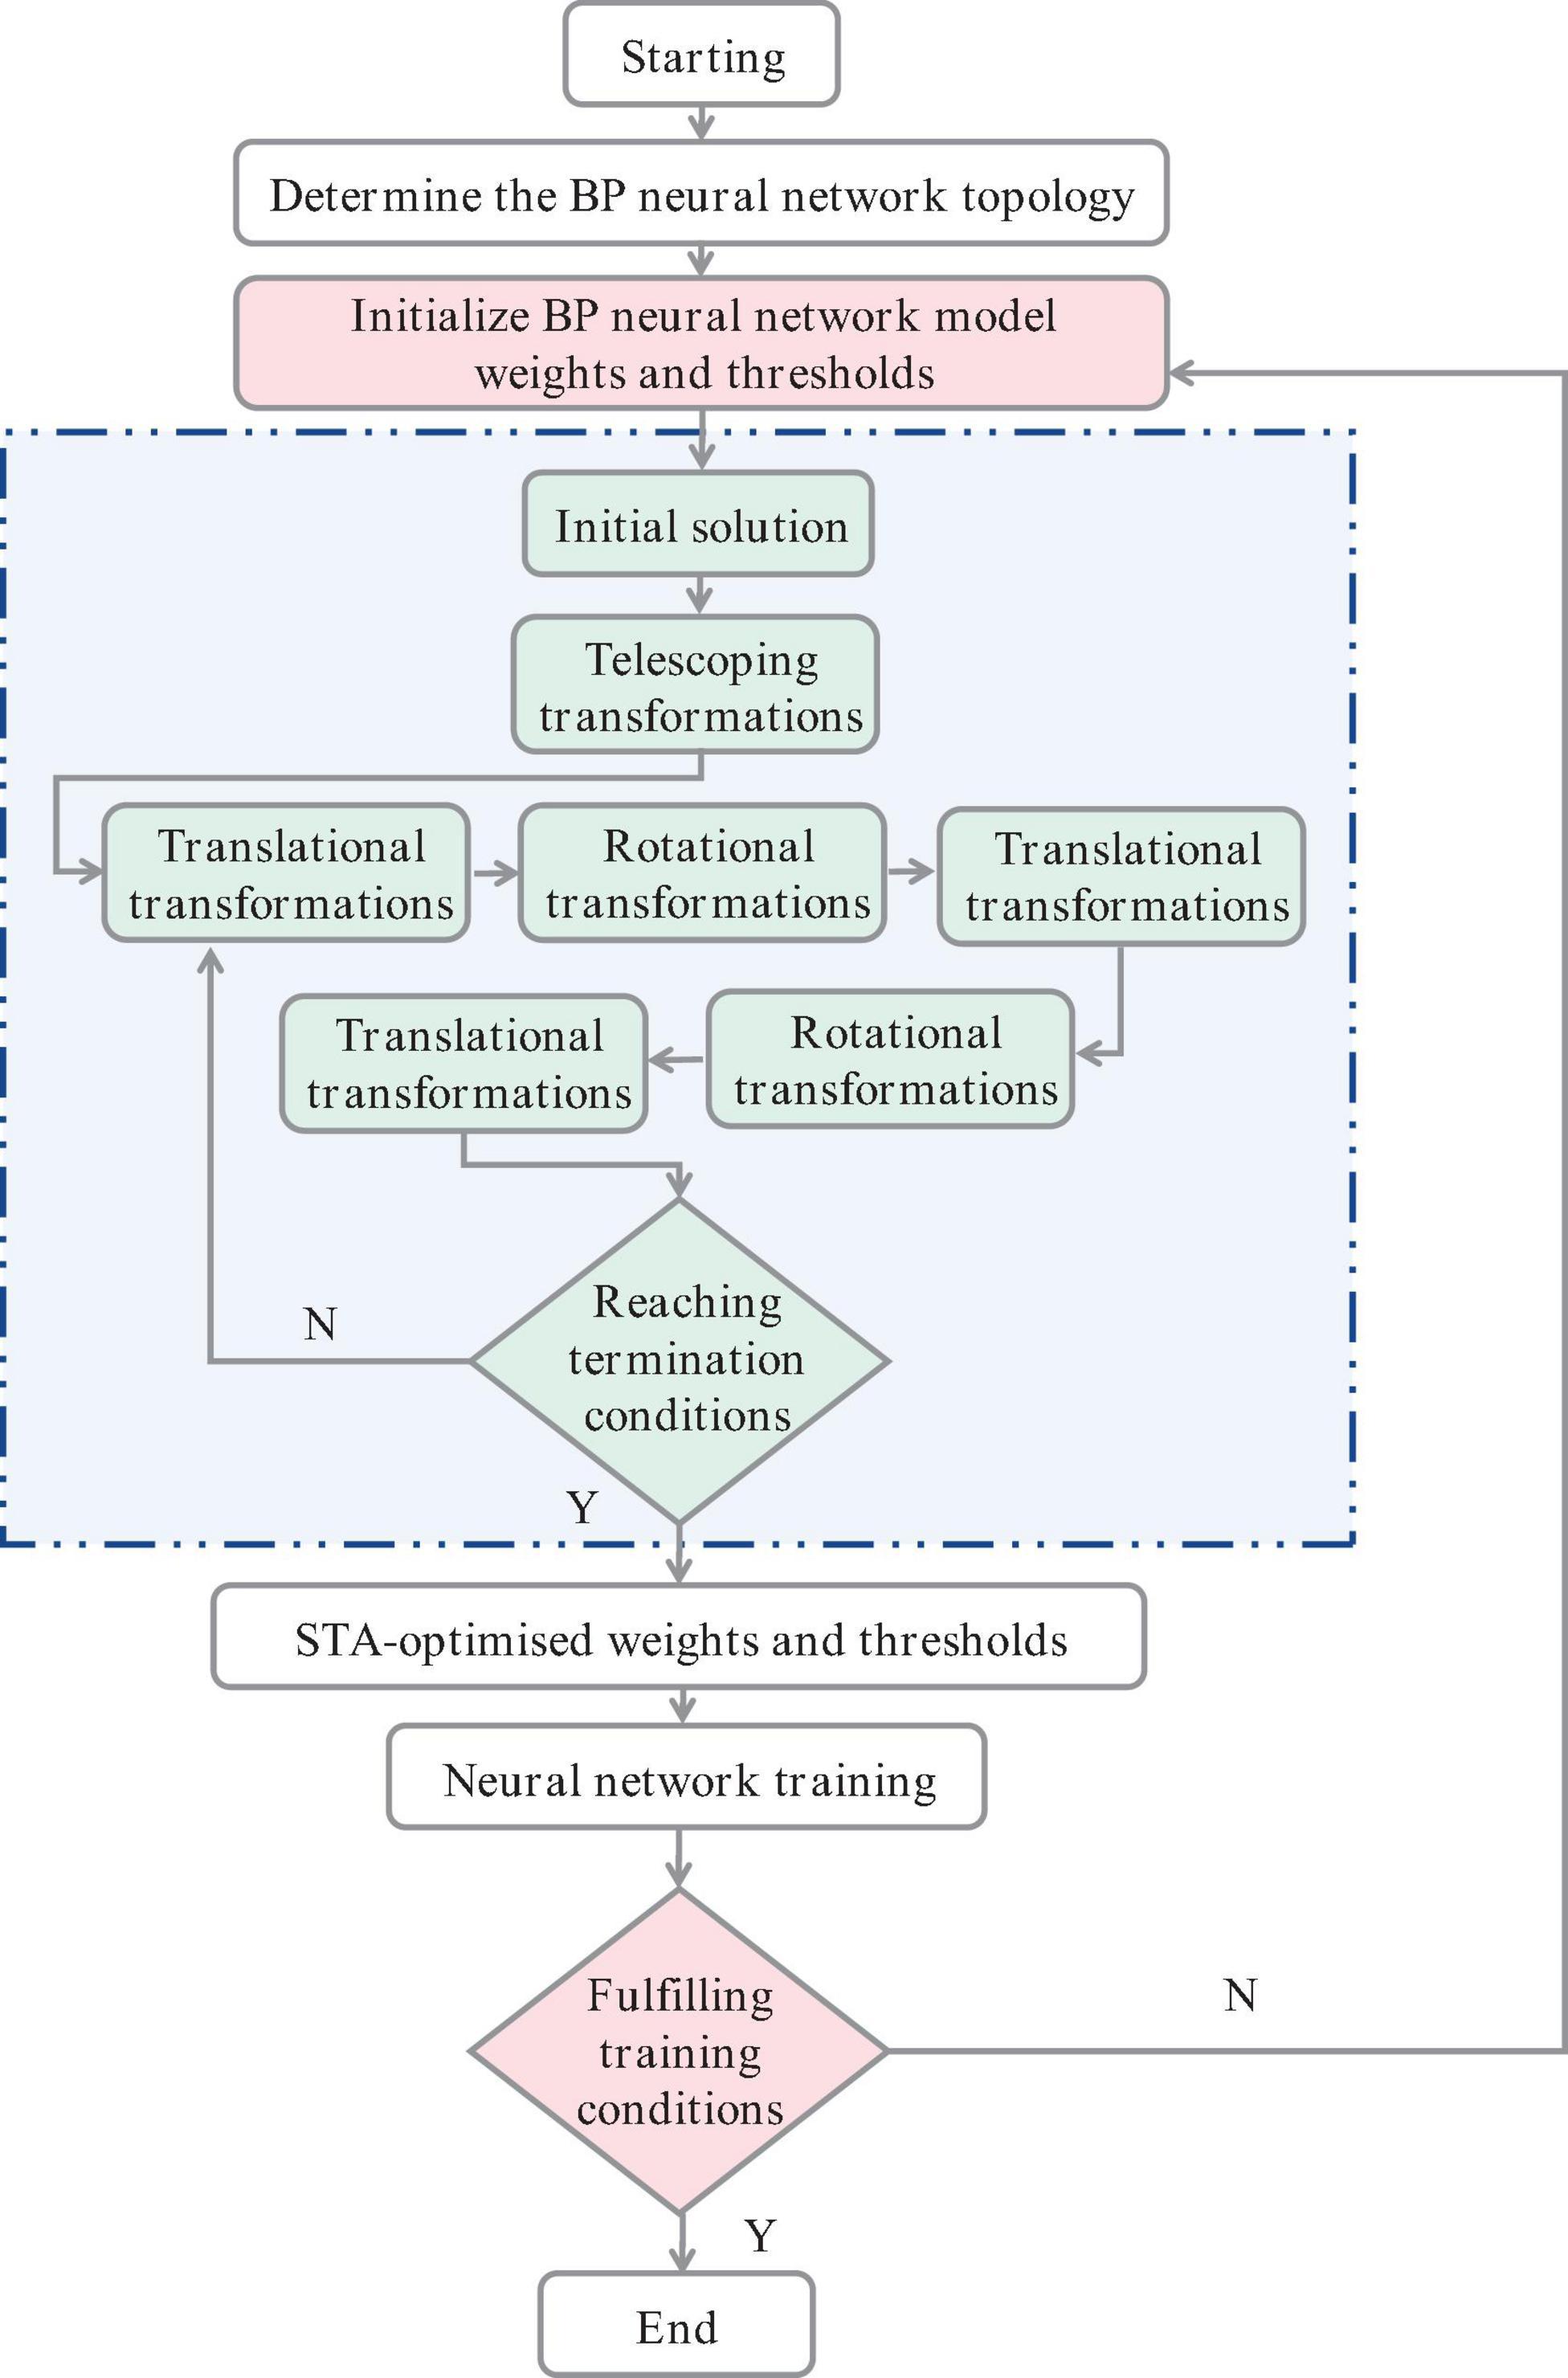
Figure 3. Flow chart of improved STA-BP neural network.
Table 2 shows the statistical analysis of chlorophyll content in P. koraiensis Nakai needles of different ages, which were used for both modeling and validation in this study. The range of chlorophyll content for the annual needle set was 0.245–0.960 mg/g, with a coefficient of variation of 27.2%. For the biennial needle set, the chlorophyll content range was 0.283–1.219 mg/g, with a coefficient of variation of 26.8%. The triennial needle set showed a chlorophyll content range of 0.343–1.231 mg/g and a coefficient of variation of 25.4%. The mixed conifer model set showed a chlorophyll content variation interval of 0.290–1.137 mg/g, and a coefficient of variation at 38%. The sequence of chlorophyll content in P. koraiensis Nakai leaves of different ages followed the order: triennial > biennial > annual. The dispersion of the standard deviation and coefficient of variation data indicated a well-represented sample.
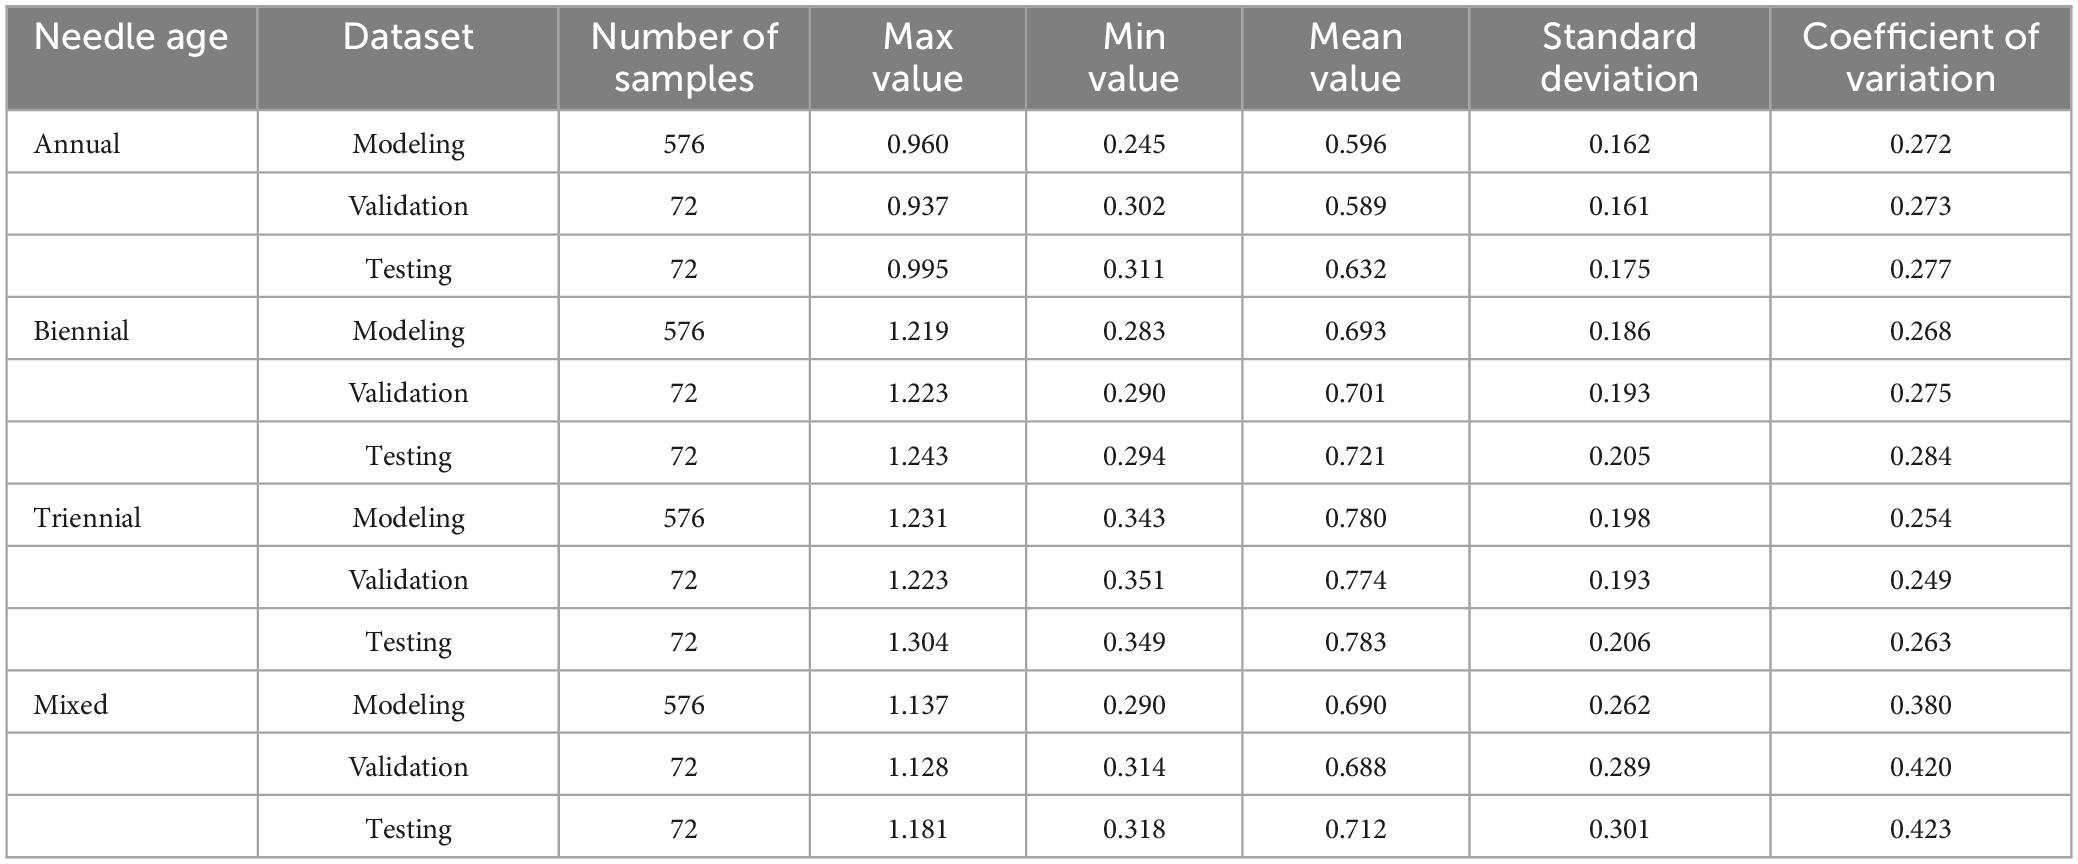
Table 2. Statistics of chlorophyll content in needle leaves of Picea koraiensis Nakai at different ages.
The spectral data collected by a hyperspectral camera from P. koraiensis Nakai needles of different ages, although influenced by factors such as noisy environment, light scattering, and diffuse reflectance, showed similar trends in spectral reflectance changes. These trends were observed in the raw spectrum without preprocessing (Raw), standard normal variable (SNV), and MSC (Figure 4). The visible band showed “blue valley” and “green peak” phenomena near 500 and 560 nm, respectively. A significant increase in spectral reflectance was observed from 680 to 760 nm, showing “red valley” and “red edge” phenomena near 680 and 760 nm, respectively. Raw spectral reflectance values for annual needles exceeded those of biennial and triennial needles in the 513–616 and 720–988 nm bands (p < 0.05). Systematic errors can be eliminated by differential processing of the original spectra (Figures 4B–D) and form extreme points around 711 and 690 nm. However, the reflectance of the FD and SD spectra of annual needles near 690 nm was still significantly higher than that of biennial and triennial needles (p < 0.05).

Figure 4. Pretreatment curves of needle spectra from different ages of P. koraiensis Nakai. (A) Raw, (B) FD, (C) SD, (D) SNV, and (E) MSC.
Figure 5 shows the correlation analysis between the optimized spectral vegetation index and the chlorophyll content in needles of different ages. A remarkable positive correlation is observed between the chlorophyll content and the spectral vegetation indices VOG1 and BGI1 (with correlation coefficients R = 0.63 and 0.74, respectively) in the case of annual needles (Figure 5A). Conversely, the spectral vegetation index Ctr2 shows a significant negative correlation (correlation coefficient R = −0.77). In the context of biennial (Figure 5B) and triennial needles (Figure 5C), the chlorophyll content shows significant positive correlations with the spectral vegetation indices Ctr1 (R = 0.59, 0.63), Ctr2 (R = 0.79, 0.71), VOG2 (R = 0.61, 0.83), and VOG3 (R = 0.62, 0.82). However, there is a significant negative correlation with the spectral vegetation indices VOG1 (R = −0.69, −0.78), BGI1 (R = −0.53, −0.79) and BRI2 (R = −0.60, −0.77) (p < 0.01). For mixed needles (Figure 5D), the correlation coefficient between chlorophyll content and the spectral vegetation index VOG1 is 0.55, while for the spectral vegetation index Ctr2 it is −0.67. Figure 5 shows an increasing correlation between chlorophyll content and each spectral vegetation index with increasing age of P. koraiensis Nakai. However, the correlation between chlorophyll content and the spectral index of mixed needles is the lowest. A more nuanced classification of plant leaves could improve the correlation between chlorophyll content and spectral vegetation index.
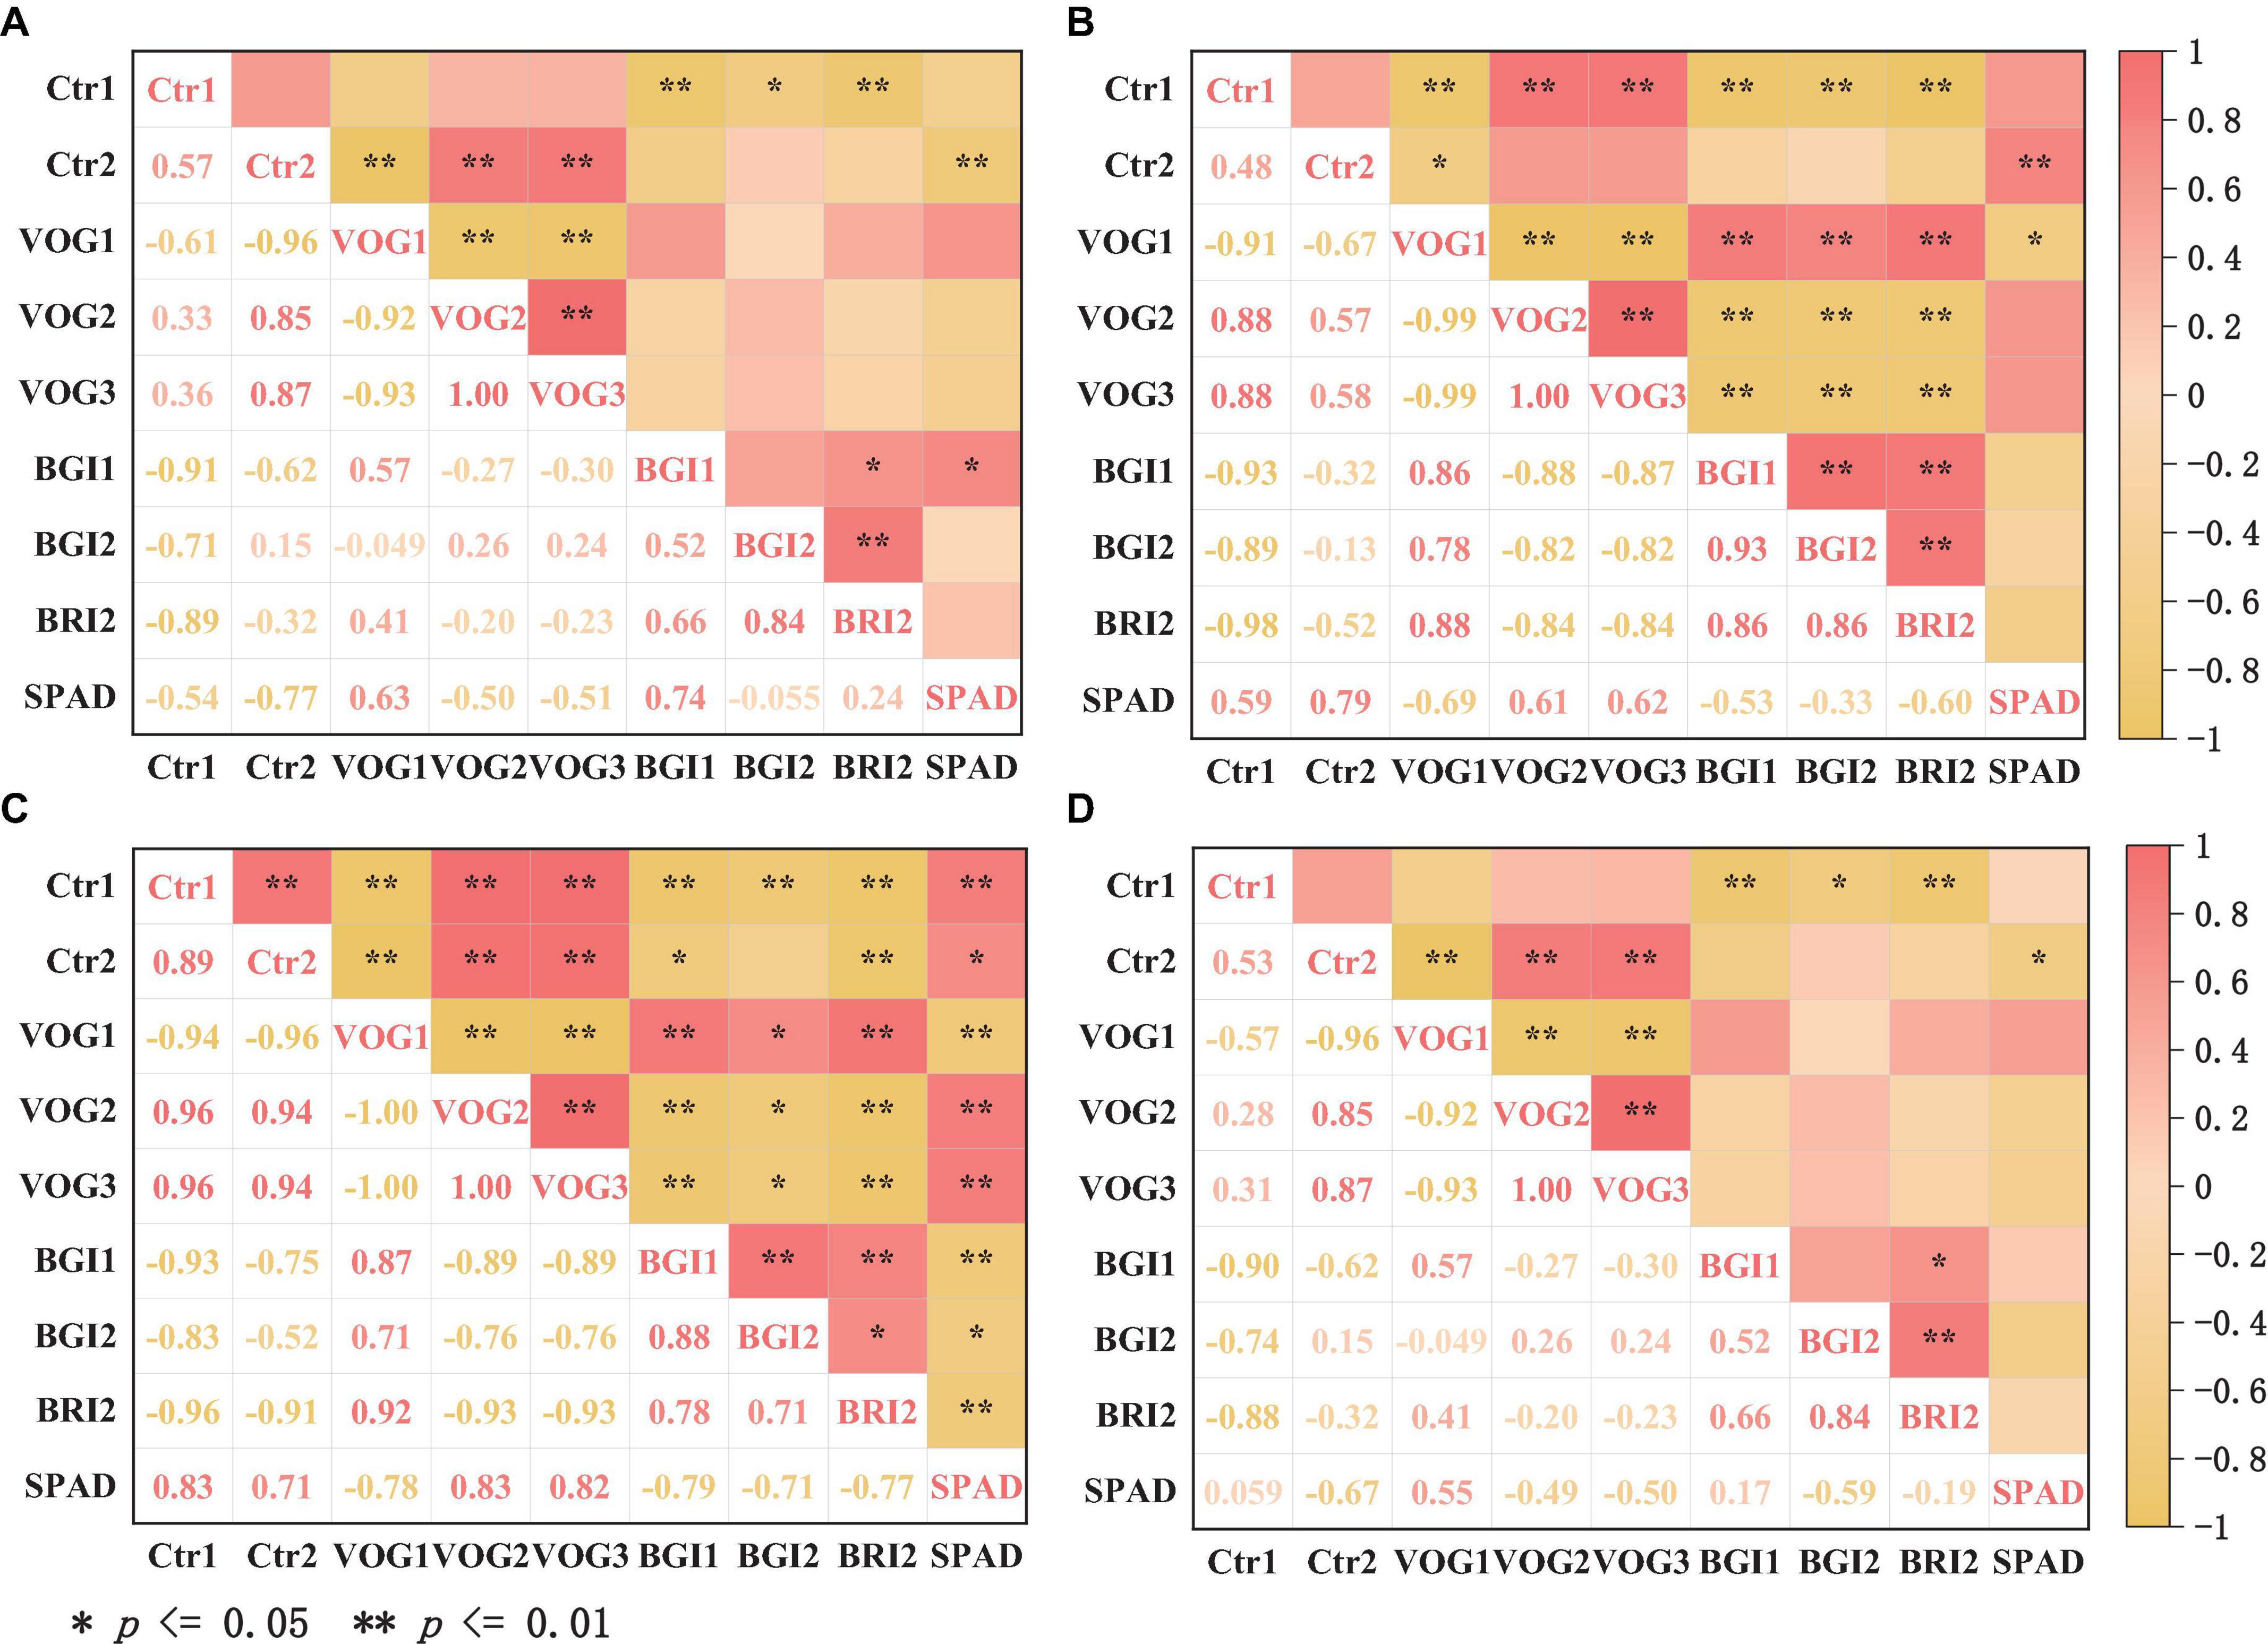
Figure 5. Correlation analysis of optimized spectral index with chlorophyll content of annual needles (A), biennial needles (B), triennial needles (C), and mixed needles (D).
Figure 6 shows the correlation between the spectral reflectance of the original spectra, four spectral pretreatments, and chlorophyll content in conifer leaves of different ages. A remarkable negative correlation is observed between the original spectral reflectance and the chlorophyll content in needles of different ages at the wavelengths 540–566 and 702–717 nm (p < 0.05). As shown in Figure 6B, the correlation coefficients between FD spectral reflectance and chlorophyll content in biennial needles at wavelengths of 563, 680, and 712 nm exceed those in annual, triennial, and mixed needles. The correlation coefficients between SD spectral reflectance and biennial needle chlorophyll content peak at wavelengths 672–684 and 708 nm, with R values of −0.64 and 0.65, respectively. The correlation coefficients between spectral reflectance treated with SNV and MSC and chlorophyll content of needles of different ages remain consistent in the 413–780 nm band. In the 420–620 and 690–720 nm bands, the correlation coefficients between spectral reflectance and chlorophyll content of biennial needles significantly exceed those of annual, triennial, and mixed needles. However, the correlation coefficients between spectral reflectance and chlorophyll content of needles of different ages after different spectral pretreatments are significantly lower than those of the optimized vegetation index and chlorophyll content of needles of different ages.
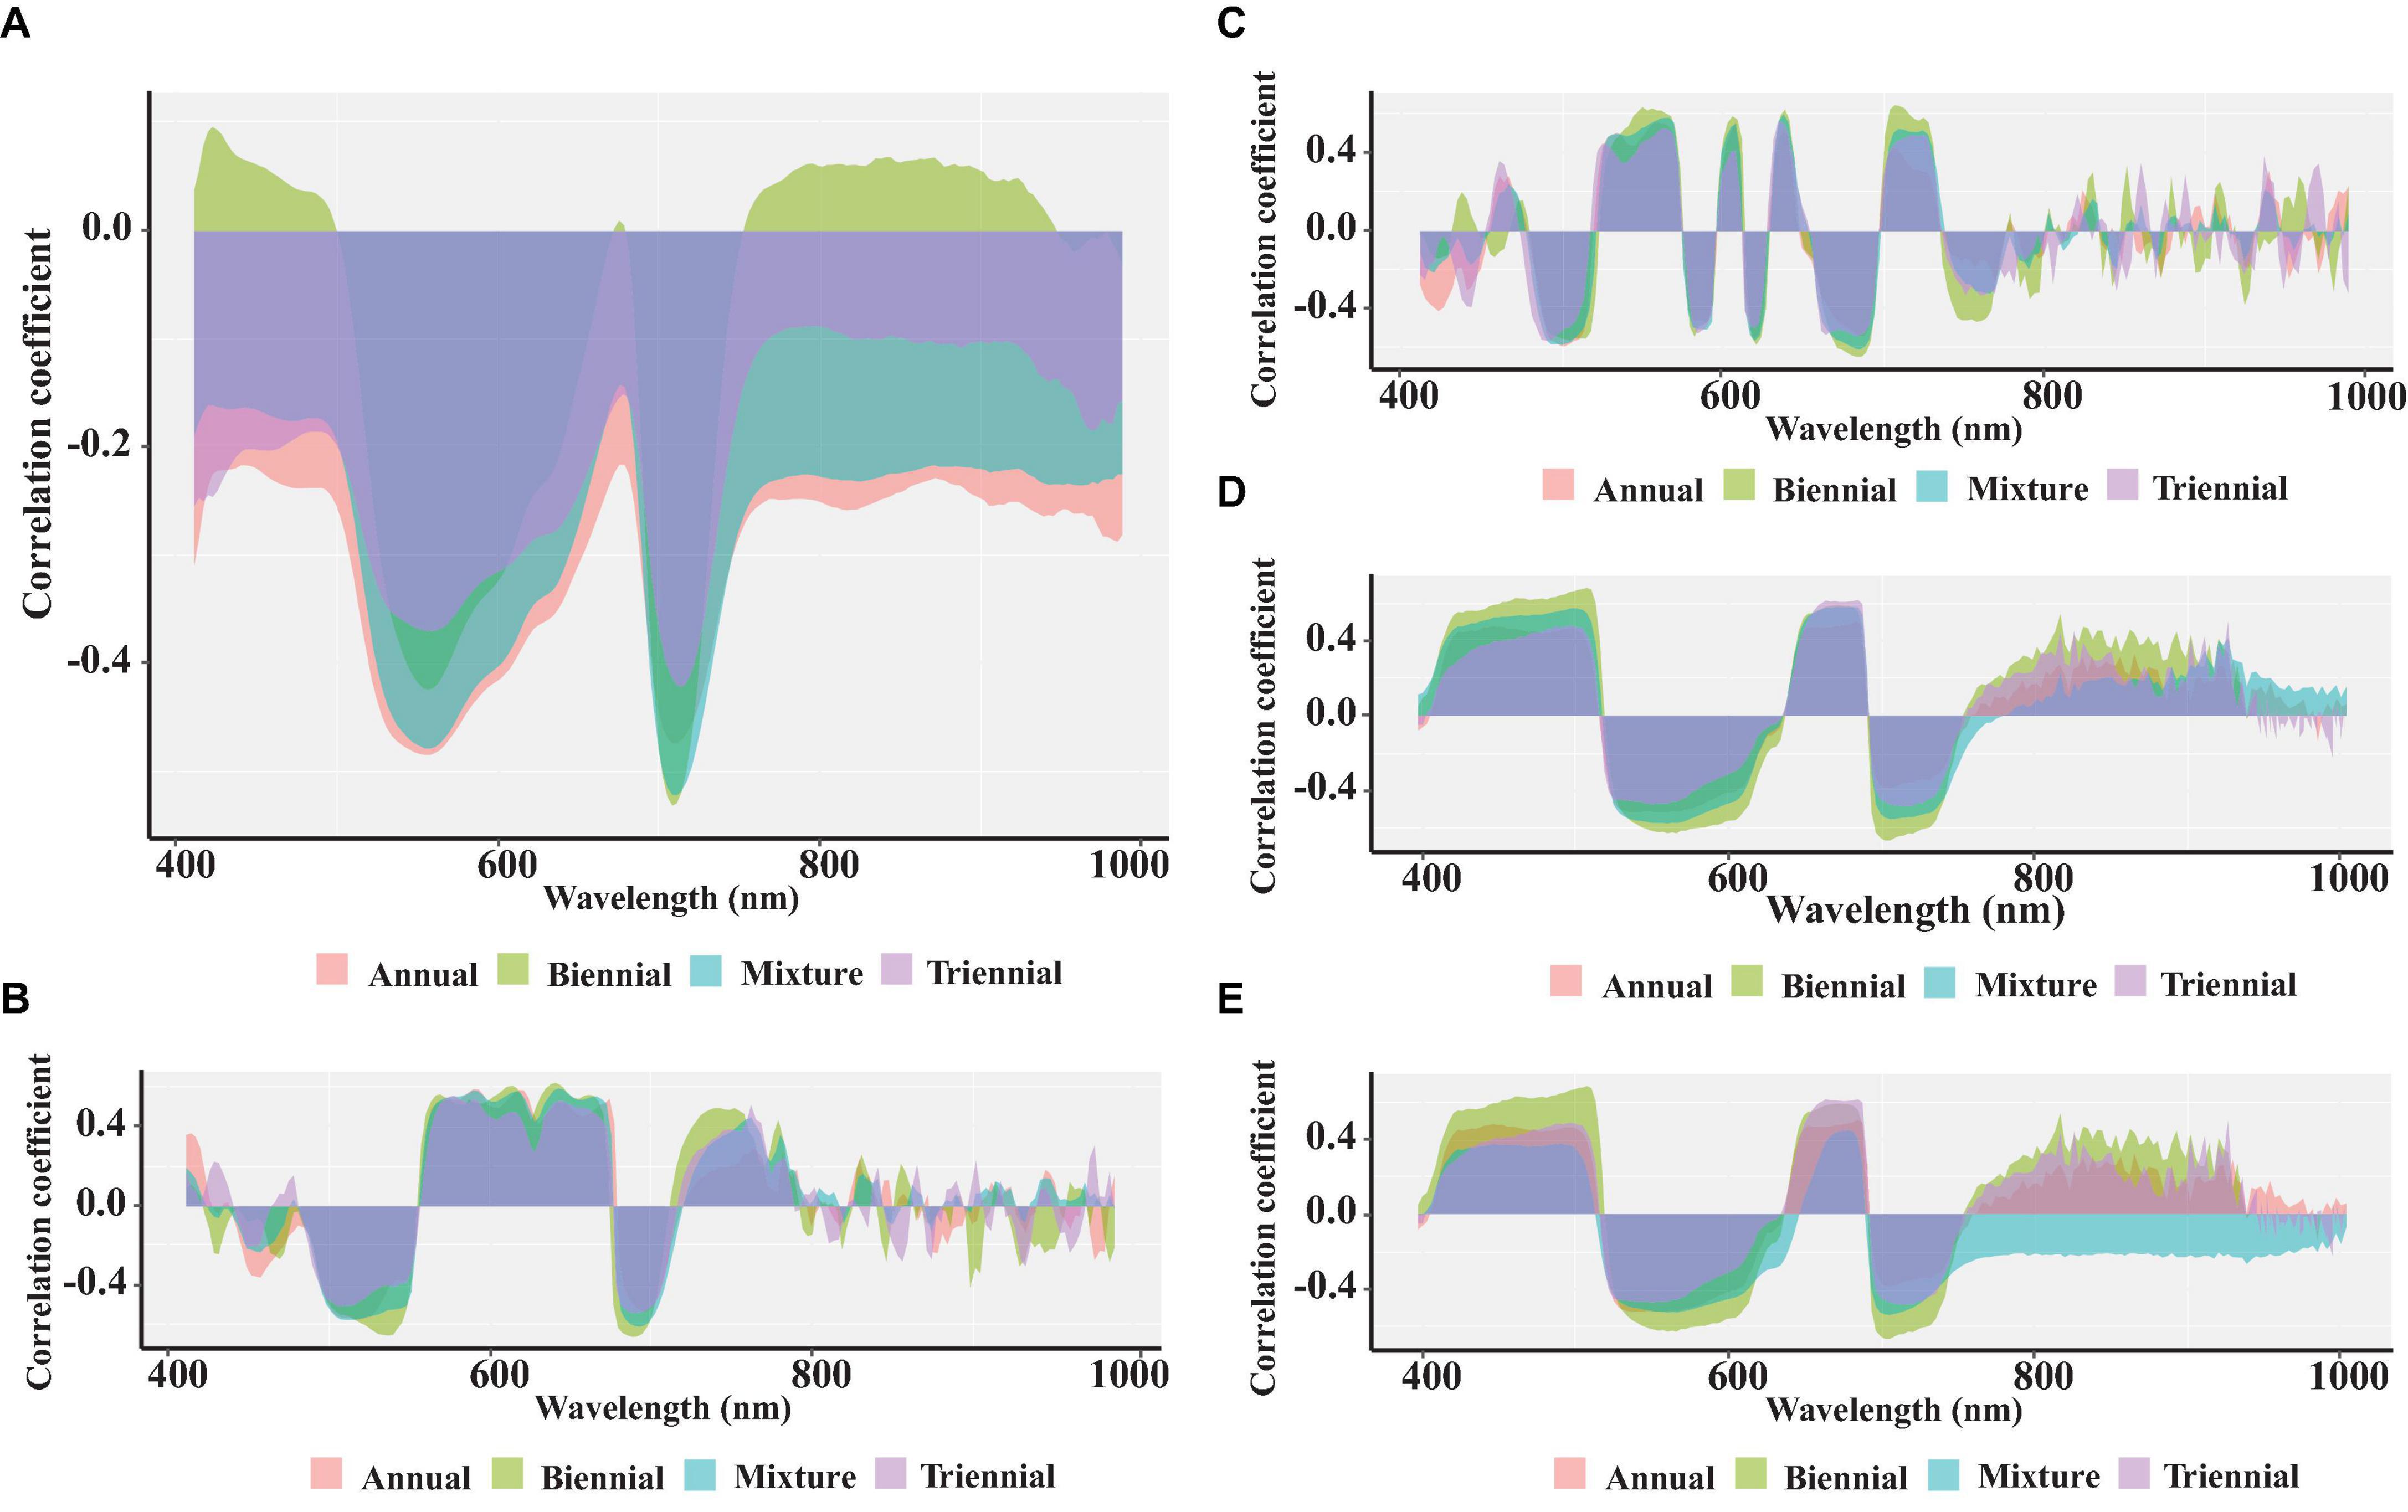
Figure 6. Correlation analysis of spectral reflectance between Raw (A), FD (B), SD (C), SNV (D), and MSC (E), and chlorophyll content of needles at different ages.
The original spectra of needles of different ages and the spectral reflectance (with chlorophyll correlation greater than ±0.5) and spectral vegetation index (with chlorophyll correlation greater than ±0. 6) of the four spectral pretreatments were substituted into the traditional algorithm PLS model, the improved Stacking-PLS model for chlorophyll of needles of different ages, respectively, and the optimal PLS and Stacking-PLS models were determined by the cross-validation method (RMSEcv) for annual needles (NcompPLS = 5, NcompStacking-PLS = 3), biennial needles (NcompPLS = 5, NcompStacking-PLS = 2), triennial needles (NcompPLS = 5, NcompStacking-PLS = 2), mixed needles (NcompPLS = 6, NcompStacking-PLS = 3), and the optimal number of components (Ncomp) (Figure 7).
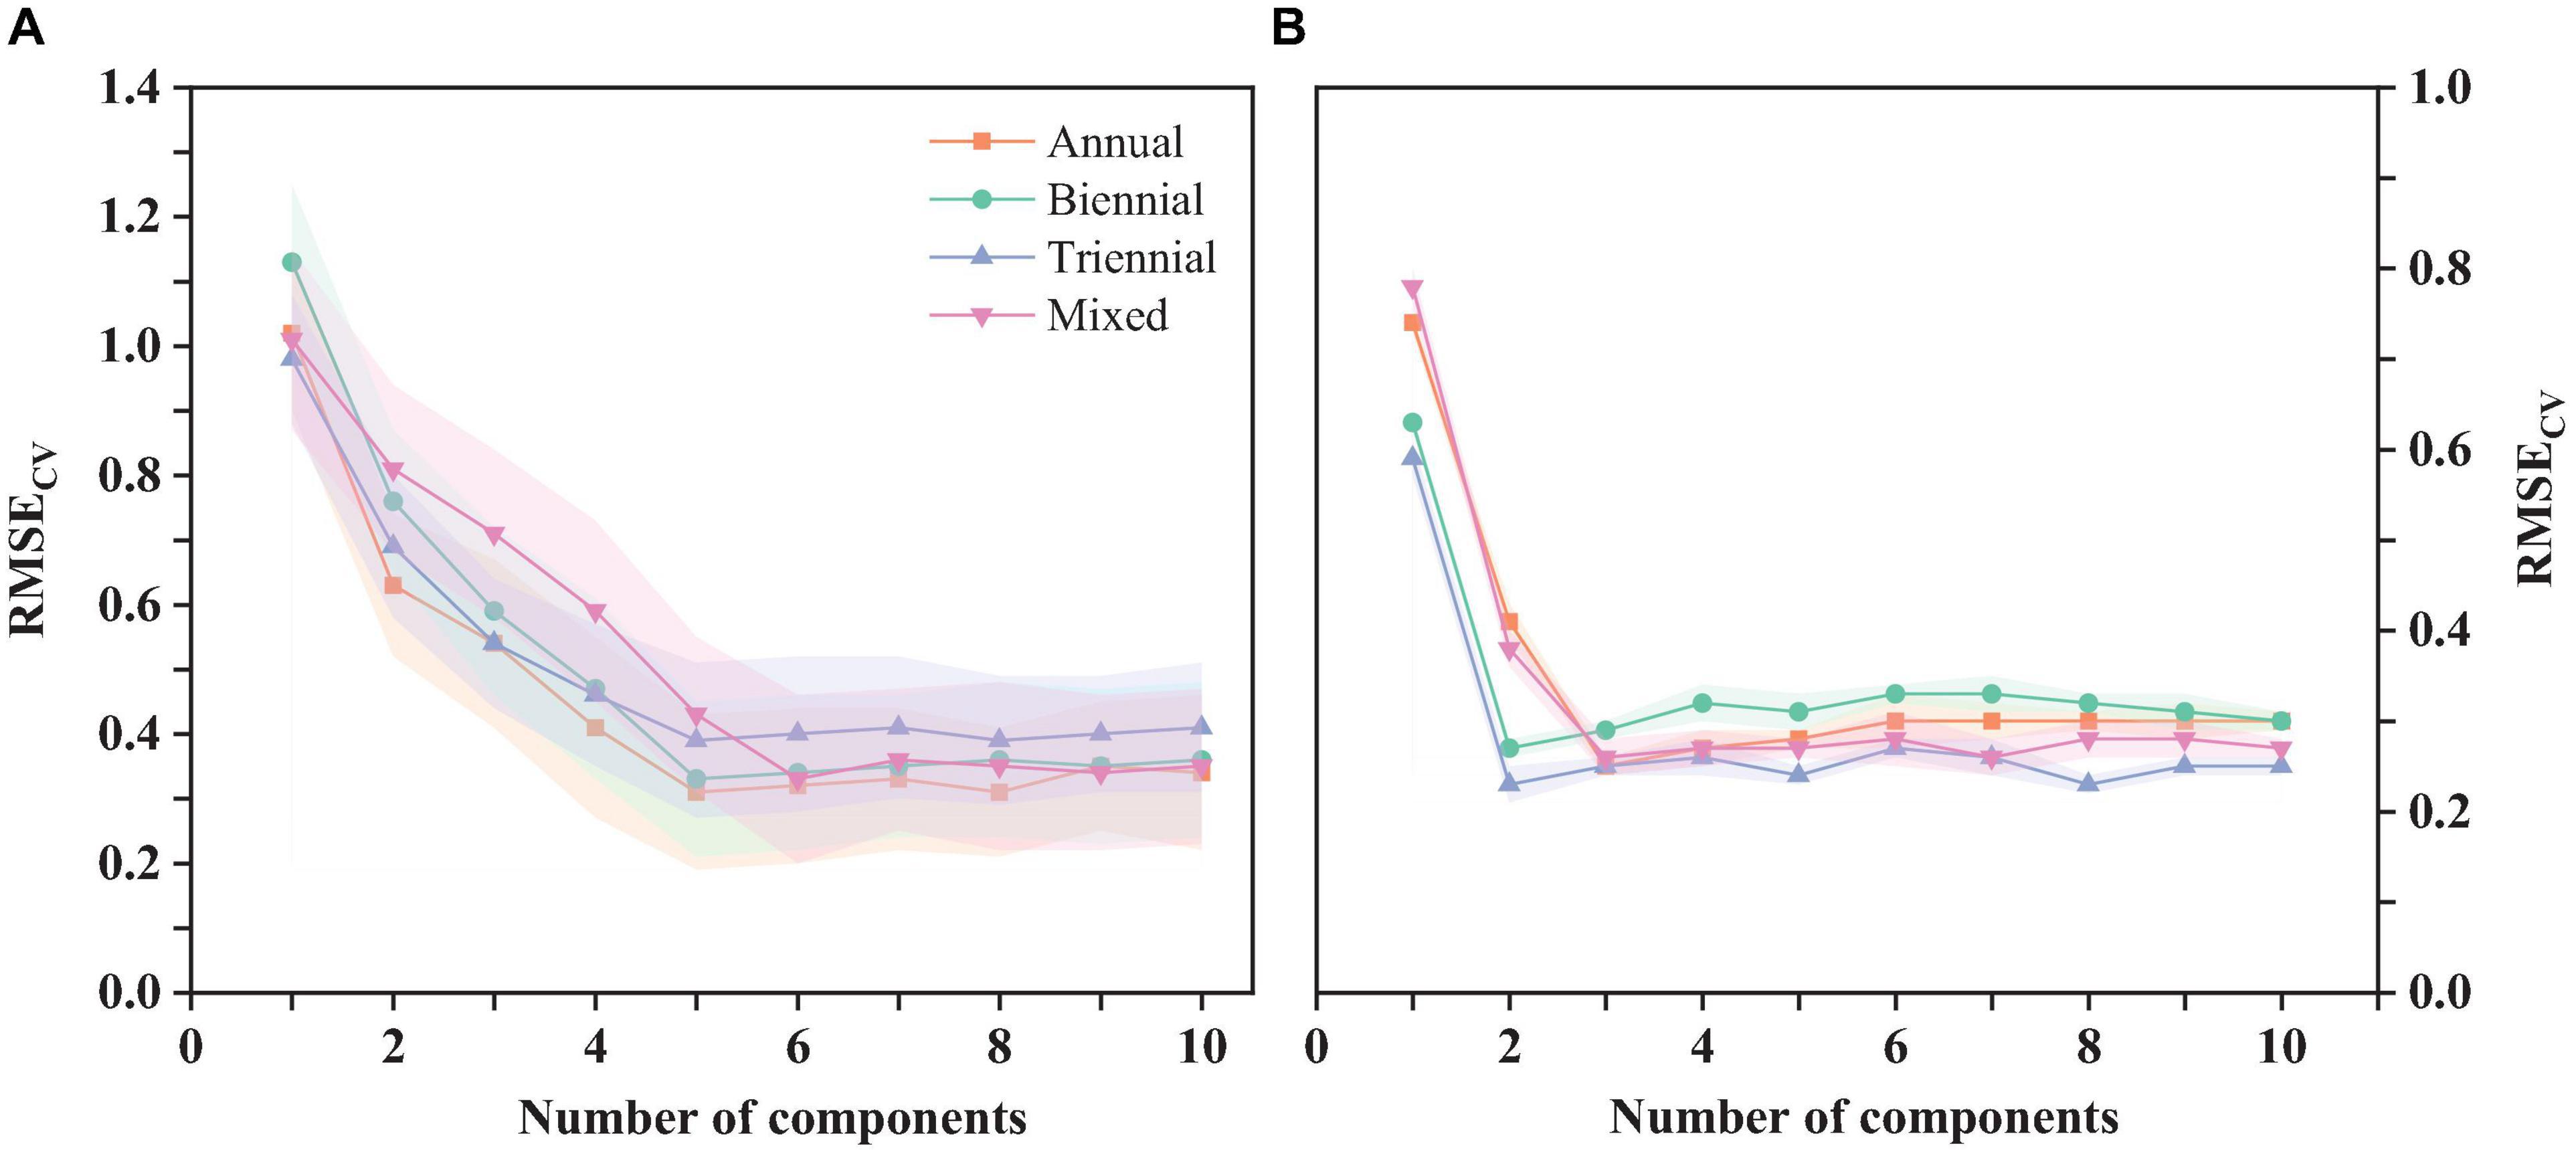
Figure 7. Evaluation of the predicted chlorophyll PLS model (A) and the Stacking-PLS (B) model for coniferous leaves of different ages using cross-validation (RMSEcv).
As shown in Figure 8, the fitting accuracy of the Stacking-PLS model is significantly better than that of the traditional PLS model, and the root mean square error (RMSE) is correspondingly lower. The fitting accuracy of the triennial needle model exceeds that of the biennial and annual needle models, regardless of whether the traditional PLS algorithm or the improved Stacking-PLS is used. The model fitted by mixed needles (traditional PLS algorithm R2 = 0.6, improved Stacking-PLS R2 = 0.67) generally falls below the model accuracy of annual needles (traditional PLS algorithm R2 = 0.69, improved Stacking-PLS R2 = 0.76), biennial needles (traditional PLS algorithm R2 = 0.71, improved Stacking-PLS R2 = 0.83), and triennial needles (traditional PLS algorithm R2 = 0.76, improved Stacking-PLS R2 = 0.85).
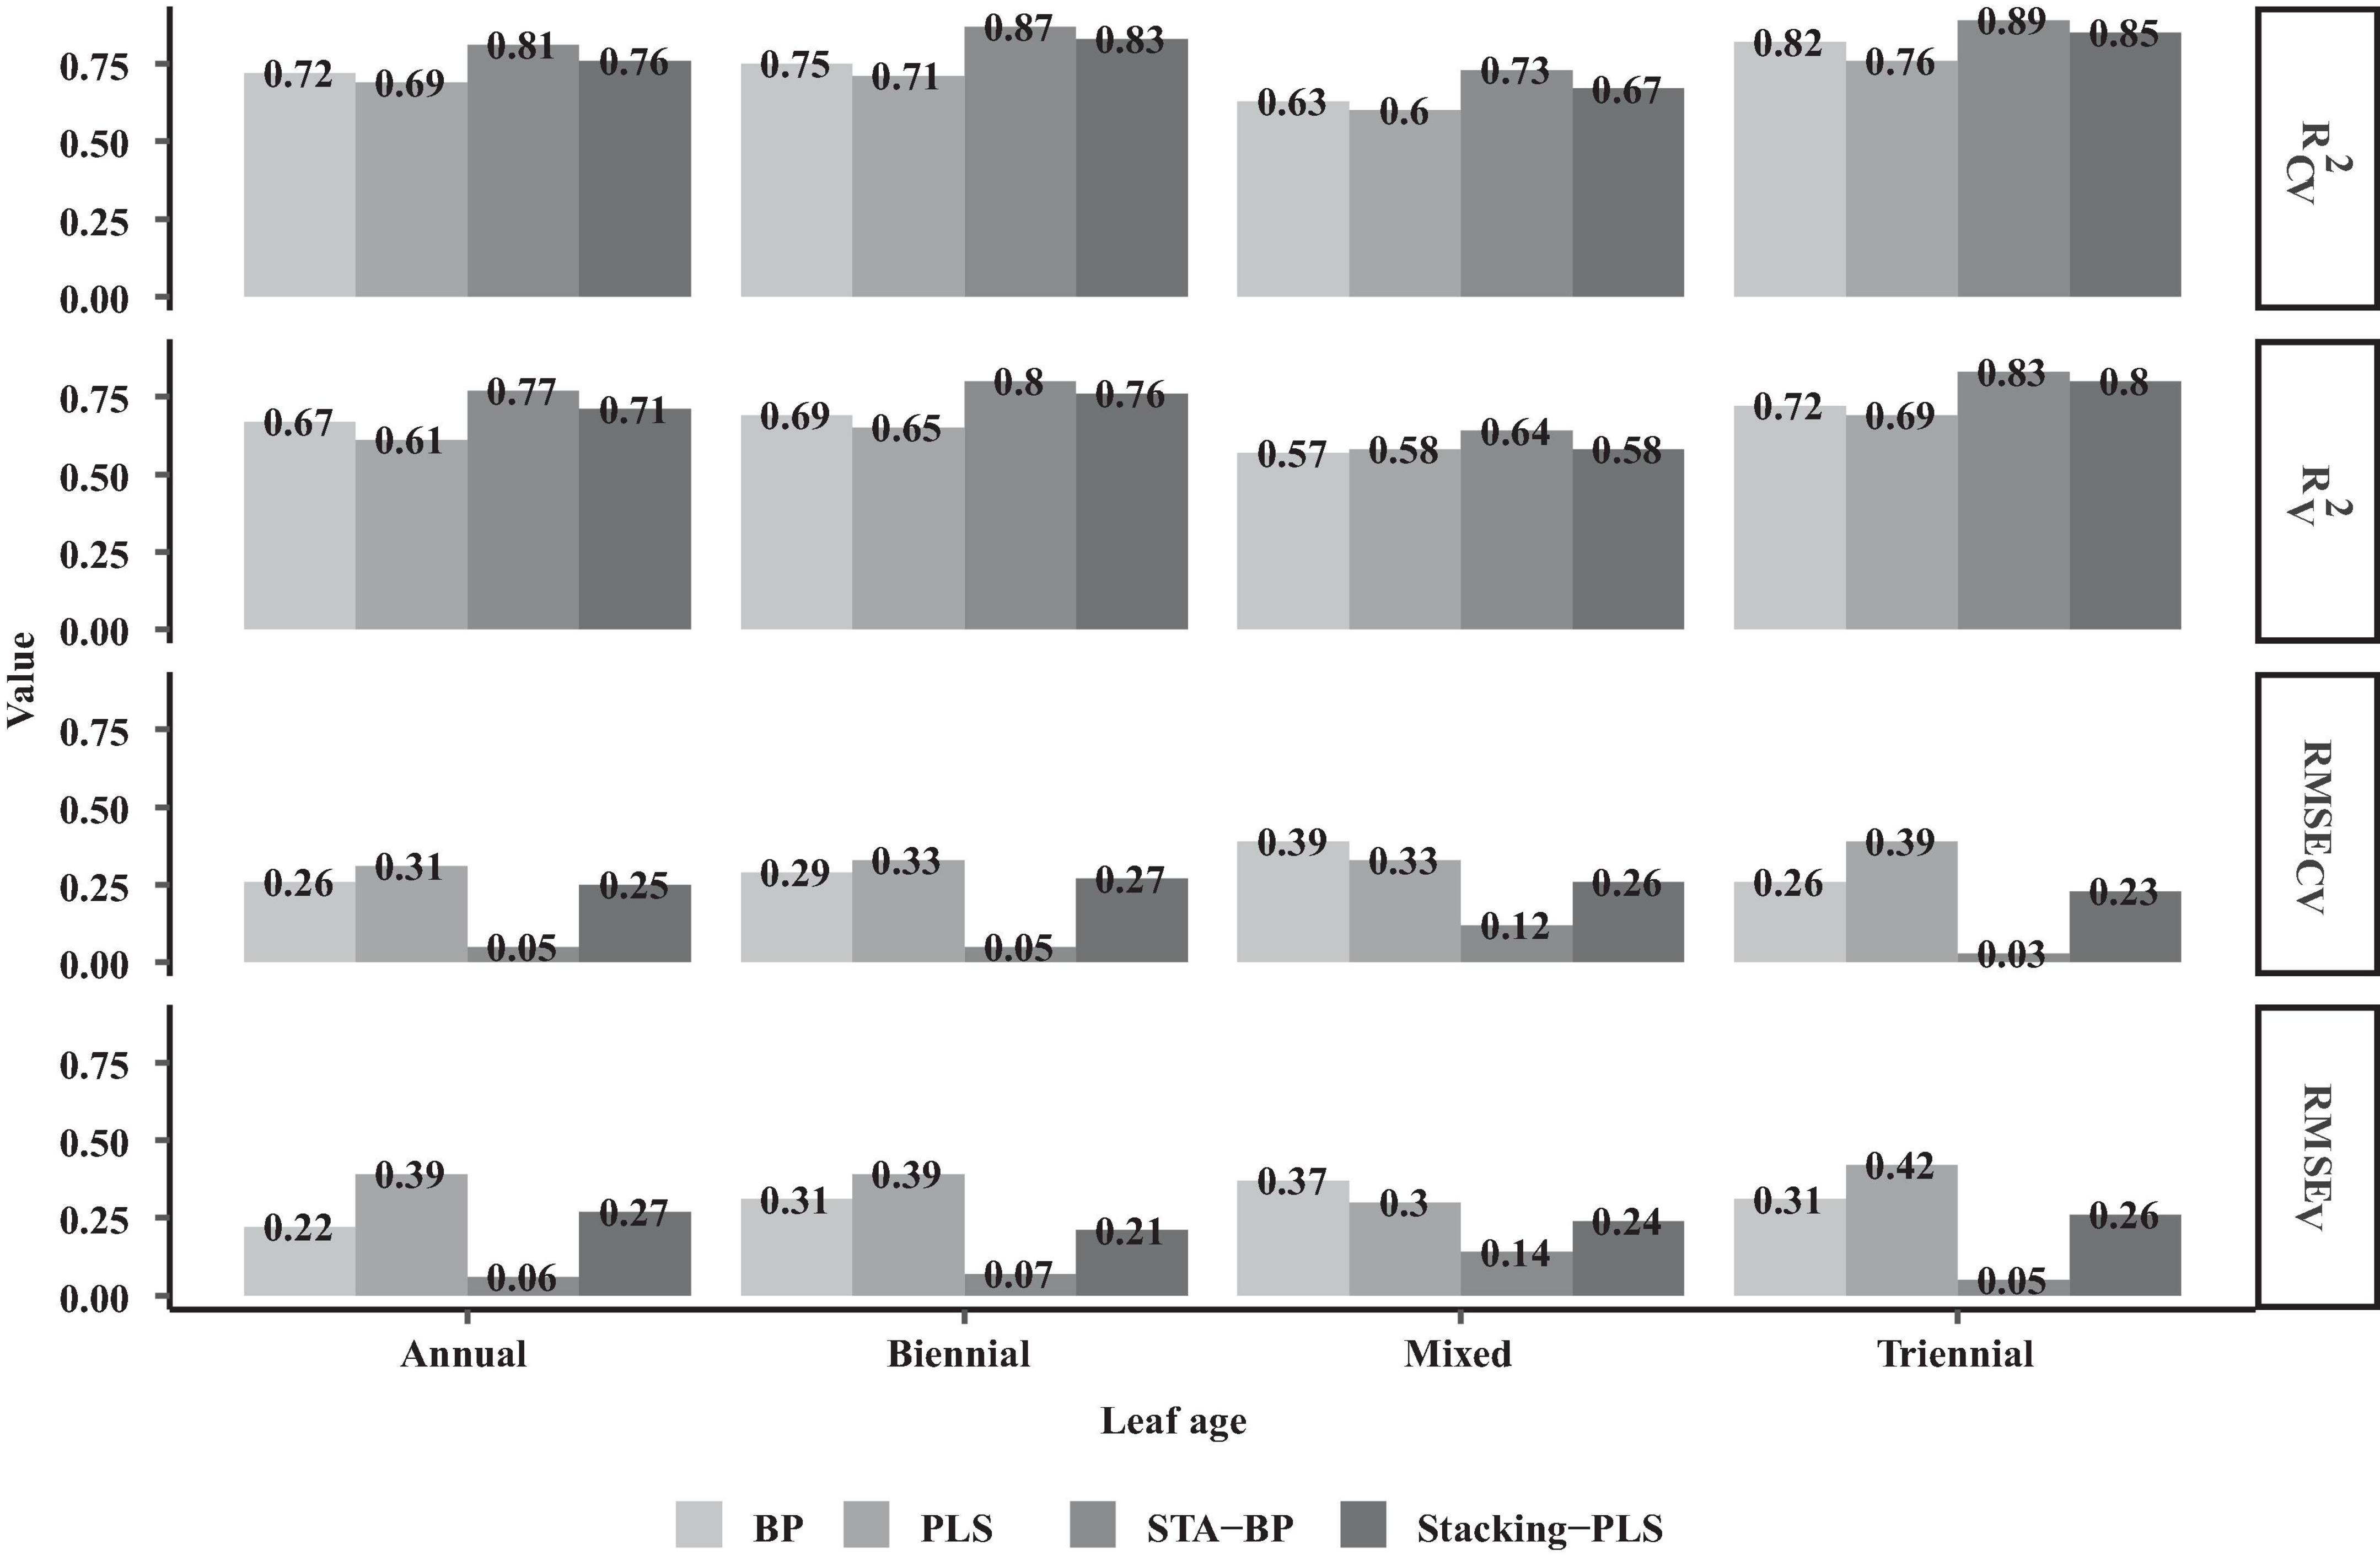
Figure 8. Model fitting and evaluation of needle chlorophyll BP, PLS, STA-BP, and Stacking-PLS at different ages.
As shown in Figure 8, the robustness of the traditional neural network model is lower than that of the STA-BP model. The chlorophyll models of different ages fitted by the STA-BP neural network show the following accuracy: 3-year chlorophyll model (R2 = 0.81) > 2-year chlorophyll model (R2 = 0.87) > annual chlorophyll model (R2 = 0.89) > mixed chlorophyll fitting model (R2 = 0.73). The accuracy of the STA-BP model exceeds that of the traditional BP neural network algorithm, the traditional PLS algorithm, and the stacking PLS model. Although the stacking integration idea is similar to the neural network fitting method, it still needs to be improved to the improved STA-BP neural network method. The mixed needle fitting model of chlorophyll STA-BP is significantly lower than the different age needle fitting model, while the refinement of classification fitting significantly improves the accuracy of the STA-BP neural network model. According to Figure 8, the models fitted by these four methods consistently show higher accuracy for biennial needles and annual needles, which is consistent with the spectral vegetation index and the correlation law of needle chlorophyll at different ages.
The STA-BP model was screened as the optimal model. To evaluate the stability and adaptability of the STA-BP model, R2 and RMSE were used as evaluation criteria to validate its predictive performance using the test set. The scatter plots of the fit of the measured and predicted values of needle chlorophyll content at different ages are shown in Figure 9. The results indicated that the STA-BP model had a better simulation effect with higher precision in predicting chlorophyll content in triennial needles (R2 = 0.7991) compared to biennial needles (R2 = 0.8176), annual needles (R2 = 0.8355), and mixed needles (R2 = 0.6615).
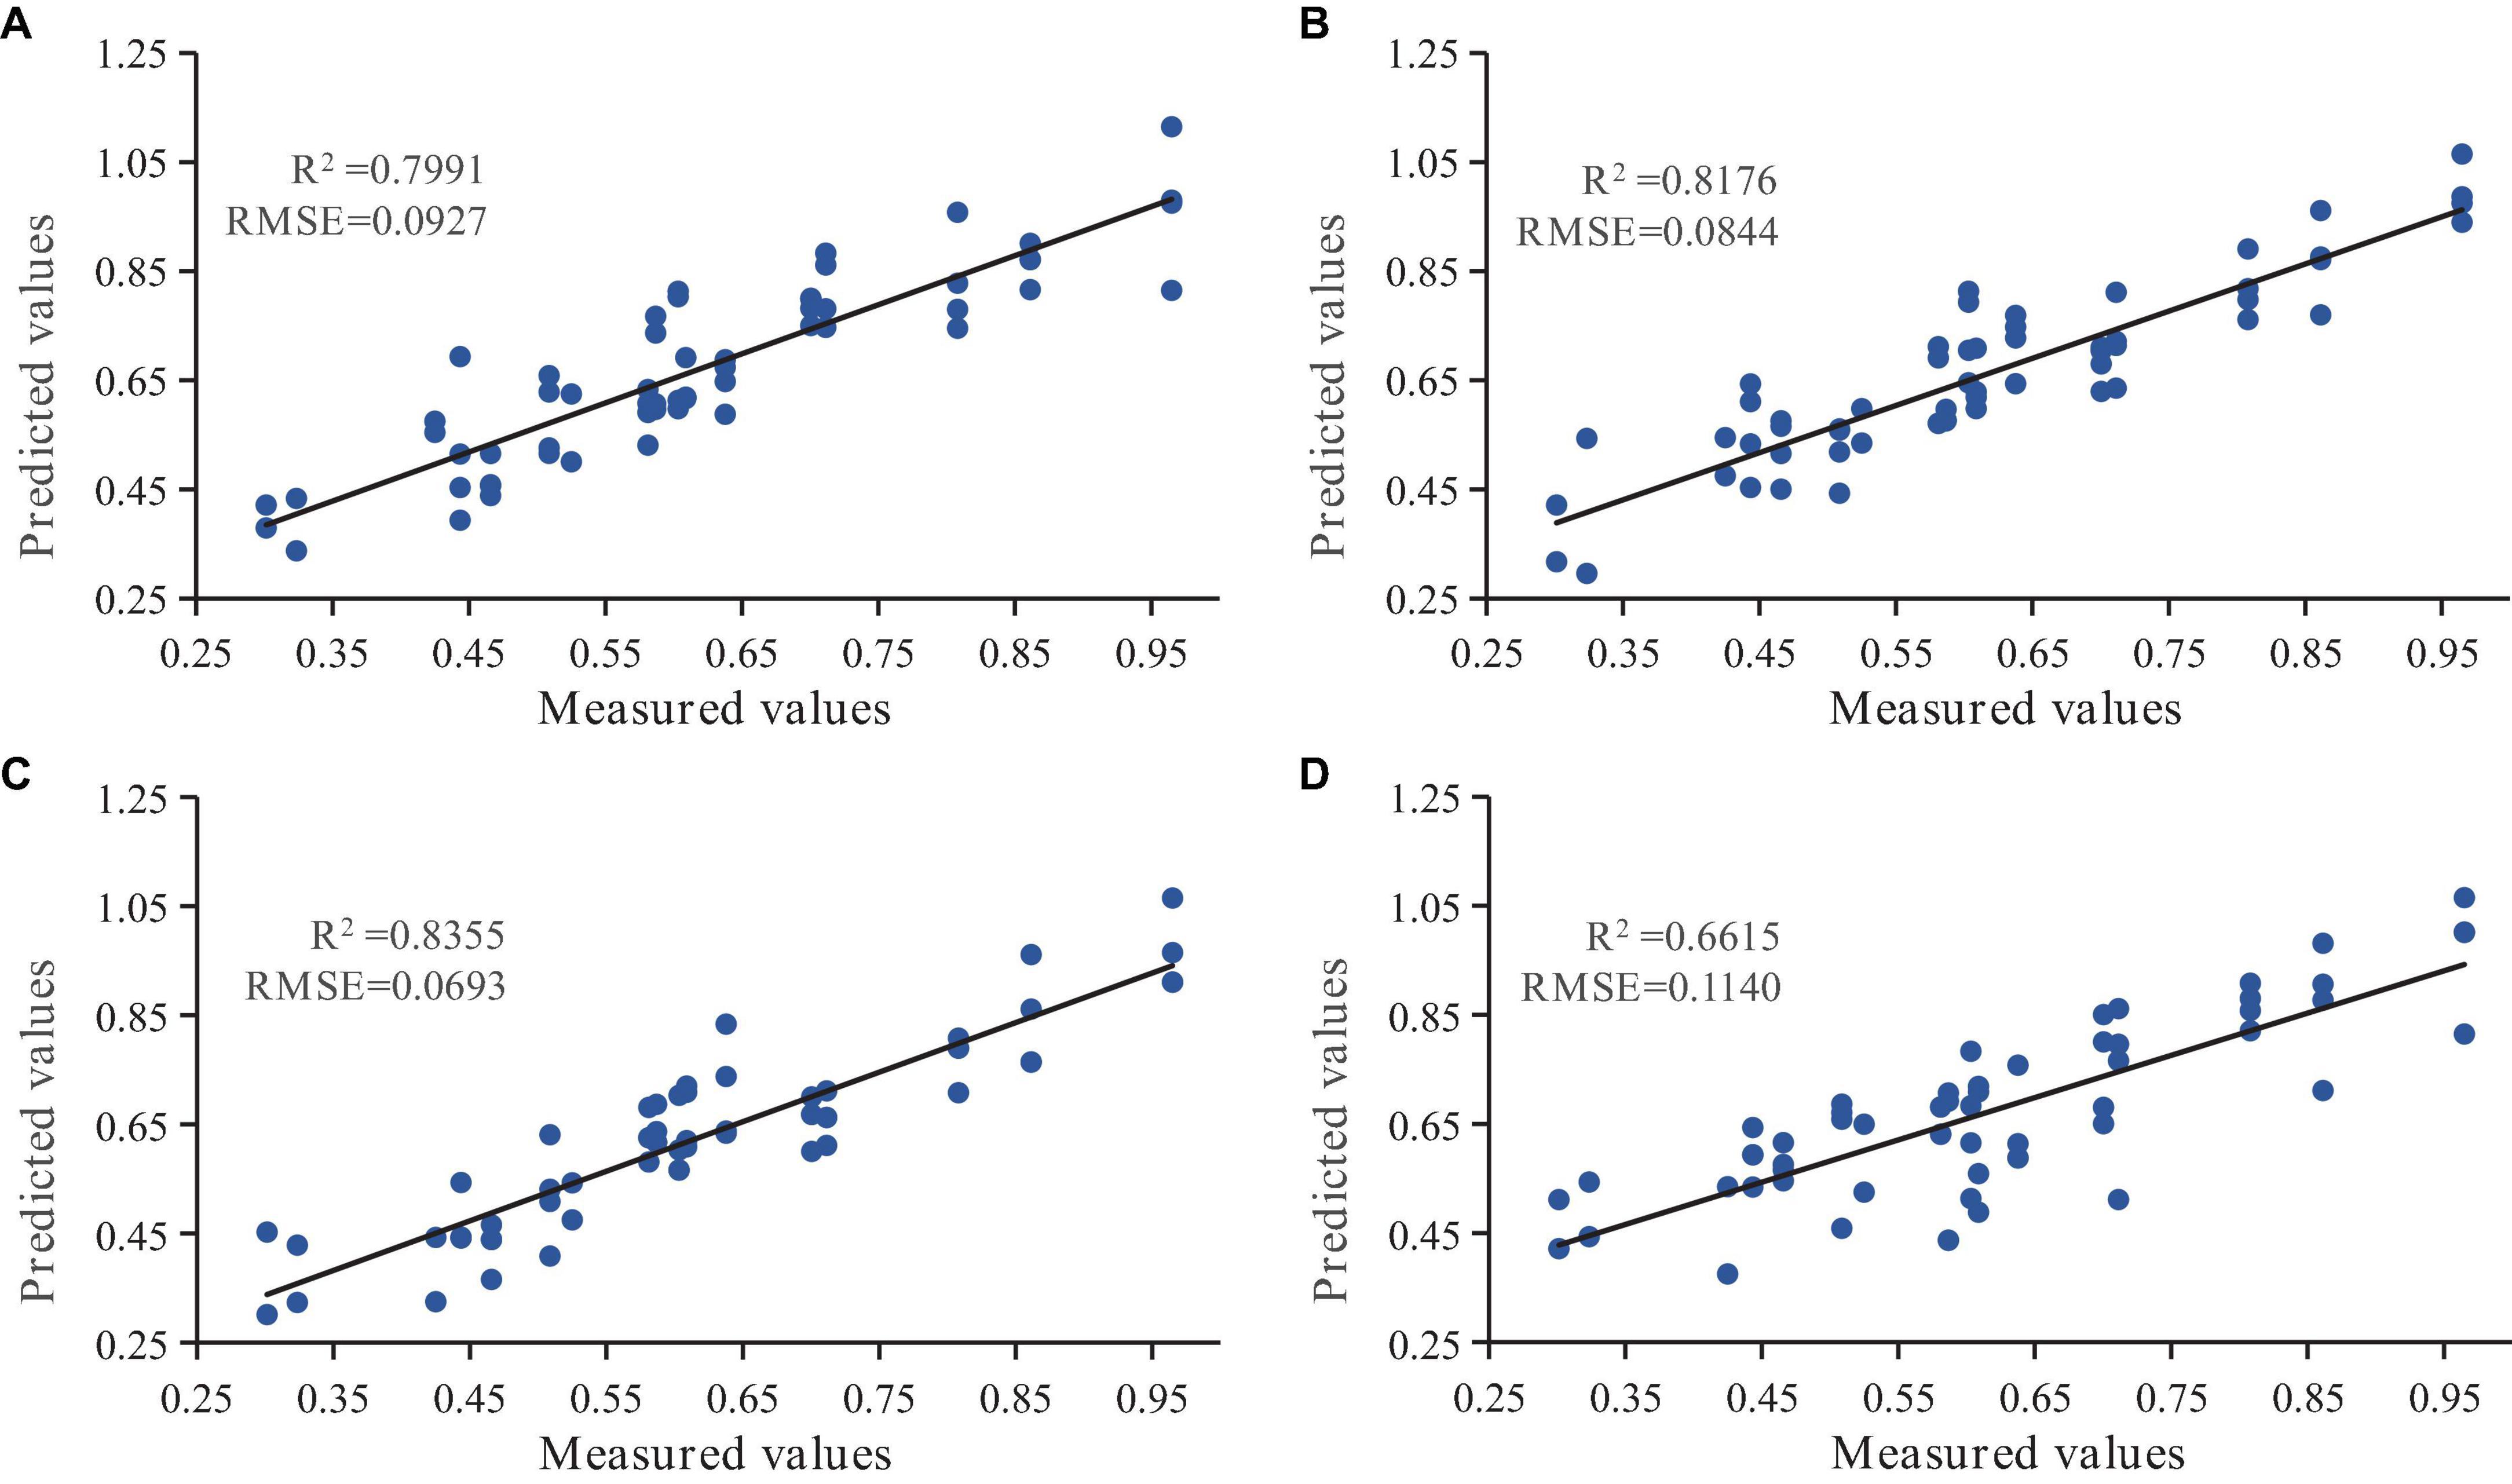
Figure 9. The scatter plots of the fit between the measured and predicted values of needle chlorophyll content at different ages using the state transition algorithm improved BP neural network model (STA-BP). Subplots (A–D) correspond to the annual, biennial, triennial, and mixed conifers of P. koraiensis Nakai, respectively.
China, known for its exceptional biodiversity, is home to a wide range of forest germplasm resources and diverse genetic resources. These resources play an important role in the sustainable development of forestry and the advancement of biological genetic engineering (Priyanka et al., 2021). Among the valuable coniferous evergreen tree species in the forest region of Northeast China, P. koraiensis Nakai is considered to be instrumental in restoring forest ecosystems, maintaining ecological balance, and providing industrial materials (Wang et al., 2023).
The importance of chlorophyll content in assessing plant health and growth performance is well established (Wendong et al., 2016; Croft et al., 2017). Spectrometry is a rapid, nondestructive, and efficient method for determining plant physiological parameters and has been widely adopted in plant science research (Buddenbaum et al., 2015; Arellano et al., 2017). However, full-spectrum analysis can generate noisy and redundant information, which may compromise the predictive performance of the model and increase its complexity (Gente et al., 2016; Raddi et al., 2022). In this experiment, a pretreatment of needle spectra at different ages (Figure 4) was performed. This process effectively eliminated background noise and baseline drift interferences, enhanced spectral signals, highlighted practical information of the maps, and selected spectral bands and vegetation indices with high correlation with chlorophyll content. As a result, the construction of the traditional algorithm PLS model, the improved stacking PLS model, the traditional BP neural network model, and the improved STA-BP neural network model was facilitated.
An increase in spectral index with age of P. koraiensis Nakai needles and its correlation with chlorophyll content were observed. The correlation between chlorophyll content and the spectral indices of Ctr1, VOG2, and VOG3 in 3-year-old needles exceeded 0.8. The Carter indices, which refer to the narrow spectral bands near the red (695 nm) and blue (420 nm) absorption bands and the strong chlorophyll absorption band (760 nm) at the edge of the chlorophyll absorption characteristics of needles (Carter, 1994), and the Vogelmann indices, whose spectral band is also located at the red edge and aims to enhance the pigment signal and correct for leaf water content (Vogelmann et al., 1993), were used. This indicates that chlorophyll content is a factor influencing the correlation between spectral indices and chlorophyll content. Furthermore, a commonality was found in the relationship between spectral reflectance and chlorophyll content of needles in Figure 6, which consistently showed a peak in the band around 680–720 nm for chlorophyll content and a significant correlation coefficient. This finding is consistent with the study results of Merzlyak et al. (1999), who indicated that 680 nm was the most sensitive to changes in chlorophyll content caused by leaf senescence. This has been attributed to the strong absorption of phytochromes in different bands (Fedotov et al., 2018).
The traditional PLS algorithm, a regression method capable of reducing numerous measured common spectral factors to a few unrelated potential factors, has been noted to have a tendency to overfit when misapplied (Atzberger et al., 2010). Due to its design for linear regression models, the traditional PLS algorithm is unsuitable for nonlinear relationships (Baffi et al., 1999; Li et al., 2005). In response to this limitation, an improved nonlinear stacking PLS model based on the stacking integration concept was proposed. This improved model demonstrated superior accuracy compared to the traditional linear PLS model (Figure 8). Previous research supports this finding. Wang et al. (2017) highlighted the superiority of nonlinear fitting in the characteristic dry edge (severe moisture deficit) and wet edge (sufficient soil moisture) space of surface temperature and vegetation index over the traditional linear fitting accuracy. Similarly, Li et al. (2007) and Wang et al. (2015) constructed nonlinear PLS models based on neural networks and extreme learning machines, respectively, both of which outperformed traditional algorithms. In this study, the nonlinear BP neural network model fitting of the traditional algorithm showed higher accuracy than the linear PLS model of the traditional algorithm. Despite the similarity between the stacking integration concept and the neural network fitting mode, the improved nonlinear STA-BP model still outperformed the nonlinear stacking PLS model. This suggests that the nonlinear fitting of chlorophyll content in needles of different ages of P. koraiensis Nakai is superior to the traditional linear model fitting methods, a finding consistent with Chen et al. (2016). Regardless of whether the traditional linear and nonlinear method or the improved nonlinear method was used, the fitting accuracy of the triennial needle model was found to be greater than that of the biennial needle model, which in turn was greater than that of the annual needle model, and finally the mixed needle fitting model. This pattern is consistent with the spectral vegetation index and the chlorophyll content law of needles of different ages. This may be due to the fact that needles with higher chlorophyll content absorb more solar energy and release clearer spectral signals. Furthermore, the chlorophyll content model with mixed needle fitting had the lowest accuracy, confirming that a model with fine classification can improve its robustness.
This study focused on improving the prediction models of chlorophyll content in P. koraiensis Nakai needles of different ages, an important evergreen species in Northeast China. Improvements were made to traditional linear PLS regression and nonlinear BP neural network models, taking into account the complexity of variables and refined classification. The research found that the correlation between chlorophyll content and each spectral index increased with the age of the needles. However, spectral reflectance pre-processed with different spectra showed lower correlation coefficients with chlorophyll content compared to the optimized vegetation index. The improved nonlinear stacking PLS model showed superior accuracy compared to traditional models, suggesting that nonlinear fitting methods are more effective for predicting chlorophyll content. The study also confirmed that fine-needle fitting can improve model robustness. These advances provide a basis for future predictions of plant physiological indicators and forest health status, contributing to the sustainable development of forestry in China.
The original contributions presented in this study are included in the article/supplementary material, further inquiries can be directed to the corresponding author.
YW designed the study and wrote the manuscript. JZ participated in the experiment. SD and LX supervised the experiments and performed revisions of the manuscript. All authors read and approved the final manuscript.
This research was supported by the National Key Research and Development Program of the site pollution of soil causes and treatment technology special project, China (No. 2020YFC1807704).
The authors declare that the research was conducted in the absence of any commercial or financial relationships that could be construed as a potential conflict of interest.
All claims expressed in this article are solely those of the authors and do not necessarily represent those of their affiliated organizations, or those of the publisher, the editors and the reviewers. Any product that may be evaluated in this article, or claim that may be made by its manufacturer, is not guaranteed or endorsed by the publisher.
Akyol, K. (2020). Stacking ensemble based deep neural networks modeling for effective epileptic seizure detection. Expert Syst. Appl. 148:113239. doi: 10.1016/j.eswa.2020.113239
Arellano, P., Tansey, K., Balzter, H., and Tellkamp, M. (2017). Plant family-specific impacts of petroleum pollution on biodiversity and leaf chlorophyll content in the Amazon rainforest of Ecuador. PLoS One 12:e0169867. doi: 10.1371/journal.pone.0169867
Atzberger, C., Guérif, M., Baret, F., and Werner, W. (2010). Comparative analysis of three chemometric techniques for the spectroradiometric assessment of canopy chlorophyll content in winter wheat. Comput. Electr. Agric. 73, 165–173. doi: 10.1016/j.compag.2010.05.006
Baffi, G., Martin, E. B., and Morris, A. J. (1999). Non-linear projection to latent structures revisited (the neural network PLS algorithm). Comput. Chem. Eng. 23, 1293–1307. doi: 10.1016/S0098-1354(99)00291-4
Bi, Y., Yuan, K., Xiao, W., Wu, J., Shi, C., Xia, J., et al. (2016). A local pre-processing method for near-infrared spectra, combined with spectral segmentation and standard normal variate transformation. Anal. Chim. Acta 909, 30–40. doi: 10.1016/j.aca.2016.01.010
Buddenbaum, H., Stern, O., Paschmionka, B., Hass, E., Gattung, T., Stoffels, J., et al. (2015). Using VNIR and SWIR field imaging spectroscopy for drought stress monitoring of beech seedlings. Int. J. Remote Sens. 36, 4590–4605. doi: 10.1080/01431161.2015.1084435
Carter, G. A. (1994). Ratios of leaf reflectances in narrow wavebands as indicators of plant stress. Remote Sens. 15, 697–703. doi: 10.1080/01431169408954109
Chen, J., Hu, H., Chen, K., and Wang, G. (2016). Effects of climate change on the grain yield based on nonlinear PLSR model. Chin. J. Agrometeorol. 37, 674–681.
Croft, H., Chen, J. M., Luo, X., Bartlett, P., Chen, B., and Staebler, R. M. (2017). Leaf chlorophyll content as a proxy for leaf photosynthetic capacity. Glob. Change Biol. 23, 3513–3524. doi: 10.1111/gcb.13599
Cui, H., and Liu, M. (2020). Analysis on the results of the 9th national forest inventory. J. West China For. Sci. 49, 90–95.
De Jong, S. M., Addink, E. A., Hoogenboom, P., and Nijland, W. (2012). The spectral response of Buxus sempervirens to different types of environmental stress – A laboratory experiment. ISPRS J. Photogrammetry Remote Sens. 74, 56–65. doi: 10.1016/j.isprsjprs.2012.08.005
Divya, Y., and Gopinathan, P. (2019). Soil water content measurement using hyper-spectral remote sensing techniques – A case study from north-western part of Tamil Nadu, India. Remote Sens. Applic. Soc. Environ. 14, 1–7. doi: 10.1016/j.rsase.2019.01.005
Dolk, D. R., and Kottemann, J. E. (1993). Model integration and a theory of models. Decis. Support Syst. 9, 51–63. doi: 10.1016/0167-9236(93)90022-U
Faal, S., Tavakoli, T., and Ghobadian, B. (2015). Mathematical modelling of thin layer hot air drying of apricot with combined heat and power dryer. J. Food Sci. Technol. Mysore 52, 2950–2957. doi: 10.1007/s13197-014-1331-9
Fedotov, Y. V., Belov, M. L., Kravtsov, D. A., Cherpakov, A. A., and Gorodnichev, V. A. (2018). Selection of emission detection ranges for the laser method of plant stress revealing at a fluorescence excitation wavelength of 355 nm. IOP Conf. Ser. Mater. Sci. Eng. 450:062005. doi: 10.1088/1757-899X/450/6/062005
Garhwal, A. S., Pullanagari, R. R., Li, M., Reis, M. M., and Archer, R. (2020). Hyperspectral imaging for identification of Zebra Chip disease in potatoes. Biosyst. Eng. 197, 306–317. doi: 10.1016/j.biosystemseng.2020.07.005
Gente, R., Born, N., Balzer, J. C., and Koch, M. (2016). “Assessment of plants’ reaction to drought stress using THz time domain spectroscopy,” in 41st International conference on infrared, millimeter, and terahertz waves (IRMMW-THz), (Piscataway, NJ: IEEE), 1–2. doi: 10.1109/IRMMW-THz.2016.7758370
Grosse-Rhode, M. (2004). “On model integration and integration modelling - Introduction to the subject area integration modelling,” in Integration of software specification techniques for applications in engineering, eds H. Ehrig, W. Damm, J. Desel, M. Grosserhode, W. Reif, E. Schnieder, et al. (Berlin: Springer), 567–581. doi: 10.1007/978-3-540-27863-4_30
Gu, L., Liu, Y., and Zhen, J. (2021). Prediction of beet yield based on BP neural network optimized by improved particle swarm algorithm. J. Xinjiang Univ. 38, 191–196.
Han, X., Dong, Y., Yue, L., Xu, Q., Xie, G., and Xu, X. (2021). State-transition simulated annealing algorithm for constrained and unconstrained multi-objective optimization problems. Appl. Intell. 51, 775–787. doi: 10.1007/s10489-020-01836-8
He, W., Li, Y. Q., Wang, J. Y., Yao, Y. F., Yu, L., Gu, D. X., et al. (2021). Using field spectroradiometer to estimate the leaf N/P ratio of mixed forest in a Karst area of southern China: A combined model to overcome overfitting. Remote Sens. 13:3368. doi: 10.3390/rs13173368
Hu, E., He, J., and Shen, S. (2023). A hybrid discrete state transition algorithm for combinatorial optimization problems. Front. Energy Res. 11:1148011. doi: 10.3389/fenrg.2023.1148011
Huang, B., Lu, F., Sun, B., Wang, X., Li, X., Ouyang, Z., et al. (2023). Climate change and rising CO2 amplify the impact of land use/cover change on carbon budget differentially across China. Earths Future 11:e2022EF003057. doi: 10.1029/2022EF003057
Huang, W., Liu, H., and Bai, M. (2009). “Urban expansion simulation based on constrained artificial neural network cellular automata model,” in 17th International conference on geoinformatics (Fairfax, VA: IEEE), 350–353.
Jia, W., Zhao, D., Shen, T., Ding, S., Zhao, Y., and Hu, C. (2015). An optimized classification algorithm by BP neural network based on PLS and HCA. Appl. Intell. 43, 176–191. doi: 10.1007/s10489-014-0618-x
Karaman, I., Qannari, E., Martens, H., Hedemann, M. S., Knudsen, K. E. B., and Kohler, A. (2013). Comparison of Sparse and Jack-knife partial least squares regression methods for variable selection. Chemometr. Intell. Lab. Syst. 122, 65–77. doi: 10.1016/j.chemolab.2012.12.005
Kaviani, S., and Sohn, I. (2020). Influence of random topology in artificial neural networks: A survey. ICT Express 6, 145–150. doi: 10.1016/j.icte.2020.01.002
Keiner, L. E., and Yan, X.-H. (1998). A neural network model for estimating sea surface chlorophyll and sediments from thematic mapper imagery. Remote Sens. Environ. 66, 153–165. doi: 10.1016/S0034-4257(98)00054-6
Lan, S. (2015). Growth dynamic analysis of half-sib progeny and comprehensive evaluation on heredity effects of Picea koraiensis. J. Beihua Univ. 16, 509–514.
Li, C. F., Ye, H., Wang, G. Z., and Zhang, J. (2005). A recursive nonlinear PLS algorithm for adaptive nonlinear process modeling. Chem. Eng. Technol. 28, 141–152. doi: 10.1002/ceat.200407027
Li, R., Meng, G., Gao, N., and Xie, H. (2007). Combined use of partial least-squares regression and neural network for residual life estimation of large generator stator insulation. Meas. Sci. Technol. 18, 2074–2082. doi: 10.1088/0957-0233/18/7/038
Li, Y., and Cao, W. (2019). An extended multilayer perceptron model using reduced geometric Algebra. IEEE Access 7, 129815–129823. doi: 10.1109/ACCESS.2019.2940217
Li, Y., Sun, Y., Jiang, J., and Liu, J. (2019). Spectroscopic determination of leaf chlorophyll content and color for genetic selection on Sassafras tzumu. Plant Methods 15:73. doi: 10.1186/s13007-019-0458-0
Liu, J., Meng, Q., Ge, X., Liu, S., Chen, X., and Sun, Y. (2020). Leaf area index inversion of summer maize at multiple growth stages based on BP neural network. Remote Sens. Technol. Applic. 35, 174–184.
Luo, J., Ying, K., He, P., and Bai, J. (2005). Properties of Savitzky–Golay digital differentiators. Digital Signal Process. 15, 122–136. doi: 10.1016/j.dsp.2004.09.008
Ma, S., Baldocchi, D. D., Mambelli, S., and Dawson, T. E. (2011). Are temporal variations of leaf traits responsible for seasonal and inter-annual variability in ecosystem CO2 exchange? Funct. Ecol. 25, 258–270. doi: 10.1111/j.1365-2435.2010.01779.x
Merzlyak, M. N., Gitelson, A. A., Chivkunova, O. B., and Rakitin, V. Y. (1999). Non-destructive optical detection of pigment changes during leaf senescence and fruit ripening. Physiol. Plant. 106, 135–141. doi: 10.1034/j.1399-3054.1999.106119.x
Miraglio, T., Adeline, K., Huesca, M., Ustin, S., and Briottet, X. (2019). Monitoring LAI, chlorophylls, and carotenoids content of a woodland Savanna using hyperspectral imagery and 3D radiative transfer modeling. Remote Sens. 12:28. doi: 10.3390/rs12010028
Mullen, K. M., and Stokkum, I. H. M. V. (2007). An introduction to the “Special volume spectroscopy and chemometrics in R”. J. Stat. Softw. 18, 1–5. doi: 10.18637/jss.v018.i01
Priyanka, V., Kumar, R., Dhaliwal, I., and Kaushik, P. (2021). Germplasm conservation: Instrumental in agricultural biodiversity—A review. Sustainability 13:6743. doi: 10.3390/su13126743
Raddi, S., Giannetti, F., Martini, S., Farinella, F., Chirici, G., Tani, A., et al. (2022). Monitoring drought response and chlorophyll content in Quercus by consumer-grade, near-infrared (NIR) camera: A comparison with reflectance spectroscopy. New For. 53, 241–265. doi: 10.1007/s11056-021-09848-z
Rogers, M. S., Chung, T., and Fergusson, S. (1995). Oscillometric measurement of mean arterial pressure: The effect of position on prediction of pregnancy induced hypertension. J. Obstetr. Gynaecol. 15, 221–225. doi: 10.3109/01443619509020684
Rooney, N., and Patterson, D. (2007). A weighted combination of stacking and dynamic integration. Pattern Recogn. 40, 1385–1388. doi: 10.1016/j.patcog.2006.10.008
Shipley, B., Lechowicz, M. J., Wright, I., and Reich, P. B. (2006). Fundamental trade-offs generating the worldwide leaf economics spectrum. Ecology 87, 535–541. doi: 10.1890/05-1051
Steinier, J., Termonia, Y., and Deltour, J. (1972). Smoothing and differentiation of data by simplified least square procedure. Anal. Chem. 44, 1906–1909. doi: 10.1021/ac60319a045
Tawhid, M. A., and Savsani, V. (2018). A novel multi-objective optimization algorithm based on artificial algae for multi-objective engineering design problems. Appl. Intell. 48, 3762–3781. doi: 10.1007/s10489-018-1170-x
Tong, Q., Zhang, B., and Zhang, L. (2016). Current progress of hyperspectral remote sensing in China. J. Remote Sens. 20, 689–707.
Tran, T. N., Afanador, N. L., Buydens, L. M. C., and Blanchet, L. (2014). Interpretation of variable importance in partial least squares with significance multivariate correlation (sMC). Chemometr. Intell. Lab. Syst. 138, 153–160. doi: 10.1016/j.chemolab.2014.08.005
Vogelmann, J., Rock, B., and Moss, D. (1993). Red edge spectral measurements from sugar maple leaves. Int. J. Remote Sens. 14, 1563–1575. doi: 10.1080/01431169308953986
Wang, C., Hu, J., and Wen, C. (2015). “A nonlinear PLS modeling method based on extreme learning machine,” in 34th Chinese control conference (CCC) (Hangzhou: IEEE), 3507–3511. doi: 10.1109/ChiCC.2015.7260180
Wang, H. X., and Hu, Z. L. (2006). “Maximum margin criterion embedded partial least square regression for linear and nonlinear discrimination,” in International conference on computational-intelligence and security, (Piscataway, NJ: IEEE), 33–38. doi: 10.1109/ICCIAS.2006.294086
Wang, S., Zhang, N., Wu, L., and Wang, Y. (2016). Wind speed forecasting based on the hybrid ensemble empirical mode decomposition and GA-BP neural network method. Renew. Energy 94, 629–636. doi: 10.1016/j.renene.2016.03.103
Wang, X. (2009). “Research on case retrieval model based on rough set theory and BP neural network,” in International symposium on intelligent ubiquitous computing and education (Chengdu: IEEE), 117–120. doi: 10.1109/IUCE.2009.71
Wang, X., Cong, P., Kang, Q., Fu, Q., Liu, C., and Wang, X. (2017). Discussion on method of nonlinear fitting dry and wet edges of LST/NDVI feature space better than traditional linear fitting method. Trans. Chin. Soc. Agric. Eng. 33, 306–314.
Wang, Y., Jiang, Z., Qin, A., Wang, F., Chang, E., Liu, Y., et al. (2023). Population structure, genetic diversity and candidate genes for the adaptation to environmental stress in Picea koraiensis. Plants 12:1266. doi: 10.3390/plants12061266
Wendong, D., Girdthai, T., Zesu, H., Ketudat-Cairns, M., Rong, T., and Wang, S. J. (2016). Genetic analysis for anthocyanin and chlorophyll contents in rapeseed. Cienc. Rural 46, 790–795. doi: 10.1590/0103-8478cr20150564
Wold, S., Albano, C., Dunn, W. J., Esbensen, K., Hellberg, S., Johansson, E., et al. (1984). Modelling data tables by principal components and PLS-class patterns and quantitative predictive relations. Analusis 12, 477–485.
Zhang, W., and Moller-Pedersen, B. (2013). “Tool integration models,” in 20th Asia-Pacific software engineering conference (APSEC) (IEEE: Bangkok), 485–494. doi: 10.1109/APSEC.2013.70
Zheng, L., and Zhang, Y. (2021). Nonlinear partial least squares regression model based on Stacking integration and its application. J. Hubei Univ. Technol. 36, 114–120.
Zheng, W., Ming, J., Yang, M., Zhou, S., and Wang, S. (2017). Hyperspectral estimation of rice pigment content based on band depth analysis and BP neural network. Chin. J. Eco Agric. 25, 1224–1235.
Zhou, L., Wu, H., and Wang, S. (2020). Study on nutrient contents and ecological stoichiometric characteristics in needles of Picea koraiensis in different stands. J. Plant Resourc. Environ. 29, 19–25.
Zhou, X. P., and Cheng, H. (2014). Stability analysis of three-dimensional seismic landslides using the rigorous limit equilibrium method. Eng. Geol. 174, 87–102. doi: 10.1016/j.enggeo.2014.03.009
Zhou, X., Yang, C., and Gui, W. (2020). The principle of state transition algorithm and its applications. Acta Automatica Sin. 46, 2260–2274.
Zhou, Y., Lu, A., and Liu, X. (2022). Prediction of chlorophyll a content in water body based on BP Neural Network with improved genetic algorithm. Electr. Test 15, 37–42.
Keywords: STA-BP neural network, stacking integration, nonlinear fitting, fine classification, PLS model
Citation: Wang Y, Zhang J, Diao S and Xue L (2023) Nonlinear model prediction of needle chlorophyll content of Picea koraiensis Nakai at different needle ages based on hyperspectral features. Front. For. Glob. Change 6:1207270. doi: 10.3389/ffgc.2023.1207270
Received: 17 April 2023; Accepted: 14 June 2023;
Published: 29 June 2023.
Edited by:
Vega Cong Xu, University of Canterbury, New ZealandCopyright © 2023 Wang, Zhang, Diao and Xue. This is an open-access article distributed under the terms of the Creative Commons Attribution License (CC BY). The use, distribution or reproduction in other forums is permitted, provided the original author(s) and the copyright owner(s) are credited and that the original publication in this journal is cited, in accordance with accepted academic practice. No use, distribution or reproduction is permitted which does not comply with these terms.
*Correspondence: Liang Xue, bGlhbmd4dWVAY2FmLmFjLmNu
†These authors have contributed equally to this work
Disclaimer: All claims expressed in this article are solely those of the authors and do not necessarily represent those of their affiliated organizations, or those of the publisher, the editors and the reviewers. Any product that may be evaluated in this article or claim that may be made by its manufacturer is not guaranteed or endorsed by the publisher.
Research integrity at Frontiers
Learn more about the work of our research integrity team to safeguard the quality of each article we publish.