- 1College of Nanfang, Sanya Nanfan Research Institute, Hainan University, Sanya, China
- 2Intelligent Forestry Key Laboratory of Haikou City, School of Tropical Agriculture and Forestry, Hainan University, Haikou, China
- 3Surveying and Mapping Engineering Institute of Gansu Province, Lanzhou, China
Introduction: Rubber trees are an important cash crop in Hainan Province; thus, monitoring sample plots of these trees provides important data for determining growth conditions. However, existing monitoring technology and rubber forest sample plot analysis methods are relatively simple and present widespread issues, such as limited monitoring equipment, transportation difficulties, and relatively poor three-dimensional visualization effects in complex environments. These limitations have complicated the development of rubber forest sample plot monitoring.
Method: This study developed a terrestrial photogrammetry system combined with 3D point-cloud reconstruction technology based on the structure from motion with multi-view stereo method and sample plot survey data. Deviation analyses and accuracy evaluations of sample plot information were performed in the study area for trees to explore the practical significance of this method for monitoring rubber forest sample plots. Furthermore, the relationship between the height of the first branch, diameter at breast height (DBH), and rubber tree volume was explored, and a rubber tree standard volume model was established.
Results: The Bias, relative Bias, RMSE, and RRMSE of the height of the first branch measured by this method were −0.018 m, −0.371%, 0.562 m, and 11.573%, respectively. The Bias, relative Bias, RMSE, and RRMSE of DBH were −0.484 cm, −1.943%, −2.454 cm, and 9.859%, respectively, which proved that the method had high monitoring accuracy and met the monitoring requirements of rubber forest sample plots. The fitting results of rubber tree standard volume model had an R2 value of 0.541, and the estimated values of each parameter were 1.745, 0.115, and 0.714. The standard volume model accurately estimated the volume of rubber trees and forests using the first branch height and DBH.
Discussion: This study proposed an innovative planning scheme for a terrestrial photogrammetry system for 3D visual monitoring of rubber tree forests, thus providing a novel solution to issues observed in current sample plot monitoring practices. In the future, the application of terrestrial photogrammetry systems to monitor other types of forests will be explored.
1. Introduction
Hainan Province, located on the northern edge of the tropics, has a tropical monsoon climate and is the only tropical agricultural base in China. Under current economic and social development conditions, including increasingly depleted resources and severe environmental pollution, Hainan Province possesses remarkable advantages in the sustainable development of tropical agriculture and forestry (Tan et al., 2020; Gao et al., 2022). As an important measure for realizing sustainable development, modern crop monitoring tools are of great importance in promoting agricultural modernization and facilitating sustainable agricultural development. Therefore, a modern monitoring system should be established for various types of crops to regularly monitor their growth conditions, such as biomass, pests, diseases, and environmental factors.
Rubber trees are important cash crops in Hainan Province and have a cultivation area exceeding 470,000 ha. Moreover, the yield of rubber latex from this region is over 300,000 tons, which accounts for approximately 40% of the national total (Guo et al., 2006). However, because Hainan Province is in a tropical region, the rubber tree planting environment has a complex forest structure and terrain (Linares-Palomino and Ponce Alvarez, 2005; Chave et al., 2014; Bojórquez et al., 2020; Janssen et al., 2020; Kübler et al., 2020). Thus, investigating the conditions of rubber tree plantations in this region is difficult. Furthermore, existing monitoring technology and rubber forest sample plot analysis methods are relatively simple and present widespread issues, such as limited monitoring equipment, transportation difficulties, and relatively poor three-dimensional visualization effects in complex environments. These limitations have complicated the development of rubber forest sample plot monitoring.
Although unmanned aerial vehicle (UAV) photogrammetry and ground-based laser radar can resolve problems associated with monitoring forests within complex terrain, they present certain shortcomings, such as their high cost, transportation difficulty, and difficult implementation in complex terrains (Asner et al., 2010; Koukal et al., 2014). Therefore, in this study, we developed a terrestrial photogrammetry system based on the principles of forest mensuration, photogrammetry, image processing technology, and other theories (Qiu et al., 2018) and evaluated its feasibility for rubber forest sample plot monitoring through deviation analyses.
The diameter at breast height (DBH) and tree height represent basic tree measurement factors that can be used to determine the growth trend of a stand and reveal the composition of horizontal and vertical spatial structures. In traditional forest monitoring tasks, the main survey content includes DBH, tree height, and stand volume and density (McRoberts et al., 2009). Among traditional forest monitoring methods, plot sampling is the most common, and it involves the use of marking tools to establish suitable sample plots in different layout patterns for conducting surveys (Wang et al., 2018). Within these sample plots, the DBH and tree height are measured using DBH calipers and traditional height gauges, respectively. Finally, the data collected from the sample plots are utilized to estimate forest resources (Curtis and Arney, 1977). However, this traditional method is not suitable for measurements in environments with high forest density and severe tree occlusion. The accuracy of measuring individual wood factors is influenced by the accuracy of survey methods and instruments and the subjectivity of the observers, which result in large deviations (Newnham et al., 2015). To address these problems, more functional tree measurement tools and instruments, such as optical and ultrasonic Vertex hypsometers (Božić et al., 2005) and forest compass instruments (Falin et al., 2011), have gradually been developed for different application scenarios. The electronic angle-gauge tree-measuring instrument developed by Dong et al. (2009) and simple electronic tree-measuring gun developed by Xu et al. (2013) can directly measure the height of single trees. Liu et al. (2018) designed a portable handheld tree measurement instrument based on the principle of electromechanical and forest mensuration, and it is primarily used for automatic measurement of DBH. As forestry methods advance and information intelligence processes emerge, tree measurement instruments have been developed that have greatly promoted the progress of forest resource surveys in China; moreover, intelligent equipment has become mainstream (Borz et al., 2022). However, traditional monitoring methods are facing increasing limitations. Therefore, the monitoring efficiency of traditional monitoring methods should be improved. In addition, the demand for highly efficient and accurate forest resource survey techniques is increasing in the field of forestry surveys.
Unmanned aerial vehicles are highly efficient and less time-consuming than traditional survey methods; thus, they are widely used in forest resource investigation, basic surveying, mapping, meteorological monitoring, and other fields (Grenzdörffer and Teichert, 2008; Hartley, 2017; Guimarães et al., 2020; Galaktionov et al., 2021). UAV photogrammetry has recently become popular, and it is based on the installation of various sensors onboard UAVs capable of performing multi-angle photogrammetry of the measured area and remotely obtaining a large range of high-resolution image information (Zmarz, 2009) and the subsequent establishment of a comprehensive 3D data correlation model. Giannetti et al. (2018) proposed a method for predicting forest growing stock volume using UAV photogrammetry without relying on a digital terrain model (DTM). The research results showed that this DTM-independent approach produced comparable results to traditional photogrammetry and airborne laser scanning (ALS) methods. In the experiments conducted in Italy, the root mean square error percentage (RMSE%) of the predictions ranged from 15.9 to 16.7%, while in Norway, it ranged from 16.3 to 17.9%. This indicates that UAV photogrammetry can effectively predict forest growing stock volume even in the absence of a high-resolution DTM, thereby enhancing the potential of UAVs in forest monitoring and inventory (Giannetti et al., 2018). Biesemans et al. (2005) used UAV photogrammetry to assess property damage caused by natural disasters. Yfantis (2019) confirmed the versatility of UAV survey systems in forest fire prevention. Liu Changjun et al. used UAV photogrammetry technology to investigate mountain flood disasters and obtained image data with sufficiently high speed and accuracy to effectively meet the requirements of mountain flood disaster investigation and evaluation tasks (Lin et al., 2010). Lowe et al. (2019) presented an analysis of shoreline change on reef islands using UAV-derived orthomosaics and digital surface models (DSMs) collected on Sipadan Island, Sabah, Malaysia, and Sasahura Ite Island, Isabel Province, Solomon Islands. Furthermore, UAVs can overcome the problems of complex terrain and complex environments more effectively than traditional mapping and surveying technology, thereby increasing the accuracy of forest resource monitoring (Ruwaimana et al., 2018; Navarro et al., 2020) and greatly reducing the pressure on surveying and mapping workers (Liu et al., 2014). However, the hardware platform functions of UAVs are not perfect, and shortcomings are observed in practical applications. For example, UAV photogrammetry can only complete the 3D reconstruction of the tree canopy phenotype and may face challenges or yield poor results in capturing the tree structure beneath the canopy (Chianucci et al., 2016; Tomaštík et al., 2017). Moreover, numerous ground control points are required for UAV photogrammetry, resulting in high demands for computer performance and processing capabilities, and during image processing, potential drawbacks are observed, such as long processing times and high deviation rates of feature points (Ni et al., 2018; Jayathunga et al., 2020). In addition, the quality of the images captured by UAV is also of utmost importance. It requires precise adjustments to the camera lens, flight altitude, and flight speed of the UAV. The use of high-resolution and low-distortion lenses, along with appropriate ISO settings, ensures that the shutter speed is fast enough to capture clear and visible images while minimizing the occurrence of motion blur. The selection of flight altitude and speed should be based on the size of the target features and the ground sampling distance to minimize the impact of motion blur on image quality (O’Connor et al., 2017; Frey et al., 2018).
Terrestrial laser scanning (TLS), as an advanced remote sensing technique, has recently experienced rapid development. It utilizes a laser emitted from a sensor attached to the instrument to measure the distance between the sensor and target object. By penetrating the forest canopy, TLS is able to capture both horizontal and vertical information of the forest stand. This non-contact measurement method is harmless to the human body and exhibits minimal errors, thus offering high point-cloud density and millimeter-level precision. Therefore, it has emerged as a novel technology for acquiring forest resource data and gradually become a focus of forestry investigations at home and abroad (Dassot et al., 2011; Burt et al., 2013). Yao et al. (2011) used high-precision TLS combined with an allometric biomass model of specific tree species to calculate forest biomass, and the results indicated that TLS offers high efficiency and accuracy in biomass estimations. Dominik et al. used TLS to obtain stand structure parameters and used density, vertical, and structural information as test factors, and the results showed that this method produced accurate results (Bauwens et al., 2016). Chen et al. (2019a) used ground mobile lidar to obtain point-cloud data and used the cylinder-diameter fitting method to develop DBH models for different tree species, and the RMSE of the results was relatively low. Similarly, Chen et al. (2019b) used ground laser scanning point-cloud data to estimate the biomass of common tree species in northern China, and the results showed that this method could accurately estimate forest biomass and effectively calibrate allometric biomass models. However, the application of TLS in the field of forestry monitoring has certain limitations, such as the high cost, which may hinder its widespread adoption. Additionally, TLS devices have limited portability owing to their bulky size and weight, making them less suitable in complex terrains and for applications that require mobility. Moreover, TLS relies on optimal visibility conditions, which limits its effectiveness in densely vegetated or obstructed areas and in situations with poor lighting. Lastly, the processing of TLS-generated point-cloud data can be complex and resource-intensive and requires specialized software and significant computational resources. Thus, the associated cost, portability, visibility, and data processing requirements of TLS should be considered when assessing the suitability of this approach for specific applications (Béland et al., 2011; White et al., 2016; Saarinen et al., 2018) and represent shortcomings and limitations in the use of TLS for three-dimensional point-cloud reconstruction of forests and subsequent monitoring (Rautiainen et al., 2011).
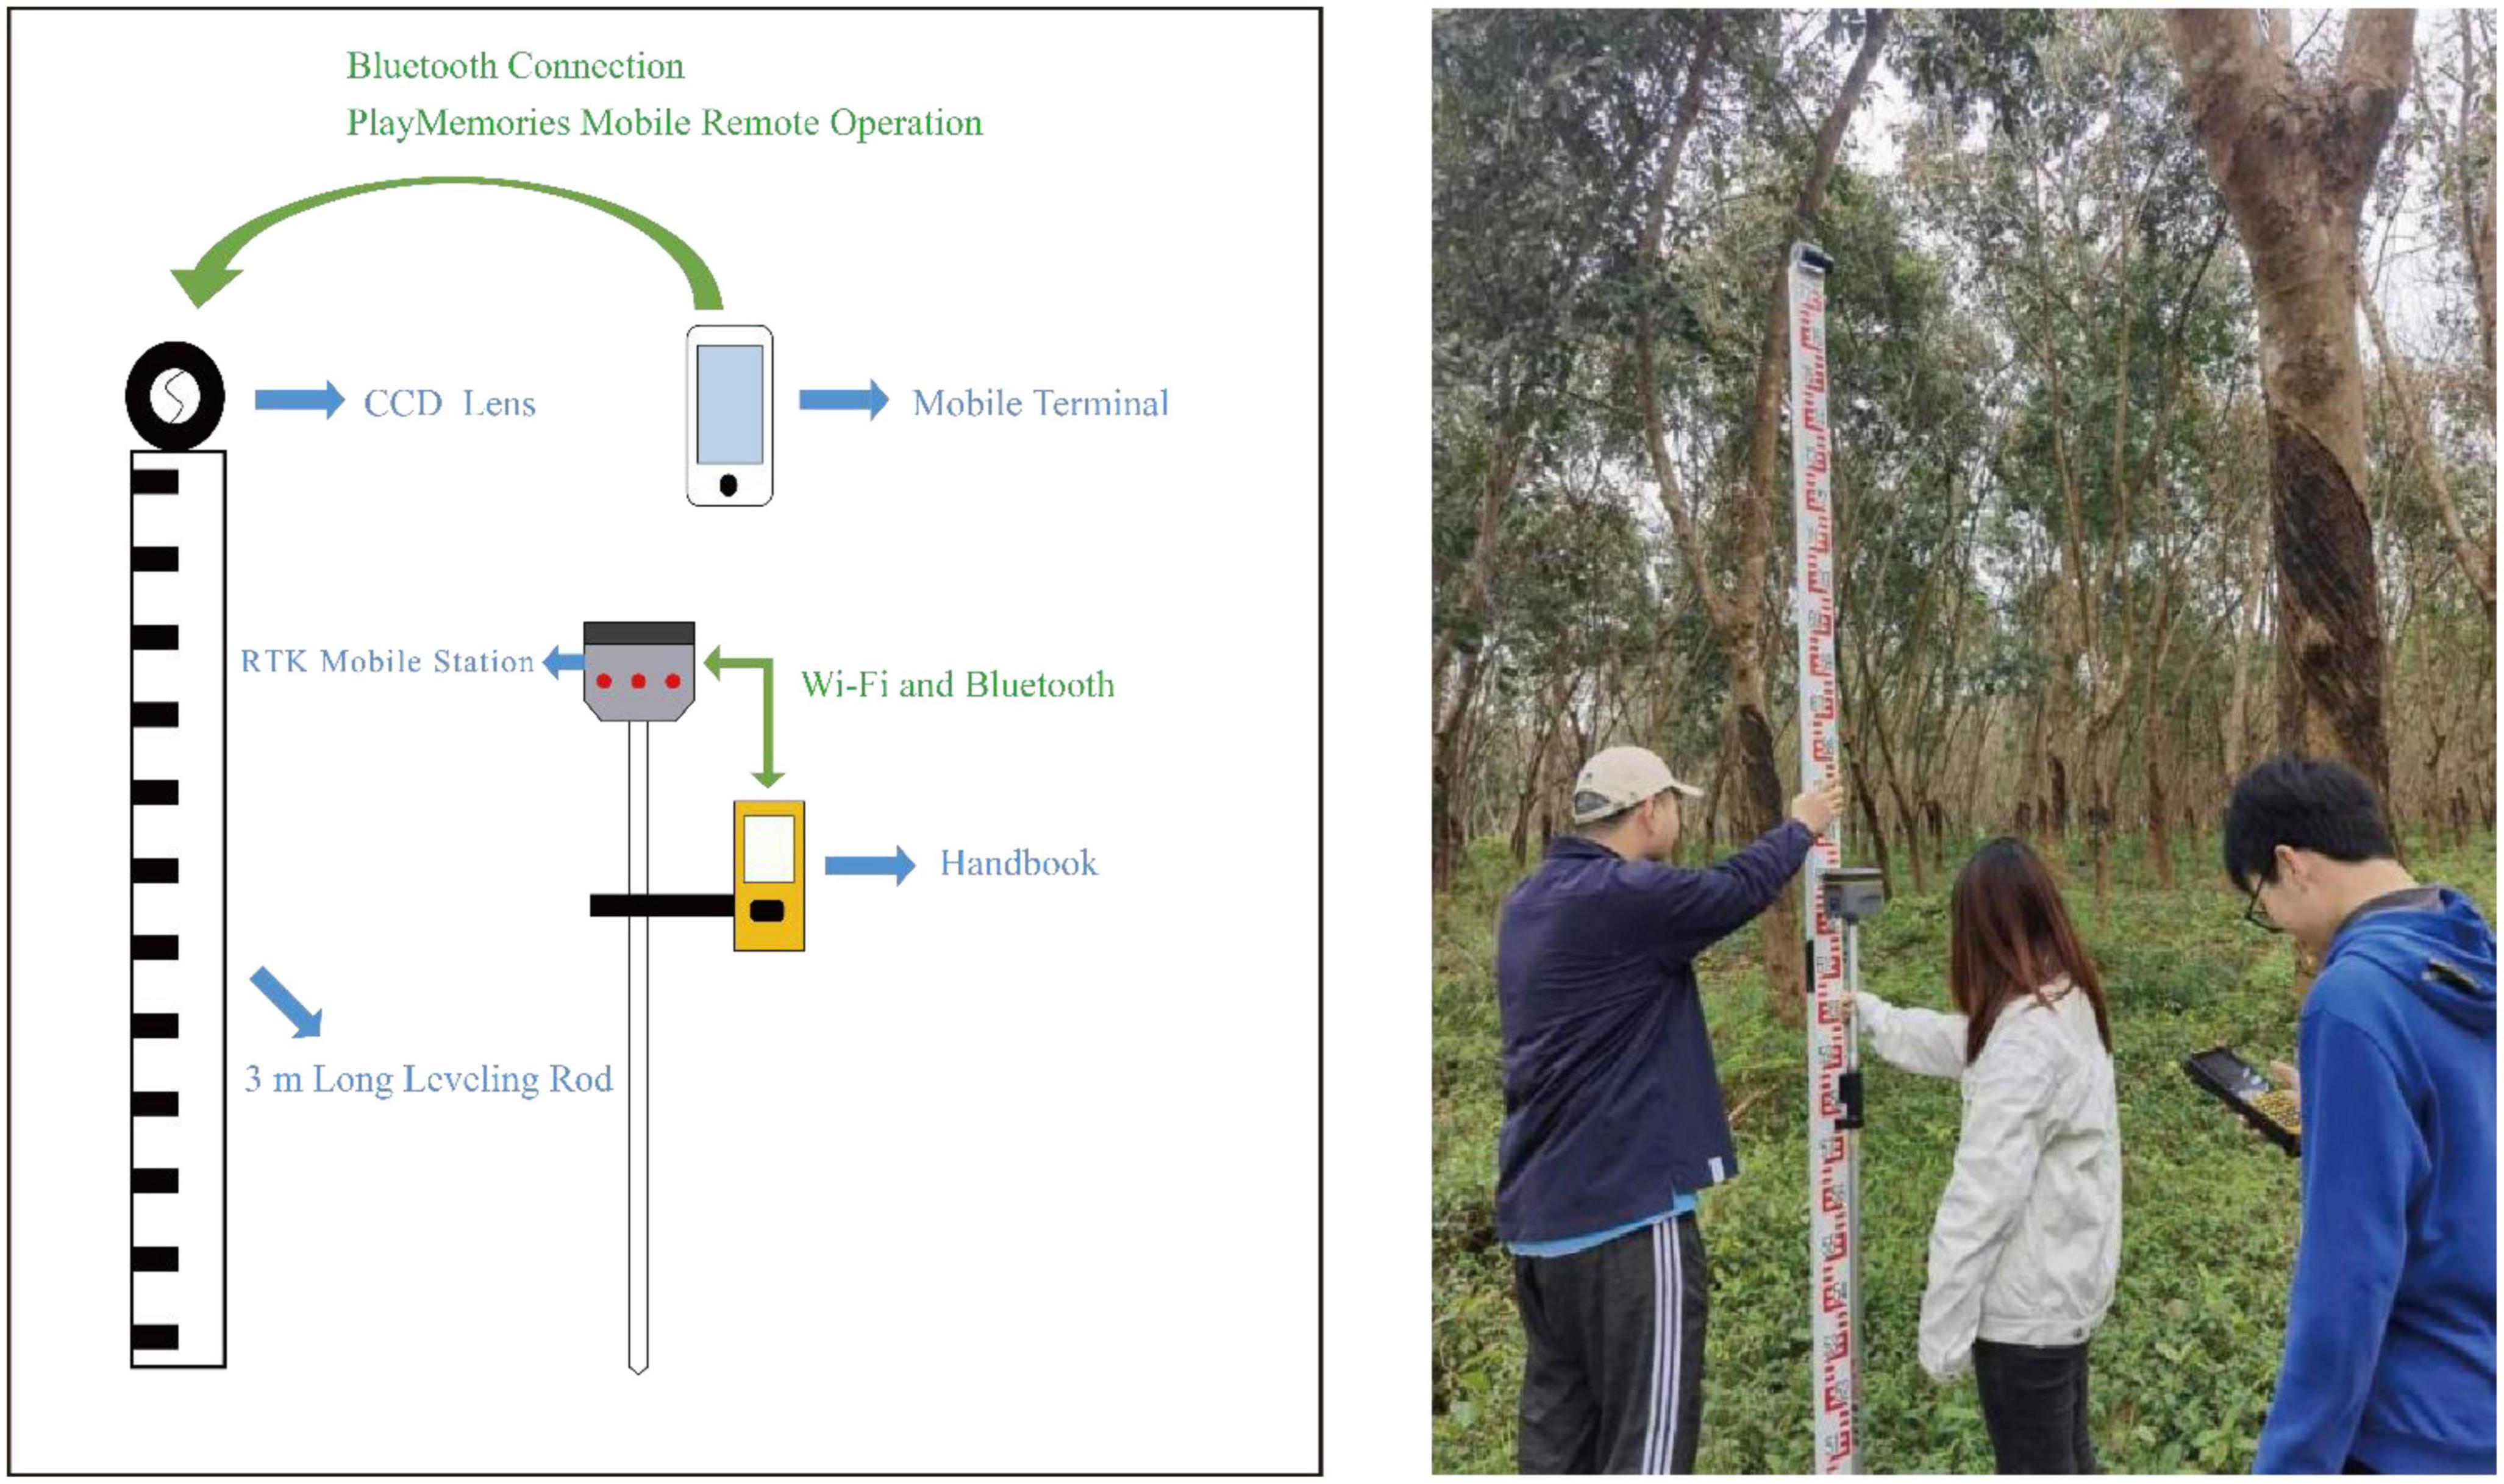
Owing to these problems in the application of photogrammetry technology for rubber forests, we sought to develop a terrestrial photogrammetry system applicable to rubber forest sample plot monitoring (Figure 1). Compared with other photogrammetric instruments, terrestrial photogrammetry technology is performed using experimental equipment with greater portability, can provide high-precision sample image information, and is well-suited for point measurement tasks in complex terrains. Although terrestrial photogrammetry systems, UAV, and TLS each present advantages and limitations depending on the specific applications, the proposed terrestrial photogrammetry system has a lower cost and greater portability than UAV and TLS, thus making it more accessible and suitable for a wider audience. Additionally, terrestrial photogrammetry can provide higher resolution data and capture more detailed understory features, thereby enabling it to achieve accuracy comparable to that of TLS (Piermattei et al., 2019). It can even generate denser point clouds than UAV because it is limited by missing understory information caused by canopy occlusion (Wallace et al., 2016). Overall, terrestrial photogrammetry has the advantages of being cost-effective, efficient, and easy to operate, and it also demonstrates good three-dimensional visualization capabilities, particularly in complex terrains (Iglhaut et al., 2019; Berra and Peppa, 2020). In this study, the proposed terrestrial photogrammetry system was first employed to capture images of rubber forests within sample plots, and software was used to transform the image data into a three-dimensional point-cloud reconstruction. The reconstructed models were then used to perform measurements for the sample plots, and the measurement accuracy of the terrestrial photogrammetry system was assessed by comparing the measured and actual values and identifying errors. Finally, a comprehensive investigation was conducted to further explore the applicability and practical significance of the terrestrial photogrammetry system in monitoring rubber forest sample plots.
2. Materials and methods
2.1. Overview of the study area
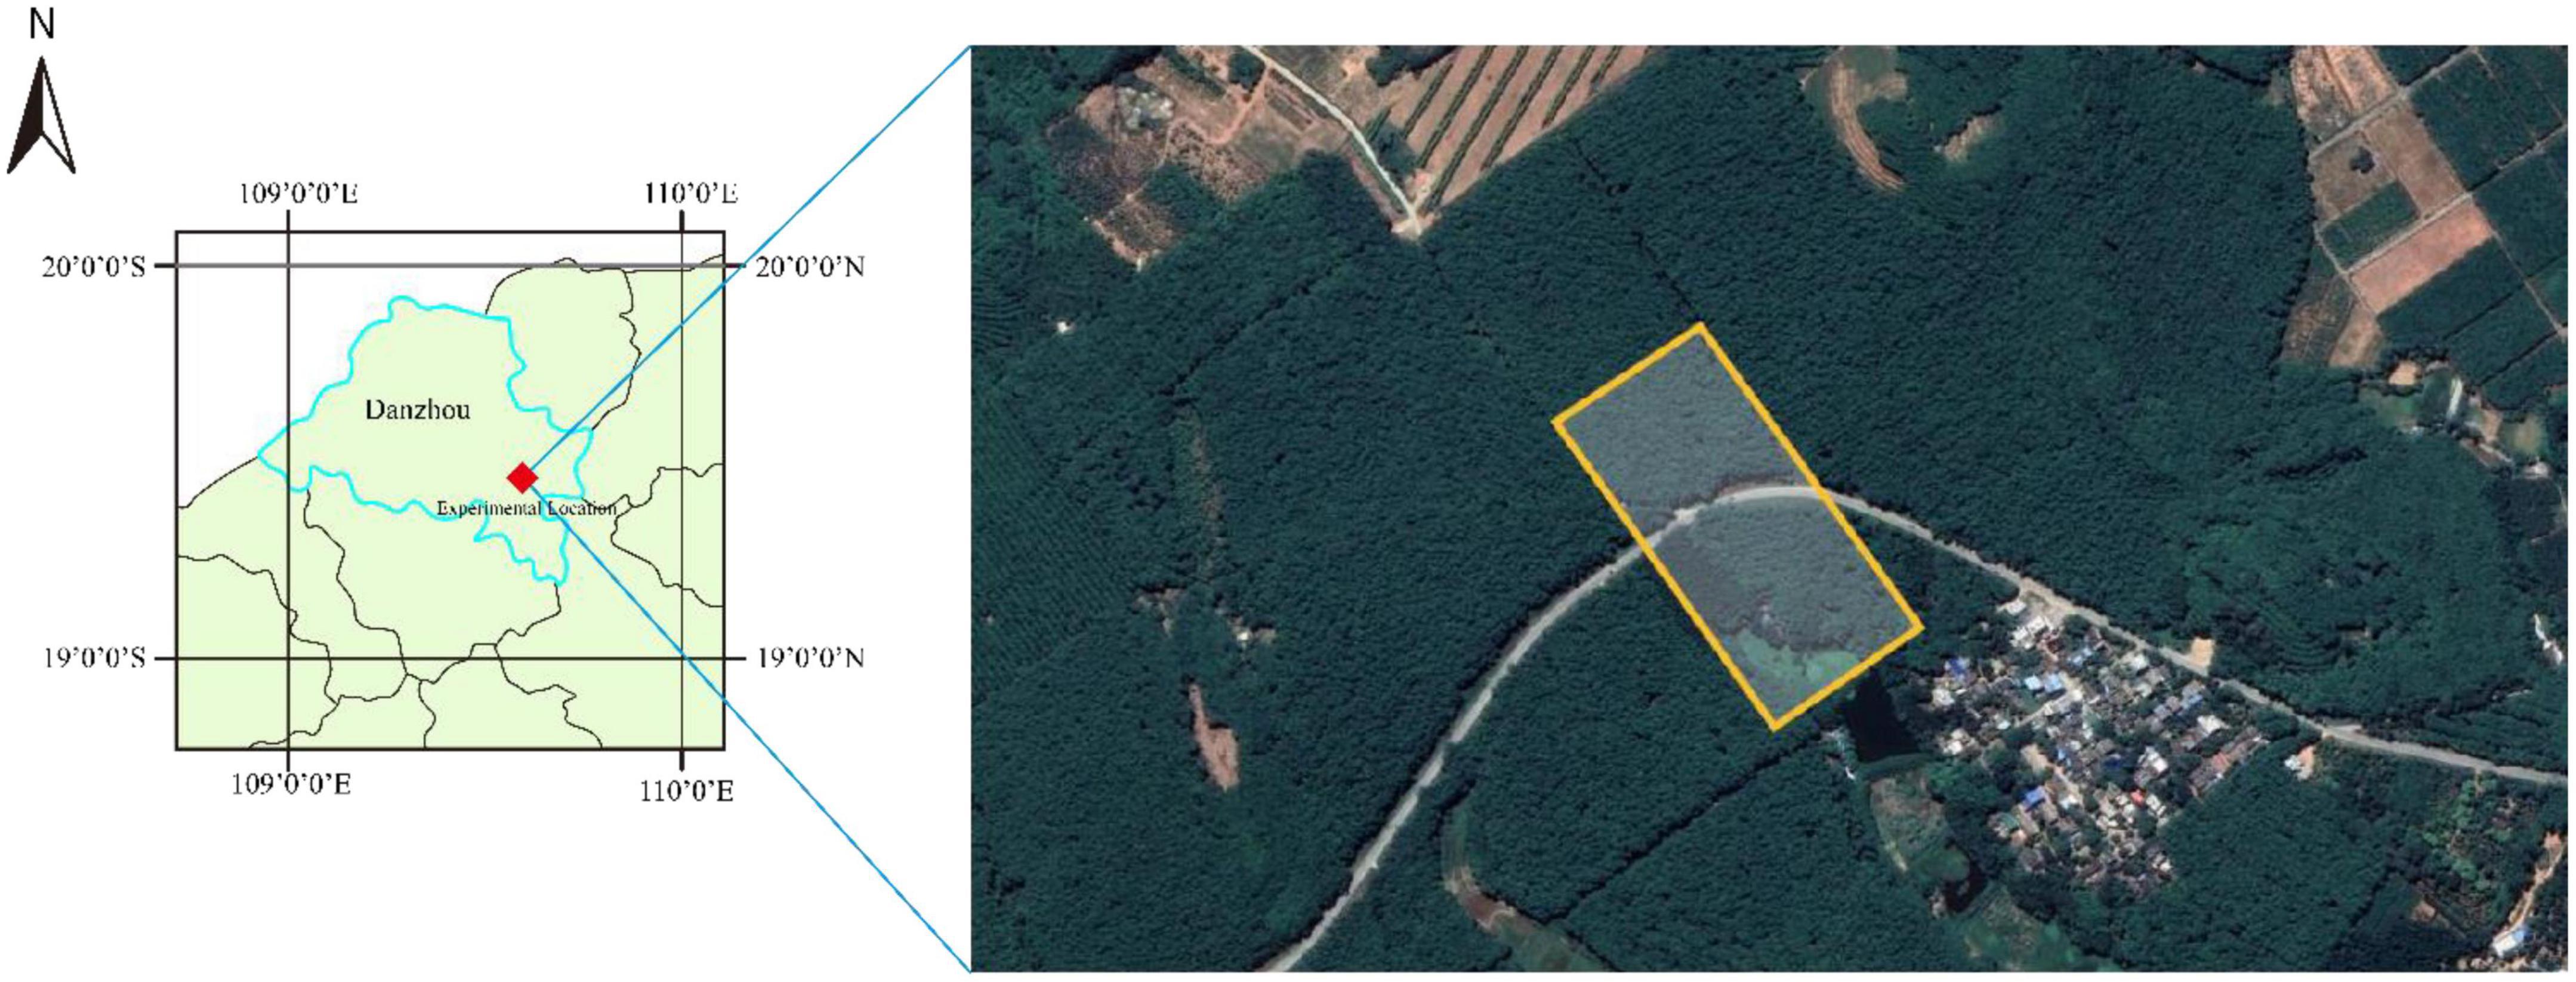
The study area (4500 m2) was located in Xiqing Farm, which is in the middle of Danzhou City, at latitude and longitude coordinates of 109°28′56″E–109°28′59″E and 19°31′14″N–19°31′18″N (Figure 2). Xiqing Farm is a state-owned farm enterprise affiliated with the Hainan Agricultural Reclamation Company, and it primarily focuses on the natural rubber industry and integrates agriculture, industry, commerce, construction, and transportation. In recent years, with the strong support of the government for developing tropical agriculture and forestry in Hainan Province, Xiqing Farm has been actively engaged in rubber forest cultivation, and the planting area has gradually expanded. However, owing to the remote location, complex environment, and large coverage area of the farm, manual monitoring methods are difficult to perform. Therefore, our objective was to develop a terrestrial photogrammetry system for monitoring rubber forest sample plots that would enable sustainable monitoring and yield assessments of rubber forests in the study area.
2.2. Composition of experimental equipment
2.2.1. Terrestrial photogrammetry system
The terrestrial photogrammetry system developed in this study consisted of a charge-coupled device (CCD) lens, a 3 m long leveling rod, and a real-time kinematic (RTK) mobile station. This system controlled the CCD lens and an RTK mobile station to obtain images using mobile software and image position information, respectively.
In this study, a SONY DSC-QX100 CCD lens (Sony Corporation, Japan) was used, and it was operated using PlayMemories Mobile software (Sony Corporation, Japan). This portable lens-type camera is specifically designed to deliver exceptional performance in outdoor photography and demonstrates advanced near-field communication (NFC) functionality. Its compact and lightweight engineering plastic construction enables effortless portability and adaptability to diverse environments, thereby optimizing field efficiency.
As a real-time dynamic measurement system, the RTK mobile station could dynamically provide 3D coordinates of the measurement station in the specified coordinate system in real time. The difference method is effective at eliminating most deviations, thereby ensuring high accuracy in the field, typically up to the centimeter level. In this study, the RTK of the South Galaxy 1Plus model was adopted, and it utilizes the LINUX operating system, which significantly enhances hardware responsiveness and signal reception capabilities. This station demonstrates reliable performance even in challenging weather and environmental conditions, and it can establish a connection with a handbook device for data recording using WIFI or Bluetooth functionality. This ensures real-time and accurate recording of coordinate information, thereby enhancing work efficiency.
Using the structure from motion with multi-view stereo (SfM-MVS) method, a computer was employed to generate 3D point-cloud reconstruction model of the rubber forest, 3D coordinate information of each rubber tree within the sampling field was obtained, and the DBH, first branch height, and volume were measured. Finally, a deviation analysis was performed to evaluate the practicality and accuracy of the terrestrial photogrammetry system in monitoring rubber forest sample plots.
2.2.2. Miscellaneous equipment
Furthermore, in this study, we measured DBH using a tree DBH tape. Moreover, we used time-of-flight (ToF) mobile phones equipped with a built-in RGB-D simultaneous localization and mapping (SLAM) algorithm to measure the first branch height of each rubber tree. These parameter values provided the reference values for the deviation analysis.
The tree DBH tape had two scales: circumference diameter and diameter. The measured diameter of the trunk 1.3 m above the ground could be taken as the actual value.
In Android smartphones based on Google Tango technology, the included ToF depth camera could estimate depth based on the principle of ToF, and it could be combined with an RGB camera to form an RGB-D camera, which could be a substitute for LiDAR to measure height. The SLAM algorithm is a real-time positioning and composition technology that can be used with the RGB-D camera to compile information on the surrounding unknown environment in real time after observing and acquiring images to estimate the relative pose of the system. In this study, the ToF mobile phone was used to measure the height of the first branch. The bias and RMSE values of the estimated average DBH were 0.33 and 1.26 cm, respectively, and those of the estimated average tree height were 0.15 and 1.11 m, respectively (Fan et al., 2018).
2.3. Principles of terrestrial photogrammetry technology
2.3.1. Principle of photogrammetry
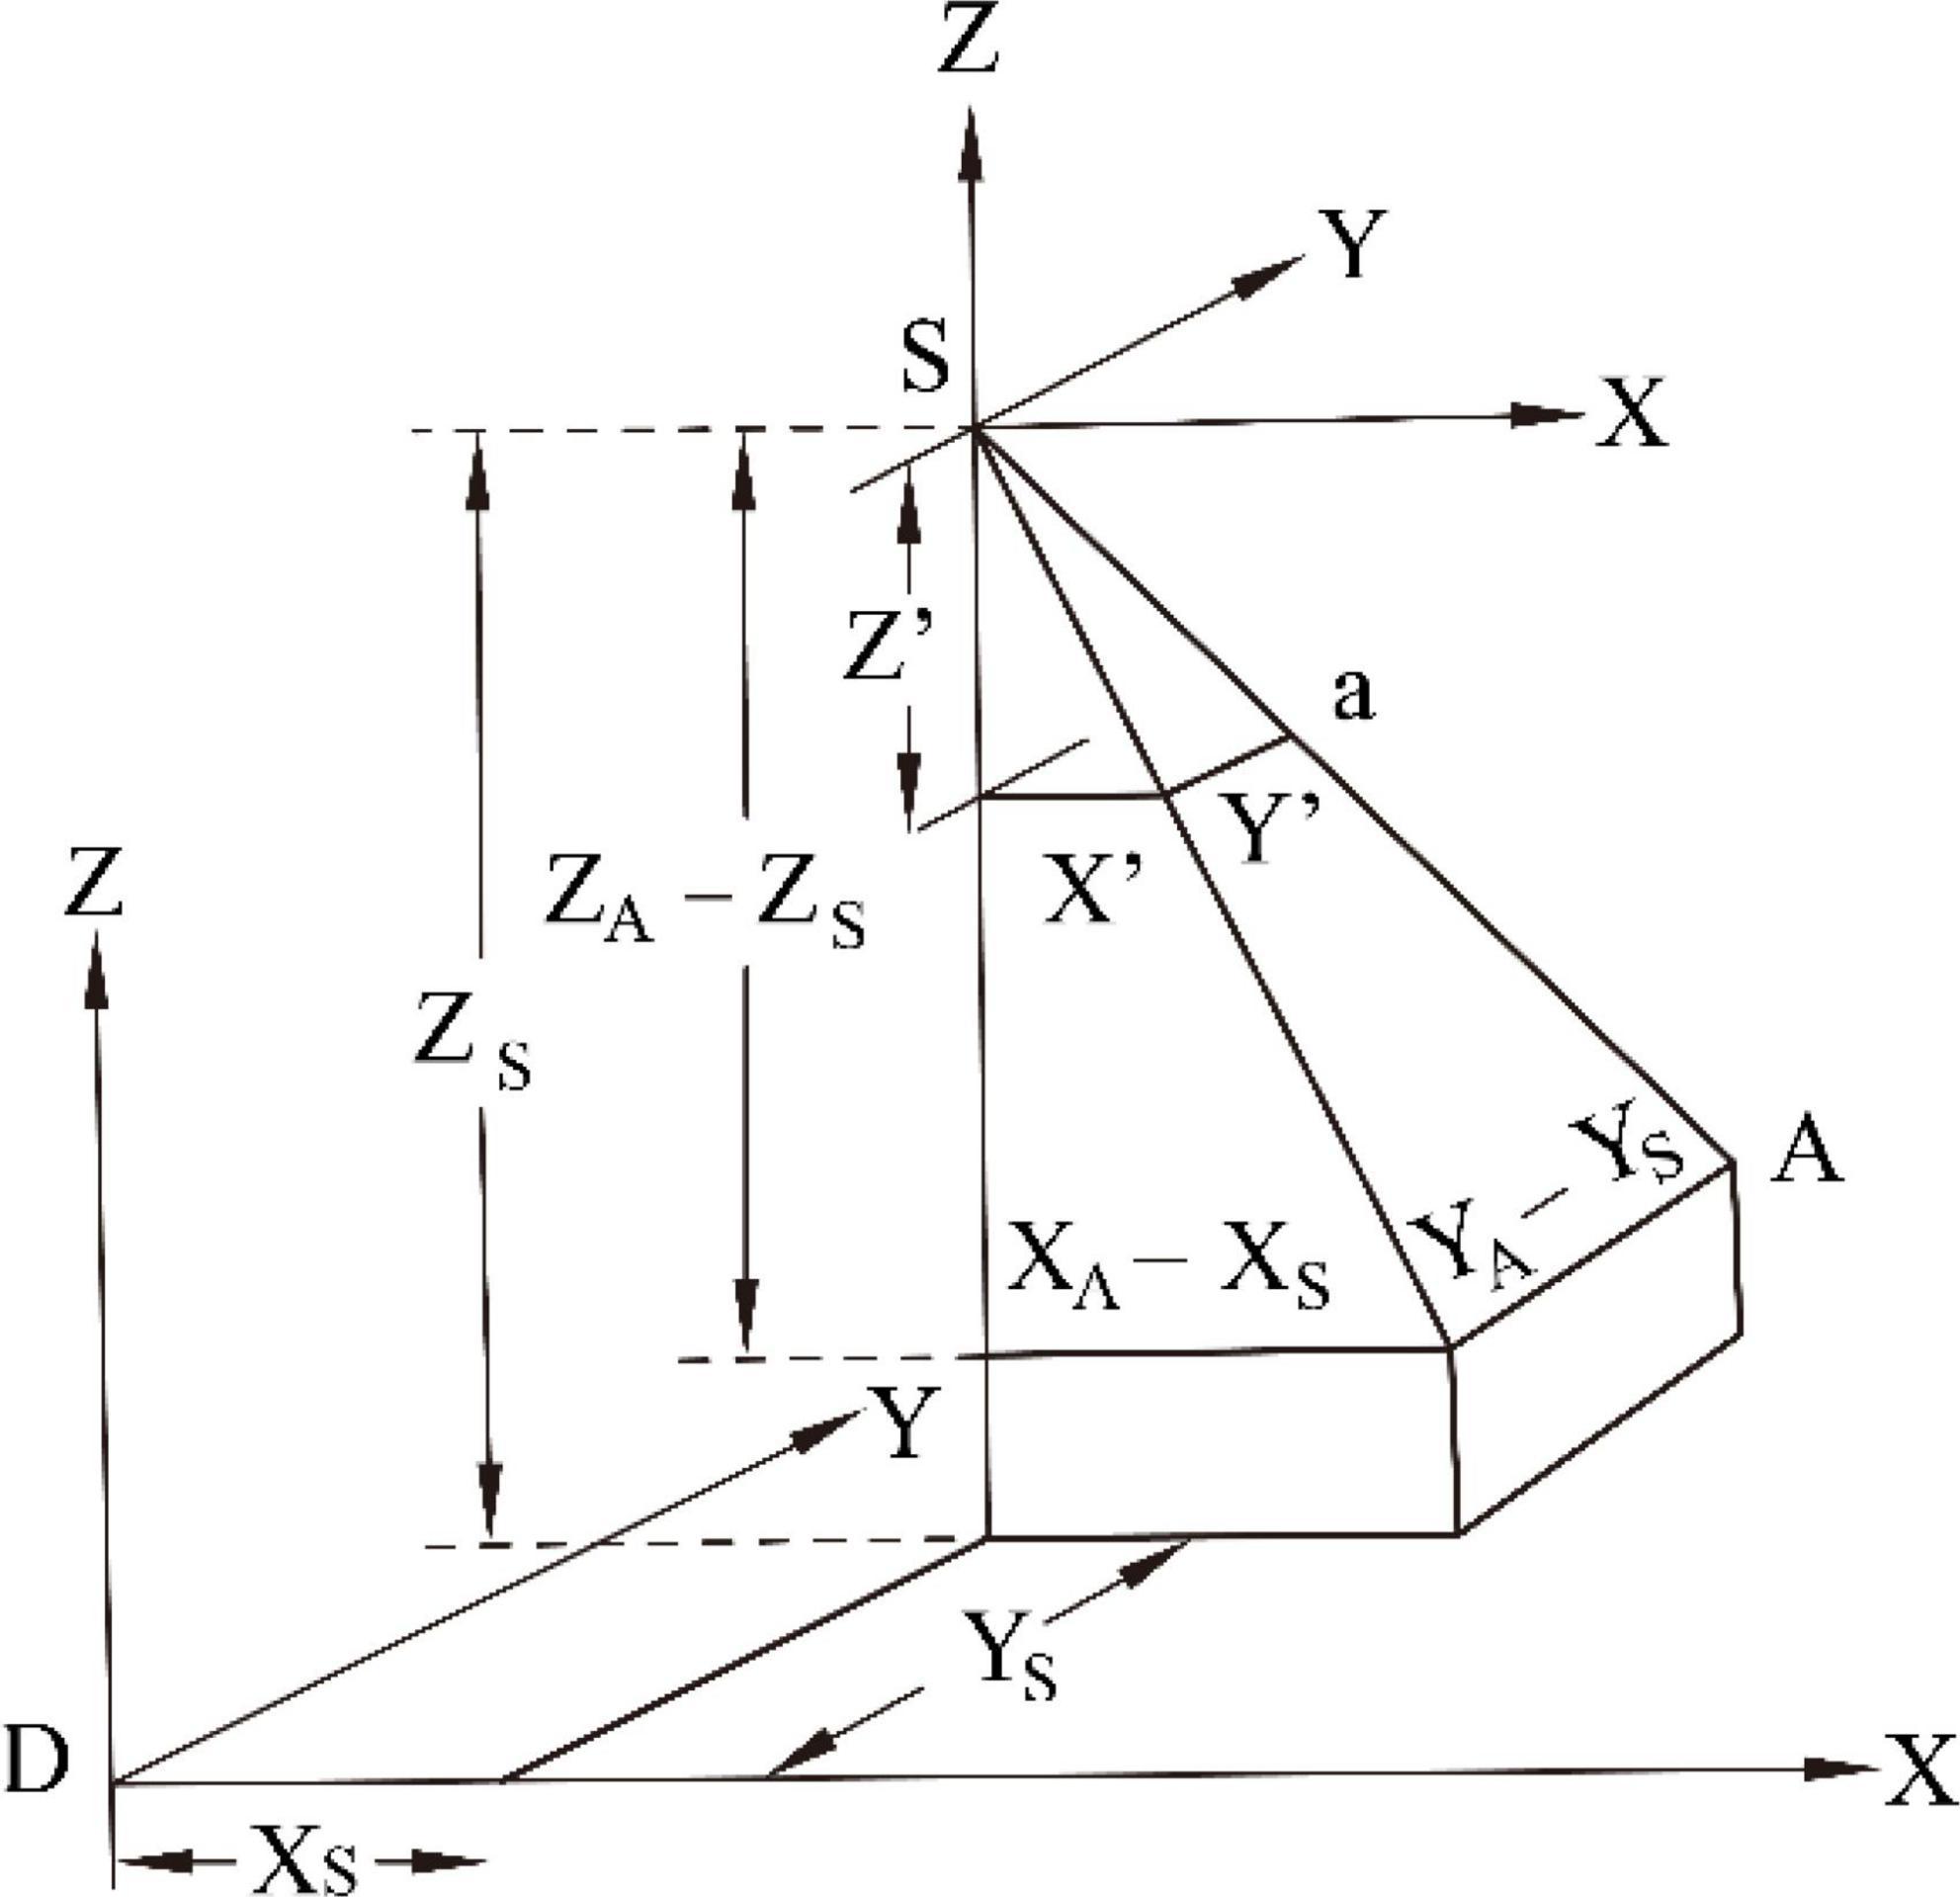
The center perspective projection model is the core principle of photogrammetry. The collinearity condition equation establishes the perspective projection relationship between an image and the object space, and it describes the optical center as being located on the same line as a point in the image. Moreover, a geometric relationship is established based on light as the space in the imaging process and the camera position in object space. This model has been applied to all types of photogrammetry algorithms and methods, including the single-image space rear intersection, multi-image space forward intersection algorithms, and the bundle adjustment method (Granshaw, 2010).
where x and y represent the image plane coordinates of a pixel; x0, y, and f are the internal orientation elements of the image; XS, YS, and ZS denote the object space coordinates of the camera station; XA, YA, and ZA represent the object space coordinates of the object point; and ai, bi, ci (i = 1, 2, 3) represent the nine direction cosines formed by the three exterior orientation angles of the image.
Figure 3 presents the central projection diagram. Equation 1 provides the general form of the collinear conditional equation that is commonly used in photogrammetry, which clearly expresses the corresponding image points of object point projection and describes the generation of internal camera images through the principle of central perspective projection (Bender, 1971).
2.3.2. Structure from motion and multi view stereo
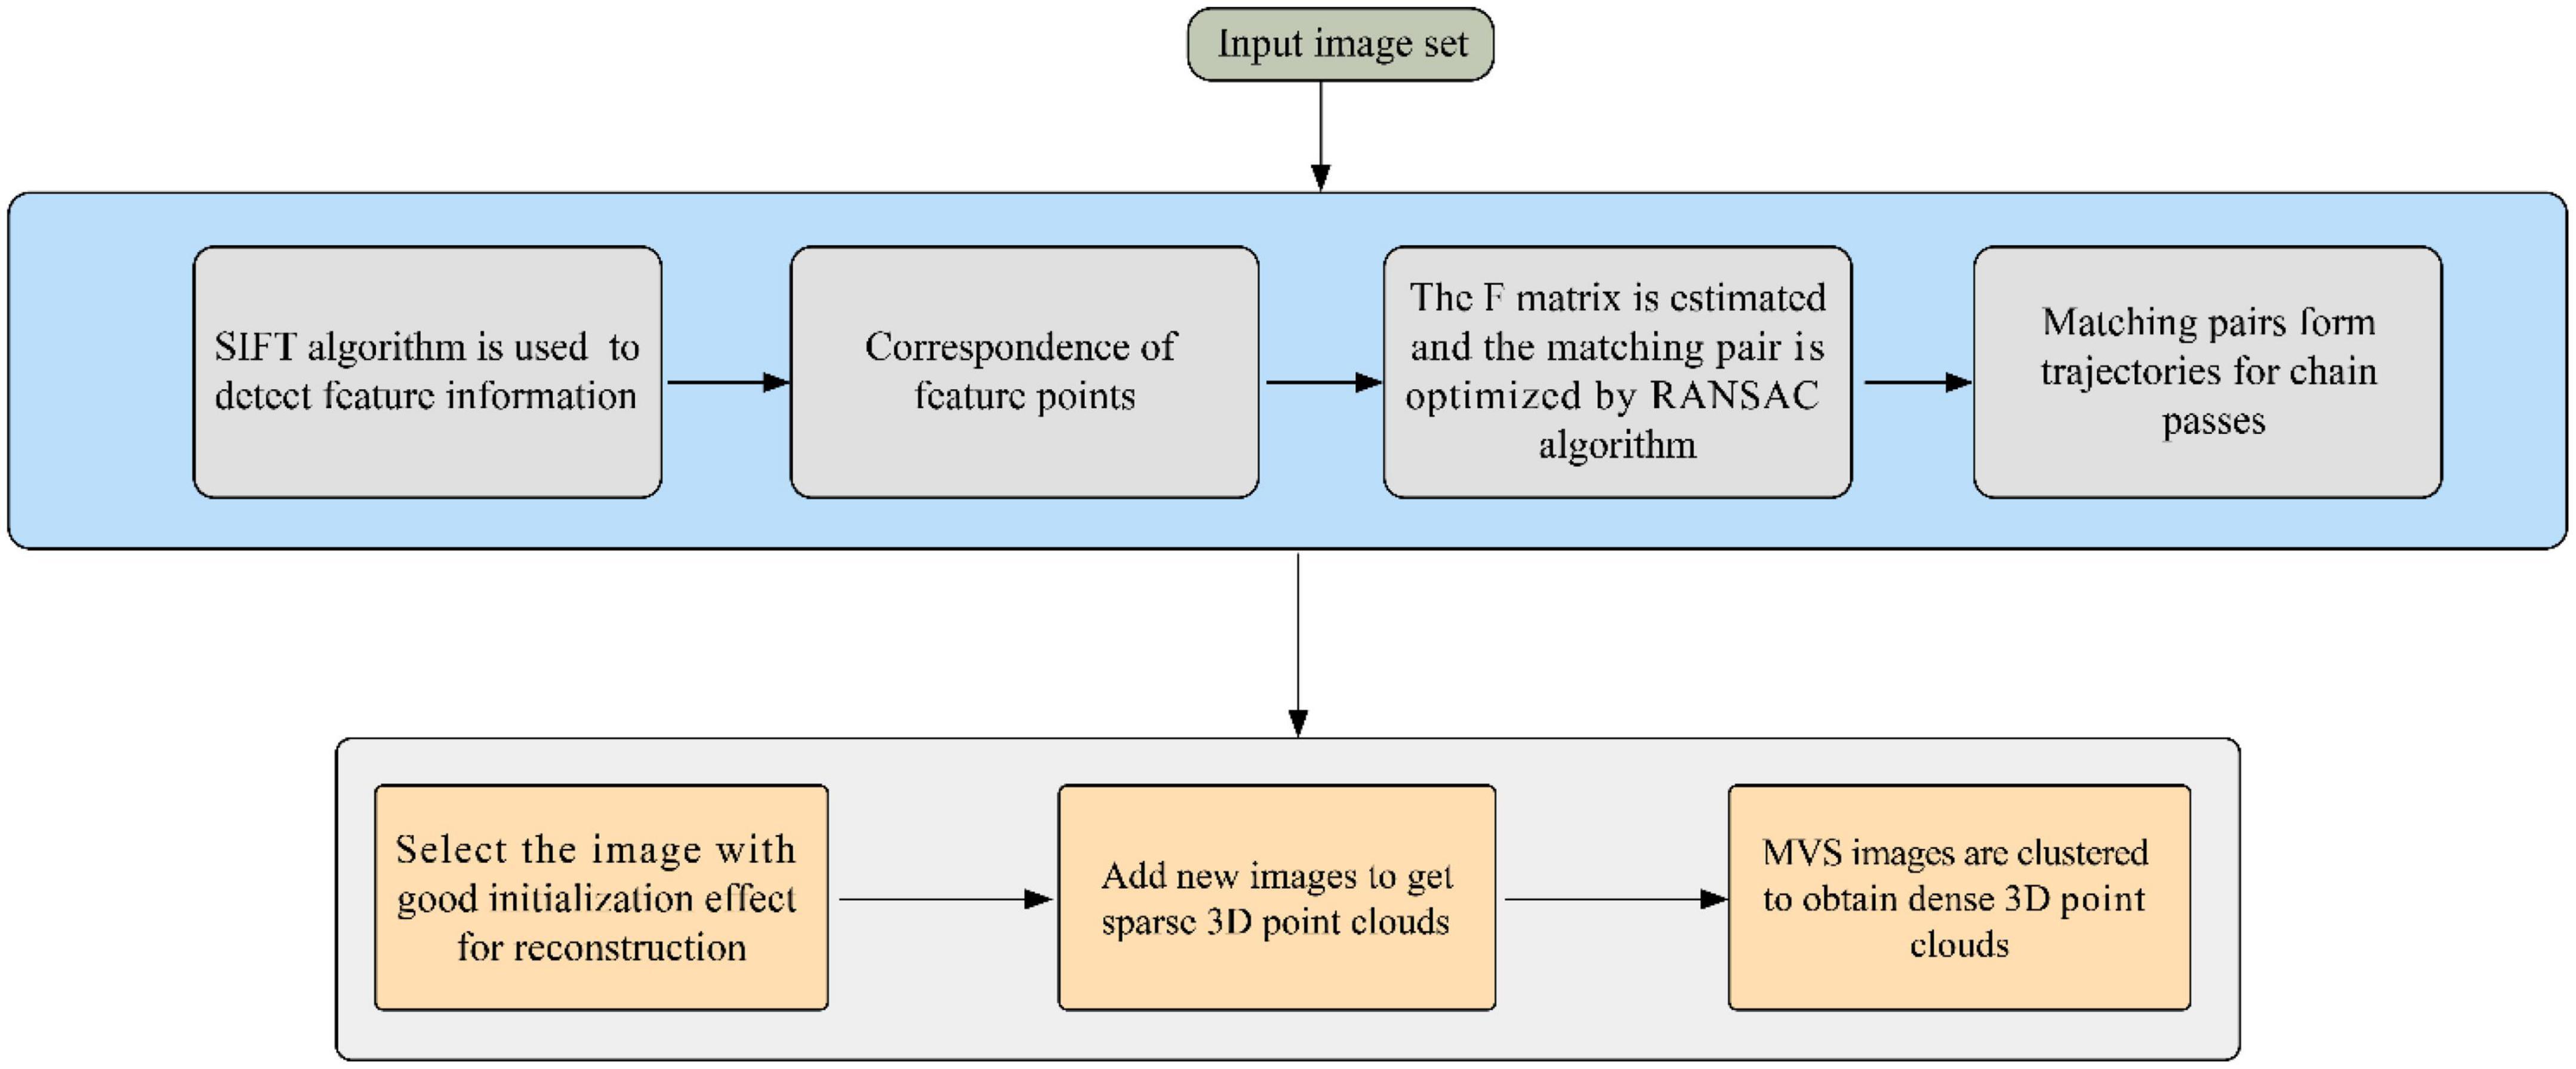
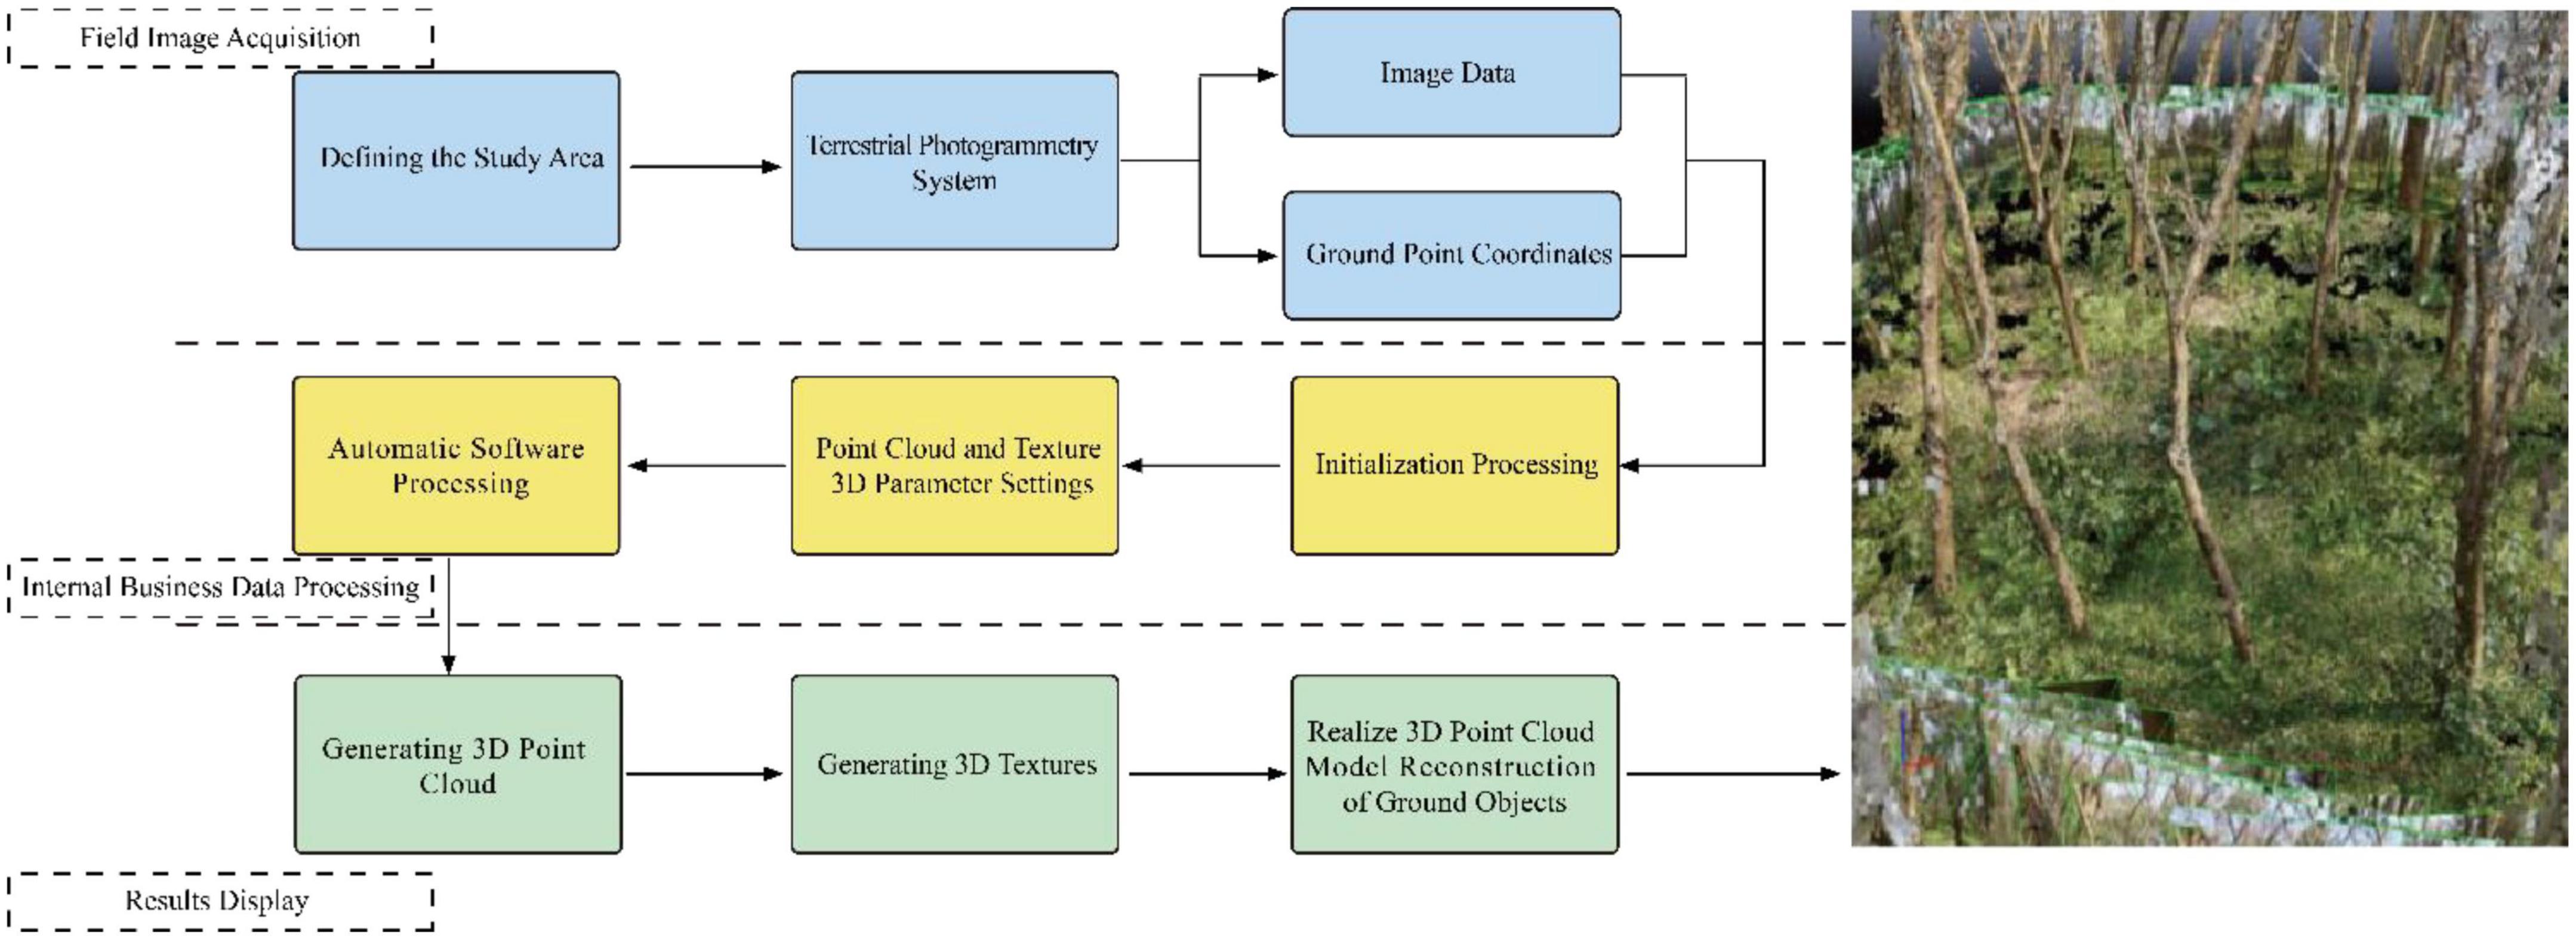
Terrestrial photogrammetry primarily obtains ground object information through a camera sensor attached to the ground system (Bolognesi et al., 2014) and provides a fast, real-time, and efficient survey method for forest resource investigation. SfM is a new topographic survey technology based on a combination of traditional photogrammetry and computer vision technologies that are widely used in surveying and mapping, remote sensing, and other similar fields. It primarily identifies the matched feature points in the overlapping image set by the algorithm and then calculates the position and direction of the camera by the difference amount (Wallace et al., 2016). An overlapping image set is used to establish the sparse point cloud of the research object. In this study, a 3D point-cloud reconstruction was performed using passive reconstruction (Ferreira et al., 2017). Sparse point clouds were generated from 2D images through the SfM principle, and dense point clouds were generated using the MVS method, which was further refined to obtain a high-resolution model (Nakano et al., 2014; Mali and Kuiry, 2018; Berra and Peppa, 2020; Bayati et al., 2021). A complete set of SfM was constructed based on the MVS algorithm (SfM-MVS) workflow (Figure 4).
The SfM-MVS workflow only requires overlapping image sets to reconstruct a 3D geomorphic model, thereby reducing the cost while ensuring that the accuracy and density of the data were similar those of TLS data. This process also generated a super-large-scale terrain model that is compatible with 3D point-cloud measurements of tree location information, DBH, and first branch height in the sample plot. A deviation analysis was conducted between the obtained data and the actual values to evaluate the practicality and accuracy of the system in monitoring the rubber forest sample plot.
2.4. Terrestrial photogrammetry process
2.4.1. Terrestrial photogrammetry of the rubber forest
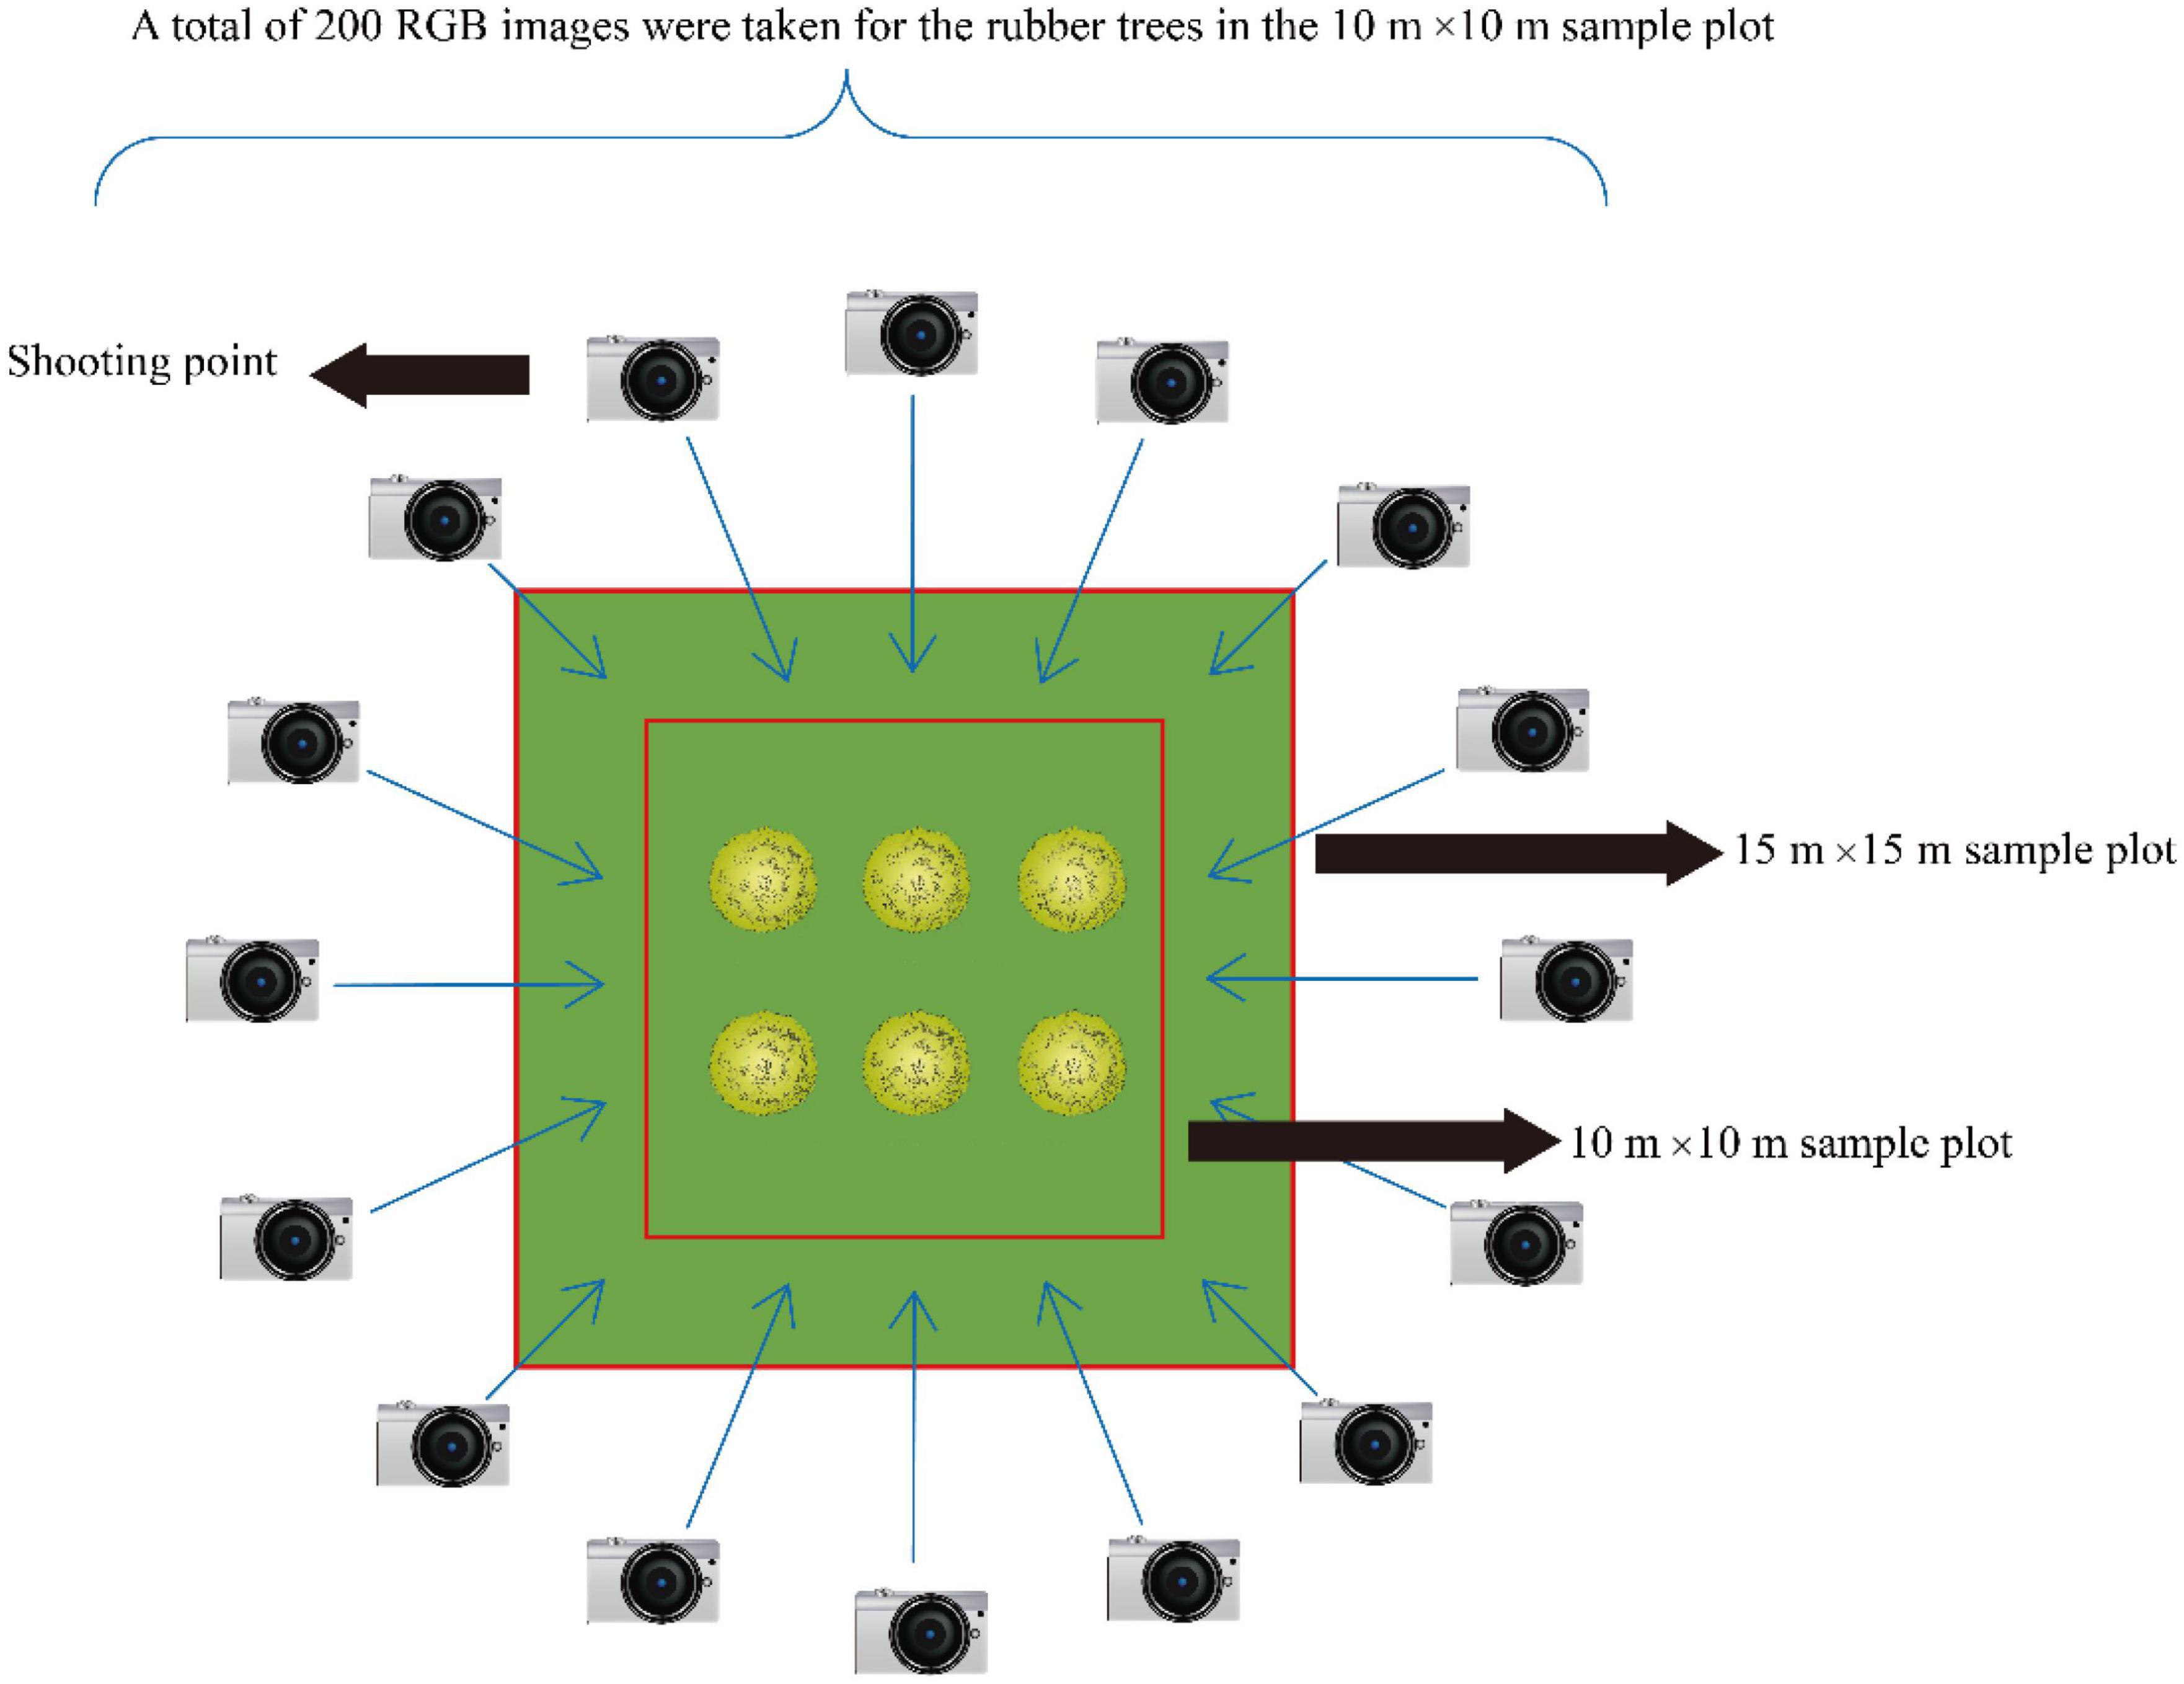
A rubber forest with relatively flat terrain was selected as the monitoring area. To divide the 15 m × 15 m sample plot by a sample plot marker with 15 and 10 m long lines, a 10 m × 10 m sample plot was established at the center of the sample plot and 19 nested sample plots were constructed. Furthermore, the ring structure photogrammetry method was used to photograph the quadrate information within an area of 10 m × 10 m at the outer cut dot position centered on the 15 m × 15 m sample plot. To ensure the reconstruction quality and accuracy of the sample plot model, approximately 200 RGB images were obtained from each sample plot (Figure 5). The terrestrial photogrammetry system developed in this study acquired 3765 RGB images from 19 rubber forest sample plots through non-contact measurements.
2.4.2. Measurement of first branch height and DBH
In this study, DBH was measured using a tree DBH tape while the first branch height of each rubber tree was measured using a ToF mobile phone with a built-in RGB-D SLAM algorithm. These parameters provided the reference values for the deviation analyses.
A ToF mobile phone equipped with a built-in RGB-D SLAM algorithm was used to measure the first branch height using the single wood tree height measurement function, and a vertical line was automatically generated after clicking on the position of the ground on the phone screen. When determining the first branch height in the field and moving the camera backward, the branch point of the trunk was displayed on the screen. The branch point was clicked to determine the automatic measurement of the first branch height, which was the actual value. In this study, the first branch height, which refers to the height of the first living branch in the crown starting from the ground level, was measured. To minimize measurement deviations in the first branch height, efforts were made to keep the horizontal position of the mobile phone as fixed as possible during movement. When the first branch height was less than 5 m, the height was directly measured by reading the leveling rod.
2.4.3. 3D Point-cloud reconstruction and measurement based on the SfM-MVS method
In this study, the acquired RGB images were processed using Pix4D Mapper, which is modeling software developed by the Swiss Pix4D company. This program processes several imported images using the embedded SfM method to generate high-resolution 3D models and obtains the appearance, shape, and feature information of real scenes, and it has the advantages of high precision, automation, and speed. The specific steps of reconstruction were as follows: (1) acquiring field images; (2) importing and setting the image attributes; (3) selecting the output coordinate systems as WGS84 to generate a raster DSM and orthophoto map (DOM); and (4) generating a quality report after automatic processing by the software and performing 3D model reconstruction of ground objects (Figure 6). Then, in the point-cloud model, the coordinate values were obtained by clicking the images at the ground diameter and branch and the difference between the coordinates of the two points on the Y-axis was calculated to obtain the measured value of the height under the branch. The image was clicked on the left and right ends of the trunk to obtain the coordinate value. Equation 2 was used to calculate the distance between the two points to obtain the DBH measurement value. In the calculation process, consistency was ensured between the center position of the picture and the real position to minimize the deviation.
where |AB| is the distance between the left and right ends of the trunk and represents the DBH and (x1, y1) and (x2, y2) are the two-point coordinates.
2.5. Construction of the standard volume model for rubber trees
The forest growing stock volume refers to the total volume of standing timber in the forest and is an index used to measure forest resources. Standing timber volume is the basis for forest resource and sustainable management. The rubber tree standard volume model, as a tool to estimate the volume of individual rubber trees, is also a basis for quantitatively estimating the forest growing stock volume. The rubber tree standard volume model developed in this study adopted the Yamamoto volume formula as the basic equation because it better reflects the change law of DBH and first branch height. Moreover, this model has good applicability and high precision in forestry investigation. The volume change depended on the parameter changes with DBH and first branch height, as shown in Equation 3.
where V is the volume, D is the measured value of the DBH point cloud, H is the measured value of the first branch height point cloud, and A, B, and C are model parameters.
First, we utilized the point cloud clipping function in Pix4D Mapper software to trim the reconstructed three-dimensional point cloud model of rubber trees, and only the main trunks and branches were retained. The resulting trimmed three-dimensional point cloud model of the rubber trees was then exported. Subsequently, we imported the rubber tree’s three-dimensional point cloud model into ArcMap software (Environmental Systems Research Institute, Redlands, CA, USA) and used the mask extraction tool to extract the planar projection image of the rubber plantation plot. We then imported the planar projection image of the rubber plantation plot into ENVI software (ITT Visual Information Solutions, Circle Boulder, CO, USA) and applied the grayscale segmentation tool to extract the ground projection image of the rubber trees by removing ground points. This image was subsequently re-imported into ArcMap to calculate the ground projection area of the rubber trees and determine the first branch height. Finally, we imported the ground projection image of the rubber trees and the three-dimensional point cloud model of the rubber plantation into ArcGIS Pro software (Environmental Systems Research Institute) to sequentially measure the DBH of each rubber tree within the plot and calculate the volume, thereby obtaining the material volume value for each individual tree. After obtaining the DBH, first branch height, and volume values for the rubber trees, we performed nonlinear fitting using IBM SPSS Statistics 26 software (IBM International Business Machines Corporation) and calculated the coefficient of determination (R2) for the fitting.
2.6. Principle of deviation analysis
In this study, a terrestrial photogrammetry system was used to obtain DBH and the first branch height data for rubber trees. The accuracy of the 3D point-cloud measurement results was dependent on the quality of the point-cloud model and the measurement method of the point-cloud model. The DBH and first branch height data of 119 rubber trees were integrated and input into Origin mapping software (Origin Lab, Northampton, Massachusetts, USA) for linear fitting, and a scatter sample plot of DBH and first branch height was obtained. By examining the scatter plot, we can directly observe the data accuracy. Simultaneously, the accuracy evaluation performed in this study included the parameters bias, relative bias, RMSE, RRMSE, and R2 to verify the accuracy. The specific calculation methods are shown in Equations 4–8:
where yi is the measured value, yri is the actual value, yr is the average of the actual values, and n is the total number of sample plots.
3. Results
3.1. 3D Point-cloud reconstruction results
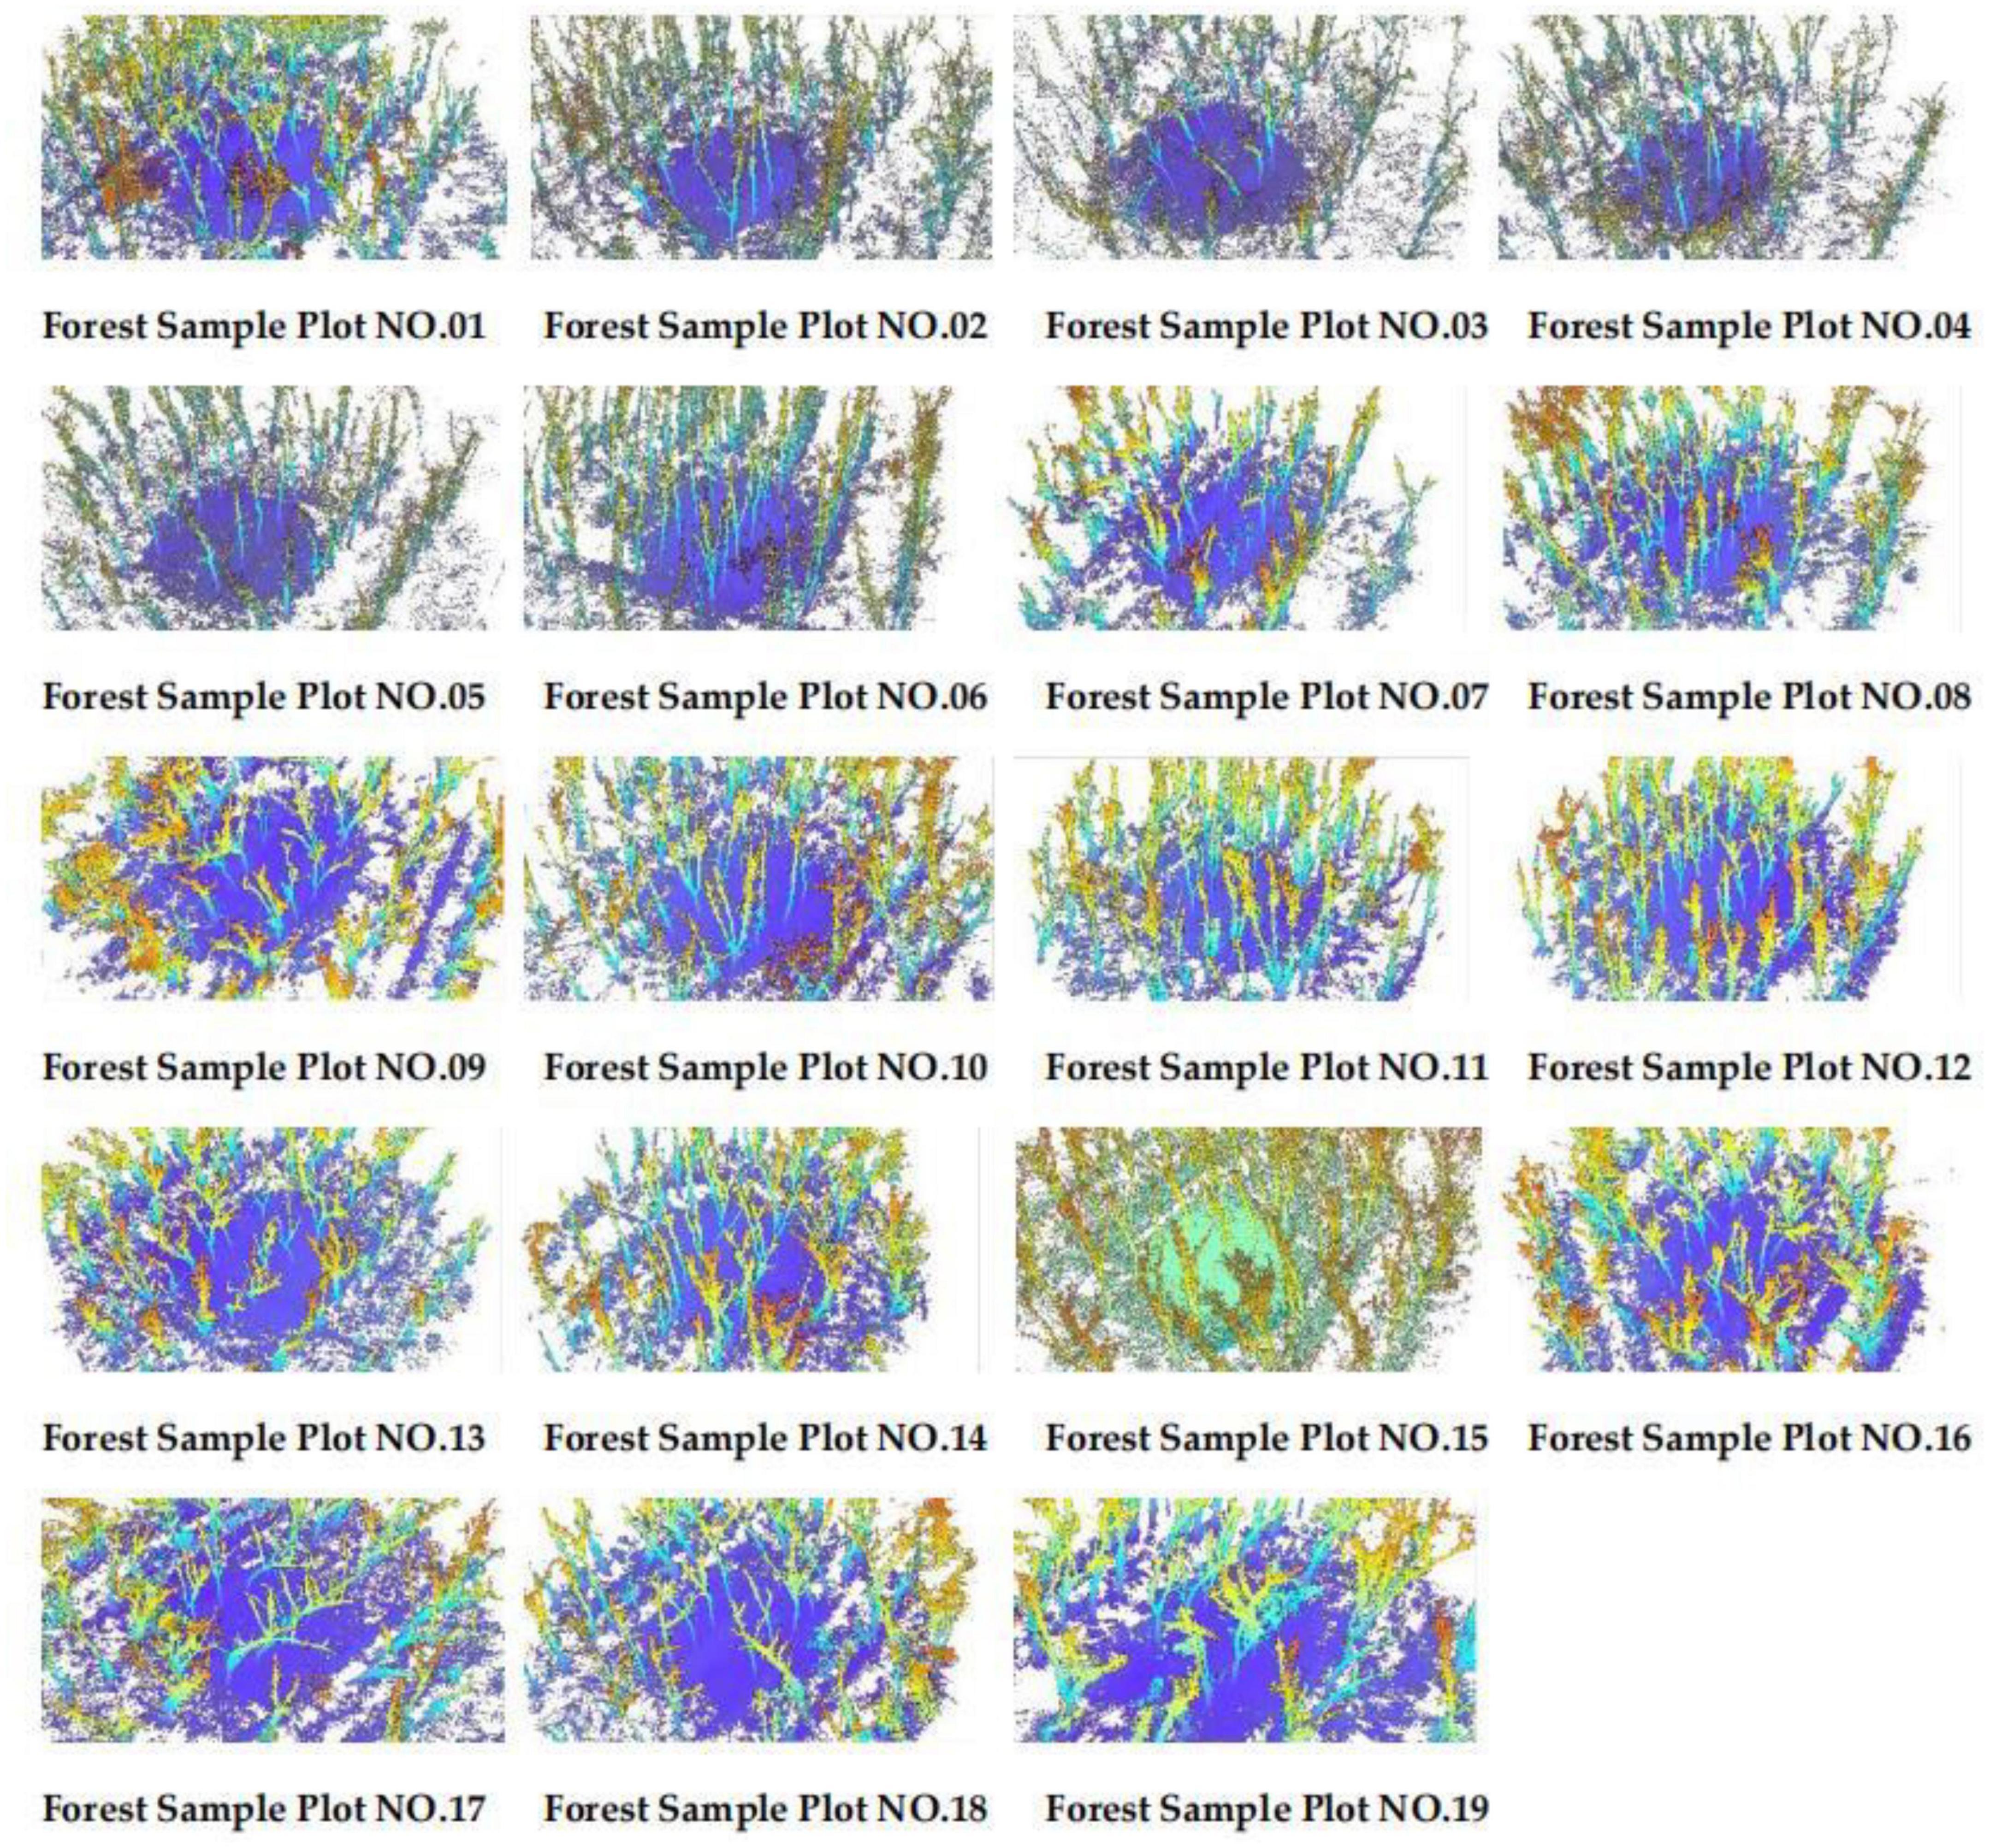
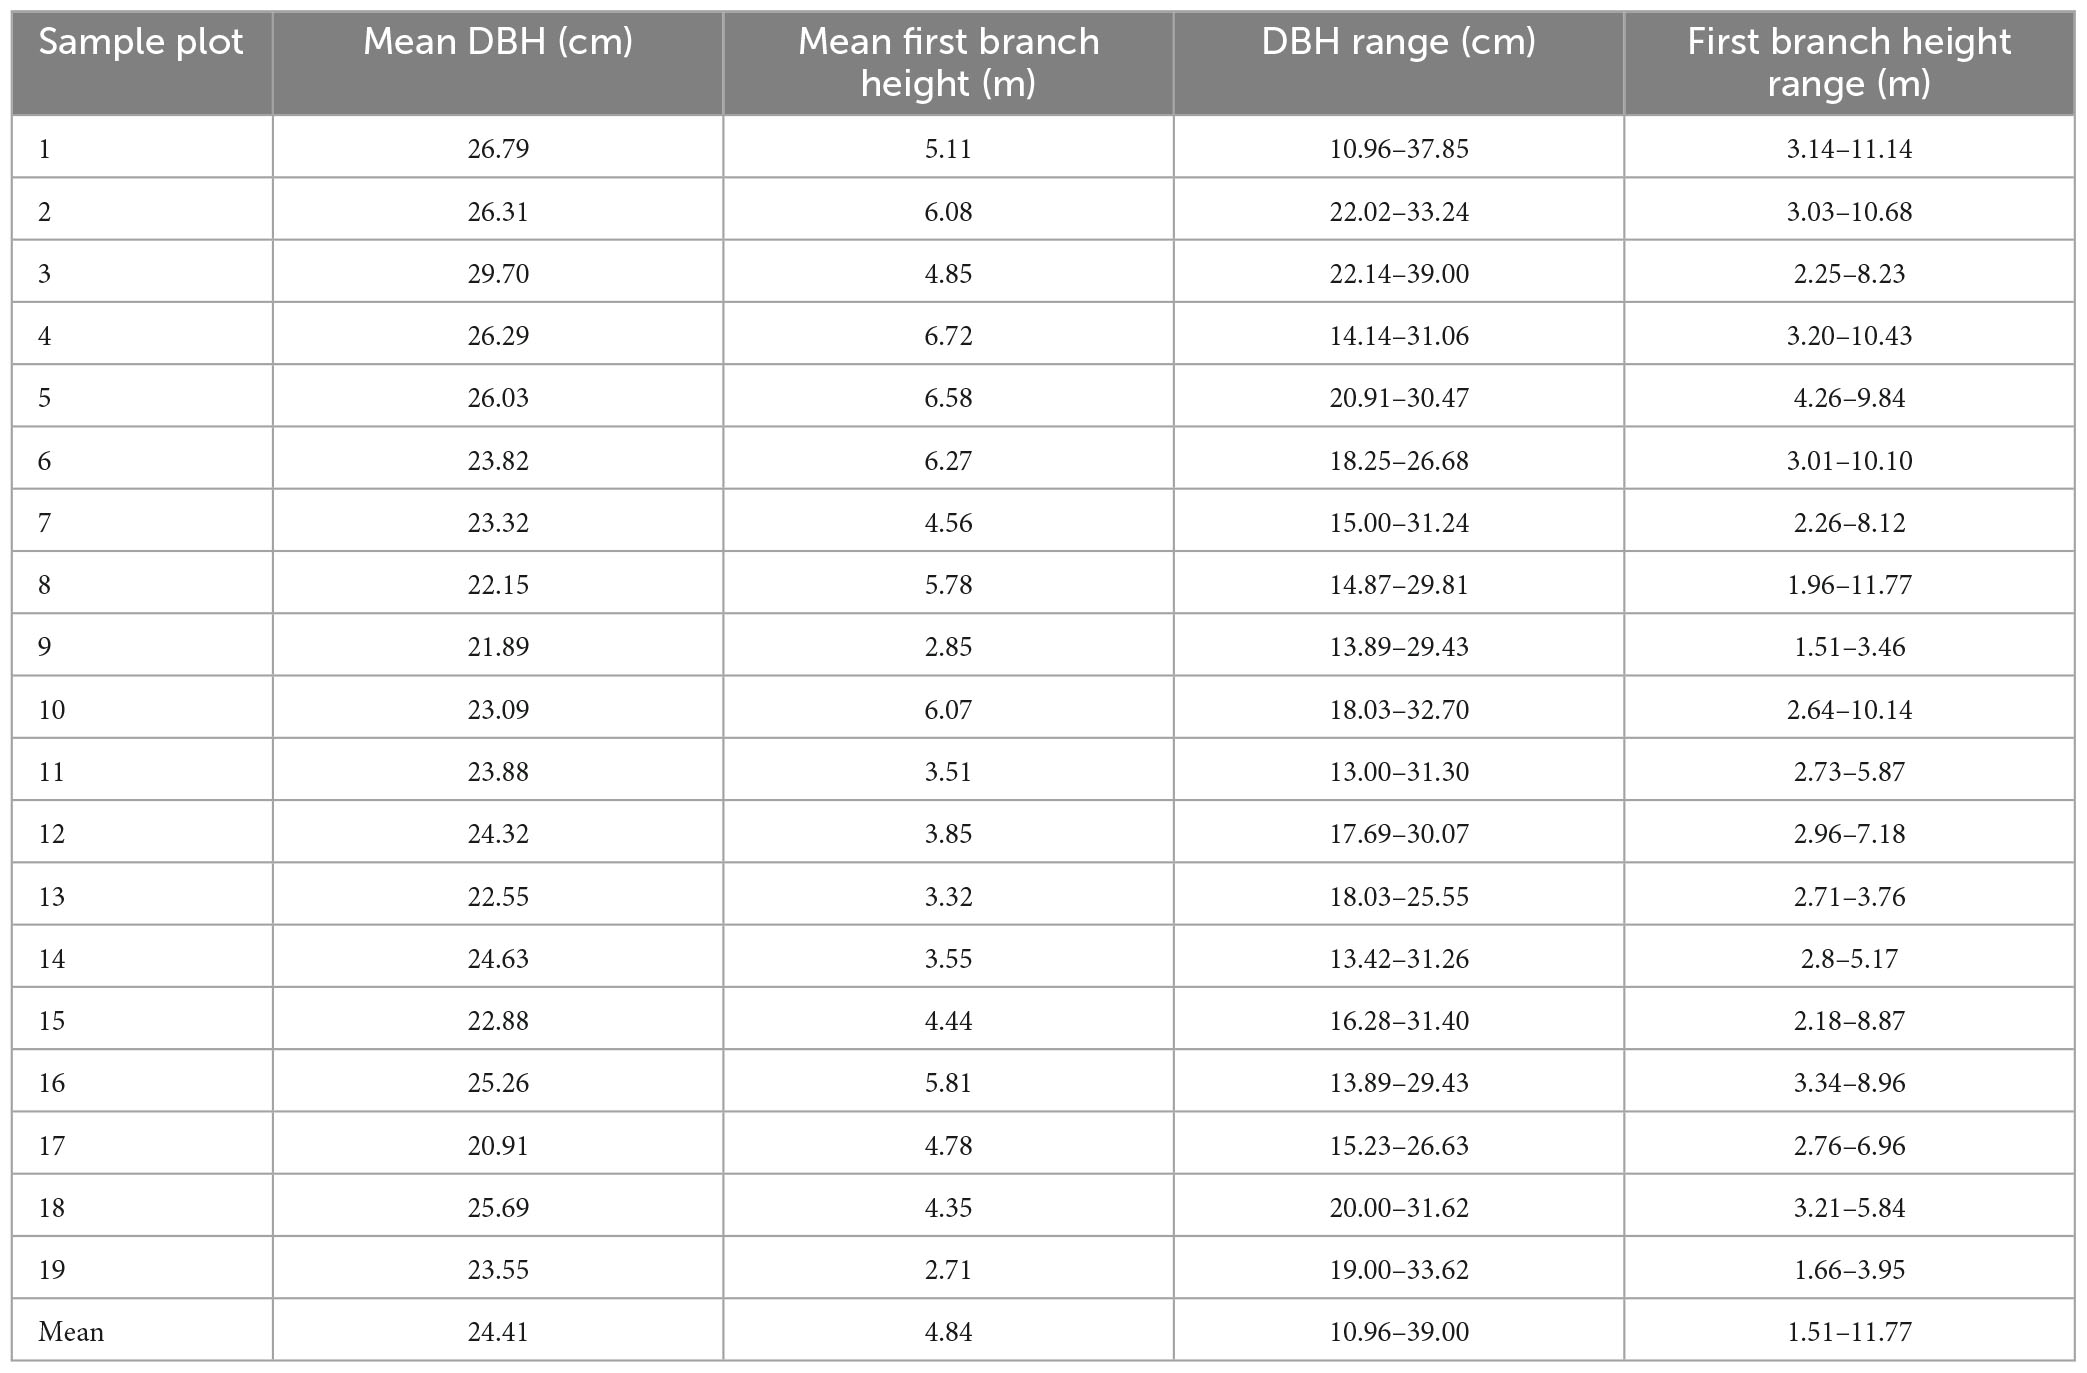
In total, 3,765 images were imported using the Pix4D Mapper software, and 3D point-cloud reconstruction was performed on the research object based on the original two-dimensional images (Figure 7). The quality report showed that the average relative difference between the initial and optimized internal camera parameters was 10.6%; average number of point clouds and average density of point clouds were 8897295 and 31341/m3, respectively; and average adjustment deviation of the combined beam method was 0.22 pixels. Furthermore, the measurement function of the Pix4D Mapper was used to measure the first branch height and DBH of rubber trees in the sample plot, and the results are provided in Tables 1, 2.
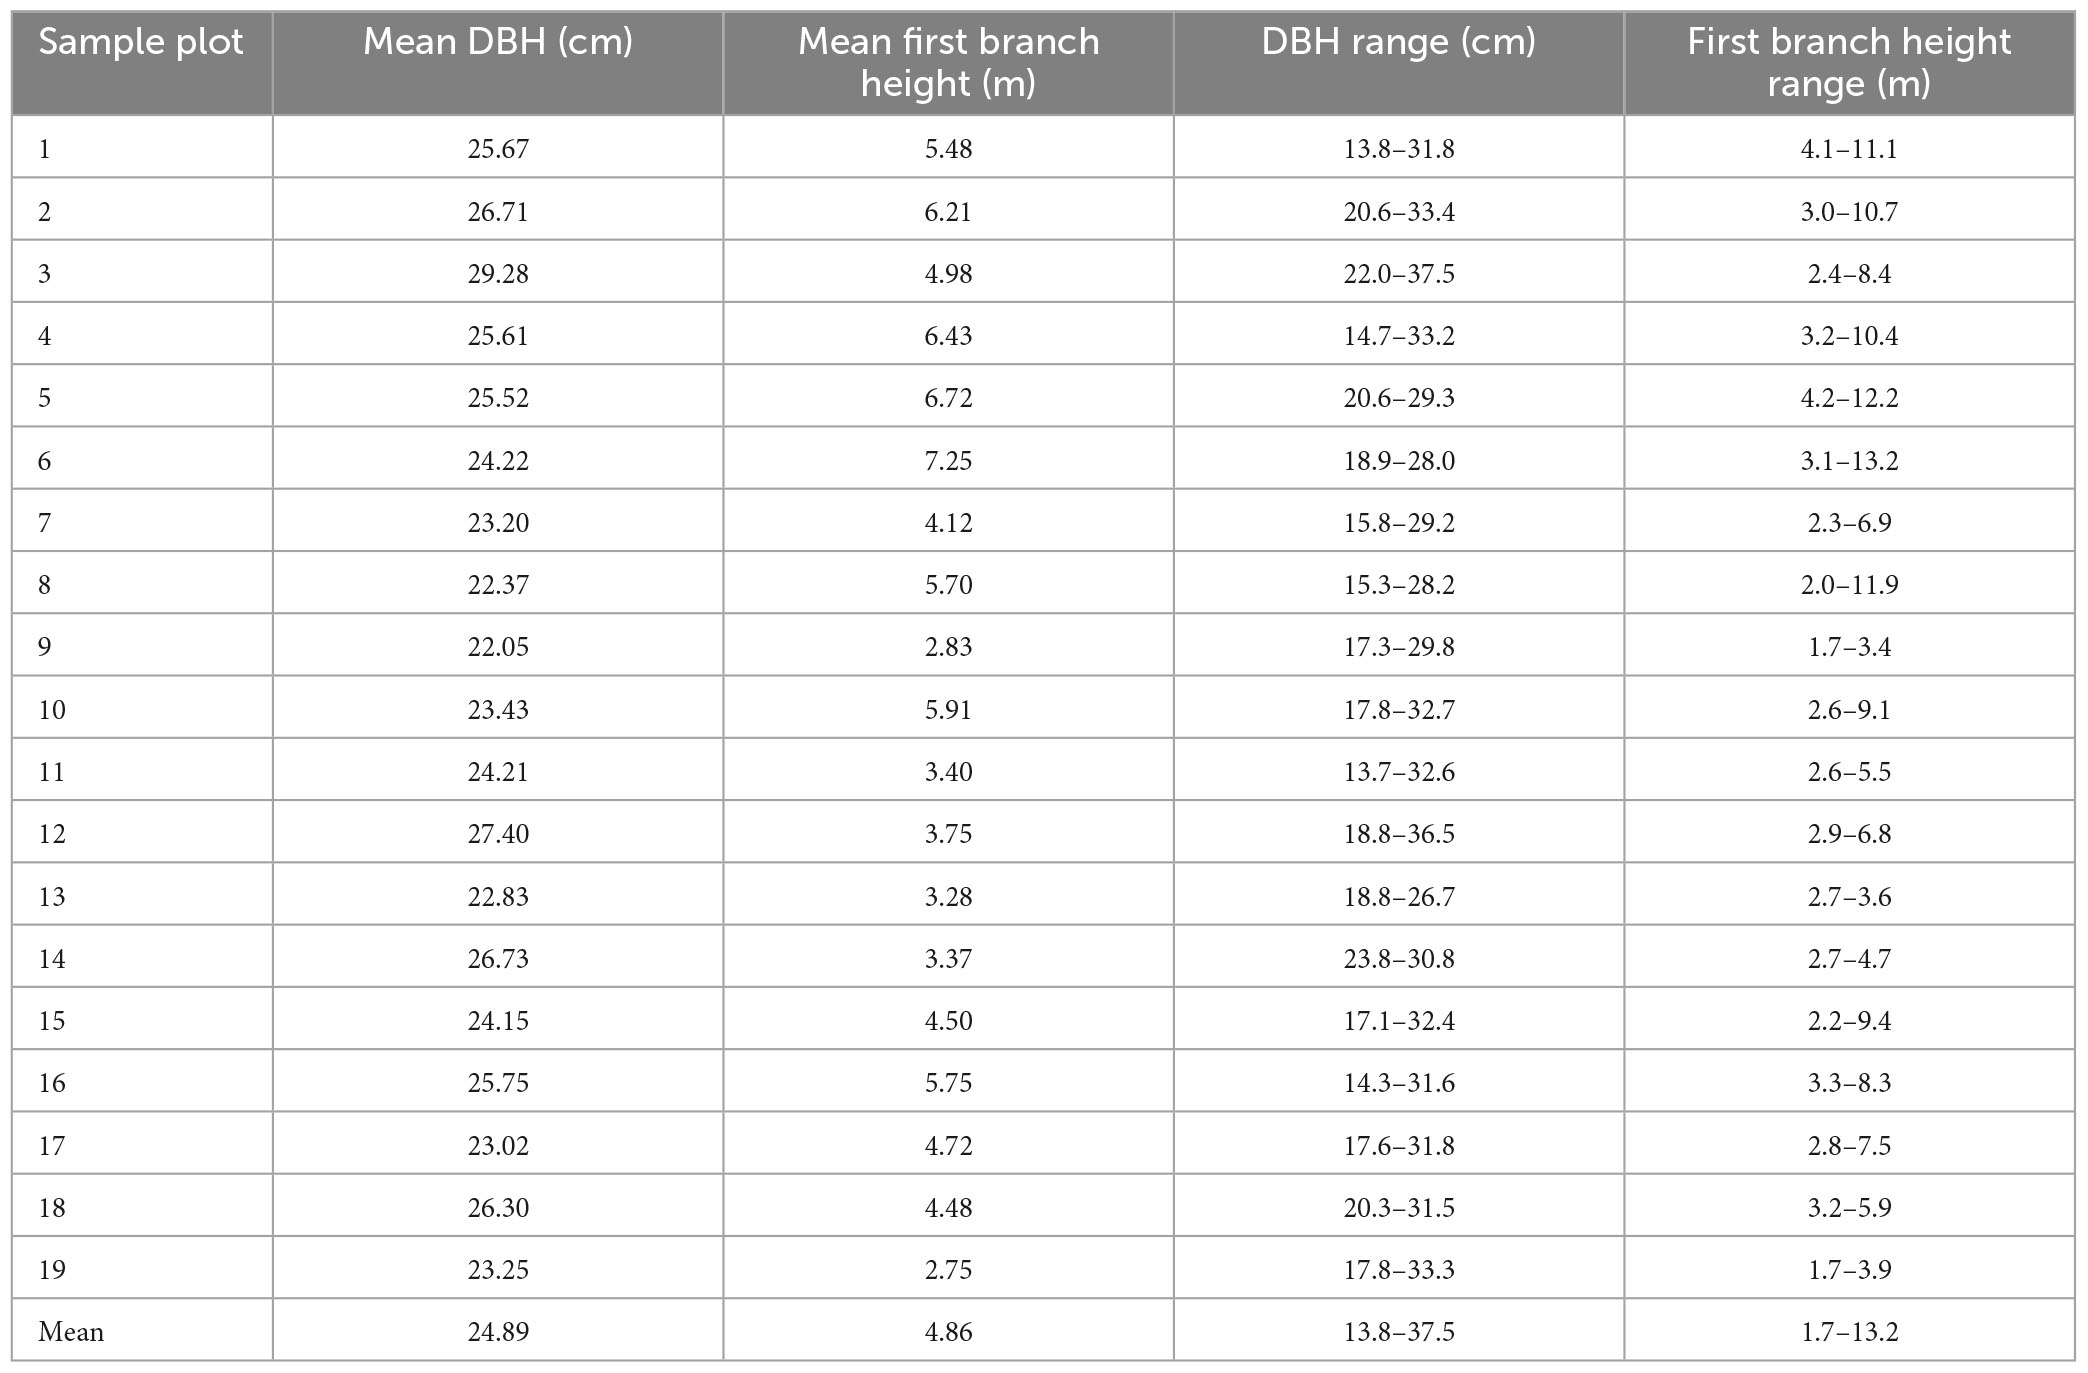
As presented in Table 1, the average first branch height and DBH of the rubber forest were 4.84 m and 24.41 cm, respectively, while the total DBH and first branch height were 10.96–39.00 cm and 1.51–11.77 m, respectively. These results indicated that the overall growth status of the rubber trees in the study area was uneven and the degree of dispersion of DBH and first branch height was large, which was possibly due to the comprehensive influence of the geographical environment, light conditions, and human factors. As shown in Table 2, the average overall first branch height and DBH values in the rubber forest were 4.86 m and 24.89 cm, respectively, which did not show a remarkable deviation from the 3D point-cloud measurement results. A comparison of the 3D point-cloud measurements with field measurements showed that the average DBH deviations of trees in sample plots 7, 8, and 9 were relatively small at 0.118, −0.219, and −0.161 cm, respectively, and the overall average deviation was approximately 0.787 cm. The differences in the average first branch height in sample plots 9, 13, and 19 were 0.013, 0.038, and −0.040 m, respectively, and the overall average deviation was approximately 0.2 m, the accuracy of these sample plots was among the top three for all sample plots. The results showed that the 3D reconstruction results of the above sample plots were relatively good, the shooting process was less affected by other factors, and accurate values could be obtained. The differences in average DBH in sample plots 12, 14, and 17 were −3.082, −2.102, and −2.105 cm, respectively, while the differences in average first branch height in sample plots 1, 6, and 7 were −0.378, −0.985, and 0.439 m, respectively. The large difference values obtained for the above areas may have been caused by unclear images, which resulted in poor reconstruction results.
3.2. DBH and height of first branch deviation analysis
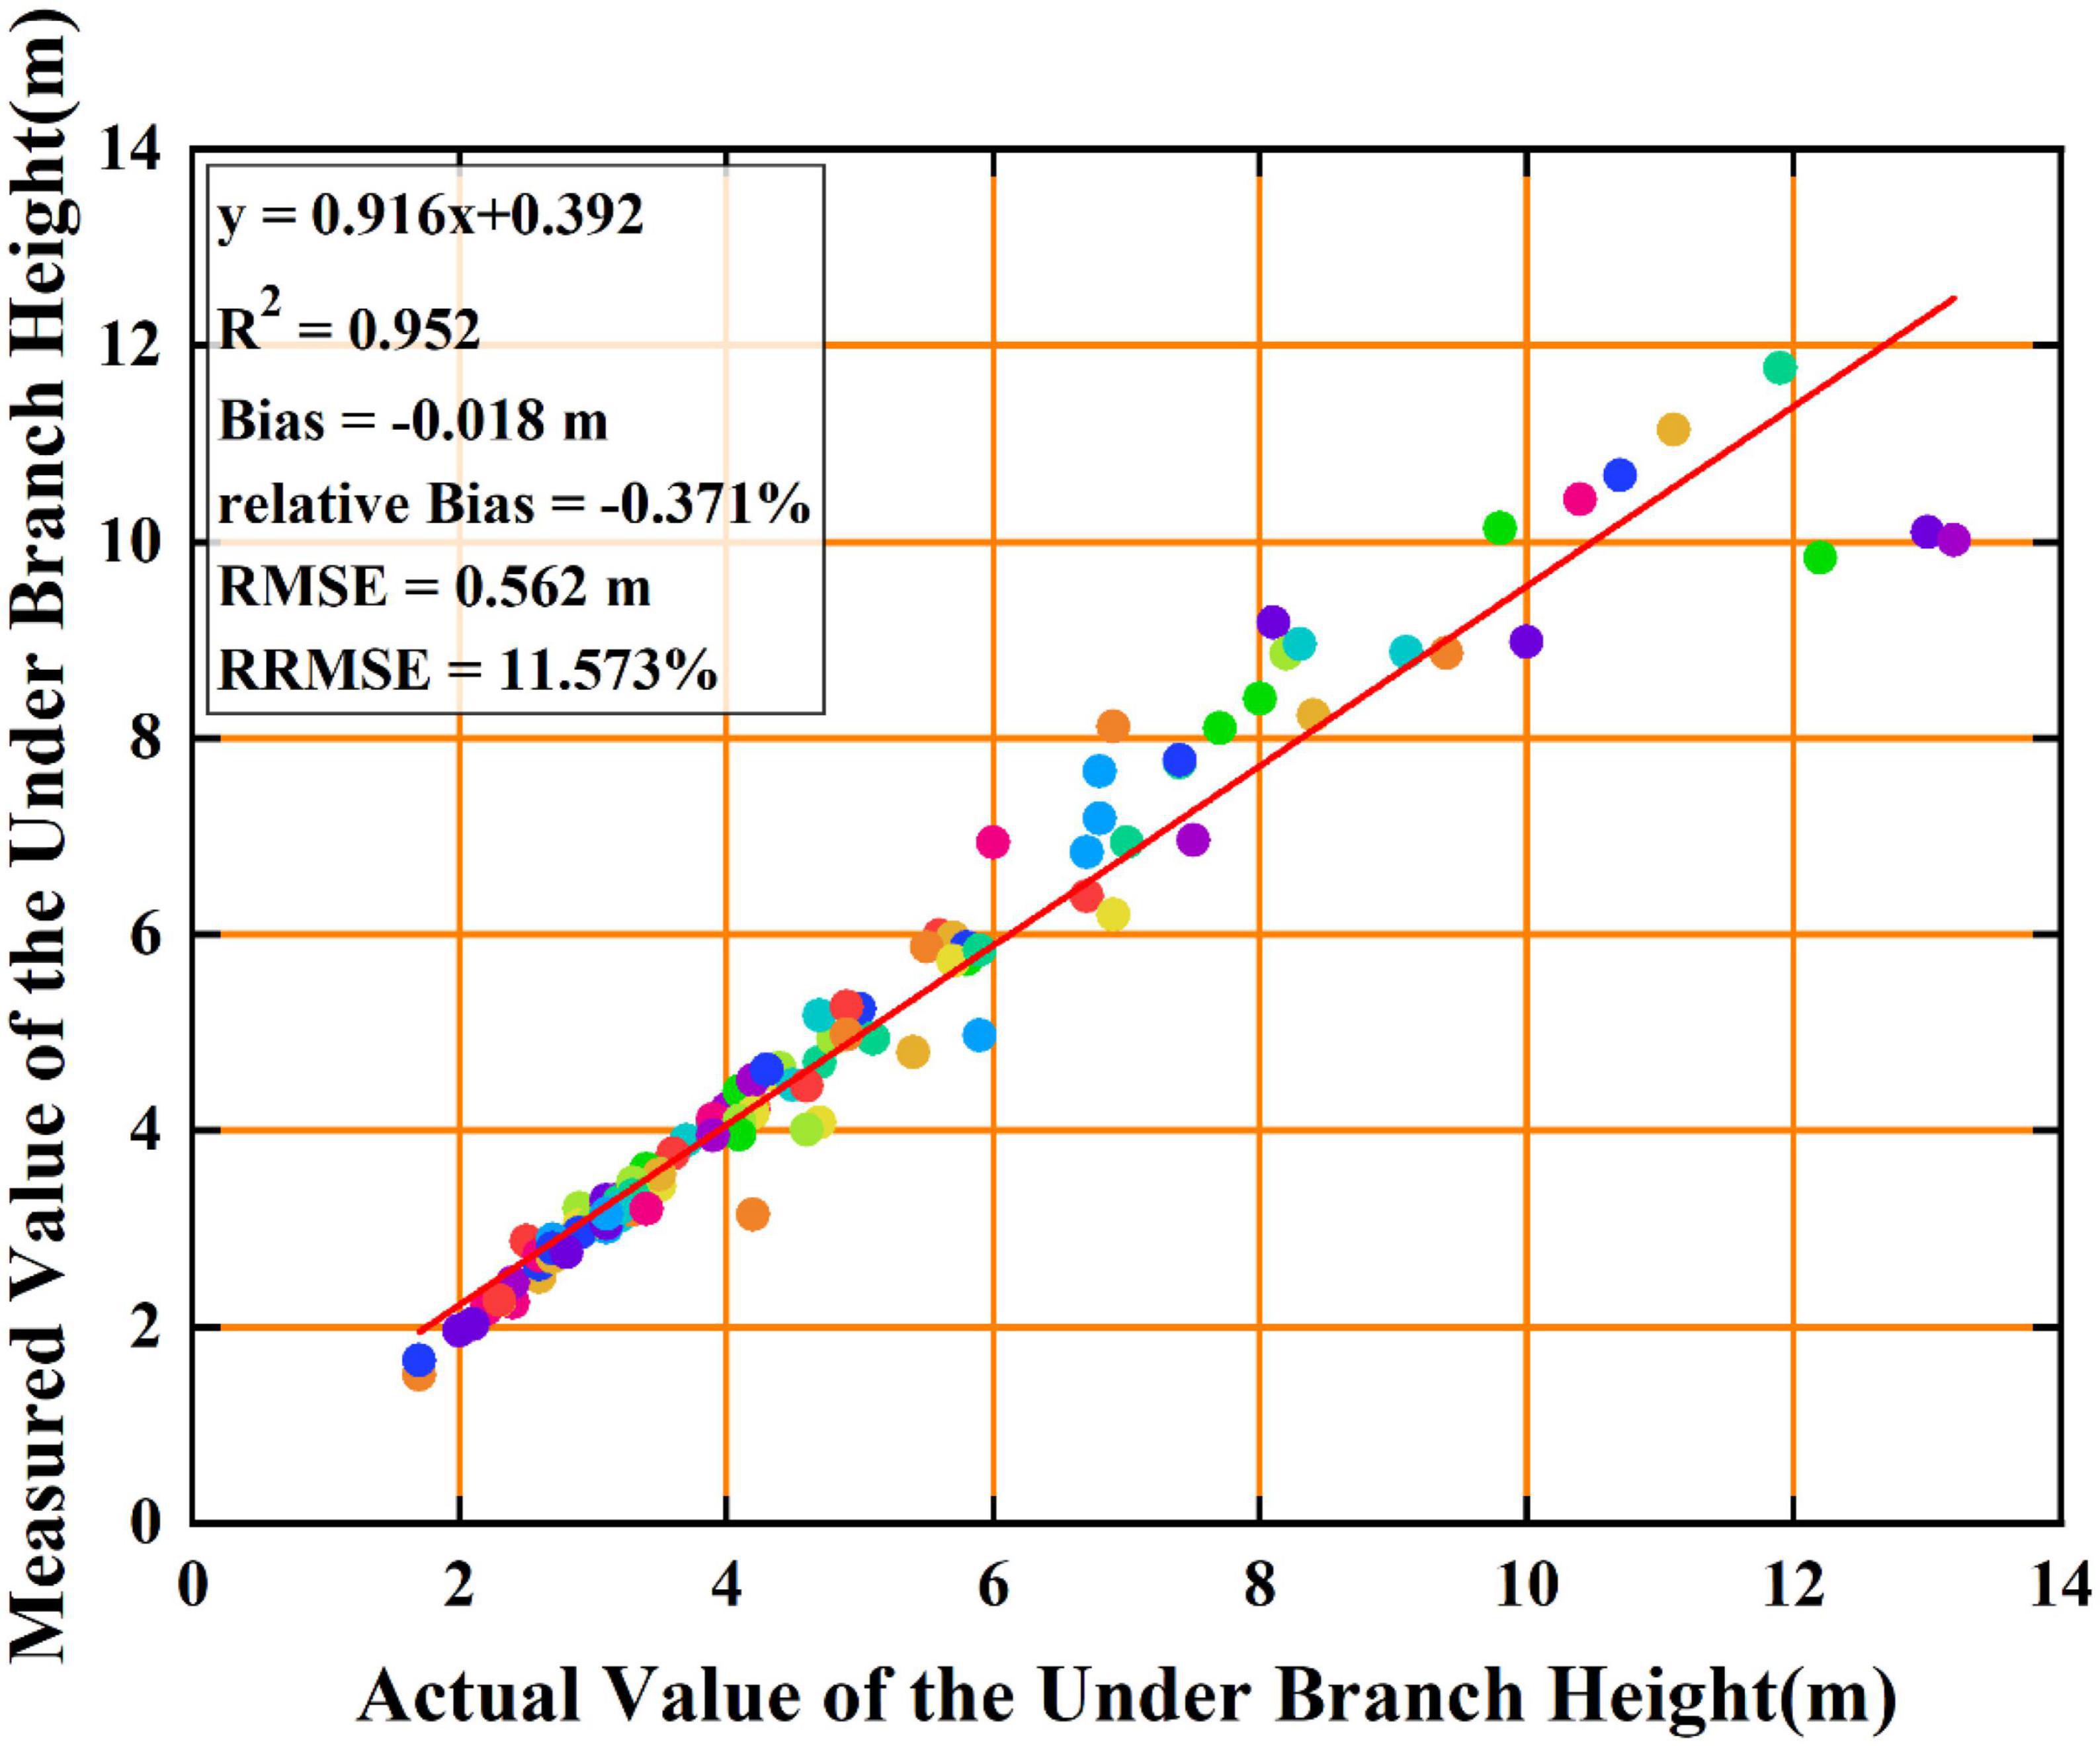
The scatter showed that the measured first branch height values were uniformly distributed on both sides of the actual values (Figure 8). The maximum measurement deviation occurred in sample plot 6, with a deviation of 0.985 m and an overall deviation of less than 0.2 m. The bias, relative bias, and RMSE were −0.018 m, −0.371%, and 0.562 m, respectively. The RRMSE was 11.573%, and the fitting determination coefficient R2 was 0.952 (Table 3). Thus, the 3D point-cloud measurement accuracy of the first branch height met the monitoring requirements of the rubber forest sample plots.
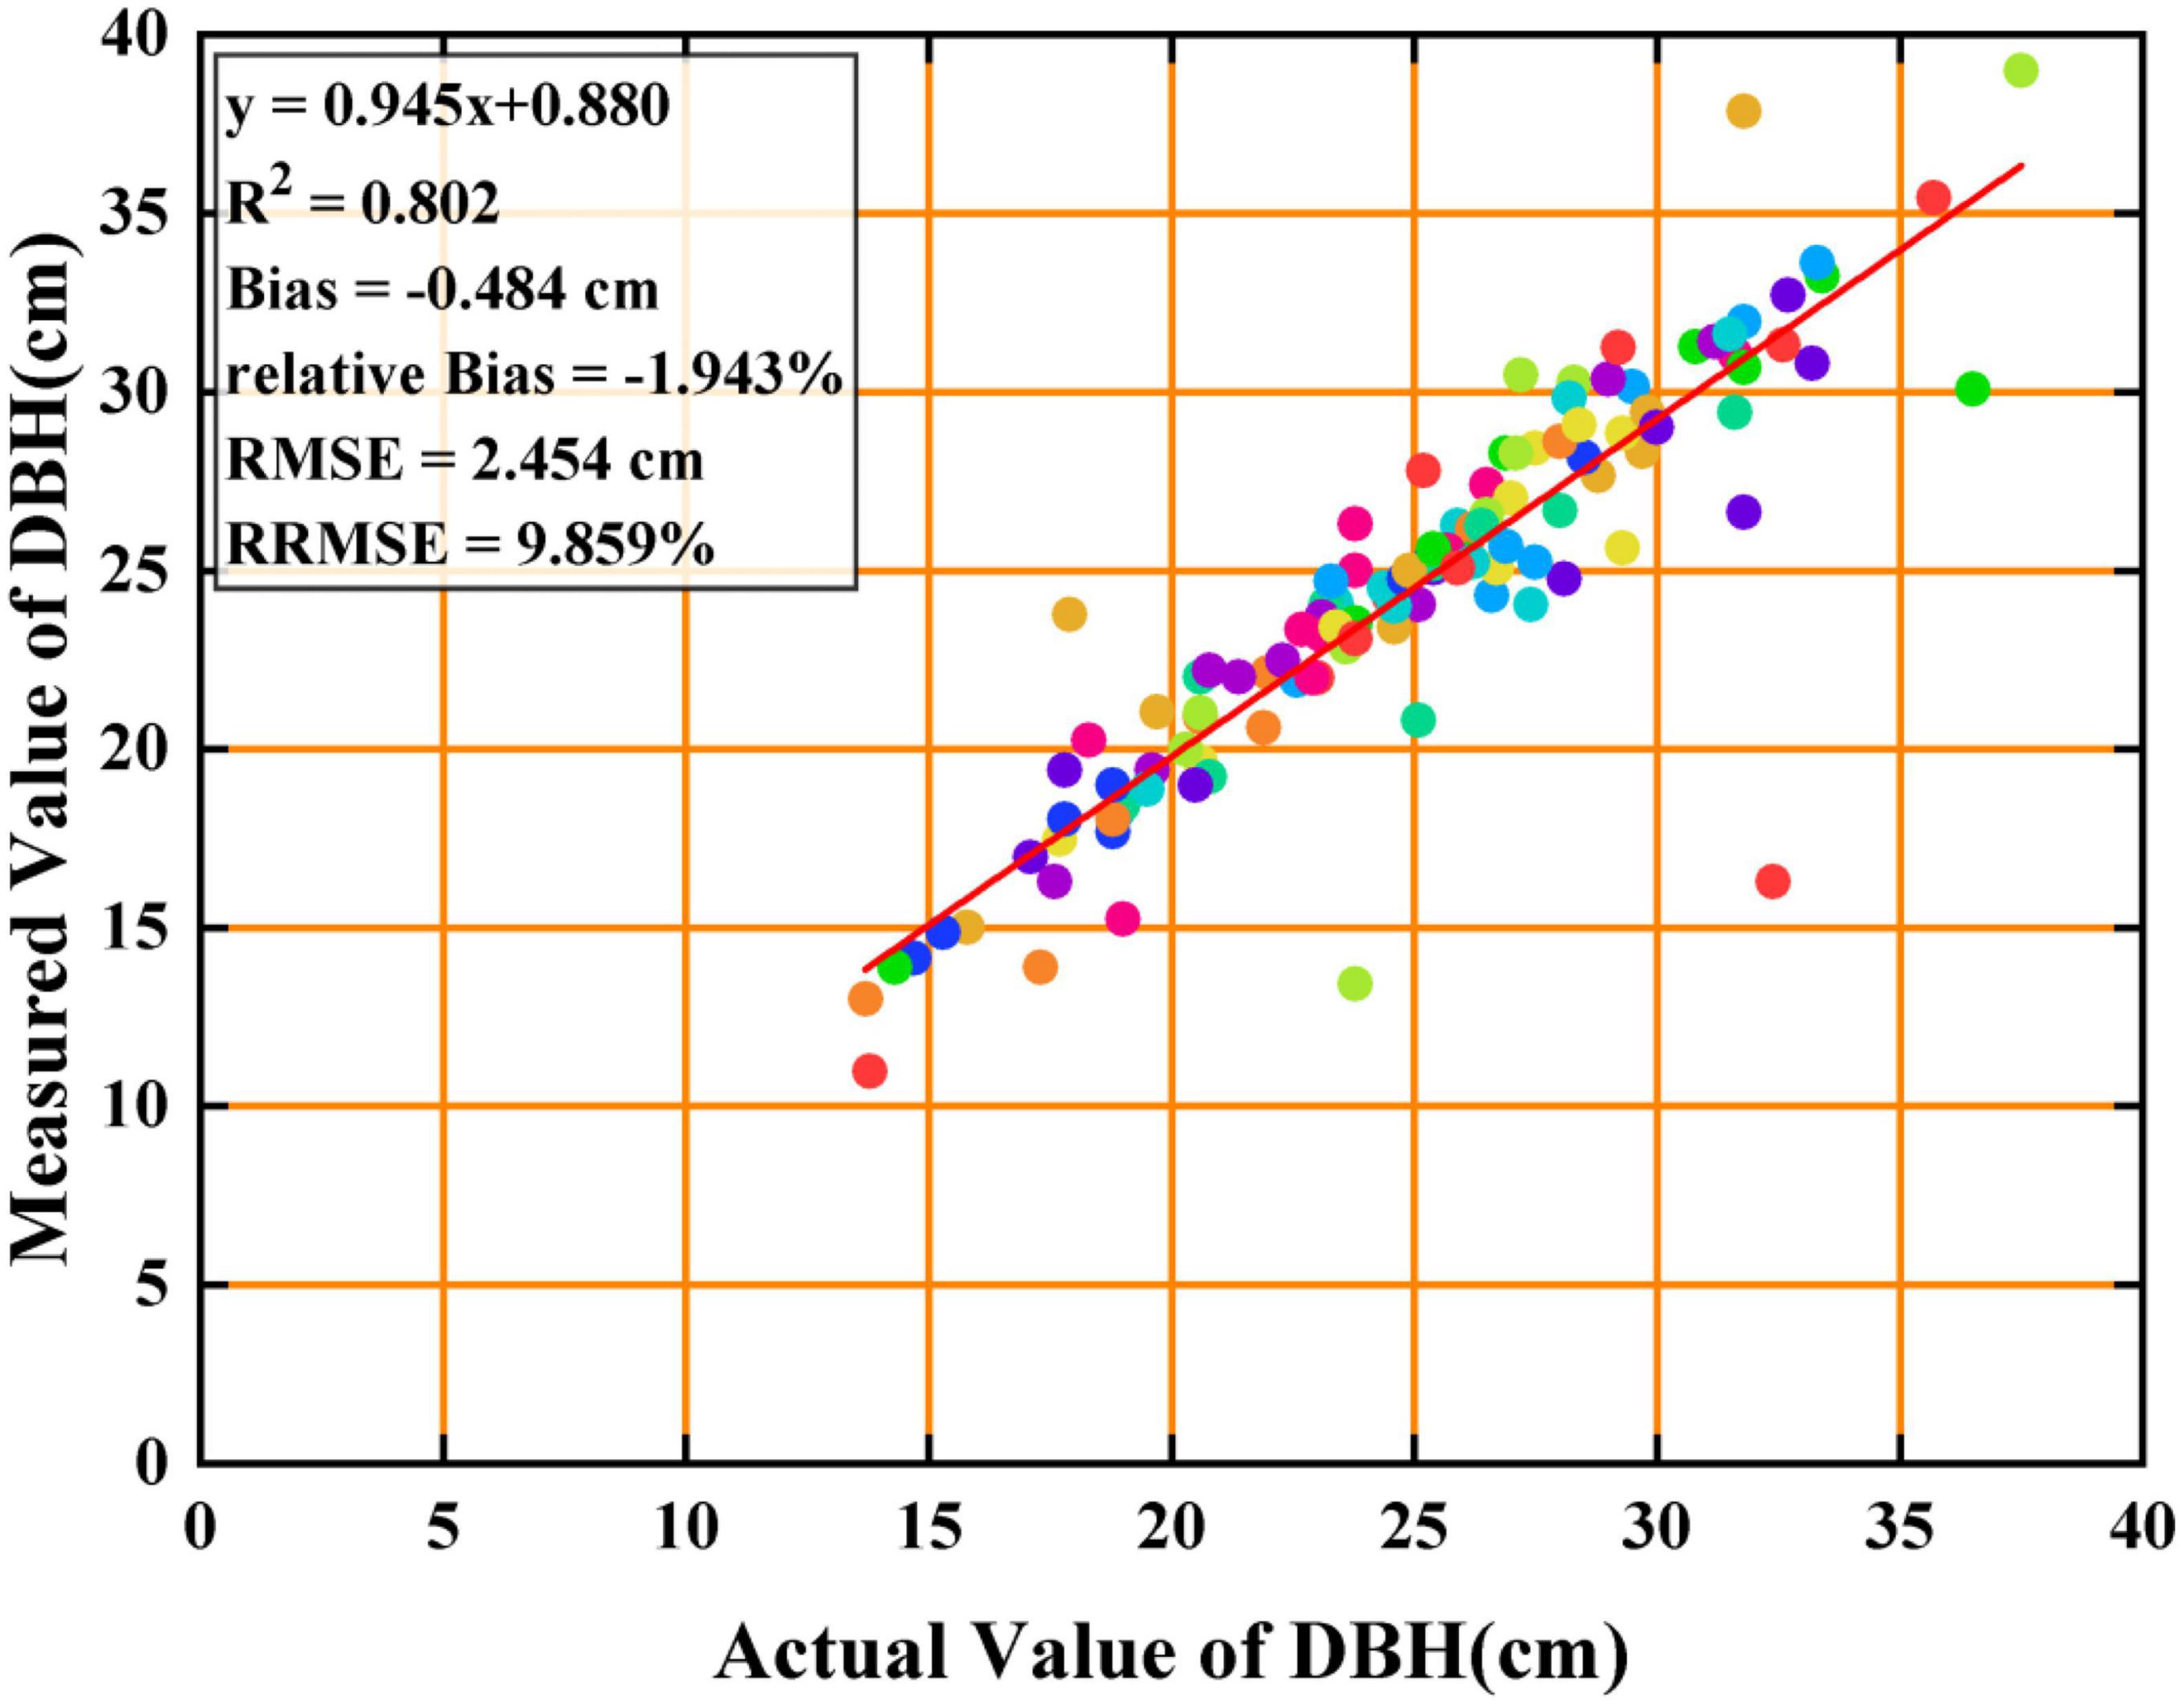
The measured DBH values were uniformly distributed on both sides of the actual values (Figure 9). The results showed that the maximum measurement deviation was 3.082 cm, and most measurement deviations were within 1 cm. In addition, the bias, relative bias, RMSE, and RRMSE were −0.484 cm, −1.943%, −2.454 cm, and 9.859%, respectively, and the fitting determination coefficient R2 was 0.802, as shown in Table 3. Therefore, the 3D measurement accuracy of the DBH point cloud met the monitoring requirements of the rubber forest sample plots.
3.3. Analysis of the standard volume model of rubber trees
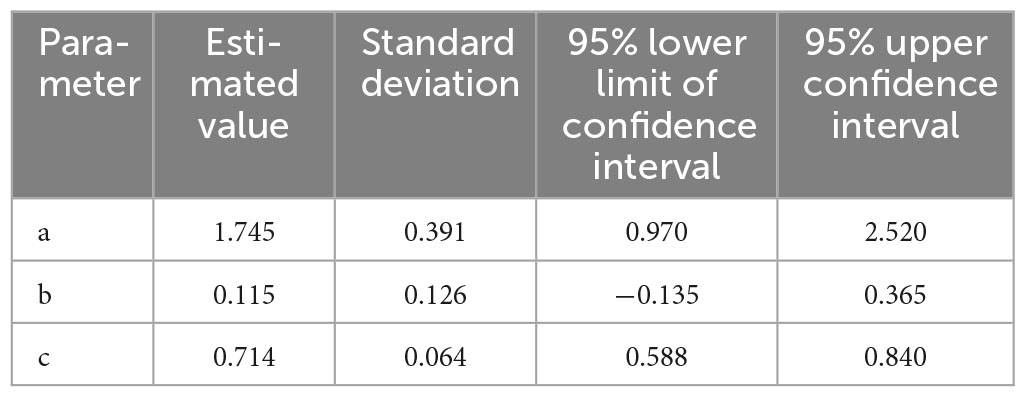
The functional relationship among volume, tree height, and DBH reflected by the Yamamoto volume formula was accurate and had a good linear fit, and its form and fitting parameters intuitively interpreted the shape of the tree trunk. We then performed nonlinear fitting of Equation 2 to obtain the binary volume general equation. The estimated values, standard deviations, and 95% confidence intervals of the three parameters are listed in Table 4. The fitting parameter R2 − 0.541 met the accuracy requirements for the quantitative assessment of rubber forest stock volume. Owing to the complex growth conditions of rubber trees in the study area, growth differences were evident between trees, which resulted in the failure to obtain a unified standard for cutting the point cloud of a single rubber tree and caused differences in the calculated volume value. Thus, the measured DBH and first branch height values exhibited significant fluctuations that led to a decrease in the degree of fit.
4. Discussion
4.1. Source of systematic deviations
Owing to the limitations of shooting technology of rubber trees image acquisition and the specific characteristics of the research area, various factors influenced the experimental methods that lead to deviations in the measurement results.
(1) During the planting process, rubber trees were typically placed a certain distance apart to ensure that they received sufficient light and nutrition during the growth process. However, after the trees matured, their crowns were typically staggered; thus, complete and independent crowns of rubber trees were difficult to identify. When acquiring 3D point-cloud data and measuring the first branch height, the branches of some rubber trees presented complex intertwining and interleaving, which hindered the surveyor from identifying the correct measurement points and caused deviations in the first branch height measurement data of rubber trees.
(2) Owing to limitations in the quality of the rubber tree image and post-processing software, when the 3D point cloud of a rubber tree was restored, the distribution of the point cloud of the trunk at 1.3 m was uneven, which resulted in a deviation in the selection of the left and right ends of the trunk and DBH.
(3) The operation of the terrestrial photogrammetry system relied on the CCD lens and RTK, and its built-in components were affected by environmental factors and weather conditions during photogrammetry. For example, poor signal quality and unstable signal reception were typically encountered during RTK movements. The complexity and irregularity of the sample plot and direct sunlight could hinder the proper focusing of the CCD lens, resulting in unclear images that could affect subsequent data processing and produce deviations.
4.2. Analysis of the 3D point-cloud reconstruction task based on the SfM-MVS method
The SfM-MVS method for 3D point-cloud reconstruction tasks only required portable equipment, obtained accurate data, and achieved a comparable density as airborne laser radar. The performance of TLS photography was comparable to that of the measurement equipment for large-scale spatial 3D point-cloud reconstruction, and the method was also cost-effective, easy to implement, and highly efficient; however, there were still limitations in its real-world application.
The quality report of the 3D point-cloud reconstruction showed that the matched feature points identified in the first 80 images accounted for approximately 90% of the entire sample plot, whereas those identified in the remaining images only accounted for 10% or less; moreover, certain images were redundant. Therefore, the number of images required to reconstruct the 3D point-cloud model of the sample plot could not be determined and the production rate of the point cloud could not be guaranteed (Bangen et al., 2014). This finding indicates that a sufficient number of images must be captured during shooting. In addition, 3D point-cloud data analysis platforms typically consume notable computing power and time when processing high-resolution and large-scale images. Approximately 3 h is required to restore the complete information of a sample plot, and during this period, the CPU occupancy of the computer is high. Therefore, the image resolution demands of current 3D point-cloud reconstruction technology must be appropriately reduced the model must be constructed through a continuous view, the image quality should be adjusted, and CPU and GPU should be used to co-process image datasets to reduce the computation time. Castillo et al. (2012) noted that directly reducing the point cloud to reduce working time would lead to loss of data and represents a relatively “crude” method. Therefore, Morales et al. (2010) proposed a method based on the local surface characteristics of an object, where the radial basis function surface statistics could process the point-cloud data. Lai et al. (2014) discovered 3D meshing using the Poisson surface 3D point-cloud reconstruction algorithm, reconstructed a 3D point cloud with a simple subset, and successfully obtained a rock wall topology with a high reduction degree. Owing to the input of numerous image datasets, the number of point clouds in a rubber forest sample plot is approximately nine million and the 3D point-cloud data will inevitably retain redundant information. Ma et al. (2013) proposed a method of triangulating and rendering a plane, and it reduced redundant information in the scene and preserved the main feature information; thus, it was suitable for the reconstruction of large point-cloud scenes. The adopted texture generation algorithm also identified the simplified expression of 3D point clouds, and the preserved scene retained the geometric accuracy (Ma et al., 2013).
The SfM-MVS 3D point-cloud reconstruction task using multiple-view stereoscopic vision technology involved capturing multiple perspectives of the measured object. However, many factors cannot be controlled when filming the rubber tree profile, such as windy conditions that cannot be controlled, the presence of landscape texture objects, unpredictable ambient lighting, and potential challenges of filming under poor light conditions. These factors directly affect the accuracy and density of 3D point-cloud data (Fonstad et al., 2013; Gienko and Terry, 2014). Furthermore, the SfM-MVS 3D point-cloud reconstruction task cannot be performed in real time, and whether a high-precision 3D point-cloud model can be successfully generated via the photogrammetry process cannot be determined. Moreover, the development of 3D point-cloud data analysis software remains imperfect. At present, the application scope is small and only supports computer-based control and analysis, while the possibility of 3D visualization in mobile devices has not yet been explored.
The terrestrial photogrammetry system developed in this study requires certain improvements in terms of the suitability of the CCD lens, the supporting software PlayMemories Mobile, and the shooting efficiency. The software is expected to be improved in the future to achieve point-to-point shooting and control sensitivity. In addition, tracking and positioning technology can be developed to calculate the projection position of the shooting point on the ground using a specific algorithm, and this method would be able to effectively avoid the influence of terrain factors, such as slope and deep pits, and achieve accurate positioning of the shooting position. The above methods can effectively improve the accuracy of the data and can be better applied for the sustainable monitoring of rubber forests.
The development of the SfM-MVS 3D point-cloud reconstruction method is still in the early stages, and its potential applicability needs to be comprehensively explored. In the future, experiments should be conducted to verify the specific impact of external factors on the control range and data accuracy and determine solutions to resolve the associated issues. To ensure the accuracy of monitoring, internal and external efficiency can be improved by appropriately adjusting the quality and quantity of images and optimizing the image resolution. Thus, combined with the improved terrestrial photogrammetry system, the accuracy of the 3D point-cloud reconstruction can be further improved.
4.3. Application analysis of terrestrial photogrammetry system for the monitoring of rubber forest
The terrestrial photogrammetry system developed in this study, which consisted of a CCD lens, leveling rod, and RTK, is a new method for monitoring rubber forest sample plots in Hainan Province. The results of the deviation analysis showed that the measurement deviations of first branch height and DBH (11.573 and 9.859%, respectively) were primarily due to measurement method deviations and image clarity. Nonetheless, the monitoring accuracy of the system was high, and, the system offered several advantages for realizing sustainable management: (1) the monitoring efficiency was high and the monitoring data and images could be permanently retained; (2) non-contact measurements could provide a solution to the challenge of monitoring complex terrains, where direct access is difficult or impossible; (3) point-cloud planning could be conducted on the 3D point-cloud data analysis platform, and the planning results could be applied to actual scenes to realize intelligent monitoring; (4) compared with UAV and TLS technology, the main components of the terrestrial photogrammetry system were inexpensive, simple to operate, and easy to carry, thereby reducing monitoring costs and rendering the platform suitable for forest monitoring; (5) the dynamic real-time remote-control system could obtain information from measurement station, facilitate the integration of internal and external elements, successfully resolve the time-consuming and labor-intensive characteristics of field investigations, and reduce the tedious data processing required for internal elements.
5. Conclusion
Based on the principles of forest mensuration, photogrammetry, image processing technology, and other theories, we developed a terrestrial photogrammetry system that could effectively resolve the practical problems associated with sustainable monitoring of rubber forests and provides advantages of low cost and high efficiency. Combined with the developed rubber tree standard volume model, the proposed system could reveal the change law of DBH and first branch height and accurately estimate the rubber tree and even rubber forest volumes. Furthermore, based on the results, a comprehensive analysis was conducted of the current situation of 3D point-cloud reconstruction and the application of terrestrial photogrammetry systems for the sustainable management of rubber forests. The results showed that the terrestrial photogrammetry system has advantages that include its low cost, portability, high accuracy, and strong practicability in the field of rubber forest sample plot monitoring. However, whether the monitoring effect and efficiency of the terrestrial photogrammetry system would be affected by the expansion of the rubber forest sample plot area and increase in the number of trees and whether the system could be applied to other types of forests remain unclear and must be addressed in further experiments. This study provided novel ideas for monitoring rubber forest sample plots, and the proposed system lays the foundation for the sustainable monitoring of other types of crops in the future. Such monitoring is important for the sustainable development of tropical agriculture and forestry in Hainan Province.
Data availability statement
The datasets [3D Visual Sustainable Management of Rubber Forest Based on Terrestrial Photogrammetry System] for this study can be found in the [FIGSHARE] [https://doi.org/10.6084/m9.figshare.22133126].
Author contributions
ZQ and SL contributed to the conception and design of the study and wrote the first draft of the manuscript. SL, LL, YX, CW, NL, RL, and DY organized the database and performed the statistical analysis. LL, YX, CW, NL, RL, and DY wrote the sections of the manuscript. All authors contributed to the manuscript revision, read, and approved the submitted version.
Funding
This research was funded by the National Natural Science Foundation of China (Grant number 32160364), the Hainan Provincial Key Research and Development Plan of China (Grant number ZDYF2021SHFZ110), the Hainan Provincial Natural Science Foundation of China (Grant number 320QN185), the Science and Technology Innovation Project of Gansu Provincial Department of Natural Resources (Grant number 202206), the Science and Technology Innovation Project of Gansu Provincial Department of Natural Resources (Grant number 202250), and the National College Student Innovation and Entrepreneurship Training Program of China (Grant number 202210589073).
Acknowledgments
We thank those students who assisted with the fieldwork and data collection and the instructor for their constructive comments that helped to improve this study.
Conflict of interest
The authors declare that the research was conducted in the absence of any commercial or financial relationships that could be construed as a potential conflict of interest.
Publisher’s note
All claims expressed in this article are solely those of the authors and do not necessarily represent those of their affiliated organizations, or those of the publisher, the editors and the reviewers. Any product that may be evaluated in this article, or claim that may be made by its manufacturer, is not guaranteed or endorsed by the publisher.
Supplementary material
The Supplementary Material for this article can be found online at: https://www.frontiersin.org/articles/10.3389/ffgc.2023.1206450/full#supplementary-material
References
Asner, G. P., Powell, G. V., Mascaro, J., Knapp, D. E., Clark, J. K., Jacobson, J., et al. (2010). High-resolution forest carbon stocks and emissions in the Amazon. Proc. Natl. Acad. Sci. U.S.A. 107, 16738–16742. doi: 10.1073/pnas.1004875107
Bangen, S. G., Wheaton, J. M., Bouwes, N., Bouwes, B., and Jordan, C. (2014). A methodological intercomparison of topographic survey techniques for characterizing wadeable streams and rivers. Geomorphology 206, 343–361. doi: 10.1016/j.geomorph.2013.10.010
Bauwens, S., Bartholomeus, H., Calders, K., and Lejeune, P. (2016). Forest inventory with terrestrial LiDAR: A comparison of static and handheld mobile laser scanning. Forests 7:127. doi: 10.3390/f7060127
Bayati, H., Najafi, A., Vahidi, J., and Gholamali Jalali, S. (2021). 3D reconstruction of uneven-aged forest in single tree scale using digital camera and SfM-MVS technique. Scand. J. For. Res. 36, 210–220. doi: 10.1080/02827581.2021.1903074
Béland, M., Widlowski, J.-L., Fournier, R. A., Côté, J.-F., and Verstraete, M. M. (2011). Estimating leaf area distribution in savanna trees from terrestrial LiDAR measurements. Agric. For. Meteorol. 151, 1252–1266. doi: 10.1016/j.agrformet.2011.05.004
Bender, L. U. (1971). Analytical photogrammetry: A collinear theory. Columbus, OH: The Ohio State University.
Berra, E. F., and Peppa, M. V. (2020). “Advances and challenges of UAV SFM MVS photogrammetry and remote sensing: Short review,” in 2020 IEEE Latin American GRSS & ISPRS remote sensing conference (LAGIRS), (Piscataway, NJ: IEEE), doi: 10.1109/LAGIRS48042.2020.9285975
Biesemans, J., Everaerts, J., and Lewyckyj, N. (2005). PEGASUS: Remote sensing from a HALE-UAV. ASPRS Ann. Conv. 1, 53–56.
Bojórquez, A., Martínez-Yrízar, A., Búrquez, A., Jaramillo, V. J., Mora, F., Balvanera, P., et al. (2020). Improving the accuracy of aboveground biomass estimations in secondary tropical dry forests. For. Ecol. Manage. 474:118384. doi: 10.1016/j.foreco.2020.118384
Bolognesi, M., Furini, A., Russo, V., Pellegrinelli, A., and Russo, P. (2014). Accuracy of cultural heritage 3D models by RPAS and terrestrial photogrammetry. Int. Arch. Photogramm. Remote Sens. Spatial Inform. Sci. 40:113. doi: 10.5194/isprsarchives-XL-5-113-2014
Borz, S. A., Proto, A. R., Keefe, R., and Niţă, M. D. (2022). Electronics, close-range sensors and artificial intelligence in forestry. Forests 13:1669. doi: 10.3390/f13101669
Božić, M., Čavlović, J., Lukić, N., Teslak, K., and Kos, D. (2005). Efficiency of ultrasonic vertex III hypsometer compared to the most commonly used hypsometers in Croatian forestry. Croatian J. For. Eng. 26, 91–99.
Burt, A., Disney, M. I., Raumonen, P., Armston, J., Calders, K., and Lewis, P. (2013). “Rapid characterisation of forest structure from TLS and 3D modelling,” in IEEE international geoscience and remote sensing symposium-IGARSS, (Piscataway, NJ: IEEE), 3387–3390. doi: 10.1109/IGARSS.2013.6723555
Castillo, C., Pérez, R., James, M. R., Quinton, J. N., Taguas, E. V., and Gómez, J. A. (2012). Comparing the accuracy of several field methods for measuring gully erosion. Soil Sci. Soc. Am. J. 76, 1319–1332. doi: 10.2136/sssaj2011.0390
Chave, J., Réjou-Méchain, M., Búrquez, A., Chidumayo, E., Colgan, M. S., Delitti, W. B., et al. (2014). Improved allometric models to estimate the aboveground biomass of tropical trees. Glob. Change Biol. 20, 3177–3190. doi: 10.1111/gcb.12629
Chen, S., Feng, Z., Chen, P., Khan, T. U., and Lian, Y. (2019a). Nondestructive estimation of the above-ground biomass of multiple tree species in boreal forests of China using terrestrial laser scanning. Forests 10:936. doi: 10.3390/f10110936
Chen, S., Liu, H., Feng, Z., Shen, C., and Chen, P. (2019b). Applicability of personal laser scanning in forestry inventory. PLoS One 14:e0211392. doi: 10.1371/journal.pone.0211392
Chianucci, F., Disperati, L., Guzzi, D., Bianchini, D., Nardino, V., Lastri, C., et al. (2016). Estimation of canopy attributes in beech forests using true colour digital images from a small fixed-wing UAV. Int. J. Appl. Earth Observ. Geoinform. 47, 60–68. doi: 10.1016/j.jag.2015.12.005
Curtis, R. O., and Arney, J. D. (1977). Estimating D.B.H. from stump diameters on second-growth Douglas-fir. Portland, OR: Pacific Northwest Forest and Range Experiment Station.
Dassot, M., Constant, T., and Fournier, M. (2011). The use of terrestrial LiDAR technology in forest science: Application fields, benefits and challenges. Ann. For. Sci. 68, 959–974. doi: 10.1007/s13595-011-0102-2
Dong, B., Yang, X., Feng, Z., Tang, X., Zhang, D., and Du, L. (2009). Technology of multiple concentric circles for surveying forest volume with electronic angle gauge. Trans. Chin. Soc. Agric. Eng. 25, 156–160.
Falin, L., Yong, L., and Siqi, Z. (2011). Status and prospects of forest measurement instruments. For. Resources Manage. 1:96.
Fan, Y., Feng, Z., Mannan, A., Khan, T. U., Shen, C., and Saeed, S. (2018). Estimating tree position, diameter at breast height, and tree height in real-time using a mobile phone with RGB-D SLAM. Remote Sens. 10:1845. doi: 10.3390/rs10111845
Ferreira, E., Chandler, J., Wackrow, R., and Shiono, K. (2017). Automated extraction of free surface topography using SfM-MVS photogrammetry. Flow Meas. Instrum. 54, 243–249. doi: 10.1016/j.flowmeasinst.2017.02.001
Fonstad, M. A., Dietrich, J. T., Courville, B. C., Jensen, J. L., and Carbonneau, P. E. (2013). Topographic structure from motion: A new development in photogrammetric measurement. Earth Surf. Process. Landforms 38, 421–430. doi: 10.1002/esp.3366
Frey, J., Kovach, K., Stemmler, S., and Koch, B. (2018). UAV photogrammetry of forests as a vulnerable process. A sensitivity analysis for a structure from motion RGB-image pipeline. Remote Sens. 10:912. doi: 10.3390/rs10060912
Galaktionov, O., Zavyalov, S., Shchegoleva, L., and Korzun, D. (2021). “Features of building a forestry intelligent robotic system,” in Proceedings of the 29th conference Open Innovations Association (FRUCT) 2021, Tampere, 433–436. doi: 10.5281/zenodo.4770812
Gao, J., Shahid, R., Ji, X., and Li, S. (2022). Climate Change resilience and sustainable tropical agriculture: Farmers’ perceptions, reactive adaptations and determinants of reactive adaptations in Hainan, China. Atmosphere 13:955. doi: 10.3390/atmos13060955
Giannetti, F., Chirici, G., Gobakken, T., Nćsset, E., Travaglini, D., and Puliti, S. (2018). A new approach with DTM-independent metrics for forest growing stock prediction using UAV photogrammetric data. Remote Sens. Environ. 213, 195–205. doi: 10.1016/j.rse.2018.05.016
Gienko, G. A., and Terry, J. P. (2014). Three-dimensional modeling of coastal boulders using multi-view image measurements. Earth Surf. Process. Landforms 39, 853–864. doi: 10.1002/esp.3485
Granshaw, S. I. (2010). Close range photogrammetry: Principles, methods and applications. Photogramm. Rec. 25, 203–204. doi: 10.1111/j.1477-9730.2010.00574_1.x
Grenzdörffer, G. J., and Teichert, B. (2008). The photogrammetric potential of low-cost UAVs in forestry and agriculture. Remote Sens. SI Sci. 31, 1207–1214.
Guimarães, N., Pádua, L., Marques, P., Silva, N., Peres, E., and Sousa, J. J. (2020). Forestry remote sensing from unmanned aerial vehicles: A review focusing on the data, processing and potentialities. Remote Sens. 12:1046. doi: 10.3390/rs12061046
Guo, Z., Zhang, Y., Deegen, P., and Uibrig, H. (2006). Economic analyses of rubber and tea plantations and rubber-tea intercropping in Hainan, China. Agrofor. Syst. 66, 117–127. doi: 10.1007/s10457-005-4676-2
Hartley, R. (2017). Unmanned aerial vehicles in forestry–reaching for a new perspective. N. Z. J. For. 62, 31–39.
Iglhaut, J., Cabo, C., Puliti, S., Piermattei, L., O’Connor, J., and Rosette, J. (2019). Structure from motion photogrammetry in forestry: A review. Curr. For. Rep. 5, 155–168. doi: 10.1007/s40725-019-00094-3
Janssen, P., Stella, J. C., Piégay, H., Räpple, B., Pont, B., Faton, J.-M., et al. (2020). Divergence of riparian forest composition and functional traits from natural succession along a degraded river with multiple stressor legacies. Sci. Total Environ. 721:137730. doi: 10.1016/j.scitotenv.2020.137730
Jayathunga, S., Owari, T., Tsuyuki, S., and Hirata, Y. (2020). Potential of UAV photogrammetry for characterization of forest canopy structure in uneven-aged mixed conifer–broadleaf forests. Int. J. Remote Sens. 41, 53–73. doi: 10.1080/01431161.2019.1648900
Koukal, T., Atzberger, C., and Schneider, W. (2014). Evaluation of semi-empirical BRDF models inverted against multi-angle data from a digital airborne frame camera for enhancing forest type classification. Remote Sens. Environ. 151, 27–43. doi: 10.1016/j.rse.2013.12.014
Kübler, D., Hildebrandt, P., Günter, S., Stimm, B., Weber, M., Muñoz, J., et al. (2020). Effects of silvicultural treatments and topography on individual tree growth in a tropical mountain forest in Ecuador. For. Ecol. Manage. 457:117726. doi: 10.1016/j.foreco.2019.117726
Lai, P., Samson, C., and Bose, P. (2014). Visual enhancement of 3D images of rock faces for fracture mapping. Int. J. Rock Mech. Mining Sci. 72, 325–335. doi: 10.1016/j.ijrmms.2014.09.016
Lin, J., Tao, H., Wang, Y., and Huang, Z. (2010). “Practical application of unmanned aerial vehicles for mountain hazards survey,” in 2010 18th International conference on geoinformatics, (Piscataway, NJ: IEEE), doi: 10.1109/GEOINFORMATICS.2010.5567777
Linares-Palomino, R., and Ponce Alvarez, S. I. (2005). Tree community patterns in seasonally dry tropical forests in the Cerros de Amotape Cordillera, Tumbes, Peru. For. Ecol. Manage. 209, 261–272. doi: 10.1016/j.foreco.2005.02.003
Liu, H., Feng, Z., Hu, N., Liu, J., and Yu, X. (2018). Design of handheld precision standing tree height measurement device. Trans. Chin. Soc. Agric. Mach. 49, 129–134. doi: 10.6041/j.issn.1000-1298.2018.12.016
Liu, P., Chen, A. Y., Huang, Y.-N., Han, J.-Y., Lai, J.-S., Kang, S.-C., et al. (2014). A review of rotorcraft unmanned aerial vehicle (UAV) developments and applications in civil engineering. Smart Struct. Syst. 13, 1065–1094. doi: 10.12989/sss.2014.13.6.1065
Lowe, M. K., Adnan, F. A. F., Hamylton, S. M., Carvalho, R. C., and Woodroffe, C. D. (2019). Assessing reef-island shoreline change using UAV-derived orthomosaics and digital surface models. Drones 3:44. doi: 10.3390/drones3020044
Ma, L., Whelan, T., Bondarev, E., de With, P. H. N., and McDonald, J. (2013). “Planar simplification and texturing of dense point cloud maps,” in 2013 European conference on mobile robots, (Piscataway, NJ: IEEE), doi: 10.1109/ECMR.2013.6698837
Mali, V. K., and Kuiry, S. N. (2018). Assessing the accuracy of high-resolution topographic data generated using freely available packages based on SfM-MVS approach. Measurement 124, 338–350. doi: 10.1016/j.measurement.2018.04.043
McRoberts, R. E., Tomppo, E., Schadauer, K., Vidal, C., Ståhl, G., Chirici, G., et al. (2009). Harmonizing national forest inventories. J. For. 107, 179–187. doi: 10.1093/jof/107.4.179
Morales, R., Wang, Y., and Zhang, Z. (2010). “Unstructured point cloud surface denoising and decimation using distance RBF K-nearest neighbor kernel,” in Advances in multimedia information processing-PCM proceedings, Part II. 2010: 11th Pacific Rim Conference on Multimedia, Shanghai, China, September 2010, (Berlin: Springer), 11. doi: 10.1007/978-3-642-15696-0_20
Nakano, T., Kamiya, I., Tobita, M., Iwahashi, J., and Nakajima, H. (2014). Landform monitoring in active volcano by UAV and SfM-MVS technique. Int. Arch. Photogramm. Remote Sens. Spatial Inform. Sci. 8, 71–75. doi: 10.5194/isprsarchives-XL-8-71-2014
Navarro, A., Young, M., Allan, B., Carnell, P., Macreadie, P., and Ierodiaconou, D. (2020). The application of unmanned aerial vehicles (UAVs) to estimate above-ground biomass of mangrove ecosystems. Remote Sens. Environ. 242:111747. doi: 10.1016/j.rse.2020.111747
Newnham, G. J., Armston, J. D., Calders, K., Disney, M. I., Lovell, J. L., Schaaf, C. B., et al. (2015). Terrestrial laser scanning for plot-scale forest measurement. Curr. For. Rep. 1, 239–251. doi: 10.1007/s40725-015-0025-5
Ni, W., Sun, G., Pang, Y., Zhang, Z., Liu, J., Yang, A., et al. (2018). Mapping three-dimensional structures of forest canopy using UAV stereo imagery: Evaluating impacts of forward overlaps and image resolutions with LiDAR data as reference. IEEE J. Selected Top. Appl. Earth Observ. Remote Sens. 11, 3578–3589. doi: 10.1109/JSTARS.2018.2867945
O’Connor, J., Smith, M., and James, M. (2017). Cameras and settings for aerial surveys in the geosciences: Optimising image data. Prog. Phys. Geogr. 41, 325–344. doi: 10.1177/0309133317703092
Piermattei, L., Karel, W., Wang, D., Wieser, M., Mokroš, M., Koreň, M., et al. (2019). Terrestrial Structure from Motion photogrammetry for deriving forest inventory data. Remote Sens. 11:950. doi: 10.3390/rs11080950
Qiu, Z., Feng, Z., Jiang, J., Lin, Y., and Xue, S. (2018). Application of a continuous terrestrial photogrammetric measurement system for plot monitoring in the Beijing Songshan national nature reserve. Remote Sens. 10:1080. doi: 10.3390/rs10071080
Rautiainen, A., Wernick, I., Waggoner, P. E., Ausubel, J. H., and Kauppi, P. E. (2011). A national and international analysis of changing forest density. PLoS One 6:e19577. doi: 10.1371/journal.pone.0019577
Ruwaimana, M., Satyanarayana, B., Otero, V., Muslim, A. M., Syafiq, M., Ibrahim, S., et al. (2018). The advantages of using drones over space-borne imagery in the mapping of mangrove forests. PLoS One 13:e0200288. doi: 10.1371/journal.pone.0200288
Saarinen, N., Vastaranta, M., Näsi, R., Rosnell, T., Hakala, T., Honkavaara, E., et al. (2018). Assessing biodiversity in boreal forests with UAV-based photogrammetric point clouds and hyperspectral imaging. Remote Sens. 10:338. doi: 10.3390/rs10020338
Tan, H., Li, Q., Zhang, H., Wu, C., Zhao, S., Deng, X., et al. (2020). Pesticide residues in agricultural topsoil from the Hainan tropical riverside basin: Determination, distribution, and relationships with planting patterns and surface water. Sci. Total Environ. 722:137856. doi: 10.1016/j.scitotenv.2020.137856
Tomaštík, J., Mokroš, M., Saloň, Š, Chudý, F., and Tunák, D. (2017). Accuracy of photogrammetric UAV-based point clouds under conditions of partially-open forest canopy. Forests 8:151. doi: 10.3390/f8050151
Wallace, L., Lucieer, A., Malenovský, Z., Turner, D., and Vopěnka, P. (2016). Assessment of forest structure using two UAV techniques: A comparison of airborne laser scanning and structure from motion (SfM) point clouds. Forests 7:62. doi: 10.3390/f7030062
Wang, X., Wang, S., and Dai, L. (2018). Estimating and mapping forest biomass in northeast China using joint forest resources inventory and remote sensing data. J. For. Res. 29, 797–811. doi: 10.1007/s11676-017-0504-6
White, J. C., Coops, N. C., Wulder, M. A., Vastaranta, M., Hilker, T., and Tompalski, P. (2016). Remote sensing technologies for enhancing forest inventories: A review. Can. J. Remote Sens. 42, 619–641. doi: 10.1080/07038992.2016.1207484
Xu, W., Feng, Z., Su, Z., Xu, H., Jiao, Y., and Fan, J. (2013). Development and experiment of handheld digitalized and multi-functional forest measurement gun. Trans. Chin. Soc. Agric. Eng. 29, 90–99.
Yao, T., Yang, X., Zhao, F., Wang, Z., Zhang, Q., Jupp, D., et al. (2011). Measuring forest structure and biomass in New England forest stands using Echidna ground-based lidar. Remote Sens. Environ. 115, 2965–2974. doi: 10.1016/j.rse.2010.03.019
Yfantis, E. A. (2019). “A UAV with autonomy, pattern recognition for forest fire prevention, and AI for providing advice to firefighters fighting forest fires,” in 2019 9th Annual computing and communication workshop and conference (CCWC), (Piscataway, NJ: IEEE), doi: 10.1109/CCWC.2019.8666471
Keywords: terrestrial photogrammetry, SfM-MVS technology, 3D point-cloud reconstruction, the rubber tree standard volume model, sustainable management of rubber tree forests
Citation: Lei S, Liu L, Xie Y, Fang Y, Wang C, Luo N, Li R, Yu D and Qiu Z (2023) 3D visualization technology for rubber tree forests based on a terrestrial photogrammetry system. Front. For. Glob. Change 6:1206450. doi: 10.3389/ffgc.2023.1206450
Received: 15 April 2023; Accepted: 31 July 2023;
Published: 14 August 2023.
Edited by:
Felipe Bravo, Universidad de Valladolid, SpainReviewed by:
Quang-Thanh Bui, VNU University of Science, VietnamFrancisco Mauro, Universidad de Valladolid, Spain
Copyright © 2023 Lei, Liu, Xie, Fang, Wang, Luo, Li, Yu and Qiu. This is an open-access article distributed under the terms of the Creative Commons Attribution License (CC BY). The use, distribution or reproduction in other forums is permitted, provided the original author(s) and the copyright owner(s) are credited and that the original publication in this journal is cited, in accordance with accepted academic practice. No use, distribution or reproduction is permitted which does not comply with these terms.
*Correspondence: Zixuan Qiu, eml4dWFucWl1QGhhaW5hbnUuZWR1LmNu
 Shuhan Lei
 Li Liu
 Yu Xie
 Ying Fang
 Chuangxia Wang
 Ninghao Luo
 Ruitao Li
 Donghai Yu3
 Zixuan Qiu