 Jinhui Yang
 Bangchu Gong
 Xibing Jiang
95% of researchers rate our articles as excellent or good
Learn more about the work of our research integrity team to safeguard the quality of each article we publish.
Find out more
ORIGINAL RESEARCH article
Front. For. Glob. Change , 29 June 2023
Sec. Forest Growth
Volume 6 - 2023 | https://doi.org/10.3389/ffgc.2023.1203674
This article is part of the Research Topic Forest Phenomics: How Does Developing Sensor Technology Improve the Growth of Forest Plantations? View all 5 articles
Soluble sugars are critical determinants of fruit quality and play a significant role in human nutrition. Chestnuts, rich in soluble sugars, derive their sweetness from them. However, their content varies with cultivar, location, and environmental conditions. Traditional methods for determining soluble sugar content in chestnuts are time-consuming, laborious, and destructive. Therefore, there is a pressing need for rapid, non-destructive, and straightforward methods for determining soluble sugars in chestnuts to expedite genetic selection. This study aimed to develop a hyperspectral imaging-based prediction model for soluble sugar content in Chinese chestnuts. Firstly, abnormal samples were eliminated using ensemble partial least squares for outlier detection. We then compared the average original and block scale (BS) spectra, with the latter demonstrating significant differences. The BS pretreatment exhibited two small absorption peaks in the 403.7 ∼ 429.1 nm band and 454.7 ∼ 500 nm band, less fluctuation in the spectral curves from 503.2 to 687.2 nm, and a substantial increase in spectral absorption between 690.6 and 927.8 nm. Subsequently, we developed a partial least squares (PLS) model using BS pretreatment and regularized elimination (rep) variable selection, which showed better accuracy in predicting chestnut soluble sugar content than other variable selection methods. The model fitting accuracy after the spectra treatment was marginally better than that of the original spectra, with a calibration set correlation coefficient (R2) of 0.59 and root mean square error (RMSE) of 1.02, and a validation set R2 of 0.66 and RMSE of 0.94. The wavelengths at 464.3, 503.2, 539.3, 579, and 711.3 nm were identified as critical for developing the soluble sugar content prediction model. The study demonstrated the potential of Near-Infrared Spectroscopy (NIS) as a rapid and non-destructive method for predicting chestnut soluble sugar content, which could be beneficial for quality control and sorting in the food industry.
Chinese chestnuts, members of the Fagaceae family, provide ecological and economic benefits and have been cultivated in China for over three millennia (Barakat et al., 2009). Because of their distinctive taste, chestnuts are highly sought after in international markets, which contain lower levels of fat and protein but higher amounts of water and carbohydrates compared to other nuts (Desmaison et al., 1984; Ümran et al., 2006). This unique property allows chestnuts to be consumed either raw or cooked, as well as processed into various forms such as canned foods, cakes, and confectioneries (Senem et al., 2021).
Sweetness is a crucial component of fruit flavor and plays an integral role in fruit quality formation (Wang et al., 2022). Soluble sugar content and composition are the main determinants of fruit sweetness, which not only effectively modulates the human taste system but also provides beneficial carbohydrates to humans (Vânia et al., 2021; Alessandra et al., 2022). Therefore, the content and composition of soluble sugars are essential for the evaluation of fruit quality (Li M. et al., 2018). Chestnuts are rich in soluble sugars, mainly consisting of sucrose, fructose and glucose, and their sweetness also depends on the content of these three sugars. However, their content is influenced by factors such as variety, growing location, and other environmental conditions (Freinkel, 2009; Pereira-Lorenzo et al., 2010). Genetic selection is necessary to obtain good quality chestnuts and to reduce the impact of environmental factors on soluble sugars. However genetic selection usually depends on extensive experiments and large sample sizes (Couture et al., 2016). While traditional methods for determining soluble sugar content in chestnuts yield accurate measurements, they require kernel peeling and drying, rendering them time-consuming, laborious, and destructive, thereby rendering them unsuitable for large-scale genetic selection. Therefore, there is a pressing need to develop rapid, non-destructive, and straightforward methods for determining soluble sugars in chestnuts to expedite the progress of genetic selection.
With the advancements in chemometric methods and spectroscopic instrument hardware technology, spectroscopic analysis has become a mainstream technique for non-destructive detection of the internal quality of fruits (Maria et al., 2021). Hyperspectral imaging technology is a rapid, eco-friendly, non-destructive, and efficient detection method (Yu et al., 2009; Yang et al., 2020). It reflects the absorption information of molecules, such as hydrogen-containing groups like C-H, O-H, and N-H, in the ensemble and multiplicity frequencies. When combined with chemometric methods, spectroscopy can perform qualitative and quantitative analysis of relevant chemical components (Luypaert et al., 2007; Shi and Yu, 2017), it has been widely used in various fields.
However, the spectral information obtained directly using spectral analysis techniques often contains noise and other irrelevant information that can affect model building. To filter out useful spectral information and ensure model stability, preprocessing of the spectra is necessary (Du et al., 2020; Albanell et al., 2021). Commonly used spectral preprocessing methods include smoothing, first-order derivative, second-order derivative, standard normal variable transformation, batch normalization and so on (Gai et al., 2022; Xiao et al., 2022).
Furthermore, spectral data often exhibit problems such as wide spectral bands, overlapping absorption peaks, serious co-linearity between adjacent bands, and contain a large amount of redundant information (Webb et al., 2020). To reduce the modeling wavenumber, simplify the model, and improve model prediction accuracy, it is necessary to select spectral variables and remove noise and interference variables that are independent of the target attribute before establishing the model (Li and Zhao, 2019). Successive projections algorithm (SPA), Monte Carlo uninformative variable elimination (MCUVE), uninformative variable elimination (UVE) and randomized tests (RT) are common variable selection algorithms (Li P. et al., 2018; Cheng et al., 2020).
The establishment of a stable and accurate quantitative analysis model is of utmost importance in the application of spectral analysis techniques. Commonly used methods for model establishment include PLS, principal component regression (PCR), multiple linear regression (MLR), and artificial neural networks (ANN) (Hein, 2010; Yang et al., 2018). Among these methods, PLS is widely used and is particularly effective in handling regression relationships between multiple variables when variables are highly correlated. It is able to effectively solve the problem of many variables and small sample size (Keshav, 2021). The PLS method combines the advantages of principal component regression and multiple linear regression methods, with the smallest sum of squares of errors and a relatively simple model with high predictive accuracy (Mehmood et al., 2020; Beyaztas and Lin, 2022).
In recent years, hyperspectral imaging techniques have been widely used to detect quality parameters in fruits and vegetables, such as apples (Zhang Y. et al., 2021), peaches (Jiang et al., 2021), carrots and tomatoes (Roberto et al., 2018). However, no hyperspectral techniques have been reported for the detection of quality parameters in chestnuts to date.
In the present study, a model for the prediction of soluble sugars in chestnuts was developed using hyperspectral imaging combined with chemometrics. The aims of the study were to (1) investigate the potential of spectroscopic techniques in quantifying the soluble sugar content of chestnuts and establish an optimal prediction model; (2) identify the best pre-treatment method for soluble sugars during model building; and (3) determine the most important wavelengths associated with the soluble sugar content of chestnuts for non-destructive detection during model calibration.
In this study, a total of 112 chestnut varieties were collected from the provincial chestnut germplasm nursery in Lanxi county, Zhejiang Province, China in August 2022. The chestnut trees were planted in 2012 with a spacing of 3 × 4 m and consisted of 6 plants per variety, which were meticulously maintained each year and have now reached full maturity. Ten to fifteen chestnut bracts of consistent size and appearance were harvested from each variety and kept at room temperature for 5 days. Afterward, the bracts and shells were removed, and three kernels of uniform size and color were selected as experimental material. The samples were stored at −20°C until further analysis.
Spectral and image data were collected using a hyperspectral imager (GaiaSkyMini2-VN) with 176 spectral bands, a spectral range of 400–1000 nm and a spectral resolution of 3 ± 0.5 nm, manufactured at JiangSu Dualix Spectral Image Ltd., China. Prior to the acquisition of the hyperspectral images, the chestnuts were removed from the −20° refrigerator and left at room temperature for 4 h to bring the chestnuts to the same room temperature as the images were acquired and to dry the moisture on the surface of the chestnuts.
In addition, black and white correction is required prior to image acquisition. The calibration process involved obtaining a black and white corrected reference reflectance spectrum. This was achieved by scanning a white plate (0% reflectance) to acquire an all-white calibration image R1, covering the camera lens with a cap (100% reflectance) to obtain an all-black calibration image R2, and scanning the sample to obtain the original diffuse reflectance spectrum R3. The calibrated diffuse reflectance spectrum R was then calculated using equation (1), as described by Guo et al. (2019).
Figure 1 depicts the experimental setup used for collecting hyperspectral information. The hyperspectral camera is mounted on a tripod, with the optical axis oriented perpendicular to the carrier table located below. The imaging lens is positioned 60cm away from the carrier table, and the scanning range is 45° left and right. An illumination system consisting of halogen lamp light sources is placed on each side of the camera lens, positioned at a 30° angle in the vertical plane. The samples are labeled with numbers and placed on the carrier table.
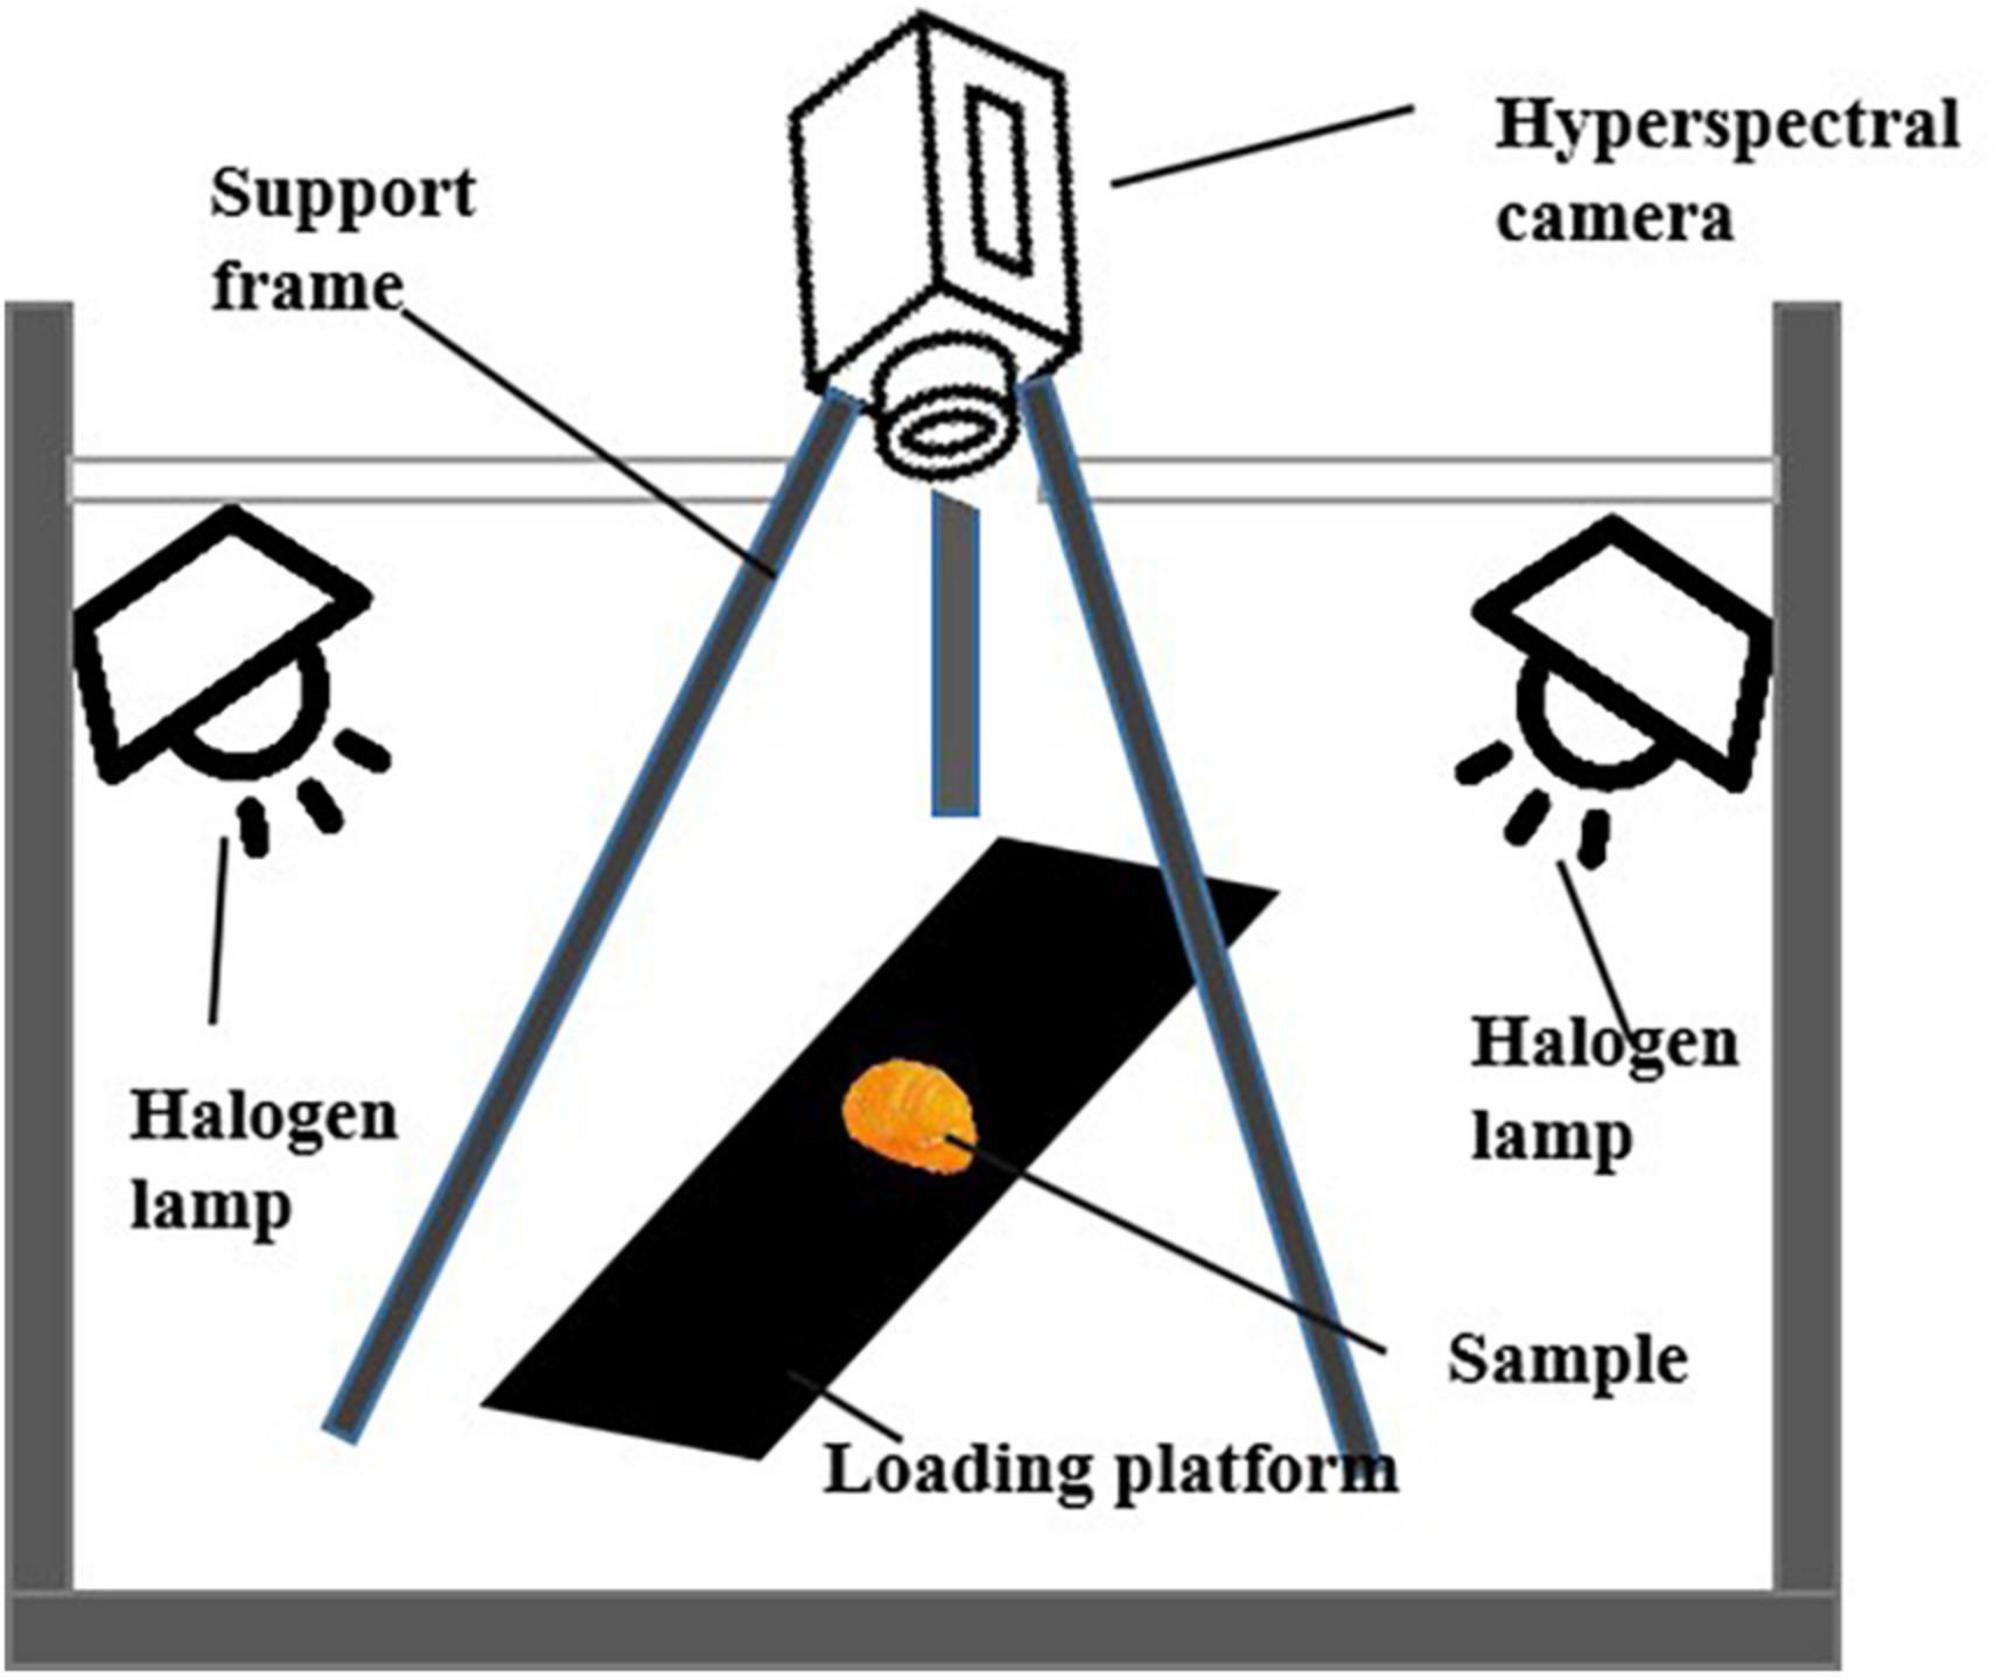
Figure 1. Simplified schematic of the hyperspectral imaging system.
After the spectral data collection, the chestnut kernel was ground into fine powder. A sample of 0.02 g was weighed to correspond with the kernels from which the spectral data was collected. The soluble sugar content of the samples was determined using the anthrone colorimetric method.
The spectral images corrected for black and white references were imported into the ENVI 5.3 software and regions of interest (ROI) were selected using the Region of Interest Tool on the software toolbar. ROI were randomly cropped on the kernels, with the shaded edges excluded, to obtain a total of 336 ROI for 112 species of chestnuts, depending on the chestnut species. Figure 2 illustrates the process where (a) shows an image of a chestnut kernel captured by the hyperspectral camera, while (b) and (c) depict the randomly selected green ROI regions, and the red areas indicate the background to be removed.
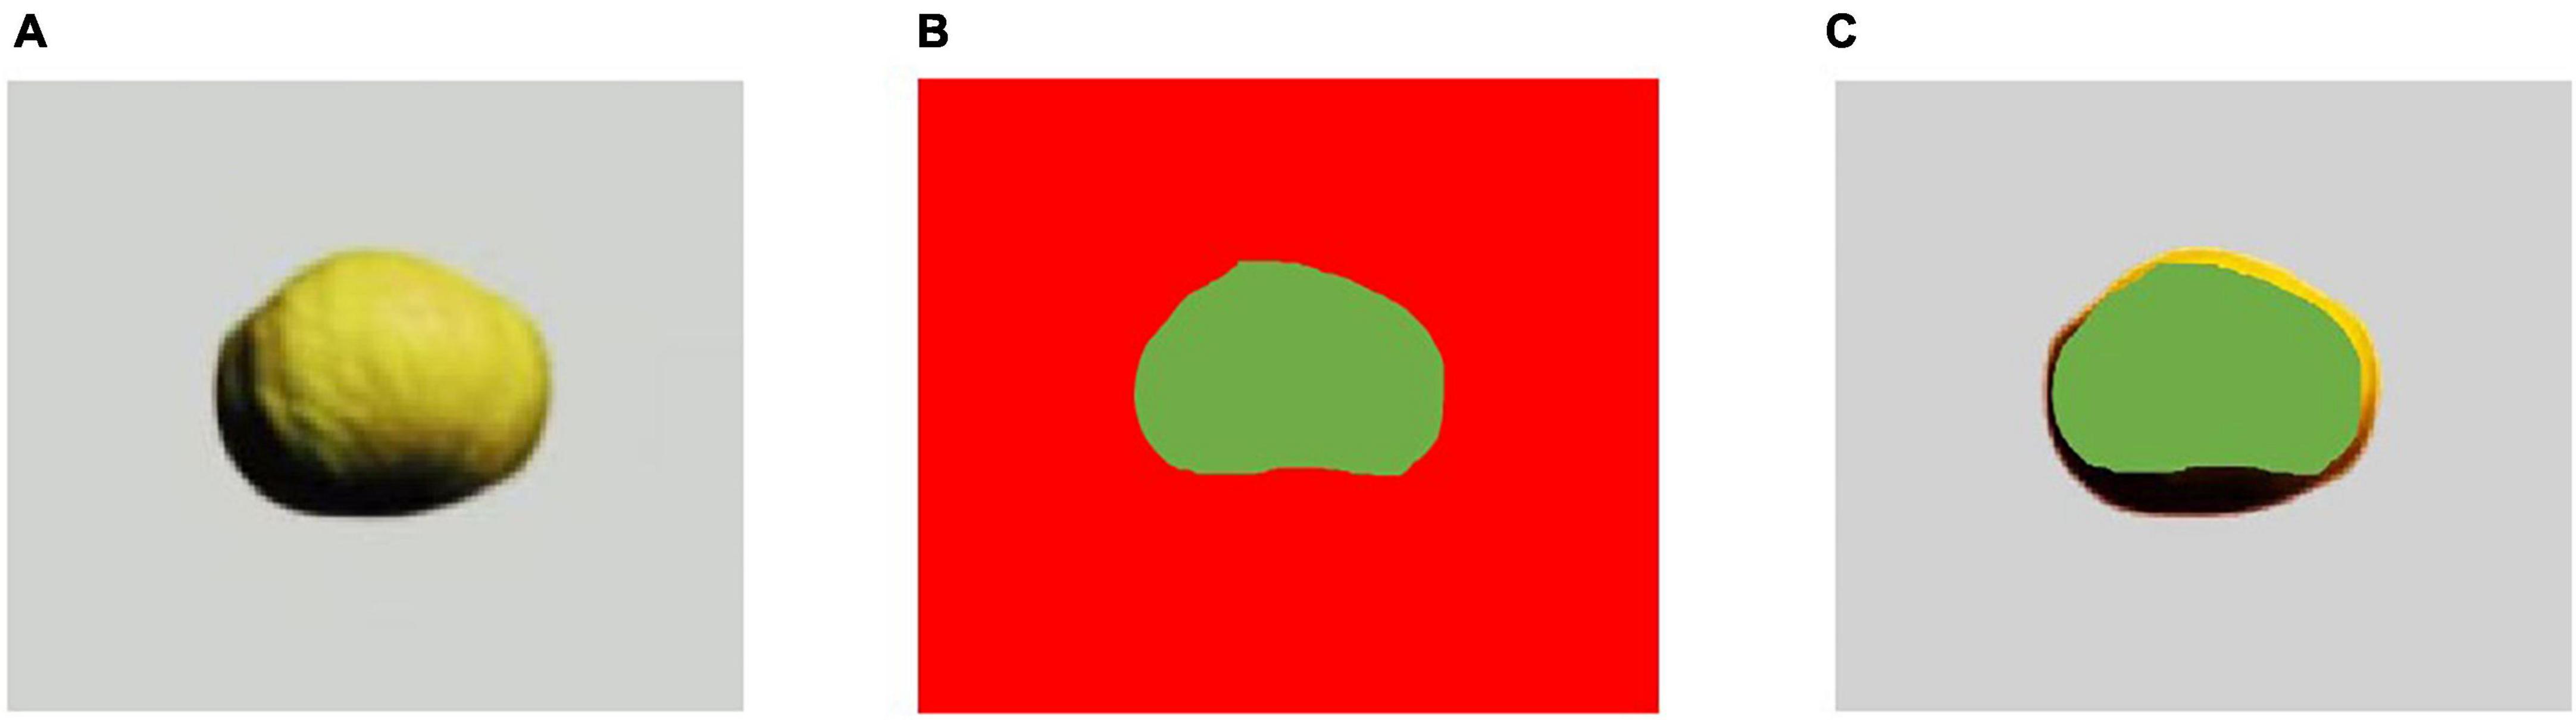
Figure 2. (A) Hyperspectral image of the obtained chestnut sample; (B) red background and the selected green regions of interest (ROI) region of the sample; (C) the selected ROI region is indicated in panel (A).
To improve the accuracy and reliability of the quantitative analysis model for chestnut soluble sugars, it is necessary to remove outliers in the samples prior to spectral pre-processing. This experiment uses Ensemble Partial Least Squares for outlier detection to remove outliers (Cao et al., 2017). As this methodology could efficiently detect and remove the outliers by combining multiple models, each trained on different subsets of data and it is able to capture different patterns and relationships present in the dataset.
After removing the anomalous samples, spectral data must be pre-processed to reduce the noise and interference information in the spectra (Zhang L. et al., 2020). To achieve this, Standard normal variate transformation (SNV) (Barnes et al., 1989), BS (Eriksson et al., 2001), block normal (BN) (Eriksson et al., 2001), first-order derivative, and second-order derivative (1st and 2nd) using the Savitzky–Golay (SG) filters (Luo et al., 2005) were used for single and composite processing. The optimal treatment was selected based on the R2 and RMSE.
Recent research has shown that variable selection of the original spectrum can reduce computational complexity and improve the predictiveness of the model (Alizadeh et al., 2019). In this study, Backward Variable Elimination (bve) (Eason, 1990; Austin, 2008), regularization elimination (rep) (Molajou et al., 2021), and significant multivariate correlation (sMC) algorithm (Liu et al., 2021) were used for variable selection.
The PLS method was used to build the prediction model for this experiment, the spectral data underwent pre-processing and variable selection, with 80% randomly selected as the calibration set and 20% as the validation set. The PLS model was tested with 100 simulations to assess its overall stability and predictive performance (Couture et al., 2016). The effectiveness of the linear fit of the spectral values to the soluble sugar content was evaluated by the R2 and RMSE, which measure the degree of correlation and deviation between predicted and measured values, respectively (Mohammad, 2020; Karunasingha, 2022). A higher R2 value closer to 1 and a lower RMSE value closer to 0 indicate better predictive performance of the model (He et al., 2022).
All data analysis and image production were conducted using R software. The “prospectr” package (Stevens and Ramirez-Lopez, 2014) was used for spectral pre-processing, the “plsVarSel” package (Mehmood et al., 2012) for variable selection, the “pls” package (Wehrens and Mevik, 2007) and the “enpls” package (Xiao et al., 2019) for constructing PLS models and the “ggplot2” package (Villanueva and Chen, 2019) for generating image visualizations.
The framework follow chart is shown in Figure 3.
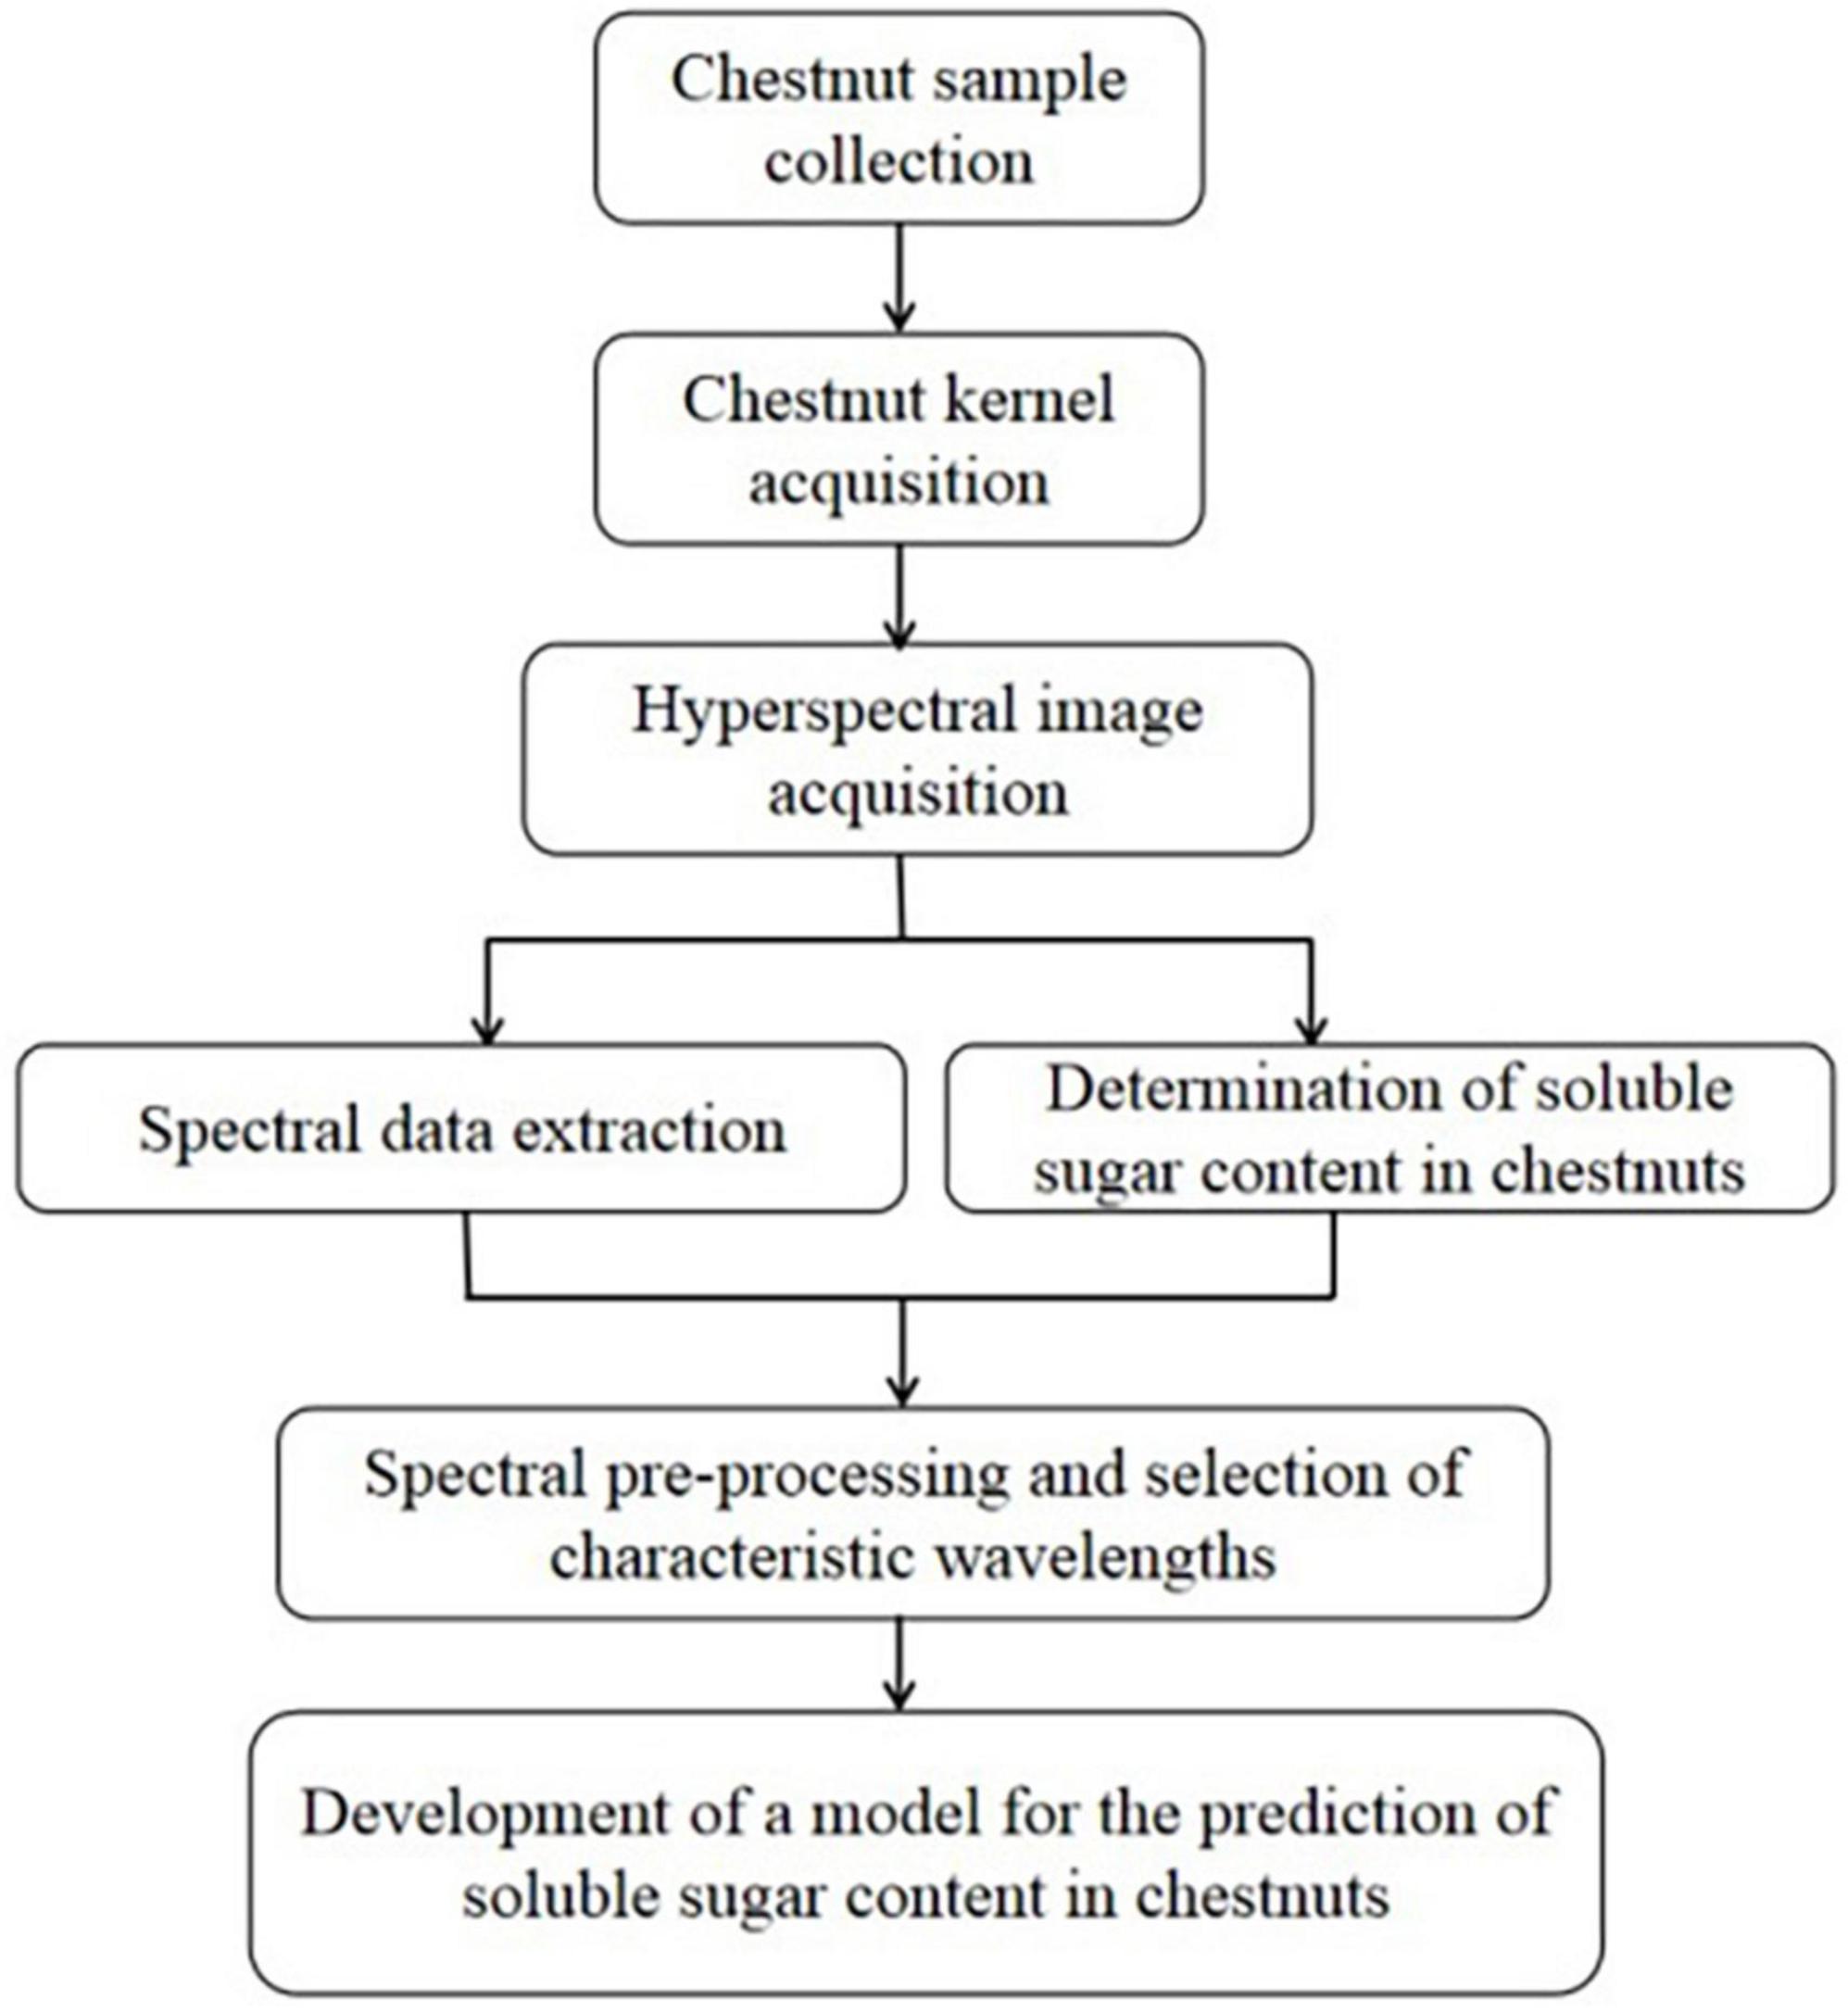
Figure 3. Workflow diagram for model building of soluble sugar content prediction in chestnut.
The abnormal samples were excluded using ensemble partial least squares for outlier detection, and screened based on the sample error mean and error standard deviation (SD). Figure 4 illustrates that the upper left region with a large error SD represents the sample with abnormal spectral value, while the lower left region displays the normal sample selected for analysis. The upper right region with a large error mean and error SD represents the sample with abnormal spectral value and soluble sugar content of chestnut, while the lower right region with a large error mean corresponds to the sample with abnormal soluble sugar content.
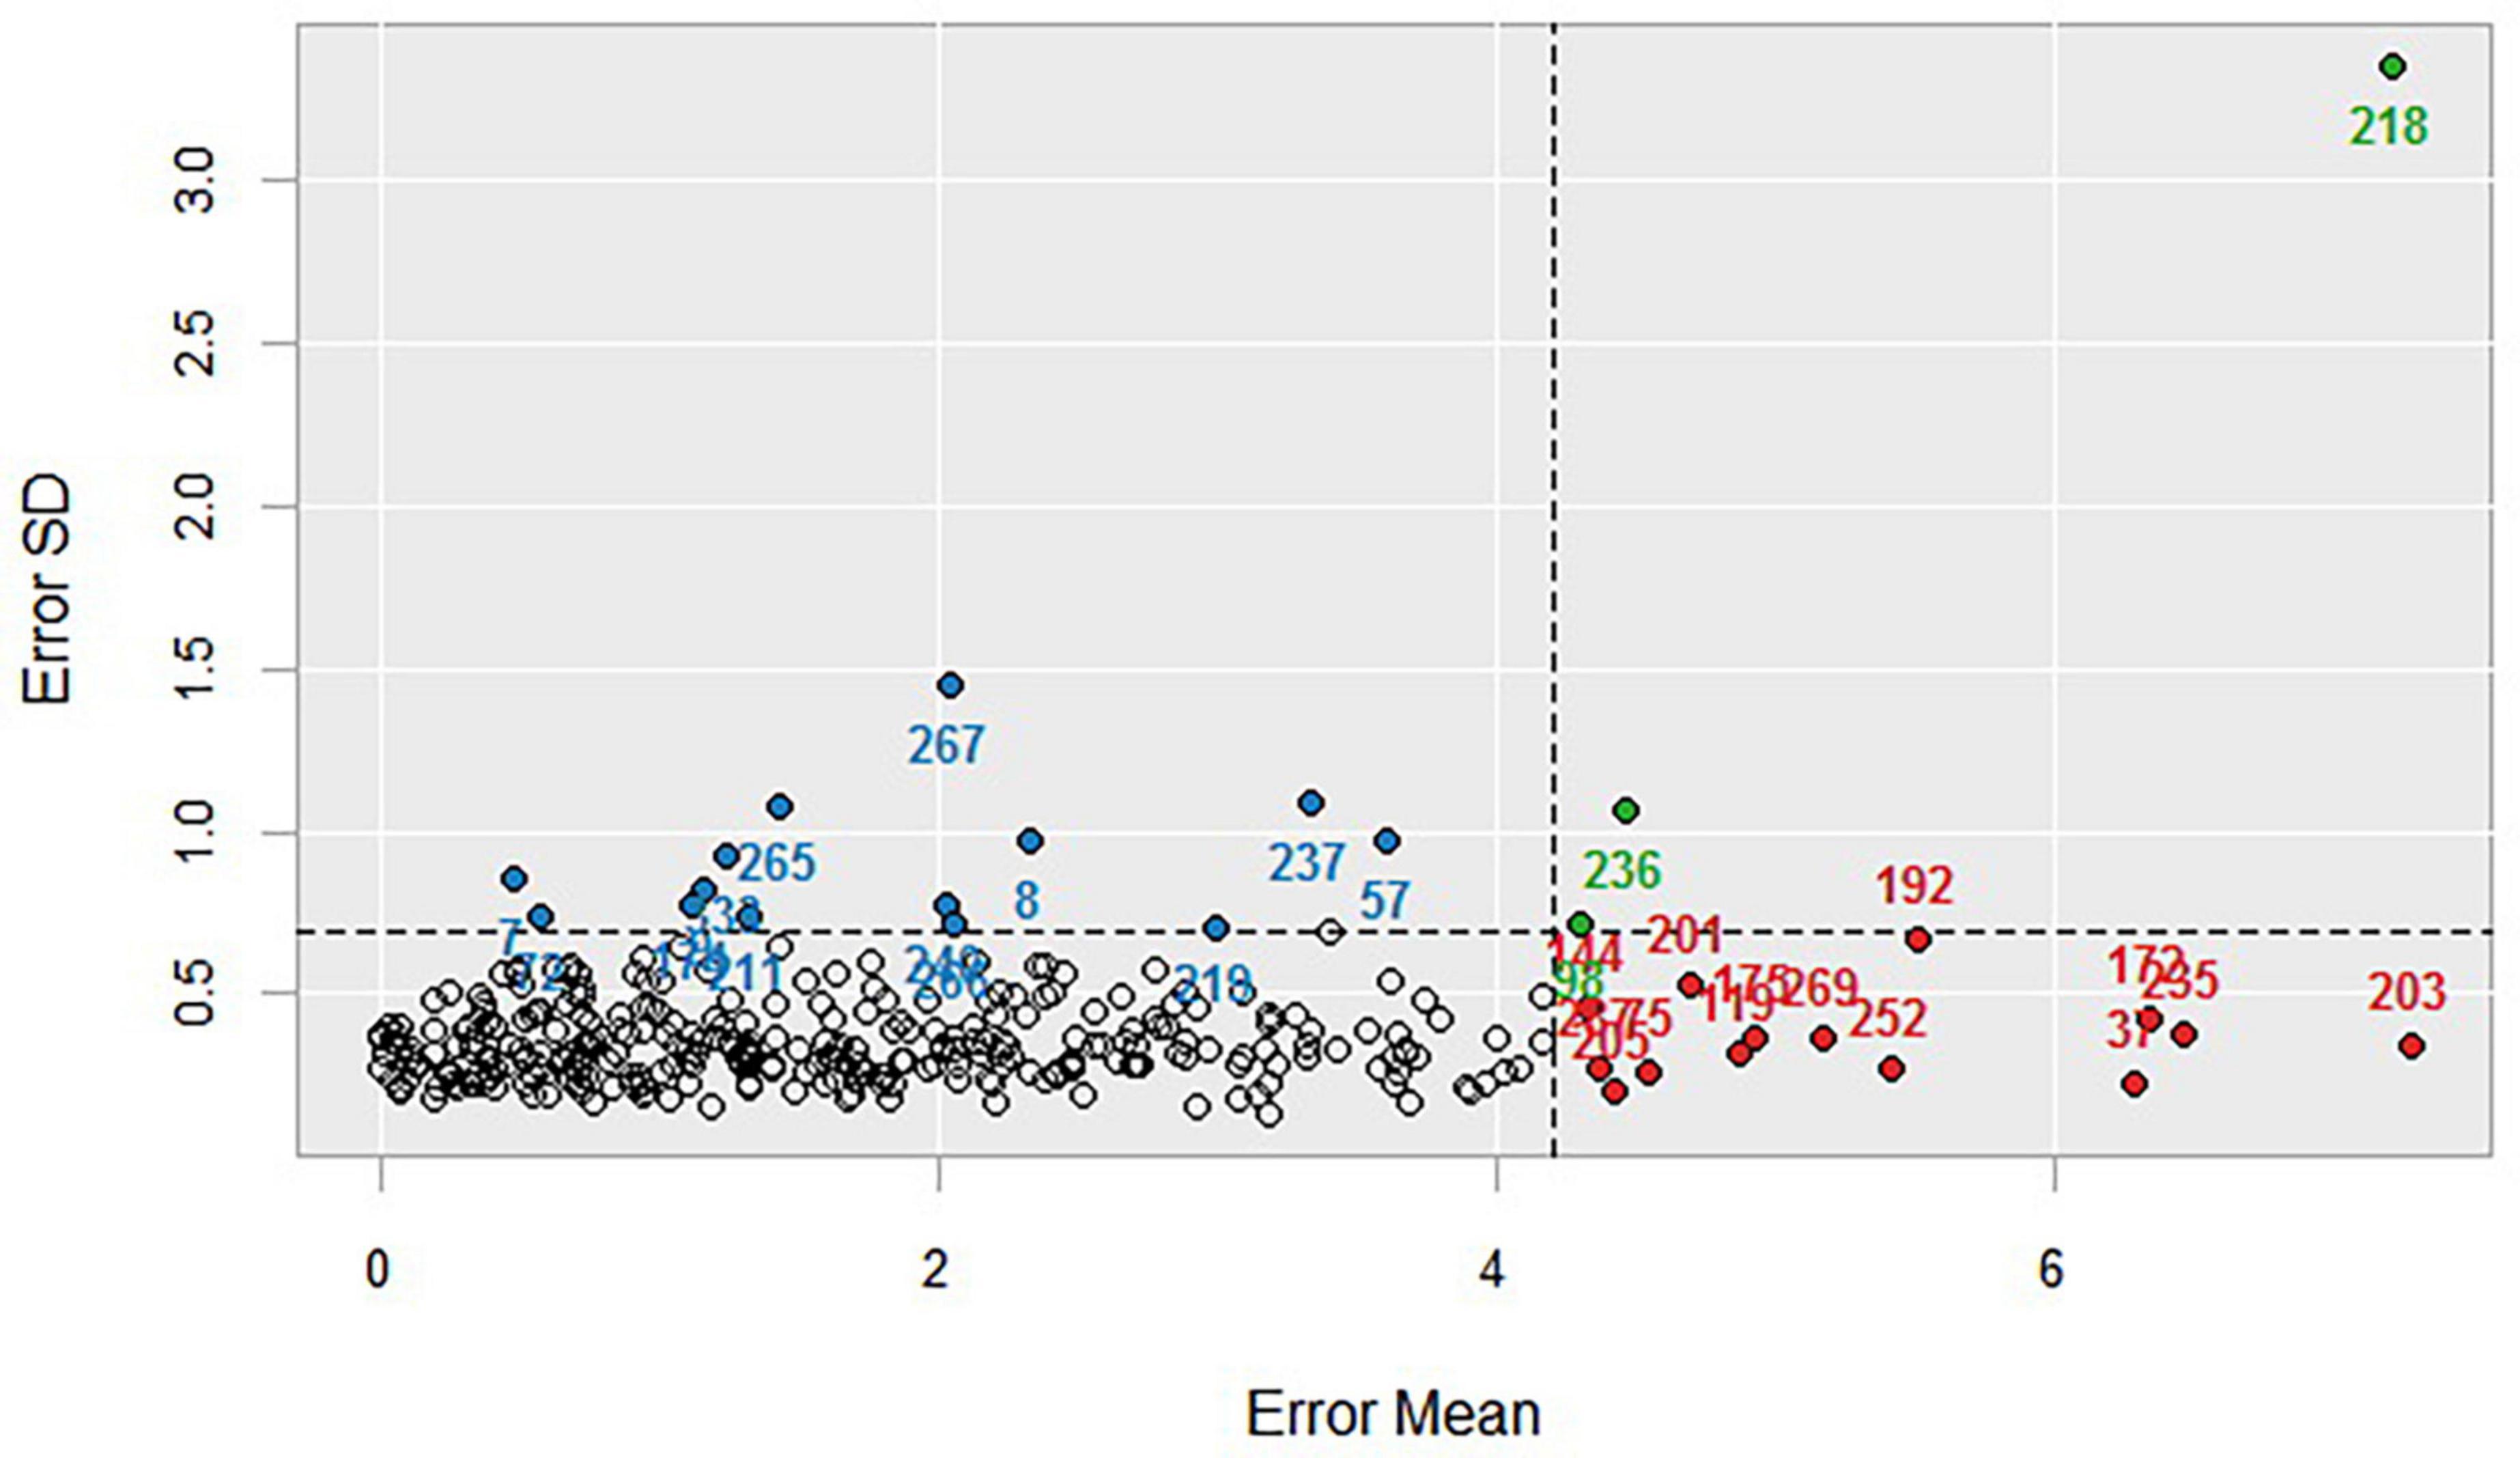
Figure 4. Ensemble partial least squares for outlier detection. The marked values in the graph indicate sample numbers, blue, green, and red circles indicate abnormal values and blank circles indicate normal values.
The results of model calibration using the selected best pretreatment BS and three variable selection methods are shown in Table 1. The model built using BS spectral pre-processing demonstrated higher accuracy compared to the original spectra and other variable selection methods.
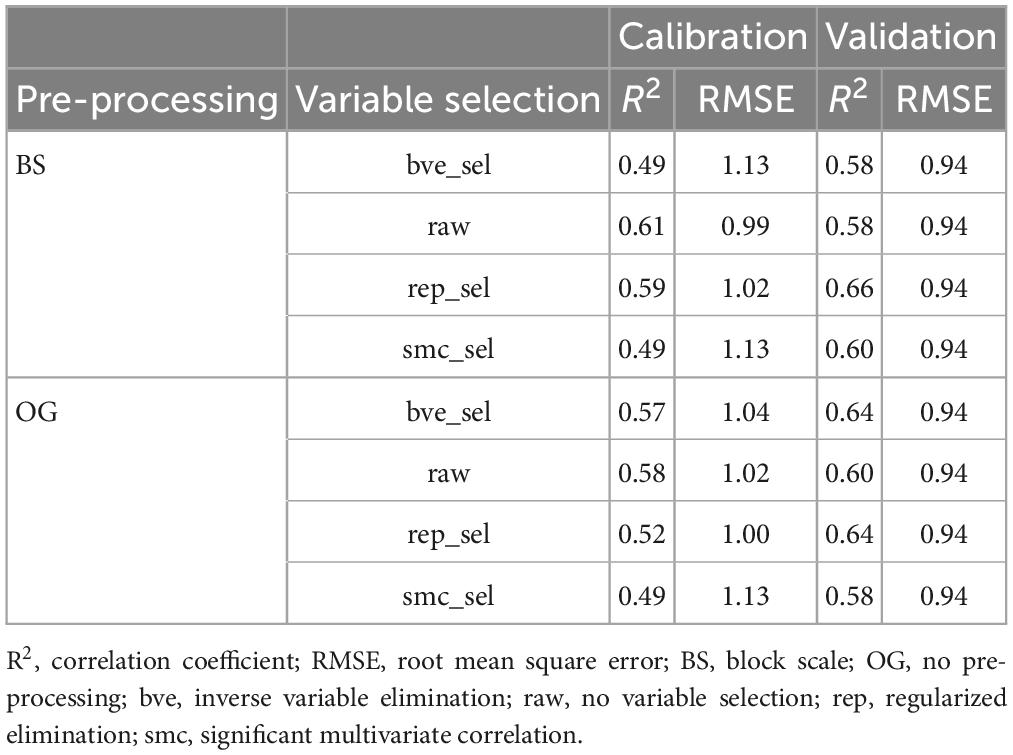
Table 1. Optimal pretreatment and partial least squares (PLS) prediction models used to estimate soluble sugars.
For the model that uses original bands (OG) without pre-processing, the calibration set R2 ranged from 0.49 to 0.58, with RMSE values ranging from 1.00 to 1.13. The validation set R2 ranged from 0.58 to 0.64, with an RMSE value of 0.94. The models after BS preprocessing had a calibration set R2 in the range of 0.49–0.61 and RMSE values in the range of 0.99–1.13. The validation set R2 ranged from 0.58 to 0.66, with all RMSE values at 0.94. The variable selection method for the model after BS preprocessing varied depending on the selection method and the model accuracy. The accuracy of variable selection using bve and sMC was lower than that of no variable selection (raw). The best accuracy was obtained using the rep variable selection method, with calibration set R2 and RMSE values of 0.59 and 1.02, respectively, and validation set R2 and RMSE values of 0.66 and 0.94, respectively.
Figure 5A depicts the original average spectra of the chestnut samples. The spectral signals exhibited slight variations due to differences in size, color, and internal composition of the chestnuts, but demonstrated consistent trends and high spectral overlap. Subsequently, (b) illustrates the average spectrum after block scale pretreatment, which indicated significant differences from the original spectra. The pretreated spectra exhibited two small absorption peaks in the 403.7 ∼ 429.1 nm band and 454.7 ∼ 500 nm band, less fluctuation in the spectral curves from 503.2 to 687.2 nm, and a considerable increase in spectral absorption between 690.6 and 927.8 nm. Notably, the spectral absorbance between 690.6 and 927.8 nm exhibited a substantial surge, peaking at 927.8 nm, while the spectral curve between 931.5 and 993.9 nm decreased.
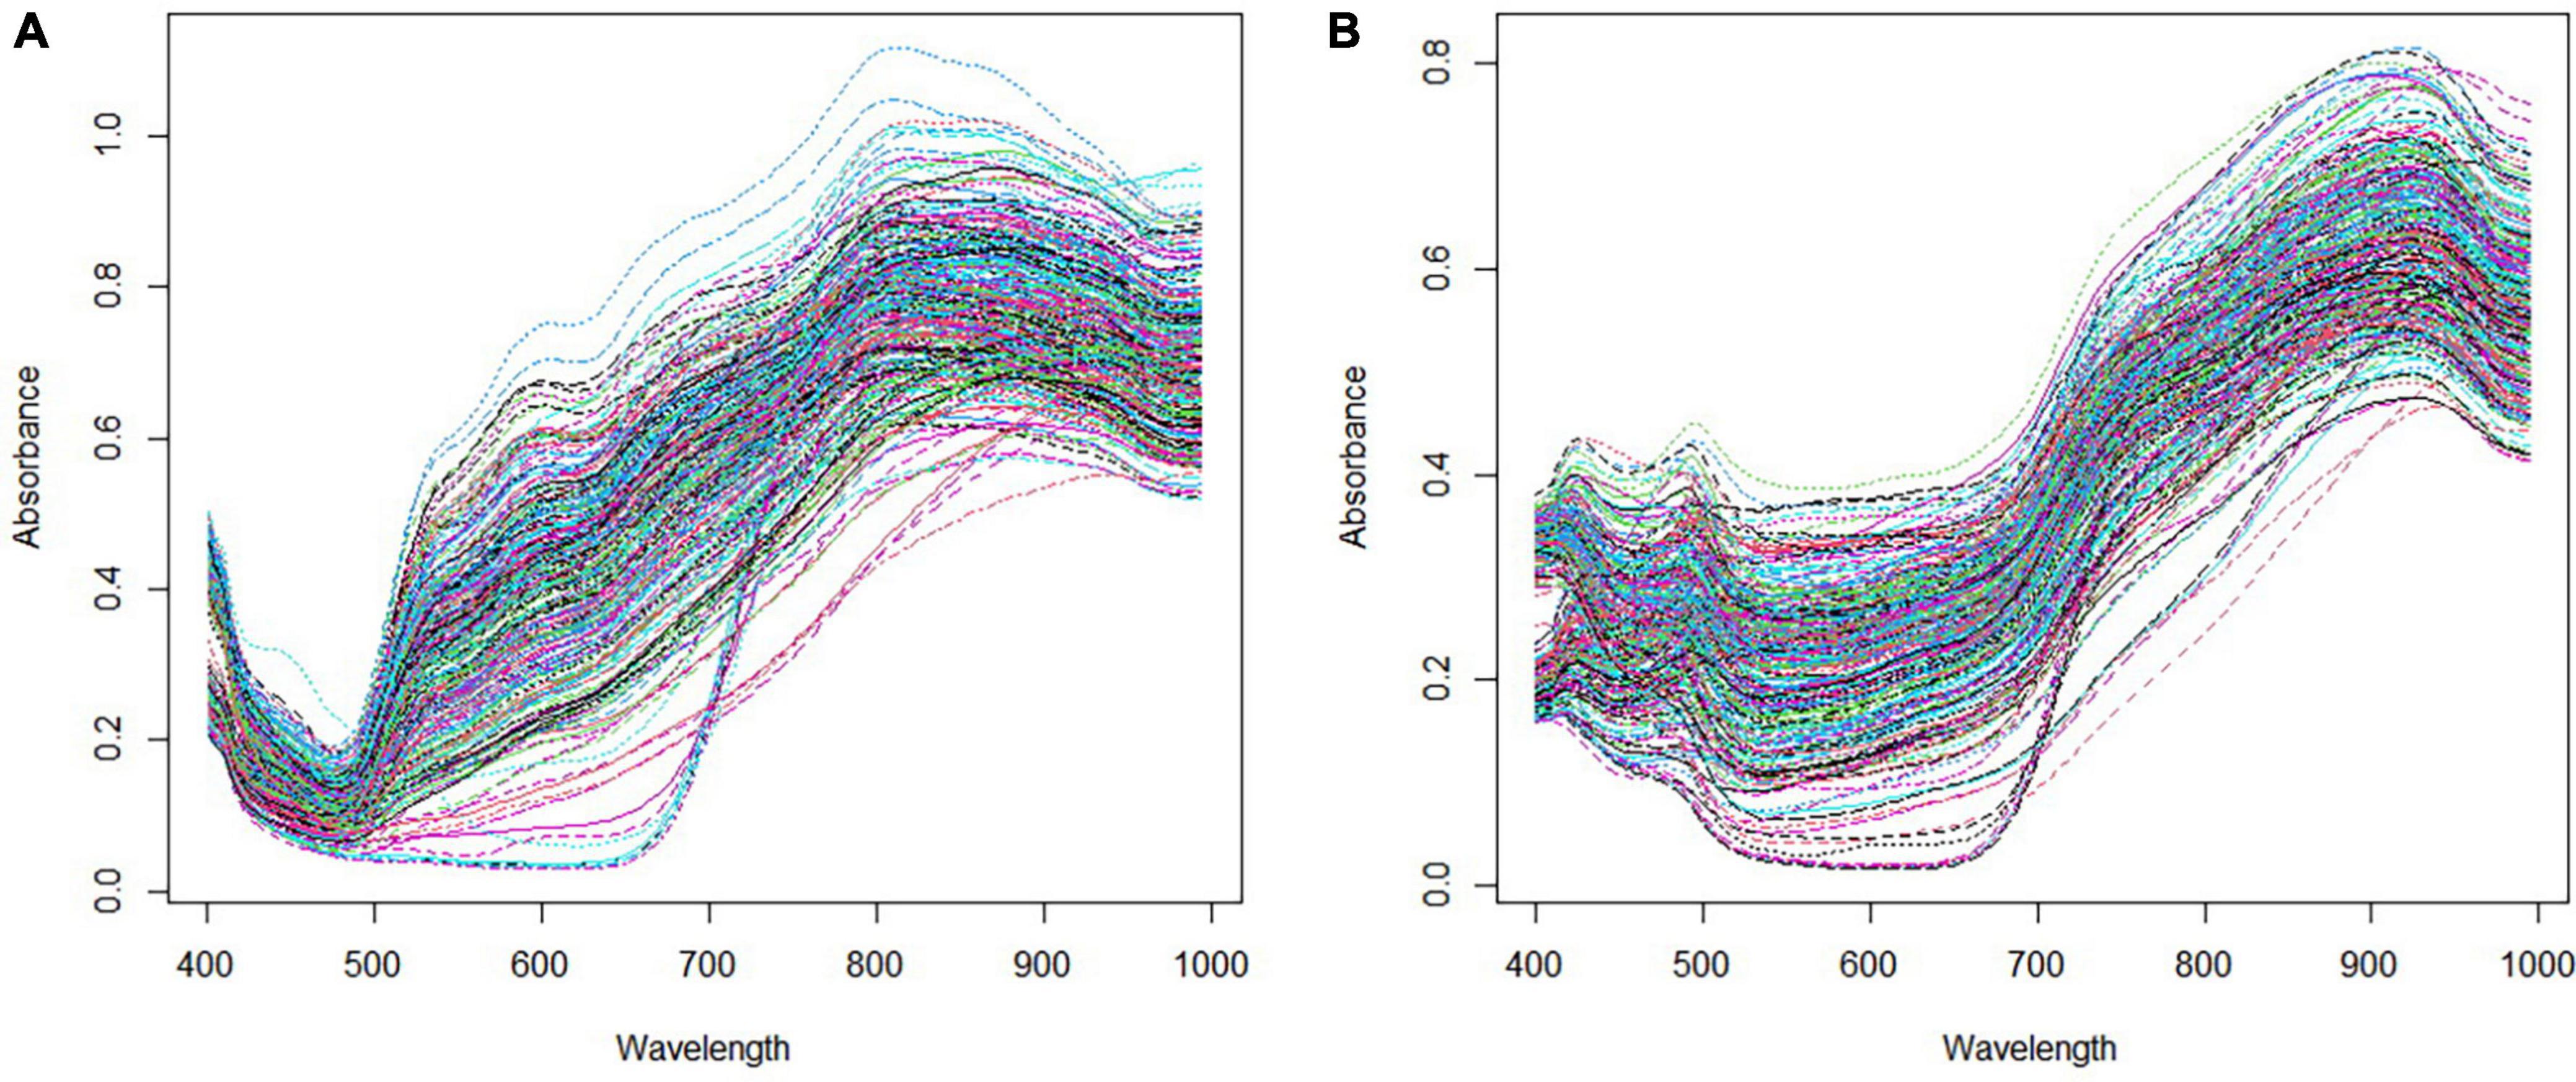
Figure 5. Raw mean spectra of panel (A) and mean spectra of BS pretreated (B).
The measured and predicted values of soluble sugars obtained by PLS regression using BS- rep and the original full spectrum are shown in Figures 6A, B. The prediction errors for both models are at the lower end of the range, with the spectrally treated model fitting slightly more accurately than the original full-spectrum fit. The wavenumber (wave) after variable selection is 42 and the wave of the original full spectrum is 176. These results confirm the feasibility of hyperspectral imaging for rapid and non-destructive prediction of the soluble sugar content of chestnuts.
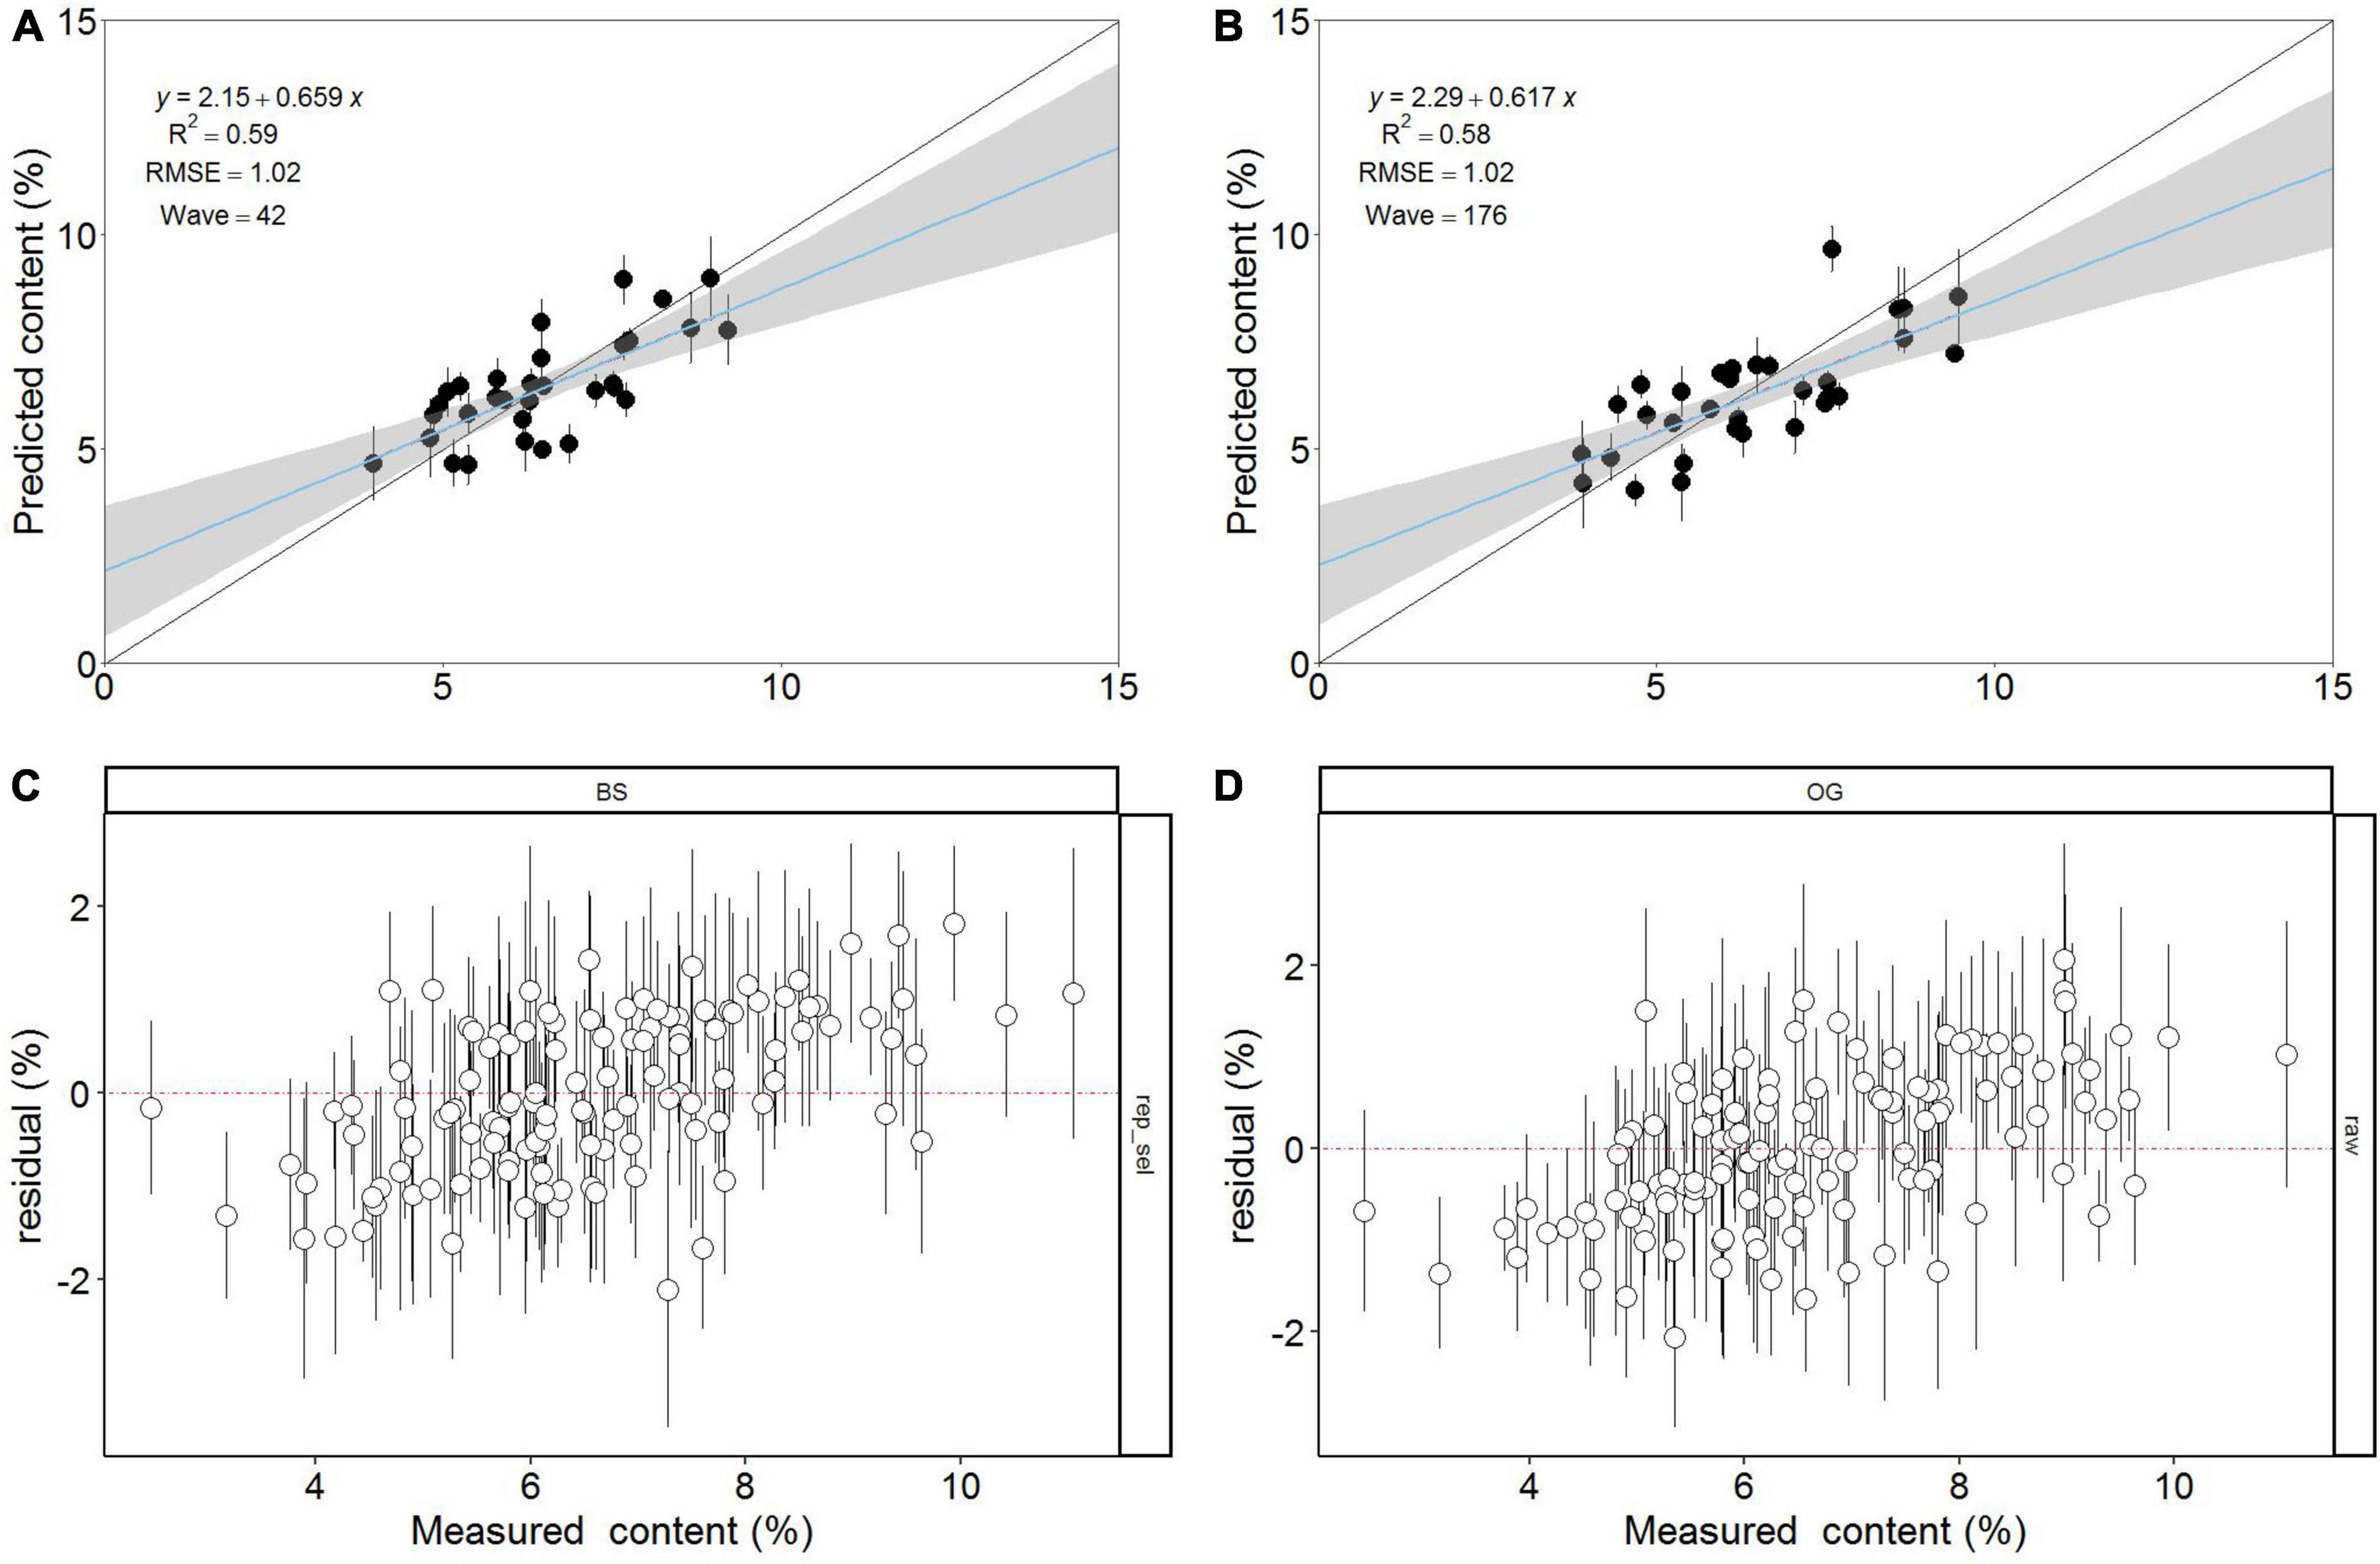
Figure 6. (A) Partial least squares (PLS) prediction model obtained based on BS-rep. (B) PLS prediction model of the original mean spectrum. The regression line of the model is the solid blue line, and the solid black line indicates that the measured and predicted values of soluble sugars are equal. (C) Plot of residuals versus soluble sugar measurements based on BS-rep spectra. (D) Plot of residuals versus soluble sugar measurements for raw mean spectra. Error bars for predicted values represent the SDs obtained from the 100 simulated models. Wave mean wavenumber.
the residuals of the best processing model and the raw spectra have been displayed in Figures 6C, D, respectively. It can be seen that chestnut soluble sugar content is easily underestimated below 5% and more likely to be overestimated above 7%. The residuals for the best treatment model ranged from −2.11 to 1.81, compared to −2.07 ∼ 2.06 for the model without spectral treatment.
Furthermore, Figure 7 depicted the significant variables selected by the rep algorithm, revealing that the selected wavelengths at 464.3, 503.2, 539.3, 579, and 711.3 nm are critical for developing the soluble sugar content prediction model.
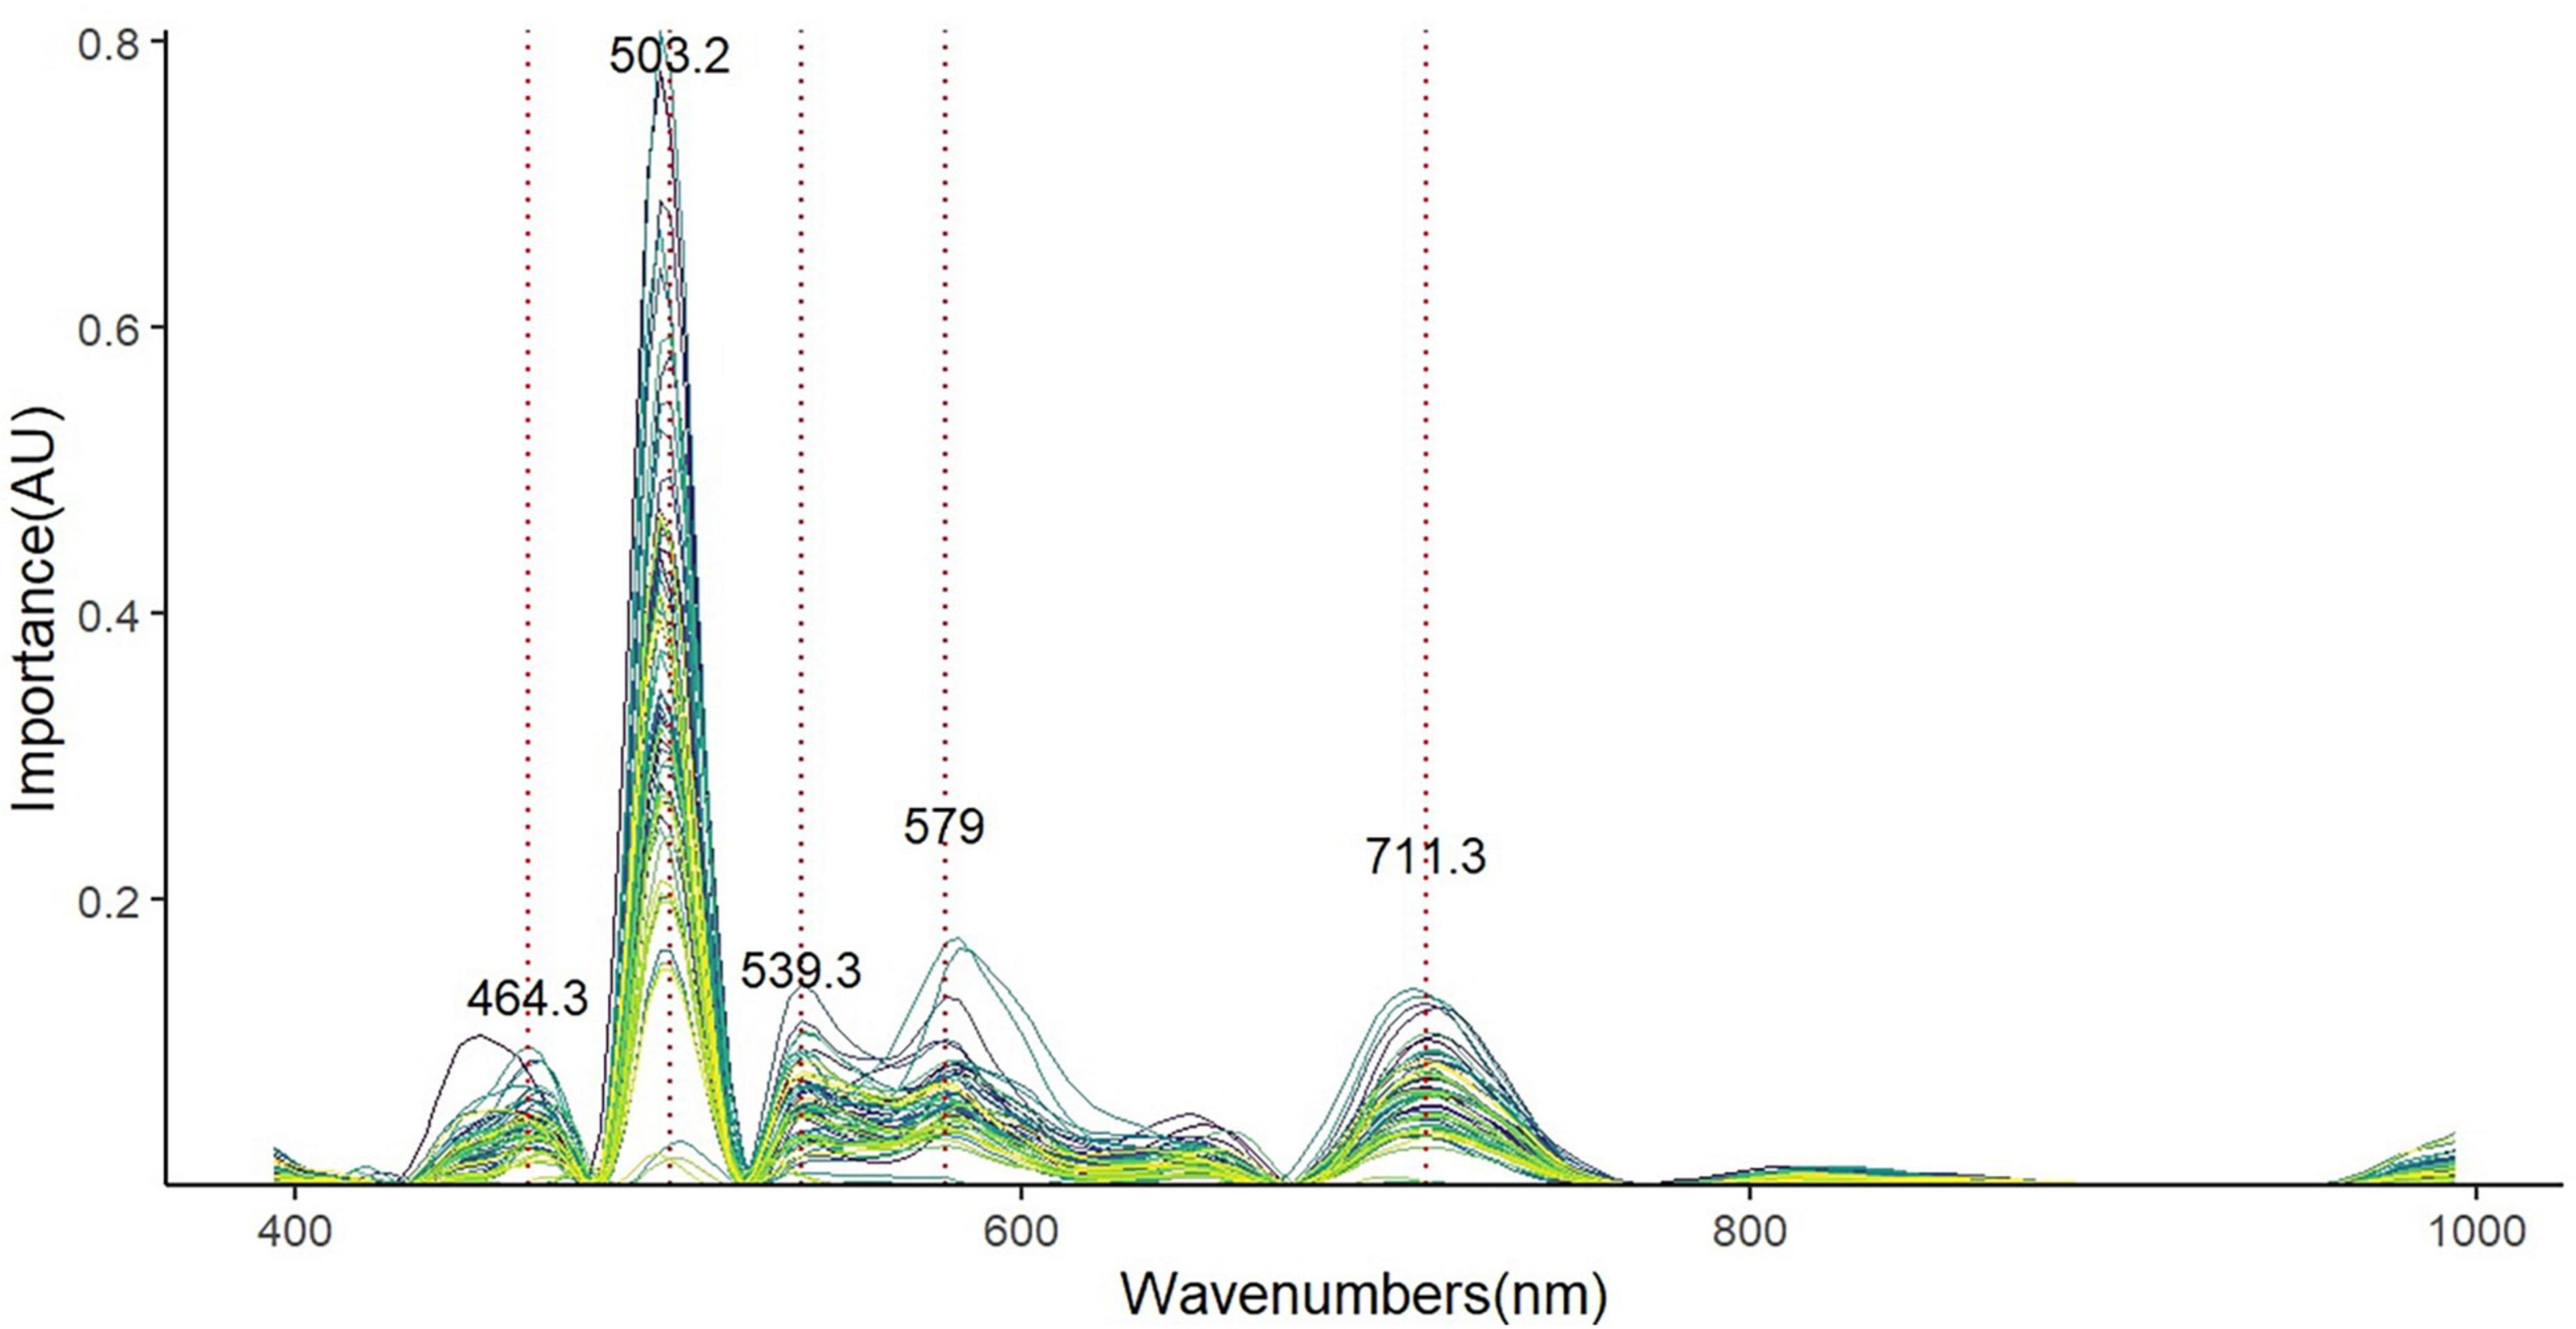
Figure 7. Spectral effects of 100 random runs of the soluble sugar model.
As an emerging technology, hyperspectral imaging can acquire both image and spectral information of samples, which is efficient, fast and non-destructive, and is widely used in medicine, agriculture and food quality (Halicek et al., 2019; Lu et al., 2020; Zhu et al., 2020). In agriculture, hyperspectral imaging technology can be used as a non-destructive inspection tool, which has a broad application in fruit and vegetable quality monitoring and variety selection (Faqeerzada et al., 2020). Hyperspectral imaging has already been used for the detection and grading of apple bruises (Tan et al., 2018), the assessment of kiwi ripeness (Serranti et al., 2018), and the analytical determination of soluble solids content in oranges (Zhang et al., 2020a). In this study, a hyperspectral camera was used to obtain spectral and image information of chestnuts. The aim was to explore the feasibility of hyperspectral image techniques in detecting the soluble sugar content of chestnuts. Soluble sugars play a crucial role in plant growth and development, serving not only as signaling molecules but also as key indicators of fruit quality due to their content and fraction within the fruit (León and Sheen, 2003; Tang et al., 2021). Consequently, developing a rapid, convenient, and non-destructive method for determining soluble sugar content is essential for fruit quality assessment and new variety selection.
To this end, this study examined the relationship between soluble sugars and hyperspectral images by integrating BS preprocessing methods, original spectra, and three commonly used machine learning techniques. The results indicated that the optimal prediction model combined the BS preprocessing method with the rep variable selection method, achieving R2 and RMSE values of 0.59 and 1.02, respectively. These values were lower than the R2 and RMSE values obtained when predicting the soluble sugar content of sweet maize (R2 = 0.8431, RMSE = 5.8292) (Yang et al., 2020). The discrepancy may be attributed to the freshness of the chestnut used for spectral data collection, their high water content, and the complex texture and composition of the chestnut kernels. The strong absorption of water in the NIR spectral band, in conjunction with other compounds present in the fruit, renders the collected spectra highly intricate (He et al., 2021). Moreover, the collected spectra encompass not only absorption information related to the chemical composition but also scattering information pertaining to the internal fruit structure, complicating the accurate assignment of specific absorption bands to particular chemical components (Yuan et al., 2022). This resembles the prediction of soluble solids content by PLSR models based on visible/near-infrared spectroscopy of lychee, which may also be due to the non-uniform thickness and roughness of the lychee peel, as well as the complex composition of the flesh interior, resulting in limited model prediction accuracy (Pu et al., 2016).
It has been demonstrated that sugars are not uniformly distributed in fruits; therefore, collecting spectral information from multiple regions of the fruit surface can enhance the accuracy of predictive models (Jiang et al., 2021; Tan et al., 2022). Hyperspectral imaging, a novel method that merges spectroscopy and image analysis, yields both image and spectral information for a sample, providing a comprehensive depiction of its shape, texture, and intrinsic characteristics (Quan et al., 2014; Zhang et al., 2020b). However, hyperspectral imaging is substantially influenced by the sample’s curvature, and the acquired hyperspectral image data often contain numerous non-linearities. These factors necessitate hyperspectral data processing for reliable extraction of sample properties (Luka et al., 2021). Various treatments possess distinct characteristics. For example, SNV primarily eliminates scattering phenomena and filters the impact of optical range changes on the spectral signal during the experiment (Bi et al., 2016). The derivative removes baseline drift and background interference, enhances spectral differences, and improves resolution (Xu et al., 2008). Detrend eliminates baseline drift and curvature interference from the spectral signal (Luypaert et al., 2003). In practice, the appropriate processing method should be chosen based on the spectral data (Luo et al., 2020).
In a study on the rapid prediction of sugar content in Dangshan pears, the influence of fruit shape caused significant fluctuations in the fruit surface’s reflectance, preventing accurate spectral information from being obtained across the entire fruit surface. Mean normalization of the spectra partially mitigated the impact of fruit shape on the obtained spectra, improved spectral intensity differences, and yielded a more uniform grayscale distribution compared to the original (Zhang et al., 2018). In this study, the spectral intensity of chestnuts was also affected by the curvature of the hemispherical surface. To minimize the impact of curvature and other interfering information, the spectra were processed using BS. BS can identify information in different blocks, extract complementary information from them, balance the influence of building modules, and prevent any block from dominating the model, thereby reducing the effects of interfering information such as scattering, fruit shape, etc. (Campos and Reis, 2020; Puneet et al., 2021).
As shown in Figure 5, it is evident that the BS-processed spectral data are much more tightly clustered, and the absorption peaks become more pronounced compared to the original average spectra, although the absorption peaks exhibit a broader spectral range. Spectra provide light intensity values at each increment of the wavelength range, resulting in a large number of variables that necessitate considerable computational power to combine (Esposito and Houser, 2019). Direct modeling of the original full spectrum not only replicates the structure and incurs significant costs, but also negatively impacts the model’s stability. Therefore, it is essential to extract valid wavelength information as needed (Qi and Fu, 2022). These selected effective wavelengths reduce data dimensionality, contain the most critical information related to the sample traits, and can replace the original full spectrum for modeling. This approach increases the model accuracy and robustness while accelerating data computational speed and reducing the computational cost of the generated model (Saputro and Handayani, 2017; Zhang J. et al., 2021). In this experiment, variable selection based on BS pretreatment using bve, rep, and sMC was combined with PLS to construct PLS models for predicting soluble sugar content in chestnuts. The results of each model are shown in Table 1. Models built with bve and sMC selected wavelengths exhibited lower accuracy than those constructed using the original full spectrum, which may be attributed to the elimination of some information variables related to soluble sugars during the variable selection covariance removal process. This is similar to the pear fruit sugar content prediction model building, where models using SPA-selected variables were built with lower accuracy than full-spectrum modeling (Zhang et al., 2018). The model built using the variables selected by the rep method demonstrated marginally better performance than the model built from the original full spectrum. This improvement is because the problems of covariance and overfitting are alleviated by using only the effective wavelengths, eliminating redundant wavelengths that do not carry much spectral information, and reducing the amount of operations (Aquinocruz et al., 2021). This has also been demonstrated in non-destructive testing of strawberry quality attributes, where models built using selected effective wavelengths have higher predictive performance than those built from the original full spectrum (ElMasry et al., 2007). In this study, the important variables selected closely related to soluble sugars in chestnuts were 464.3, 503.2, 539.3, 579, and 711.3 nm, similar to those selected in bananas, namely 440, 525, 633, 672, 709, 760, 925, and 984 nm (Rajkumar et al., 2012). Furthermore, the residual analysis of the best model and the original spectral model was performed in this experiment. As seen in Figures 6C, D, the residuals of the best model were more evenly distributed and had a narrower bandwidth in the −2 to 2 interval compared to the original spectrum. It has been found that if the residual values are evenly distributed in the horizontal band and have a narrower bandwidth, this indicates that the chosen model is more appropriate and has better fitting accuracy (Couture et al., 2016).
The presented findings demonstrate the feasibility of utilizing hyperspectral imaging for predicting soluble sugar content in chestnuts. However, further improvements are required to refine the model and achieve optimal performance. Therefore, a comprehensive investigation of factors affecting spectral analysis and mitigation of their negative effects is necessary for enhancing subsequent research. Additionally, the exploration of a wider range of combinations of spectral processing and modeling methods is recommended to augment the sample.
This study explored the feasibility of using hyperspectral techniques to predict the soluble sugar content in chestnut fruits. Soluble sugars play a crucial role in determining chestnut fruit quality, as they influence both nutrition and flavor. The study applied various preprocessing methods to the spectral data, including SNV, derivative, DET, and BS, and employed machine learning techniques to establish a prediction model for soluble sugar content. The results indicated that the BS pretreatment method combined with rep variable selection yielded the optimal prediction model, with an R2 value of 0.59 and an RMSE value of 1.02. The selected model demonstrated higher accuracy in fitting the regression equation, suggesting that it was more appropriate and reliable for predicting soluble sugar content in chestnuts.
The original contributions presented in this study are included in the article/Supplementary material, further inquiries can be directed to the corresponding author.
JY conducted the experiment and wrote the manuscript. XJ designed the study and revised the manuscript. BG revised and corrected the manuscript. All authors read and approved the final manuscript.
This research was funded by the Zhejiang Science and Technology Major Program on Agriculture New Variety Breeding (2021C02070-4).
The authors declare that the research was conducted in the absence of any commercial or financial relationships that could be construed as a potential conflict of interest.
All claims expressed in this article are solely those of the authors and do not necessarily represent those of their affiliated organizations, or those of the publisher, the editors and the reviewers. Any product that may be evaluated in this article, or claim that may be made by its manufacturer, is not guaranteed or endorsed by the publisher.
The Supplementary Material for this article can be found online at: https://www.frontiersin.org/articles/10.3389/ffgc.2023.1203674/full#supplementary-material
Albanell, E., Martínez, M., De Marchi, M., and Manuelian, C. L. (2021). Prediction of bioactive compounds in barley by near-infrared reflectance spectroscopy (NIRS). J. Food Compost. Anal. 97:103763. doi: 10.1016/j.jfca.2020.103763
Alessandra, M., Elson, T., and Andre, B. H. M. (2022). Descriptive sensory profile and consumer study impact of different nutritive and non-nutritive sweeteners on the descriptive, temporal profile, and consumer acceptance in a peach juice matrix. Foods 11, 244–244. doi: 10.3390/foods11020244
Alizadeh, R., Jia, L., Nellippallil, A. B., Wang, G., and Mistree, F. (2019). Ensemble of surrogates and cross-validation for rapid and accurate predictions using small data sets. Artif. Intell. Eng. Des. Anal. Manuf. 33, 1–18. doi: 10.1017/S089006041900026X
Aquinocruz, B., Gupta, V., and Howard, S. (2021). Optical spectroscopy sequential wavelength selection using a higher leverage approach. IEEE Sens. Lett. 5:7002004. doi: 10.1109/LSENS.2021.3079099
Austin, P. C. (2008). Bootstrap model selection had similar performance for selecting authentic and noise variables compared to backward variable elimination: A simulation study. J. Clin. Epidemiol. 61, 1009–1017.e1. doi: 10.1016/j.jclinepi.2007.11.014
Barakat, A., DiLoreto, D. S., Zhang, Y., Smith, C., Baier, K., Powell, W. A., et al. (2009). Comparison of the transcriptomes of American chestnut (Castanea dentata) and Chinese chestnut (Castanea mollissima) in response to the chestnut blight infection. BMC Plant Biol. 9:51. doi: 10.1186/1471-2229-9-51
Barnes, R., Dhanoa, M. S., and Lister, S. J. (1989). Standard normal variate transformation and de-trending of near-infrared diffuse reflectance spectra. Appl. Spectrosc. 43, 772–777. doi: 10.1366/0003702894202201
Beyaztas, U., and Lin, S. H. (2022). A robust functional partial least squares for scalar-on-multiple-function regression. J. Chemom. 36:e3394 doi: 10.1002/cem.3394
Bi, Y., Yuan, K., Xiao, W., Wu, J., Shi, C., Xia, J., et al. (2016). A local pre-processing method for near-infrared spectra, combined with spectral segmentation and standard normal variate transformation. Anal. Chim. Acta 909, 30–40. doi: 10.1016/j.aca.2016.01.010
Campos, M. P., and Reis, M. S. (2020). Data preprocessing for multiblock modelling–A systematization with new methods. Chemometr. Intell. Lab. Syst. 199:103959. doi: 10.1016/j.chemolab.2020.103959
Cao, D. S., Deng, Z. K., Zhu, M. F., Yao, Z. J., and Zhao, R. G. (2017). Ensemble partial least squares regression for descriptor selection, outlier detection, applicability domain assessment, and ensemble modeling in QSAR/QSPR modeling. J. Chemometr. 31:e2922. doi: 10.1002/cem.2922
Cheng, H., Wang, J., and Du, Y. (2020). Combining multivariate method and spectral variable selection for soil total nitrogen estimation by Vis–NIR spectroscopy. Arch. Agron. Soil Sci. 67, 1665–1678. doi: 10.1080/03650340.2020.1802013
Couture, J. J., Singh, A., Rubert-Nason, K. F., Serbin, S. P., Lindroth, R. L., and Townsend, P. A. (2016). Spectroscopic determination of ecologically relevant plant secondary metabolites. Methods Ecol. Evol. 7, 1402–1412. doi: 10.1111/2041-210X.12596
Desmaison, A. M., Marcher, M. H., and Tixier, M. (1984). Changes in the free and total amino acid composition of ripening chestnut seeds. Phytochemistry 23, 2453–2456. doi: 10.1016/S0031-9422(00)84074-1
Du, Q. W., Zhu, M. T., Shi, T., Luo, X., and Chen, Y. (2020). Adulteration detection of corn oil, rapeseed oil and sunflower oil in camellia oil by in situ diffuse reflectance near-infrared spectroscopy and chemometrics. Food Control 121:107577. doi: 10.1016/j.foodcont.2020.107577
Eason, S. (1990). Backward variable elimination canonical correlation and canonical cross-validation. New Orleans, LA: University of New Orleans.
ElMasry, G., Wang, N., ElSayed, A., and Ngadi, M. (2007). Hyperspectral imaging for nondestructive determination of some quality attributes for strawberry. J. Food Eng. 81, 98–107. doi: 10.1016/j.jfoodeng.2006.10.016
Eriksson, L., Johansson, E., Kettaneh-Wold, N., and Wold, S. (2001). Multi-and megavariate data analysis. Umeå: Umetrics Academy, 43.
Esposito, T., and Houser, K. (2019). Models of colour quality over a wide range of spectral power distributions. Light. Res. Technol. 51, 331–352. doi: 10.1177/1477153518765953
Faqeerzada, M. A., Perez, M., Lohumi, S., Lee, H., and Cho, B. K. (2020). Online application of a hyperspectral imaging system for the sorting of adulterated almonds. Appl. Sci. 10:6569. doi: 10.3390/app10186569
Freinkel, S. (2009). American chestnut: The life, death, and rebirth of a perfect tree. Berkeley, CA: University of California Press.
Gai, Z., Sun, L., Bai, H., Li, X., Wang, J., and Bai, S. (2022). Convolutional neural network for apple bruise detection based on hyperspectral. Spectrochim. Acta A Mol. Biomol. Spectrosc. 279:121432. doi: 10.1016/j.saa.2022.121432
Guo, W., Li, W., Yang, B., Zhu, Z. Z., Liu, D., and Zhu, X. (2019). A novel noninvasive and cost-effective handheld detector on soluble solids content of fruits. J. Food Eng. 257, 1–9. doi: 10.1016/j.jfoodeng.2019.03.022
Halicek, M., Fabelo, H., Ortega, S., Callico, G. M., and Fei, B. (2019). In-vivo and ex-vivo tissue analysis through hyperspectral imaging techniques: Revealing the invisible features of cancer. Cancers 11:756. doi: 10.3390/cancers11060756
He, H. J., Wang, Y., Zhang, M., Wang, Y., Ou, X., and Guo, J. (2022). Rapid determination of reducing sugar content in sweet potatoes using NIR spectra. J. Food Compost. Anal. 111:104641. doi: 10.1016/j.jfca.2022.104641
He, X., Hu, D., Fu, X., and Rao, X. (2021). Spatial frequency domain imaging for determining absorption and scattering properties of bruised pears based on profile corrected diffused reflectance. Postharvest Biol. Technol. 179:111570. doi: 10.1016/j.postharvbio.2021.111570
Hein, P. R. G. (2010). Multivariate regression methods for estimating basic density in Eucalyptus wood from near infrared spectroscopic data. Cerne 16, 90–96.
Jiang, H., Jiang, X., Ru, Y., Chen, Q., Xu, L., and Zhou, H. (2021). Sweetness detection and grading of peaches and nectarines by combining short- and long-wave fourier- transform near-infrared spectroscopy. Anal. Lett. 54, 1–20. doi: 10.1080/00032719.2020.1795186
Karunasingha, D. S. K. (2022). Root mean square error or mean absolute error? Use their ratio as well. Inf. Sci. 585, 609–629. doi: 10.1016/j.ins.2021.11.036
Keshav, K. (2021). Partial least square (PLS) analysis. Resonance 26, 429–442. doi: 10.1007/s12045-021-1140-1
León, P., and Sheen, J. (2003). Sugar and hormone connections. Trends Plant Sci. 8, 110–116. doi: 10.1016/S1360-1385(03)00011-6
Li, M., Li, P., Ma, F., Dandekar, A. M., and Cheng, L. (2018). Sugar metabolism and accumulation in the fruit of transgenic apple trees with decreased sorbitol synthesis. Hortic. Res. 5:60. doi: 10.1038/s41438-018-0064-8
Li, P., Du, G., Ma, Y., Zhou, J., and Jiang, L. (2018). A novel multivariate calibration method based on variable adaptive boosting partial least squares algorithm. Chemometr. Intell. Lab. Syst. 176, 157–161. doi: 10.1016/j.chemolab.2018.03.013
Li, S., and Zhao, L. (2019). A variable selection method based on ensemble-SISPLS for near infrared spectroscopy. Spectr. Anal. Rev. 39, 1047–1052. doi: 10.3964/j.issn.1000-0593(2019)04-1047-06
Liu, J., Sun, Y., Liu, W., Tan, Z., Jiang, J., and Li, Y. (2021). Association of spectroscopically determined leaf nutrition related traits and breeding selection in Sassafras tzumu. Plant Methods 17:33. doi: 10.1186/s13007-021-00734-5
Lu, B., Dao, P. D., Liu, J., He, Y., and Shang, J. (2020). Recent advances of hyperspectral imaging technology and applications in agriculture. Remote Sens. 12:2659. doi: 10.3390/rs12162659
Luka, R., Urban, S., Tadej, T., Matija, J., Urban, P., Jošt, S., et al. (2021). Effect of curvature correction on parameters extracted from hyperspectral images. J. Biomed. Opt. 26:096003. doi: 10.1117/1.JBO.26.9.096003
Luo, J., Ying, K., He, P., and Bai, J. (2005). Properties of Savitzky–Golay digital differentiators. Digit. Signal Process. 15, 122–136. doi: 10.1016/j.dsp.2004.09.008
Luo, L., Yao, X., and He, S. (2020). Study on the method of determining the survival rate of rice seeds based on visible-near infrared multispectral data. Spectr. Anal. Rev. 40, 221–226. doi: 10.3964/J.ISSN.1000-0593(2020)01-0221-06
Luypaert, J., Massart, D., and Vander Heyden, Y. (2007). Near-infrared spectroscopy applications in pharmaceutical analysis. Talanta 72, 865–883. doi: 10.1016/j.talanta.2006.12.023
Luypaert, J., Zhang, M. H., and Massart, D. L. (2003). Feasibility study for the use of near infrared spectroscopy in the qualitative and quantitative analysis of green tea, Camellia sinensis (L.). Anal. Chim. Acta 478, 303–312. doi: 10.1016/S0003-2670(02)01509-X
Maria, B. A., Cristina, P., Mihaela, B., Catalin, L. P., and Mioara, P. (2021). Non-destructive methods for fruit quality evaluation. Sci. Rep. 11:7782. doi: 10.1038/s41598-021-87530-2
Mehmood, T., Liland, K. H., Snipen, L., and Sæbø, S. (2012). A review of variable selection methods in partial least squares Regression. Chemometr. Intell. Lab. Syst. 118, 62–69. doi: 10.1016/j.chemolab.2012.07.010
Mehmood, T., Sæbø, S., and Liland, K. H. (2020). Comparison of variable selection methods in partial least squares regression. J. Chemometr. 34:e3226. doi: 10.1002/cem.3226
Mohammad, G. S. (2020). Estimate accuracy of the sample determination coefficient R2 and R2 for the multiple regression models. J. Southwest Jiaotong Univ. 55:25. doi: 10.35741/issn.0258-2724.55.1.25
Molajou, A., Nourani, V., Afshar, A., Khosravi, M., and Brysiewicz, A. (2021). Optimal design and feature selection by genetic algorithm for emotional artificial neural network (EANN) in rainfall-runoff modeling. Water Resour. Manag. 35, 2369–2384. doi: 10.1007/s11269-021-02818-2
Pereira-Lorenzo, S., Ramos-Cabrer, A. M., Díaz-Hernández, M., Ciordia-Ara, M., and Ríos-Mesa, D. (2010). Chemical composition of chestnut cultivars from Spain. Sci. Hortic. 107, 306–314. doi: 10.1016/j.scienta.2005.08.008
Pu, H., Liu, D., Wang, L., and Sun, D. W. (2016). Soluble solids content and pH prediction and maturity discrimination of lychee fruits using visible and near infrared hyperspectral imaging. Food Analyt. Methods 9, 235–244. doi: 10.1007/s12161-015-0186-7
Puneet, M., Michel, R. J., Delphine, J. R. B., Alessandra, B., Federico, M., Alison, N., et al. (2021). Recent trends in multi-block data analysis in chemometrics for multi-source data integration. TrAC Trends Anal. Chem. 137:116206. doi: 10.1016/j.trac.2021.116206
Qi, H., and Fu, X. (2022). A practical and effective method for reducing differential reflectance spectroscopy noise. Nanotechnol. Precis. Eng. 5:013006. doi: 10.1063/10.0009680
Quan, J., Bai, B., Jin, S., and Zhang, Y. (2014). Indoor positioning modeling by visible light communication and imaging. Chin. Opt. Lett. 12:052201. doi: 10.3788/COL201412.052201
Rajkumar, P., Wang, N., Eimasry, G., Raghavan, G., and Gariepy, Y. (2012). Studies on banana fruit quality and maturity stages using hyperspectral imaging. J. Food Eng. 108, 194–200. doi: 10.1016/j.jfoodeng.2011.05.002
Roberto, B., Valentina, G., Alessio, T., and Riccardo, G. (2018). Application of visible/near infrared spectroscopy to quality control of fresh fruits and vegetables in large-scale mass distribution channels: A preliminary test on carrots and tomatoes. J. Sci. Food Agric. 98, 2729–2734. doi: 10.1002/jsfa.8768
Saputro, A. H., and Handayani, W. (2017). “Wavelength selection in hyperspectral imaging for prediction banana fruit quality,” in 2017 International conference on electrical engineering and informatics (ICELTICs), (Banda Aceh: IEEE). doi: 10.1109/ICELTICS.2017.8253259
Senem, S., Betül, A., Serhat, K., and Utku, Ç. Ö. (2021). Effects of different pretreatments on the physicochemical characteristics and quality criteria of chestnut (Castanea sativa Mill.) pickle: A new value-added product. J. Food Process. Preserv. 45:e15669. doi: 10.1111/jfpp.15669
Serranti, S., Bonifazi, G., and Gasbarrone, R. (2018). “Kiwifruits ripening assessment by portable hyperspectral devices,” in Sensing for agriculture and food quality and safety X, eds M. S. Kim, K. Chao, B. A. Chin, and B. Cho (Washington, DC: SPIE). doi: 10.1117/12.2297353
Shi, H., and Yu, P. (2017). Comparison of grating-based near-infrared (NIR) and Fourier transform mid-infrared (ATR-FT/MIR) spectroscopy based on spectral preprocessing and wavelength selection for the determination of crude protein and moisture content in wheat. Food Control. 82, 57–65.
Stevens, A., and Ramirez-Lopez, L. (2014). An introduction to the prospectr package. https://mran.microsoft.com/snapshot/2020-01-29/web/packages/prospectr/vignettes/prospectr-intro.pdf (accessed February 14, 2014).
Tan, B., You, W., Huang, C., Xiao, T., Tian, S., Luo, L., et al. (2022). An intelligent Near-Infrared diffuse reflectance spectroscopy scheme for the Non-Destructive testing of the sugar content in Cherry Tomato fruit. Electronics 11:3504. doi: 10.3390/ELECTRONICS11213504
Tan, W., Sun, L., Yang, F., Che, W., Ye, D., Dan, Z., et al. (2018). The feasibility of early detection and grading of apple bruises using hyperspectral imaging. J. Chemometr. 32:e3067. doi: 10.1002/cem.3067
Tang, Y., Ren, J., Liu, C., Jiang, J., Yang, H., and Li, J. (2021). Genetic characteristics and QTL analysis of the soluble sugar content in ripe tomato fruits. Sci. Hortic. 276:109785. doi: 10.1016/j.scienta.2020.109785
Ümran, E., Cevriye, M., and Arif, S. (2006). Chemical composition of fruits of some important chestnut cultivars. Braz. Arch. Biol. Technol. 49, 183–188. doi: 10.1590/S1516-89132006000300001
Vânia, S., Sandra, P., Alice, V., Eunice, B., Francisco, G., Carlos, R., et al. (2021). Preliminary insights in sensory profile of sweet cherries. Foods 10, 612–612. doi: 10.3390/foods10030612
Villanueva, R. A. M., and Chen, Z. J. (2019). ggplot2: Elegant graphics for data analysis (2nd ed.). Measure. Inter. Res. Perspect. 17, 160–167. doi: 10.1080/15366367.2019.1565254
Wang, A., Ma, H., Zhang, B., Mo, C., Li, E., and Li, F. (2022). Transcriptomic and metabolomic analyses provide insights into the formation of the Peach-like aroma of Fragaria nilgerrensis Schlecht. fruits. Genes 13:1285. doi: 10.3390/GENES13071285
Webb, J. K., Lee, C. C., Carswell, R. F., and Milakovi, D. (2020). Getting the model right; an information criterion for spectroscopy. Monthly Notices R. Astron. Soc. 501, 2268–2278. doi: 10.1093/mnras/staa3551
Wehrens, R., and Mevik, B. H. (2007). The pls package: Principal component and partial least squares regression in R. J. Stat. Softw. 18, 1–24. doi: 10.18637/jss.v018.i02
Xiao, N., and Cao, D.-S., Li, M.-Z., and Xu, Q.-S. (2019). Enpls: Ensemble partial least squares regression. Available online at: https://cran.r-project.org/web/packages/enpls/index.html (accessed May 18, 2019).
Xiao, Q., Tang, W., Zhang, C., Zhou, L., Feng, L., Shen, J., et al. (2022). Spectral preprocessing combined with deep transfer learning to evaluate chlorophyll content in Cotton leaves. Plant Phenomics 2022:9813841. doi: 10.34133/2022/9813841
Xu, L., Zhou, Y. P., Tang, L. J., Wu, H. L., Jiang, J. H., Shen, G. L., et al. (2008). Ensemble preprocessing of near-infrared (NIR) spectra for multivariate calibration. Anal. Chim. Acta 616, 138–143. doi: 10.1016/j.aca.2008.04.031
Yang, Q., Yang, X., Zhang, Q., Wang, Y., and Huang, F. (2020). Quantifying soluble sugar in super sweet corn using near-infrared spectroscopy combined with chemometrics. Optik Int. J. Light Electr. Opt. 220:165128.
Yang, Y., Ma, L., Du, G., Li, J., and Ma, Y. (2018). Exploring the applicability of quantitative models based on NIR reflectance spectroscopy of plant samples. Spectroscopy 33, 27–32.
Yu, H. Y., Niu, X. Y., Lin, H. J., Ying, Y. B., Li, B. B., and Pan, X. X. (2009). A feasibility study on on-line determination of rice wine composition by Vis–NIR spectroscopy and least-squares support vector machines. Food Chem. 113, 291–296. doi: 10.1016/j.foodchem.2008.06.083
Yuan, L. M., You, L., Yang, X., Chen, X., Huang, G., Chen, X., et al. (2022). Consensual regression of soluble solids content in peach by near infrared spectrocopy. Foods 11, 1095–1095. doi: 10.3390/foods11081095
Zhang, D., Xu, L., Liang, D., Xu, C., Jin, X., and Weng, S. (2018). Fast prediction of sugar content in dangshan pear (Pyrus spp.) using hyperspectral imagery data. Food Anal. Methods 11, 2336–2345. doi: 10.1007/s12161-018-1212-3
Zhang, H., Zhan, B., Pan, F., and Lou, W. (2020b). Determination of soluble solids content in oranges using visible and near infrared full transmittance hyperspectral imaging with comparative analysis of models. Postharvest Biol. Technol. 163:111148. doi: 10.1016/j.postharvbio.2020.111148
Zhang, H., Zhang, S., Dong, W., Luo, W., Huang, Y., Zhan, B., et al. (2020a). Detection of common defects on mandarins by using visible and near infrared hyperspectral imaging. Infrared Phys. Technol. 108:103341. doi: 10.1016/j.infrared.2020.103341
Zhang, J., Cheng, T., Guo, W., Xu, X., Qiao, H., Xie, Y., et al. (2021). Leaf area index estimation model for UAV image hyperspectral data based on wavelength variable selection and machine learning methods. Plant Methods 17, 1–14. doi: 10.1186/s13007-021-00750-5
Zhang, L., Sun, H., Rao, Z., and Jisun, H. (2020). Hyperspectral imaging technology combined with deep forest model to identify frost-damaged rice seeds. Spectrochim. Acta Part A Mol. Biomol. Spectrosc. 229:117973. doi: 10.1016/j.saa.2019.117973
Zhang, Y., Chen, Y., Wu, Y., and Cui, C. (2021). Accurate and nondestructive detection of apple brix and acidity based on visible and near-infrared spectroscopy. Appl. Opt. 60, 4021–4028. doi: 10.1364/AO.423994
Keywords: regression, plant growth, tree production, spectroscopy, Chinese chestnuts, soluble sugar content
Citation: Yang J, Gong B and Jiang X (2023) Hyperspectral imaging-based prediction of soluble sugar content in Chinese chestnuts. Front. For. Glob. Change 6:1203674. doi: 10.3389/ffgc.2023.1203674
Received: 11 April 2023; Accepted: 22 May 2023;
Published: 29 June 2023.
Edited by:
Vega Cong Xu, University of Canterbury, New ZealandReviewed by:
Wenhao Bo, Beijing Forestry University, ChinaCopyright © 2023 Yang, Gong and Jiang. This is an open-access article distributed under the terms of the Creative Commons Attribution License (CC BY). The use, distribution or reproduction in other forums is permitted, provided the original author(s) and the copyright owner(s) are credited and that the original publication in this journal is cited, in accordance with accepted academic practice. No use, distribution or reproduction is permitted which does not comply with these terms.
*Correspondence: Xibing Jiang, anhiOTEyQGNhZi5hYy5jbg==
Disclaimer: All claims expressed in this article are solely those of the authors and do not necessarily represent those of their affiliated organizations, or those of the publisher, the editors and the reviewers. Any product that may be evaluated in this article or claim that may be made by its manufacturer is not guaranteed or endorsed by the publisher.
Research integrity at Frontiers
Learn more about the work of our research integrity team to safeguard the quality of each article we publish.