- 1Forestry College, Beihua University, Jilin City, Jilin, China
- 2Jilin Songhuajiang Sanhu National Nature Reserve Administration, Jilin City, Jilin, China
The promotion of forest resource protection and sustainable development relies greatly on the value of forest ecosystem services. In Jilin Songhuajiang Sanhu National Nature Reserve in Northeast China, a total of 169 sample plots were examined and analyzed to evaluate the provisioning and supporting services provided by the forest ecosystem. The study revealed that the near-mature and over-mature Fraxinus mandshurica forest have relatively high timber supply and species resources conservation values per unit area, respectively. Furthermore, the mature Betula platyphylla forest has the highest forest nutrient retention value, while the near-mature Juglans mandshurica forest has the highest soil conservation value, with the nitrogen fixation value accounting for the highest proportion. The forest ecosystem services in the reserve have a total value of 659.07 million $⋅y–1. The main contributors to the value are the services of soil fertilizer conservation, timber supply, and species resources conservation, with the mixed broad-leaved forest and Quercus mongolica forest being the main contributors, accounting for 63.1 and 18.8% of the total value, respectively. Nonetheless, the service value of per unit area in J. mandshurica forest is the highest. Near-mature and mature forests are the main contributors to the total value, accounting for 42.3 and 34.9%, respectively. Forest lands exhibit significant variations in the values of provisioning and supporting services across different stand types and age groups.
1. Introduction
The forest ecosystem is a crucial component of the global natural ecosystem and plays an integral role in ensuring sustainable human development (Ma et al., 2021). Unfortunately, people’s understanding of the forest ecosystem has been limited to its economic uses, particularly the provision of timber and forest by-products for economic development, with a lack of comprehensive understanding of its service values (Hettiarachchi and Ranasinghe, 2013). Despite the high economic value of forest wood, it is not adequately accounted for in political and economic policies resulting in insufficient investments in its protection and management. The one-sided pursuit of rapid economic development has led to significant damage to the ecosystem (Smith et al., 2019). Therefore, raising awareness regarding the importance of the ecosystem has become a pressing issue. A scientific and comprehensive evaluation of forest ecosystem service value has become a global focus and hot issue (Niu et al., 2012; Ninan and Inoue, 2013b).
Ecosystem services are essential for human survival as they provide nutritious food, and clean water, regulate disease and climate, support crop pollination and soil formation, and offer recreational, cultural, and spiritual benefits. Ecosystems provide four main types of services to the world, namely provisioning services, regulating services, supporting services, and cultural services (Food and Agriculture Organization, 2020). However, quantifying the aesthetic appreciation of nature and the inspiration it provides for culture and innovation remains challenging. To quantitatively estimate service values, scholars have employed various methods, including the conditional value method, market value method, emergy evaluation method, and income conversion method, to assess ecosystem service values (Costanza et al., 1997; Odum and Odum, 2000; Zhang, 2010; Hidemichi et al., 2017). Some researchers have evaluated the ecosystem service values based on ecology alone (Daily and Ehrlich, 1999), while others investigate the impact of biodiversity on ecosystem services to characterize their value (Fromm, 2000; Farnsworth et al., 2012). Given the structural complexity and peculiarities of different ecosystems, evaluation techniques, and methods have garnered significant attention to ensure accurate service value assessment (Villa et al., 2014; Cheng et al., 2019).
Since the 1950s, various methods such as the travel cost, replacement cost, and contingent valuation method have been utilized internationally to assess the direct use value of forest ecosystems (Tobias and Mendelsohn, 1991; Hanley, 1993; Beaumont et al., 2014). It has been estimated that the per unit area value of forest ecosystem services in Mexico is US$80 per year, totaling to US$4 billion (Adger and Weiguang, 1995). Some scholars have calculated the overall value of forest ecosystems in national nature reserves (Tobias and Mendelsohn, 1991; Hanley, 1993; Ninan and Inoue, 2013a; Beaumont et al., 2014; Jin et al., 2016; Chang et al., 2019; Liu et al., 2022). Moreover, utilizing NOAA-AVHRR and Landsat imagery, the ecosystem service value of land under various use methods was calculated (Konarska et al., 2002). By considering tourists’ preferences for landscapes in the protected areas and utilizing the travel cost method, recreational value of the protected area can be inferred. The recreational value of the conservation area can be estimated by analyzing the tourists’ demand for the landscape (Font, 2000), and other values such as timber supply value, soil conservation value, forest nutrient retention, and species conservation value can be evaluated based on stock volume, soil erosion, tree nutrients, and species composition (Villa et al., 2014; Cheng et al., 2019).
In recent years, there has been an increase in studies on the service values of different forest ecosystems based on small-scale areas, particularly forest nature reserves. These reserves can be classified into various value areas based on plant and animal species, environmental categories, species richness, and other factors, and the conservation priority can be ranked based on the evaluation value (Goodfellow and Peterken, 1981). By considering tourists’ preferences for landscapes in the protected areas and utilizing the travel cost method, recreational value of the protected area can be inferred. The recreational value of the conservation area can be estimated by analyzing the tourists’ demand for the landscape (Font, 2000), and other values such as timber supply value, soil conservation value, forest nutrient retention, and species conservation value can be evaluated based on stock volume, soil erosion, tree nutrient, and species composition (Villa et al., 2014; Cheng et al., 2019). The study on the value of forest nature reserves has garnered the attention of scholars worldwide, and the evaluation system of nature reserves has been scientifically divided into different types such as conservation value, resource value, and economic value (Zhang et al., 2011). However, there are still issues such as the lack of standardization and uniformity in evaluation methods, and incomplete evaluation metrics.
Forest type and forest have a significant impact on forest structure, plant growth, and vegetation biomass accumulation (Shengjun et al., 2009; Grytnes, 2010; Gamfeldt et al., 2013), so they are fundamental factors that strongly influence the ecosystem services provided by forests. As time passes, the biomass, biodiversity, and soil quality of forest ecosystems change, and different tree species exhibit significant differences in their biomass and nutrient content (Gamfeldt et al., 2013; Musavi et al., 2017; Kuuluvainen and Gauthier, 2018), compared with other service functions, the change of forest type and forest age has a more direct relationship with the function of support and provision service. Therefore, studying the support and provision of ecosystem services from the perspective of forest age and type can accurately quantify the value of these services, and the assessment results of the ecosystem service value in different forest types and ages are highly practical and scientific to provide evidence and guidance for the rational management, protection, and sustainable utilization of forests. Therefore, the primary aim of this study is to analyze the forest provision and support service values in Jilin Songhuajiang Sanhu National Nature Reserve under various forest types and age groups. Additionally, the study intends to perform a comprehensive evaluation of the forest supply value, species resource conservation value, forest nutrient retention value, and soil conservation value in forests with different types and ages. The results of this study can be used by policymakers to identify target forests for enhancing forest service values through operational strategies.
2. Materials and methods
2.1. Study area
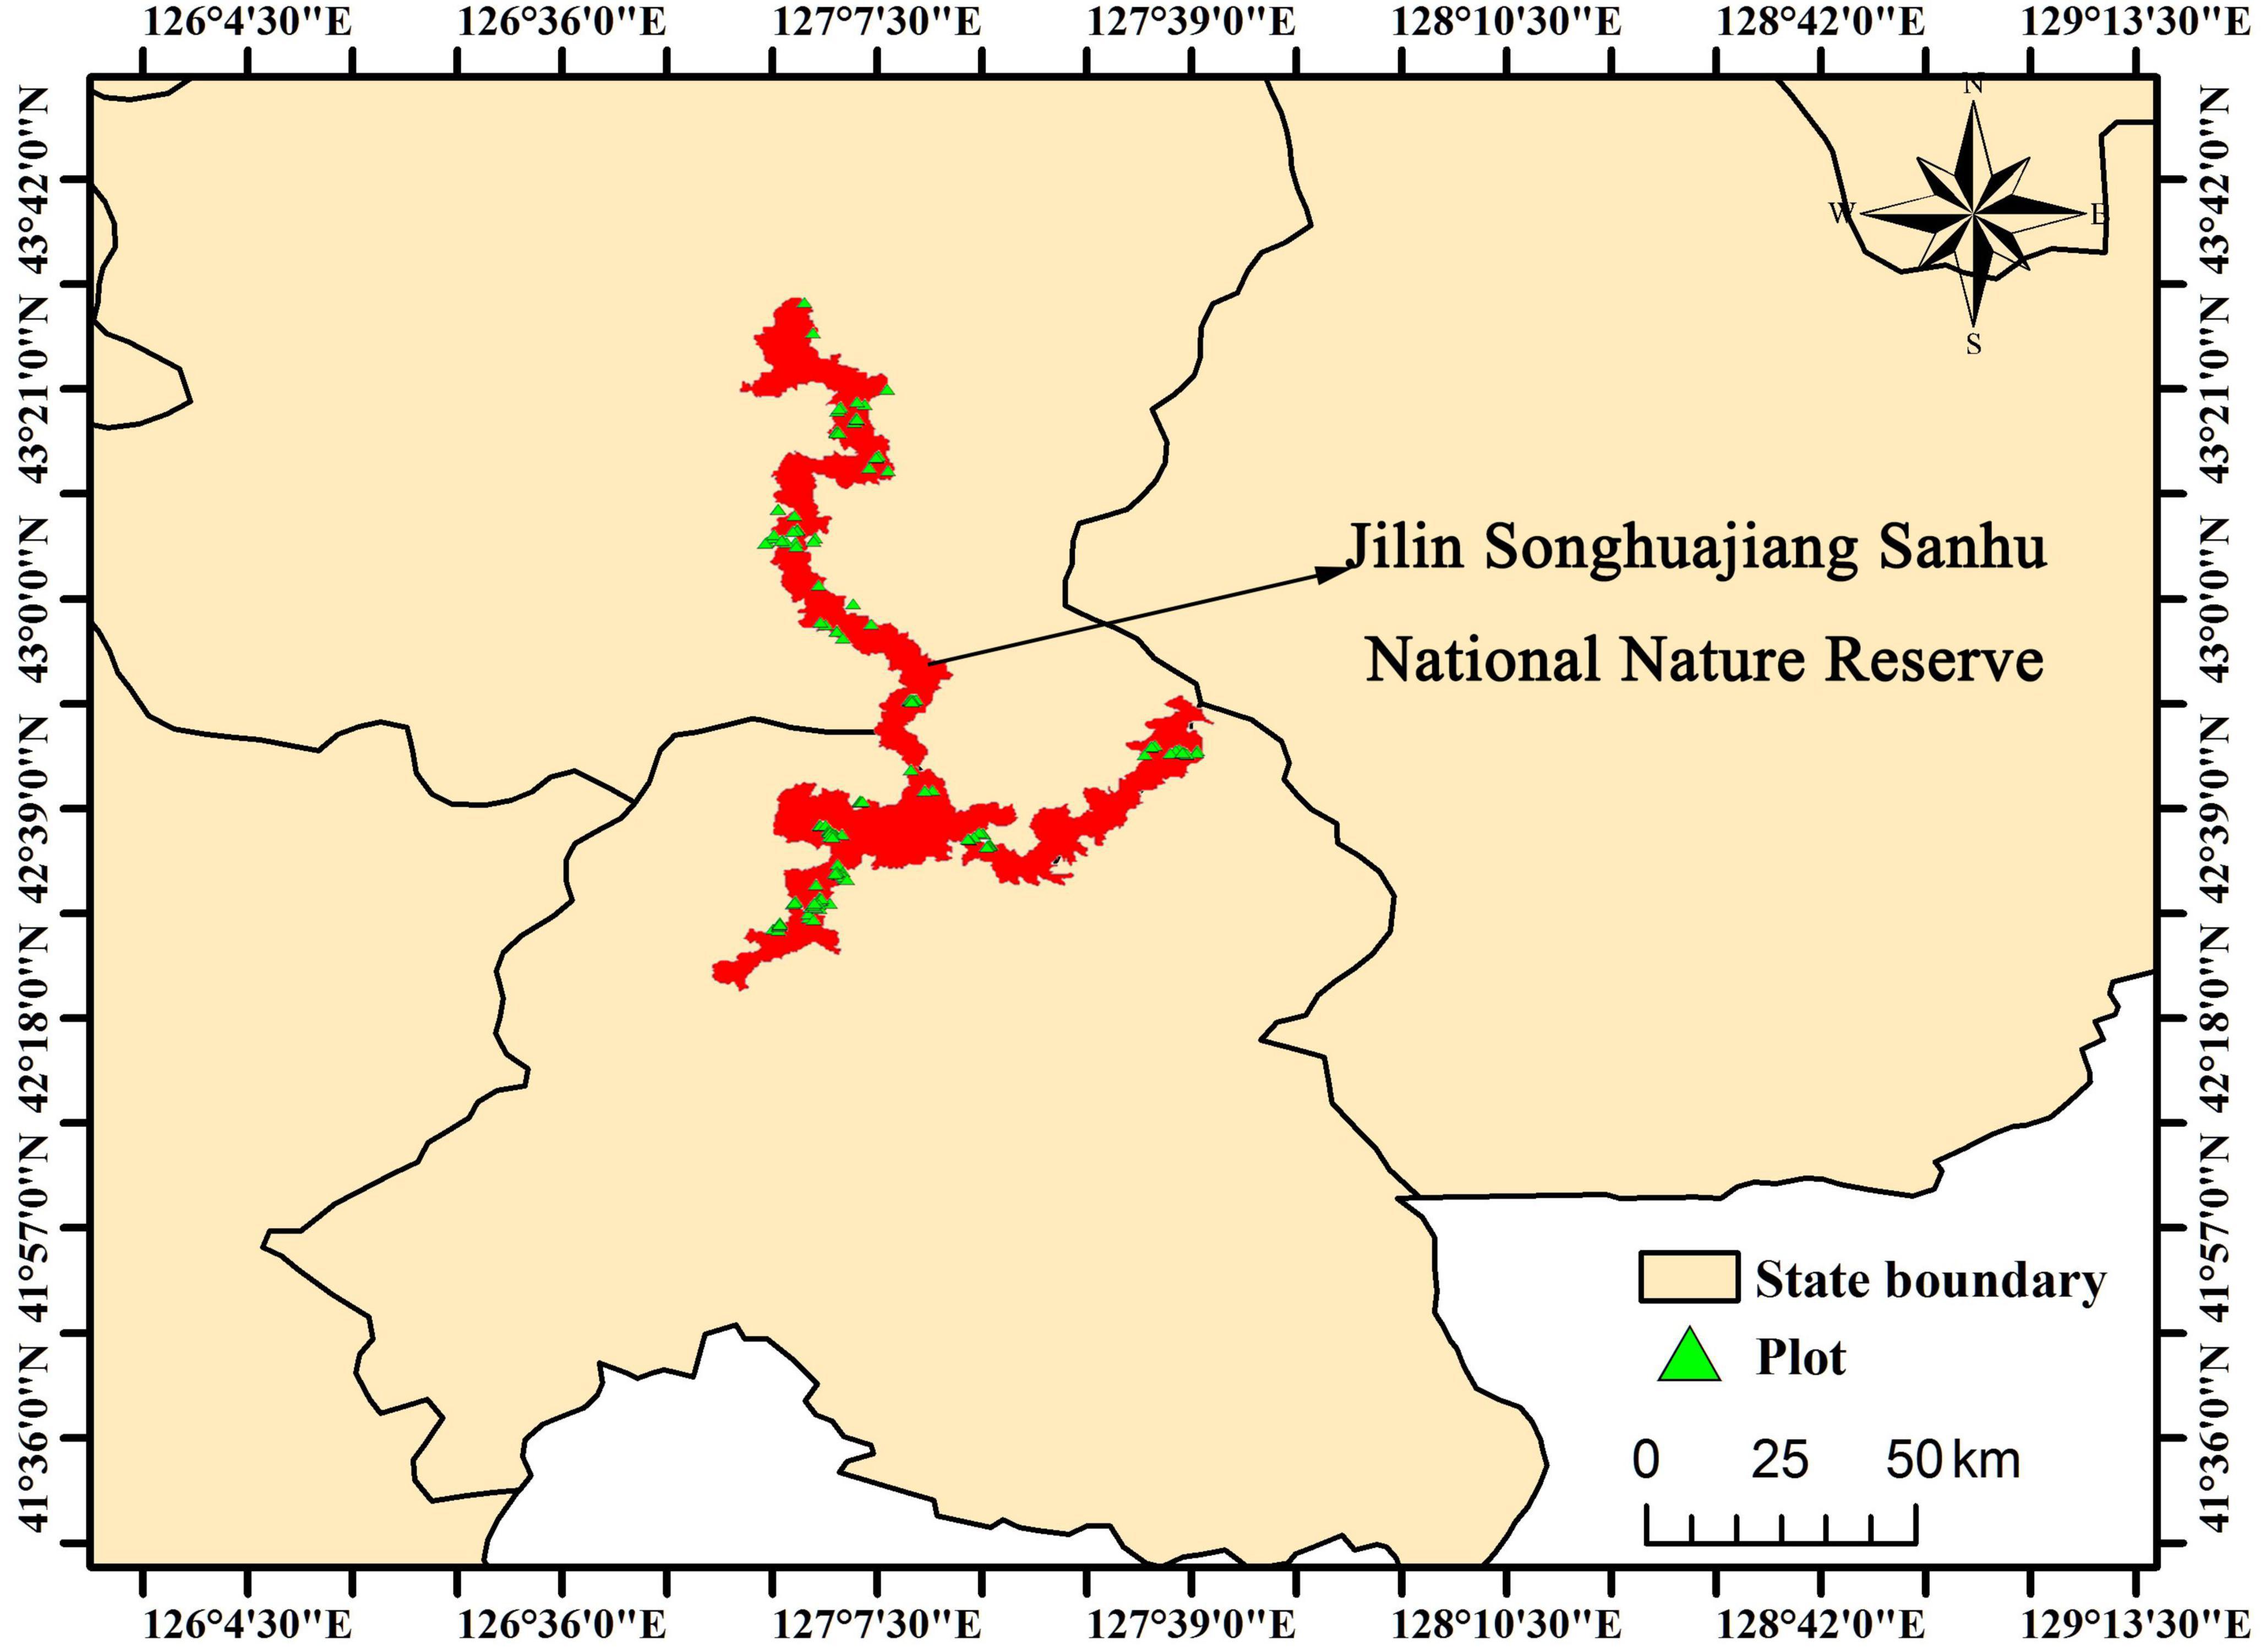
The Jilin Songhuajiang Sanhu National Nature Reserve is located in the central and eastern part of Jilin Province (42°20′10″∼43°33′06″N, 126°51′40″∼127°45′21″E) (Figure 1), which undertakes the functions of soil and water conservation and groundwater recharge in the Songhua River Basin, and it is an important hydropower base in Northeast China. The climate belongs to the continental monsoon climate of northern temperate zone. The annual average temperature is between 3.9 and 4.9°C. The average temperature in January and July is about −18 and 20°C, respectively. The average annual precipitation is about 644.8∼825.1 mm, and the rainfall is concentrated in June to August. The annual sunshine hours is 2,350∼2,450 h, and the frost-free period is 92∼134 days. The soil type is mainly dark brown soil. The reserve is dominated by mountain forest ecosystems, with abundant plant resources, which can be divided into seven types: coniferous forest, mixed coniferous and broad-leaved forest, deciduous broad-leaved forest, shrub, meadow, swamp, and aquatic vegetation. The forestland area is 122,800 ha, accounting for 78.4% of the total area of the reserve, and which is mainly closed forest land, with an area of 111,500 ha. The forest community types are mainly broad-leaved mixed forest and oak forest, and the main dominant tree species include Pinus koraiensis, Fraxinus mandshurica, Phellodendron amurense, Chosenia arbutifolia, Tilia amurensis, Juglans mandshurica, Quercus mongolica, and so on. However, affected by many factors such as man-made destruction, historical unreasonable development, natural disasters, and global climate change, the Sanhu Reserve is faced with a variety of ecological environmental problems and protection pressure (Lei, 2006), and clarifying the service value of the forest ecosystem in this region is an important basis for determining the protection object and strength. Maintaining the quality of air and soil, providing flood and disease control, or pollinating crops are some of the regulating services provided by ecosystems, and the non-material benefits of aesthetic inspiration, cultural identity, sense of home, and spiritual experience related to the natural environment are called cultural services, but it is still difficult to accurately and quantitatively evaluate the value of regulating services and cultural services from a large regional scale, especially considering the conditions of different forest types and ages.
2.2. Field investigation and sample analysis
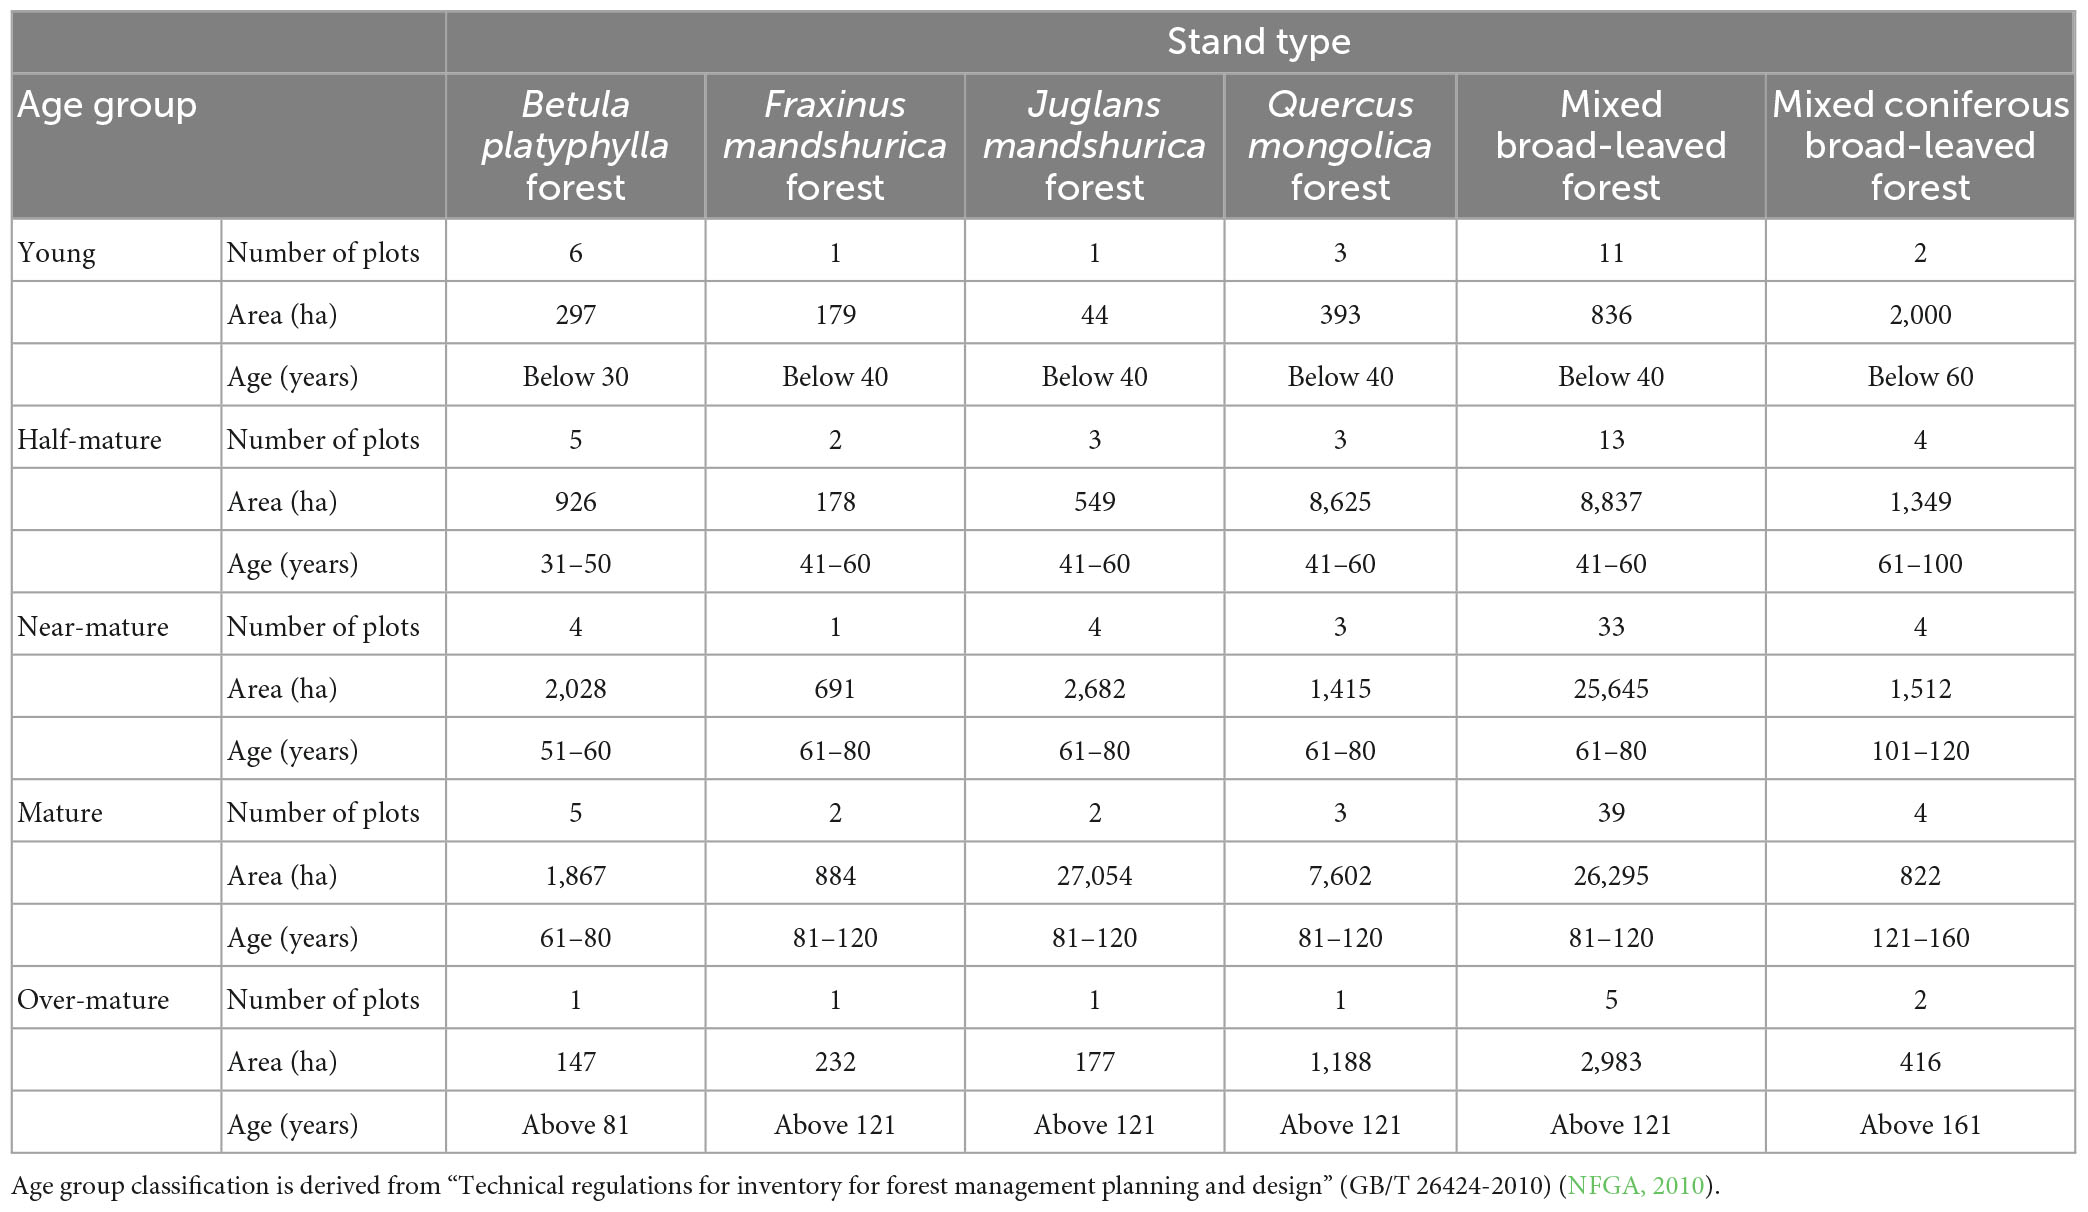
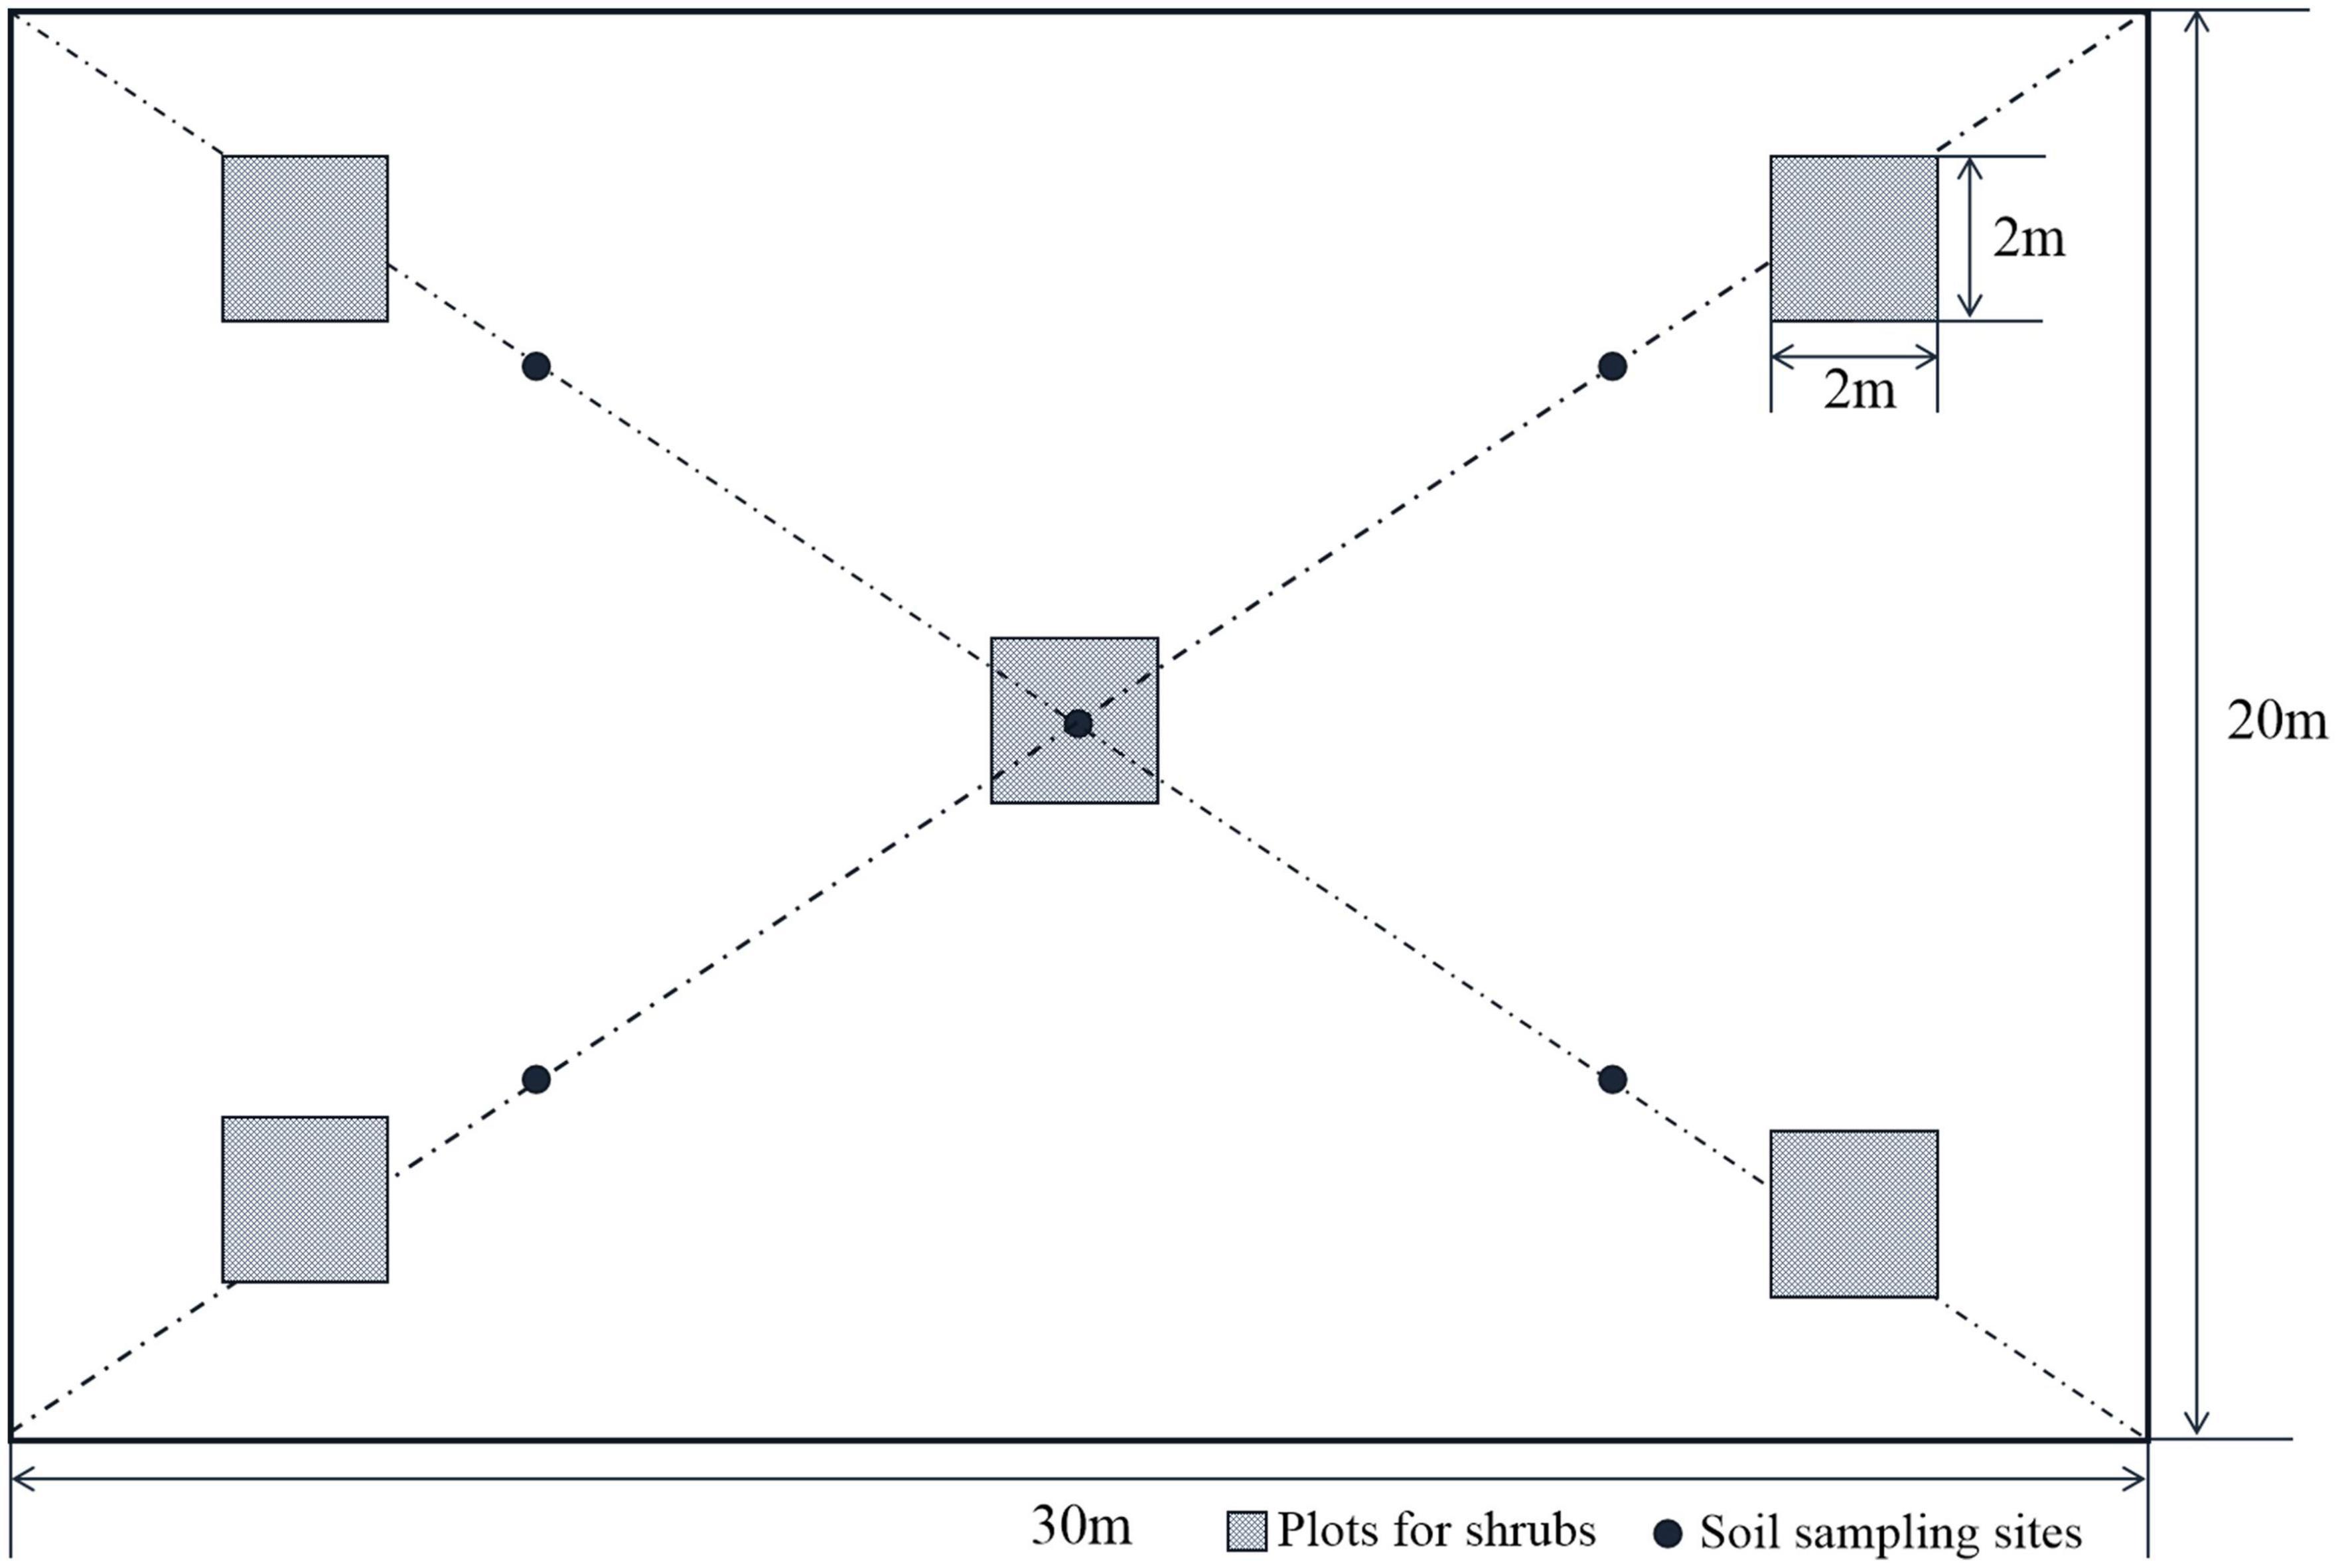
According to the historical forest resource inventory data of study area, it is known that the main forest community types in the reserve include Betula platyphylla forest, F. mandshurica forest, J. mandshurica forest, Q. mongolica forest, mixed broad-leaved forest, and mixed coniferous broad-leaved forest. In order to obtain the values of the provisioning and supporting services provided by different forest types and age groups in the reserve, the sample plots in each forest type were selected based on the reserve’s forest types, age groups, distribution area, and proportion of each forest type. A total of 169 plots were set up and investigated in different forest stand types in the reserve (Figure 1), the stand types, age groups, and number of plots in each forest type are shown in Table 1. The sample plots for the investigation of the basic characteristics of the community were selected from the representative sections of the typical community. The forest compass was used to enclose the rectangular basic survey plots of the community with an area of 20 m × 30 m (Song et al., 2002), and then measured the tree height and DBH (diameter at breast height) of each tree in the plot, and record the basic information of the tree species, and only record the tree species and tree height for the individuals whose tree height is <1.3 m. Five small quadrats with an area of 2 m × 2 m were set up at the corners and center of the plot to survey shrubs (Song et al., 2002; Yuan et al., 2015; see Figure 2), and we recorded the species, average height, and number of shrubs within these plots. Within each shrub plot, one small plot with an area of 1 m × 1 m was designated to survey herbaceous plants (Song et al., 2002; Yuan et al., 2015), and the species, height, number, and coverage of herbaceous plants were surveyed and recorded, and then the average plant height was obtained by calculating the average plant height of different species of herbaceous plants.
To clarify the age group and annual volume growth of forests, about five standard trees of dominant tree species in each survey plot were selected for the collection of annual ring strips, and the annual ring sample core was collected at 1.3 m above the ground of the sample tree with a growth cone to drill from south to north, and then put it into a straw, and record the tree species, DBH, skin thickness, and collection time. Then, the age group of forest was determined based on the average age of the group specie, and the criteria for age group classification are shown in Table 1, which mainly includes young forests, half-mature forests, near-mature forests, mature forests, and over-mature forests for each forest type. A total of 10 tree species (B. platyphylla Sukaczev, Populus davidiana Dode, F. mandshurica Rupr., J. mandshurica Maxim., P. amurense Rupr., T. amurensis Rupr., Q. mongolica Fisch. ex Ledeb., Ulmus davidiana Planch. var. Japonica (Rehd.) Nakai, Acer pictum Thunb., and P. koraiensis Sieb et Zucc.) sample cores were obtained, with 20∼25 ring sample cores for each tree species, and after processing the sample cores, the Lintab tree ring analyzer was used to accurately measure the annual ring width of the tree ring samples.
To determine the nutrient content and bulk density of the soil in each plot, we collected five surface soil samples, the sampling sites are shown in Figure 2. After being brought back to the laboratory, the samples are naturally air-dried, and then the dried particles, fine roots, and other impurities are removed from the air-dried soil with tweezers. The samples are then ground and screened through a 0.25 mm steel sieve for subsequent chemical property analysis. At the same time, a 100 cm3 soil core sampler is used to collect undisturbed soil from each sampling point, which are then used for soil density determination (NY/T 1,121.4). The main analysis indicators include soil organic matter (LY/T 1,237–1,999), total nitrogen (LY/T 1,228–1,999), total phosphorus (LY/T 1,232–1,999), and total potassium (LY/T 1,232–1,999), etc. In addition, the leaf, branch, stem, and root organ samples from 55 trees of the 10 dominant tree species in the plots were collected, and a total of 220 mixed samples of each organ were obtained, and the total nitrogen, total phosphorus and total potassium in each sample were determined (LY/T 1,271–1,999).
2.3. Statistical analysis
Statistical analysis of the data was carried out using software such as SPSS16.0 and SAS9.1. The current study mainly evaluates the provisioning and supporting service functions according to the “Specifications for assessment of forest ecosystem services” (GB/T 38582-2020) (NFGA, 2020), and the main value indicators for evaluation include the forest supply value, species resource conservation value, soil conservation value, and forest nutrition retention value.
2.3.1. Forest supply value
The supply values of different individual timber are calculated based on the annual volume growth of the main tree species in different stand types, and then sum up to obtain the forest supply value ($⋅ha–1⋅ y–1) of per unit area for different stand types and age groups, which mainly refers to the value of living trees in the study area, the calculation formula is as follow:
where, Uwood product is the annual timber supply product value in the study area ($⋅y–1); Ai is the distribution area of the i-th wood product (ha); Si is the annual volume growth per unit area of the i-th wood product (m3 ha–1⋅y–1); Ui is the price of the i-th wood product ($⋅m–3); i = 1,2,3…n.
This study conducted statistical analysis on the annual ring samples of 10 major tree species in the study area, and plotted their diameter growth curves. By using the fitting equation of the diameter growth curve of each tree species and the stand volume table for single trees in Jilin Province (JPFD, 2003), this study calculated and analyzed the 2-year volume and stand volume per unit area for each tree species. Furthermore, the study obtained the unit area increment of stand volume (Si) for different forest types. The arithmetic average of the measured annual ring width data of different tree species was used to eliminate differences in different growth processes and growth environments. And because there is an error in drilling the annual ring samples, there will be a difference between the DBH calculated from the annual ring sample and the actual measurement value. Therefore, it is necessary to correct the annual ring width and the values measured by the girth to improve the accuracy of the DBH, the correction formula is as follows (Eq. 1):
where θ is the corrected value (cm); Dbh is the DBH measured by a tape (cm); Dic is the product of the accumulation of complete growth core growth ring sequence and complete DBH (cm); t is the tree age from tree core determination. The corrected tree-ring sequence is obtained by adding the θ value to each tree-ring sequence, which takes the existing bark thickness as part of the xylem (Zhang et al., 2012).
2.3.2. Species resource conservation value
According to the calculation formula of species resource conservation value in the assessment standard of “Specifications for assessment of forest ecosystem services” (NFGA, 2020), endangered species and ancient trees are included in the species conservation value evaluation. In the current study, the classification and statistics of plant species in various plots are based on the “China Species Red List” and its index system and ancient tree age index system.
The formula for calculating species conservation value is as follows:
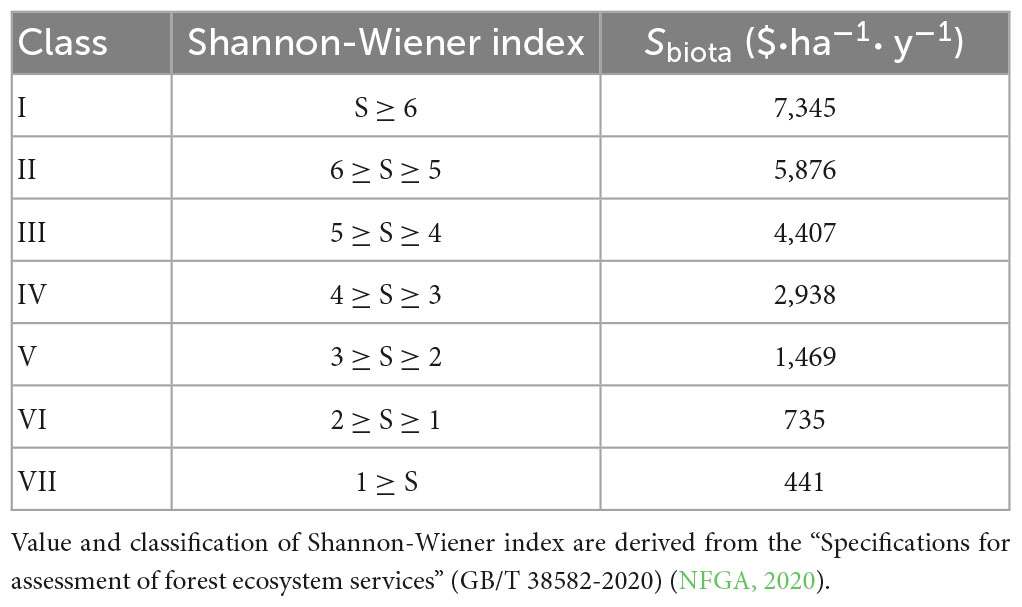
where, Uibiota is the value of the forest to protect biodiversity every year ($⋅y–1); Em is the rare and endangered index assessing species m within a stand (or area); x is the counted number of rare and endangered species; Bn is the endemic index for assessing species n within a stand (or area); Or is the ancient tree age index for evaluating species r in the stand (or area); z is the number of species for calculating ancient tree species; Sbiota is the opportunity cost of annual species loss per unit area ($⋅ha–1⋅y–1), and the corresponding Shannon-Wiener index classes and values are shown in Table 2 (GB/T 38582-2020); Ai is the forest area (ha); i = 1,2,3…n.
The formula for the Shannon-Wiener index calculation is as follows:
where, H’ is Shannon-Wiener index; Pi represents the importance value of the i-th species; S represents the number of species in the community, and i = 1,2,3…n.
The formula for the calculation of the overall diversity of the community is as follows:
where, D1, D2, and D3 represent the diversity index of the tree layer, shrub layer, and herb layer, respectively;,W1, W2, and W3 represent the weighting coefficients of the tree layer, shrub layer, and herb layer, respectively; Ci represents the coverage of different layers; C represents the total coverage of the community in different layers; hi represents the average height of vegetation in different community layers; h represents the sum of the average heights of the community in different layers; i = 1,2,3…n.
2.3.3. Soil conservation value
In the current study, the shadow engineering method and the market value method (Li et al., 2011; Villa et al., 2014) were used to calculate the value of soil stabilization and soil fertility conservation, respectively, and the calculation formulas are as follows:
where, Gi is the amount of soil retained by the forest (t y–1); Ai is the forest area (ha); X1 and X2 are the soil erosion modulus of forested land and unforested land in Northeast China, respectively (t⋅ha–1⋅y–1). Ui–soil is the market value of soil retained by the forest ($⋅y–1); Csoil is the cost of excavating and transporting a unit volume of earthwork in the market ($⋅m–3); ρ is the soil bulk density of forest woodland (g⋅cm–3); Ui–fertility is the annual value of each stand to conserve soil fertility ($⋅y–1); Nnutrition, Pnutrition, Knutrition, and M are the measured N content (%), P content (%), K content (%), and organic matter content (%) of soil, respectively; R1 and R2 are the N content (%) and P content (%) of the phosphoric acid fertilizer, respectively; C1, C2, and C3 are the price of phosphoric acid fertilizer, potassium chloride fertilizer, and organic matter ($⋅t–1), respectively; i = 1,2,3…n.
2.3.4. Forest nutrition retention value
In order to obtain the value of the nutrients retained by the trees, the substitution value method is used to convert the large amount of N, P, K, and other nutrients that the trees absorb from the soil or air each year into the market value of chemical fertilizers, and the forest nutrition retention value is calculated as follows:
where, GN, GP, and GK are the amounts of nitrogen, phosphorus, and potassium accumulated by trees each year (t⋅y–1), respectively; Ui–nutrition is the accumulated value of nutrients in the tree year ($⋅y–1); Nnutrition, Pnutrition, and Knutrition are the ratios (%) of N, P, and K contained in forest trees, respectively; Byear is the annual growth of forest biomass (kg); R1 and R2 are the N content and P content (%) of the phosphoric acid fertilizer, respectively; R3 is the K content (%) of potassium chloride fertilizer; C1 and C2 are the prices of diammonium phosphate fertilizers and potassium chloride fertilizers, respectively ($⋅t–1); i = 1,2,3…n.
Using the tree species DBH growth curve fitting results and the biomass allometric growth equation (Wang, 2006), the biomass growth of each tree species was obtained, and then the N, P, and K contents of different tree species were used to obtain the annual tree nutrient retention of each survey plot. Finally, the prices of different fertilizers and the contents of fertilizer nutrients are converted into market values to obtain the nutrient retention value per unit area of forest trees in different stand types and age groups ($⋅y–1). While the annual net productivity and nutrient content of different forest vegetation types are different, and the nutrient content of different organs of the same plant is also different, so the average nutrient content of plant branches, stems, leaves, and roots cannot truly represent the overall nutrient content of plants, and it is necessary to comprehensively consider the nutrient content and biomass weight. The calculation formulas are as follows:
where, Gnutrient is the weighted average nutrient ratio of the arbor; Ci is the percentage of nutrients in an organ of the tree; Wj is the biomass of a certain organ of the tree; Wt is the total biomass of tree; i = 1,2,3…n.
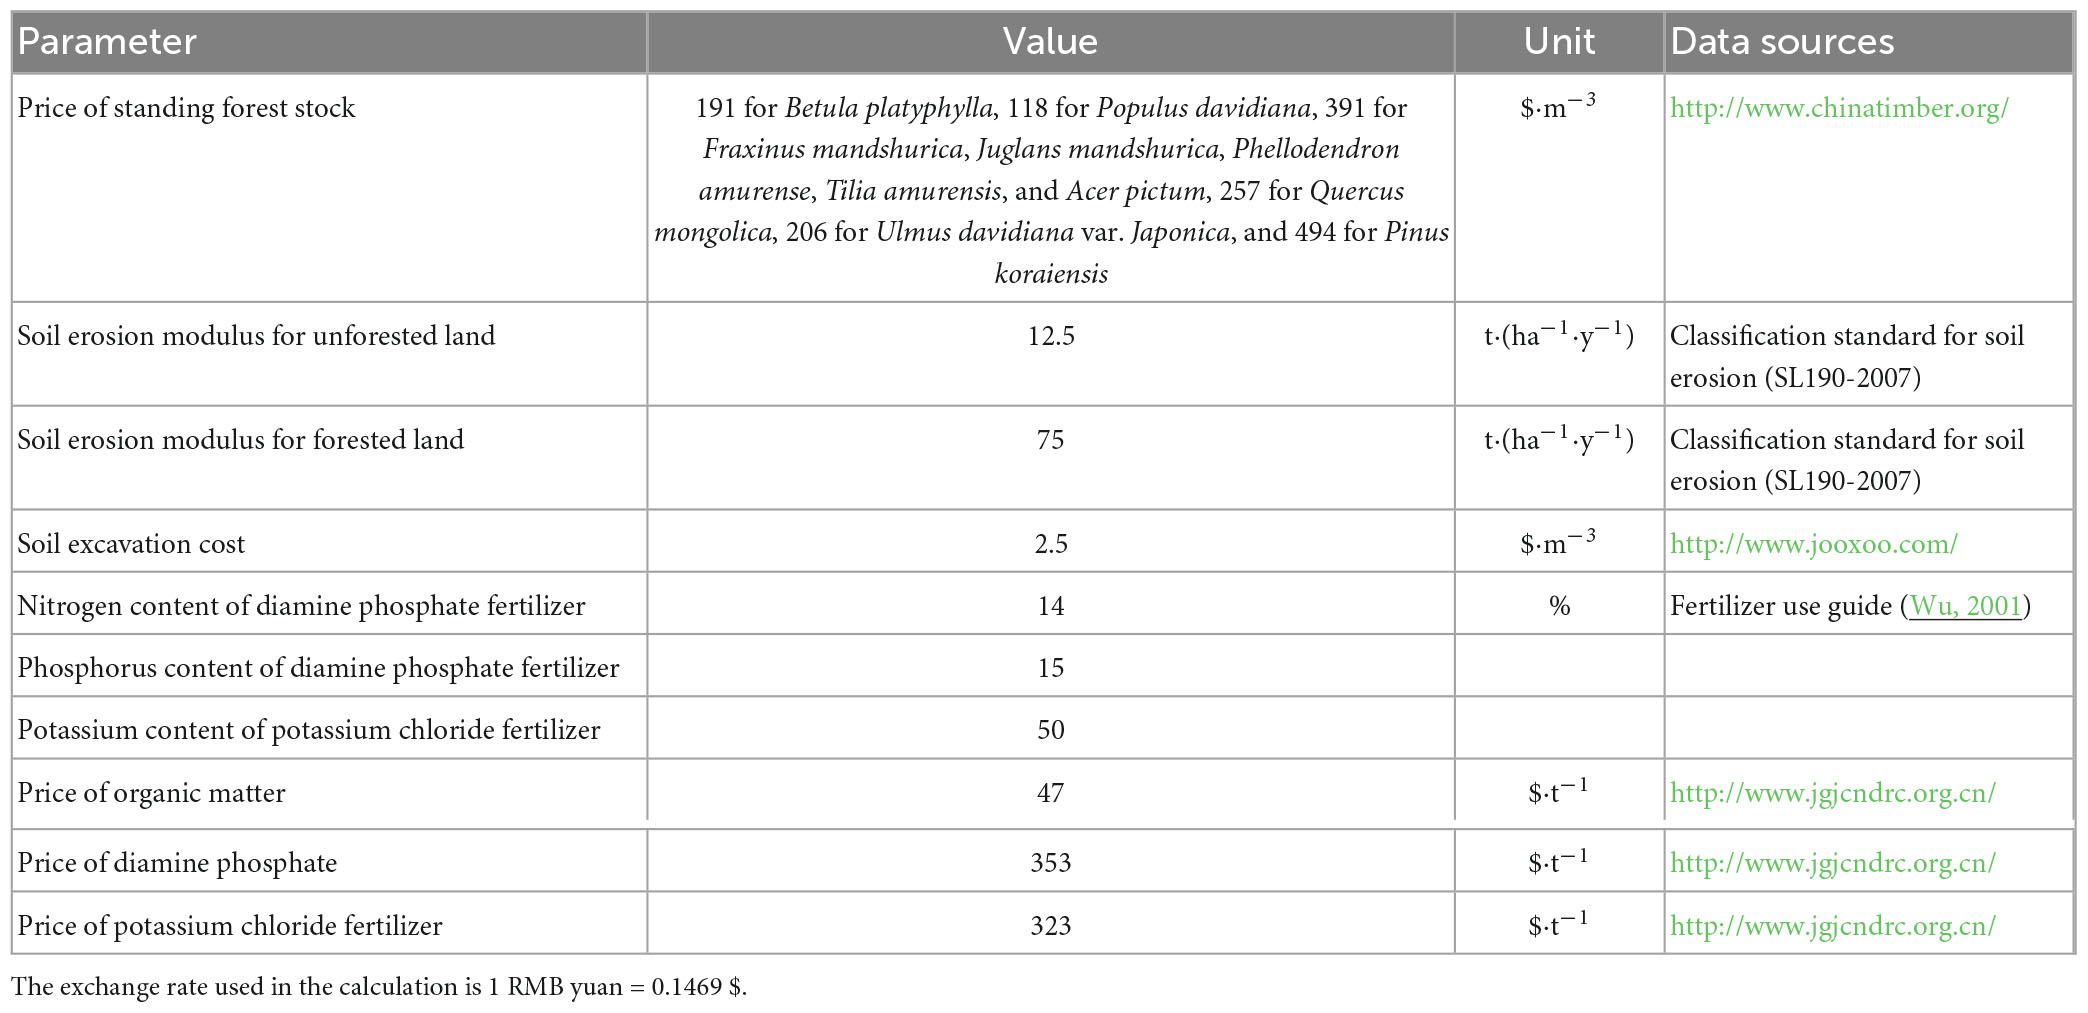
The related parameter values are listed in Table 3. The DBH growth fitting equations, volume growth, biodiversity index, soil nutrition contents and soil bulk density of different stand types, and weighted nutrient contents of different organs and individuals for each tree specie are showed in supplementary material.
3. Results
3.1. The value of provisioning services function of different stand types
3.1.1. Supply value of forest trees
The highest supply value of forest trees per unit area among different stand types is in near-mature F. mandshurica forest, which is 2,190 $⋅ha–1⋅y–1 (Figure 3), and the young B. platyphylla forest is the lowest, only 388 $⋅ha–1⋅y–1, moreover, the difference in supply value of mixed coniferous broad-leaved forest among different age groups can reach 1410 $⋅ha–1⋅y–1.
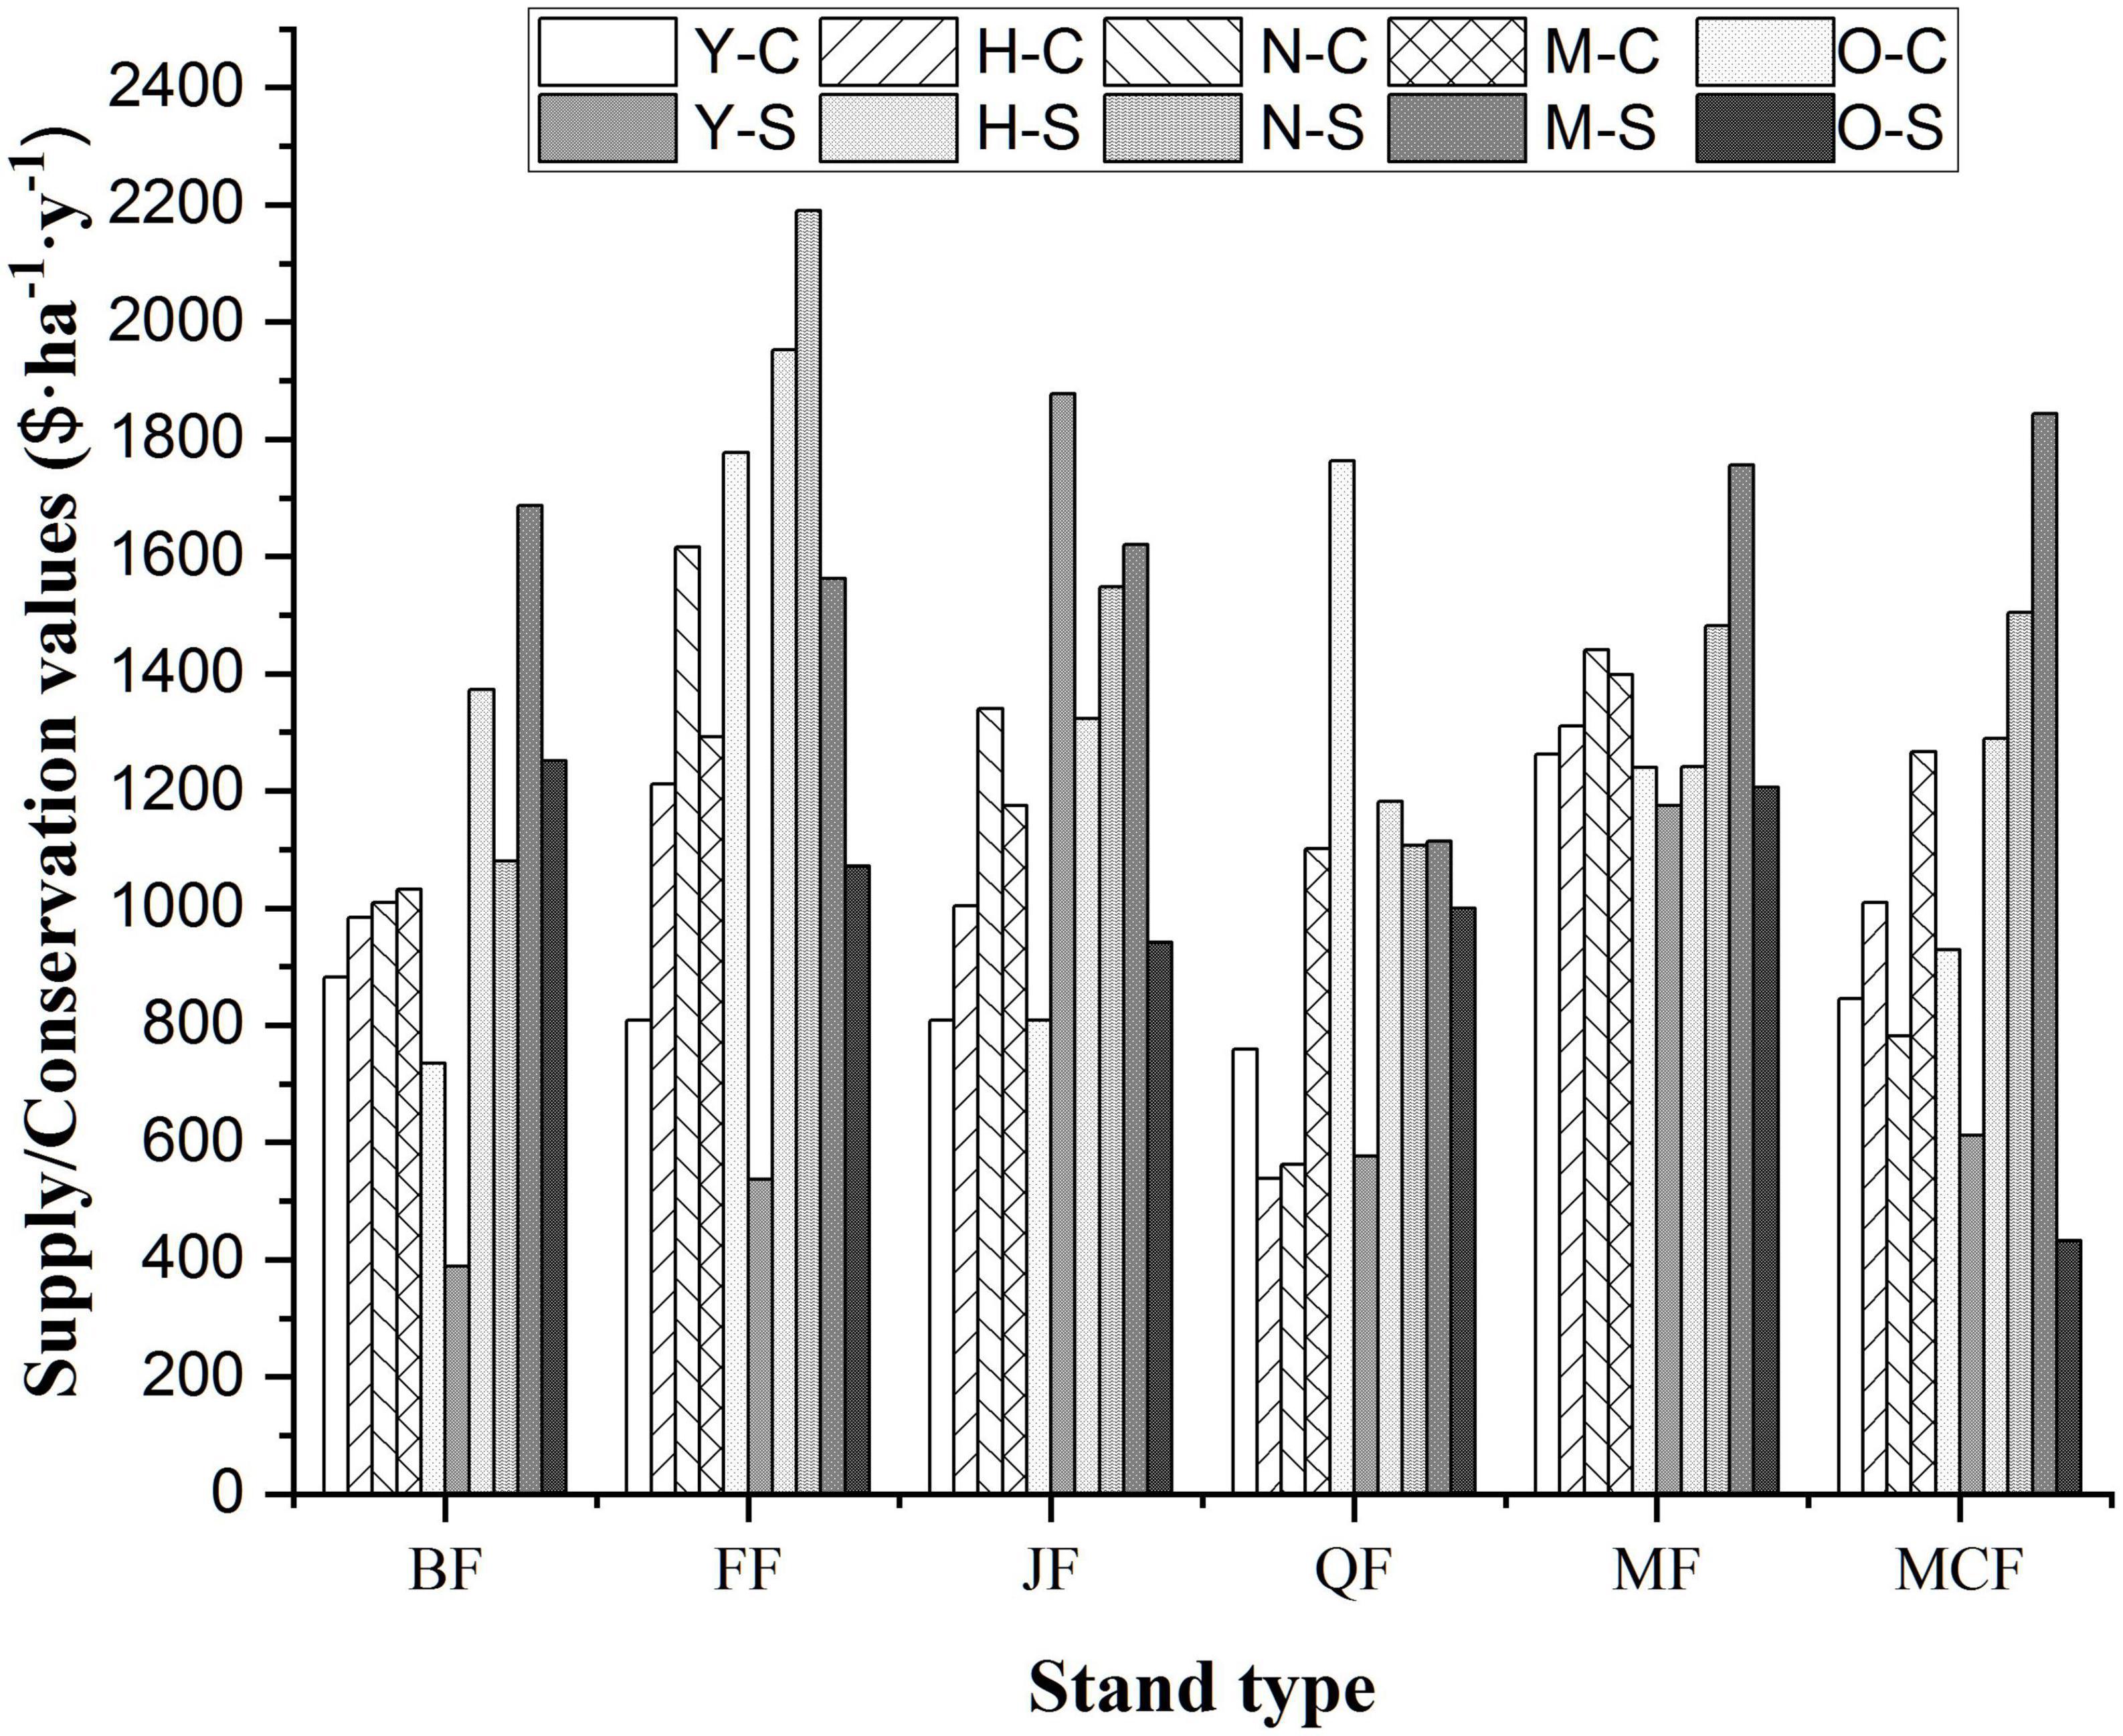
Figure 3. Supply value and species resources conservation value of per unit area of different stand types and age groups. Y-C, H-C, N-C, M-C, and O-C are the conservation values of species resources of young forest, half-mature forest, near-mature forest, mature forest and over-mature forest, respectively; Y-S, H-S, N-S, M-S, and O-S are the supply values of young forest, half-mature forest, near-mature forest, mature forest and over-mature forest, respectively. Stand types include Betula platyphylla forest (BF), Fraxinus mandshurica forest (FF), Juglans mandshurica forest (JF), Quercus mongolica forest (QF), mixed broad-leaved forest (MF), and mixed coniferous broad-leaved forest (MCF).
3.1.2. Conservation value of species resources
The survey results showed that the vegetation types of the near threatened (LU) level in the study area were F. mandshurica, P. amurense, and P. koraiensis, which were mostly found in mixed broad-leaved forest and mixed coniferous and broad-leaved forest. And the ancient trees (100∼299a) included and other tree species totaling 94, mainly in the mature and over-mature forest stage. And a total of 94 ancient trees (100∼299a), including P. koraiensis, Q. mongolica, F. mandshurica, T. amurensis, and J. mandshurica, were found, mainly in the mature and over-mature forest stages. Based on the distribution of endangered species, precious ancient trees and endemic species in the study area and the Shannon-Wiener index classes and values, the species conservation value ($⋅y–1) of per unit area of different stand types and age groups was calculated (Figure 3).
With the increase of the age, the species conservation value per unit area of B. platyphylla forest, J. mandshurica forest, and B. platyphylla forest showed a unimodal change (Figure 3), and the peaks appeared in mature forest, near-mature forest and near-mature forest, respectively. The species conservation value of Q. mongolica forest showed a continuous increasing trend as a whole, and reached the maximum value in over-mature forest, and the value for F. mandshurica forest was relatively high in near-mature forest and over-mature forest, while those in mixed coniferous broad-leaved forest were higher in mature and half-mature forests. Among the six stand types, the conservation value of over-mature F. mandshurica forest is the highest, which is 1,777 $⋅ha–1⋅y–1, and the value of half-mature Q. mongolica forest is the lowest, which is only 539 $⋅ha–1⋅y–1.
3.2. The value of supporting services function of different stand types
3.2.1. Soil conservation value
The soil reinforcement value per unit area of different stand types is as follows: J. mandshurica forest (231 $⋅ha–1⋅y–1) > mixed broad-leaved forest (200 $⋅ha–1⋅y–1) > F. mandshurica forest (199 $⋅ha–1⋅y–1) > B. platyphylla forest (195 $⋅ha–1⋅y–1) > mixed coniferous broad-leaved forest (194 $⋅ha–1⋅y–1) > Q. mongolica forest (176 $⋅ha–1⋅y–1) (see Figure 4). The soil fertilizer retention value per unit area of different stand types and age groups ranges from 1,073 to 6,414 $⋅ha–1⋅y–1, the highest value is in the near-mature J. mandshurica forest, and the lowest is in the young F. mandshurica forest. Among them, the retention value of N element is relatively high, ranging from 301 to 4,501 $⋅ha–1⋅y–1, and the highest and lowest values are in young F. mandshurica forest and near-mature J. mandshurica forest, respectively. The retention values for K and P are 344∼1,165 and 6∼1,485 $⋅ha–1⋅y–1, respectively, and the lowest values both appear in the young F. mandshurica forest, and the highest values are in the near-mature Q. mongolica forest and half-mature F. mandshurica forest, respectively. The soil fertilizer retention value of organic matter is between 49 and 825 $⋅ha–1⋅y–1 with the highest value in over-mature F. mandshurica forest.
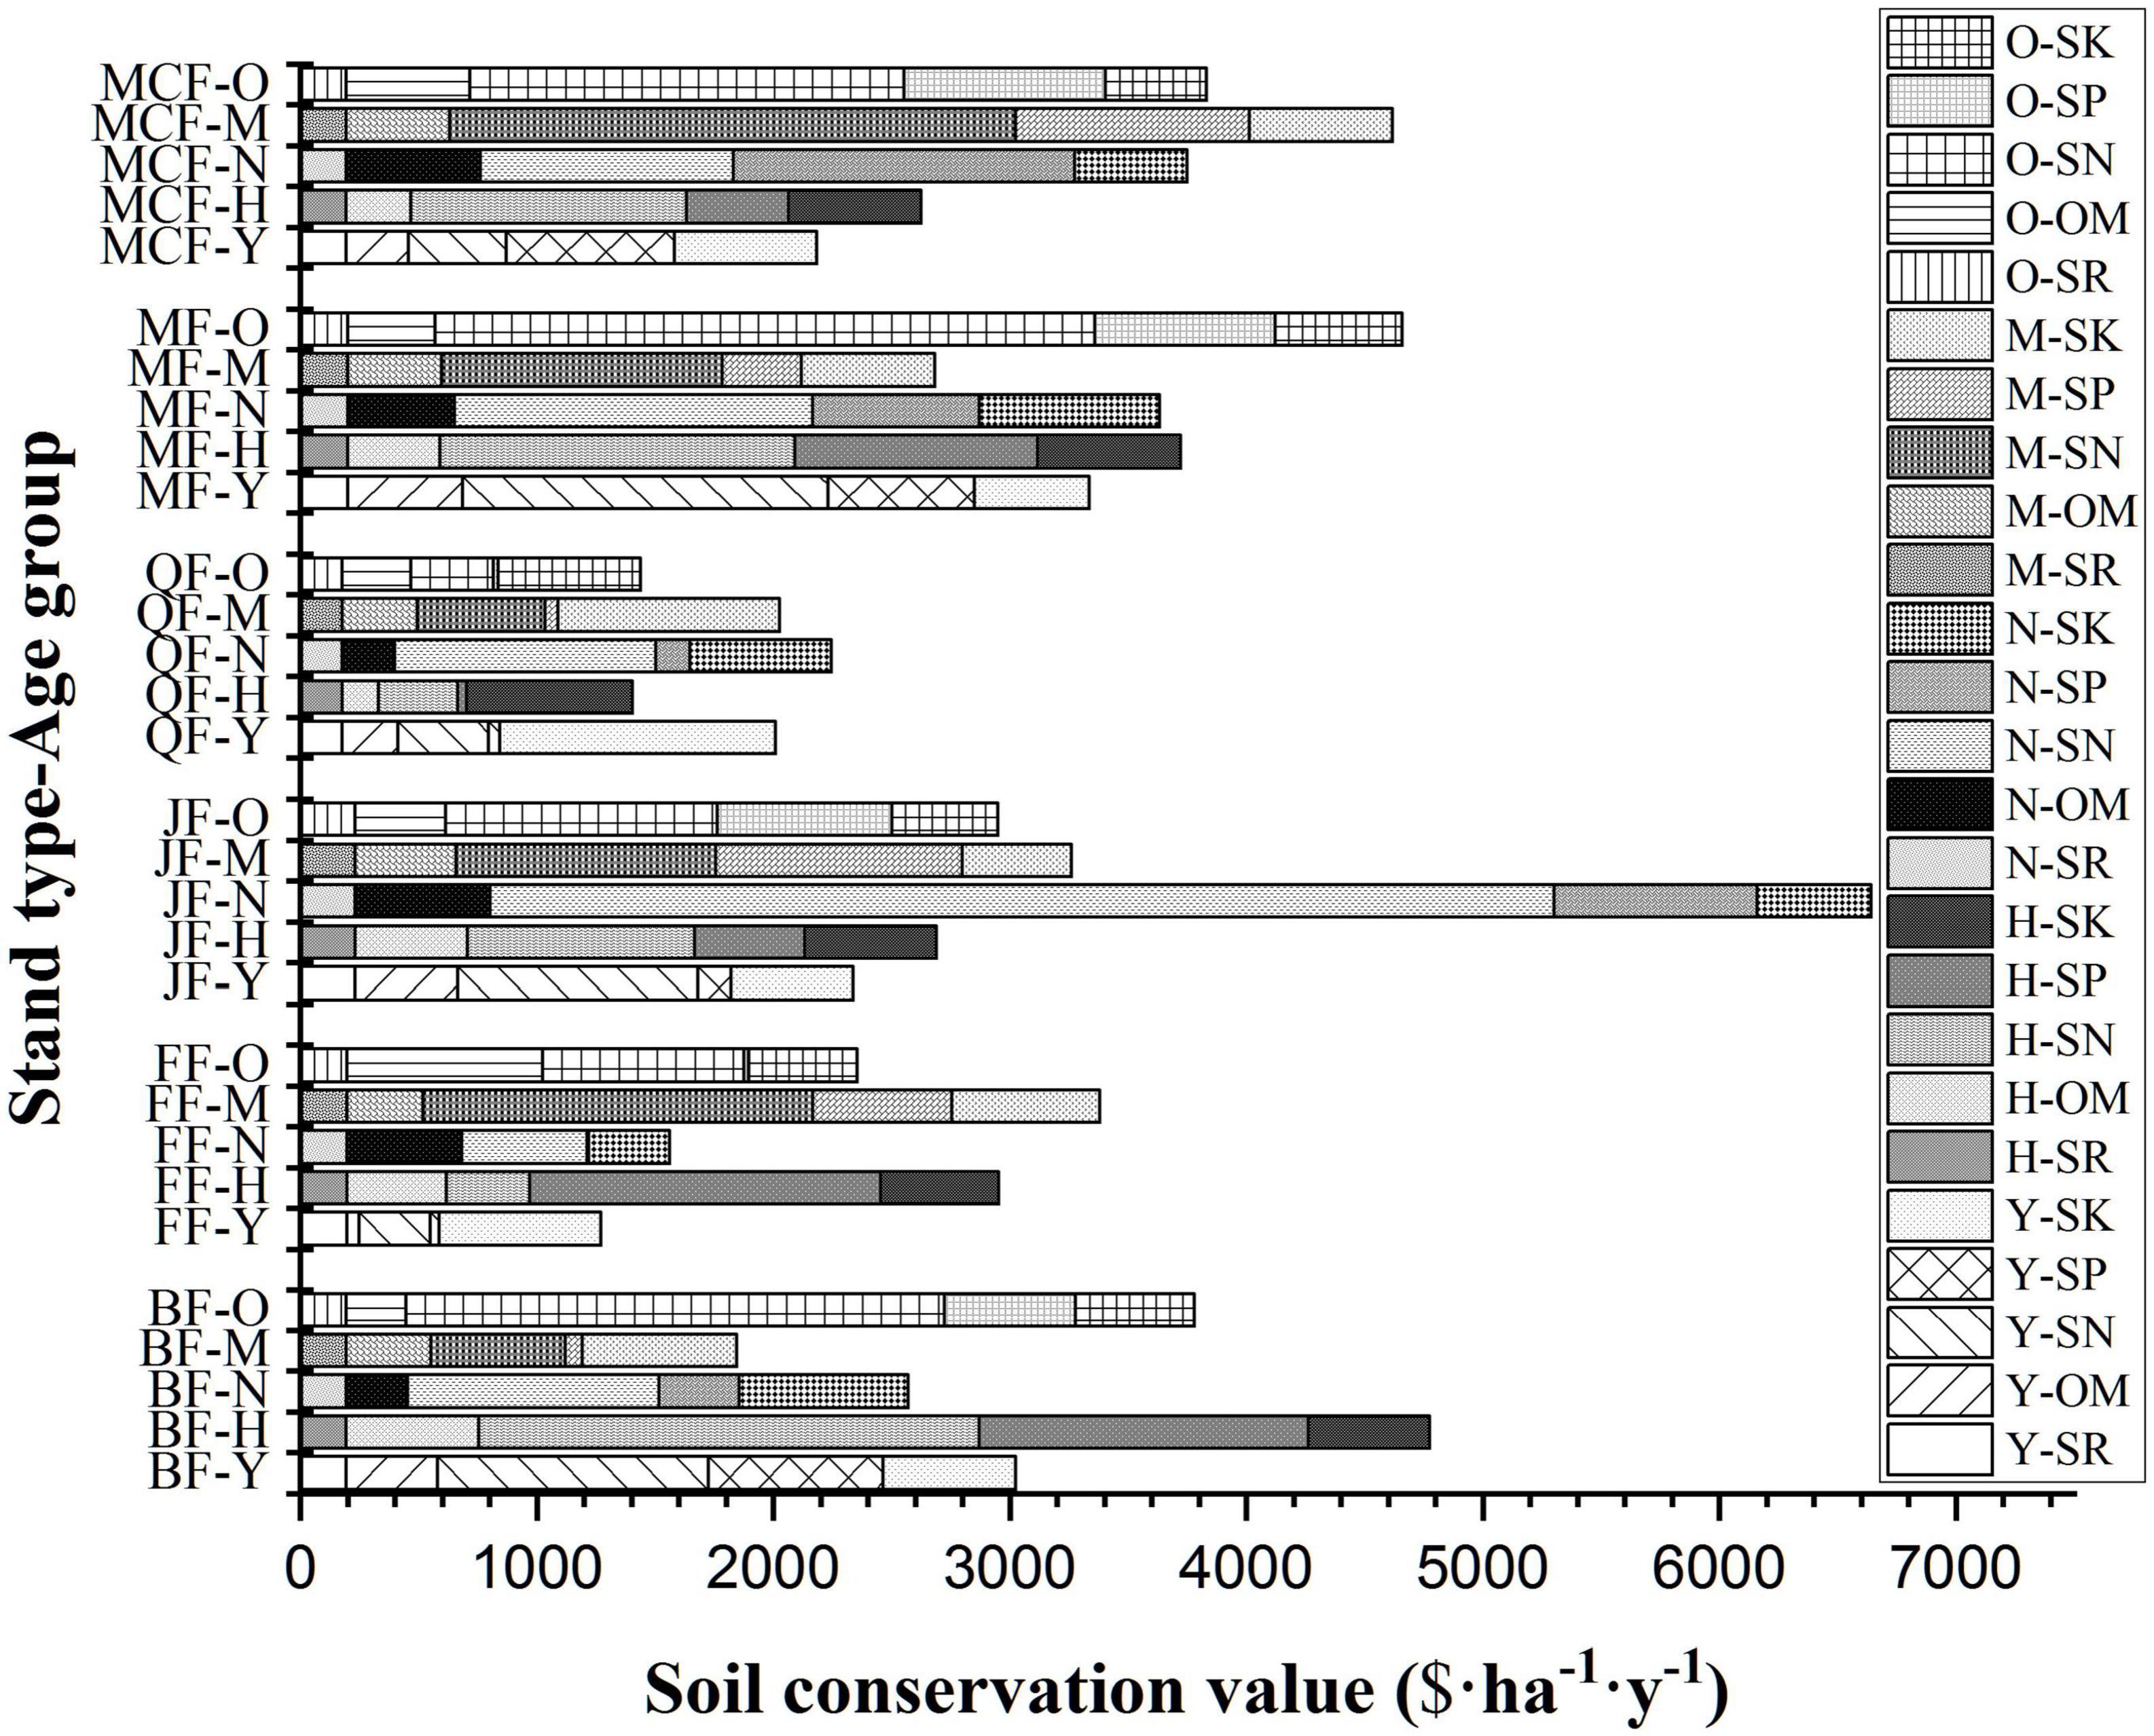
Figure 4. Soil conservation value of per unit area of different stand types and age groups. Y-(SN, SP, SK, OM, SR), H-(SN, SP, SK, OM, SR), M-(SN, SP, SK, OM, SR), and O-(SN, SP, SK, OM, SR) are the soil conservation value for N, P, K, organic matter and soil retention of young forest, half-mature forest, near-mature forest, mature forest, and over-mature forest, respectively; Betula platyphylla forest (BF)-Y, H, N, M, O, Fraxinus mandshurica forest (FF)-Y, H, N, M, O, Juglans mandshurica forest (JF)-Y, H, N, M, O, Quercus mongolica forest (QF)-Y, H, N, M, O, mixed broad-leaved forest (MF)-Y, H, N, M, O, and mixed coniferous broad-leaved forest (MCF)-Y, H, N, M, O are the young forest, half-mature forest, near-mature forest, mature forest, and over-mature forest of different stand types, respectively.
3.2.2. Forest nutrient retention value
The tree nutrient values of N, P, and K elements per unit area of different stand types and age groups were ranked as follows: N > P > K (Figure 5). The forest nutrient retention values of per unit area of N and P are 43∼177 and 9∼61 $⋅ha–1⋅y–1, respectively, and the highest value is in mature B. platyphylla forest. The retention value of K is between 2 and 16 $⋅ha–1⋅y–1, and the near-mature forest of F. mandshurica forest is relatively high. The lowest retention values of N, P, and K are the over-mature mixed coniferous broad-leaved forest. Based on N, P, and K, the retention value of different stand types is between 53 and 252 $⋅ha–1⋅y–1, and the value of mature B. platyphylla forest is relatively high, while the mixed coniferous broad-leaved forest is the lowest. The nutrient retention values of near-mature forest and mature forest are relatively high among different age groups, for example, the values of mature B. platyphylla forest and near-mature F. mandshurica forest are more than 235 $⋅ha–1⋅y–1. The values of young and over-mature forests are relatively low, such as the retention values of young and over-mature mixed coniferous broad-leaved forest are only 63 and 53 $⋅ha–1⋅y–1, respectively.
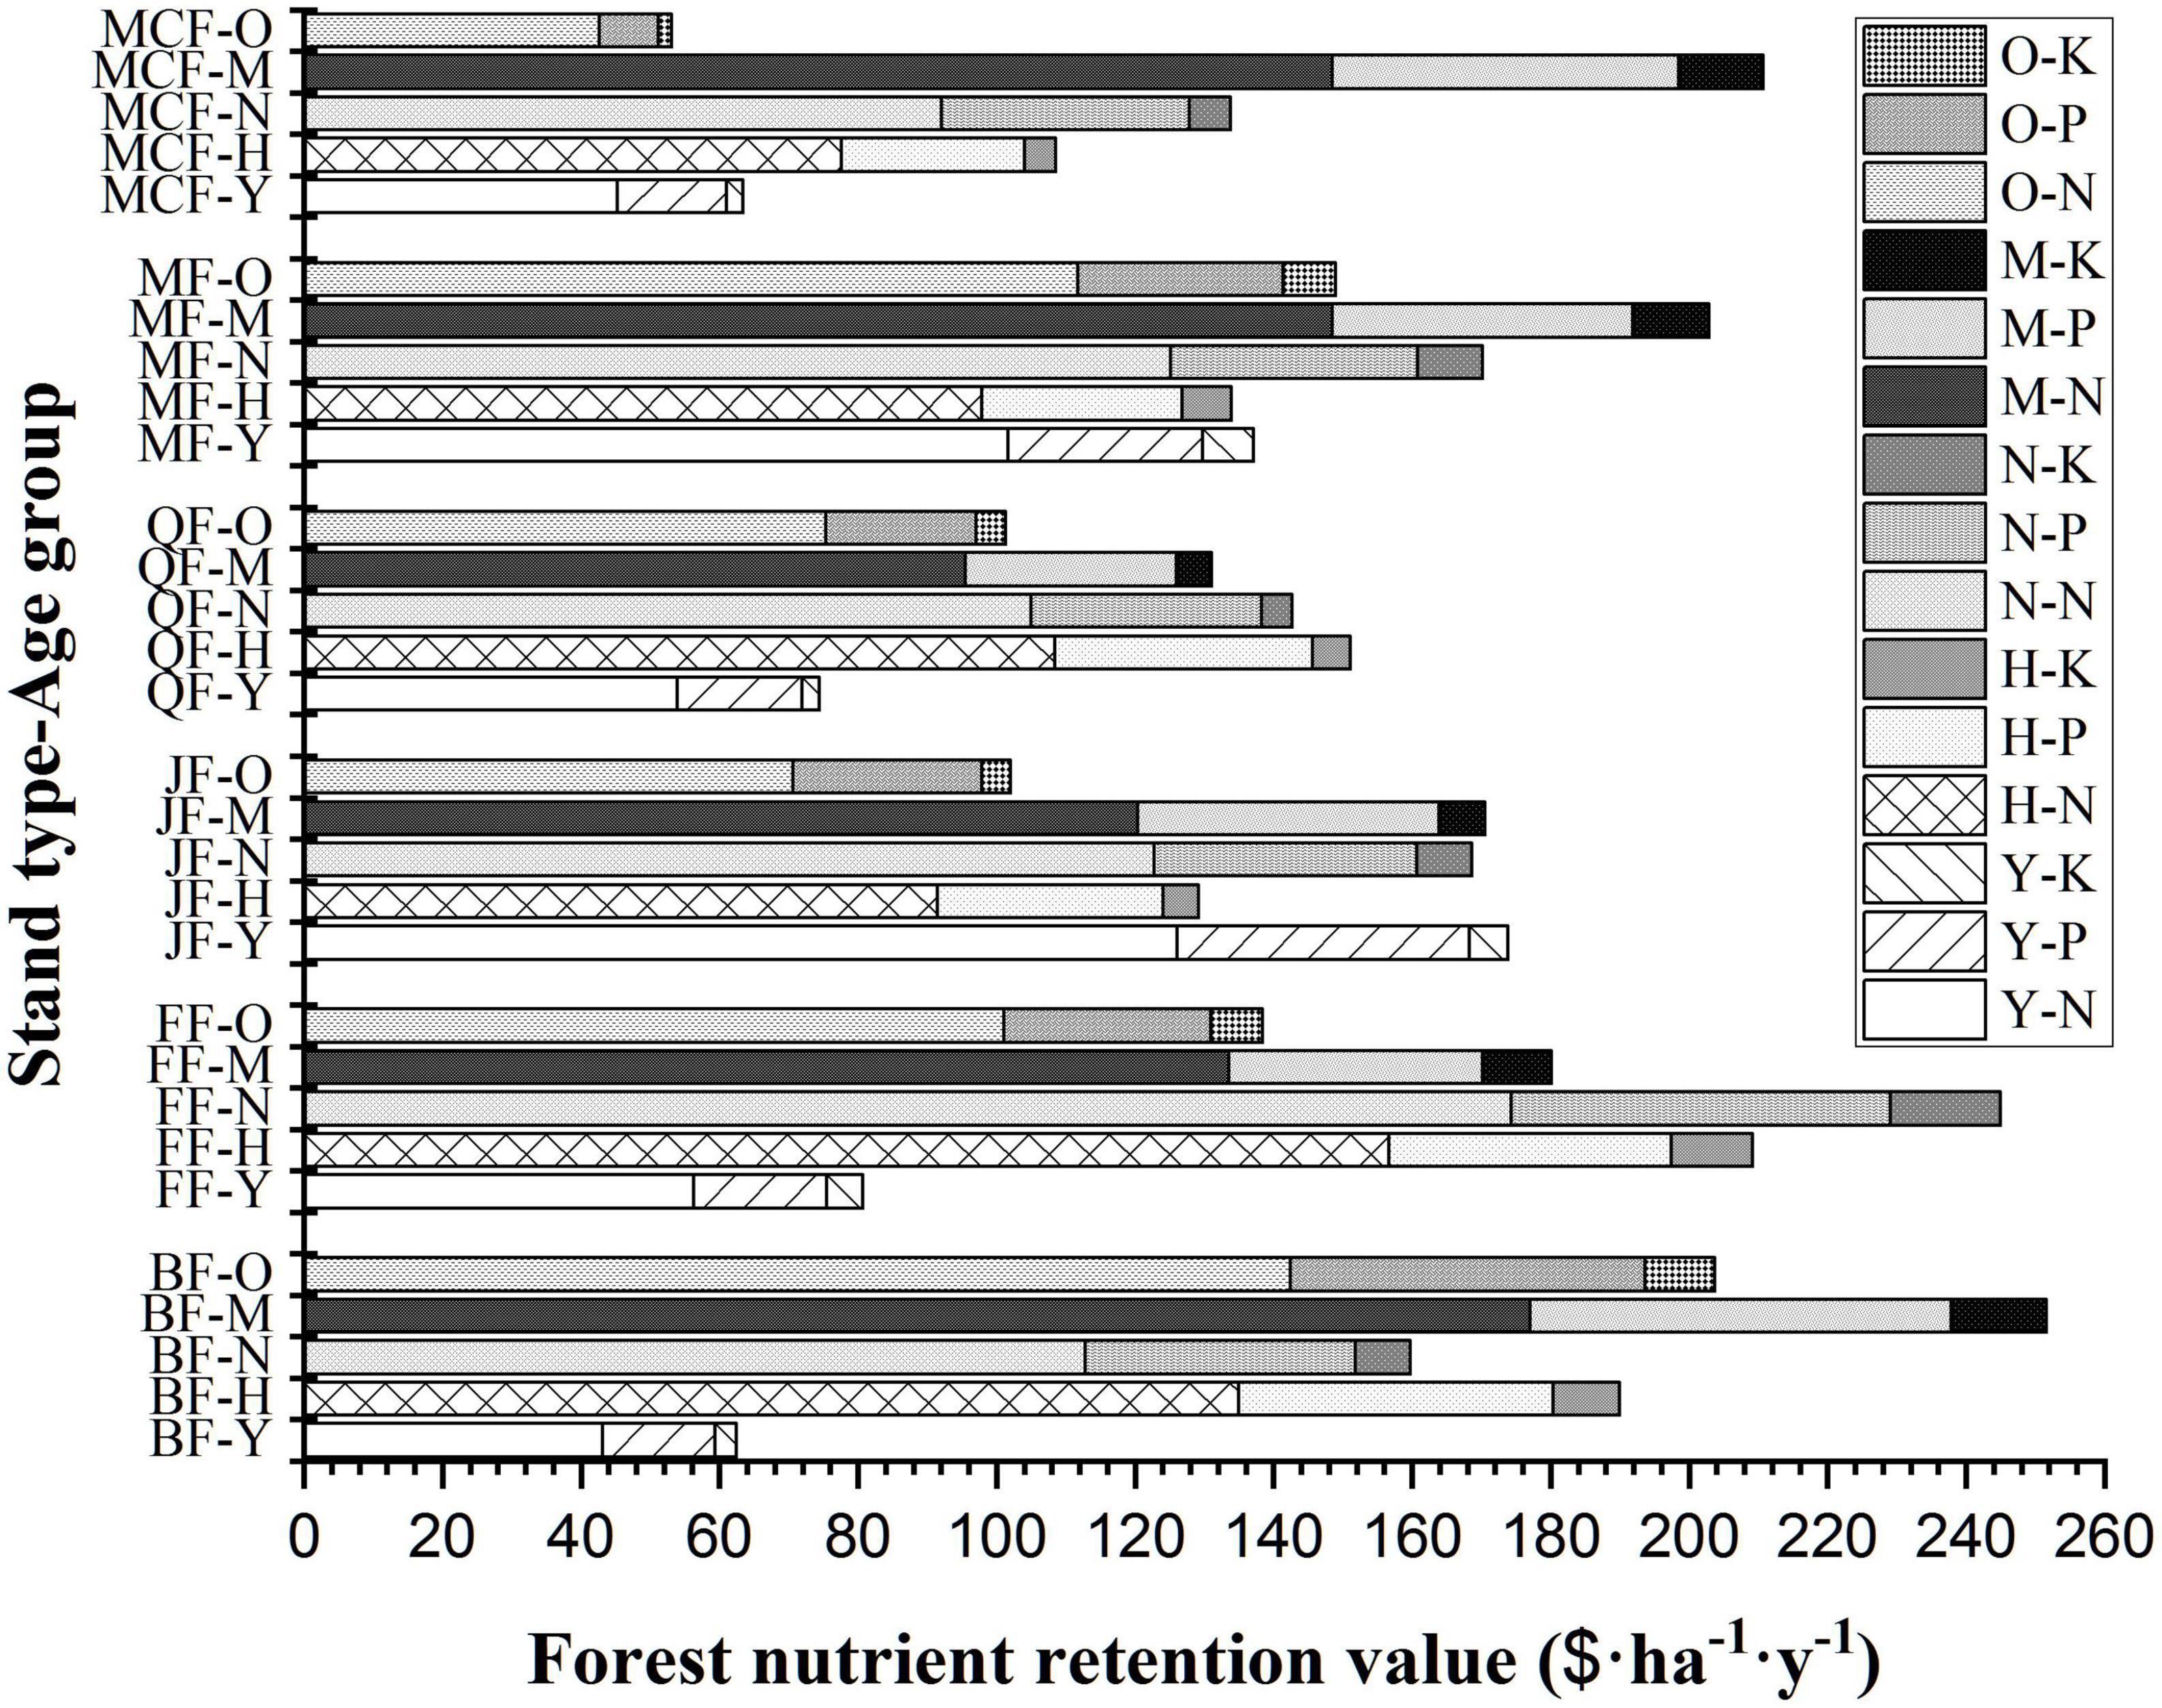
Figure 5. Forest nutrient retention value of per unit area of different stand types and age groups. Y-(N, P, K), H-(N, P, K), M-(N, P, K), and O-(N, P, K) are the forest nutrient retention values of young forest, half-mature forest, near-mature forest, mature forest, and over-mature forest, respectively; Betula platyphylla forest (BF)-Y, H, N, M, O, Fraxinus mandshurica forest (FF)-Y, H, N, M, O, Juglans mandshurica forest (JF)-Y, H, N, M, O, Quercus mongolica forest (QF)-Y, H, N, M, O, mixed broad-leaved forest (MF)-Y, H, N, M, O, and mixed coniferous broad-leaved forest (MCF)-Y, H, N, M, O are the young forest, half-mature forest, near-mature forest, mature forest, and over-mature forest of different stand types, respectively.
3.3. The value of supporting services function of different stand types
The total forest area of the reserve is 116,234 ha, and the forest composition is mainly mixed broad-leaved forest and Q. mongolica forest, accounting for 83.1% of the forest area. The forest areas of B. platyphylla forest, J. mandshurica forest, and mixed coniferous broad-leaved forest are similar, which are between 4 and 6%, while the F. mandshurica forest has the smallest area (1.9%). Based on the calculation results of the services function value per unit area of different forest types and age groups, combined with the survey data, the value of forest community provision and support service function in Sanhu Nature Reserve ($⋅y–1) was obtained (Figure 6). The total value of forest ecosystem provision and support services in the reserve is 659.07 million $⋅y–1, and the average value per unit area is 5,670 $⋅ha–1⋅y–1. The value of different service functions are as follows: soil fertilizer retention value (319.30 million $⋅y–1) > forest trees supply value (61.96 million $⋅y–1) > species resources conservation value (134.48 million $⋅y–1) > soil reinforcement value (22.63 million $⋅y–1) > forest nutrient retention value (19.02 million $⋅y–1), and soil fertilizer retention value accounts for the highest proportion, followed by forest trees supply value (24.6%) and species resources conservation value (20.5%) (Figure 7). The proportion of provision and service function value of different stand types is mainly affected by the size of the stand area. The mixed broad-leaved forest has the highest proportion, accounting for 62.9%, followed by the Q. mongolica forest with 19.0%, accounting for 81.9% in total, which are the main body of the reserve’s service function value. The value proportion of J. mandshurica forest was 7.1%, while the values of F. mandshurica forest, B. platyphylla forest, and mixed coniferous broad-leaved forest all accounted for less than 5% with a total of 11.0% (Figure 7). The service value per unit area is between 7,595 and 5,259 $⋅ha–1⋅y–1, which is represented by J. mandshurica forest > mixed broad-leaved forest > F. mandshurica forest > mixed coniferous broad-leaved forest > B. platyphylla forest.
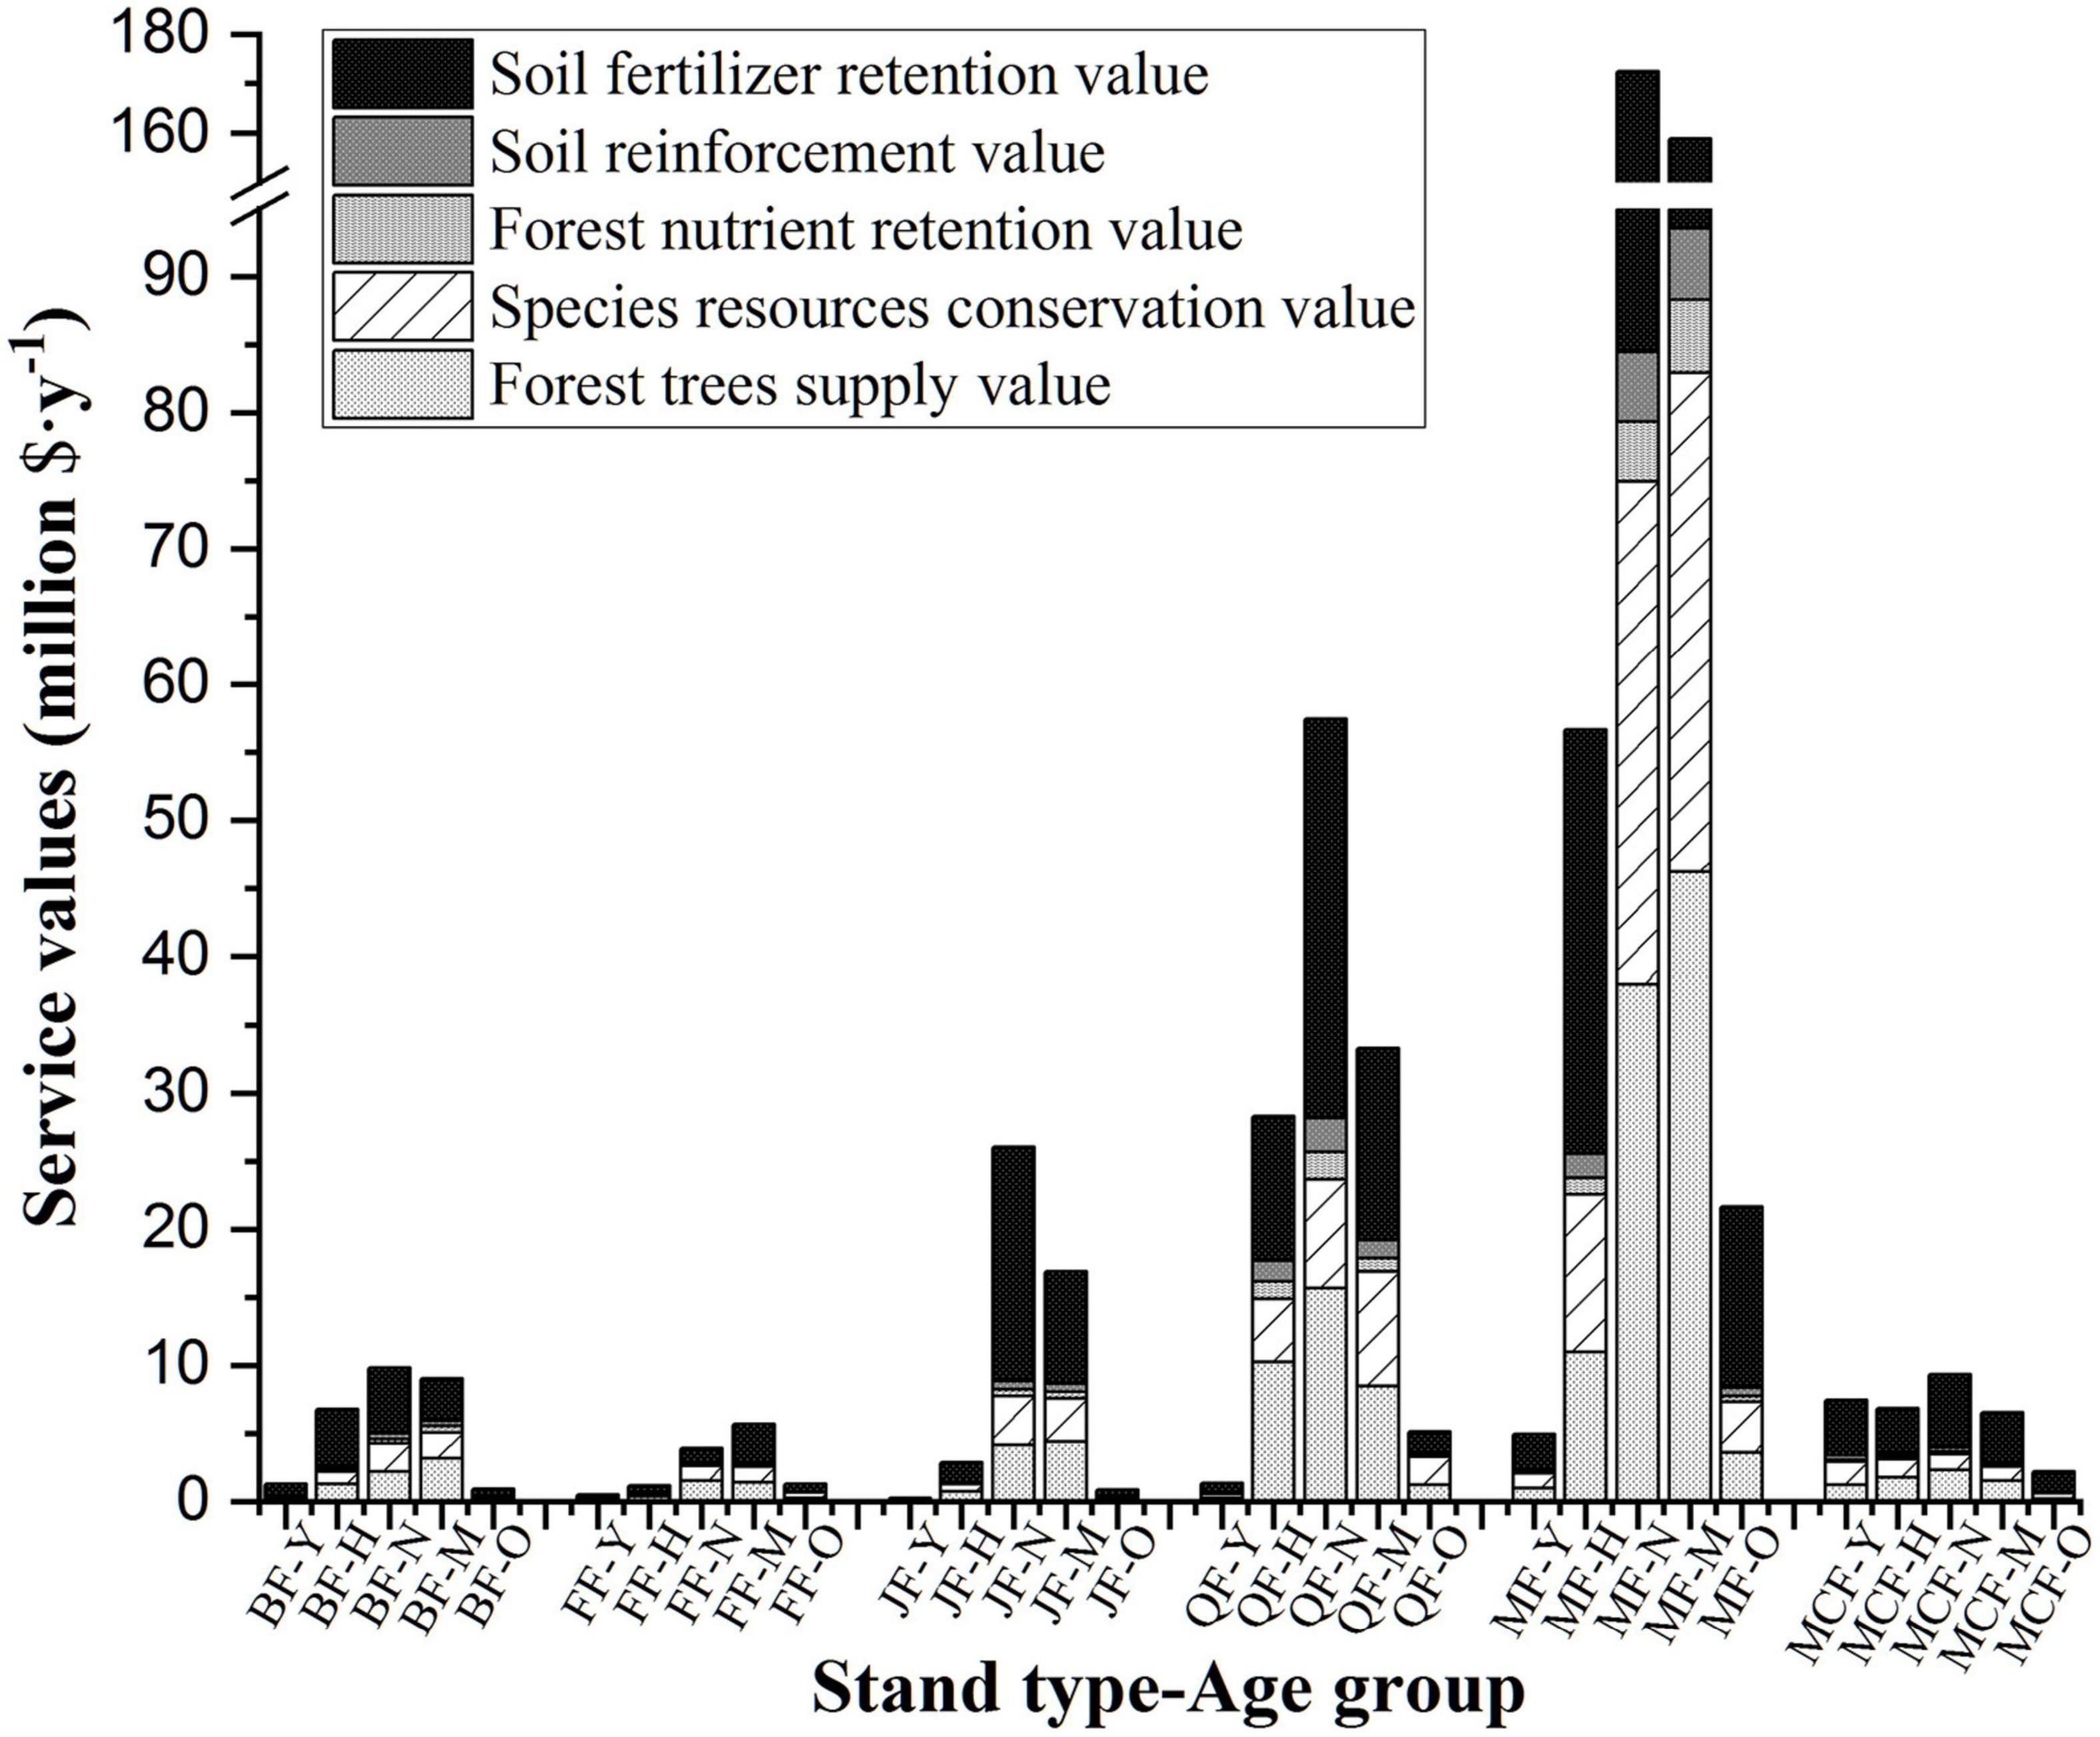
Figure 6. The values of provision and support service functions in Sanhu Reserve. Betula platyphylla forest (BF)-Y, H, N, M, O, Fraxinus mandshurica forest (FF)-Y, H, N, M, O, Juglans mandshurica forest (JF)-Y, H, N, M, O, Quercus mongolica forest (QF)-Y, H, N, M, O, mixed broad-leaved forest (MF)-Y, H, N, M, O, and mixed coniferous broad-leaved forest (MCF)-Y, H, N, M, O are the young forest, half-mature forest, near-mature forest, mature forest, and over-mature forest of different stand types, respectively.
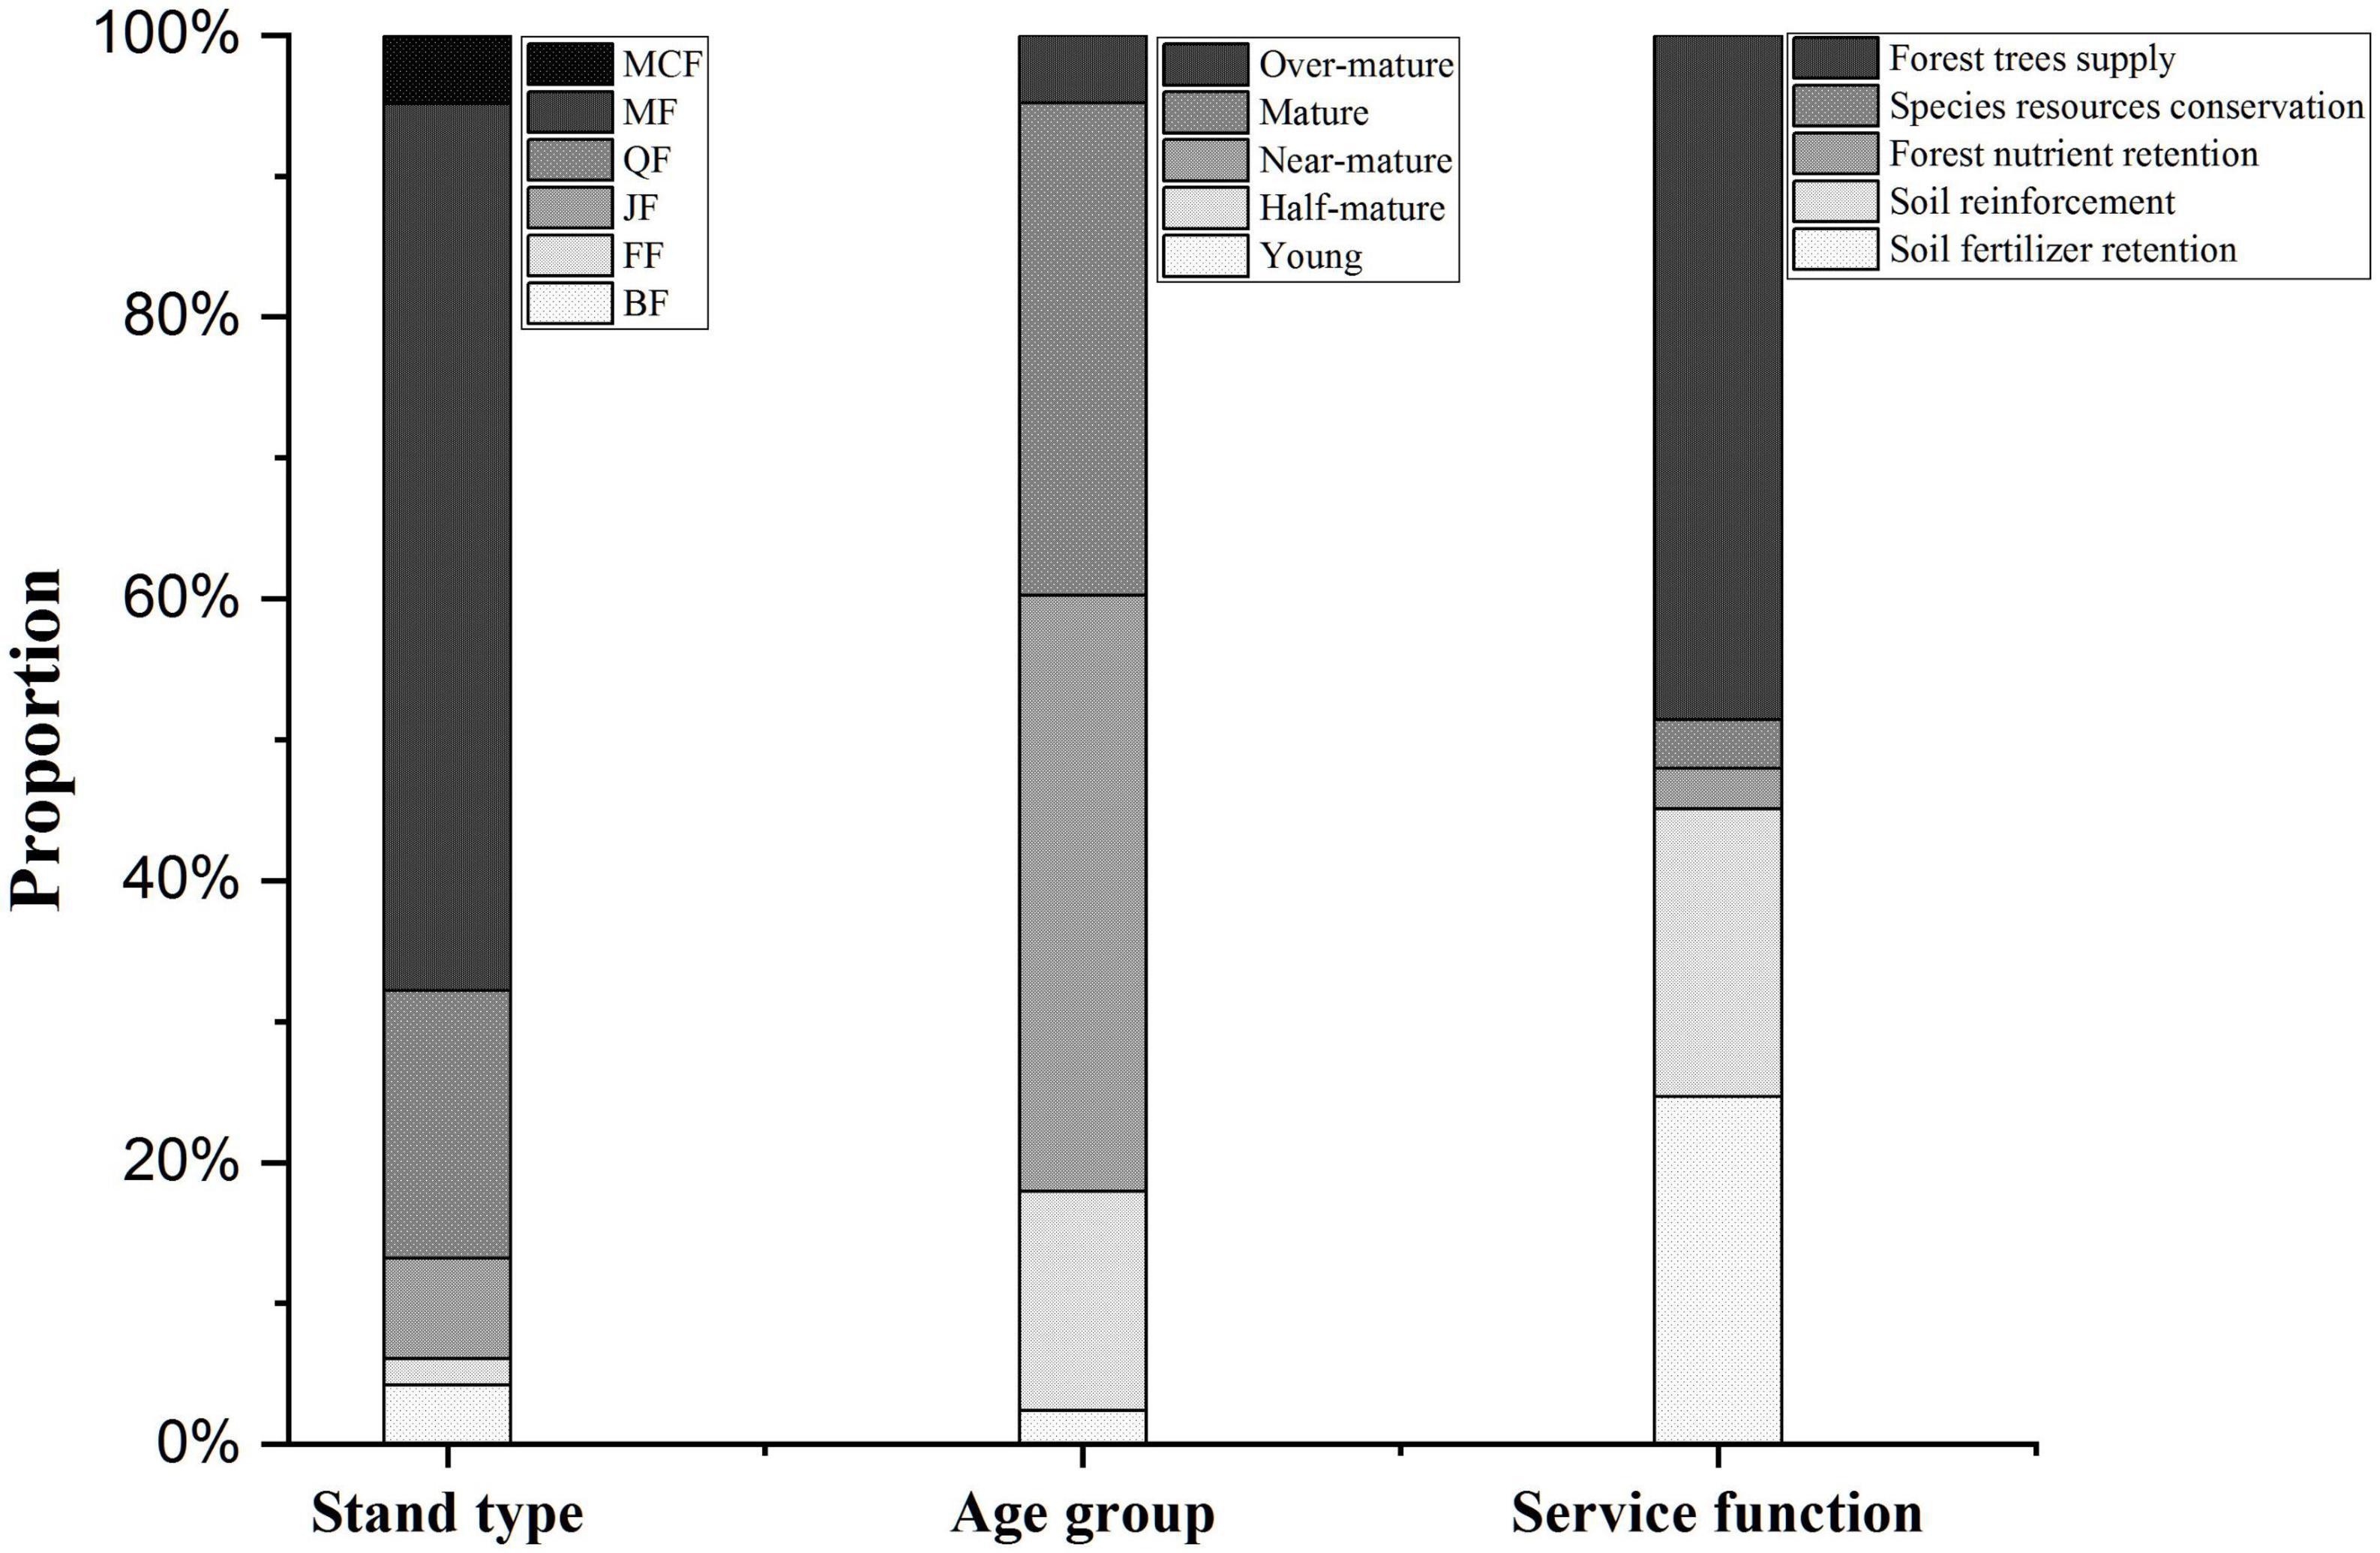
Figure 7. Proportion of the values of different service functions, stand types, and age groups. Stand types include Betula platyphylla forest (BF), Fraxinus mandshurica forest (FF), Juglans mandshurica forest (JF), Quercus mongolica forest (QF), mixed broad-leaved forest (MF), and mixed coniferous broad-leaved forest (MCF).
Among all age groups, the value of provision and supply of near-mature forest is the highest, reaching 272.50 million $⋅y–1, accounting for 42.3% of the total value, followed by mature forest (34.9%). The proportion of half-mature forest is 15.5%, and the proportions of over-mature forest (4.8%) and young forest (2.4%) are relatively small. The service value of the near-mature J. mandshurica forest is the highest (9,607 $⋅ha–1⋅y–1), and the young F. mandshurica forest is the lowest (2,703 $⋅ha–1⋅y–1). Near-mature forest not only occupies the largest area of forest land in the reserve, but also has high supply value and soil fertilizer retention value, which is crucial for the sustainable and stable performance of ecological functions and value growth of nature reserve, followed by mature forest (Figures 6, 7).
4. Discussion
There are noticeable variations in economic utilization, species conservation, nutrient retention, soil stabilization, and fertilizer conservation among different types of trees, shrubs, and herbs. As critical biological resources, forest plants, and their products are now an essential aspect of human life and production. They serve various purposes such as production of wood products, provision of food and medicine, and industrial production (Weckwerth, 2011). The varying vegetation compositions of forest ecosystems in different stand types cause differences in the value of their service functions (Blattert et al., 2017; Uhde et al., 2017). The increase in population and domestic economy has significantly heightened the demand for timber products in recent years (Wenda et al., 1999), Evaluating the provision value of forests across different stands and age groups is crucial for achieving sustainable and efficient usage of trees. In this study, F. mandshurica forest has the highest provision value of forest products per unit area, attributed to a higher volume growth and wood price. Meanwhile, young B. platyphylla forest has the lowest value, primarily due to its low volume growth, and comprising mostly low-priced tree species such as B. platyphylla and P. davidiana. Forest products’ provision values are primarily affected by stock volume, as the B. platyphylla forest, F. mandshurica forest, J. mandshurica forest, and Q. mongolica forest have relatively single species. While the values of mixed broad-leaved forest and mixed coniferous broad-leaved forest are affected not only by the difference in volume growth of age groups, but also by the proportion of tree species due to their complex compositions. Therefore, the forest type is closely linked to the ecological service value (Guan et al., 2022). The growth rate of each tree species at different age stages determined the growth of the forest, and although the DBH growth curves of the 10 primary tree species studied demonstrated that the growth rate gradually declined with an increase in DBH, it remains affected by species-specific factors (Lee et al., 2004; Chen et al., 2020). In this study, all forest types except for J. mandshurica forest showed low annual supply value during the young forest stage, and a significant decline in supply value during the over-mature forest stage. This is mainly because growth volume was relatively high during the half-mature, near-mature, and mature stages, and relatively small in the young stage, with a significant decrease in the over-mature stage (Wang, 2006), which is why half-mature, near-mature, and mature forests have higher supply value. Furthermore, significant differences in the annual volume growth of different stand types were the main reason for the variation in the annual supply value among forest types (Faccoli and Bernardinelli, 2014). Therefore, the growth potential of forest provision values should be comprehensively considered before logging. Overall, to enhance the supply value of forest ecosystems in the study area, decision-makers should focus on the management and operation of F. mandshurica forest during the half-mature to mature stages, followed by the mixed coniferous broad-leaved forest.
Maintaining biodiversity is the basis for ensuring the stability of forest ecosystem functions, and how to quantify the values of these functions is an important issue at home and abroad (Chazdon et al., 2009). Among the species conservation values of different stand types, the value of F. mandshurica forest is the highest, mainly because of its large diversity index, and there are many endangered tree species and precious ancient trees in this stand type. The conservation value of the half-mature Q. mongolica forest was the lowest, which should be attributed to the absolute dominance of Q. mongolica in the community, and the low diversity index (Sang and Bai, 2009). Moreover, with the development of the forest, the species conservation value of B. platyphylla forest, J. mandshurica forest, and mixed broad-leaved forest shows an increasing trend up to the mature and over-mature forest stages, while the Q. mongolica forest maintains continuous growth (He et al., 2016). Overall, to enhance the conservation value of species diversity in the reserve, it is recommended to strengthen the management and operation of F. mandshurica forest and Q. mongolica forest during the over-mature forest stage.
Soil is a crucial component and environmental factor in the forest ecosystem that maintains energy flow and dynamic balance. The forest ecosystem plays a key role in soil reinforcement and fertilizer protection to ensure soil quality (Guo et al., 2001). Among the six main stand types examined in this study, the Q. mongolica forest demonstrated the largest soil bulk density (0.75), with B. platyphylla forest and mixed coniferous broad-leaved forest following closely behind, followed by F. mandshurica forest and mixed broad-leaved forest. J. mandshurica forest had the smallest bulk density. Soil with a small bulk density is looser and conducive to intercepting seepage, storing water, and slowing down runoff scouring. In contrast, soil with higher density is typically more susceptible to erosion (Qian, 1999). Therefore, the Q. mongolica forest has relatively low soil reinforcement value. Moreover, the soil organic matter and nutrient contents of different stand types varied significantly (Gan et al., 2020). The mixed coniferous broad-leaved forest had relatively high organic matter, N and P contents, whereas the Q. mongolica forest had low contents for these parameters. However, the Q. mongolica forest had relatively high K content in the soil (Li et al., 2017). Using the market value method to estimate soil fertility retention value, the results showed that N element had the highest fertility retention value, followed by K and P, while the organic matter had the lowest value. Additionally, the soil fertilizer retention value was higher in J. mandshurica forest and mixed broad-leaved forest, followed by B. platyphylla forest and mixed coniferous broad-leaved forest, and was lower in F. mandshurica forest and Q. mongolica forest, the results of this study are similar to other related research findings in the same Changbai Mountain range (Zhang et al., 2017; Liu et al., 2023). Although there was no significant temporal change in the soil conservation value in this study, forests during the half-mature to mature stages, especially the J. mandshurica forest, exhibited higher soil conservation value, making it the primary management and operational target for improving soil conservation value in the reserve.
In addition, the conservation of nutrient elements by forest trees is also one of the important service functions of forest ecosystems (Fan et al., 2015). Organ biomass is an important basis for estimating the level of tree nutrient content, and due to the differences in the growth rate of different tree species, the current study used the allometric growth equation of various tree species to calculate the organ biomass (Wang, 2006), and based on the weight of the organ biomass of trees with a DBH of 5–100 cm and the organ nutrient content of each tree species, the N, P, and K nutrient elements content (%) of individual trees were calculated (Fan, 2014). There are obvious differences in the nutrient content of different tree species (Eriksson and Rosen, 1994), and there are also significant differences in nutrient contents of different organs of trees (Deng et al., 2019), in the current study, the N and K content of each organ is the highest in leaves, followed by branches, and relatively small in stems and roots, so the difference in forest biomass and organ nutrient content directly determines the N, P, and K nutrient retention capacity of trees. And as the basic element of protein, compared with P and K, N has the highest average content in individuals of different tree species (Liu and Wang, 2018), so the tree nutrient value of N element per unit area of different stand types and age groups is the highest, followed by P and K. As the forest age increases, the overall annual nutrient retention value of the forest shows a trend of first increasing and then significantly decreasing when it reaches the over-mature forest stage. In particular, the near-mature and mature F. mandshurica forests and B. platyphylla forests should be the primary management targets for enhancing the nutrient retention value of forestry in the reserve.
The average value of provision and support service functions per unit area of forest ecosystem in Sanhu Nature Reserve is 5,670 $⋅ha–1⋅y–1, which is higher than the average value per unit area of reserves in China and the world (Taye et al., 2021; Kang et al., 2022), but it is significantly lower than the Shennongjia Nature Reserve (14,896 $⋅ha–1⋅y–1) (Wu, 2018), which has very rich biological resources. Affected by tree species composition, ecosystem structure, distribution area, etc., the unit area value of different reserves presents significant differences in terms of forest supply, species conservation, nutrient fixation, and soil conservation (Uddin et al., 2013; Bai et al., 2019; Wang, 2022). Compared with the Ailao Mountain Reserve in Yunnan, the supply value of timber per unit in the Sanhu Reserve is relatively small, because there are more precious wood species in the Ailao Mountain Reserve (Tang, 2021). From the perspective of the entire reserve, the near-mature and mature forests have high provision and support service values, especially the mixed broad-leaved forest. The per unit area service values of J. mandshurica forest and mixed broad-leaved forest are relatively high. Therefore, in Jilin Songhuajiang Sanhu National Nature Reserve, management and operation should focus on near-mature and mature mixed broad-leaved forests in order to maintain and enhance the supply and support service values of the forest ecosystem. Additionally, the service functions of Q. mongolica forest and J. mandshurica forest should be gradually improved.
5. Conclusion
There are significant differences in the provision and support service values of forests with different types and ages. The near-mature F. mandshurica forest has a high provision value, with the value peak appearing mainly in the half-mature and mature forest stages. The over-mature F. mandshurica forest and mature Q. mongolica forest both show high species conservation value. Moreover, with the development of the forest, the species conservation value of B. platyphylla forest, J. mandshurica forest, and mixed broad-leaved forest shows an increasing trend up to the mature and over-mature forest stages, while the Q. mongolica forest maintains continuous growth. In terms of nutrient retention value, mature B. platyphylla forest has a significant advantage, and near-mature and mature forests have high nutrient retention capacity. The near-mature J. mandshurica forest has a high soil conservation value, with overall high soil conservation value observed from the half-mature to mature forest stages. From the perspective of the entire research area, the soil fertilizer conservation value is the highest, followed by the forest trees supply value and species conservation value, and the mixed broad-leaved forest and Q. mongolica forest are the main body of the reserve’s provision and support service functions. In addition, near-mature and mature forests in the reserve are the main contributors to the service function value, especially the mixed broad-leaved forest in the reserve. It is of great practical significance to specifically protect and manage forest types with high service value in different forest development stages for promoting the sustainable development of regional forest resources.
Data availability statement
The original contributions presented in this study are included in the article/Supplementary material, further inquiries can be directed to the corresponding author.
Author contributions
QL, YC, and CF contributed to conception and design of the study. QL and CF organized the database. FY performed the statistical analysis. QL wrote the first draft of the manuscript. QL, YC, FY, and CF wrote sections of the manuscript. All authors contributed to manuscript revision, read, and approved the submitted version.
Funding
The authors acknowledge the support of the Technology Development Program of Jilin Province (YDZJ202201ZYTS494), the Science and Technology Research Project of the Education Office of Jilin Province (JJKH20220063KJ), the Incubation Programme Project of Youth Innovation Team (Research team on vegetation-soil-microbial interaction effects and synergistic mechanisms in forest ecosystems), the National Key Technology Research and Development Program of the Ministry of Science and Technology of China (2021FY100802-04), and the Doctoral Scientific Research Foundation of Beihua University (Characteristics of Heavy Metal Pollution and Accumulation in Vegetable Soils in the Suburbs of Typical Industrial Cities).
Conflict of interest
The authors declare that the research was conducted in the absence of any commercial or financial relationships that could be construed as a potential conflict of interest.
Publisher’s note
All claims expressed in this article are solely those of the authors and do not necessarily represent those of their affiliated organizations, or those of the publisher, the editors and the reviewers. Any product that may be evaluated in this article, or claim that may be made by its manufacturer, is not guaranteed or endorsed by the publisher.
Supplementary material
The Supplementary Material for this article can be found online at: https://www.frontiersin.org/articles/10.3389/ffgc.2023.1199304/full#supplementary-material
References
Bai, Z., Wang, W., Huan, L. I., Liu, D., Guo, Z., and Liu, H. (2019). Change of forest ecosystem service function and its value in kanas nature reserve. J. Land. Res. 11:4.
Beaumont, N. J., Jones, L., Garbutt, A., Hansom, J. D., and Toberman, M. (2014). The value of carbon sequestration and storage in coastal habitats. Estuar. Coas. Shelf Sci. 137, 32–40. doi: 10.1016/j.ecss.2013.11.022
Blattert, C., Lemm, R., Thees, O., Lexer, M. J., and Hanewinkel, M. (2017). Management of ecosystem services in mountain forests: review of indicators and value functions for model based multi-criteria decision analysis. Ecol. Indicat. 79, 391–409. doi: 10.1016/j.ecolind.2017.04.025
Chang, Y., Zou, T., Yoshino, K., Luo, S., and Zhou, S. (2019). Ecological policy benefit valuation based on public feedback: forest ecosystem services in wuyishan nature reserve, China. Sci. Total Environ. 673, 622–630. doi: 10.1016/j.scitotenv.2019.04.076
Chazdon, R. L., Peres, C. A., Dent, D., Sheil, D., Lugo, A. E., Lamb, D., et al. (2009). The potential for species conservation in tropical secondary forests. Conservat. Biol. 23, 1406–1417. doi: 10.1111/j.1523-1739.2009.01338.x
Chen, J., Yang, H., Man, R., Wang, W., Sharma, M., Peng, C., et al. (2020). Using machine learning to synthesize spatiotemporal data for modelling DBH-height and DBH-height-age relationships in boreal forests. Forest Ecol. Manage. 466:118104. doi: 10.1016/j.foreco.2020.118104
Cheng, X., Van Damme, S., Li, L., and Uyttenhove, P. (2019). Evaluation of cultural ecosystem services: a review of methods. Ecosyst. Serv. 37:100925. doi: 10.1016/j.ecoser.2019.100925
Costanza, R., d’Arge, R., de Groot, R., Farber, S., Grasso, M., Hannon, B., et al. (1997). The value of the world’s ecosystem services and natural capital. Nature 387, 253–260. doi: 10.1038/387253a0
Daily, G. C., and Ehrlich, P. R. (1999). Managing earth’s ecosystems: an interdisciplinary challenge. Ecosystems 2, 277–280. doi: 10.1007/s100219900075
Deng, S., Shi, K., Ma, J., Zhang, L., Ma, L., and Jia, Z. (2019). Effects of fertilization ratios and frequencies on the growth and nutrient uptake of magnolia wufengensis (magnoliaceae). Forests 10:65. doi: 10.3390/f10010065
Eriksson, H. M., and Rosen, K. (1994). Nutrient distribution in a Swedish tree species experiment. Plant Soil 164, 51–59. doi: 10.1007/BF00010110
Faccoli, M., and Bernardinelli, I. (2014). Composition and elevation of spruce forests affect susceptibility to bark beetle attacks: implications for forest management. Forests 5, 88–102. doi: 10.3390/f5010088
Fan, C. (2014). Carbon estimation and distribution characteristics of forest vegetation in jilin province. Ph. D, Thesis. Northeast Forestry University.
Fan, H., Wu, J., Liu, W., Yuan, Y., Hu, L., and Cai, Q. (2015). Linkages of plant and soil C:N:P stoichiometry and their relationships to forest growth in subtropical plantations. Plant Soil 392, 127–138. doi: 10.1007/s11104-015-2444-2
Farnsworth, K. D., Lyashevska, O., and Fung, T. (2012). Functional complexity: the source of value in biodiversity. Ecol. Complexity 11, 46–52. doi: 10.1016/j.ecocom.2012.02.001
Font, A. R. (2000). Mass tourism and the demand for protected natural areas: a travel cost approach. J. Environ. Econ. Manage. 39, 97–116. doi: 10.1006/jeem.1999.1094
Food and Agriculture Organization (2020). Global forest resources assessment (FRA). Italy: Food and Agriculture Organization.
Fromm, O. (2000). Ecological structure and functions of biodiversity as elements of its total economic value. Environ. Res. Econ. 16, 303–328. doi: 10.1023/A:1008359022814
Gamfeldt, L., Snäll, T., Bagchi, R., Jonsson, M., Gustafsson, L., Kjellander, P., et al. (2013). Higher levels of multiple ecosystem services are found in forests with more tree species. Nat. Commun. 4:1340. doi: 10.1038/ncomms2328
Gan, H. Y., Schöning, I., Schall, P., Ammer, C., and Schrumpf, M. (2020). Soil Organic matter mineralization as driven by nutrient stoichiometry in soils under differently managed forest stands. Front. Forests Global Change 3:99. doi: 10.3389/ffgc.2020.00099
Goodfellow, S., and Peterken, G. F. (1981). A method for survey and assessment of woodlands for nature conservation using maps and species lists: the example of norfolk woodlands. Biol. Conservat. 21, 177–195. doi: 10.1016/0006-3207(81)90090-2
Grytnes, J. A. (2010). Fine-scale vascular plant species richness in different alpine vegetation types: relationships with biomass and cover. J. Veget. Sci. 11, 87–92. doi: 10.2307/3236779
Guan, S., Lu, Y., and Liu, X. (2022). Evaluation of multiple forest service based on the integration of stand structural attributes in mixed oak forests. Sustainability 14:8228. doi: 10.3390/su14148228
Guo, Z., Xiao, X., Gan, Y., and Zheng, Y. (2001). Ecosystem functions, services and their values – a case study in xingshan county of CHINA. Ecol. Econ. 38, 141–154. doi: 10.1016/S0921-8009(01)00154-9
Hanley, N. D. (1993). The contingent valuation of forest characteristics: two experiments. J. Agric. Econ. 44, 218–229. doi: 10.1111/j.1477-9552.1993.tb00267.x
He, F., Yang, B., Wang, H., Yan, Q., Cao, Y., and He, X. (2016). Changes in composition and diversity of fungal communities along quercus mongolica forests developments in northeast China. Appl. Soil Ecol. 100, 162–171. doi: 10.1016/j.apsoil.2015.12.014
Hettiarachchi, J., and Ranasinghe, D. (2013). “A survey of the market availability and its potential for non-wood forest products, with special reference to medicinal plants and cane,” in Proceedings of international forestry & environment symposium.
Hidemichi, F., Masayuki, S., and Shunsuke, M. (2017). Decomposition analysis of forest ecosystem services values. Sustainability 9:687. doi: 10.3390/su9050687
Jin, X., Ma, J., Cai, T., Sun, X., and University, N. F. (2016). Non-use value assessment for wetland ecosystem service of hongxing national nature reserve in northeast China. J. Forestry Res. 27, 1435–1442. doi: 10.1007/s11676-016-0264-8
Kang, N., Hou, L., Huang, J., and Liu, H. (2022). Ecosystem services valuation in China: a meta-analysis. Sci. Total Environ. 809:151122. doi: 10.1016/j.scitotenv.2021.151122
Konarska, K. M., Sutton, P. C., and Castellon, M. (2002). Evaluating scale dependence of ecosystem service valuation: a comparison of NOAA-AVHRR and Landsat TM datasets. Ecol. Econ. 41, 491–507. doi: 10.1016/S0921-8009(02)00096-4
Kuuluvainen, T., and Gauthier, S. (2018). Young and old forest in the boreal: critical stages of ecosystem dynamics and management under global change. Forest Ecosyst. 5:26. doi: 10.1186/s40663-018-0142-2
Lee, W.-K., Gadow, K., Chung, D.-J., Lee, J.-L., and Shin, M.-Y. (2004). DBH growth model for pinus densiflora and quercus variabilis mixed forests in central Korea. Ecol. Mod. 176, 187–200. doi: 10.1016/j.ecolmodel.2003.11.012
Lei, J. (2006). The strategic position of songhua river three lakes protected area in the construction of northeast ecological system. Forestry Econ. 3, 57–59.
Li, W., Bai, Z., Jin, C., Zhang, X., Guan, D., Wang, A., et al. (2017). The influence of tree species on small scale spatial heterogeneity of soil respiration in a temperate mixed forest. Sci. Total Environ. 590, 242–248. doi: 10.1016/j.scitotenv.2017.02.229
Li, Z., Zhang, Y., Zhu, Q., Tian, S., and Chen, Z. (2011). Evaluation of values of ecosystem service function of the plain forestry in China. Energy Proc. 11, 4902–4910.
Liu, F., Feng, C., Zhou, Y., Zhang, L., Du, J., Huang, W., et al. (2022). Effectiveness of functional zones in national nature reserves for the protection of forest ecosystems in China. J. Environ. Manage. 308:114593. doi: 10.1016/j.jenvman.2022.114593
Liu, S., and Wang, H. (2018). N,P,and K characteristics of different age groups of temperate coniferous tree species in northwestern China. J. Forestry Res. 29:8. doi: 10.1007/s11676-017-0442-3
Liu, Y., Chen, Y., Liu, Y., and Li, Y. (2023). Comprehensive assessment on soil nutrient characteristics and quality of typical forests in zhangguangcai mountains. Guizhou Agric. Sci. 51, 28–34.
Ma, S., Qiao, Y., Wang, L., and Zhang, J. (2021). Terrain gradient variations in ecosystem services of different vegetation types in mountainous regions: vegetation resource conservation and sustainable development. Forest Ecol. Manage. 482:118856. doi: 10.1016/j.foreco.2020.118856
Musavi, T., Migliavacca, M., Reichstein, M., Kattge, J., Wirth, C., Black, T. A., et al. (2017). Stand age and species richness dampen interannual variation of ecosystem-level photosynthetic capacity. Nat. Ecol. Evolut. 1:0048. doi: 10.1038/s41559-016-0048
NFGA (2010). Technical regulations for inventory for forest management planning and design. Beijing: National Forestry and Grassland Administration.
NFGA (2020). Specifications for assessment of forest ecosystem services. Beijing: National Forestry and Grassland Administration.
Ninan, K. N., and Inoue, M. (2013a). Valuing forest ecosystem services: case study of a forest reserve in Japan. Ecosyst. Serv. 5, 78–87. doi: 10.1016/j.ecoser.2013.02.006
Ninan, K. N., and Inoue, M. (2013b). Valuing forest ecosystem services: what we know and what we don’t. Ecol. Econ. 93, 137–149. doi: 10.1016/j.ecolecon.2013.05.005
Niu, X., Wang, B., Liu, S., Liu, C., Wei, W., and Kauppi, P. E. (2012). Economical assessment of forest ecosystem services in China: characteristics and implications. Ecol. Complexity 11, 1–11. doi: 10.1016/j.ecocom.2012.01.001
Odum, H. T., and Odum, E. P. (2000). The energetic basis for valuation of ecosystem services. Ecosystems 3, 21–23. doi: 10.1007/s100210000005
Qian, Y. (1999). Study on soil physical properties of desertified land in mosuowan reclamation area. Arid Zone Res. 16, 41–46.
Sang, W., and Bai, F. (2009). “Vascular diversity patterns of forest ecosystem before and after a 43-year interval under changing climate conditions in the changbaishan nature reserve, northeastern China,” in Forest ecology: recent advances in plant ecology, ed. A. G. Van der Valk (Dordrecht: Springer Netherlands), 115–130. doi: 10.1007/978-90-481-2795-5_10
Shengjun, J. I., Geng, Y., Defeng, L. I., and Wang, G. (2009). Plant coverage is more important than species richness in enhancing aboveground biomass in a premature grassland, northern China - science direct. Agric. Ecosyst. Environ. 129, 491–496. doi: 10.1016/j.agee.2008.11.002
Smith, D. M., Eade, R., Scaife, A. A., Caron, L. P., Danabasoglu, G., Delsole, T. M., et al. (2019). Loss and damage: the role of ecosystem services. NPJ Clim. Atmos. Sci. 2, 8–14.
Song, M., Dong, M., and Jiang, G. (2002). Importance of clonal plants and plant species diversity in the northeast China transect. Ecol. Res. 17, 705–716. doi: 10.1046/j.1440-1703.2002.00527.x
Tang, A. (2021). Evaluation of forest ecosystem service value in ailaoshan national nature reserve. China: Yunnan Normal University.
Taye, F. A., Folkersen, M. V., Fleming, C. M., Buckwell, A., Mackey, B., Diwakar, K. C., et al. (2021). The economic values of global forest ecosystem services: a meta-analysis. Ecol. Econ. 189:107145. doi: 10.1016/j.ecolecon.2021.107145
Tobias, D., and Mendelsohn, R. (1991). Valuing ecotourism in a tropical rain-forest reserve. J. Hum. Environ. 20, 91–91.
Uddin, M. S., van Steveninck, E., Stuip, M., and Shah, M. A. R. (2013). Economic valuation of provisioning and cultural services of a protected mangrove ecosystem: a case study on sundarbans reserve forest. Bangladesh. Ecosyst. Serv. 5, 88–93. doi: 10.1016/j.ecoser.2013.07.002
Uhde, B., Heinrichs, S., Stiehl, C. R., Ammer, C., Müller-Using, B., and Knoke, T. (2017). Bringing ecosystem services into forest planning – can we optimize the composition of chilean forests based on expert knowledge? Forest Ecol. Manage. 404, 126–140. doi: 10.1016/j.foreco.2017.08.021
Villa, F., Bagstad, K. J., Voigt, B., Johnson, G. W., Portela, R., Honzák, M., et al. (2014). A methodology for adaptable and robust ecosystem services assessment. PLoS One 9:e91001. doi: 10.1371/journal.pone.0091001
Wang, C. (2006). Biomass allometric equations for 10 co-occurring tree species in Chinese temperate forests. Forest Ecol. Manage. 222, 9–16. doi: 10.1016/j.foreco.2005.10.074
Wang, X. (2022). The evaluation of forest ecosystem service function value in guandi mountain state-owned forest region in shanxi province. Chin. Agric. Sci. Bull. 38, 49–55.
Weckwerth, W. (2011). Metabolomics and systems biology approaches for the investigation of endophytes – plant- interaction – a vision for their importance in biotechnology and natural product research. Planta Medica 77:L12. doi: 10.1055/s-0031-1282090
Wenda, L., Dongxiang, W., and Nan, L. (1999). Market analysis for timber and forest products in China. J. Forestry Res. 10, 124–126. doi: 10.1007/BF02855543
Wu, Y. (2018). Evaluation on service value of forest ecosystem in daba mountain natural reserve Ph, D. Thesis. Chongqing Normal University.
Yuan, J., Xin, W., Zhengchun, S., Fei, C., Zhaoyong, H., Xiaofeng, Z., et al. (2015). Impacts of CWD on understory biodiversity in forest ecosystems in the qinling mountains China. Pakistan J. Bot. 47, 1855–1864.
Zhang, L., Rong, H., Yang, X. U., and Xingwang, X. U. (2011). Evaluation research of the service value of the forest ecosystem in jiuhua mountain, anhui. J. Mount. Sci. 29, 291–298.
Zhang, T., Wang, C., and Zhang, Q. (2017). Vertical variation in stoichiometric relationships of soil carbon, nitrogen and phosphorus in five forest types in the maoershan region northeast China. Chin. J. Appl. Ecol. 28, 3135–3143.
Zhang, Y. (2010). The millennium ecosystem assessment follow-up: a global strategy for turning knowledge into action. J. Natl. Res. 3, 522–528.
Keywords: nature reserve, forest ecosystem, forest type, age group, supporting service value, provisioning service value
Citation: Liu Q, Cheng Y, Yu F and Fan C (2023) The effects of forest types and age groups on forest provisioning and supporting service value in Sanhu Nature Reserve, Northeast China. Front. For. Glob. Change 6:1199304. doi: 10.3389/ffgc.2023.1199304
Received: 03 April 2023; Accepted: 30 May 2023;
Published: 15 June 2023.
Edited by:
Shreekar Pant, Baba Ghulam Shah Badshah University, IndiaReviewed by:
Marifatul Haq, University of Kashmir, IndiaYashwant Singh Rawat, Federal Technical and Vocational Education and Training Institute (FTVETI), Ethiopia
Copyright © 2023 Liu, Cheng, Yu and Fan. This is an open-access article distributed under the terms of the Creative Commons Attribution License (CC BY). The use, distribution or reproduction in other forums is permitted, provided the original author(s) and the copyright owner(s) are credited and that the original publication in this journal is cited, in accordance with accepted academic practice. No use, distribution or reproduction is permitted which does not comply with these terms.
*Correspondence: Chunnan Fan, ZmFuY2h1bm5hbmJoQDE2My5jb20=
 Qiang Liu
 Yan Cheng2