 Andrei G. Lapenis1*Leonid N. Yurganov2
- 1Department of Geography and Planning, University at Albany, Albany, NY, United States
- 2Joint Center for Earth Systems Technology, University of Maryland, Baltimore County, MD, United States
Over the past two decades, the escalating emissions of greenhouse gases from boreal wildfires in the Northern Hemisphere have drawn significant attention, underscoring an unprecedented wildfire season in 2021. Our calculations indicate that between 2002 and 2020, wildfires in Russia released approximately 726 ± 280 Tg CO2eqv yr−1. This aligns closely with similar estimates derived from remote sensing data, far surpassing the earlier approximations found in the Russian National Inventory Report (NIR) by a factor of 2 to 3. Notably, in 2021 alone, Russia’s wildfires emitted an exceptionally high amount of 1,700 Tg CO2eqv, exceeding the carbon emissions from the country’s fossil fuel consumption. Consequently, this situation led to an almost complete counterbalance of carbon assimilation by Russian forests. Our analysis attributes over 50% of the variation in wildfire frequency between 2002 and 2021 to shifts in the Arctic Oscillation (AO). This suggests a potential for utilizing AO as a predictive variable for wildfires. It’s noteworthy that the AO itself is influenced by the sustained regression of Arctic sea-ice. From this, it can be inferred that in the foreseeable future, Russian forests might undergo a transition from their role as carbon sinks to the potential net contributors of carbon to the atmosphere.
Introduction
In the last two decades, predicting Siberian boreal forest wildfires has become tougher due to their rapid expansion, large scale, and varying occurrence (Natole et al., 2021). Some forest fires have grown so big, exceeding 10 thousand hectares, that they are termed “mega-fires” (Stephens et al., 2014; Linley et al., 2022). Historically, these fires were mainly in boreal forests below the Arctic Circle (Hu et al., 2015). But lately, like during 2019–2021, there’s been an extraordinary increase in Arctic wildfires across tundra and forest tundra biomes (Romanov et al., 2022b).
Understanding Siberian wildfires, including the mega-fires predating satellite technology, remains limited. Despite historical fire frequency uncertainties, all evidence underscores the robust association between wildfires and climate change (Glückler et al., 2021; Novenko et al., 2022a,b; Higuera et al., 2023). Notably, Siberia experienced more wildfires during the Medieval Warm Period compared to the Little Ice Age (Novenko et al., 2022a). Numerous studies establish correlations between anthropogenic greenhouse gas emissions, climate warming, heightened fire occurrence, and ensuing emissions (Kumar et al., 2020; McCarty et al., 2020; Burrell et al., 2022). This article employs a satellite-based approach to estimate carbon dioxide and methane emissions from Russian wildfires, linking them to Northern Hemisphere atmospheric circulation indices. This climatological perspective on wildfires aims to unravel potential connections between NH wildfires and global warming, while also predicting their future trajectory.
Methodology and data
In our study, we utilized a wildfire model driven by satellite imagery of burned areas and remote-sensing evaluations of forest productivity (Giglio et al., 2006, 2016). This model calculates combustion byproducts including CO, CO2, and CH4. We applied this model to analyze wildfires in Russia and the Northern Hemisphere spanning the years 2002–2021. Specifically, we employed the algorithm and data provided by the Global Fire Emissions Database version 4.1 (GFED4.1), with detailed computation procedures outlined in the GFED4 online manual.1 Notably, this algorithm offers a higher-resolution assessment of small fires compared to the approach used, for example, by Romanov et al. (2022a,b) and Van Der Werf et al. (2017). Furthermore, it diverges from the work of Romanov et al. (2022a) in terms of coefficients used to convert biomass into emissions.
To better understand the potential connection between wildfire emissions and weather patterns, we collected monthly data for three key atmospheric circulation indexes in high latitudes: the North Atlantic Oscillation (NAO), Arctic Oscillation (AO), and Arctic Dipole Anomaly (ADA). These indexes are based on principal components derived from the leading empirical orthogonal function of sea-level pressure anomalies across the North Atlantic and Arctic regions (Hurrell and Deser, 2010; Molteni et al., 2011). Together, NAO and AO account for the majority of the seasonal and interannual variability in high-latitude atmospheric circulations within the Northern Hemisphere (NH). Our dataset includes monthly numerical values for NAO, AO, and ADA covering 2002–2021, sourced from the National Weather Service’s Climate Prediction Center (NOAA, 2023). With a relatively concise record of wildfire emissions in the Northern Hemisphere and Russia from 2002 to 2021, and comprehensive emissions integration, we utilized simple linear regression to explore potential statistical links between annual emissions and atmospheric circulation indexes.
Lastly, we incorporated monthly satellite data concerning the extent of Arctic sea-ice (Fogt et al., 2022). Several studies have demonstrated a strong correlation between the Arctic sea-ice extent and atmospheric circulation indexes (Zhang et al., 2008). Therefore, it holds the potential to serve as a predictive variable for changes in AO, NAO, and ADA.
Results
Our estimate of carbon dioxide emissions from wildfires within the Russian Federation are depicted in the supplement (Supplementary Figure 1). For comparison purposes, we have included estimates by Romanov et al. (2022a), as well as estimates of CO2 wildfire emissions from the official Russian National Inventory Report (Russian Federation, 2021). The results from Romanov and colleagues correlate strongly with our findings (r2 = 0.7, p < 0.01), while the estimates from the Russian NIR exhibit no substantial correlations with either our results or those of Romanov et al. (2022a). Furthermore, our calculations and those of Romanov et al. (2022a) indicate emissions approximately 2–3 times higher than the NIR data (Supplementary Figure 1).
In addition to carbon dioxide, we assessed methane emissions expressed as CO2 equivalent (CO2eqv) alongside carbon dioxide emissions from wildfires (Figure 1). Calculations of methane and carbon dioxide emissions as CO2eqv were conducted for two values of CH4 Global Warming Potential (GWP) according to Myhre et al. (2013): 87 (20-year time horizon) and 37 (100-year time horizon). These GWP values encompass climate-carbon feedback effects and methane oxidation. Given the substantial year-to-year variations in wildfire emissions over the last two decades, the use of a 20-year time horizon is pivotal for comprehending the complete impact of wildfires on the greenhouse effect and climate warming.
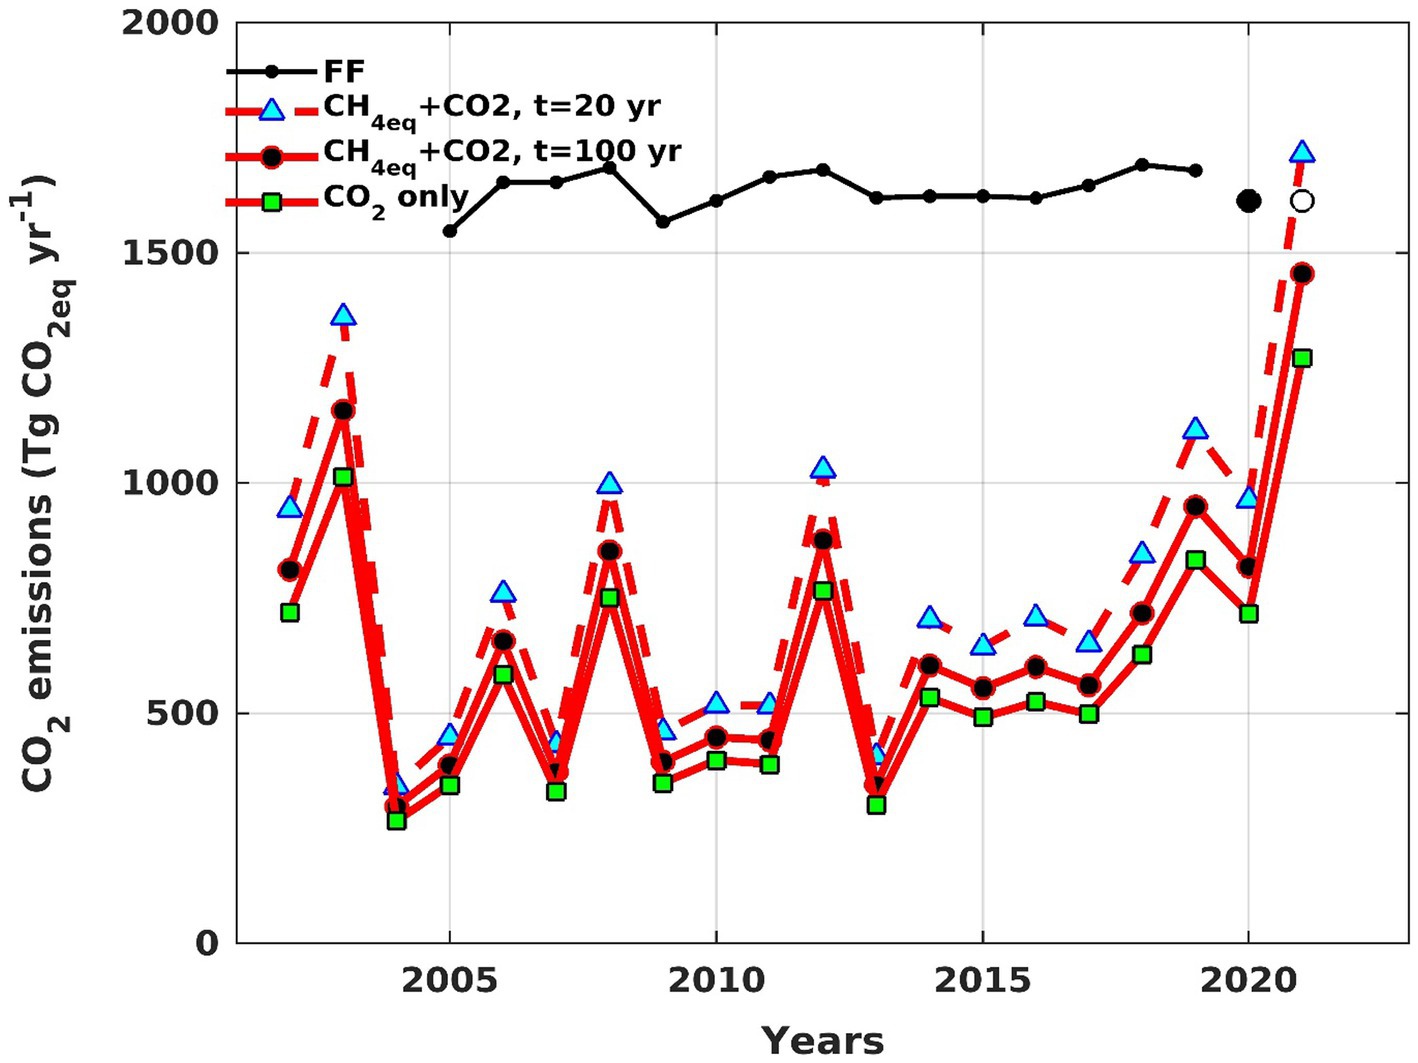
Figure 1. Russia’s atmospheric carbon emissions from burning of fossil fuels (black line), and from wildfires as estimated in this study (red lines). The dots represent preliminary estimates of carbon emissions by the Russian Federation in 2020 and 2021. Red solid line with green markers represents carbon dioxide emissions only. The solid red line with black represents total CH4 and CO2 emissions expressed as CO2eqv for methane’s GWP time horizons of 100 years and the red line thin blue markers, 20 years.
The same Figure 1 illustrates industrial CO2 emissions resulting from fossil fuel combustion in Russia (NIR 2021). As of now, data for NIR in 2020 and 2021 are unavailable. Hence, we relied on the 2020 Global Carbon Project’s estimate for Russia’s total carbon emissions from fossil fuel combustion and cement production (depicted as a solid black dot) (Friedlingstein et al., 2021). The open circle in the graph denotes estimated emissions for 2021 (Knight et al., 2021).
Based on our estimates, carbon dioxide emissions from wildfires in Russia’s atmosphere reached 1,270 Tg CO2 in 2021, accounting for approximately 50% of carbon dioxide emissions from the Northern Hemisphere (Figure 1). Our maximum projection for total atmospheric greenhouse gas (GHG) emissions from wildfires in 2021, expressed as carbon dioxide equivalents (CO2eqv) using a 20-year time horizon for methane’s GWP, was 1,700 Tg of CO2eqv. This surpasses the typical carbon emissions from Russia’s fossil fuel combustion during the 2002–2021 period (Figure 1).
The remarkably elevated GHG emissions from wildfires in the Russian Federation and across the entire Northern Hemisphere in 2021 (Yurganov and Rakitin, 2022) warrant further investigation. Thus, we scrutinized our CO2eqv emission estimates from Russian wildfires and NH wildfires in relation to high-latitude atmospheric circulation indexes. Among the three indexes (NAO, AO, ADA), only the AO demonstrated close correlations with annual emissions resulting from wildfires. To be specific, the AO index for March exhibited a significant, direct correlation with emissions from all wildfires in the Northern Hemisphere, including Russia (r2 = 0.21, p < 0.01). This relationship can be attributed to lower spring precipitation in East Siberia, resulting in diminished spring soil moisture that favors fire-prone weather conditions. At the same time, our observations reveal that in years characterized by notably high emissions during summer months —such as 2003, 2012, and 2021—the Arctic Oscillation (AO) index shows a distinct trend of recording significantly elevated values, especially in June and July. These elevated values are indicative of robustly intensified fire-prone weather conditions. Consequently, we aggregated AO indexes for March with those for June and July and compared this composite (MJJ) index with annual emissions.
We determined that the MJJ index accounts for about 50% (p < 0.01) of the interannual variability in CO2eqv emissions from Russian fires and about 55% (p < 0.01) of the variability in emissions from all NH wildfires (Figure 2). However, this strong linear correlation between the interannual variability of emissions from wildfires and the AO index could be attributed to positive temporal trends in both variables (Figure 1; Supplementary Figure 2). Consequently, we removed the linear trends from the AO index and CO2eqv emission records and subsequently recalculated the linear regression.
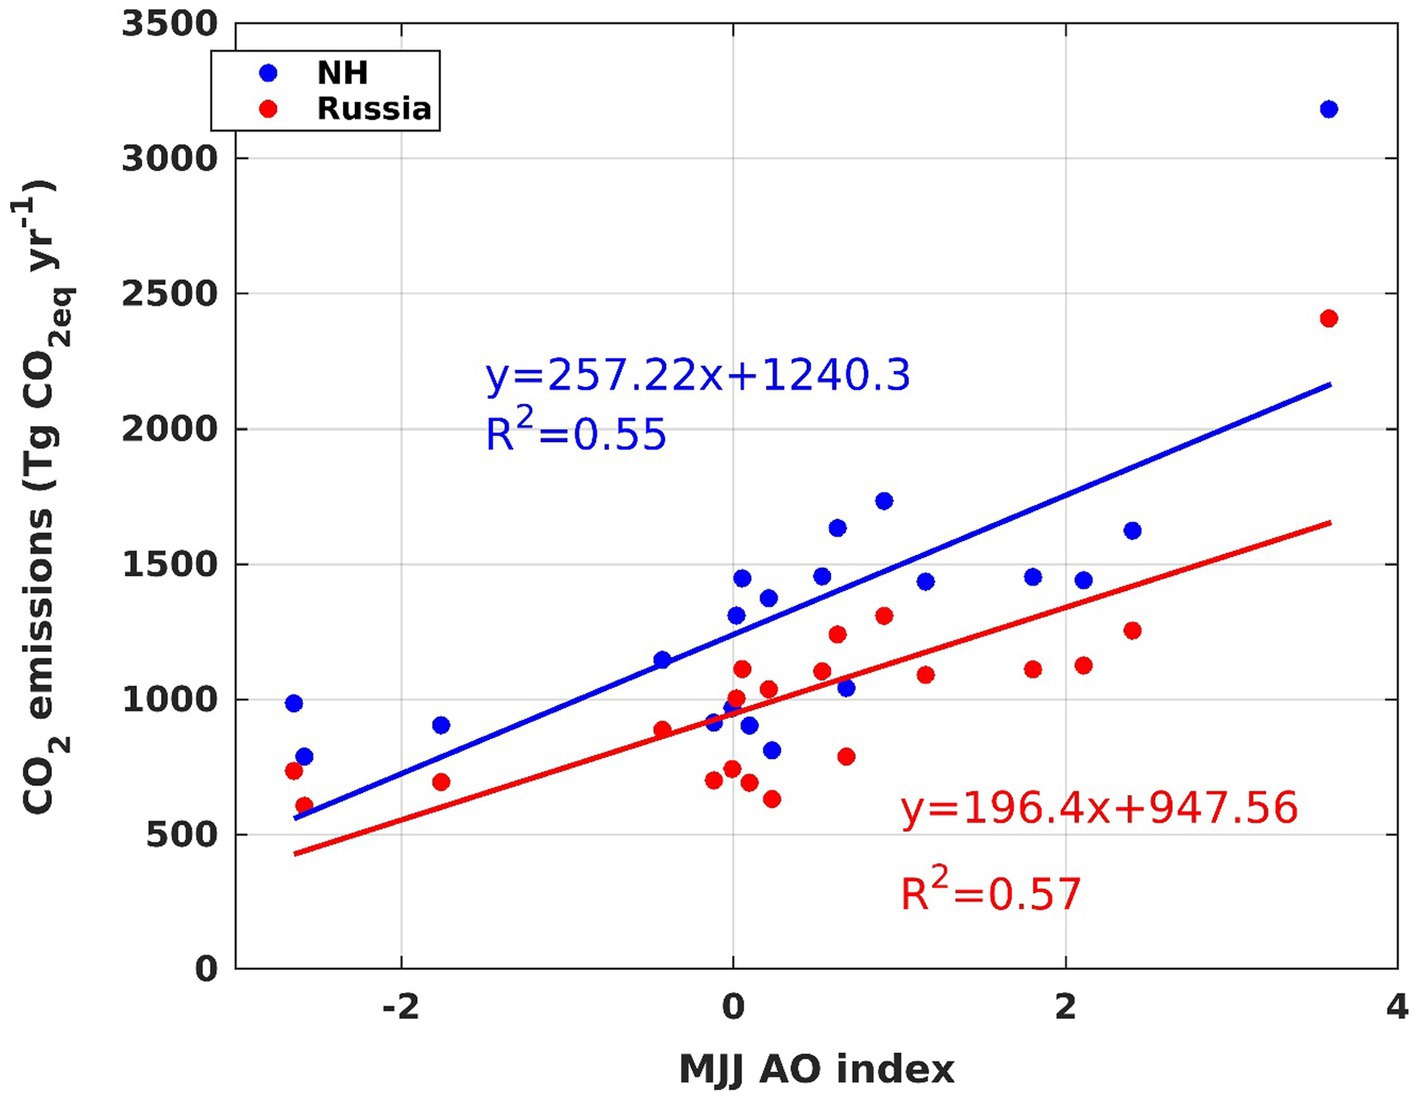
Figure 2. A regression between total annual carbon dioxide equivalent (CO2eqv) emissions from wildfires in the Northern Hemisphere (blue line) and the composite Arctic Oscillation index—an aggregation of AO indexes for the months of March, June, and July (MJJ). The red line represents the regression specifically between NH carbon dioxide emissions (no methane) and MJJ index.
For the entire NH, the R2 value decreased only marginally from 0.55 (Figure 2) to 0.47. As a result, we have deduced that our composite AO index (MJJ) clarifies roughly 50% of the interannual fluctuations in NH wildfire emissions. It’s important to note that this does not imply that the remaining 50% of emission variability is unrelated to climate or weather fluctuations. Here, we solely considered climatic indexes that portray variability on a hemispheric scale. It’s conceivable that at a local or mesoscale level, other connections between local wildfires and weather variables (e.g., vapor pressure deficit, soil moisture, wind speed, seasonal precipitation) exist (Natole et al., 2021). However, this kind of analysis falls beyond the purview of this study.
The historical record of Arctic sea-ice extent (Supplementary Figure 2) exhibited significant yet somewhat modest correlations with greenhouse gas (GHG) emissions. The most noteworthy outcomes were observed between NH GHG emissions and the rank of annual sea-ice extent of the previous year. However, this connection was notably weaker than the linkage between AO indexes of the same year and GHG emissions for both Russian forests and the entire NH (Figure 2).
Discussion
In a positive AO phase, the Polar Vortex gathers strength, which escalates the transfer of atmospheric air along latitudes. Conversely, negative AO values are associated with the weakening of the Polar Vortex, resulting in diminished zonal circulation, the wavering of the Polar Front, and the accumulation of high pressure over the central-northern regions of North America. This index notably clarifies the converse interannual variations in Western and Eastern Siberian wildfires. To be precise, according to Zhu et al. (2021), the positive AO phase is tied to heightened summer precipitation in Western Siberia and reduced precipitation in Eastern Siberia. This discrepancy can be attributed to the augmented transport of moist air from the North Atlantic over Europe and Western Siberia during the positive AO phase. This inflow of moisture to the Western Siberia leads to increased precipitation and the suppression of wildfires. However, as this air travels further to Eastern Siberia, it loses significant amount of moisture. Hence, the temporal trends in Western and Eastern Siberian wildfires diverge (Zhu et al., 2021).
Based on our estimations, the net outcome of this dipole behavior exhibited by Siberian wildfires was a rise in overall GHG emissions. This effect can be rationalized by the East Siberian Forest area (Alekseev et al., 2019), which is experiences fire-prone weather during positive AO phase, being over ten times larger than that of West Siberia, which experiences wetter weather during AO positive phase.
In North America, conducive conditions for wildfires prevail in the central regions during the negative AO phase, while the positive phase induces fire-favorable conditions over the Alaska, the Pacific Northwest, and the northeastern parts of Canada and the US. These areas encompass over 60% of all North American boreal forests (Wulder et al., 2007). Consequently, considering Eurasia and North America together, we conclude that positive AO phases lead to decreased precipitation and higher temperatures over most of the boreal forests in the NH. This elucidates the strong correlation found in this study between positive AO phases and annual GHG emissions from wildfires, as presented in CO2eqv (Figure 2).
Yet, a lingering question remains concerning the future trajectory of wildfires and AO trends. Regrettably, our current understanding of future AO trends remains limited.
Some studies, however, have proposed that the positive trends in the AO observed over recent decades, or elements of AO circulation such as the appearance of summer anticyclones over East Siberia, are linked to the vanishing sea ice in the Arctic Ocean (Wang and Ikeda, 2000; Liu et al., 2004; Zhang et al., 2008). These connections possess a clear physical basis. As the Arctic Ocean warms, it diminishes the coverage of sea ice, creating open water expanses between the shore and floating ice. Elevated Arctic Ocean SSTs decrease ocean-continent temperature difference, reduce atmospheric stability, giving rise to negative atmospheric vorticity or cyclonic movement, thereby strengthening the Polar Vortex and increasing the AO index.
The unusual summer weather marked by anticyclones over East Siberia becomes more recurrent due to the northward shift of the polar jet, driven by the earlier mentioned Arctic Ocean warming, the intensification of the Polar Vortex, and the premature melting of seasonal snow and ice cover (Scholten et al., 2022). Additionally, there’s a lag between sea ice decline and positive NAO/AO phases (Caian et al., 2018). All of this indicates that the connection between sea ice and AO/NAO could be harnessed as a prospective multi-year forecasting mechanism for future AO trends (Caian et al., 2018). The alterations in fire weather patterns over the Western US have already been linked to declining Arctic sea ice (Zou et al., 2021).
Our endeavor to establish a direct correlation between sea ice extent (expressed as year ranking, Supplementary Figure 2) and the GHG emissions from wildfires in Russia and the entire NH led to the identification of a statistically significant yet relatively weak correlation (r2 = 0.20 to 0.25, p < 0.05) between preceding years of ice ranks and wildfire occurrences. This likely reflects the fact that the connection between sea ice decline and the intensity of GHG emissions is mediated by alterations in atmospheric circulation such as AO variability. Consequently, the direct and not lagged linkage between the AO index and GHG emissions displayed a stronger regression (Figure 2). This implies that despite the dampening of fire-prone weather in certain locations, such as Western Europe, the overall effect of an increase in the AO is positive, leading to heightened wildfire emissions.
Another mechanism tied to the escalation of the AO index that contributes to the formation of fire-prone weather involves the creation of blocking anticyclones. A noteworthy portion—around 40%—of the year-to-year variability in the burnt area of Siberian wildfires has been attributed to atmospheric blocking or the emergence of summer anticyclones over East Siberia (Mokhov et al., 2020). These, associated with positive AO phase, anticyclones obstruct the entry of moist air through typical summer wave cyclones, which can result in the more frequent occurrence of hot and dry summers within this boreal forest region. Changes in the overall frequency of atmospheric blocking occurrences contribute to approximately 40% of the year-to-year fluctuations in greenhouse gas (GHG), carbon monoxide (CO), and emissions of small aerosol particles stemming from Russian wildfires (Mokhov et al., 2020). It’s noteworthy that the Mokhov and colleagues’ study (2020) was conducted prior to the extraordinary wildfires of 2021 and therefore does not encompass this specific year of potentially record-breaking biomass burning. Concurrently, evidence points to August 2021 being one of the hottest months in the past 46 years, were characterized by persistent and robust anticyclonic conditions (Tomshin and Solovyev, 2022).
Hence, the record GHG emissions from wildfires estimated in our study for 2021 are consistent with the exceptionally high composite AO index (MJJ) and the extended period of anticyclonic blocking over East Siberia. Worth noting is the fact that 2020 was ranked second in terms of the minimum extent of September Sea ice in the Arctic Ocean, measuring about 3.8 million km2 (Fogt et al., 2022). As mentioned earlier, sea ice extent leads AO changes on about 1 year, which aligns with the anomalously high GHG emissions from NH wildfires in the 2021 season (Figure 1).
There is substantial confidence in the projection that the early-autumn Arctic will become virtually ice-free by 2050 (e.g., Budyko, 1969; Masson-Delmotte et al., 2021). Following this trend in Arctic sea-ice, we should anticipate a sustained positive trend in the AO and, consequently, further increases in wildfires and GHG emissions. Moreover, an in-depth analysis of the representation of winter and summer atmospheric blocking in the Northern Hemisphere in the two most recent IPCC reports (CMIP5 and CMIP6) involving global simulations of future climate revealed negligible changes or even declines in blocking, except for East Siberia where blocking is projected to become more frequent (Mokhov and Timazhev, 2015; Davini and D’Andrea, 2020).
This prediction carries significant implications for the terrestrial carbon budget and atmospheric CO2 levels. Presently, Russian forests act as a net carbon sink (Schepaschenko et al., 2021; Romanov et al., 2022a). The exceptionally high wildfire emissions observed in the 2021 season are undoubtedly an anomaly (Figures 1, 2). However, considering the possibility that the 2021 annual GHG emissions from wildfires could become the new norm, the implications for the net carbon balance of Russian forests are considerable. A linear trend analysis of recent AO changes indicates that 2021 AO values, expressed as MJJ index, could become the new normal by 2050–2070 (Supplementary Figure 2).
In 2021, the wildfires in the Russian Federation emitted approximately 1,700 Tg of carbon dioxide equivalent (Figure 1). Over the 2015–2020 period, Russian forests exhibited an annual carbon absorption of 330 ± 37 Mt, equivalent to about 1,200 ± 136 Tg of carbon dioxide (Romanov et al., 2022a), a figure consistent with some other recent studies (e.g., Schepaschenko et al., 2021). We can now contrast these estimates with the extraordinary 2021 fire emissions. In the study conducted by Romanov et al. (2022a), the 2015–2020 average annual wildfire emissions were estimated at 642 Tg of carbon dioxide. If all other conditions, including forest harvesting, remained constant in 2021 as the average during the 2015–2020 period, we can substitute the 642 Tg of average fire emissions for 2015–2020 with the 1,700 Tg of carbon dioxide equivalent emitted by wildfires in 2021. This calculation yields a net carbon uptake of only 140 Tg of carbon dioxide. The accuracy of calculations of the net forest carbon dioxide uptake is about plus-minus 136 Tg, which is very close to calculated above 140 Tg CO2 of net carbon sink into Russian forests in 2021. Therefore, this estimate is not statistically different from the zero. It would be safe to say, that 2021 was the year of nearly zero sink of carbon into forest biomass.
The warming of the Arctic is expected to continue beyond the mid-21st century (IPCC, 2021). Considering this, we can conclude that the worst regarding wildfires may not have been witnessed yet. This assessment implies that within the coming decades, Russian forests might shift from being a net carbon sink to a zero sink, like in 2021, or even a source of greenhouse gases.
Data availability statement
Publicly available datasets were analyzed in this study. This data can be found at: https://sentinels.copernicus.eu/web/sentinel/access-to-sentinel-data-via-the-copernicus-data-space-ecosystem.
Author contributions
AL and LY conceived the idea. LY conducted the calculations. AL wrote the first draft. All authors contributed to the article and approved the submitted version.
Acknowledgments
We thank Guido R. van der Werf for help with managing GFED4.1 input files.
Conflict of interest
The authors declare that the research was conducted in the absence of any commercial or financial relationships that could be construed as a potential conflict of interest.
Publisher’s note
All claims expressed in this article are solely those of the authors and do not necessarily represent those of their affiliated organizations, or those of the publisher, the editors and the reviewers. Any product that may be evaluated in this article, or claim that may be made by its manufacturer, is not guaranteed or endorsed by the publisher.
Supplementary material
The Supplementary material for this article can be found online at: https://www.frontiersin.org/articles/10.3389/ffgc.2023.1188057/full#supplementary-material
Footnotes
References
Alekseev, A., Tomppo, E., McRoberts, R. E., and von Gadow, K. (2019). A constructive review of the state forest inventory in the Russian Federation. For. Ecosyst. 6:9. doi: 10.1186/s40663-019-0165-3
Budyko, M. I. (1969). The effect of solar radiation variations on the climate of the earth. Tellus 21, 611–619. doi: 10.3402/tellusa.v21i5.10109
Burrell, A. L., Sun, Q., Baxter, R., Kukavskaya, E. A., Zhila, S., Shestakova, T., et al. (2022). Climate change, fire return intervals and the growing risk of permanent forest loss in boreal Eurasia. Sci. Total Environ. 831:154885. doi: 10.1016/j.scitotenv.2022.154885
Caian, M., Koenigk, T., Döscher, R., and Devasthale, A. (2018). An interannual link between Arctic Sea-ice cover and the North Atlantic Oscillation. Clim. Dyn. 50, 423–441. doi: 10.1007/s00382-017-3618-9
Davini, P., and D’Andrea, F. (2020). From CMIP3 to CMIP6: northern hemisphere atmospheric blocking simulation in present and future climate. J. Clim. 33, 10021–10038. doi: 10.1175/JCLI-D-19-0862.1
Fogt, R. L., Sleinkofer, A. M., Raphael, M. N., and Handcock, M. S. (2022). A regime shift in seasonal total Antarctic Sea ice extent in the twentieth century. Nat. Clim. Chang 12, 54–62. doi: 10.1038/s41558-021-01254-9
Friedlingstein, P., Jones, M. W., O’Sullivan, M., Andrew, R. M., Bakker, D. C. E., Hauck, J., et al. (2021). Global Carbon Budget 2021. Earth Syst. Sci. Data. 14, 1917–2005. doi: 10.5194/essd-2021-386
Giglio, L., Boschetti, L., Roy, D., and Humber, M. (2016). Collection 6 MODIS burned area product user’s guide version 1.0. In MODIS.
Giglio, L., Csiszar, I., and Justice, C. O. (2006). Global distribution and seasonality of active fires as observed with the Terra and Aqua moderate resolution imaging Spectroradiometer (MODIS) sensors. J. Geophys. Res. Biogeosci. 111:G02016. doi: 10.1029/2005JG000142
Glückler, R., Herzschuh, U., Kruse, S., Andreev, A., Vyse, S. A., Winkler, B., et al. (2021). Wildfire history of the boreal forest of south-western Yakutia (Siberia) over the last two millennia documented by a lake-sediment charcoal record. Biogeosciences 18, 4185–4209. doi: 10.5194/bg-18-4185-2021
Higuera, P., Barnes, J., Chipman, M., Urban, M., and Hu, F. (2023). The burning tundra: a look back at the last 6,000 years of fire in the Noatak National Preserve, Northwestern Alaska. Alaska Park Science. 10, 659–740.
Hu, F. S., Higuera, P. E., Duffy, P., Chipman, M. L., Rocha, A. V., Young, A. M., et al. (2015). Arctic tundra fires: Natural variability and responses to climate change. Front. Ecol. Environ. 13, 369–377. doi: 10.1890/150063
Hurrell, J. W., and Deser, C. (2010). North Atlantic climate variability: the role of the North Atlantic Oscillation. J. Mar. Syst. 79, 231–244. doi: 10.1016/j.jmarsys.2009.11.002
IPCC (2021). “Climate change 2021: the physical science basis” in Contribution of working group I to the sixth assessment report of the intergovernmental panel on climate change. eds. V. Masson-Delmotte, P. Zhai, A. Pirani, S. L. Connors, C. Péan, and S. Berger, et al. (Cambridge, United Kingdom, New York, NY: Cambridge University Press)
Knight, David, Olga, Emelyanova, Irina, Rostovtseva, Samuel, Freije-Rodriguez, Vladimir, Kolchin, Peter, Nagle, et al. (2021). 46th issue of the Russia economic report. Available at: https://www.worldbank.org/en/country/russia/publication/rer.
Kumar, A., Yadav, J., and Mohan, R. (2020). Global warming leading to alarming recession of the Arctic Sea-ice cover: insights from remote sensing observations and model reanalysis. Heliyon 6:e04355. doi: 10.1016/j.heliyon.2020.e04355
Linley, G. D., Jolly, C. J., Doherty, T. S., Geary, W. L., Armenteras, D., Belcher, C. M., et al. (2022). What do you mean, ‘megafire’? Glob. Ecol. Biogeogr. 31, 1906–1922. doi: 10.1111/geb.13499
Liu, J., Curry, J. A., and Hu, Y. (2004). Recent Arctic Sea ice variability: connections to the Arctic oscillation and the ENSO. Geophys. Res. Lett. 31:L09211. doi: 10.1029/2004GL019858
Masson-Delmotte, V., Zhai, P., Pirani, A., Connors, S.L., Péan, C., Berger, S., et al. (2021). IPCC, 2021: climate change 2021: the physical science basis. Cambridge University Press: Cambridge, United Kingdom, New York, NY.
McCarty, J. L., Smith, T. E. L., and Turetsky, M. R. (2020). Arctic fires re-emerging. Nat. Geosci. 13, 658–660. doi: 10.1038/s41561-020-00645-5
Mokhov, I. I., Bondur, V. G., Sitnov, S. A., and Voronova, O. S. (2020). Satellite monitoring of wildfires and emissions into the atmosphere of combustion products in Russia: relation to atmospheric blockings. Dokl. Earth Sci 495, 921–924. doi: 10.1134/S1028334X20120089
Mokhov, I. I., and Timazhev, A. V. (2015). Model assessment of possible changes of atmospheric blockings in the northern hemisphere under RCP scenarios of anthropogenic forcings. Dokl. Earth Sci. 460, 63–67. doi: 10.1134/S1028334X15010122
Molteni, F., King, M. P., Kucharski, F., and Straus, D. M. (2011). Planetary-scale variability in the northern winter and the impact of land-sea thermal contrast. Clim. Dyn. 37, 151–170. doi: 10.1007/s00382-010-0906-z
Myhre, G., Shindell, D., Bréon, F.-M., Collins, W. D., Fuglestvedt, J., Huang, J., et al. (2013). “IPCC AR5 (2013) chapter 8: anthropogenic and natural radiative forcing” in Climate change 2013: the physical science basis. Contribution of working group I to the fifth assessment report of the intergovernmental panel on climate change eds. T. F. Stocker, D. Qin, G.-K. Plattner, M. Tignor, S. K. Allen, and J. Doschung, et al. Cambridge University Press. 659–740.
Natole, M., Ying, Y., Buyantuev, A., Stessin, M., Buyantuev, V., and Lapenis, A. (2021). Patterns of mega-forest fires in East Siberia will become less predictable with climate warming. Environ. Adv. 4:100041. doi: 10.1016/j.envadv.2021.100041
NOAA (2023). Available at: https://www.cpc.ncep.noaa.gov/.
Novenko, E., Kupriyanov, D., Mazei, N., Prokushkin, A., Phelps, L., Buri, A., et al. (2022a). Evidence that modern fires may be unprecedented during the last 3400 years in permafrost zone of Central Siberia. Russ. Environ. Res. Lett. 17:025004. doi: 10.1088/1748-9326/ac4b53
Novenko, E., Mazei, N., Kupriyanov, D. A., Babeshko, K. V., Kusilman, M. V., Zyuganova, I. S., et al. (2022b). Paleoenvironmental changes, vegetation dynamics and fire history in northwest Putorana plateau (Russian subarctic) during the last 1300 years. SSRN Electron. J. 17. doi: 10.2139/ssrn.4048857
Romanov, A. A., Tamarovskaya, A. N., Gloor, E., Brienen, R., Gusev, B. A., Leonenko, E. V., et al. (2022a). Reassessment of carbon emissions from fires and a new estimate of net carbon uptake in Russian forests in 2001–2021. Sci. Total Environ. 846:157322. doi: 10.1016/j.scitotenv.2022.157322
Romanov, A. A., Tamarovskaya, A. N., Gusev, B. A., Leonenko, E. V., Vasiliev, A. S., and Krikunov, E. E. (2022b). Catastrophic PM2.5 emissions from Siberian forest fires: impacting factors analysis. Environ. Pollut. 306:119324. doi: 10.1016/j.envpol.2022.119324
Russian Federation (2021). National Inventory Report (NIR). Available at: https://unfccc.int/documents/273477.
Schepaschenko, D., Moltchanova, E., Fedorov, S., Karminov, V., Ontikov, P., Santoro, M., et al. (2021). Russian forest sequesters substantially more carbon than previously reported. Sci. Rep. 11, 1–7. doi: 10.1038/s41598-021-92152-9
Scholten, R. C., Coumou, D., Luo, F., and Veraverbeke, S. (2022). Early snowmelt and polar jet dynamics co-influence recent extreme Siberian fire seasons. Science 378, 1005–1009. doi: 10.1126/science.abn4419
Stephens, S. L., Burrows, N., Buyantuyev, A., Gray, R. W., Keane, R. E., Kubian, R., et al. (2014). Temperate and boreal forest mega-fires: characteristics and challenges. Front. Ecol. Environ. 12, 115–122. doi: 10.1890/120332
Tomshin, O., and Solovyev, V. (2022). Features of the extreme fire season of 2021 in Yakutia (Eastern Siberia) and heavy air pollution caused by biomass burning. Remote Sens. 14:4980. doi: 10.3390/rs14194980
Van Der Werf, G. R., Randerson, J. T., Giglio, L., Van Leeuwen, T. T., Chen, Y., Rogers, B. M., et al. (2017). Global fire emissions estimates during 1997–2016. Earth Syst. Sci. Data 9, 697–720. doi: 10.5194/essd-9-697-2017
Wang, J., and Ikeda, M. (2000). Arctic oscillation and Arctic Sea-Ice oscillation. Geophys. Res. Lett. 27, 1287–1290. doi: 10.1029/1999GL002389
Wulder, M. A., Campbell, C., White, J. C., Flannigan, M., and Campbell, I. D. (2007). National circumstances in the international circumboreal community. For Chron. 83, 539–556. doi: 10.5558/tfc83539-4
Yurganov, L., and Rakitin, V. (2022). Two decades of satellite observations of carbon monoxide confirm the increase in northern hemispheric wildfires. Atmos 2022:1479. doi: 10.3390/atmos13091479
Zhang, X., Sorteberg, A., Zhang, J., Gerdes, R., and Comiso, J. C. (2008). Recent radical shifts of atmospheric circulations and rapid changes in Arctic climate system. Geophys. Res. Lett. 35:L22701. doi: 10.1029/2008GL035607
Zhu, X., Xu, X., and Jia, G. (2021). Asymmetrical trends of burned area between eastern and Western Siberia regulated by atmospheric oscillation. Geophys. Res. Lett. 48:e96095. doi: 10.1029/2021GL096095
Keywords: wildfires, carbon emissions, fossil fuel, carbon sequestration, carbon dioxide equivalent
Citation: Lapenis AG and Yurganov LN (2023) Increase in Arctic Oscillations explains most interannual variability in Russia’s wildfires. Front. For. Glob. Change. 6:1188057. doi: 10.3389/ffgc.2023.1188057
Edited by:
Sean Michael Gleason, Agricultural Research Service, United StatesReviewed by:
Leonardo Montagnani, Free University of Bozen-Bolzano, ItalyCopyright © 2023 Lapenis and Yurganov. This is an open-access article distributed under the terms of the Creative Commons Attribution License (CC BY). The use, distribution or reproduction in other forums is permitted, provided the original author(s) and the copyright owner(s) are credited and that the original publication in this journal is cited, in accordance with accepted academic practice. No use, distribution or reproduction is permitted which does not comply with these terms.
*Correspondence: Andrei G. Lapenis, YW5kcmVpbEBhbGJhbnkuZWR1