
95% of researchers rate our articles as excellent or good
Learn more about the work of our research integrity team to safeguard the quality of each article we publish.
Find out more
ORIGINAL RESEARCH article
Front. For. Glob. Change , 24 May 2023
Sec. Forest Soils
Volume 6 - 2023 | https://doi.org/10.3389/ffgc.2023.1172062
This article is part of the Research Topic Forests' Soil-Environment Interactions Under Global Change View all 4 articles
 Bei Zhang1,2†
 Chaohao Xu1†
 Zhonghua Zhang1,2
 Cong Hu1
 Yeyong He1,2
 Kuaikuai Huang1,2
 Qingling Pang1,2
 Gang Hu1*
The dynamics of soil organic carbon (SOC) and its fractions are important for evaluating the vegetation restoration effect and carbon cycle of the ecosystem. Here, SOC fractions, including light fraction organic carbon (LFOC), heavy fraction organic carbon (HFOC), and labile organic carbon (LOC) fractions (including water-soluble organic carbon, WSOC, readily oxidizable organic carbon, ROC, particulate organic carbon, POC, and microbial biomass carbon, MBC), were investigated at four soil depths under five restoration stages in a tropical karst area in southwest China. This study showed that the content of SOC and its fractions significantly increased with vegetation restoration and decreased with increasing soil depth at each restoration stage (p < 0.05). Additionally, LFOC was more sensitive to vegetation restoration, whereas HFOC was the main storage form of SOC. The LOC fractions in the surface soil layer were significantly higher than those in the lower, and the percentages of some LOC fractions (POC/SOC and MBC/SOC) significantly decreased with increasing soil depth, indicating that SOC was more stable in the lower layer than in the surface layer. Correlation analysis showed that SOC was significantly and positively correlated with its fractions. Moreover, SOC and its fraction were positively correlated with soil chemical factors (TN, TP, AP, AK, ECa, EMg, NH4+-N, and NO3–-N) and negatively correlated with bulk density (BD) at a significant level (p < 0.05). Moreover, redundancy analysis showed that the 12 soil physicochemical factors explained 70.99% of the variation in SOC and its fractions, with AK, NH4+-N, and BD being the main factors, explaining 19.38, 17.24, and 10.52% of the variation, respectively. The structural equation mode analysis showed that soil properties, above-ground biomass, and litterfall explained most of the variation in SOC (59%), LFOC (79%), HFOC (81%), and LOC (61%). Soil properties and above-ground biomass significantly affected SOC, LFOC, and HFOC content mainly through indirect effects, while the total phosphorus content of the litterfall could directly and significantly affect SOC, LFOC, and HFOC content. NH4+-N and AK of soil factors had direct effects on LFOC and LOC accumulation, respectively. This study provides a valuable perspective for estimating carbon sink potential and constructing carbon sink models in karst areas.
Soil organic carbon (SOC), the largest terrestrial organic carbon pool, has a global storage capacity of approximately 2,344 Gt, which is approximately twice that of the atmospheric carbon pool. A crucial source and sink of atmospheric CO2, SOC plays an important role in the global carbon cycle (Stockmann et al., 2013; Scharlemann et al., 2014). Vegetation restoration can significantly improve SOC sequestration (Li et al., 2012), whereas vegetation degradation and irrational land-use practices can reduce soil carbon sequestration and accelerate greenhouse gas emissions (Lu et al., 2014). SOC sequestration capacity depends on the dynamic balance between the input of carbon sources and the mineralization and decomposition of SOC, influenced by a combination of multiple factors, including climate, restoration period, soil physical structure, and nutrients (Lal, 2004; Laganiere et al., 2010). A broader understanding of the changes in SOC pools during vegetation restoration is required to improve soil carbon sinks and develop effective land management policies.
Soil organic carbon fractions obtained using physical, chemical, and biological methods for grouping SOC attributes better reflect SOC dynamics (Six et al., 2002). For example, light fraction organic carbon (LFOC) and heavy fraction organic carbon (HFOC) are the result of SOC density grouping (Cambardella and Elliott, 1993a). LFOC decomposes rapidly and is significantly affected by vegetation type and litterfall composition, whereas HFOC is relatively stable and is the main fraction of SOC, including the main sink for carbon storage in soils. Additionally, SOC can be classified as labile organic carbon (LOC) and stable organic carbon according to its activity level. LOC, which includes water-soluble organic carbon (WSOC), readily oxidizable organic carbon (ROC), particulate organic carbon (POC), and microbial biomass carbon (MBC), accounts for a relatively small proportion of SOC. However, it can be used to indicate the dynamic characteristics of SOC and directly affects the activity of soil microorganisms, resulting in greenhouse gas emissions (Liang et al., 1997). The content and distribution of LOC fractions are affected by vegetation restoration models and restoration periods (von Lützow et al., 2007).
The global karst area is approximately 22 million km2, accounting for 15% of the total land area on Earth (Ford and Williams, 2007). China has the most widely distributed contiguous karst area in the world, accounting for approximately one-third of the country’s land area. The shallow and discontinuous soil layers and highly heterogeneous habitats in karst areas result in complex and fragile karst ecosystems (Xu et al., 2013). High-intensity human disturbances during the past decades have led to serious damage to karst ecosystems, including vegetation degradation, soil erosion, and land productivity decline, which, in turn, have led to rock desertification, restricting the sustainable development of karst areas in southwest China (Jiang et al., 2014). Since the 1970s, the Chinese government has implemented a series of ecological restoration projects in karst areas, such as the Natural Forest Protection Project, Grain to Green Project, and Rocky Desertification Control Project. Thus, the vegetation cover in karst areas of China has increased significantly, with a combined vegetation cover of 61.4% in 2016, an increase of 3.9% from 2011 and 7.9% from 2005 (Jiang et al., 2014; Tong et al., 2020). Natural closure and afforestation in natural vegetation restoration are two important measures for increasing the green cover in rock desertification areas in karst areas, and natural closure can effectively restore degraded karst ecosystems (Hua et al., 2022).
Natural vegetation restoration is more conducive to carbon sequestration than artificial afforestation in the karst areas of southwest China (Pang et al., 2019). The LOC content increased significantly after karst vegetation restoration; the stability of SOC did not increase in the short term after arable land was retired (Zhao Y. et al., 2021). Arable land in the karst valley of southwest China has the highest SOC content, followed by forests and scrubs. In contrast, the grassland SOC content was the lowest, and SOC content, storage, and fractionation showed decreasing trends with increasing soil depth (Luo et al., 2022). Among the four vegetation types (cropland, grassland, shrubland, and secondary forest) in the karst area of southwestern China, LFOC and HFOC accounted for essentially the same proportion of SOC. This indicated that the stability of SOC was not affected by land use, and exchangeable calcium (ECa) was the main factor influencing the variation in LFOC and HFOC content in subtropical karst areas (Wen et al., 2017). These studies mainly focused on subtropical karst regions, but few studies have explored the dynamics of SOC and its fractions in tropical karst regions. Compared with subtropical karst regions, tropical karst regions are richer in vegetation but have higher temperatures and rainfall, resulting in faster SOC decomposition and carbon cycling (Wang et al., 2016). Additionally, tropical karst regions are often subjected to high levels of soil erosion and loss, affecting the accumulation and retention of SOC in the soil (Zhang et al., 2011). Therefore, more studies are needed to understand how vegetation restoration affects the dynamics of SOC and its fractions in tropical karst areas.
Here, the contents of SOC and its fractions (LFOC, HFOC, WSOC, ROC, POC, and MBC) in different vegetation restoration stages in a tropical karst area in southwest China were investigated to address the following objectives: (1) clarify the changes in SOC and its fractions in the soil profile of a tropical karst area with natural vegetation restoration; (2) address the relationships between soil physicochemical factors and SOC and its fractions and determine the main limiting factors for the accumulation of SOC and its fractions; (3) explore the direct and indirect effects of soil, litterfall, and above-ground biomass on the accumulation of SOC and its fractions.
The study area is located in Longzhou County (22° 8′ 49.35″–22° 44′ 42.30″N, 106° 33′ 23.33″–107° 12′ 42.56″E), Guangxi Province, southwest China (Figure 1). The area is of tropical monsoon climate with an average annual temperature of 22°C, an absolute maximum temperature of 39°C, and an absolute minimum temperature of -3°C. The average annual precipitation is 1150–1550 mm and is concentrated from May to October. The geomorphological type is a karst peak-cluster depression landscape with an average elevation of 450 m (asl.) The soil type is alkaline limestone.
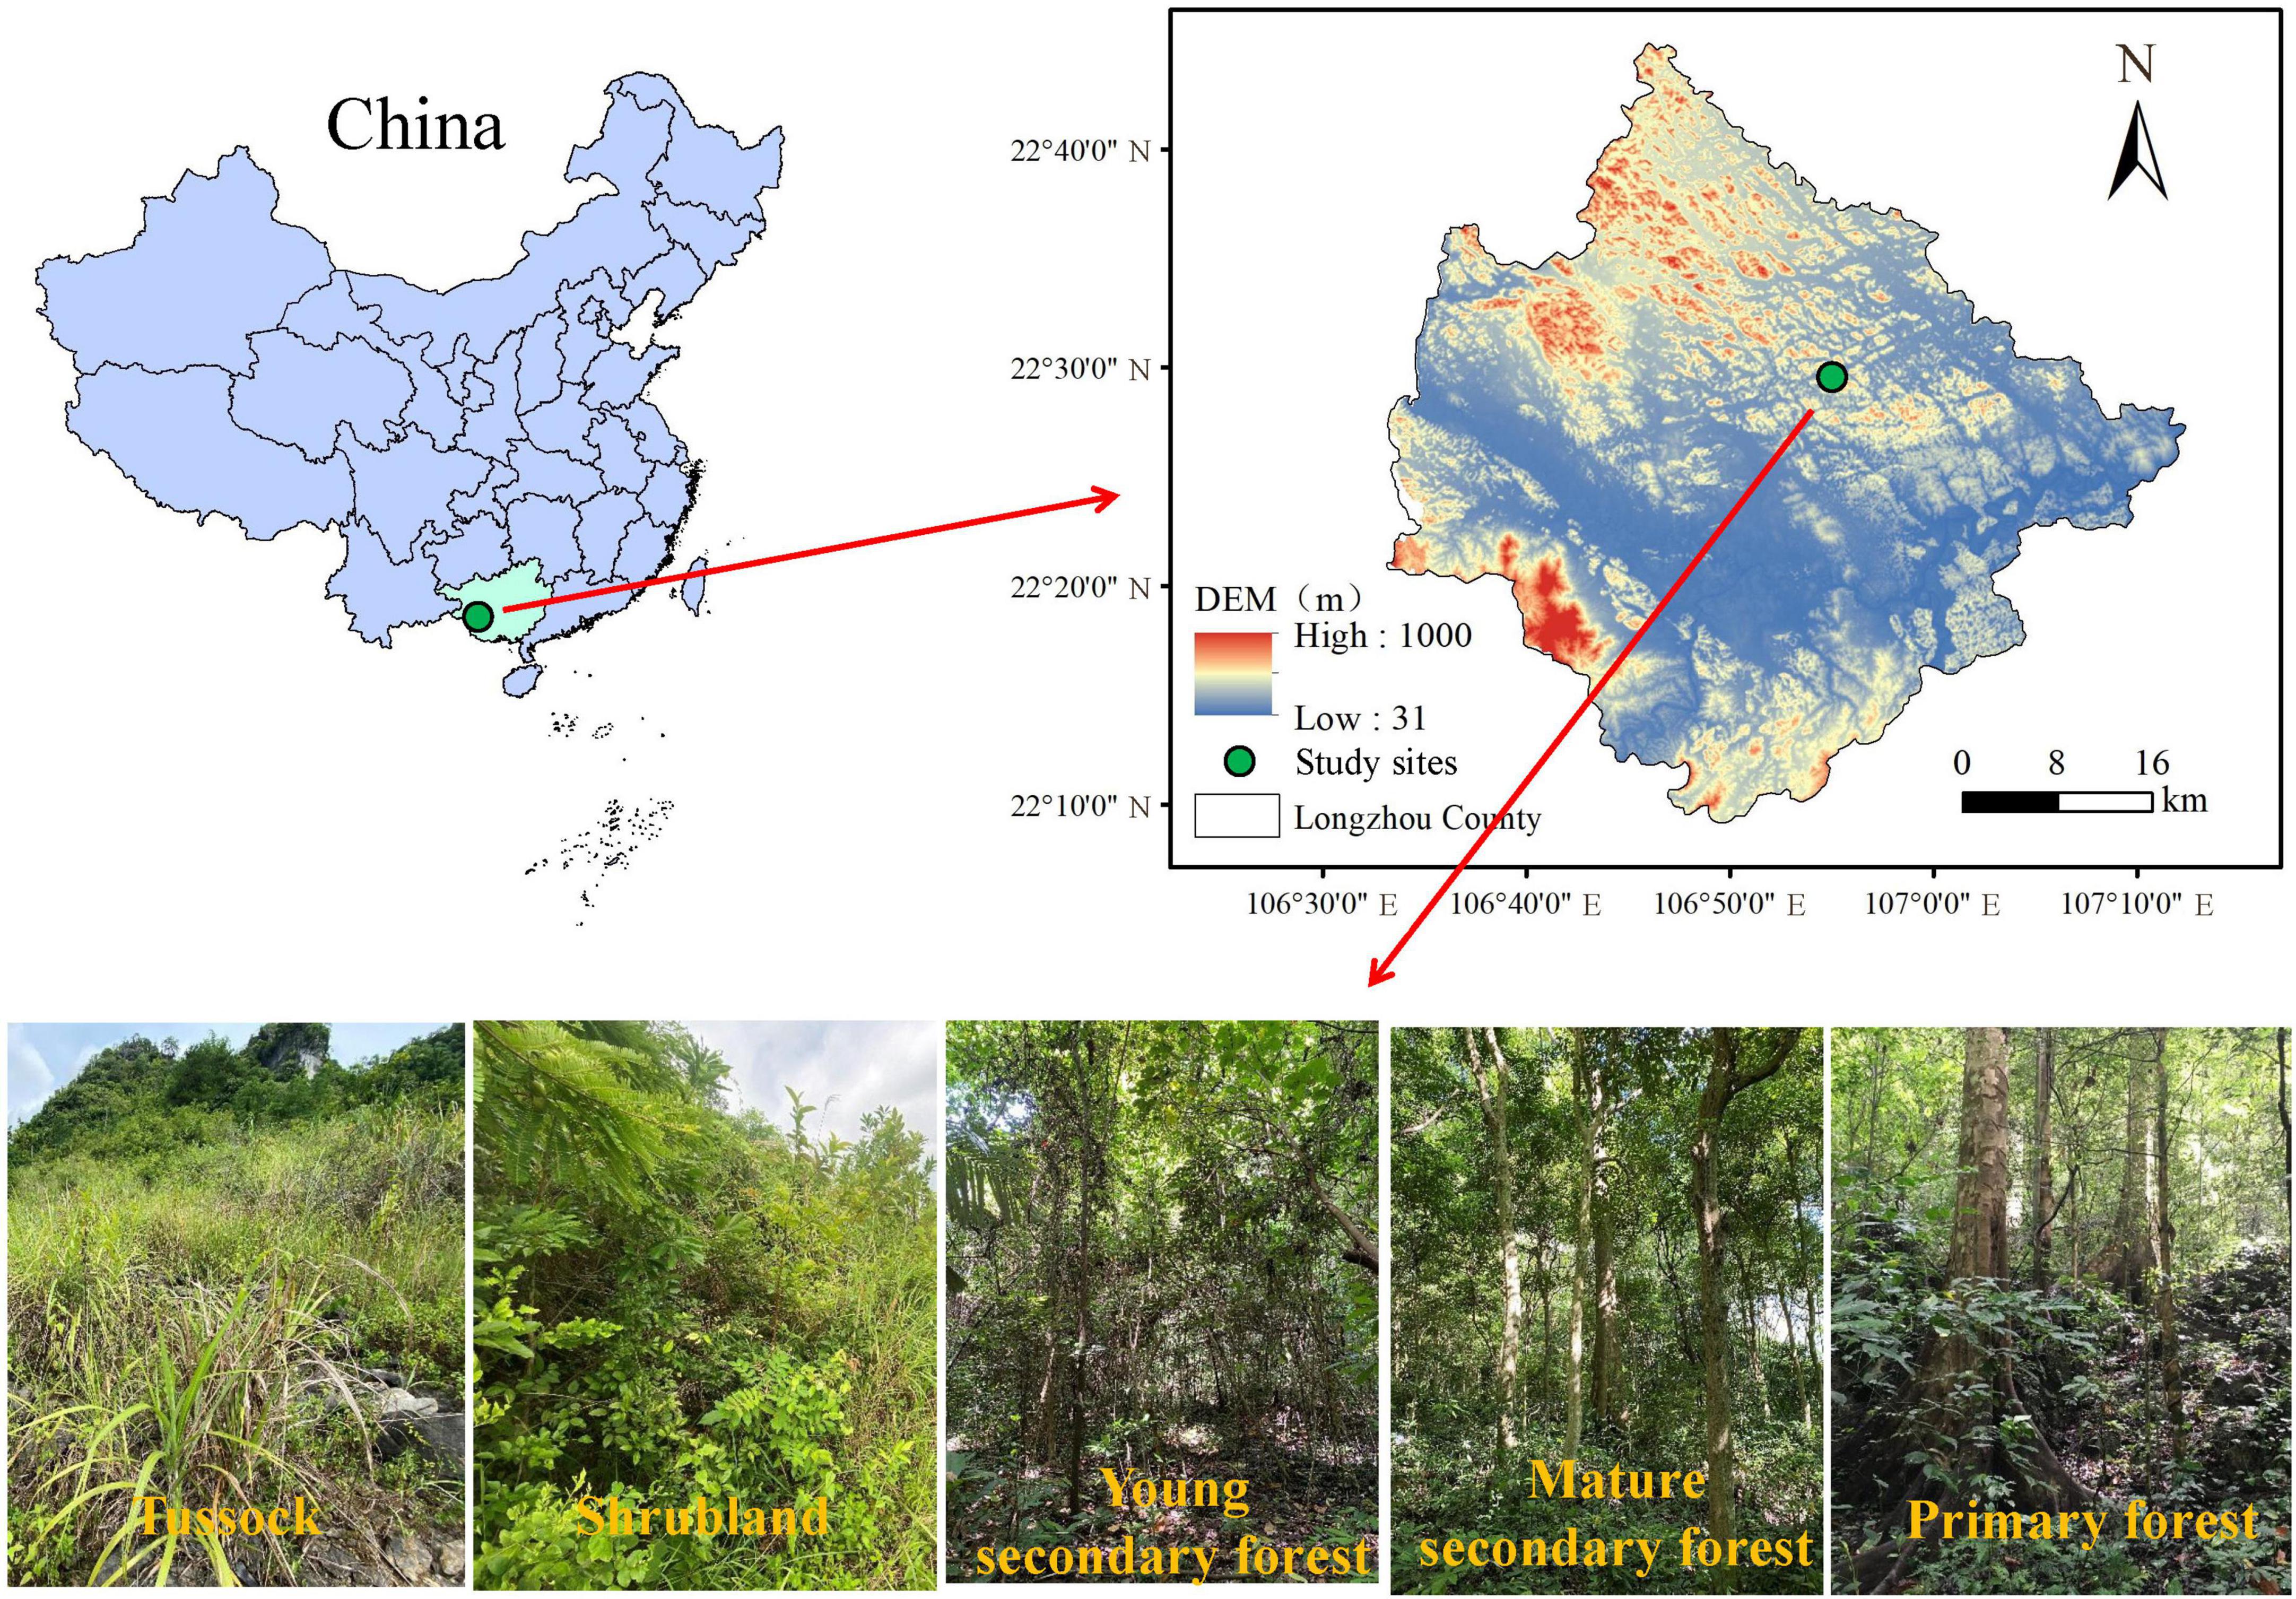
Figure 1. Location of the study area and selected restoration stages in a tropical karst area, southwest China.
Five vegetation types, namely tussock (TU, 2 m × 2 m), shrubland (SL, 10 m × 10 m), young secondary forest (YSF, 20 m × 20 m), mature secondary forest (MSY, 20 m × 20 m), and primary forest (PF, 20 m × 20 m), were selected as natural successional sequences using a spatial rather than temporal approach in August 2021. The selected natural vegetation grew under similar climatic conditions. A total of 20 plots with four replicate plots in each vegetation restoration stage were set up with the similar geographical conditions; Table 1 shows the basic information of these sampling sites. In each sampling plot, soil samples were collected from four soil depths (i.e., 0–10, 10–20, 20–30, and 30–50 cm) in triplicate, and the three replicates of soil samples from the same soil layer were mixed as one sample. Finally, a total of 80 samples were collected and placed in an insulated bag and brought to the laboratory for storage at 4°C. After removing roots and debris from the soil and passing through a 2 mm soil sieve, each soil sample was divided into two parts: one fresh soil samples was used for the determination of WSOC and MBC, while the other samples were naturally air-dried to measure the SOC, LFOC, HFOC, ROC, and POC contents. Before collecting soil samples, the thickness of the ground litterfall at each sampling plot was measured and the ground litterfall within 0.5 m × 0.5 m square area in the sampling plot was collected for calculating the litterfall yield and determining the content of litterfall organic carbon (Litter C), total nitrogen (Litter N), and total phosphorus (Litter P).
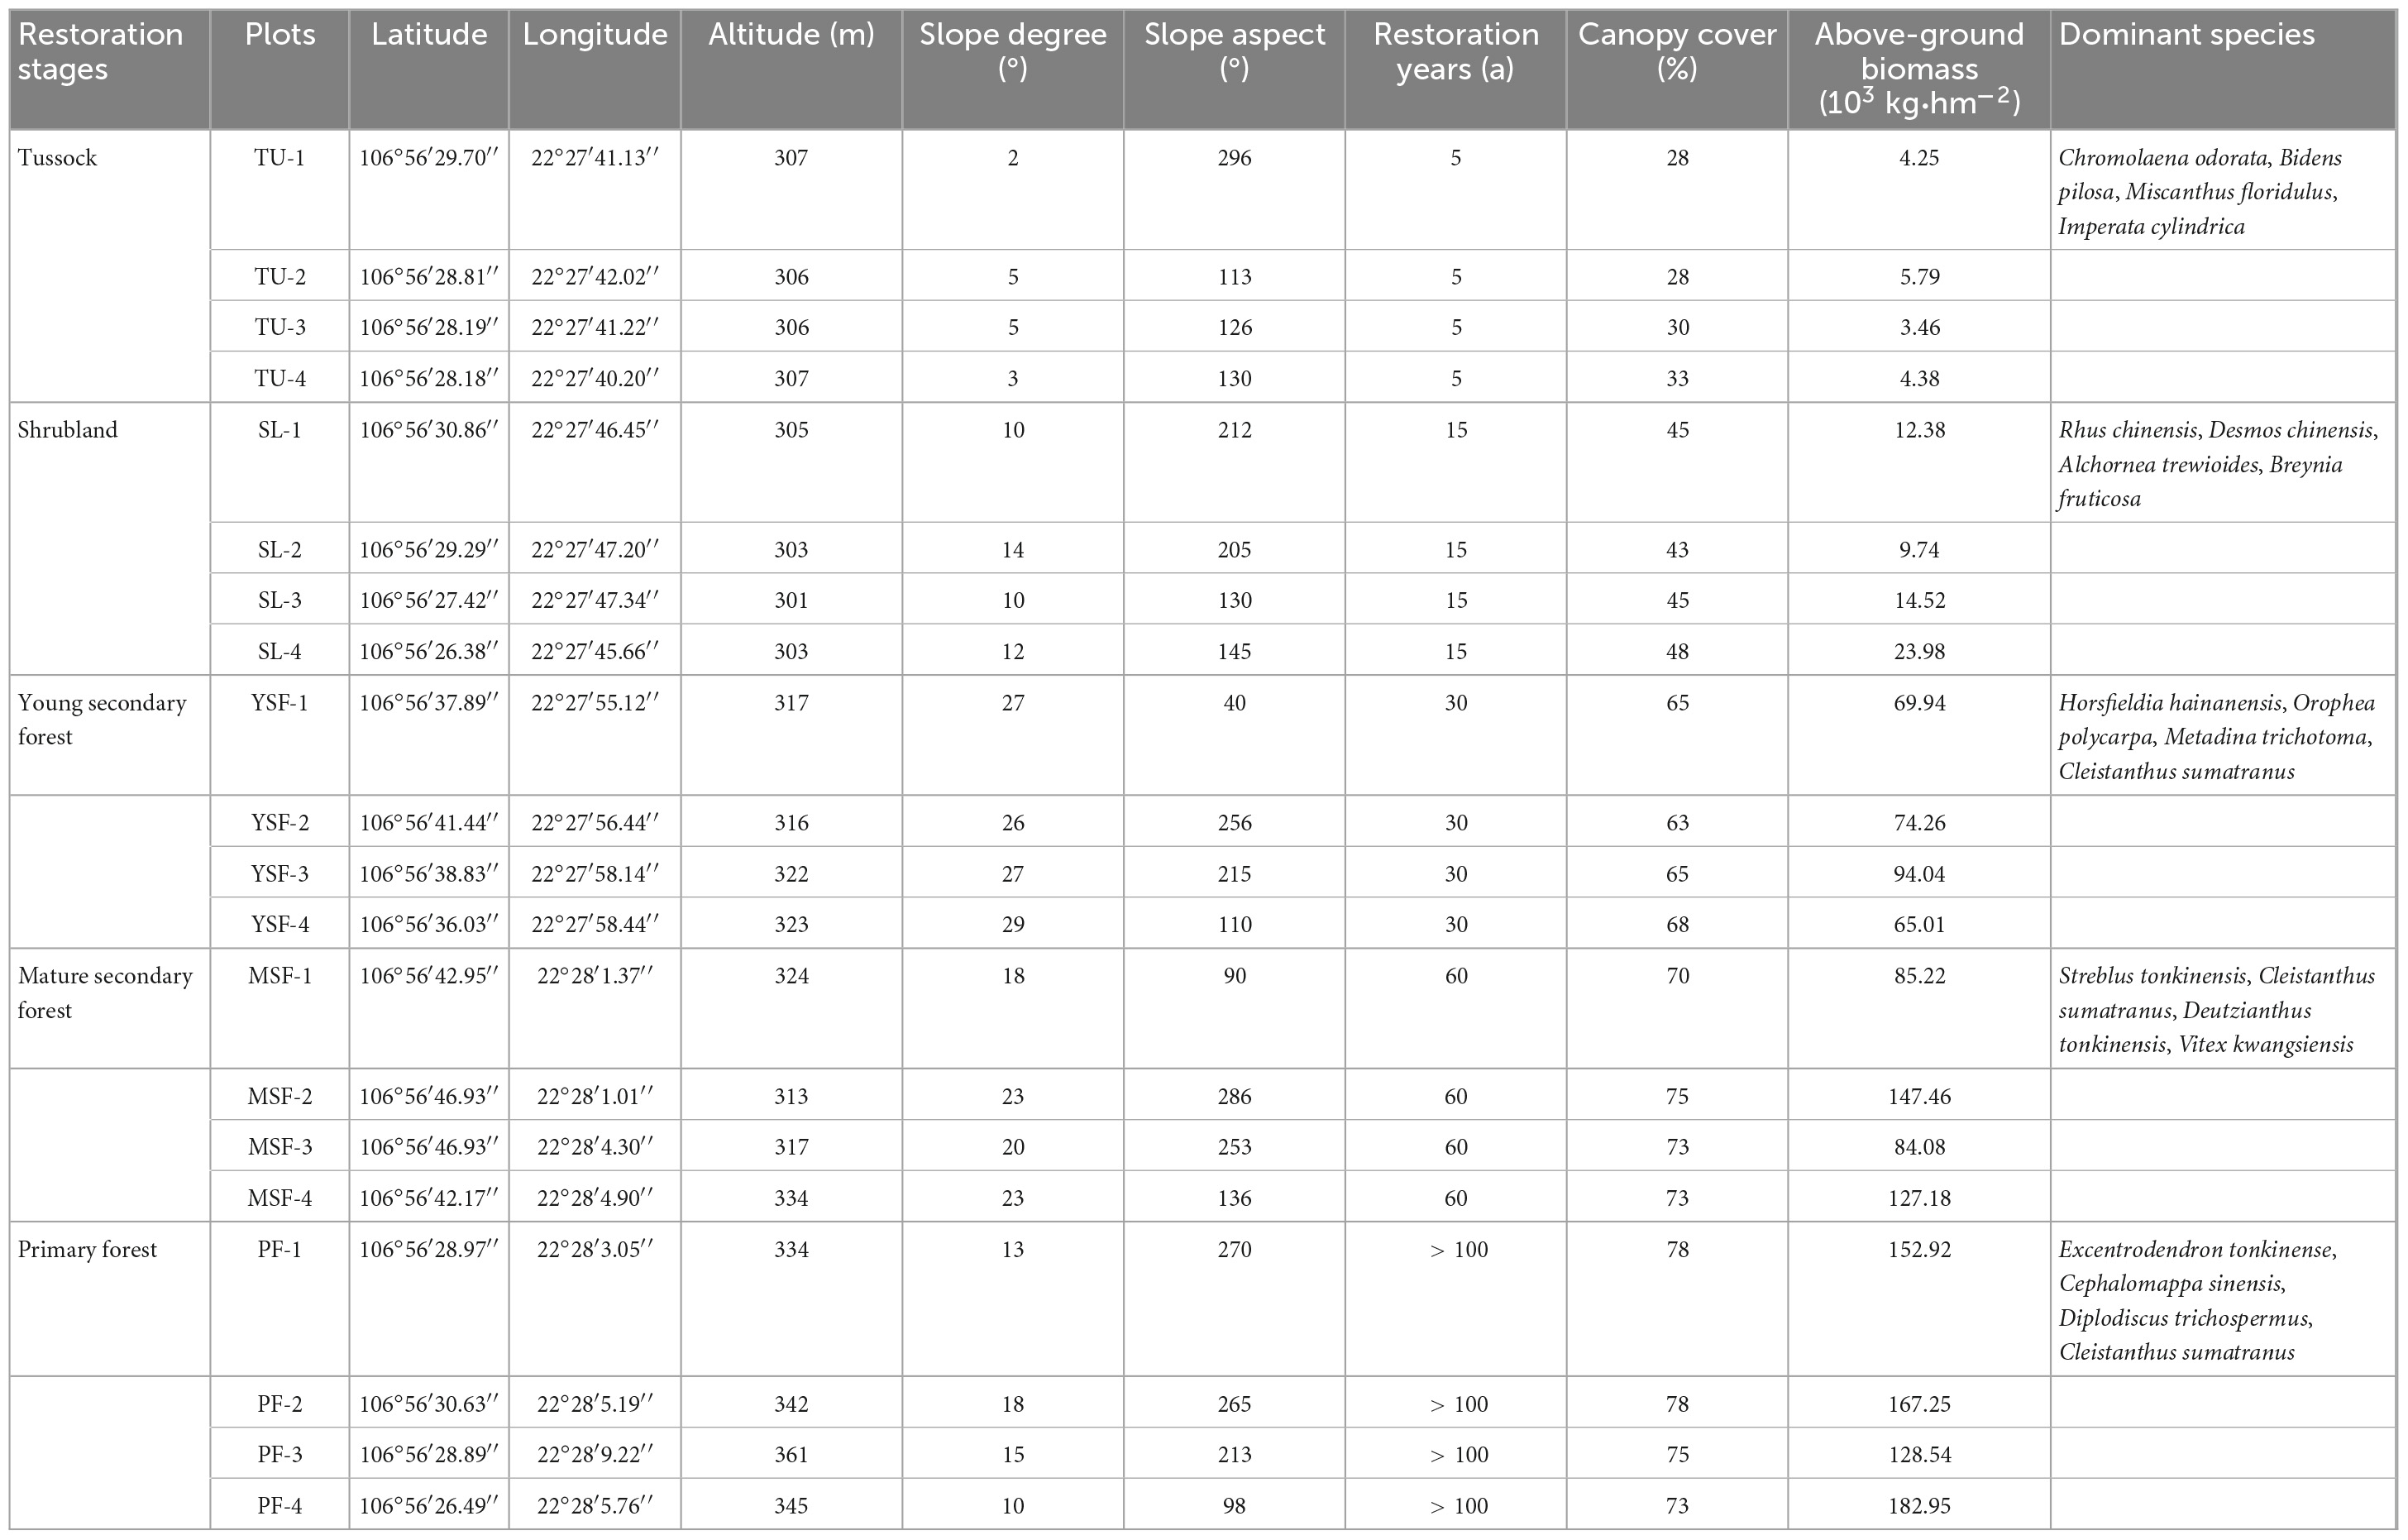
Table 1. Basic information of the study area and sampling sites.
Soil bulk density (BD) was determined using the cutting ring method in the field (Hossain et al., 2015), soil electrical conductivity (EC) using the electrode method (Rhoades and Corwin, 1981), and soil pH using the potentiometric method (Bao, 2013). Soil effective phosphorus (AP) was determined using sodium bicarbonate leaching and molybdenum antimony anti-spectrophotometric method and soil effective potassium (AK) content using flame atomic absorption spectrophotometry. Total nitrogen (TN) and Litter N were determined using the Kjeldahl method, total phosphorus (TP) and Litter P using alkali fusion-molybdenum antimony anti-spectrophotometry, and total potassium (TK) using atomic absorption spectrophotometry. ECa was determined using ammonium acetate exchange-EDTA complex titration and exchangeable magnesium (EMg) using ammonium acetate exchange-atomic absorption spectrophotometry. Ammonium nitrogen (NH4+-N) and nitrate nitrogen (NO3–-N) were determined using nano-reagent and UV spectrophotometry, respectively. The above methods were used to determine the soil physicochemical properties, as described by Bao (2013). The mean values of the above 12 soil properties are shown in Supplementary Table 1, and the properties of litterfall in the sample plots are shown in Supplementary Table 2.
The SOC and Litter C were determined by oxidation spectrophotometry using potassium dichromate (Bao, 2013). LFOC and HFOC were determined using NaI density separation (Janzen et al., 1992). The separation specific gravity used here was 1.7, with a specific gravity of less than 1.7 for LFOC and greater than 1.7 for HFOC (Janzen et al., 1992). WSOC was extracted using deionized water (water-soil ratio of 2:1) and extracted with a 0.45 μm membrane; the filtrate was determined on a TOC analyzer (Springob and Kirchmann, 2002). ROC was determined using the KMnO4 oxidation method (Blair et al., 1995), POC using the sodium hexametaphosphate separation method (Cambardella and Elliott, 1993b), and MBC using the chloroform fumigation extraction method (Wang et al., 2003).
Two-way analysis of variance (ANOVA) was used to examine the effects of vegetation restoration and soil depth on the content of SOC and its fractions. Data were tested for chi-square and multiple comparisons between means using the least significant difference method at a significance level of 0.05. Pearson’s correlation analysis was used to analyze the correlation between soil physicochemical factors and SOC and its fractions. Redundancy analysis (RDA) was used to explore the main factors affecting SOC and its fractions and calculate the explanation rate of each environmental factor. Variables with a variance inflation factor (VIF) greater than 10 were removed by detecting multicollinearity among environmental factors before performing RDA. Structural equation modeling was used to further reveal the direct and indirect pathways through which regulatory factors influence changes in SOC and its fractions. Statistical data were expressed as mean ± standard error (mean ± SE). ANOVA was performed using SPSS (version 24.0; SPSS Inc., Chicago, IL, USA). The correlation analysis, RDA analysis, contribution of each explanatory variable, and construction of the structural equation model were based on the psych (Revelle, 2017), vegan (Oksanen et al., 2016), rdacca.hp (Lai et al., 2022), and piecewiseSEM (Lefcheck, 2016) packages in R 4.1.3, respectively.
As shown in Figure 2A, Table 2, vegetation restoration and soil depth had significant effects on SOC content. During vegetation restoration, the SOC content of the 0–50 cm soil layer varied from 13.00 to 46.19 g⋅kg–1. Vegetation restoration only had a significant effect on the SOC of the 0–10 cm soil layer, showing that MSF and PF were significantly higher than TU and SL, YSF was significantly higher than TU (p < 0.05), and the SOC content tended to increase with vegetation restoration. In the soil profile, the highest SOC content was in the 0–10 cm soil layer at each restoration stage, and SOC content gradually decreased with increasing soil depth.
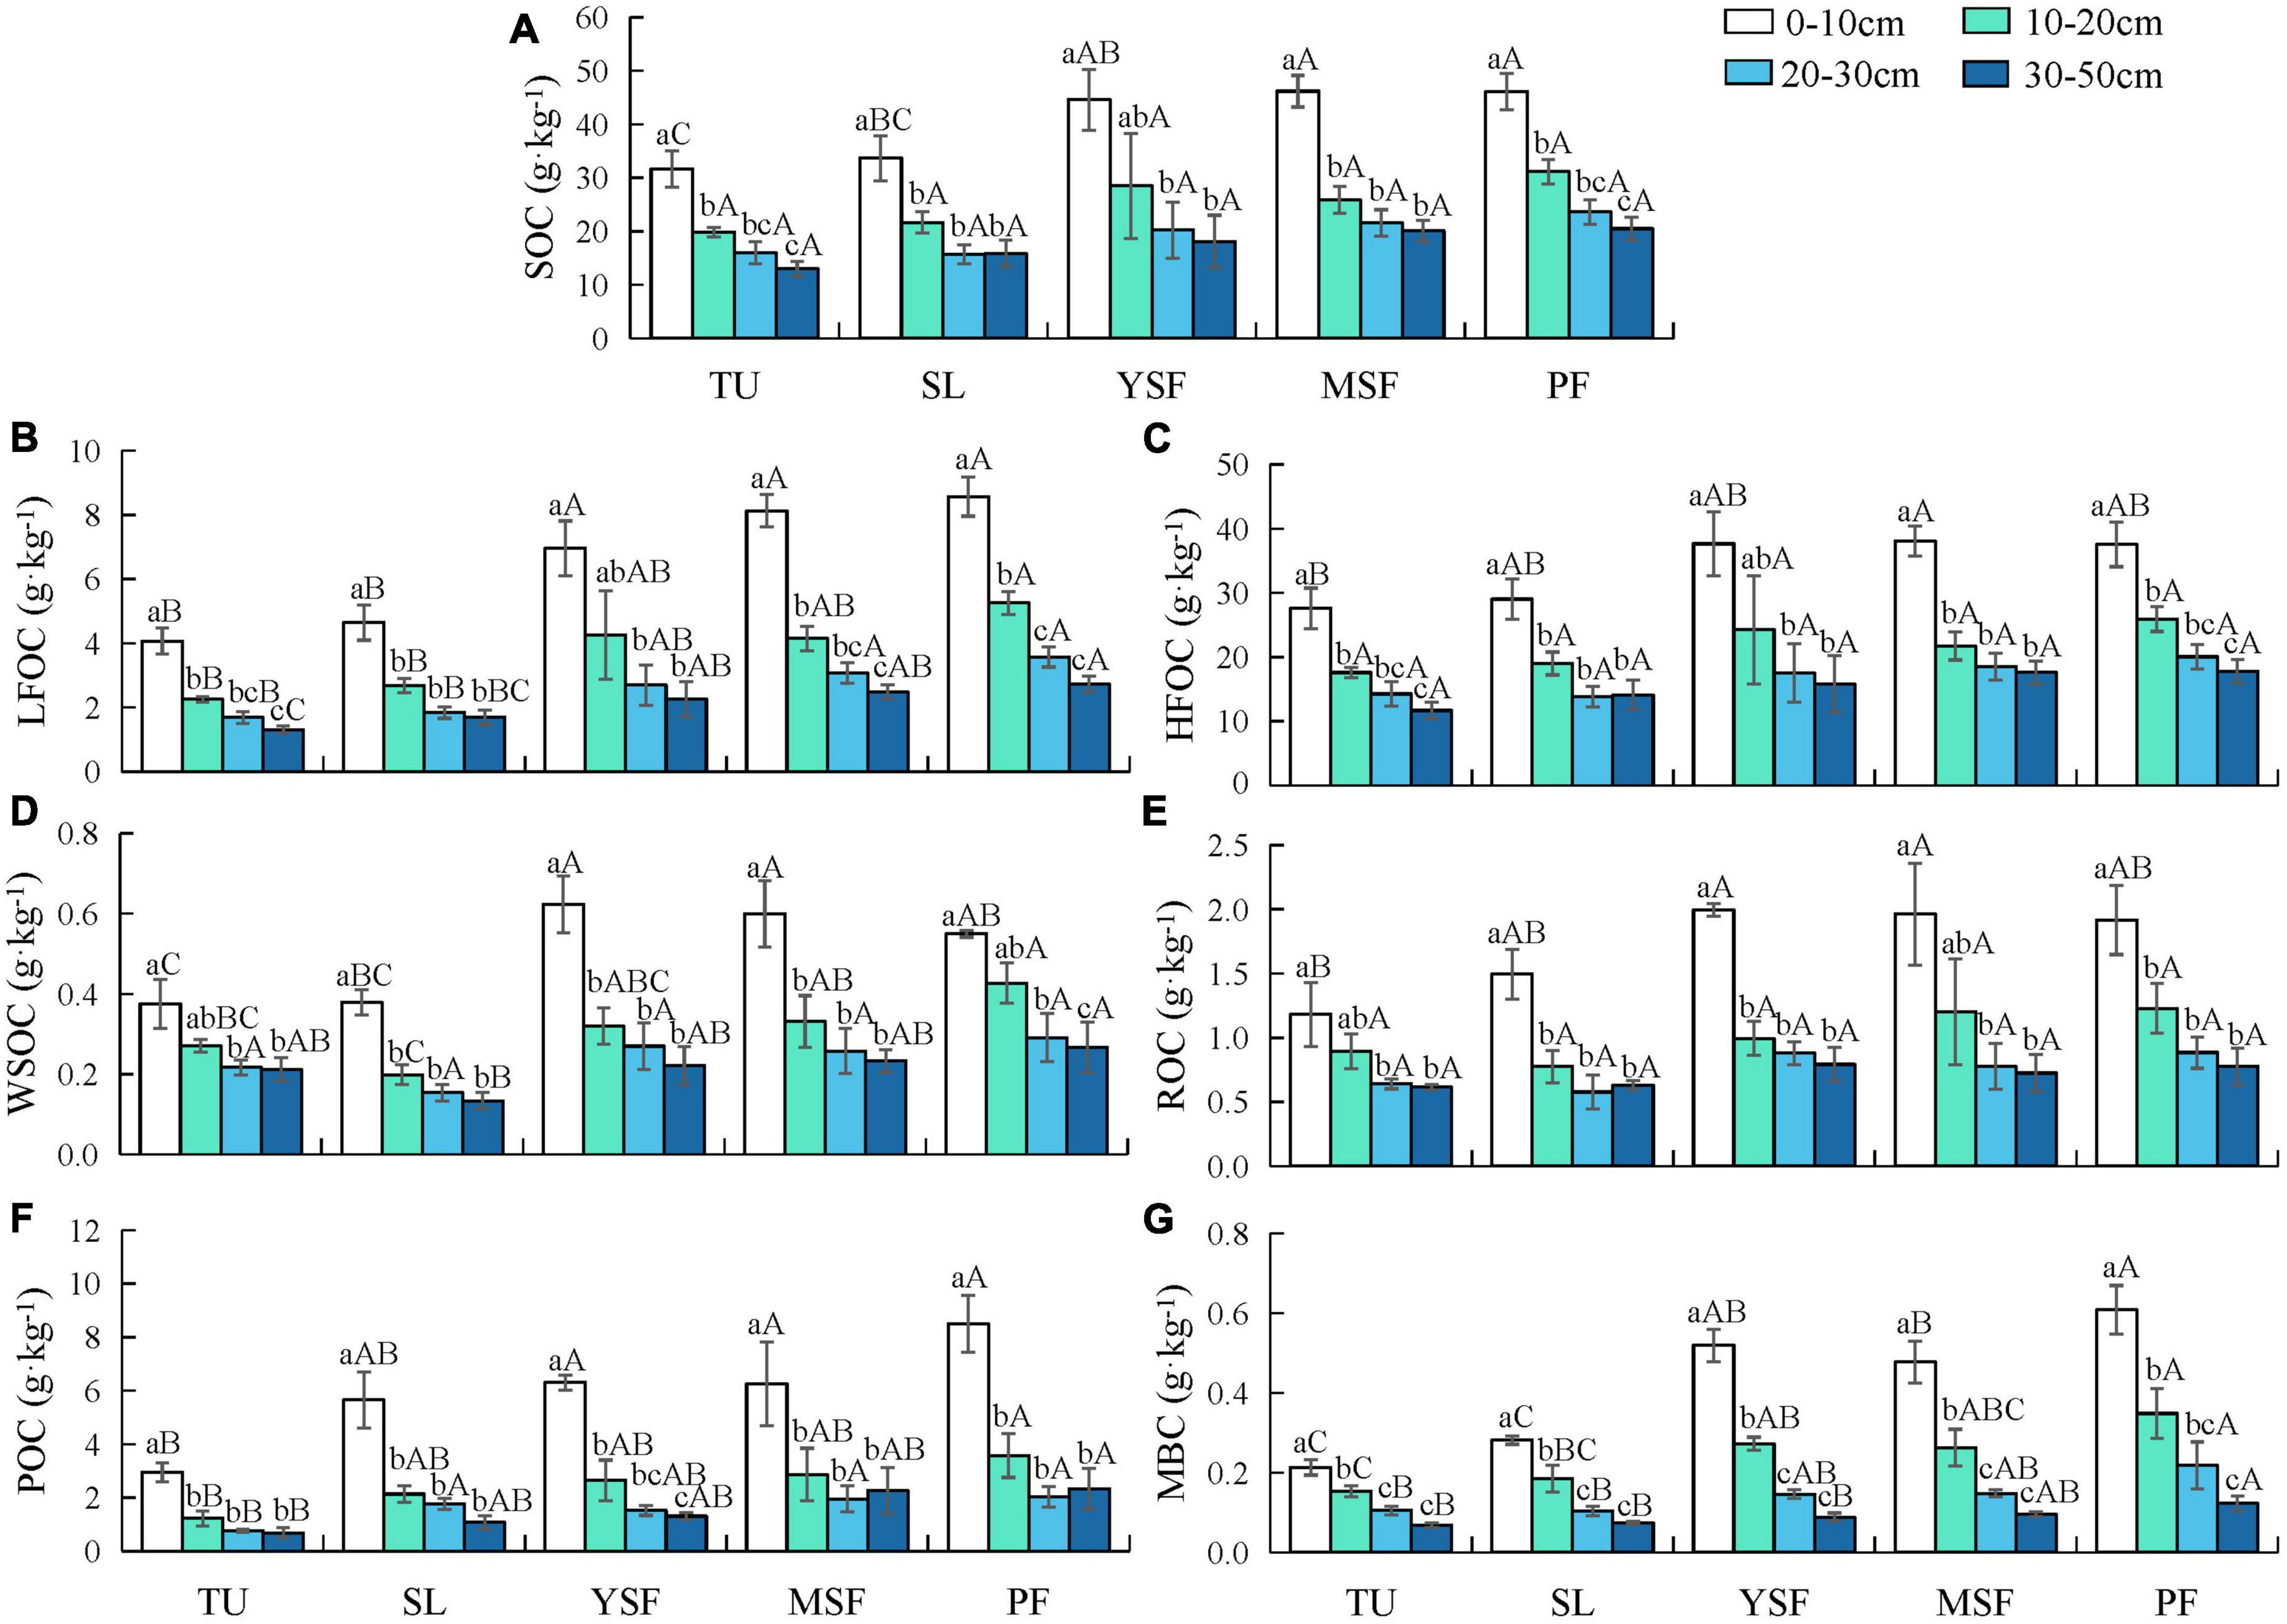
Figure 2. Distribution of (A) soil organic carbon (SOC), (B) light fraction organic carbon (LFOC), (C) heavy fraction organic carbon (HFOC), (D) water-soluble organic carbon (WSOC), (E) readily oxidizable organic carbon (ROC), (F) particulate organic carbon (POC), and (G) microbial biomass carbon (MBC) content in different vegetation restoration stages. TU, tussock, SL, shrubland, YSF, young secondary forest, MSY, mature secondary forest, PF, primary forest. Lowercase letters indicated significant differences amongst the same vegetation restoration stages of different soil layers, and capital letters indicated significant differences amongst different vegetation restoration stages in the same soil layers at the 0.05 level. Mean value ± standard error.
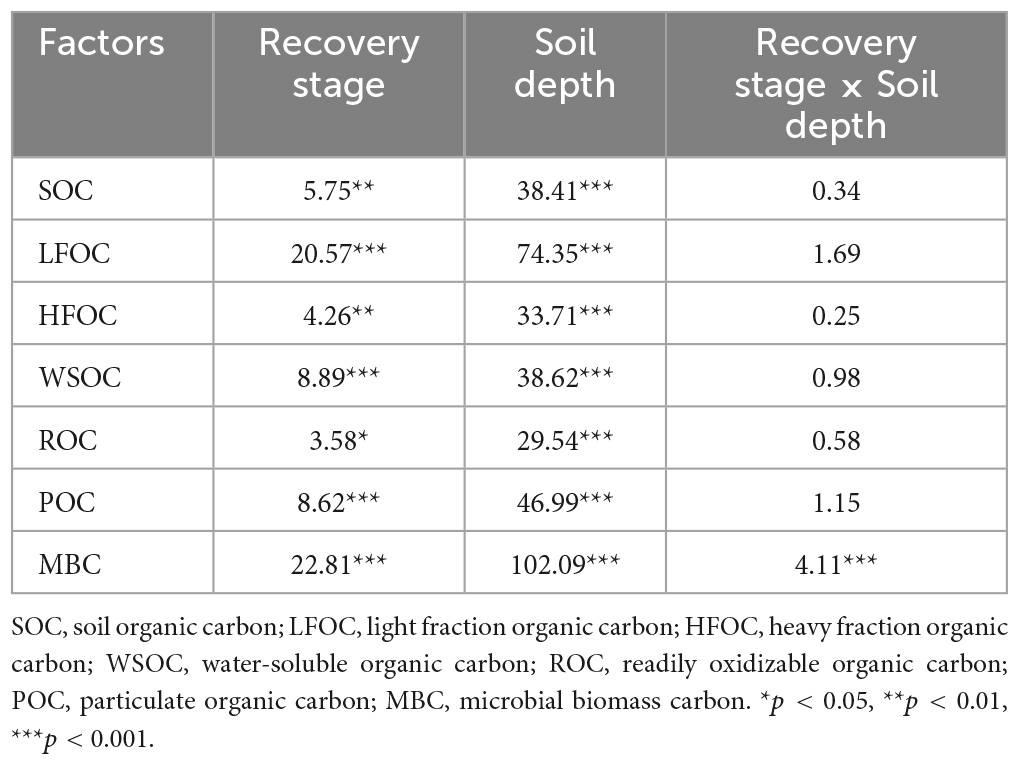
Table 2. Two-way ANOVA of single and interactions effects of soil depth and recovery stage on soil organic carbon (SOC) and its fractions.
The LFOC and HFOC contents were significantly affected by vegetation restoration and different soil depths; LFOC and HFOC contents varied from 1.31–8.57 to 11.69–38.07 g⋅kg–1, respectively (Figures 2B, C and Table 2). The LFOC content was highest in all soil layers at the PF stage, and vegetation restoration only had a significant effect on the HFOC content in the 0–10 cm soil layer, indicating that MSF was significantly higher than TU (p < 0.05); the LFOC and HFOC contents tended to increase with vegetation restoration. In the soil profile, LFOC and HFOC contents in the 0–10 cm soil layer were significantly higher than those in the other soil layers (p < 0.05), and the LFOC and HFOC contents gradually decreased with increasing soil depth.
Vegetation restoration and soil depth significantly affected each LOC fraction (WSOC, Figure 2D; ROC, Figure 2E; POC, Figure 2F; MBC, Figure 2G). WSOC content ranged from 0.13 to 0.62 g⋅kg–1 at each restoration stage, with the highest content at the YSF stage in the 0–10 cm soil layer and at the PF stage in all 10–50 cm soil layers. ROC content varied from 0.62 to 1.99 g⋅kg–1 and was highest in the YSF stage in the 0–10 and 30–50 cm soil layers, and the WSOC content was highest in the PF stage in both the 10–30 cm soil layers. POC content ranged from 0.69 to 8.49 g⋅kg–1 during vegetation restoration, and the MBC content varied from 0.07 to 0.61 g⋅kg–1 during vegetation restoration, with the highest POC and MBC contents in all soil layers at the PF stage. Overall, each LOC fraction increased with vegetation recovery.
In the soil profile, the highest content of each LOC fraction was in the 0–10 cm soil layer, and the content of each LOC fraction decreased with increasing soil depth, as follows: the contents of WSOC, ROC, POC, and MBC in the TU, YSF, MSF, and PF stages 0–10 cm were significantly higher than those in the 20–30 and 30–50 cm soil layers (p < 0.05); the WSOC, ROC, POC, and MBC contents in the 0–10 cm layer in SL stage were significantly higher than those in the other three soil layers (p < 0.05).
As shown in Table 3, the variation in LFOC/SOC at each restoration stage ranged from 10.14 to 18.59%, and HFOC/SOC fluctuated from 81.41 to 89.86%. The LFOC/SOC and HFOC/SOC increased and decreased, respectively, with vegetation restoration. In the soil profile, LFOC/SOC decreased with the deepening of the soil layer, whereas the distribution pattern of HFOC/SOC was the opposite to that of LFOC/SOC. The variation in WSOC/SOC at each restoration stage ranged from 0.86 to 1.66%, and ROC/SOC fluctuated from 3.58 to 5.41%, both of which showed no obvious variation pattern with soil depth. The variation in POC/SOC ranged from 5.15 to 16.76% and MBC/SOC fluctuated from 0.49 to 1.31% at each restoration stage, showing a decreasing trend with increasing soil depth. In general, WSOC/SOC and ROC/SOC did not significantly change with vegetation restoration (p > 0.05), whereas POC/SOC and MBC/SOC increased (p < 0.05).
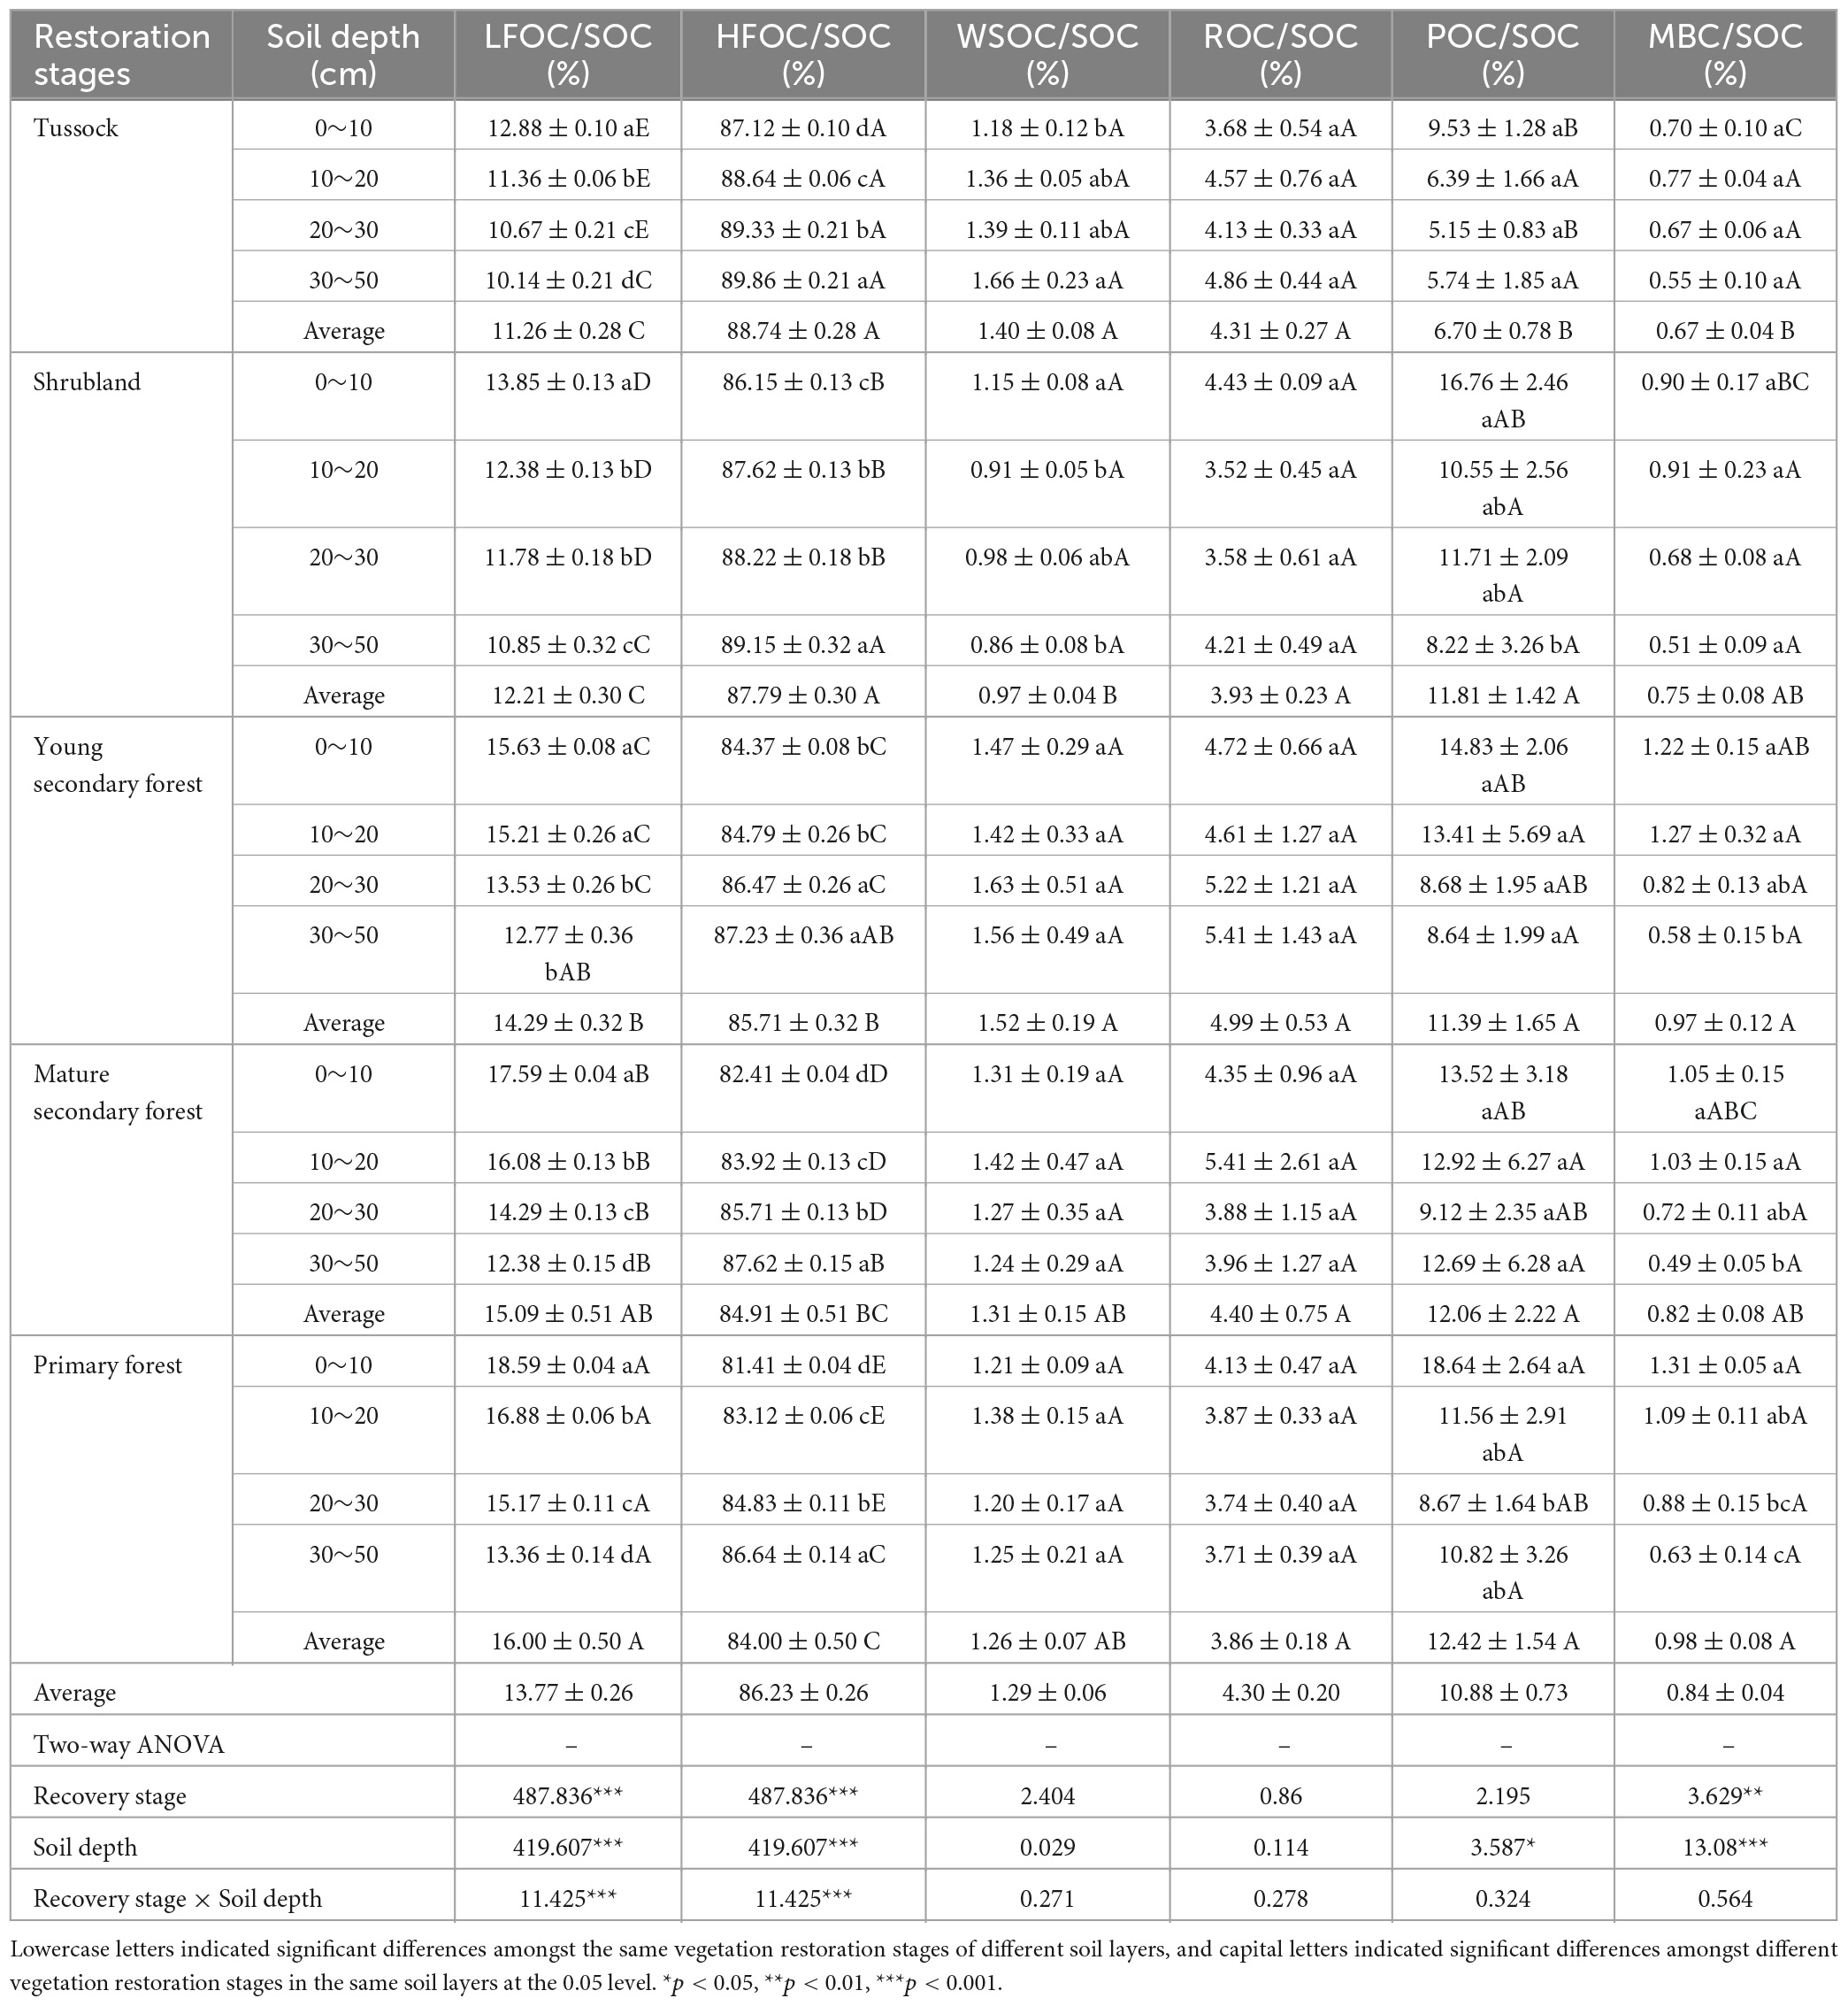
Table 3. Percentage of different fractions of soil organic carbon and results of two-way ANOVA of single and interactions effects of soil depth and recovery stage on percentage of different fractions of soil organic carbon.
As shown in Figure 3, the SOC and its fractions were significantly positively correlated. A significant positive correlation was observed between soil physicochemical properties (EC, AK, NO3–-N, TN, NH4+-N, AP, EMg, ECa, TP, and TK) and SOC, LFOC, HFOC, POC, and MBC. In contrast, SOC, LFOC, HFOC, POC, and MBC were highly negatively correlated with BD. WSOC and ROC were significantly positively correlated with EC, AK, NO3–-N, TN, NH4+-N, AP, EMg, ECa, TP, TK, and pH and were significantly negatively correlated with BD.
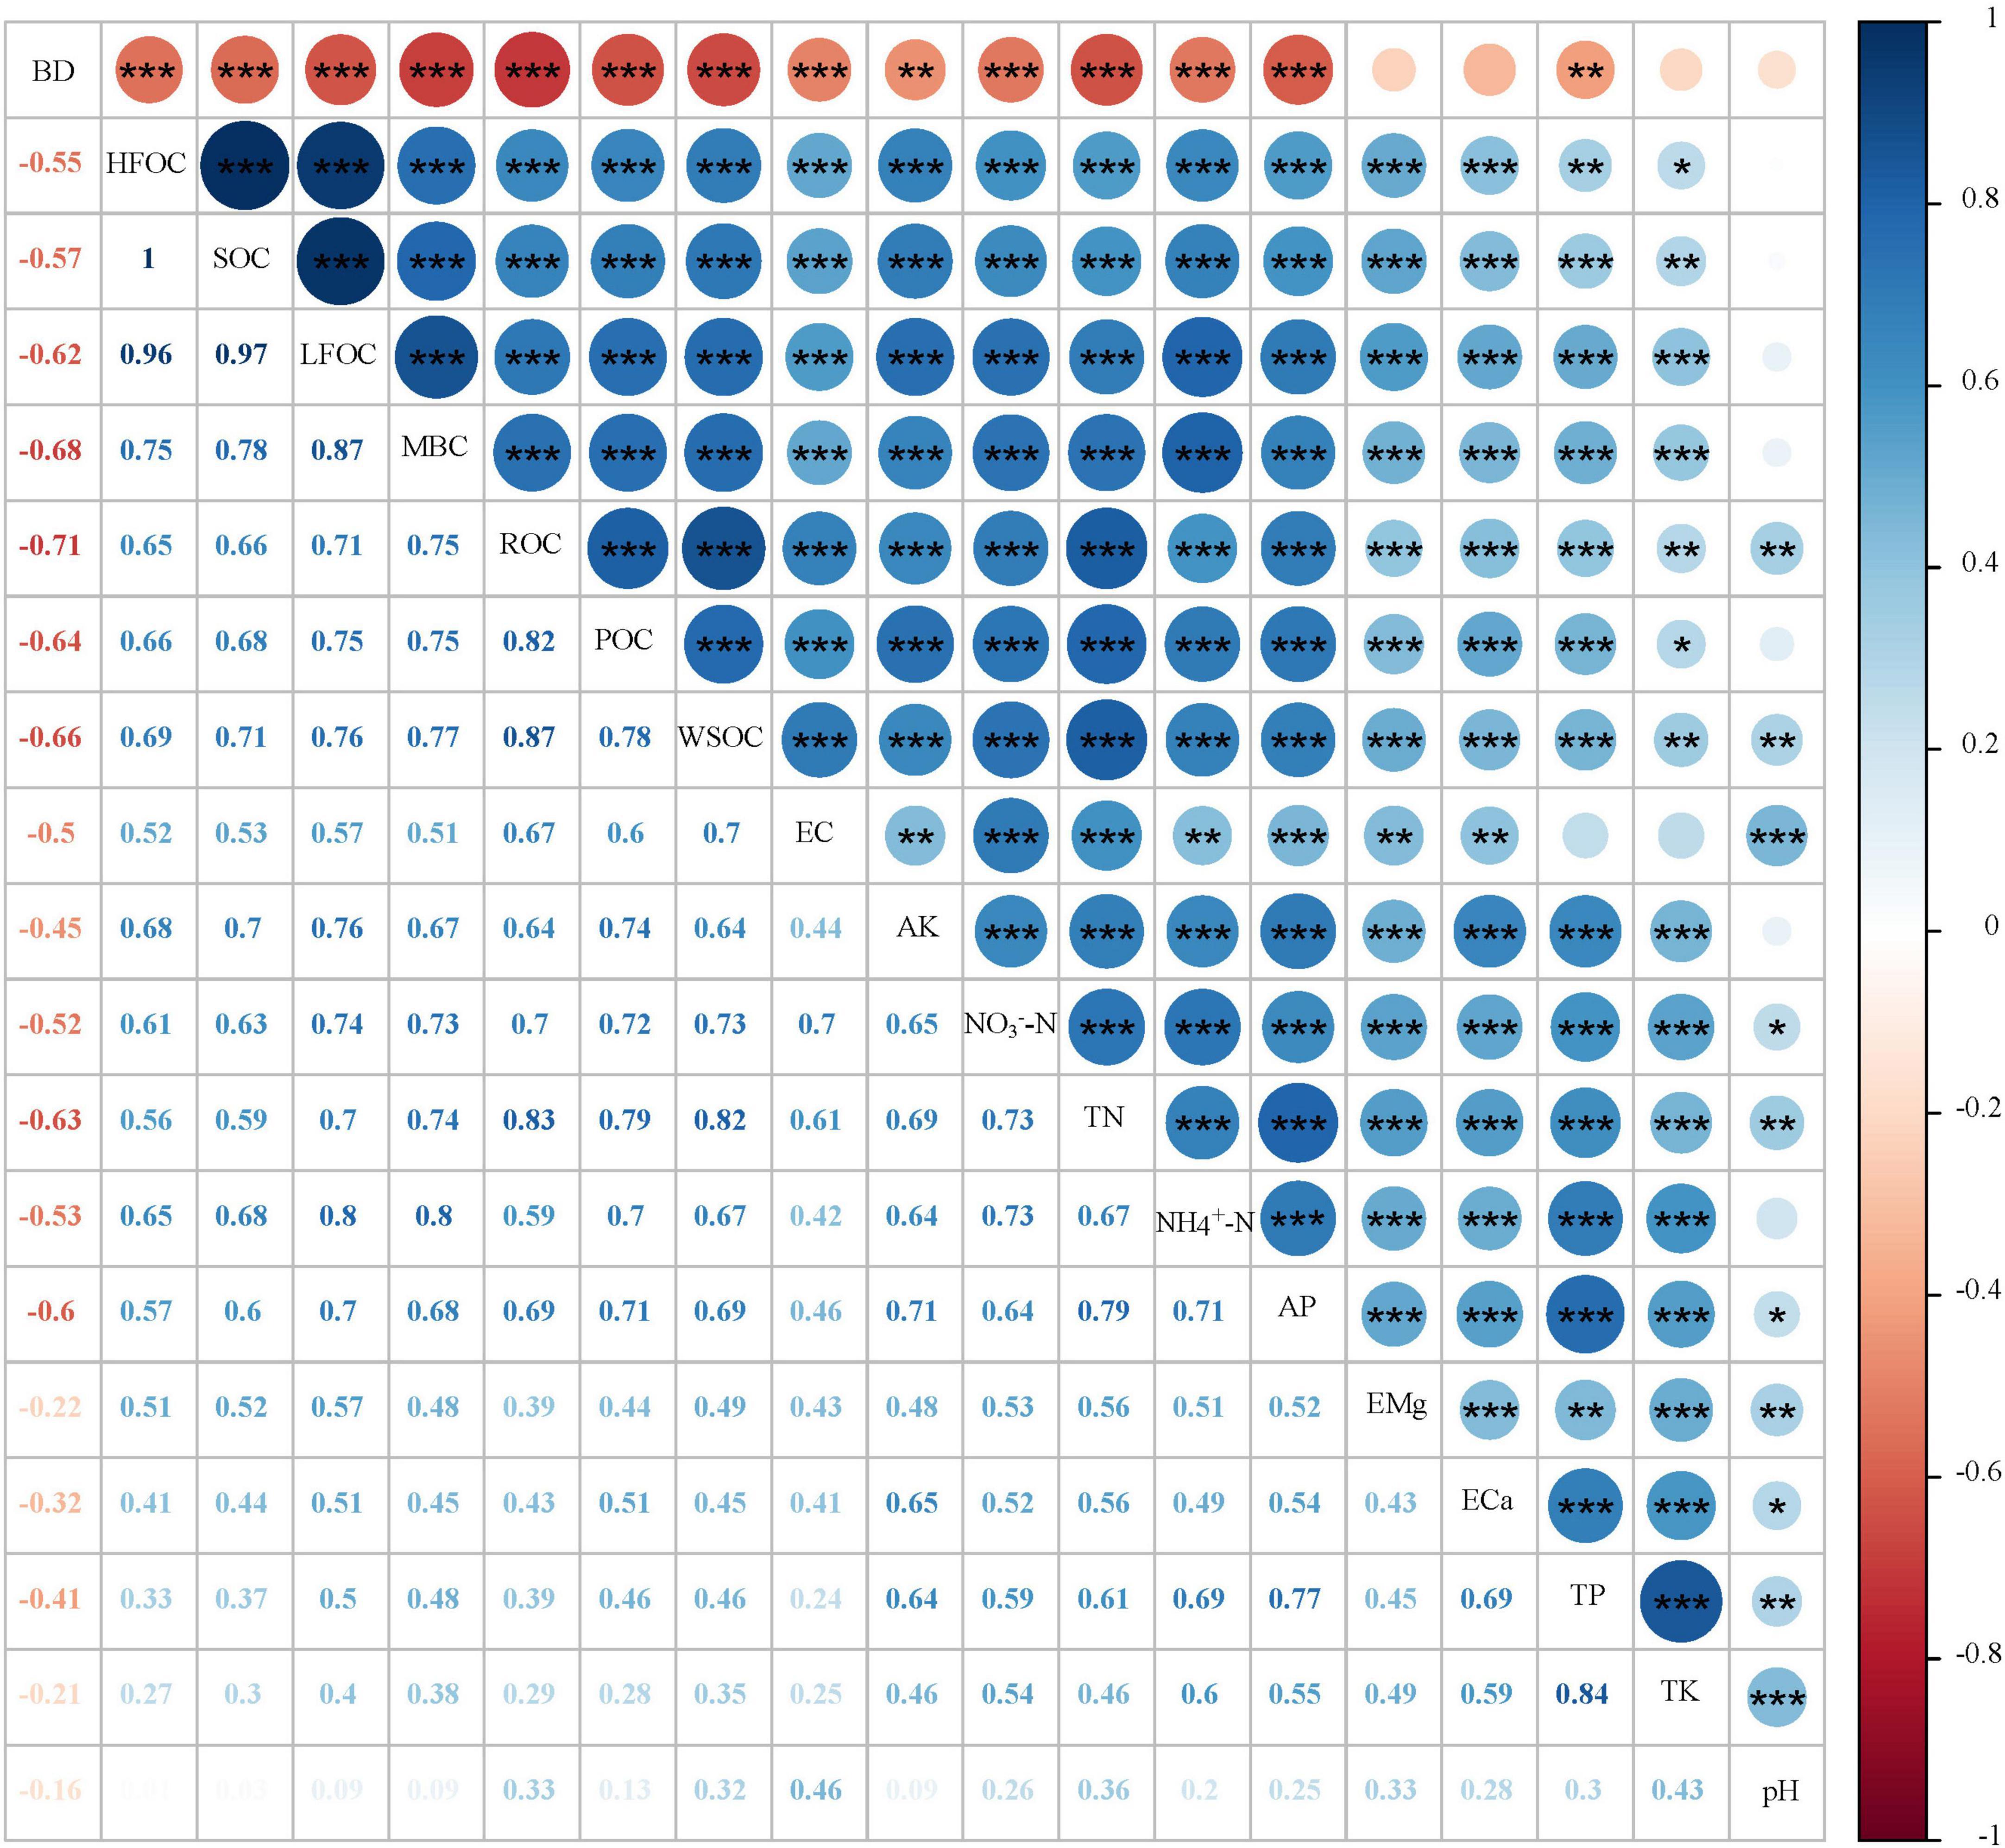
Figure 3. Correlation analysis between soil organic carbon (SOC) and its fractions and soil physicochemical properties. BD, bulk density; HFOC, heavy fraction organic carbon; SOC, soil organic carbon; LFOC, light fraction organic carbon; MBC, microbial biomass carbon; ROC, readily oxidizable organic carbon; POC, particulate organic carbon; WSOC, water-soluble organic carbon; EC, electrical conductivity; AK, available potassium; NO3–N, nitrate nitrogen; TN, total nitrogen; NH4+-N, ammonium nitrogen; AP, available phosphorus; EMg, exchangeable magnesium; Eca, exchange of calcium; TP, total phosphorus; TK, total potassium. *p < 0.05, **p < 0.01, ***p < 0.001.
The RDA results in Figure 4 show that RDA1 and RDA2 explained 92.26 and 5.56% of the variance, respectively. All the soil factors explained 70.99% of the variance in SOC and its fractions (Table 4), with AK, NH4+-N, and BD being the main influencing factors, explaining 19.38, 17.24, and 10.52% of the variance, respectively.
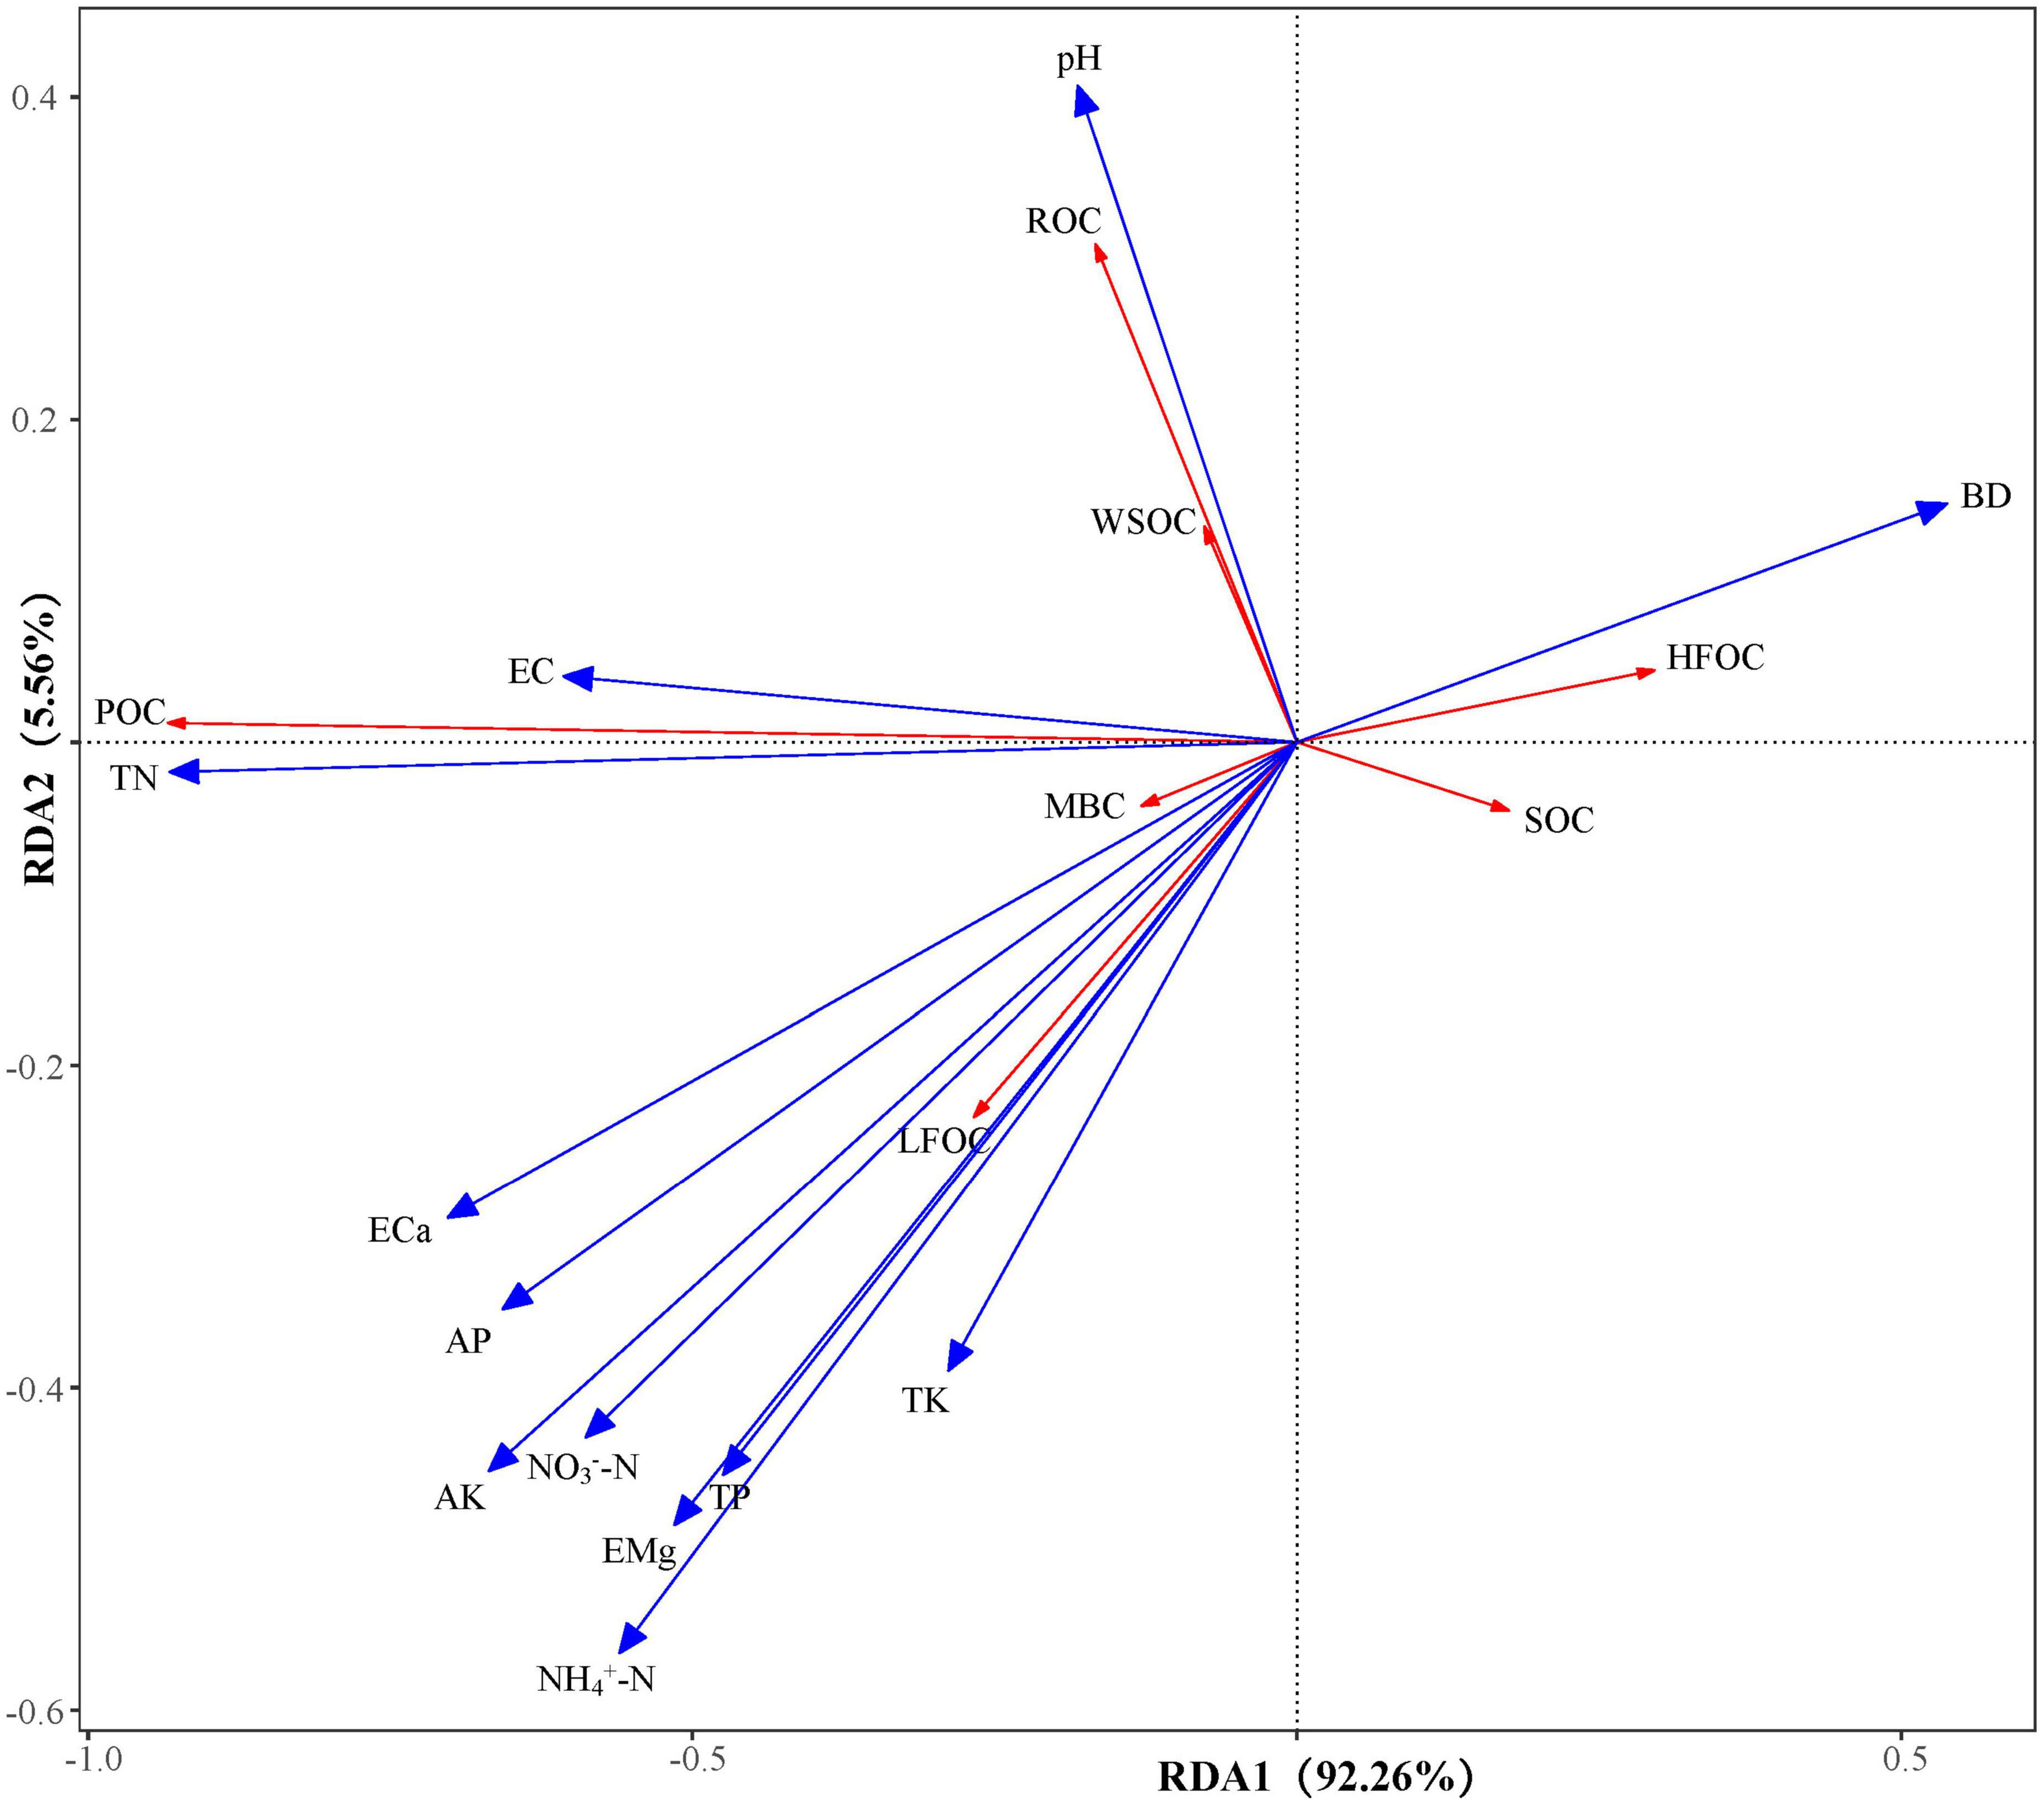
Figure 4. Redundancy analysis of SOC and its fractions with soil physicochemical properties. Response variable: SOC, soil organic carbon; LFOC, light fraction organic carbon; HFOC, heavy fraction organic carbon; WSOC, water-soluble organic carbon; ROC, readily oxidizable organic carbon; POC, particulate organic carbon; MBC, microbial biomass carbon. Explanatory variable: BD, bulk density; EC, electrical conductivity; AP, available phosphorus; AK, available potassium; ECa, exchange of calcium; EMg, exchangeable magnesium; NH4+-N, ammonium nitrogen; NO3–N, nitrate nitrogen; TN, total nitrogen; TP, total phosphorus; TK, total potassium. The red line indicates the response variable, and the blue line indicates the explanatory variable.
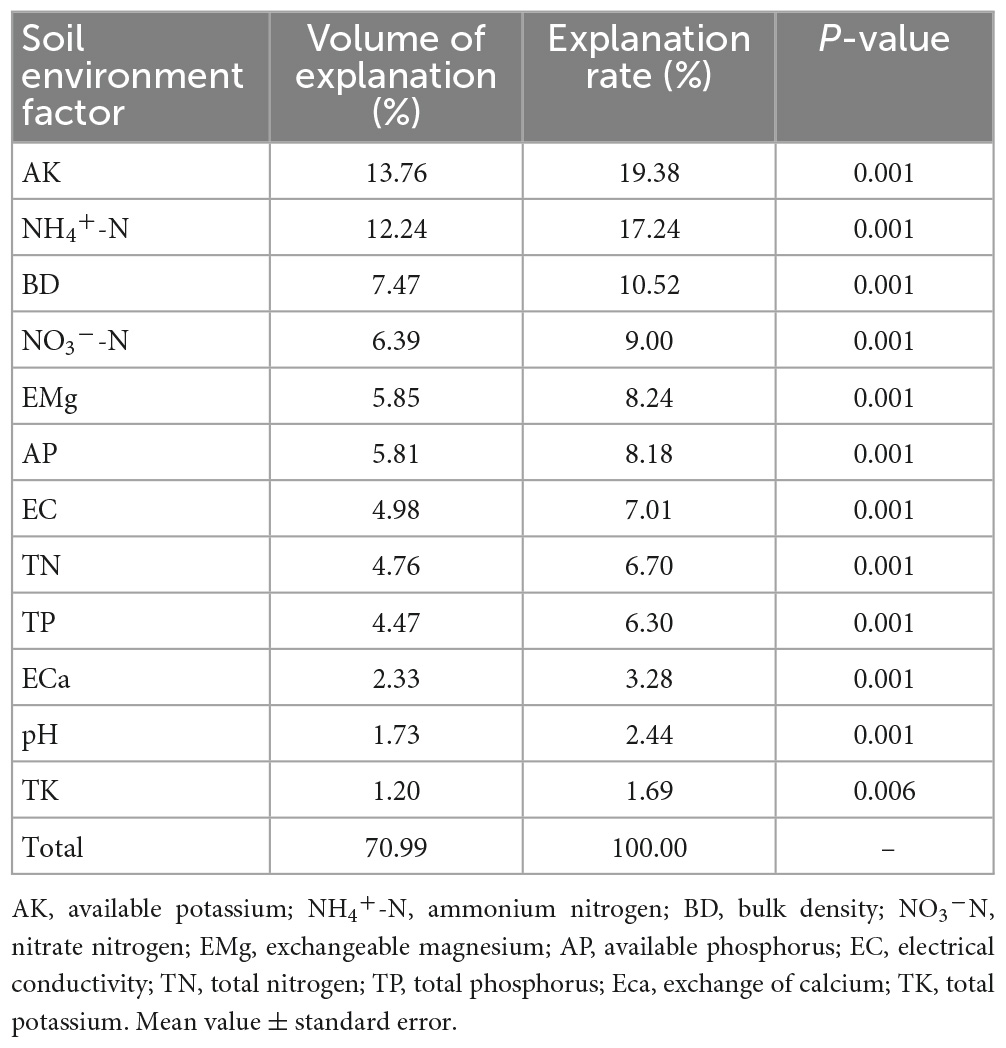
Table 4. Interpretation rate of a single environmental factor in redundancy analysis.
PiecewiseSEM was used to reveal the direct and indirect pathways through which regulatory factors influence changes in SOC and its fractions (Figure 5). Soil properties, above-ground biomass, and litterfall explained most of the variation in SOC (59%), LFOC (79%), HFOC (81%), and LOC (61%). Soil properties and above-ground biomass significantly affected SOC, LFOC, and HFOC content mainly through indirect effects, while Litter P content could directly and significantly affect SOC, LFOC, and HFOC content (p < 0.05) (Figures 5A–C). Additionally, NH4+-N and AK of soil factors directly affected the LFOC and LOC accumulation, respectively (Figures 5B, D).
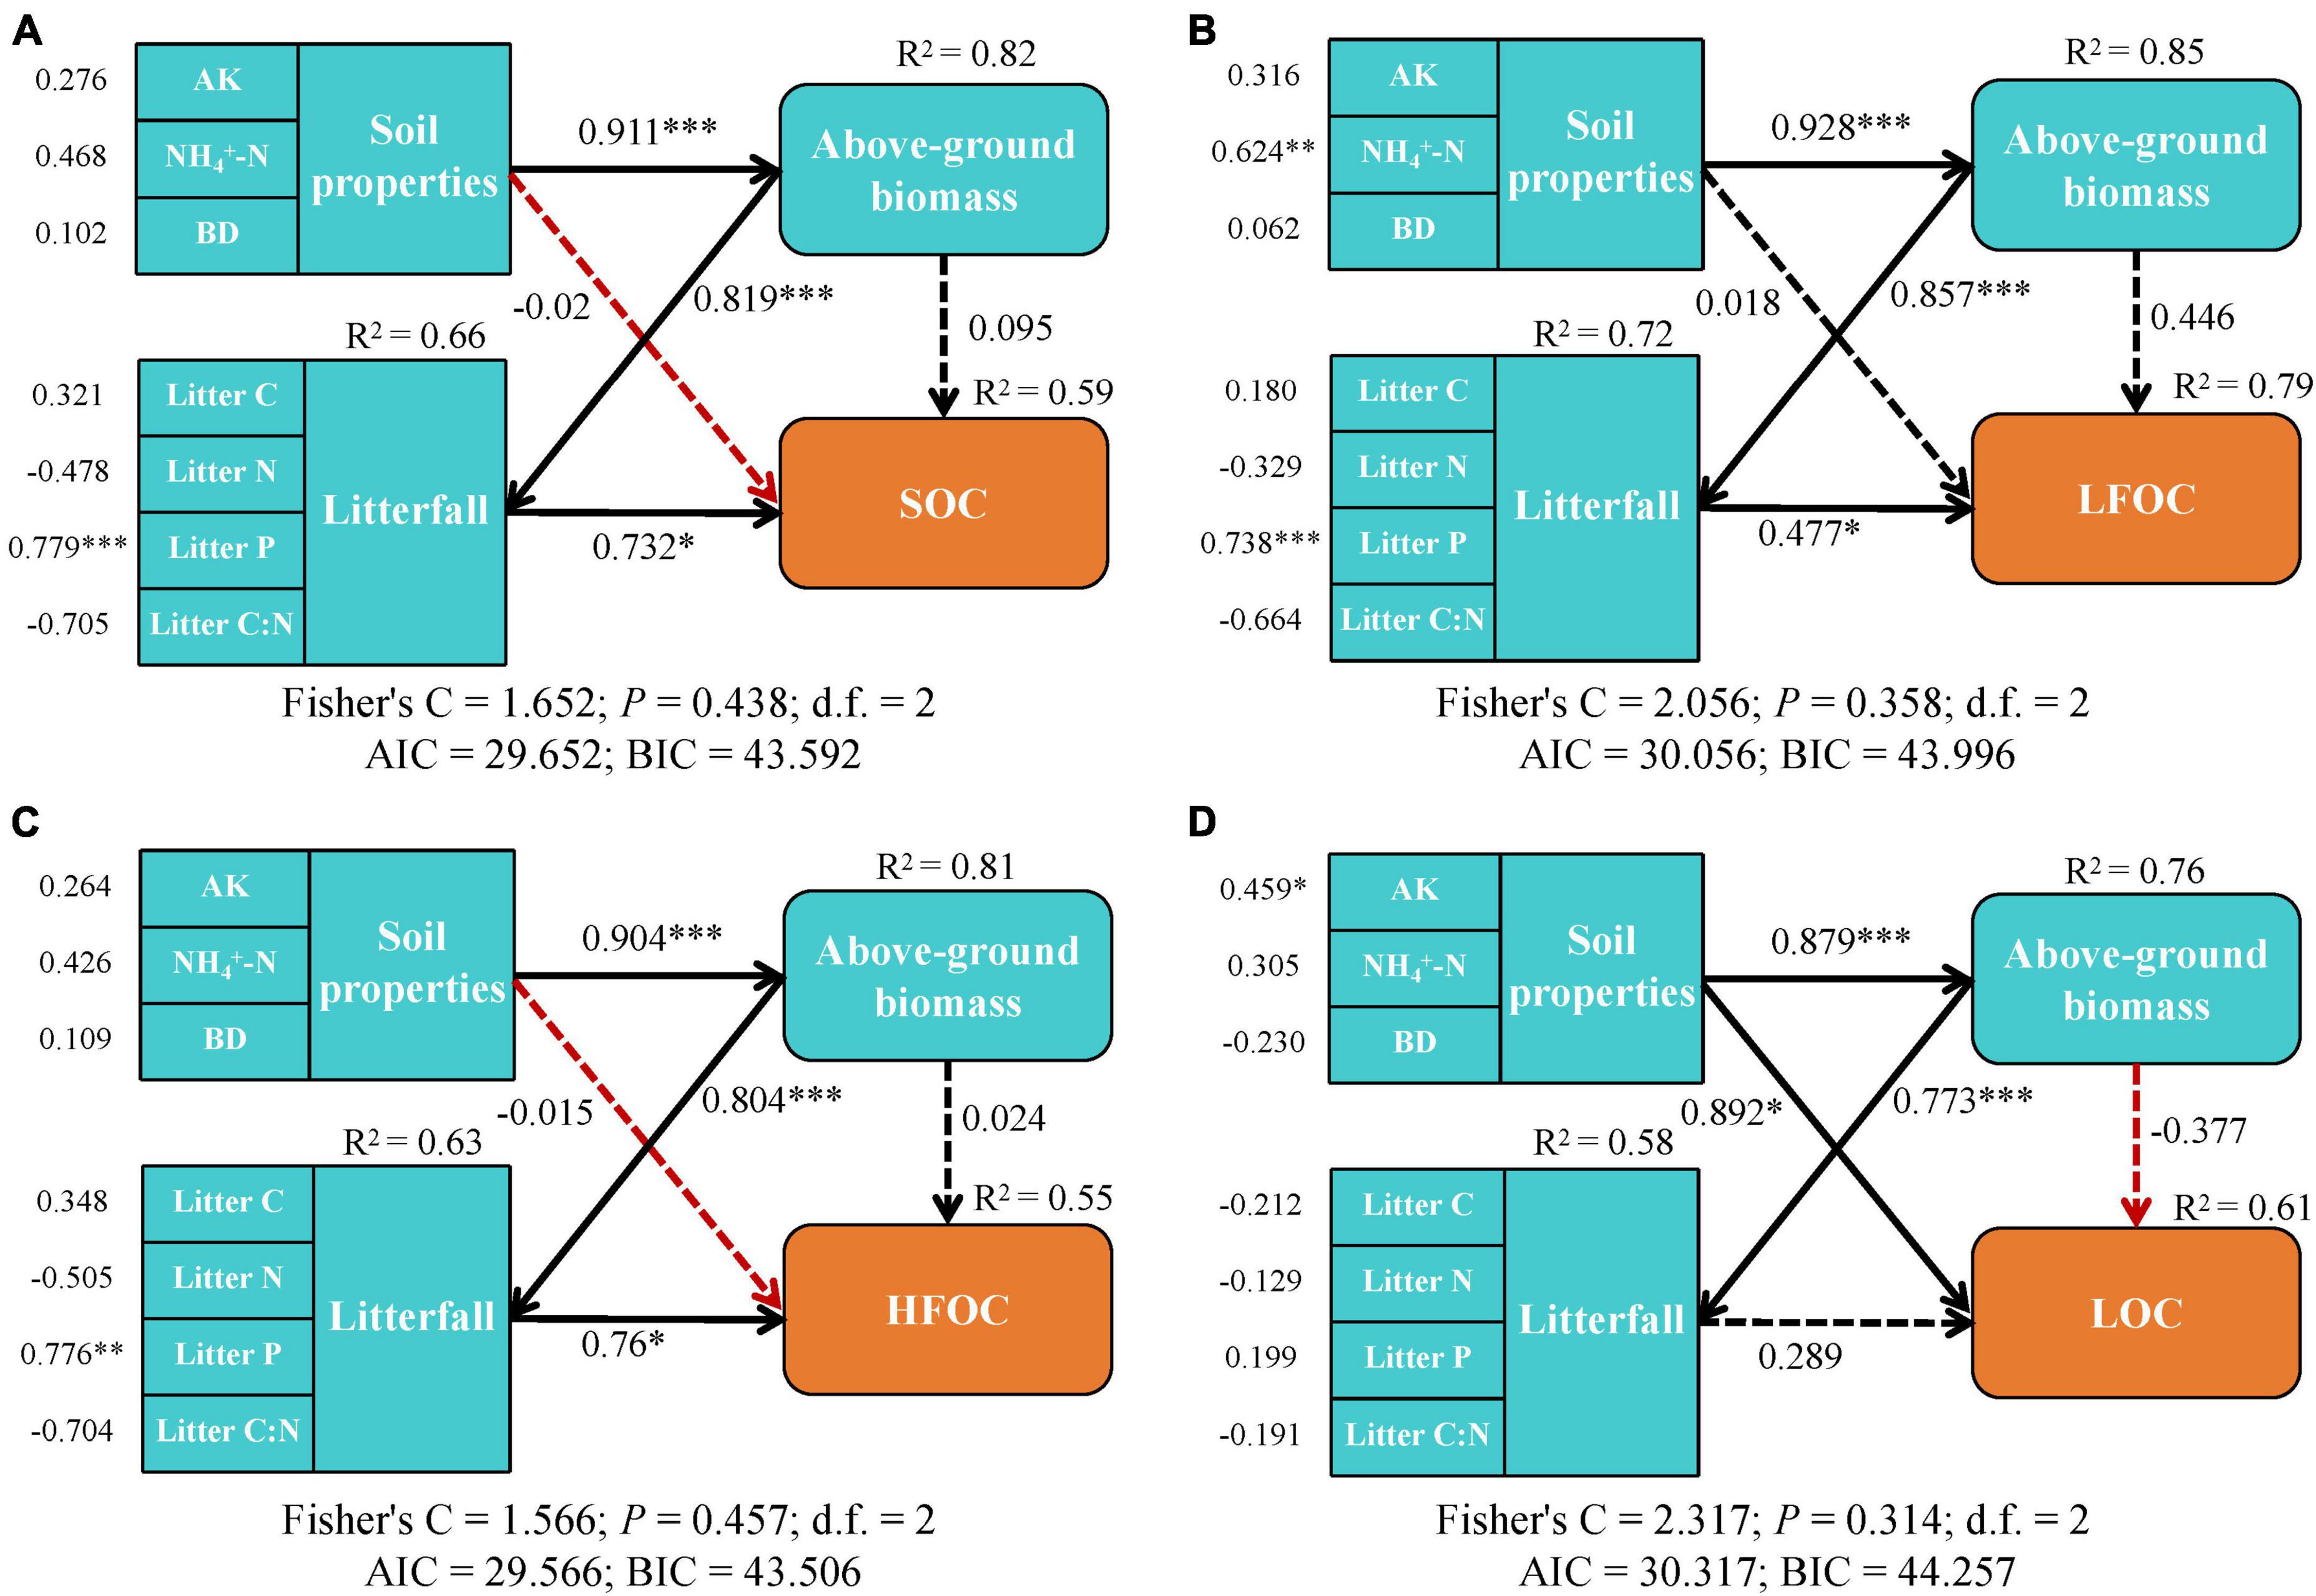
Figure 5. PiecewiseSEM pathways of influence the accumulation of the (A) soil organic carbon (SOC), (B) light fraction organic carbon (LFOC), (C) heavy fraction organic carbon (HFOC), and (D) labile organic carbon fractions (LOC). Black line indicates positive correlations, red line indicates negative correlations. The dashed line indicates that the regression results are not significant, and the solid line is significant. Numbers next to arrows represent regression coefficients. *p < 0.05, **p < 0.01, ***p < 0.001.
Soil organic carbon content is determined by the dynamic balance between the input of carbon sources from plant residues, root secretions, and root biomass and the loss of carbon due to soil respiration and erosive transport by water. The accumulation process is influenced by a combination of factors such as soil development, vegetation type, and anthropogenic disturbance (Laganiere et al., 2010). In this study, the variation of SOC content ranged from 13.00 to 46.19 g⋅kg–1, which is similar to the findings of Pang et al. (2019) and Hu and Lan (2020) in the subtropical karst region. Although tropical and subtropical karst regions differ in climate and vegetation, both are characterized by limestone bedrock and distinctive landforms, resulting in a similar range of variation in SOC content. Additionally, in the 0–50 cm soil layer, the average SOC contents of TU, SL, YSF, MSF, and PF stages were 20.11, 21.71, 27.85, 28.44, and 30.35 g⋅kg–1, respectively, and the SL, YSF, MSF, and PF stages increased 0.08, 0.38, 0.41, and 0.51 times, respectively. The largest increase in SOC content was observed when recovering from SL to YSF. YSF is the initial stage of seasonal rainforests with high biomass, resulting in a significant increase in SOC content from SL to YSF. Previous studies have also shown that SOC content increases greatly through vegetation restoration (Yang et al., 2016), such as an increase of 35–100% after reforestation (Johnson, 1992).
We found that the SOC content at each vegetation restoration stage gradually decreased with increasing soil depth. The SOC content at the 0–10 cm depth was the highest among the four soil depths, which was 39.35% of the 0–50 cm layer. This finding is similar to the results of Hu and Lan (2020) and might be explained by the enriched distribution of litterfall and roots in the surface soil (0–10 cm depth). The decomposition of litterfall and roots results in enriched humus in the surface soil with an evident surface aggregation phenomenon (Wang et al., 2014). Additionally, high moisture, abundant microorganisms, frequent disturbances, abundant litterfall, and plant roots in the surface soil are helpful for the accumulation of SOC (Barreto et al., 2011). Lower SOC is mainly influenced by root residues and secretions, with less effect of litterfall and animal activity (Fontaine et al., 2007), resulting in little change in lower SOC.
Light fraction organic carbon is an active soil carbon pool with a high turnover rate and rapid mineralization and decomposition. In comparison, as the stable carbon pool of the soil, HFOC is organic carbon combined with soil mineral colloids, which is not sensitive to external disturbances (von Lützow et al., 2007). In this study, vegetation restoration increased the soil LFOC and HFOC contents. In the 0–50 cm soil layer, the average LFOC contents in TU, SL, YSF, MSF, and PF stages were 2.33, 2.71, 4.04, 4.06, and 5.03 g⋅kg–1, respectively. From TU to SL, YSF, MSF, and PF, the LFOC content increased 0.16, 0.74, 0.91, and 1.16 times, respectively. Compared with SOC, LFOC has a faster accumulation rate and is more sensitive than SOC in response to vegetation restoration (John et al., 2005). From TU to SL, YSF, MSF, and PF, the average content of HFOC was 17.78, 19.00, 23.81, 23.98, and 25.32 g⋅kg–1, respectively. Compared with the TU stage, the SL, YSF, MSF, and PF stages increased by 0.07, 0.34, 0.35, and 0.42 times, respectively. A similar increase in SOC and an HFOC/SOC value of 86.23% indicated that the soil carbon pool was dominated by the more stable HFOC (Zhao et al., 2016). LFOC tended to increase more rapidly during the early stages of vegetation restoration, whereas HFOC tended to increase more slowly over time, resulting in an increase in LFOC/SOC with vegetation recovery, whereas HFOC/SOC decreased. This is because labile organic matter is more easily decomposed and contributes more to short-term changes in SOC, whereas the formation and stabilization of humic substances is a slower process (Boone, 1994).
The LFOC content and LFOC/SOC tended to decrease with the deepening of the soil layer because the upper soil layers received more organic matter inputs from plant residues and other sources, increasing the amount of labile carbon available to microorganisms. Thus, the LFOC content and LFOC/SOC ratio tended to be higher in the surface soil layers. However, as organic matter decomposed and was consumed by microorganisms, the LFOC content and LFOC/SOC ratio tended to decrease with depth. This is because deeper soil layers have less organic matter input and are more affected by physical and chemical processes that can lead to the loss of labile carbon (Deng et al., 2022). HFOC content decreased with increasing soil depth, which was related to more abundant SOC in the surface soil. Additionally, the high infiltration of surface soil water results in arid surface soil in karst areas, limiting microbial activity and litterfall decomposition. This leads to the decomposition rate of litterfall being smaller than the input rate of litterfall and accumulating with increasing years of vegetation restoration, resulting in a decrease in HFOC and LFOC content with increasing soil depth (Neilson et al., 2017). The HFOC/SOC ratio tended to increase with depth because deeper soil layers are more stable and provide a better environment for the formation and accumulation of humic substances. This is because humic substances are more resistant to decomposition and less affected by physical and chemical processes that can lead to the loss of organic carbon (Li et al., 2022).
Water-soluble organic carbon is an organic carbon source directly available to soil microorganisms, and its ease of decomposition and mineralization is an important pathway for SOC loss (Maie et al., 2004). Here, the WSOC content gradually increased with vegetation restoration, probably because the increased vegetation cover reduced the leaching and scouring effects of rainwater. In contrast, the decomposition of plant litterfall and root secretions increased the input of SOC, thereby significantly increasing the WSOC content. The variation of WSOC/SOC in this study ranged from 0.86 to 1.66%, which was lower than the results of Pang et al. (2019). As an important indicator of soil reactive organic carbon (ROC), changes in ROC can better reflect the relationship between soil reactive organic carbon and SOC changes and have a stronger sensitivity to SOC changes (Liang et al., 1997). We found that vegetation restoration had a significant effect on the ROC content in the 0–10 cm soil layer. Leaching erosion is the determining factor for differences in the ROC content of topsoil (Chen et al., 2017). The average annual rainfall in the study area was 1,150–1,550 mm, and the leaching erosion was strong. The restoration of vegetation improved the retention of rainwater by the canopy, litterfall, and roots, gradually decreasing the topsoil leaching erosion. Therefore, the ROC content of the topsoil increased significantly after vegetation restoration. Additionally, the ROC/SOC ratio did not significantly change with vegetation recovery, probably because of the high levels of erosion and soil loss in tropical karst areas (Chen et al., 2017). POC is the SOC bound to soil grit and reflects the amount of non-conserved organic carbon in the soil, representing a certain percentage of the active organic carbon pool (Díaz-Pinés et al., 2011). This study showed that the soil POC content and POC/SOC ratio tended to increase with revegetation. Chan (1997) found that the restoration from cropland to grassland with an increase in plant litterfall led to an increase in the POC content of the soil. Litterfall and plant secretions provide carbon sources for soil microorganisms, and soil microorganisms, as decomposers, provide nutrients for plant growth, which is important for maintaining plant diversity, ecosystem stability, and productivity (Jiang and Song, 2010). In this study, the MBC content and MBC/SOC tended to increase with vegetation restoration. Hu and Guo (2012) suggested that apoplastic and phyto secretory materials increase with vegetation restoration, while apoplastic materials reduce surface evaporation and increase soil water content, facilitating the accumulation of MBC.
The LOC fraction contents (WSOC, ROC, POC, and MBC) increased during vegetation restoration. at the early stage of vegetation restoration, vegetation composition and diversity are relatively simple, and the organic matter input to the soil from above-ground vegetation is relatively low (O’Brien and Jastrow, 2013). After vegetation restoration, the community structure became diversified and stable, the amount of litterfall, fine roots, and root secretions increased significantly, organic matter returned to the soil, and soil microbial activity increased, leading to a rapid increase in the LOC fraction content with an increase in vegetation restoration (Xue et al., 2009). The LOC fraction contents showed a decreasing trend with increasing soil depth, and the percentages of some active organic carbon fractions (POC/SOC and MBC/SOC) significantly decreased with increasing soil depth. LOC originates mainly from plant litterfall, soil humus, microorganisms, and plant roots and their secretions. Plant litterfall and roots are mainly distributed in the surface layer of the soil. With increasing depth of the soil layer, soil bulk increases, porosity decreases, and root biomass decreases, leading to a significant decrease in the content of LOC fractions in the lower layers of the soil, indicating that a deeper SOC is better protected and more stable than the surface layer (Berger et al., 2002; Xu et al., 2019). Similarly, a previous study showed that surface soil nutrient changes are more sensitive to disturbances and that deep SOC may be inert (Wattel-Koekkoek et al., 2003).
In this study, a significant positive correlation was observed between SOC and its fractions (LFOC, HFOC, WSOC, ROC, POC, and MBC). This indicates that the content of each SOC fraction depends on the SOC content; thus, a change in the component content can reflect a change in SOC (Li et al., 2014). All SOC and its fractions were significantly positively correlated with TN, TP, and AK, indicating that an increase in soil nutrients favors the accumulation of SOC and its fractions, which is consistent with the results of previous studies (Chen et al., 2018). Some LOC fractions (e.g., WSOC and ROC) were significantly and positively correlated with soil pH, indicating that a decrease in soil pH may reduce the content of some LOC fractions. Xu et al. (2019) also suggested that pH may affect the turnover rate of some LOC fractions by affecting the microbial species, number, and activity in the soil. However, Zhang et al. (2014) concluded that lowering the pH helps to increase the content of SOC and its active fractions. SOC and its fractions were significantly positively correlated with soil EC, and the effect of EC on SOC and its fractions mainly affected organic carbon fixation by influencing their ability to sorb exchanged ions in the soil. The more the soil organic matter and soil cations, the more negative ions are adsorbed by soil colloids, leading to greater EC (Jing et al., 2006). SOC and its fractions were significantly and negatively correlated with soil BD, indicating that more SOC can be stored in a loose soil environment, which is consistent with the findings of Anh et al. (2014).
In this study, the top three soil environmental factors affecting SOC content and its fractions were AK, NH4+-N, and BD. These three factors accounted for 47.14% of the variance. These findings indicate that these three were the main limiting factors for the accumulation of SOC and its fractions in tropical karst areas. The AK content reflects the K content available to plants in the soil, and NH4+-N is fast-acting N that can be directly absorbed and used by plants (Bao, 2013). During vegetation restoration in tropical karst areas, AK and NH4+-N affect the accumulation of SOC and its fractions by limiting plant growth. A greater BD of the soil results in a more unfavorable accumulation of SOC and its fractions when the downward transport of soil water and organic matter is constrained and the soil permeability becomes poor, resulting in a restricted oxygen supply and reduced activity of soil microorganisms (Zhao Q. et al., 2021). This finding differs from those of previous studies. Pang et al. (2019) suggested that the accumulation of SOC fractions in karst areas of southwestern China is limited by soil N and P. In contrast, Li et al. (2017) suggested that SOC accumulation is not limited by soil N and that ECa is the main factor affecting soil carbon changes in karst areas. The contents of SOC and its fractions in karst areas are influenced by biotic and abiotic factors that may vary in different areas and vegetation restoration stages. Further investigations are required to determine the factors limiting SOC and its accumulation in karst areas.
The piecewiseSEM results revealed that Litter P content could directly and significantly affect SOC, LFOC, and HFOC content. The availability of phosphorus can limit plant growth and microbial activity in tropical karst areas, which can limit the accumulation of organic matter in the soil. Plants and microbes can obtain more phosphorus from the litterfall, which stimulates their growth and activity (Staaf and Berg, 1982). This, in turn, can lead to an increased input of organic matter into the soil, resulting in higher levels of SOC, LFOC, and HFOC. Moreover, in karst areas, the soil is often thin and highly weathered with a low capacity to hold nutrients, making it more susceptible to erosion. Litterfall can help stabilize the soil, prevent erosion, and improve soil structure, further enhancing the accumulation of SOC and other organic carbon fractions (Templer et al., 2005).
Here, SOC and HFOC were mainly directly influenced by litterfall, LOC by soil factors, and LFOC by both soil factors and litterfall. Litterfall inputs including fallen leaves, twigs, and other plant materials are major sources of organic matter in tropical karst areas. As litterfall decomposes, organic compounds are released into the soil, contributing to the accumulation of SOC and HFOC. These compounds also contribute to the formation of stable soil aggregates that can enhance SOC and HFOC accumulation. The effectiveness of soil nutrients (AK and NH4+-N) increases microbial activity and the decomposition of organic matter, leading to an increased accumulation of LOC. Soil factors can affect the decomposition and stabilization of LFOC, whereas litterfall inputs can contribute to the accumulation of LFOC.
This study showed that vegetation restoration significantly increased SOC and its fractions (LFOC, HFOC, WSOC, ROC, POC, and MBC). Meanwhile, SOC and its fractions decreased with increasing soil depth in a tropical karst area in southwest China. Vegetation restoration has great potential to improve the soil environment through the accumulation of SOC and its fractions. These findings indicated that natural vegetation restoration is an important and effective measure for managing and protecting karstic ecological environments. Meanwhile, SOC and its fractions are closely related to soil physicochemical factors. AK, NH4+-N, and BD were the main limiting factors in the accumulation of SOC and its fractions. Furthermore, the accumulation of SOC is a dynamic process subject to the combined effects of many factors. Soil properties, above-ground biomass, and litterfall explained most of the variation in SOC (59%), LFOC (79%), HFOC (81%), and LOC (61%). Soil properties and above-ground biomass significantly affected SOC, LFOC, and HFOC content mainly through indirect effects, while Litter P content could directly and significantly affect SOC, LFOC, and HFOC content. NH4+-N and AK of soil factors had direct effects on LFOC and LOC accumulation, respectively. Overall, natural vegetation restoration can significantly improve the carbon sink capacity of tropical karst areas in Southwest China.
The raw data supporting the conclusions of this article will be made available by the authors, without undue reservation.
BZ, GH, and ZZ conceived and designed the study. BZ and CX wrote the first draft of the manuscript. BZ, CX, and CH performed the statistical analysis. BZ, CX, YH, KH, and QP surveyed the sample plots and collected and processed soil and litterfall samples. All authors contributed to the manuscript revision, read, and approved the manuscript.
This research was funded by the Guangxi Natural Science Foundation (2021GXNSFFA196005 and 2021GXNSFAA196024), the Guangxi Science and Technology Project (AD21075023), and the National Natural Science Foundation of China (31960275 and 31760128).
The authors declare that the research was conducted in the absence of any commercial or financial relationships that could be construed as a potential conflict of interest.
All claims expressed in this article are solely those of the authors and do not necessarily represent those of their affiliated organizations, or those of the publisher, the editors and the reviewers. Any product that may be evaluated in this article, or claim that may be made by its manufacturer, is not guaranteed or endorsed by the publisher.
The Supplementary Material for this article can be found online at: https://www.frontiersin.org/articles/10.3389/ffgc.2023.1172062/full#supplementary-material
Anh, P. T. Q., Gomi, T., MacDonald, L. H., Mizugaki, S., Van Khoa, P., and Furuichi, T. (2014). Linkages among land use, macronutrient levels, and soil erosion in northern Vietnam: A plot-scale study. Geoderma 232, 352–362. doi: 10.1016/j.geoderma.2014.05.011
Barreto, P. A., Gama-Rodrigues, E. F., Gama-Rodrigues, A. C., Fontes, A. G., Polidoro, J. C., Moço, M. K. S., et al. (2011). Distribution of oxidizable organic C fractions in soils under cacao agroforestry systems in Southern Bahia, Brazil. Agrofor. Syst. 81, 213–220. doi: 10.1007/s10457-010-9300-4
Berger, T. W., Neubauer, C., and Glatzel, G. (2002). Factors controlling soil carbon and nitrogen stores in pure stands of Norway spruce (Picea abies) and mixed species stands in Austria. For. Ecol. Manag. 159, 3–14. doi: 10.1016/S0378-1127(01)00705-8
Blair, G. J., Lefroy, R. D., and Lisle, L. (1995). Soil carbon fractions based on their degree of oxidation, and the development of a carbon management index for agricultural systems. Aust. J. Agric. Res. 46, 1459–1466. doi: 10.1071/AR9951459
Boone, R. D. (1994). Light-fraction soil organic matter: Origin and contribution to net nitrogen mineralization. Soil Biol. Biochem. 26, 1459–1468. doi: 10.1016/0038-0717(94)90085-X
Cambardella, C. A., and Elliott, E. T. (1993a). Carbon and nitrogen distribution in aggregates from cultivated and native grassland soils. Soil Sci. Soc. Am. J. 57, 1071–1076. doi: 10.2136/sssaj1993.03615995005700040032x
Cambardella, C. A., and Elliott, E. T. (1993b). Methods for physical separation and characterization of soil organic matter fractions. Geoderma 56, 449–457. doi: 10.1016/B978-0-444-81490-6.50036-4
Chan, K. Y. (1997). Consequences of changes in particulate organic carbon in vertisols under pasture and cropping. Soil Sci. Soc. Am. J. 61, 1376–1382. doi: 10.2136/sssaj1997.03615995006100050013x
Chen, H., Li, D. J., Xiao, K. C., and Wang, K. L. (2018). Soil microbial processes and resource limitation in karst and non-karst forests. Funct. Ecol. 32, 1400–1409. doi: 10.1111/1365-2435.13069
Chen, X. H., Yang, Q. Q., Chen, Z. Z., Yu, X. B., Yang, Q., and Lei, J. R. (2017). Distribution of soil easily oxidized organic carbon and its response to soil factors in the tropical coastal forest of Hainan island, China. J. Cent. South Univ. For. Technol. 37, 140–145. doi: 10.14067/j.cnki.1673-923x.2017.11.023
Deng, W. B., Wang, X., Hu, H. B., Zhu, M. D., Chen, J. Y., Zhang, S. et al. (2022). Variation characteristics of soil organic carbon storage and fractions with stand age in north subtropical Quercus acutissima Carruth. Forest in China. Forests 13:1649. doi: 10.3390/f13101649
Díaz-Pinés, E., Rubio, A., Van Miegroet, H., Montes, F., and Benito, M. (2011). Does tree species composition control soil organic carbon pools in Mediterranean mountain forests? For. Ecol. Manag. 262, 1895–1904. doi: 10.1016/j.foreco.2011.02.004
Fontaine, S., Barot, S., Barré, P., Bdioui, N., Mary, B., and Rumpel, C. (2007). Stability of organic carbon in deep soil layers controlled by fresh carbon supply. Nature 450, 277–280. doi: 10.1038/nature06275
Ford, D., and Williams, P. D. (2007). Karst hydrogeology and geomorphology. New York, NY: John Wiley & Sons.
Hossain, M. F., Chen, W., and Zhang, Y. (2015). Bulk density of mineral and organic soils in the Canada’s arctic and sub-arctic. Inf. Process. Agric. 2, 183–190. doi: 10.1016/j.inpa.2015.09.001
Hu, C. J., and Guo, L. (2012). Advances in the research of ecological effects of vegetation restoration. Ecol. Environ. Sci. 21, 1640–1646. doi: 10.16258/j.cnki.1674-5906.2012.09.007
Hu, N., and Lan, J. C. (2020). Impact of vegetation restoration on soil organic carbon stocks and aggregates in a karst rocky desertification area in Southwest China. J. Soil Sediment 20, 1264–1275. doi: 10.1007/s11368-019-02532-y
Hua, F., Bruijnzeel, L. A., Meli, P., Martin, P. A., Zhang, J., Nakagawa, S., et al. (2022). The biodiversity and ecosystem service contributions and trade-offs of forest restoration approaches. Science 376, 839–844. doi: 10.1126/science.abl4649
Janzen, H. H., Campbell, C. A., Brandt, S. A., Lafond, G. P., and Townley-Smith, L. (1992). Light-fraction organic matter in soils from long-term crop rotations. Soil Sci. Soc. Am. J. 56, 1799–1806. doi: 10.2136/sssaj1992.03615995005600060025x
Jiang, J., and Song, M. H. (2010). Review of the roles of plants and soil microorganisms in regulating ecosystem nutrient cycling. Chin. J. Plant Ecol. 34, 979–988. doi: 10.3773/j.issn.1005-264x.2010.08.011
Jiang, Z. C., Lian, Y. Q., and Qin, X. Q. (2014). Rocky desertification in Southwest China: Impacts, causes, and restoration. Earth Sci. Rev. 132, 1–12. doi: 10.1016/j.earscirev.2014.01.005
Jing, Y. Y., Deng, L. J., and Zhang, S. R. (2006). Study on the character of purple soil EC and effecting factors. Chin. J. Soil Sci. 3, 617–619. doi: 10.19336/j.cnki.trtb.2006.03.046
John, B., Yamashita, T., Ludwig, B., and Flessa, H. (2005). Storage of organic carbon in aggregate and density fractions of silty soils under different types of land use. Geoderma 128, 63–79. doi: 10.1016/j.geoderma.2004.12.013
Johnson, D. W. (1992). Effects of forest management on soil carbon storage. Water Air Soil Pollut. 64, 83–120. doi: 10.1007/BF00477097
Laganiere, J., Angers, D. A., and Pare, D. (2010). Carbon accumulation in agricultural soils after afforestation: A meta-analysis. Glob. Change Biol. 16, 439–453. doi: 10.1111/j.1365-2486.2009.01930.x
Lai, J. S., Zou, Y., Zhang, J. L., and Peres-Neto, P. R. (2022). Generalizing hierarchical and variation partitioning in multiple regression and canonical analyses using the rdacca. hp R package. Methods Ecol. Evol. 13, 782–788. doi: 10.1111/2041-210X.13800
Lal, R. (2004). Soil carbon sequestration impacts on global climate change and food security. Science 304, 1623–1627. doi: 10.1126/science.1097396
Lefcheck, J. S. (2016). piecewiseSEM: Piecewise structural equation modelling in r for ecology, evolution, and systematics. Methods Ecol. Evol. 7, 573–579. doi: 10.1111/2041-210X.12512
Li, D. J., Niu, S. L., and Luo, Y. Q. (2012). Global patterns of the dynamics of soil carbon and nitrogen stocks following afforestation: A meta-analysis. New Phytol. 195, 172–181. doi: 10.1111/j.1469-8137.2012.04150.x
Li, D. J., Wen, L., Yang, L. Q., Luo, P., Xiao, K. C., and Chen, H. (2017). Dynamics of soil organic carbon and nitrogen following agricultural abandonment in a karst region. J. Geophys. Res. Biogeosci. 122, 230–242. doi: 10.1002/2016JG003683
Li, L. Q., Wang, D., Liu, X. Y., Zhang, B., Liu, Y. Z., Xie, T., et al. (2014). Soil organic carbon fractions and microbial community and functions under changes in vegetation: A case of vegetation succession in karst forest. Environ. Earth Sci. 71, 3727–3735. doi: 10.1007/s12665-013-2767-3
Li, X. J., Yang, T. H., Hicks, L. C., Hu, B., Liu, X., Wei, D. D. et al. (2022). Latitudinal patterns of light and heavy organic matter fractions in arid and semi-arid soils. Catena 215:106293. doi: 10.1016/j.catena.2022.106293
Liang, B. C., MacKenzie, A. F., Schnitzer, M., Monreal, C. M., Voroney, P. R., and Beyaert, R. P. (1997). Management-induced change in labile soil organic matter under continuous corn in eastern Canadian soils. Biol. Fertil. Soils 26, 88–94. doi: 10.1007/s003740050348
Lu, X. Q., Toda, H., Ding, F. J., Fang, S. Z., Yang, W. X., and Xu, H. G. (2014). Effect of vegetation types on chemical and biological properties of soils of karst ecosystems. Eur. J. Soil Biol. 61, 49–57. doi: 10.1016/j.ejsobi.2013.12.007
Luo, Y. X., Li, Y. X., Liu, S. W., and Yu, P. J. (2022). Effects of vegetation succession on soil organic carbon fractions and stability in a karst valley area, Southwest China. Environ. Monit. Assess. 194:562. doi: 10.1007/s10661-022-10254-x
Maie, N., Watanabe, A., and Kimura, M. (2004). Chemical characteristics and potential source of fulvic acids leached from the plow layer of paddy soil. Geoderma 120, 309–323. doi: 10.1016/j.geoderma.2004.02.007
Neilson, J. W., Califf, K., Cardona, C., Copeland, A., Van Treuren, W., Josephson, K. L., et al. (2017). Significant impacts of increasing aridity on the arid soil microbiome. mSystems 2, e00195-16. doi: 10.1128/mSystems.00195-16
O’Brien, S. L., and Jastrow, J. D. (2013). Physical and chemical protection in hierarchical soil aggregates regulates soil carbon and nitrogen recovery in restored perennial grasslands. Soil Biol. Biochem. 61, 1–13. doi: 10.1016/j.soilbio.2013.01.031
Oksanen, J., Blanchet, F. G., Friendly, M., Kindt, R., Legendre, P., McGlinn, D., et al. (2016). vegan: Community ecology package. R package version 2.4-1. Available online at: http://CRAN.R-project.org/package=vegan (accessed May 13, 2022).
Pang, D. B., Cui, M., Liu, Y. G., Wang, G. Z., Cao, J. H., Wang, X. R., et al. (2019). Responses of soil labile organic carbon fractions and stocks to different vegetation restoration strategies in degraded karst ecosystems of southwest China. Ecol. Eng. 138, 391–402. doi: 10.1016/j.ecoleng.2019.08.008
Revelle, W. R. (2017). psych: Procedures for personality and psychological research. Evanston, IL: Northwestern University.
Rhoades, J., and Corwin, D. L. (1981). Determining soil electrical conductivity-depth relations using an inductive electromagnetic soil conductivity meter. Soil Sci. Soc. Am. J. 45, 255–260. doi: 10.2136/sssaj1981.03615995004500020006x
Scharlemann, J. P., Tanner, E. V., Hiederer, R., and Kapos, V. (2014). Global soil carbon: Understanding and managing the largest terrestrial carbon pool. Carbon Manag. 5, 81–91. doi: 10.4155/cmt.13.77
Six, J., Callewaert, P., Lenders, S., De Gryze, S., Morris, S. J., Gregorich, E. G., et al. (2002). Measuring and understanding carbon storage in afforested soils by physical fractionation. Soil Sci. Soc. Am. J. 66, 1981–1987. doi: 10.2136/sssaj2002.1981
Springob, G., and Kirchmann, H. (2002). C-rich sandy Ap horizons of specific historical land-use contain large fractions of refractory organic matter. Soil Biol. Biochem. 34, 1571–1581. doi: 10.1016/S0038-0717(02)00127-X
Staaf, H., and Berg, B. (1982). Accumulation and release of plant nutrients in decomposing Scots pine needle litter. Long-term decomposition in a Scots pine forest II. Can. J. Bot. 60, 1561–1568. doi: 10.1139/b82-199
Stockmann, U., Adams, M. A., Crawford, J. W., Field, D. J., Henakaarchchi, N., Jenkins, M., et al. (2013). The knowns, known unknowns and unknowns of sequestration of soil organic carbon. Agric. Ecosyst. Environ. 164, 80–99. doi: 10.1016/j.agee.2012.10.001
Templer, P. H., Groffman, P. M., Flecker, A. S., and Power, A. G. (2005). Land use change and soil nutrient transformations in the Los Haitises region of the Dominican Republic. Soil Biol. Biochem. 37, 215–225. doi: 10.1016/j.soilbio.2004.07.031
Tong, X. W., Brandt, M., Yue, Y. M., Ciais, P., Rudbeck Jepsen, M., and Penuelas, J. (2020). Forest management in southern China generates short term extensive carbon sequestration. Nat. Commun. 11:129. doi: 10.1038/s41467-019-13798-8
von Lützow, M., Kögel-Knabner, I., Ekschmitt, K., Flessa, H., Guggenberger, G., Matzner, E., et al. (2007). SOM fractionation methods: Relevance to functional pools and to stabilization mechanisms. Soil Biol. Biochem. 39, 2183–2207. doi: 10.1016/j.soilbio.2007.03.007
Wang, C. Y., He, N. P., and Lü, Y. L. (2016). Latitudinal patterns and factors affecting different soil organic carbon fractions in the eastern forests of China. Acta Ecol. Sin. 36, 3176–3188. doi: 10.5846/stxb201503310630
Wang, Q. Y., Wang, Y., Wang, Q. C., and Liu, J. S. (2014). Impacts of 9 years of a new conservational agricultural management on soil organic carbon fractions. Soil Till. Res. 143, 1–6. doi: 10.1016/j.still.2014.05.004
Wang, W. J., Dalal, R. C., Moody, P. W., and Smith, C. J. (2003). Relationships of soil respiration to microbial biomass, substrate availability and clay content. Soil Biol. Biochem. 35, 273–284. doi: 10.1016/S0038-0717(02)00274-2
Wattel-Koekkoek, E. J. W., Buurman, P., Van Der Plicht, J., Wattel, E., and Van Breemen, N. (2003). Mean residence time of soil organic matter associated with kaolinite and smectite. Eur. J. Soil Sci. 54, 269–278. doi: 10.1046/j.1365-2389.2003.00512.x
Wen, L., Li, D. J., Chen, H., and Wang, K. L. (2017). Dynamics of soil organic carbon in density fractions during post-agricultural succession over two lithology types, southwest China. J. Environ. Manage. 201, 199–206. doi: 10.1016/j.jenvman.2017.06.048
Xu, E. Q., Zhang, H. Q., and Li, M. X. (2013). Mining spatial information to investigate the evolution of karst rocky desertification and its human driving forces in Changshun, China. Sci. Total Environ. 458, 419–426. doi: 10.1016/j.scitotenv.2013.04.048
Xu, G. P., Li, Y. Q., Shen, Y. Y., Zhang, D. N., Sun, Y. J., Zhang, Z. F., et al. (2019). Soil organic carbon distribution and components in different plant communities along a water table gradient in the Huixian karst wetland in Guilin. Environ. Sci. 40, 1491–1503. doi: 10.13227/j.hjkx.201806205
Xue, S., Liu, G. B., Pan, Y. P., Dai, Q. H., Zhang, C., and Yu, N. (2009). Evolution of soil labile organic matter and carbon management index in the artificial Robinia of loess hilly area. Sci. Agric. Sin. 42, 1458–1464. doi: 10.3864/j.issn.0578-1752.2009.04.042
Yang, L. Q., Luo, P., Wen, L., and Li, D. J. (2016). Soil organic carbon accumulation during post-agricultural succession in a karst area, southwest China. Sci. Rep. 6:37118. doi: 10.1038/srep37118
Zhang, W. M., Wu, M., Wang, M., Shao, X. X., Jiang, X. S., and Zhou, B. (2014). Distribution characteristics of organic carbon and its components in soils under different types of vegetation in wetland of Hangzhou Bay. Acta Pedol. Sin. 51, 1351–1360.
Zhang, X. B., Bai, X. Y., and He, X. B. (2011). Soil creeping in the weathering crust of carbonate rocks and underground soil losses in the karst mountain areas of southwest China. Carbonates Evaporites 26, 149–153.
Zhao, Q., Liu, S., Chen, K., Wang, S. J., Wu, C. Z., Li, J., et al. (2021). Change characteristics and influencing factors of soil organic carbon in Castanopsis eyrei natural forests at different altitudes in Wuyishan nature reserve. Acta Ecol. Sin. 41, 5328–5339.
Zhao, Y., Zhang, W., Hu, P. L., Xiao, J., and Wang, K. L. (2021). Responses of soil organic carbon fractions to different vegetation restoration in a typical karst depression. Acta Ecol. Sin. 41, 8535–8544.
Keywords: karst, vegetation restoration, soil organic carbon (SOC), carbon fractions, soil depth
Citation: Zhang B, Xu C, Zhang Z, Hu C, He Y, Huang K, Pang Q and Hu G (2023) Response of soil organic carbon and its fractions to natural vegetation restoration in a tropical karst area, southwest China. Front. For. Glob. Change 6:1172062. doi: 10.3389/ffgc.2023.1172062
Received: 23 February 2023; Accepted: 09 May 2023;
Published: 24 May 2023.
Edited by:
Shri Kant Tripathi, Mizoram University, IndiaReviewed by:
Xiangping Tan, Chinese Academy of Sciences (CAS), ChinaCopyright © 2023 Zhang, Xu, Zhang, Hu, He, Huang, Pang and Hu. This is an open-access article distributed under the terms of the Creative Commons Attribution License (CC BY). The use, distribution or reproduction in other forums is permitted, provided the original author(s) and the copyright owner(s) are credited and that the original publication in this journal is cited, in accordance with accepted academic practice. No use, distribution or reproduction is permitted which does not comply with these terms.
*Correspondence: Gang Hu, YWhodWdhbmdAMTI2LmNvbQ==
†These authors have contributed equally to this work
Disclaimer: All claims expressed in this article are solely those of the authors and do not necessarily represent those of their affiliated organizations, or those of the publisher, the editors and the reviewers. Any product that may be evaluated in this article or claim that may be made by its manufacturer is not guaranteed or endorsed by the publisher.
Research integrity at Frontiers
Learn more about the work of our research integrity team to safeguard the quality of each article we publish.