 Rheya Sward
 Abigail Philbrick1
 Keryn Gedan
95% of researchers rate our articles as excellent or good
Learn more about the work of our research integrity team to safeguard the quality of each article we publish.
Find out more
ORIGINAL RESEARCH article
Front. For. Glob. Change , 05 May 2023
Sec. Temperate and Boreal Forests
Volume 6 - 2023 | https://doi.org/10.3389/ffgc.2023.1167880
This article is part of the Research Topic Impacts of Invasive Plant Management on Forest Biodiversity and Ecosystem Services View all 6 articles
Expansion of shrubs has been observed in a number of biomes and in response to diverse global change drivers. Noting shrub expansion in coastal forests affected by sea level rise, we began to monitor shrub populations in a transgressing loblolly pine forest in coastal Virginia. Forest study plots spanned a gradient of salinity and progression toward a ghost forest state, from high forest with a relatively closed canopy, to mid and low forest, where there were few remaining live canopy trees. Shrubs of the species Morella cerifera were censused for 3 years from 2019 to 2021. Shrub distributions were compared to distributions of the invasive grass Phragmites australis to test if competition with this invasive species played a role in the observed shrub distribution. Shrubs were most abundant in the mid forest, whereas P. australis was most abundant in the low forest, but we did not detect a negative correlation between changes in occupancy of P. australis and shrubs. Rapid growth of shrubs in the mid and high forest radically changed the forest understory structure during the study period. Basal area of shrubs in the mid and high forest tripled, and shrub occupancy increased from 45 to 66% in the high forest, with high patchiness between plots. A flooding event salinized the site in late 2019, during the study. Following the flood, soil porewater salinities in the low forest remained above levels known to cause mortality in M. cerifera for several months. We postulate that high salinity, rather than competition with P. australis, filters M. cerifera from the low forest, whereas moderate salinity in the mid and high forest favors M. cerifera growth and expansion. The increase in shrubs appears to be a hallmark of salt-affected maritime forest, with the shrub front occurring in advance of other indicators of transgression such as P. australis invasion.
Shrub growth forms are responsive to a variety of global changes in a diversity of ecosystems, from Arctic tundra (Mod and Luoto, 2016; Mekonnen et al., 2021) to dryland grasslands (Van Auken, 2000, 2009) to barrier-island swale communities (Zinnert et al., 2011, 2016; Wood et al., 2020). The significant increase in abundance and dominance of shrubs, or shrubification, in these ecosystems occurs for a wide variety of reasons. In Arctic tundra and barrier-island swale communities, shrubification is a result of warmer temperatures that favor shrubs over grasses and herbs (Thompson et al., 2017; Wood et al., 2020). Whereas, in dryland ecosystems, shrubs are increasing due to their resistance to ongoing grazing pressure and an associated reduction in fires as grazers reduce natural fuel loads (Archer et al., 2017). These increases in shrubs have had cascading effects for flora and fauna, as well as ecosystem cycling of carbon and nutrients (Kaarlejärvi et al., 2012), evidence that shrubification can fundamentally change ecosystems.
As a growth form, shrubs are severely understudied relative to trees and grasses (Götmark et al., 2016). In changing ecosystems, the shrub growth form has unique advantages that enable expansion. Specifically, relative to trees, shrubs invest less resources in structural growth of stems and branches, and can, therefore, allocate greater biomass to roots that can access deeper pools of water and allow persistence through periods of drought or stress (Whittaker and Woodwell, 1969). The shrub growth strategy has been described as production of many relatively small, low investment or “throwaway” stems that can be sacrificed in high stress periods or environments (Götmark et al., 2016). Shrubs can also engineer a microclimate favorable to the germination and growth of conspecifics (Wood et al., 2020). Most shrub seedlings quickly establish relatively high leaf area and biomass. Furthermore, multiple stems of shrubs allow for rapid horizontal growth, and adventitious roots can emerge from stems close to the ground allowing new vertical shoots to develop (Götmark et al., 2016). Production of multiple stems is generally recognized as a persistence strategy in woody plants (Bond and Midgley, 2001). For these reasons, shrubs may be better positioned than other growth forms to persist in a highly variable environment, such as maritime forest ecosystems periodically salinized by storm events and, increasingly, by rising sea level.
Shrubs are an important component of maritime forest understory communities, where they provide climate control, soil stabilization, water balance, and carbon uptake (Götmark et al., 2016). Maritime forests are being greatly affected by sea level rise and associated saltwater intrusion into groundwater (Taillie et al., 2019; Tully et al., 2019; Conner et al., 2022). Marsh migration and dead trees at the edge of maritime forests are visible indicators of plant community change resulting from sea level rise (Kirwan and Gedan, 2019; Ury et al., 2021). Tree regeneration is suppressed by flooding and salinity (Fagherazzi et al., 2019; Ury et al., 2020; Woods et al., 2020). As maritime forest tree canopies open due to tree stress and mortality, species that were previously shaded out, such as marsh grasses and opportunistic invasive species like the invasive common reed, Phragmites australis, establish and spread (Fagherazzi et al., 2019; Taillie et al., 2019; Shaw et al., 2022). Shrubs are among the growth forms that have been observed to increase in response to tree mortality and light availability. For example, in dying tree islands in the Florida Gulf Coast, the halophytic shrubs Lycium carolinianum and Iva frutescens increased in abundance over two decades and across a gradient of impact (Langston et al., 2017).
In maritime forests located on the eastern shore of Virginia, the wax myrtle shrub Morella cerifera (L.) Small (synonymous, Myrica cerifera, ITIS, 2022) frequently dominates the understory, but is somewhat limited to the forest edge (Brinson et al., 1995; Duberstein et al., 2020). Its geographic range extends to the North Atlantic Coastal Plain of the United States (Shao and Halpin, 1995) and the Caribbean basin, and it is introduced in Hawaii (GBIF.org, 2023). M. cerifera is an important component of the maritime forest community and increasing in recent decades on barrier islands (Huang et al., 2018; Woods et al., 2021). M. cerifera is an actinorhizal, moderately salt-tolerant evergreen shrub (Young et al., 1994; Tolliver et al., 1997; Naumann et al., 2007; Woods et al., 2020; i.e., more salt tolerant than co-existing glycophytes but less so than several other woody species in the same system; Anderson et al., 2022) and an early successional species that can form dense thickets (Kurten et al., 2008).
We investigated whether sea level rise presents yet another global change factor causing shrubification, in this case, within the herbaceous and relatively open understory communities of maritime pine forest. If shrubs are indeed increasing in abundance or dominance in maritime forest, there may be cascading effects to the ecosystem due to the identity of the shrub, here, an N-fixing and ecosystem engineering species, or due to associated changes in ecosystem stature and structure. Additionally, understanding shrub dynamics is essential to inventories of ecosystem carbon, models of vegetation change at the terrestrial-aquatic interface, and remote sensing interpretation of coastal change. Prior to the study period, we anecdotally observed an increasing number of shrubs in forests that are rapidly transgressing. Therefore, we predicted that shrubs would increase in number, size, and basal area over time in forested areas affected by sea level rise, and that these changes would be correlated with one of two abiotic changes: (1) increasing salinity, or (2) increasing light availability, which results from tree canopy decline. Lastly, we expected to see a decrease in shrub presence where the invasive common reed P. australis has increased, due to competition between M. cerifera and P. australis for light resources.
We tested these hypotheses in a well-characterized Mid-Atlantic maritime forest using 3 years of shrub census data in plots that span a gradient of salinity stress and state of transition to marsh. The Brownsville Forest, located in Nassawadox, Virginia, USA within the Virginia Coast Reserve Long-Term Ecological Research site, is typical of a Mid-Atlantic maritime forest, with dominant tree cover of mature loblolly pine (Pinus taeda) making up 50 to 75% of basal area (34 ± 13 m2 ha–1). Other common tree species at the site include Nyssa sylvatica, Acer rubrum, and Ilex opaca. Nearer to the coastal forest edge, eastern red cedar trees, Juniperus virginiana, are also common, as are Baccharis halimifolia and I. frutescens shrubs. However, in the forest understory, where our plots were located, M. cerifera was the only common shrub species. The site is owned and managed by The Nature Conservancy. Annually, Nassawadox receives an average of 1,200 mm of rainfall and 25.5 mm of snowfall, and annual temperature ranges from summer highs averaging around 31°C and winter lows of −0.5°C. Coastal land slope, an important predictor of the rate of forest retreat and marsh migration, is exceedingly low at the site (Molino et al., 2021). Based on hydrologic monitoring on-site, the forest has been subjected to salinity stress from flood events and saltwater intrusion. During the study period, saltwater flooding affected the site in October 2019 and May 2021 (Fagherazzi and Nordio, 2022; Nordio et al., 2022). At the coastal forest edge where groundwater salinities are highest, a dying, ghost forest borders the marsh, while further inland where groundwater salinities are lower, a healthier forest, with a comparatively closed canopy, resides.
In 2019, twenty-four 20 × 20 m plots were established at three levels spanning the gradient, which were termed “high” (apparently healthy forest, furthest inland, approx. 300 m from the marsh edge), “mid” (stressed forest, approx. 200 m from the marsh edge), and “low” (incipient ghost forest, closest to marsh, 100 m from the marsh edge). The forest levels were designated based on tree species composition and tree condition. In high forest, the canopy was nearly closed and deciduous tree species were present. In the mid forest, there were gaps in the canopy where branches or individual trees had died, and deciduous species were absent from the canopy, and in low forest, canopy cover was lower still, many tree snags were present, and eastern red cedars were more common. In each level, eight plots were marked with T-posts at the plot corners and a PVC pole at the plot center.
Within each forest plot, a circular plot with a radius of 2 m around the center pole was designated for the shrub census. All shrubs with woody stems (i.e., excluding seedlings) within the circular plot were tagged and included in the shrub census. Annual data was collected during the first half of each summer growing season (mid-June to early July). To quantify shrub growth over the span of 3 years (2019–2021), the following characteristics of each shrub (i.e., “individual shrub metrics”) were measured annually: height, canopy area, and stem diameter. In 2021, new shrubs were added to the census if they met the woody stem criteria. No new shrubs were added to the census in 2020 due to COVID-19 restrictions and limited data collection capacity, however, the census was otherwise conducted normally in 2020.
Shrub metrics were measured according to standard protocols (Kauffman et al., 2016). Height was measured from the ground to the highest point of the shrub. Canopy area was estimated as an ellipse by measuring the longest and widest sections of each individual’s canopy and multiplying the two canopy radii by pi. A caliper was used to measure stem diameter of the largest stem of each shrub at 2 cm above the soil surface. Stem diameter was used to estimate cross-sectional stem area, and the cross-sectional area of all stems within a plot was summed and divided by the plot area to estimate plot-scale shrub basal area. Plot-scale shrub density was calculated as the number of shrub individuals in each plot divided by plot area.
To document shrub cover at the landscape scale, the 20 × 20 m plots were systematically surveyed for shrub presence or absence. Every 5 m, on five parallel transects spaced 5 m apart, the presence (≥1 shrub stem) or absence of shrubs within a 1 m radius was observed and recorded in early July of each year. The first and last transects aligned with plot edges. A compass was used to maintain the same orientation of all the transects, and a handheld GPS (Garmin eTrex 22) was used to mark the coordinates of the starting point and to map sample locations within GIS.
Using the same survey design, we described the presence and stem density of P. australis within the forest plots. The same density scale described in Shaw et al. (2022) was used. Specifically, a zero denoted P. australis absence, a 1 that one to three stems were present, a 2 that there was a small group of stems, a 3 that there was a sparse stand, and a 4 that there was a fully developed stand. To track landscape occupancy of shrubs and P. australis density through time, we calculated the proportion of points with shrubs present and the average density of P. australis in each plot in each year. We also used ArcMap to visualize shrub occupancy and P. australis density.
We expected to see shrub occupancy decrease in locations where P. australis increased, which would suggest a competitive relationship between the two species in which P. australis can outcompete shrubs for limiting light resources in the understory. We expected this pattern to be most apparent in the low forest where P. australis was predicted to be more abundant. We mapped distribution changes to compare sample locations that experienced an increase, no change, or a decrease for both shrubs and P. australis.
Abiotic measurements of porewater salinity and canopy gap fraction were made throughout the study period. Porewater samples were collected opportunistically following rain events from the top 20 cm of soil using a pushpoint sampler (MHE Products). Salinity of the porewater sample was measured with a handheld conductivity and salinity meter (Hach, accuracy ± 0.1 ppt). On each sampling occasion, three porewater samples from each plot were collected. Each sample was measured individually and the mean of the three values was used as an estimate of plot porewater salinity. The proportion of the canopy composed of light gaps was estimated for each plot using photos collected with a fisheye lens attached to a smartphone. The smartphone was placed on top of the center pole of each plot, with the camera pointed upward toward the sky. Low hanging vegetation was pushed out of the frame in order to get a clear photo of the tree canopy. Photos were checked for quality and corrected for overexposure. Photos were analyzed in ImageJ software by binarizing the image and recording the proportion of dark pixels (canopy) relative to dark and light pixels (canopy plus sky). Canopy gap portion was calculated as 1–[canopy proportion]. This process was inspired by the canopy cover index developed by Tichý (2016).
As 97% of shrubs in the census were M. cerifera (n = 324 of 334 shrubs), the remaining n = 10 individuals, which were tree seedlings of species I. opaca (n = 9) and J. virginiana (n = 1), were excluded from the data analysis to focus on M. cerifera dynamics. For individual shrub metrics (canopy area, height, and stem diameter), mean and standard error values of all individuals within each forest level were plotted for each year. For plot-scale metrics (shrub density, basal area, occupancy of shrubs and P. australis, and abiotic variables), mean and standard error values of all plots in a forest level (n = 8 per level) were plotted for each year. Annual changes in metrics were calculated relative to the 2019 baseline census to visualize change through time. The effects of forest level (low, mid, and high) and year (2019, 2020, and 2021) and their interaction on individual shrub and plot-scale response variables were tested using two-way repeated measures ANOVA (RM-ANOVA). For individual shrub metrics, only shrubs encountered in all years were included, to accurately quantify shrub growth and to avoid potential bias from missing data. Whereas, in analyses at the plot scale, we included all shrubs found in one or more years to account for recruitment and mortality between censuses.
Prior to RM-ANOVA, normality was checked using Quantile-Quantile plots, and when required, response variables were transformed using square root or cube root transformations. The assumption of sphericity was checked using Mauchly’s test of sphericity and corrected with the Greenhouse-Geisser correction within the rstatix package (Kassambara, 2022). When RM-ANOVAs indicated significant effects (p-value < 0.05), pairwise t-tests with Bonferroni corrected p-values were used to identify differences between levels or years.
To understand the relationship between the abiotic measures and shrub metrics, we tested for Spearman rank correlations between each plot-scale response variable and the plot-scale abiotic variables of canopy cover, peak salinity in 2019, and the increase in salinity resulting from the flooding event (calculated as the early summer salinity subtracted from the post-event peak salinity in 2019). We investigated lag effects by testing correlations between the shrub metrics from each year and the abiotic conditions of all other years, with the expectation, for example, that the salinity associated with the flooding event of 2019 might be observed only in the shrub response of subsequent years.
We used a contingency table of observed distribution changes of M. cerifera and P. australis and a chi-square test of data from each forest level to distinguish if there was a statistically significant relationship between the increase, decrease, or no change in M. cerifera and P. australis presence between 2019 and 2021, with each survey point as an observation (n = 200 points per forest level). All statistical analysis and data visualization were done in R statistical software (R version 3.6.1, CRAN), and the following packages were used in data manipulation and visualization: tidyr (Wickham and Henry, 2020), ggplot2 (Wickham, 2016), stringr (Wickham and Wickham, 2019), and lubridate (Spinu et al., 2018).
Between 2019 and 2021, there was a rapid increase in all individual shrub metrics (canopy area, height, and stem diameter, Figures 1A–C) reflecting high growth of shrubs at this site (significant main effect of Year for all individual metrics in Table 1 and Supplementary Figure 1). Shrub height was the only individual metric to exhibit a significant interactive effect of forest level and year, which was a result of the increasing height of shrubs through time in the mid and high forest but not in the low forest, as well as the initially greater height of shrubs in the mid forest relative to high forest, a difference which disappeared in later years (Figure 1B).
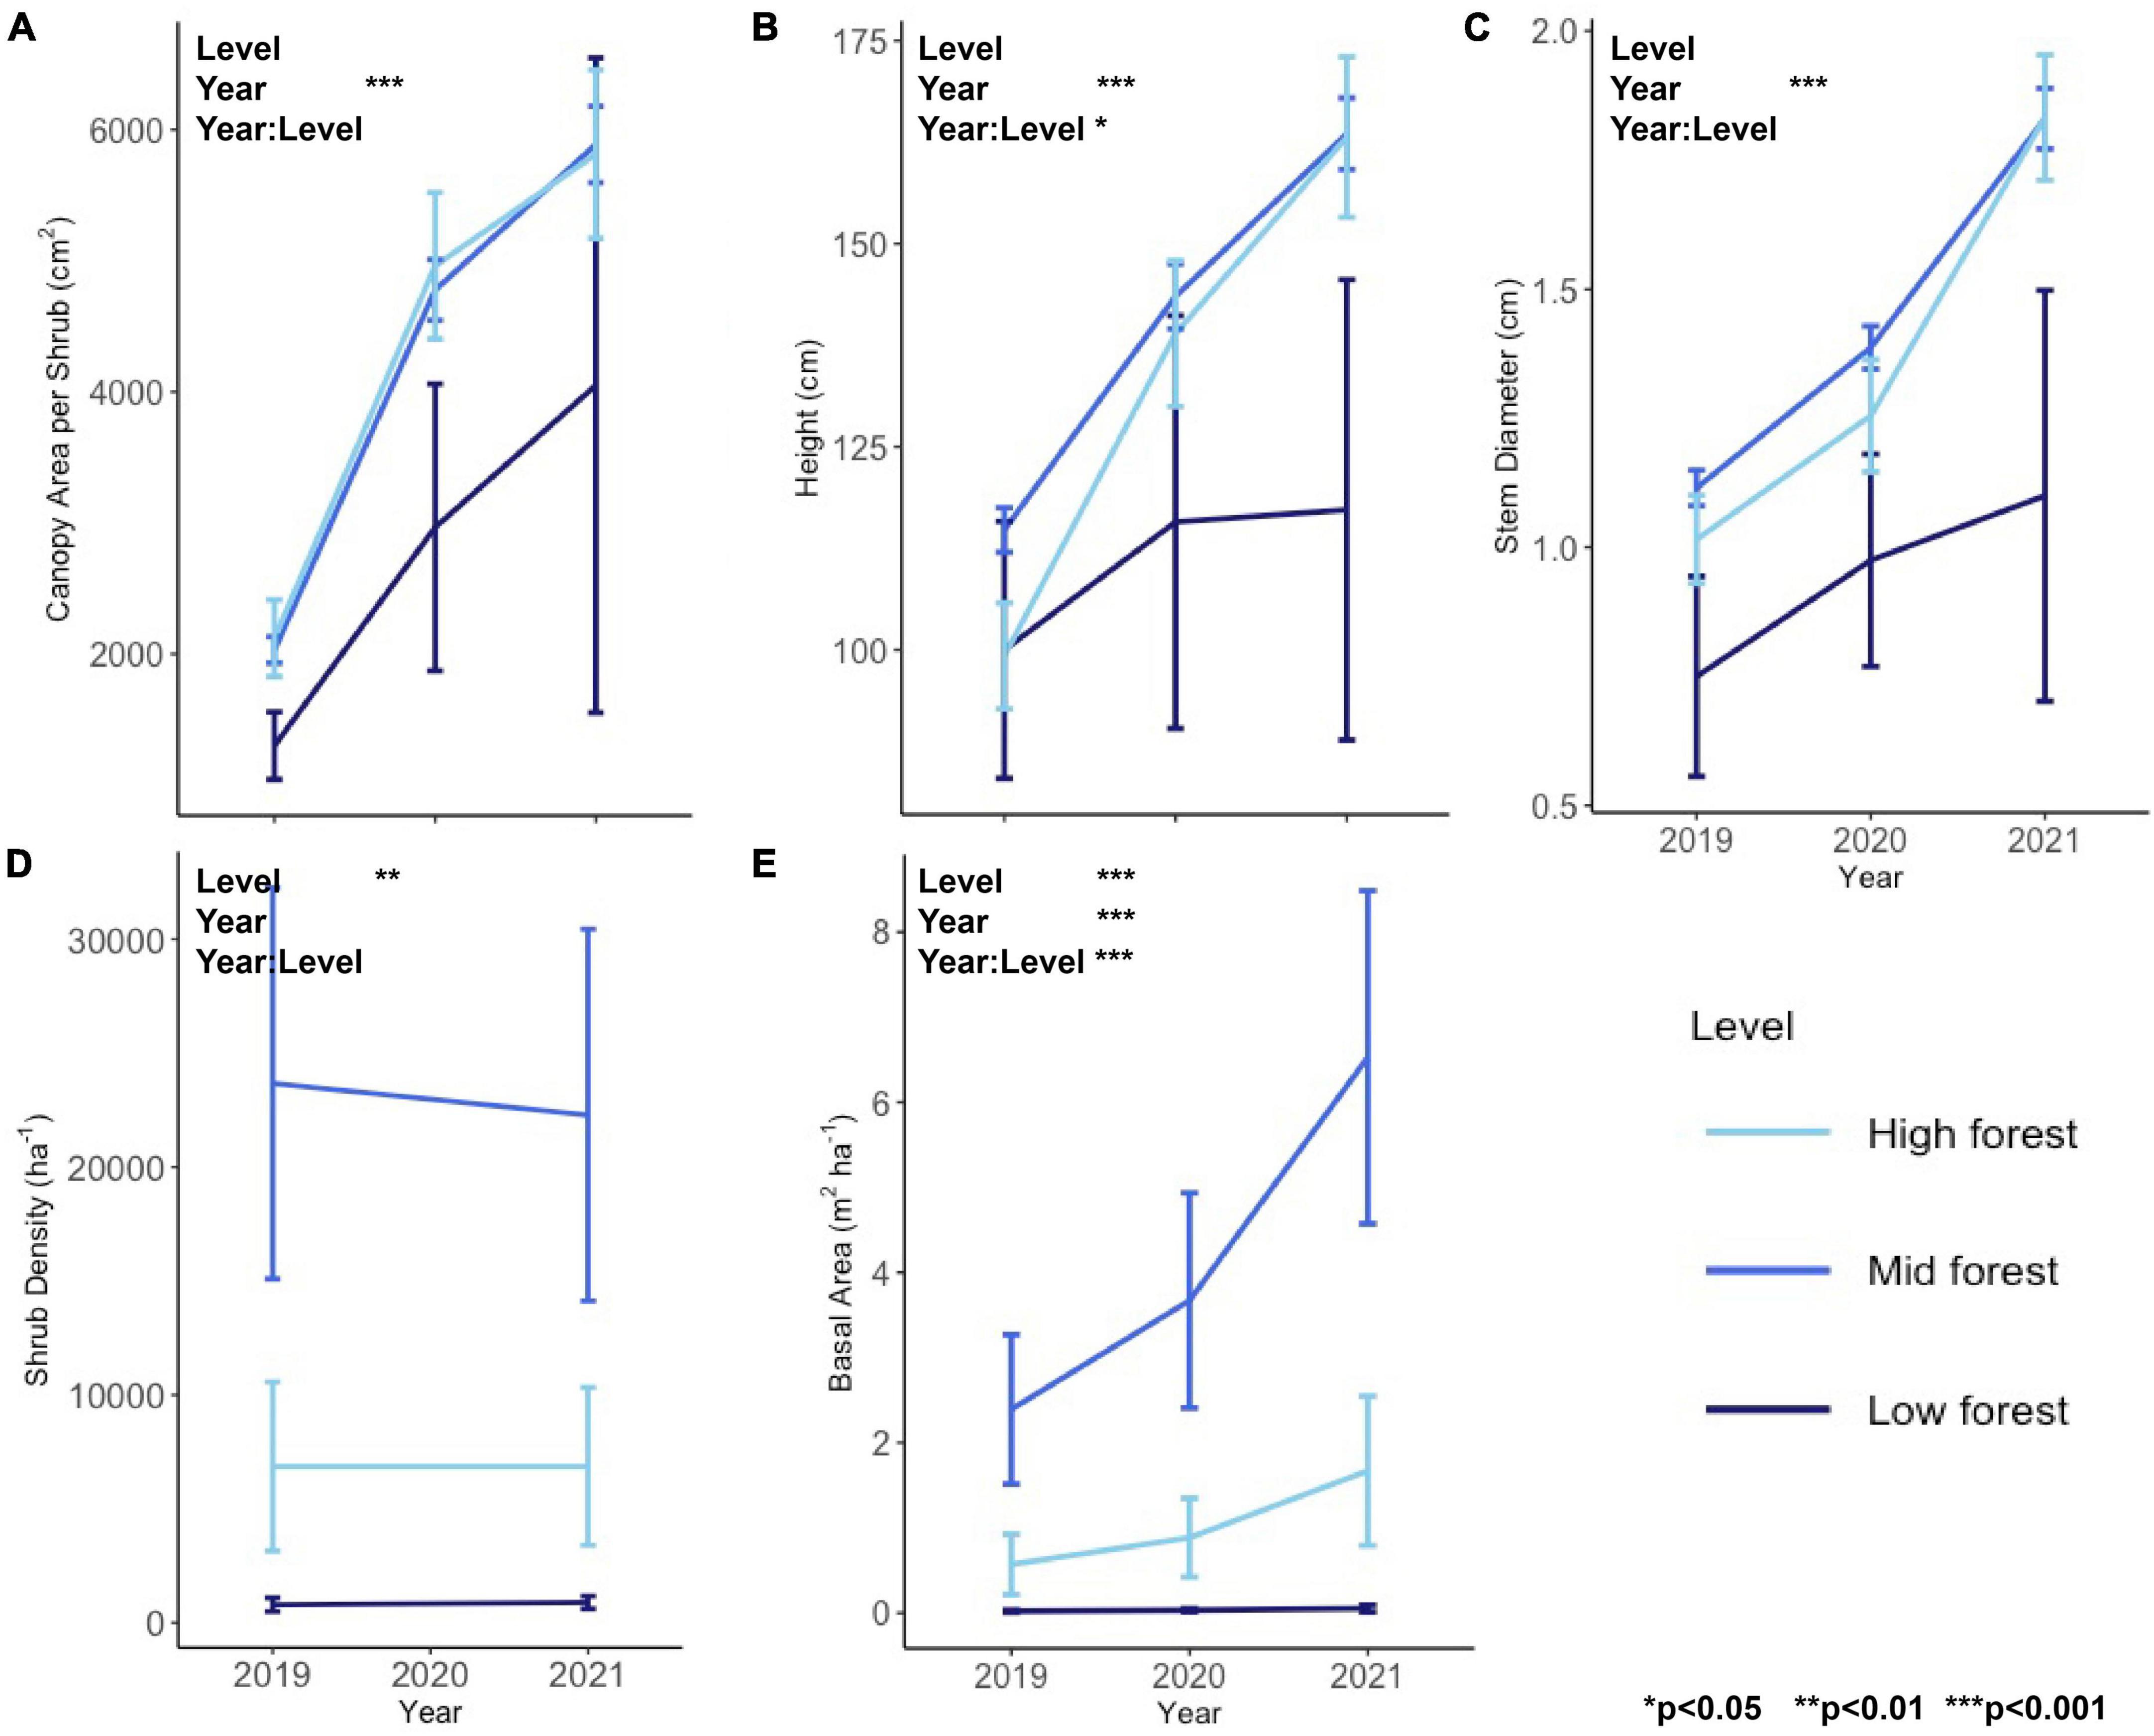
Figure 1. Individual shrub metrics of (A) canopy area, (B) height, and (C) stem diameter and plot-scale shrub metrics of (D) shrub density and (E) shrub basal area for the study years of 2019–2021. Asterisks denote p-value thresholds of factors of forest level, year, and their interaction in RM-ANOVA.
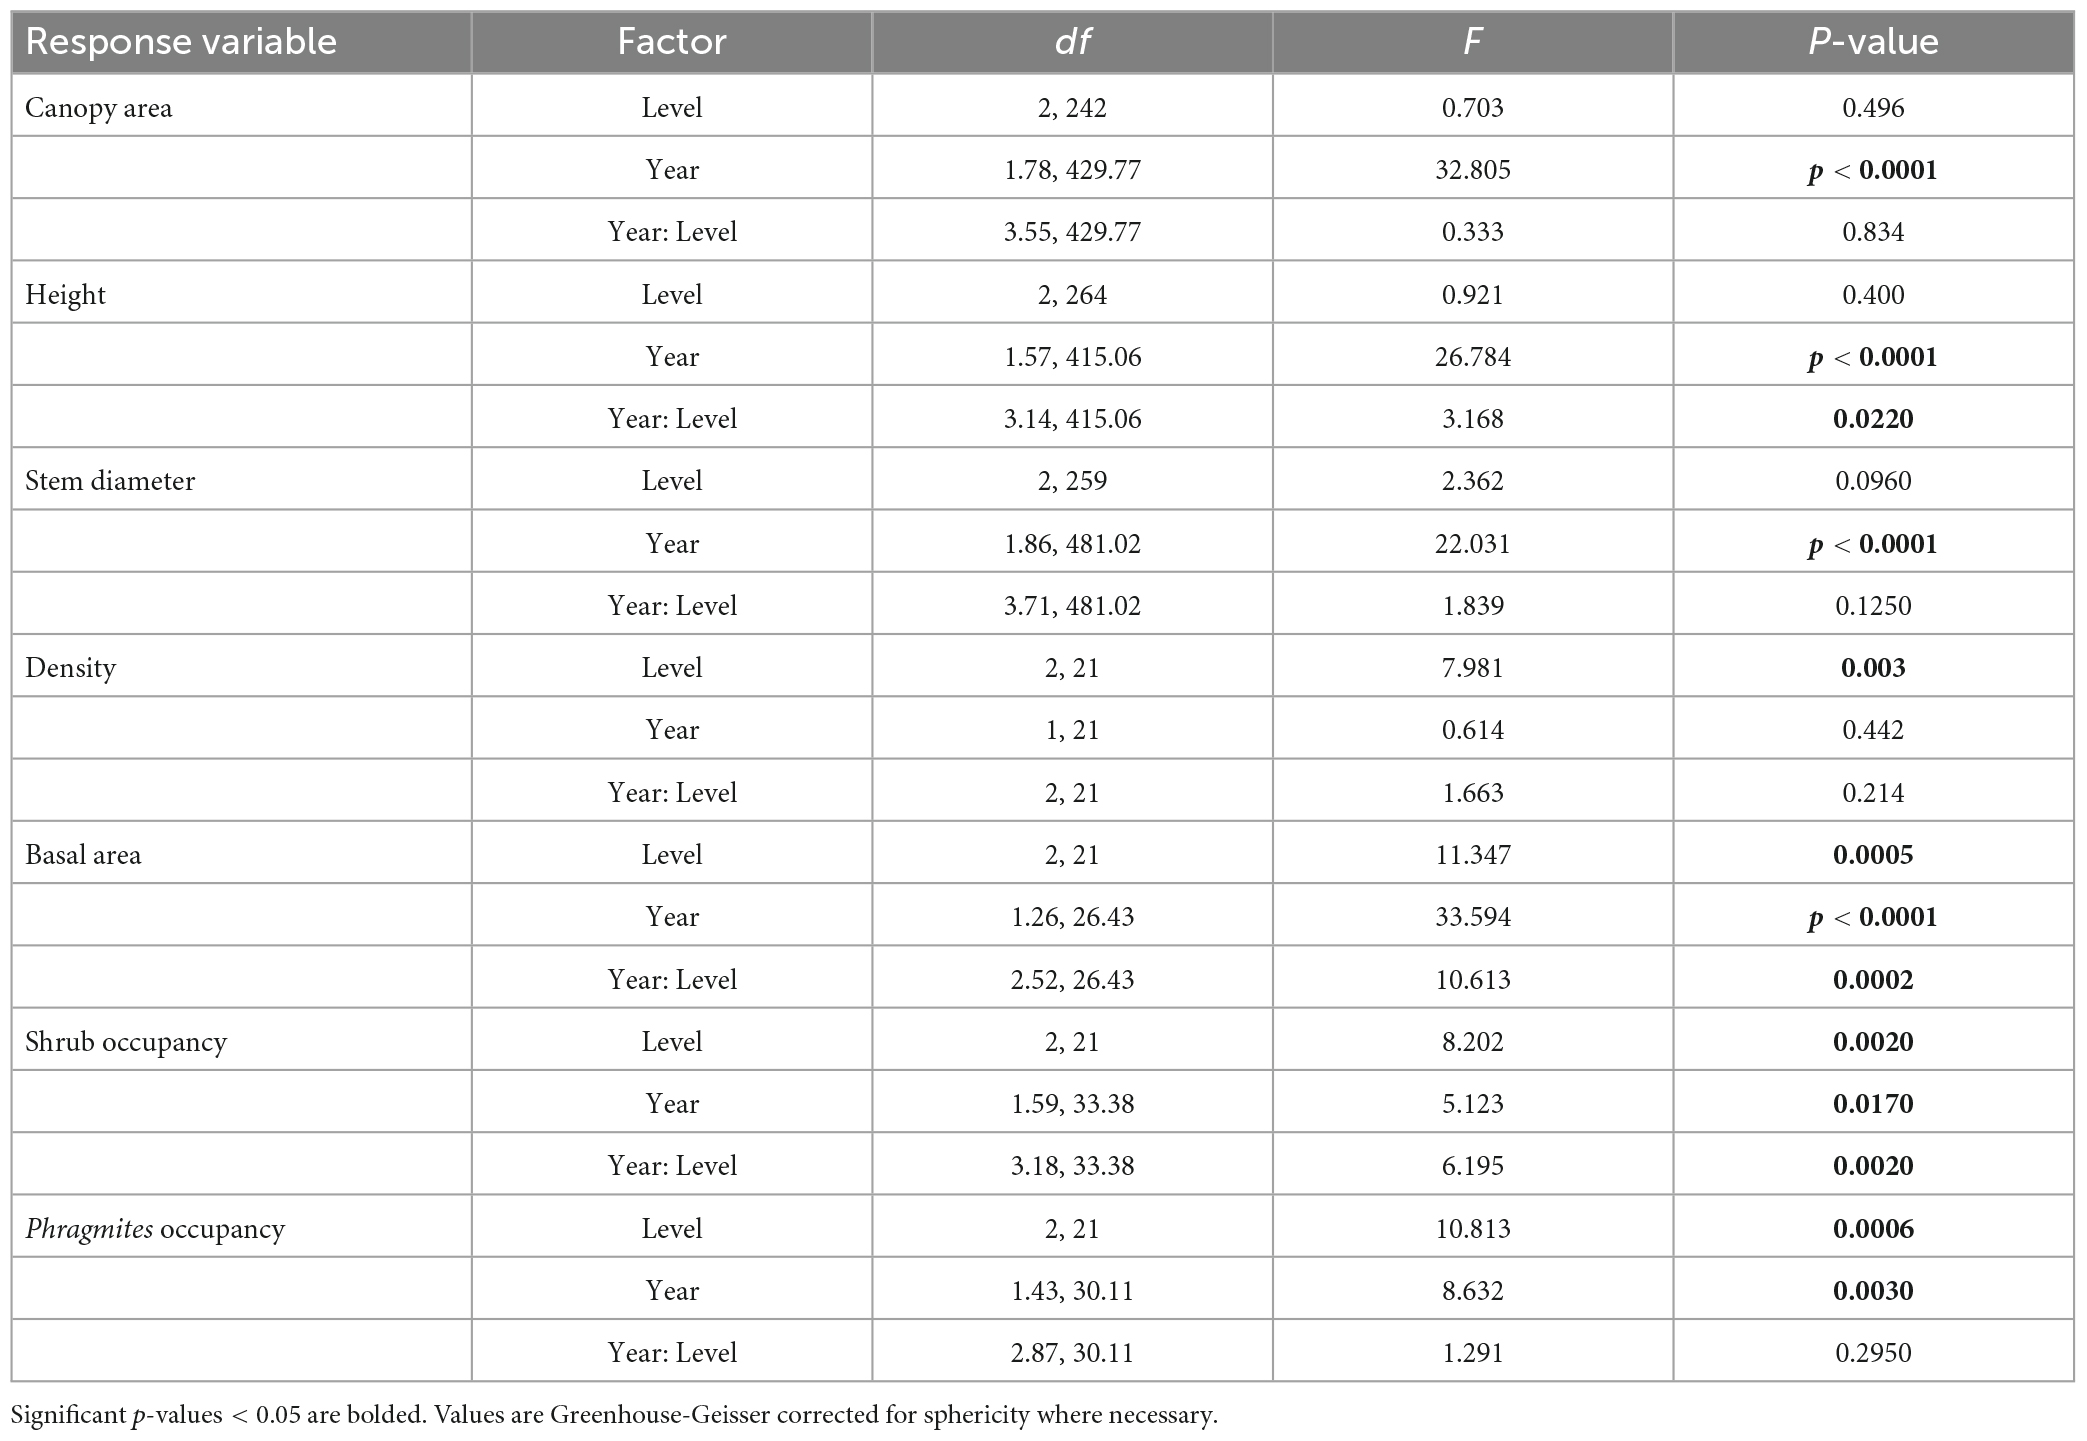
Table 1. Repeated measures ANOVA for individual shrub and plot-scale metrics.
At the plot-scale, density differed by forest level, with the mid forest having the highest shrub density (22,978 ± 5,722 shrubs/ha, mean ± s.e. across all years), then the high forest (6,864 ± 2,450 shrubs/ha), followed by the low forest (846 ± 199 shrubs/ha), and there was no change in shrub density over the course of the study (Figure 1D). In contrast to density, basal area increased dramatically during the study (Figure 1E), driven by the growth in individual stem diameter. Basal area roughly tripled in the high and mid forest, from 0.6 ± 0.4 to 2.4 ± 0.9 m2/ha, respectively, in 2019, to 1.7 ± 0.9 and 6.5 ± 2.0 m2/ha in 2021 (Figure 1).
Change in the mid and high levels was approximately linear between 2019 and 2021, with both years showing substantial increases in individual shrub growth and basal area (Figure 1). Contrastingly, the low forest experienced far less change in all metrics, and far greater variability, due to the low density of shrubs and resulting small sample size. There were only seven individuals in the low forest, one of which was not found in 2020 and two others of which were very large and considered statistical outliers.
Shrub occupancy was consistently highest (>80%) in the mid forest plots over the 3-year period (main effect of Level, Figure 2 and Table 1). The significant interactive effect between forest level and year on shrub occupancy (Table 1) was driven by increasing differences between the mid and low forest levels through time (Figure 2 and Supplementary Figures 2, 3). Interestingly, while the low and high forest levels never differed significantly in shrub occupancy, they tended toward greater difference through time [2019: low vs. high, t(7) = −0.104, p = 1.000; 2020: t(7) = −2.84, p = 0.076; 2021: t(7) = −2.89, p = 0.070]. In 2019, both low and high forest plots had approximately 45% shrub occupancy (44 ± 0.04% in low and 45 ± 0.12% in high forest), but in 2020, there was a sharp increase in shrub occupancy in the high forest (to 66 ± 0.12%) and a slight decrease in the low forest (to 39 ± 0.05%), both of which persisted into 2021 (Figure 2A).
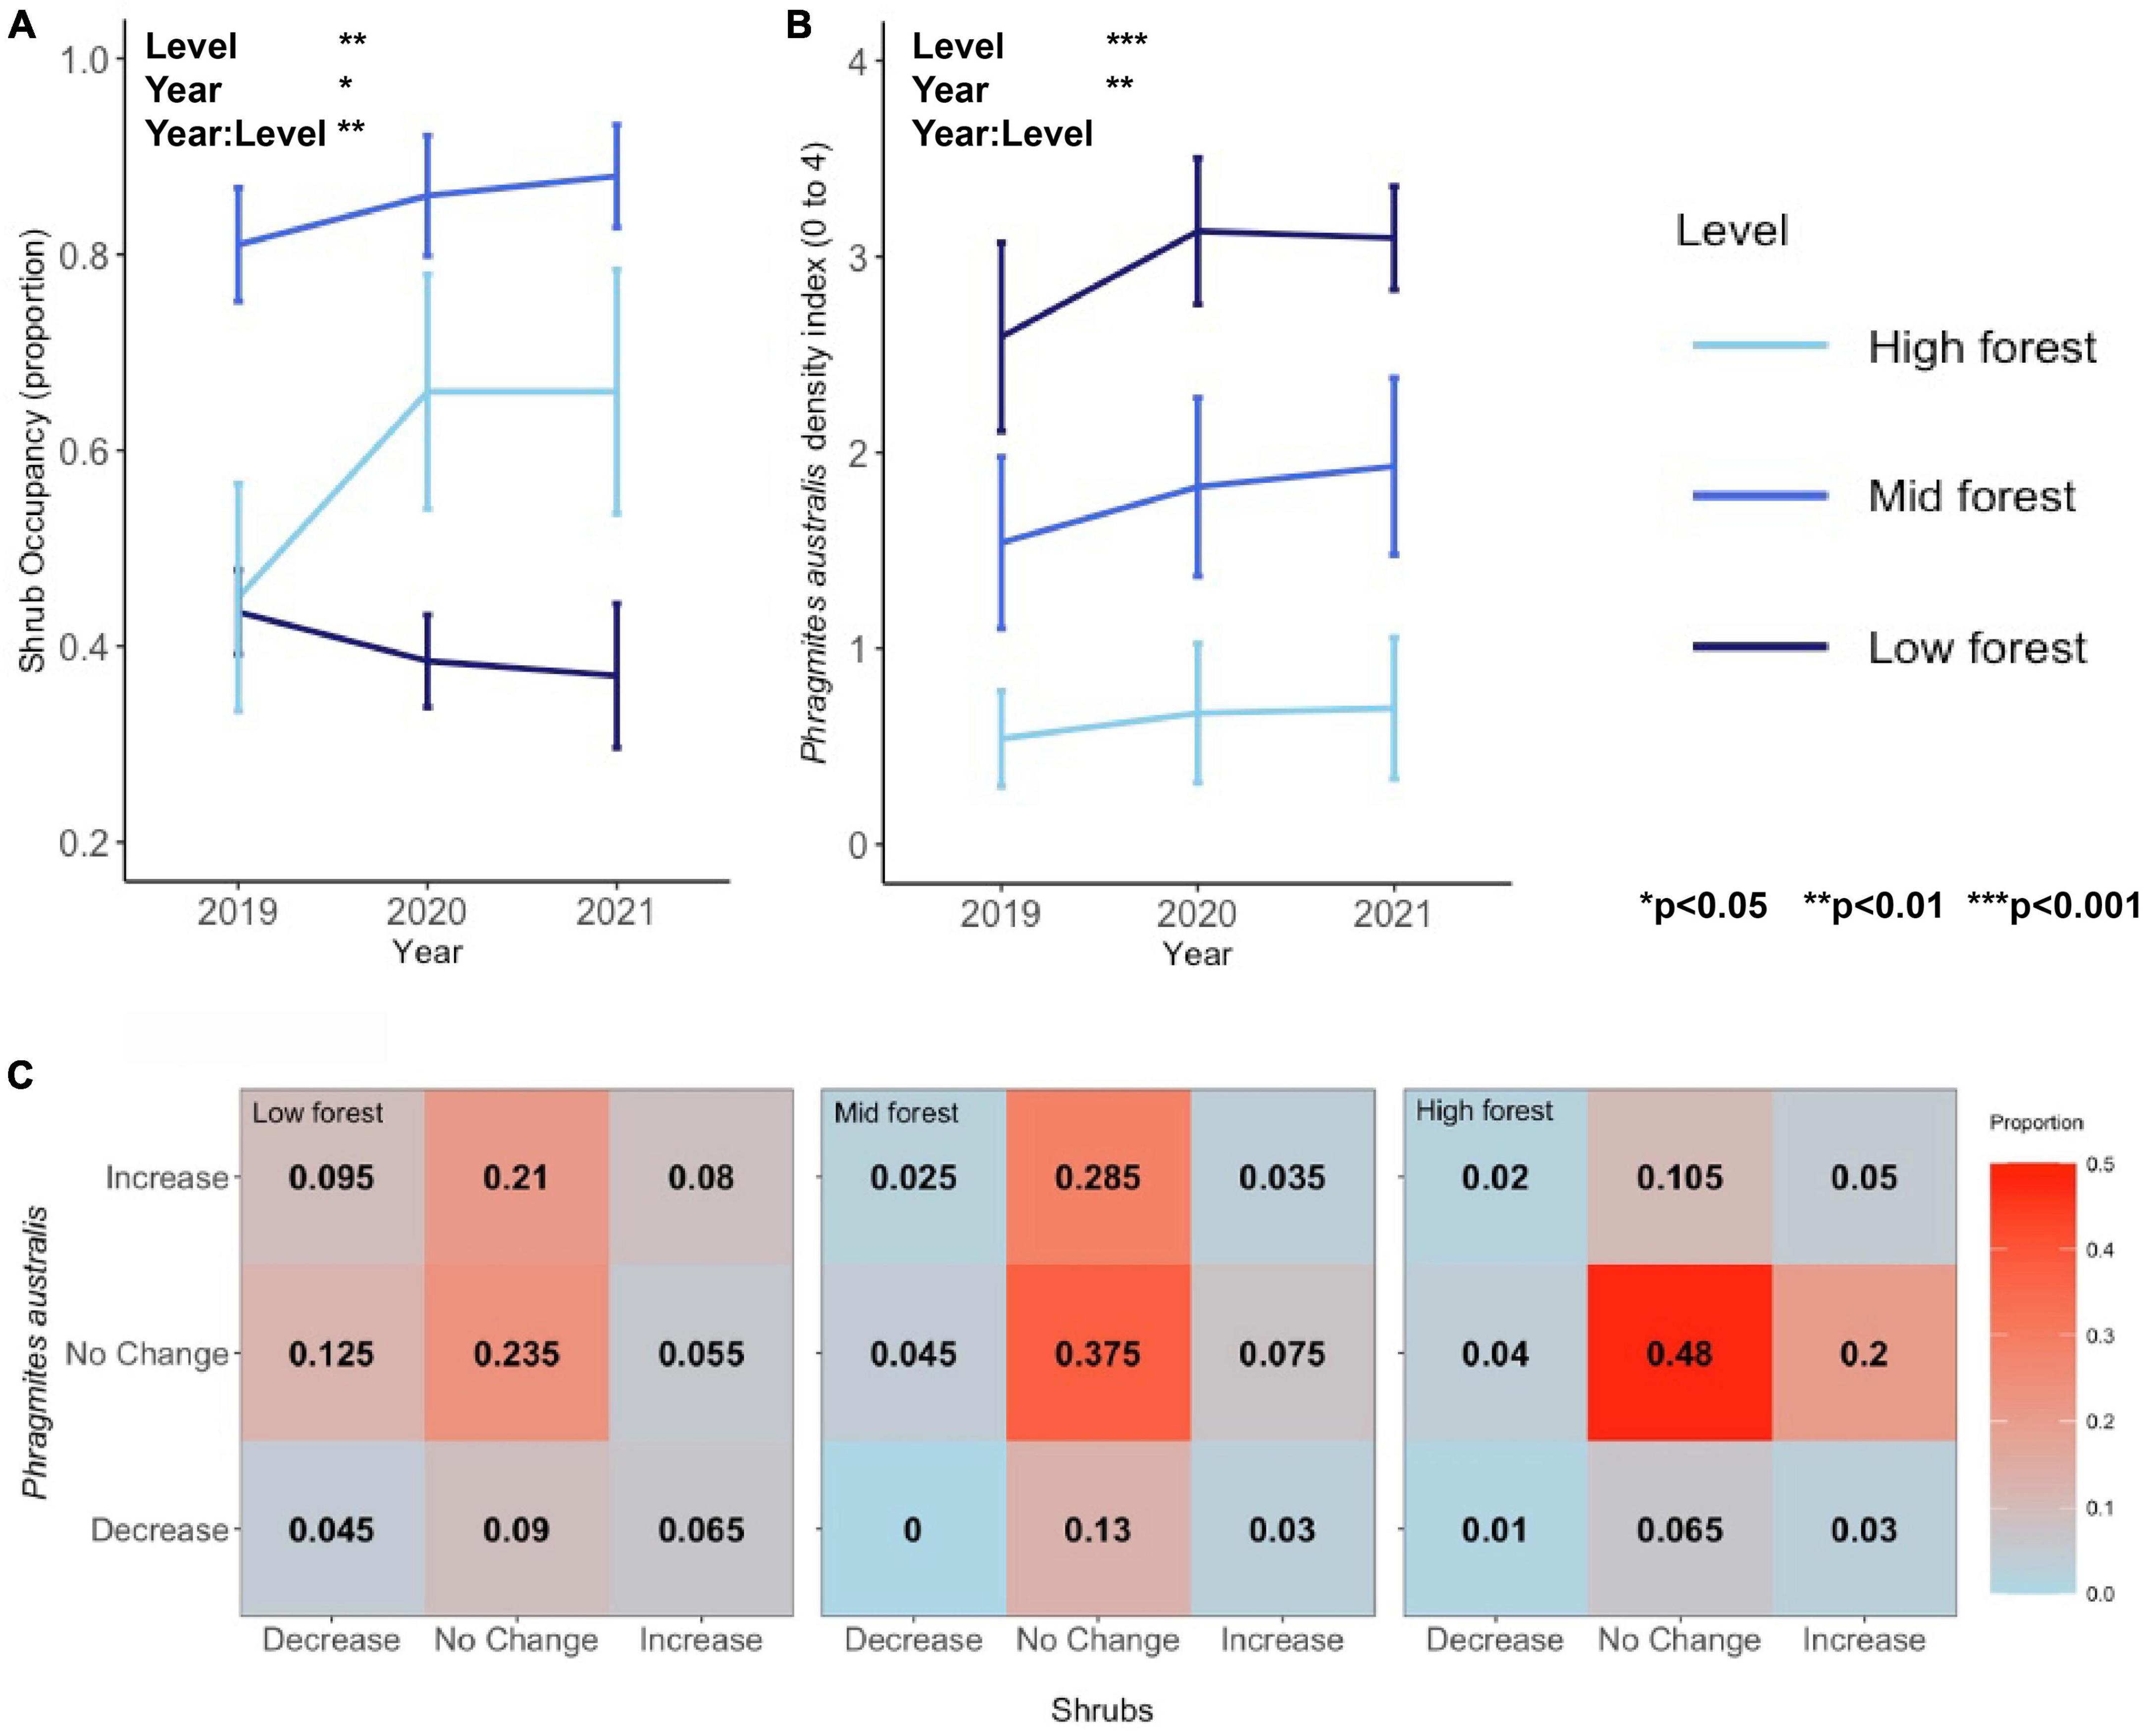
Figure 2. (A) Shrub occupancy, (B) Phragmites australis occupancy, and (C) a contingency table showing the proportion of points with increases, no change, and decreases in P. australis density or shrub occupancy in each of the forest levels. In panel (C), warmer colors represent higher proportions, with the highest proportion of points showing no change in both metrics.
As opposed to shrub occupancy, P. australis density peaked in the low forest (Figure 2, main effect of Level). P. australis density at the site increased across all forest levels from 2019 to 2020 [2019 vs. 2020, t(23) = −3.03, p = 0.018], but showed a more stagnant trend from 2020 to 2021 [2020 vs. 2021, t(24) = −0.77, p = 1.000]. Average P. australis density, using the index described, increased in the low forest from an average of 2.6 ± 0.5, or a handful of stems, in 2019 to 3.1 ± 0.3, a sparse stand, in 2021. P. australis increased in the mid forest from 1.5 ± 0.4 in 2019 to 1.9 ± 0.5 in 2021 and in the high forest from 0.5 ± 0.2 in 2019 to 0.7 ± 0.4 in 2021 (Figure 2 and Supplementary Figures 4, 5).
While there were more points in the low forest than mid or high forest levels that exhibited the expected “P. australis increase, shrub decrease” relationship (9.5% of points), the strongest pattern across all levels was overwhelmingly “no change, no change” (Figure 2C). Chi-square tests were non-significant for all levels (Table 2), indicating independence between distribution changes of P. australis and shrubs.
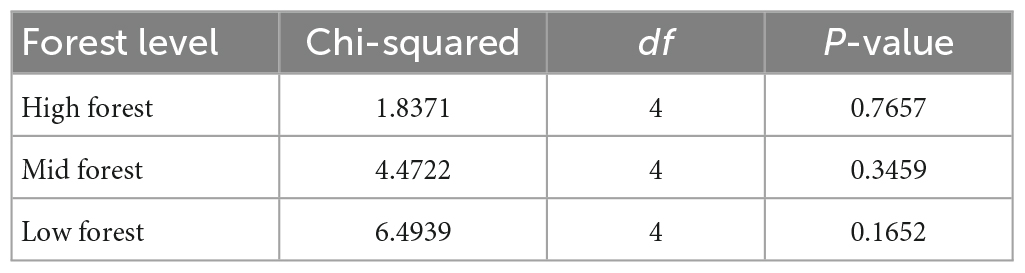
Table 2. Statistical summary table for Chi-square tests of the relationship between shrub presence and Phragmites australis presence in high, mid, and low forest plots.
Porewater salinity peaked in October 2019, due to a flooding event caused by Tropical Storm Melissa, which passed offshore during October 11–14, 2019 and elevated the spring tide series by about 1 m (Nordio et al., 2022). Although the coarse temporal coverage of porewater sampling may have missed other smaller flooding and saltwater intrusion events, independent high frequency sampling from several of the same forest plots (Fagherazzi and Nordio, 2022) suggests that the data presented here accurately represent the system. In all time points, porewater salinity was significantly higher in the low forest, where it ranged from 4 to 16 ppt, than in the high forest, where it ranged from 1 to 10 ppt (Level effect, Figure 3 and Table 3). In two of the four collection dates (on 2019-10-29 and 2021-08-08), porewater salinity in the low forest was also significantly higher than in the mid forest (Date: Level effect, Table 3), suggesting that the forest levels represented a consistent gradient in salinity stress, even as salinity stress varied considerably between sampling occasions (Date effect, Table 3). Similarly, canopy gap portion reflected a consistent stress gradient (Level effect, Table 3). There were significantly higher gap portions in the low forest (0.66 ± 0.02) than in the high [0.45 ± 0.03, t(23) = −8.20, p < 0.0001] and in the low forest than the mid forest [0.55 ± 0.02, t(23) = 3.03, p = 0.018]. Canopy gap portion was not statistically significantly different between time points, though there appeared to be a slight increase in the gap portion in the low forest from 2019 to 2020 (Figure 3B) that might represent a response of canopy trees to the 2019 flooding event. Relatedly, we observed a significant negative correlation between peak salinity with tree canopy cover and change in salinity with tree canopy cover (Figure 3C).
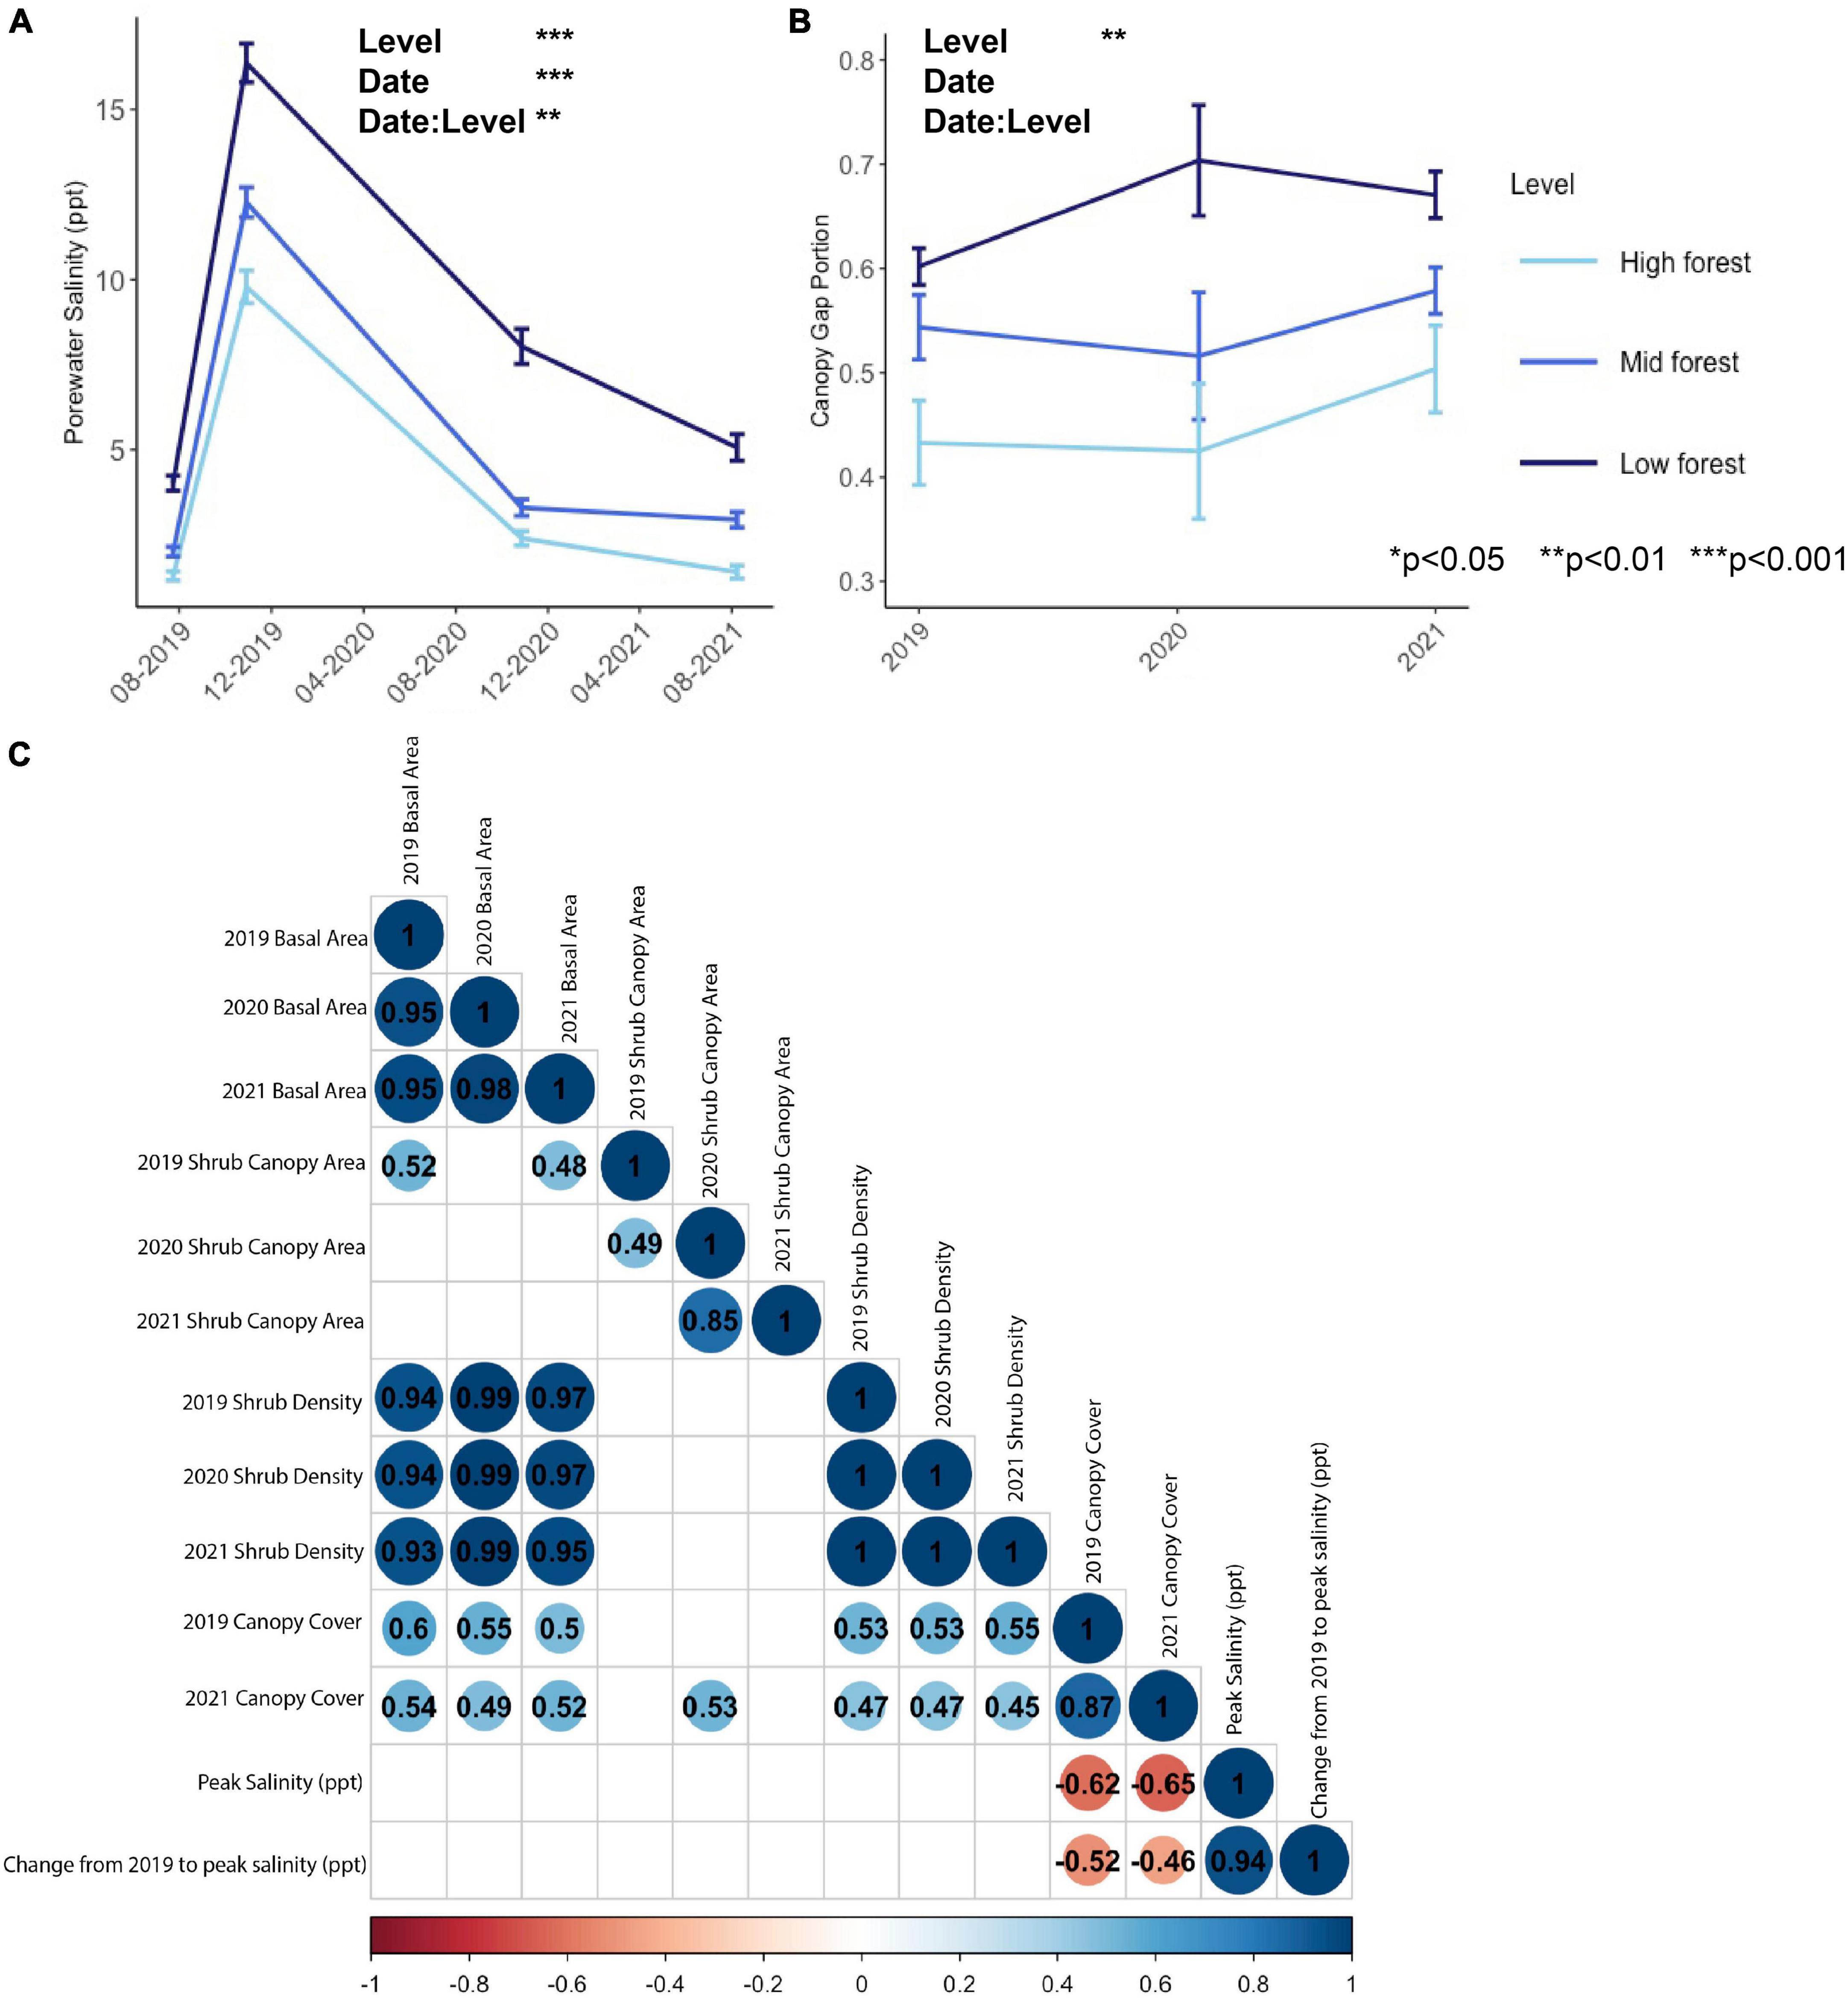
Figure 3. Abiotic variables of (A) porewater salinity sampled on four occasions, (B) canopy gap portion measured annually, and (C) correlations between abiotic variables and shrub metrics. In panel (C), only significant correlations are depicted; blank cells indicate non-significant relationships and values are correlation coefficients. Red colors indicate negative correlations and blue colors indicate positive correlations.

Table 3. Repeated measures ANOVA for abiotic variables.
We detected no significant correlation between peak salinity or change in salinity and any of the plot-scale shrub metrics (Figure 3C). However, there was a significant positive correlation of tree canopy cover with shrub density and shrub basal area in all years (Figure 3C).
In this 3-year period, we observed rapid growth of shrubs throughout the understory of the Brownsville Forest, particularly in the mid and high levels of forest, where the effects of sea level rise and saltwater intrusion are less visually apparent than in the low forest. Basal area of shrubs in the mid and high forest levels approximately tripled, as existing shrubs grew rapidly in stem diameter. Shrub landscape occupancy in the high forest increased from 45 to 66% between 2019 and 2020. The structure of the forest understory in the high forest plots, which began this short study as relatively open and with low vegetative cover, was transformed by M. cerifera expansion.
Compared to the mid and high forest, the shrub layer of the low forest had few shrubs and changed little over time. While shrubs expanded in mid and high forest plots, the low forest experienced a slight decrease in shrub occupancy. Low forest plots were instead characterized as having a higher density of P. australis, which increased gradually through time at all forest levels. Spread of P. australis at the trailing edge of retreating forest has now been observed at a number of sites throughout the Mid-Atlantic (Smith, 2013; Shaw et al., 2022). We observed that, relative to the dominance of P. australis in the low forest, shrub expansion is occurring in deeper areas of coastal forest, where forest dieback in response to salinity is less apparent. The shrub front is advancing ahead of the ghost forest edge.
That neither tree canopy cover nor porewater salinity had the predicted effect on shrub metrics is likely an outcome of the relatively short timescale of our study. Forest canopy gap portion did not significantly change during the study period; a longer time period is necessary to observe directional change across the site. Other studies of coastal vegetation change that spanned decadal timescales have detected effects of tree canopy cover decline and salinity increase on vegetation change (Taillie et al., 2019; Woods et al., 2021; Anderson et al., 2022). Instead, we observed a positive correlation of tree canopy cover with shrub basal area and shrub canopy area that reflects spatial autocorrelation of greater shrub dominance in the deeper forests levels where canopy cover is also greater.
As is typical of the coastal forest ecotone (Brinson et al., 1995; Taillie et al., 2019; Tully et al., 2019; Conner et al., 2022), salinity stress was highly dynamic during this study, with a pulse in soil porewater salinity attributable to a storm surge event early in the study period (Nordio et al., 2022). The porewater salinity levels reached 16 ppt in the low forest. In comparison, salinities in the mid and high forest levels ranged from 2 to 12 ppt and 1 to 10 ppt, respectively. Tolliver et al. (1997) observed 60% mortality in M. cerifera that were experimentally exposed to 10 ppt for 30 days, and 100% mortality in individuals exposed to 20 ppt. Seawater of 10 ppt can reduce germination probability in M. cerifera by about 50% relative to a freshwater control, and salinity of 20 ppt prevents germination entirely (Woods et al., 2020). Among coastal shrubs, M. cerifera was ranked as more sensitive to salinity than B. halimifolia and I. frutescens (Young et al., 1994). But M. cerifera is more salt-tolerant than many forest understory species, due to its adaptations to tolerate salinity stress, such as closing its stomata gradually to prevent damage to the photosynthetic apparatus (Naumann et al., 2008) and using its wide canopy to gather critical freshwater resources from rain (Allen and Conner, 2021). The moderate salinity tolerance of M. cerifera explains why the species appears to be thriving in the lower salinity zones of the mid and high forest, but is less common and exhibits slower rates of growth in the low forest, where salinity levels have breached its tolerance threshold.
Our hypothesis that the reduced density and growth of shrubs in the low forest might be explained by competition with P. australis was not supported, as we were unable to detect a negative correlation between M. cerifera and P. australis that would have been indicative of competitive exclusion. Instead, the lower density, slower growth, and decline in occupancy of M. cerifera in the low forest is better explained by a direct effect of high salinity. However, other indirect interactions may shape the distribution of M. cerifera in the coastal forests and possibly even favor M. cerifera expansion in the mid and high forest. For example, more negative effects of moderate salinity stress on trees than shrubs could mediate changes in water availability within soils which favor shrub expansion. Bird dispersal of M. cerifera (USDA, 2022) may also contribute to M. cerifera expansion in the mid and high forest, where perching trees offer habitat to birds, and gradual opening in the tree canopy provides enough sunlight at the forest floor for M. cerifera to thrive. Shrub-shrub positive feedbacks have been observed in barrier island swale plant communities, in which shrubs create a microclimate that enhances shrub recruitment (Wood et al., 2020). Lastly, M. cerifera has a symbiotic relationship with Frankia sp., an actinorhizal nitrogen-fixing bacteria (Kurten et al., 2008). Other studies have found that Frankia populations flourished in soils high in organic matter (Young et al., 1992; Wijnholds and Young, 2000). If mid and high forest soil provides higher quality resources for Frankia populations, this might benefit M. cerifera.
N-fixing shrubs in the Myricaceae have been known to radically alter ecosystem nutrient cycling (Vitousek et al., 1987). The effects of the invasion of Morella faya (formerly, Myrica faya) in the Hawaiian Islands are well-known (Vitousek et al., 1987); it alters successional processes through nitrogen enrichment and significantly increases the resource base for the entire ecosystem. Somewhat lesser known, where M. cerifera is introduced in the Hawaiian Islands, it also makes nitrogen more available to surrounding biota (Kurten et al., 2008). Similarly, M. cerifera can exert strong ecological effects in the maritime forest. A study on the barrier islands of Virginia’s Eastern Shore found that soil nitrogen content was highest in soil under M. cerifera thickets (Young et al., 1992). For this reason, we predict that the expansion of M. cerifera is likely to increase the supply of biologically available nitrogen in transitioning coastal forest.
Shrubification in other biomes has had many ecosystem-level effects beyond soil nutrient availability. The expansion of shrubs throughout the forest understory can strongly influence biodiversity, through changes in vegetation structure and soil properties (Archer et al., 2017). In other, more arid systems, woody plant encroachment has been shown to alter hydrologic cycles by changing soil infiltration rates, with effects on soil fertility and plant species richness (Archer et al., 2017).
For the case of M. cerifera expansion in the maritime forest, we expect that shifts in shrub-tree interactions will be a consequential outcome of shrubification. In M. cerifera thickets on barrier islands, recruitment of P. taeda seedlings was inhibited by shading (Tolliver et al., 1995). Lack of forest regeneration has been noted as a shift in P. taeda-dominated forests affected by salinity (Kearney et al., 2019). Therefore, shrub expansion and inhibition of tree recruitment may play a critical role in forest transition in this region. Shrub dominance has been suggested to be an intermediate or alternative successional pathway during forest transition (Woods et al., 2021). The enhanced growth and colonization of shrubs that we observed and this alternative trajectory may explain the large increase in scrub-shrub dominated areas during forest transition (Ury et al., 2021).
We observed encroachment by shrubs, specifically M. cerifera, in the understory of maritime forest, which we suggest is an indicator of transgression in advance of P. australis and the coastal forest treeline. Over the span of our study period, shrub metrics (canopy area, height, stem diameter, basal area, and occupancy) increased most dramatically in the mid and high forest. The dominance of M. cerifera in the understory of maritime forest may serve as an important indicator of ecosystem transition from healthy forest to ghost forest and eventually marsh. In this study, we add maritime forest to the list of ecosystems in which shrubification is occurring, and identify the likely driver as salinity stress related to sea level rise and saltwater intrusion.
The datasets presented in this study can be found in online repositories. The names of the repository/repositories and accession number(s) can be found below: The datasets generated and analyzed in this study are published in the Virginia Coast Reserve Data Catalog (http://www.vcrlter.virginia.edu/cgi-bin/browseData.cgi). Shrub and Phragmites data can be found within Gedan et al. (2022b), doi: 10.6073/pasta/f5d6779021676538649c445dc3a4fbf7 and abiotic data within Gedan et al. (2022a), doi: 10.6073/pasta/126bf89e433dd6cb8671c4a4d173b8f3.
KG conceived of the study. KG and AP designed the survey protocols. RS, AP, and KG collected the data in 2019 and 2021. CB and JM collected data during the 2020 season when the COVID pandemic made field work difficult. RS analyzed the data and wrote the first draft of the manuscript. All authors contributed to manuscript revision, read, and approved the submitted version.
This research was supported by the National Science Foundation under Grant No. LTER #1832221.
We are grateful to J. Zinnert for feedback on an earlier draft of the manuscript, to the following individuals who assisted with data collection in the field: A. Bollinger, J. MacGregor, and R. Mohammadi, and J. Porter for his assistance in data management and accessibility.
The authors declare that the research was conducted in the absence of any commercial or financial relationships that could be construed as a potential conflict of interest.
All claims expressed in this article are solely those of the authors and do not necessarily represent those of their affiliated organizations, or those of the publisher, the editors and the reviewers. Any product that may be evaluated in this article, or claim that may be made by its manufacturer, is not guaranteed or endorsed by the publisher.
The Supplementary Material for this article can be found online at: https://www.frontiersin.org/articles/10.3389/ffgc.2023.1167880/full#supplementary-material
Allen, S. T., and Conner, W. H. (2021). Localized augmentation of net precipitation to shrubs: A case study of stemflow funneling to hummocks in a salinity-intruded swamp. Front. For. Glob. Change 4:691321. doi: 10.3389/ffgc.2021.691321
Anderson, S. M., Ury, E. A., Taillie, P. J., Ungberg, E. A., Moorman, C. E., Poulter, B., et al. (2022). Salinity thresholds for understory plants in coastal wetlands. Plant Ecol. 223, 323–337.
Archer, S. R., Andersen, E. M., Predick, K. I., Schwinning, S., Steidl, R. J., Woods, S. R., et al. (2017). Woody plant encroachment: Causes and consequences. Rangel. Syst. 10, 25–84.
Bond, W. J., and Midgley, J. J. (2001). Ecology of sprouting in woody plants: The persistence niche. Trends Ecol. Evol. 16, 45–51. doi: 10.1016/s0169-5347(00)02033-4
Brinson, M. M., Christian, R. R., and Blum, L. K. (1995). Multiple states in the sea-level induced transition from terrestrial forest to estuary. Estuaries 18, 648–659.
Conner, W., Whitmire, S., Duberstein, J., Stalter, R., and Baden, J. (2022). Changes within a South Carolina coastal wetland forest in the face of rising sea level. Forests 13:414.
Duberstein, J. A., Krauss, K. W., Baldwin, M. J., Allen, S. T., Conner, W. H., Salter, J. S., et al. (2020). Small gradients in salinity have large effects on stand water use in freshwater wetland forests. For. Ecol. Manag. 473:118308.
Fagherazzi, S., and Nordio, G. (2022). Groundwater, soil moisture, light and weather data in Brownsville forest, Nassawadox, VA, 2019-2022. Madison, WI: Environmental Data Initiative. doi: 10.6073/PASTA/942A5A981E6E986C5FA1A9A9CD2EB8B7
Fagherazzi, S., Anisfeld, S. C., Blum, L. K., Long, E. V., Feagin, R. A., Fernandes, A., et al. (2019). Sea level rise and the dynamics of the marsh-upland boundary. Front. Environ. Sci. 7:25. doi: 10.3389/fenvs.2019.00025
GBIF.org (2023). GBIF occurrence download. Available online at: https://doi.org/10.15468/dl.hqzp7w
Gedan, K., MacGregor, J., Mohammadi, R., and Khan, A. (2022b). Forest transition experiment–vegetation monitoring on a coastal Virginia forest, 2019-2021. Madison, WI: Environmental Data Initiative. doi: 10.6073/PASTA/F5D6779021676538649C445DC3A4FBF7
Gedan, K., MacGregor, J., Mohammadi, R., and Khan, A. (2022a). Forest transition experiment–soil pore water salinity in a coastal Virginia forest. Madison, WI: Environmental Data Initiative. doi: 10.6073/PASTA/126BF89E433DD6CB8671C4A4D173B8F3
Götmark, F., Götmark, E., and Jensen, A. M. (2016). Why be a shrub? A basic model and hypotheses for the adaptive values of a common growth form. Front. Plant Sci. 7:1095. doi: 10.3389/fpls.2016.01095
Huang, H., Zinnert, J. C., Wood, L. K., Young, D. R., and D’Odorico, P. (2018). Non-linear shift from grassland to shrubland in temperate barrier islands. Ecology 99, 1671–1681. doi: 10.1002/ecy.2383
Kaarlejärvi, E., Baxter, R., Hofgaard, A., Hytteborn, H., Khitun, O., Molau, U., et al. (2012). Effects of warming on shrub abundance and chemistry drive ecosystem-level changes in a forest–tundra ecotone. Ecosystems 15, 1219–1233. doi: 10.1007/s10021-012-9580-9
Kassambara, A. (2022). rstatix: Pipe-friendly framework for basic statistical tests. Available online at: https://CRAN.R-project.org/package=rstatix (accessed January 30, 2023).
Kauffman, J. B., Arifanti, V. B., Basuki, I., Kurnianto, S., Novita, N., Murdiyarso, D., et al. (2016). Protocols for the measurement, monitoring, and reporting of structure, biomass, carbon stocks and greenhouse gas emissions in tropical peat swamp forests. Bogor: Center for International Forestry Research.
Kearney, W. S., Fernandes, A., and Fagherazzi, S. (2019). Sea-level rise and storm surges structure coastal forests into persistence and regeneration niches. PLoS One 14:e0215977. doi: 10.1371/journal.pone.0215977
Kirwan, M. L., and Gedan, K. B. (2019). Sea-level driven land conversion and the formation of ghost forests. Nat. Clim. Change 9, 450–457.
Kurten, E. L., Snyder, C. P., Iwata, T., and Vitousek, P. M. (2008). Morella cerifera invasion and nitrogen cycling on a Lowland Hawaiian lava flow. Biol. Invas. 10, 19–24.
Langston, A. K., Kaplan, D. A., and Putz, F. E. (2017). A casualty of climate change? Loss of freshwater forest islands on Florida’s Gulf Coast. Glob. Change Biol. 23, 5383–5397. doi: 10.1111/gcb.13805
Mekonnen, Z. A., Riley, W. J., Berner, L. T., Bouskill, N. J., Torn, M. S., Iwahana, G., et al. (2021). Arctic tundra shrubification: A review of mechanisms and impacts on ecosystem carbon balance. Environ. Res. Lett. 16:053001.
Mod, H. K., and Luoto, M. (2016). Arctic shrubification mediates the impacts of warming climate on changes to tundra vegetation. Environ. Res. Lett. 11:124028. doi: 10.1111/gcb.15910
Molino, G. D., Defne, Z., Aretxabaleta, A. L., Ganju, N. K., and Carr, J. A. (2021). Quantifying slopes as a driver of forest to marsh conversion using geospatial techniques: Application to Chesapeake Bay coastal-plain, United States. Front. Environ. Sci. 9:149. doi: 10.3389/fenvs.2021.616319
Naumann, J. C., Anderson, J. E., and Young, D. R. (2008). Linking physiological responses, chlorophyll fluorescence and hyperspectral imagery to detect salinity stress using the physiological reflectance index in the coastal shrub, Myrica cerifera. Remote Sens. Environ. 112, 3865–3875.
Naumann, J. C., Young, D. R., and Anderson, J. E. (2007). Linking leaf chlorophyll fluorescence properties to physiological responses for detection of salt and drought stress in coastal plant species. Physiol. Plant. 131, 422–433. doi: 10.1111/j.1399-3054.2007.00973.x
Nordio, G., Frederiks, R., Hingst, M., Carr, J., Kirwan, M., Gedan, K., et al. (2022). Frequent storm surges affect the groundwater of coastal ecosystems. Geophys. Res. Lett. 50:e2022GL100191.
Shao, G., and Halpin, P. N. (1995). Climatic controls of eastern North American coastal tree and shrub distributions. J. Biogeogr. 22, 1083–1089.
Shaw, P., Jobe, J. G. D. I., and Gedan, K. B. (2022). The invasive common reed Phragmites australis in subcanopy forest environments and implications for marsh migration. Estuaries Coast. 45, 539–550.
Smith, J. A. (2013). The role of Phragmites australis in mediating inland salt marsh migration in a Mid-Atlantic estuary. PLoS One 8:e65091. doi: 10.1371/journal.pone.0065091
Spinu, V., Grolemund, G., Wickham, H., Vaughan, D., Lyttle, I., Costigan, I., et al. (2018). Lubridate: Make dealing with dates a little easier, R package version, 1.
Taillie, P. J., Moorman, C. E., Poulter, B., Ardón, M., and Emanuel, R. E. (2019). Decadal-scale vegetation change driven by salinity at leading edge of rising sea level. Ecosystems 22, 1918–1930.
Thompson, J. A., Zinnert, J. C., and Young, D. R. (2017). Immediate effects of microclimate modification enhance native shrub encroachment. Ecosphere 8:e01687.
Tichý, L. (2016). Field test of canopy cover estimation by hemispherical photographs taken with a smartphone. J. Veg. Sci. 27, 427–435.
Tolliver, K. S., Colley, D. M., and Young, D. R. (1995). Inhibitory effects of Myrica cerifera on Pinus taeda. Am. Midl. Nat. 133, 256–263.
Tolliver, K. S., Martin, D. W., and Young, D. R. (1997). Freshwater and saltwater flooding response for woody species common to barrier island swales. Wetlands 17, 10–18.
Tully, K., Gedan, K., Epanchin-Niell, R., Strong, A., Bernhardt, E. S., BenDor, T., et al. (2019). The invisible flood: The chemistry, ecology, and social implications of coastal saltwater intrusion. BioScience 69, 368–378.
Ury, E. A., Anderson, S. M., Peet, R. K., Bernhardt, E. S., and Wright, J. P. (2020). Succession, regression and loss: Does evidence of saltwater exposure explain recent changes in the tree communities of North Carolina’s Coastal Plain? Ann. Bot. 125, 255–264. doi: 10.1093/aob/mcz039
Ury, E. A., Yang, X., Wright, J. P., and Bernhardt, E. S. (2021). Rapid deforestation of a coastal landscape driven by sea-level rise and extreme events. Ecol. Appl. 31:e02339. doi: 10.1002/eap.2339
USDA (2022). Morella cerifera, USDA plants database. Available online at: https://plants.usda.gov/home/plantProfile?symbol=MOCE2 (accessed August 22, 2022).
Van Auken, O. W. (2000). Shrub invasions of North American semiarid grasslands. Annu. Rev. Ecol. and systematics 31, 197–215.
Van Auken, O. W. (2009). Causes and consequences of woody plant encroachment into western North American grasslands. J. Environ. Manag. 90, 2931–2942. doi: 10.1016/j.jenvman.2009.04.023
Vitousek, P. M., Walker, L. R., Whiteaker, L. D., Mueller-Dombois, D., and Matson, P. A. (1987). Biological invasion by Myrica faya alters ecosystem development in Hawaii. Science 238, 802–804. doi: 10.1126/science.238.4828.802
Whittaker, R. H., and Woodwell, G. (1969). Structure, production and diversity of the oak-pine forest at Brookhaven, New York. J. Ecol. 57, 155–174.
Wickham, H., and Wickham, M. H. (2019). Package “stringr”. Available online at: http://stringr.tidyverse.org (accessed January 30, 2023).
Wijnholds, A. E., and Young, D. R. (2000). Interdependence of Myrica cerifera seedlings and the nodule forming actinomycete, Frankia, in a coastal environment. J. Coast. Res. 16, 139–144.
Wood, L. K., Hays, S., and Zinnert, J. C. (2020). Decreased temperature variance associated with biotic composition enhances coastal shrub encroachment. Sci. Rep. 10:8210. doi: 10.1038/s41598-020-65161-3
Woods, N. N., Swall, J. L., and Zinnert, J. C. (2020). Soil salinity impacts future community composition of coastal forests. Wetlands 40, 1–9.
Woods, N. N., Tuley, P. A., and Zinnert, J. C. (2021). Long-term community dynamics reveal different trajectories for two mid-Atlantic maritime forests. Forests 12:1063.
Young, D. R., Erickson, D. L., and Semones, S. W. (1994). Salinity and the small-scale distribution of three barrier island shrubs. Can. J. Bot. 72, 1365–1372. doi: 10.1139/b94-167
Young, D. R., Sande, E., and Peters, G. A. (1992). Spatial relationships of Frankia and Myrica cerifera on a Virginia, USA Barrier Island. Symbiosis 12, 209–220.
Zinnert, J. C., Shiflett, S. A., Via, S., Bissett, S., Dows, B., Manley, P., et al. (2016). Spatial–temporal dynamics in barrier island upland vegetation: The overlooked coastal landscape. Ecosystems 19, 685–697.
Keywords: shrubification, coastal change, salinization, saltwater intrusion (SWI), marsh migration, Morella cerifera, Phragmites australis
Citation: Sward R, Philbrick A, Morreale J, Baird CJ and Gedan K (2023) Shrub expansion in maritime forest responding to sea level rise. Front. For. Glob. Change 6:1167880. doi: 10.3389/ffgc.2023.1167880
Received: 16 February 2023; Accepted: 17 April 2023;
Published: 05 May 2023.
Edited by:
Pedro Álvarez-Álvarez, University of Oviedo, SpainReviewed by:
Sajad Ghanbari, University of Tabriz, IranCopyright © 2023 Sward, Philbrick, Morreale, Baird and Gedan. This is an open-access article distributed under the terms of the Creative Commons Attribution License (CC BY). The use, distribution or reproduction in other forums is permitted, provided the original author(s) and the copyright owner(s) are credited and that the original publication in this journal is cited, in accordance with accepted academic practice. No use, distribution or reproduction is permitted which does not comply with these terms.
*Correspondence: Keryn Gedan, a2dlZGFuQGd3dS5lZHU=
Disclaimer: All claims expressed in this article are solely those of the authors and do not necessarily represent those of their affiliated organizations, or those of the publisher, the editors and the reviewers. Any product that may be evaluated in this article or claim that may be made by its manufacturer is not guaranteed or endorsed by the publisher.
Research integrity at Frontiers
Learn more about the work of our research integrity team to safeguard the quality of each article we publish.