 Shengqi Jian
 Sijia Shi
 Jingkai Cui1
 Caihong Hu
- 1Yellow River Laboratory, Zhengzhou University, Zhengzhou, China
- 2PowerChina Guiyang Engineering Corporation Limited, Guiyang, China
Increasing climate change makes vegetation dynamic. At the same time, dynamic changes in vegetation not only have a feedback effect on climate change, but also affect the hydrological cycle process. Therefore, understanding the vegetation change and its response to climate change is a priority for predicting future climate change and studying the impact of vegetation change on the hydrological cycle. In this study, the Yellow River Basin in China is the study area. Based on the analysis of the evolution characteristics of meteorological elements and fractional vegetation cover (FVC), the delta downscaling Coupled Model Intercomparison Project Phase 6 (CMIP6) models are optimized. The empirical orthogonal function (EOF) and singular value decomposition (SVD) methods are used to investigate the impact of climate change on vegetation in the Yellow River Basin. The results show that: (1) in the four scenarios (SSP126, SSP245, SSP370, and SSP585), FVC in the Yellow River Basin from 2022 to 2100 shows an increasing trend, SSP370 (0.017 10a–1) > SSP126 (0.014 10a–1) > SSP245 (0.0087 10a–1) > SSP585 (0.0086 10a–1). Spatially, FVC in most regions of the Yellow River Basin show an increasing trend under the four scenarios, and the degraded areas are concentrated in a small part of the Yellow River headwaters. (2) There is a significant positive correlation between FVC and precipitation (Pre) and temperature (Tem) under four scenarios in the Yellow River Basin from 2022 to 2100. Under the same scenario, the annual average temperature can be considered as the dominant factor of FVC change in the Yellow River Basin. Under different scenarios, the impact of climate change on FVC under the high emission scenarios is greater than that under the low emission scenarios. This study will help to better understand the response of vegetation to climate change and provide a scientific basis for formulating ecological protection measures to cope with future climate change in the Yellow River Basin.
1. Introduction
Vegetation is an important part of the terrestrial ecosystem. It interacts with the atmosphere, soil, and water to achieve the exchange of matter and energy. It plays an important role in maintaining the structure, function and environment of the Earth system (Qian et al., 2019). Vegetation is highly sensitive to environmental conditions. Climate change and human activities put vegetation in a long-term dynamic evolution by changing the heat and water received by plants. From a long time series and a large spatial scale, the dynamic evolution of vegetation is mainly controlled by climate conditions (Piao et al., 2020). Accordingly, vegetation dynamics can also feed back to climate by influencing surface energy balance, evapotranspiration and surface roughness (Duveiller et al., 2018). Thus, terrestrial ecosystems and climate systems are tightly coupled. According to the Sixth Assessment Report of the Intergovernmental Panel on Climate Change, the upward trend in global temperature has accelerated significantly in recent years. Along with rising temperatures, average annual precipitation over the world’s land surface will gradually increase, and more areas will experience significant increases or decreases in precipitation. It is widely accepted that this series of climate changes, characterized by rapid warming, may pose a threat to current and future vegetation diversity and productivity (Hay et al., 2011). Therefore, understanding vegetation responses to climate change is very important for maintaining vegetation diversity and productivity in the future.
Previous studies mainly focused on vegetation responses to climate change in China and suggested that precipitation played a dominant role in vegetation changes in arid and semi-arid regions, while temperature was essential for alpine vegetation (Ge et al., 2021). Since the end of the last century, the effect of climate change on vegetation activity has become more evident in most areas of China (Liu et al., 2022). In particular, climate change leads to unstable vegetation growth in humid areas such as southwest and central China (Jiang et al., 2022). In the northwestern arid region, vegetation activity decreases with climate warming (Gao et al., 2017). However, these studies usually only cover nearly 30 years and cannot well predict the impact of future climate change on vegetation.
The CMIP global climate models (GCMs) provide valuable information for long-term climate prediction from global to sub-continental scales (Iqbal et al., 2020). Building on the previous CMIP5, CMIP6 is the latest and most advanced multi-model dataset (Eyring et al., 2016; Bagcaci et al., 2021). CMIP6 fills the gap left by CMIP5 and can better represent physical processes at smaller scales. At the same time, CMIP6 provides a set of future scenarios based on the most recent emissions trends and land use: the shared socio-economic pathways (SSPs) (O’Neill et al., 2016). SSPs cover a wider range of forces and take into account broader socio-economic conditions in the future. At this stage, many researchers mainly use statistical models to predict future vegetation. These statistical models typically use precipitation and temperature as driving data in CMIP6 (Li et al., 2022a). Zhou et al. (2020) established an NDVI prediction model based on precipitation and evapotranspiration data to predict the future dynamic changes of vegetation NDVI in China. Yuan et al. (2021) established an LAI prediction model based on precipitation and temperature data to predict the future trend of vegetation change in Northeast China. These statistical models for predicting future vegetation are based on the relationship between observed vegetation and climate drivers. Statistical models can reveal detailed local relationships, but they do not take into account the mechanisms of vegetation change (Wang et al., 2022). Now CMIP6 has provided the most recent prediction of future vegetation, allowing us to use vegetation data directly for prediction (Eyring et al., 2016). The advantage of using vegetation prediction data directly from CMIP6 is that GCMs have incorporated biophysical, biogeochemical and carbon cycle processes to account for the mechanisms of vegetation change under global warming (Wang et al., 2022). However, GCMs have low spatial resolution, which leads to greater uncertainty in GCMs. To improve the application of GCMs at the regional scale, it is necessary to obtain more high-resolution climate information. For this reason, many downscaling methods are widely used in GCMs and have been proven to effectively improve the simulation results of regional climate change (Zhou et al., 2019). Commonly used downscaling methods include statistical downscaling and dynamic downscaling. Based on mathematical and physical mechanisms, dynamic downscaling requires a lot of computational resources. Compared to dynamic downscaling, statistical downscaling requires less computation and is simpler. Therefore, it is often used to develop climate change predictions with high spatial resolution (Gebrechorkos et al., 2019). The use of downscaling methods can reduce the bias in GCMs to some extent, allowing us to apply GCMs at the regional scale.
Located in the arid and semi-arid regions of China, the Yellow River Basin is an important ecological barrier and economic zone in northern China, and plays an important strategic role in China’s ecological protection and construction (Chen et al., 2021a). At the same time, the ecological environment of the Yellow River Basin is fragile and sensitive to climate change, and there are serious problems such as soil erosion and desertification (Liu et al., 2022). In order to formulate appropriate strategies to effectively mitigate future climate warming and cope with the challenges posed by future climate change to the ecosystem, it is necessary to understand future climate change models and vegetation responses to future climate change on the basis of understanding the historical climate change model and vegetation responses to historical climate change. However, research on vegetation responses to climate change in this region mainly focuses on historical periods, and research on future climate change is less. In this study, the Yellow River Basin is the study area. And in the Yellow River Basin, the downscaling performance of 39 kinds of precipitation, temperature and three kinds of FVC CMIP6 climate model data under five interpolation methods are evaluated by multiple indicators. Then, the interpolation methods suitable for the downscaling process of the Yellow River Basin and the climate models with strong simulation ability for the Yellow River Basin are selected. Then, EOF was used to analyze the future change trend of FVC in the Yellow River Basin, and SVD was used to analyze the response of vegetation to precipitation and temperature. The results of this study are helpful in understanding the response of vegetation dynamics to climate change, and provide a scientific basis for formulating ecological protection measures to cope with future climate change in the Yellow River Basin.
2. Materials and methods
2.1. Study area
The Yellow River (32°–42°N, 96°–119°E), the second largest river in China, has a total length of 5464 km (3,395 miles), and its basin area is 795,000 square kilometers. It is an important ecological barrier and economic zone in China. The terrain in the basin covers the four major geomorphic units. The vegetation types in the basin are mainly deciduous broadleaf forest belt, grassland belt, desert belt and Qinghai Tibet Plateau vegetation belt. The soil types mainly include meadow soil, cinnamon soil, chestnut soil, brown calcareous soil, gray calcareous soil, black loessial soil, yellow cotton soil, and aeolian sand soil. Influenced by the continental monsoon, the climate in the basin is complex (arid, semi-arid, and semi humid), and the climate in different regions is significantly different. The annual precipitation in the basin is about 200–650 mm, mainly showing a decreasing trend from southeast to northwest; The annual average temperature is about 4°C, mainly showing a decreasing trend from east to west. At the same time, the water resources in the Yellow River basin are generally strained. Most of the areas are located in arid and semi-arid regions, which are vulnerable to the effects of climate and human activities. The ecological environment is fragile, and the overall landscape pattern tends to be complex, fragmented, and decentralized. In this paper, the Yellow River basin is divided into 22 sub-basins, named after the mainstream or tributaries of the Yellow River (Figure 1).
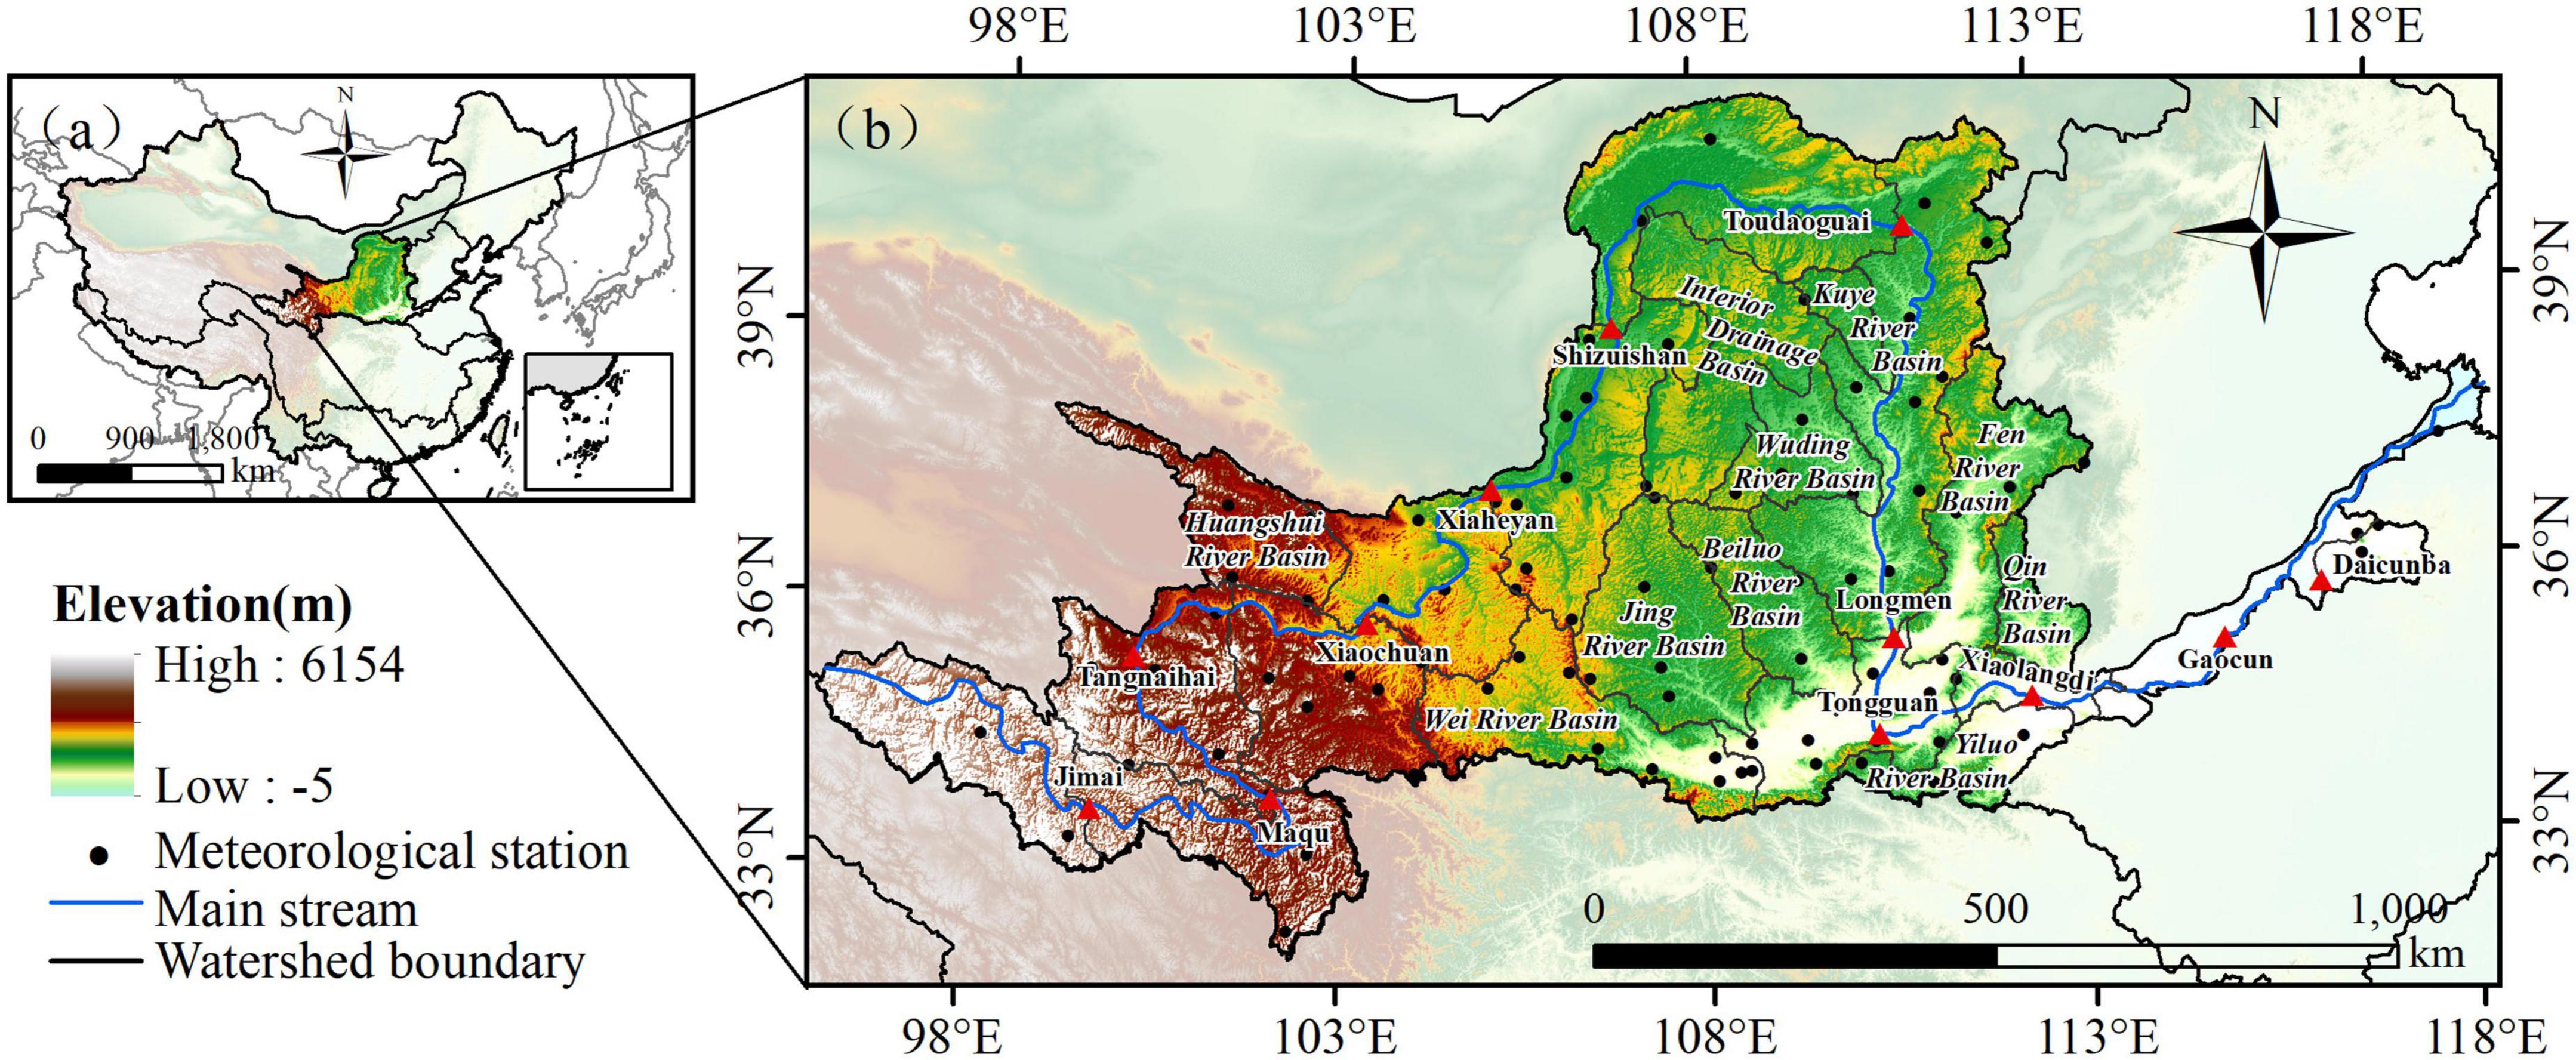
Figure 1. Study area.
2.2. Datasets
2.2.1. NDVI
Advanced very high resolution radiometer (AVHRR) NDVI derived from GIMMS NDVI3g, a semi-monthly maximum composite product released by Global Inventor Modeling and Mapping Studies (GIMMS) of NASA, with a spatial resolution of 0.083° and a time span of 1982–2015.
2.2.2. Precipitation and temperature
The measured data of 93 hydrological stations in the Yellow River Basin from 1991 to 2014 were obtained from the National Data Center for Meteorological Sciences1 the spatial resolution is 1 km, including the datasets of daily precipitation and daily mean temperature. Some missing data were reasonably interpolated by hydrological analogy method and linear interpolation method.
The dataset of cumulative precipitation and mean temperature in China over the past 30 years with a spatial resolution of 1 km during 1971–2000. The data was obtained from the National Ecosystem Science Data Center (NESDC).2
2.2.3. CMIP6 climate model data
In this study, CMIP6 climate model data were obtained from ESGF3 including four different Shared SSPs in four future time periods (2021–2040, 2041–2060, 2061–2080, and 2081–2100), low emission scenario SSP126, medium emission scenario SSP245, relatively high emission scenario SSP370 and highest emission scenario SSP585. The CMIP6 data contains the following datasets:
1) Precipitation and temperature simulation datasets of monthly average temperature (Tem) and monthly precipitation (Pre) from 39 climate models (Table 1).

Table 1. Summary of 39 GCMs for temperature and precipitation and 3 GCMs for fractional vegetation cover (FVC) from CMIP6.
2) Fractional vegetation cover (FVC) simulation datasets from three climate models (Table 1).
2.3. Methods
2.3.1. Dimidiate pixel model
The dimidiate pixel model (Carlson and Ripley, 1997; Gutman and Ignatov, 1998; Zeng et al., 2000) is a commonly used linear model. The model assumes that the surface information of each pixel includes two types of data, vegetation, and non-vegetation. FVC of this pixel is equal to the weight of the vegetation covered surface in the pixel surface. The commonly used dimidiate pixel model for retrieval of FVC from NDVI is described in Gutman and Ignatov (1998), as follows:
where, f is the fractional vegetation coverage of the pixel, NDVI is the normalized vegetation index of the pixel, NDVIveg is the NDVI of the vegetation endmember, and NDVIsoil is the NDVI of the bare soil endmember. Some scholars use the method described by Zeng et al. (2000) to calculate NDVIveg (Wu et al., 2014; Ding et al., 2016a,b). In theory, this method can accurately calculate NDVIveg, but it is not easy in practical application, because it depends on accurate vegetation type classification. Similarly, the same problem arises with the NDVIsoil calculation process, which relies on an accurate and continuous classification of soil types. However, accurate and continuous vegetation type classification and soil type classification are not easy to obtain, and the calculation is complex. Therefore, at present, the maximum and minimum values of NDVI in the confidence interval are usually used as NDVIveg and NDVIsoil. In this study, NDVI with cumulative frequency of 5 and 95% is taken as NDVIsoil and NDVIveg to eliminate the error caused by remote sensing image noise to some extent (Carlson and Ripley, 1997; Rundquist, 2002). In this study, this model is used to estimate the observed values of FVC (FVCobs), based on GIMMS NDVI3g.
2.3.2. Delta downscaling
Delta downscaling is a statistical downscaling method. Based on the measured sequence of a variable in the reference period and the characteristic value of the corresponding variable observation sequence (such as the absolute increase of temperature, the relative change rate of precipitation), high-resolution GCM data can be obtained. This method is relatively simple and requires less computation. It can reduce the simulated values of GCMs data to specific observation stations. The formula is as follows:
where, Temf represents Tem after downscaling, Temobs_ref represents the measured data of Tem in the reference period, TemGCMs_f represents GCMs data of Tem in the prediction period, TemGCMs_ref represents GCMs data of Tem in the reference period. Other symbols have similar meanings.
After downscaling, the spatial resolution of Temf and Pref is 1 km, and the spatial resolution of FVCf is 0.083°. Then Temf, Pref, and FVCf are resampled to the same spatial resolution, 0.083°, and used for later research.
2.3.3. Optimization of GCMs
Different GCMs have different abilities to simulate climate change in the basin. At the same time, different interpolation methods in the downscaling process also affect the results. In this study, five interpolation methods are used in the downscaling process, namely Spline, Kriging, Inverse Distance Weighted, Natural Neighbor Interpolation, and Bilinear Interpolation. In order to select an appropriate GCM to reduce the uncertainty brought by the GCMs, four evaluation indicators, mean absolute error (MAE), time skill score (TS), Taylor chart based evaluation method (S) and spatial skill score (SS), are used to evaluate the simulation ability of high-resolution GCMs data obtained by different interpolation methods on Pre, Tem, and FVC in the Yellow River basin. Then, the error rank under each index is calculated and the comprehensive rank is performed with equal weight. This comprehensive rank is used as the basis for selecting interpolation methods and GCMs to reduce the uncertainty caused by GCMs and interpolation methods. The smaller the value of MAE and TS, the better the simulation skill; the closer the value of S and SS to 1, the better the simulation skill.
Based on the monthly mean annual precipitation (temperature) from 1971 to 2000, the delta downscaling was applied to regional downscaling of 39 GCMs, and the validity of the monthly precipitation (temperature) simulation data was verified in 1995–2014. Based on the monthly multi-year average FVC from 1995 to 2014, delta downscaling is used to conduct regional downscaling for three GCMs. The technology roadmap is as follows (Figure 2).
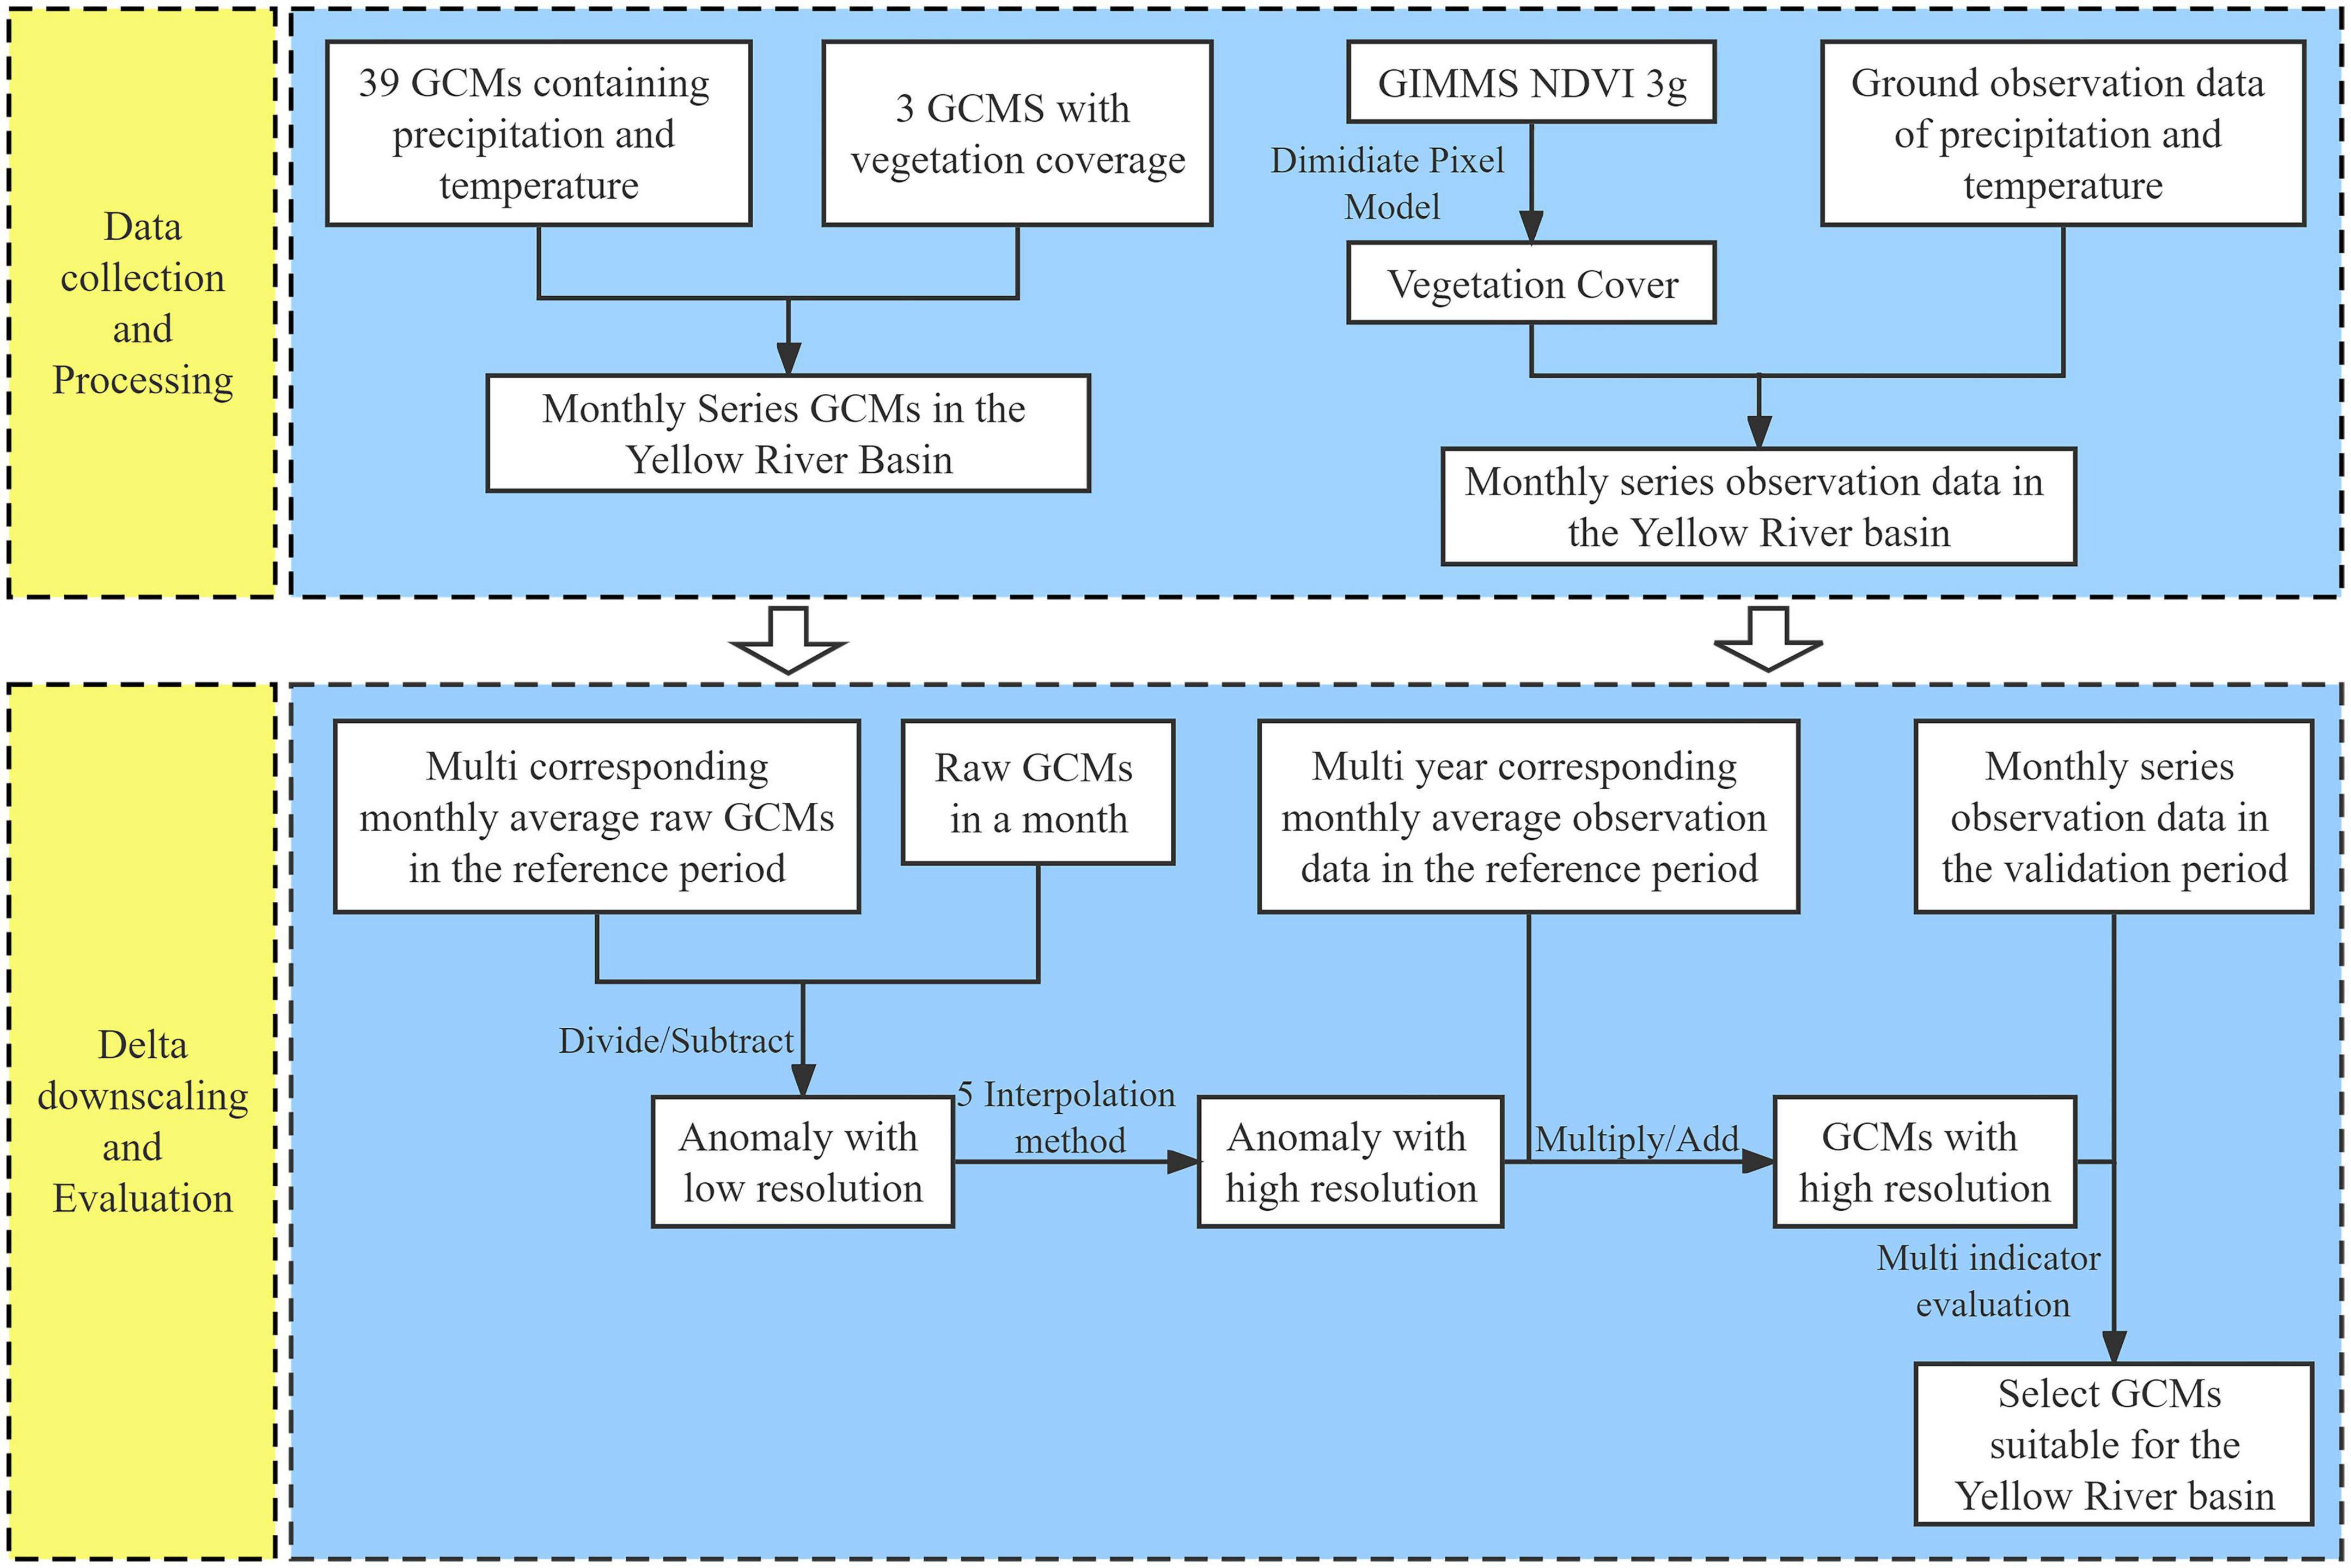
Figure 2. The downscaling and optimization of GCMs.
Coupled Model Intercomparison Project Phase 6 was officially approved in 2014, with the future period of the climate model set at 2015–2100 and divided into several scenarios for prediction. Therefore, when using remote sensing observation data to verify climate model data, it is impossible to select a specific climate model data and remote sensing observation data from 2015 to 2021 for verification. At the same time, the study uses climate model data to capture vegetation cover in a long time series. However, 2015–2022 has actually occurred. Therefore, in order to be consistent with the historical and future period division of CMIP6, and for the sake of rationality, the climate model data of 2015–2021 are not added in this study.
2.3.4. Space field analysis
2.3.4.1. Empirical orthogonal function
Empirical orthogonal function (EOF), through linear decomposition, decomposes the spatio-temporal dataset into multiple spatial feature vectors (spatial modes) and corresponding time series (time coefficients), thereby reflecting the spatial characteristics of the original variables and their changes with time, and is widely used to identify spatio-temporal patterns of climate change (Xu et al., 2002).
The multiple modes obtained by EOF are mutually orthogonal in space and converge quickly. The higher the modal contribution, the more important it is to characterize the properties represented by the mode. In this study, North is used to test the significance of each mode, and the first n modes that pass the North test and whose cumulative variance contribution rate reaches 85% are selected to analyze the temporal and spatial change trend of FVC in the Yellow River basin.
2.3.4.2. Singular value decomposition
Singular value decomposition (SVD) is an important tool to extract the coupling signals of two element space fields (Li et al., 2014). The SVD method is used to analyze the correlation between two element field sequences. It can obtain the spatial mode and time change information of the correlation field between pairs of variable fields, and its results reflect the spatial correlation degree of the two variable fields.
The same and different correlation coefficients of the left and right fields can be obtained by SVD. This study mainly analyzes the different correlation coefficients (referred to as correlation coefficients in the analysis). The different correlation coefficients refer to the correlation between the left field (right field) anomaly sequence and the right field (left field) modal time coefficients. A higher value means a stronger correlation. In this study, the T-test is used to judge whether the SVD results are statistically significant. The first n modes that pass the T-test and whose cumulative variance contribution rate reaches 90% are selected for analysis.
3. Results
3.1. Model optimization
3.1.1. Climatic factor
For precipitation, the Kriging interpolation method has the smallest error in four different evaluation indicators, so the Kriging interpolation method for precipitation can significantly reduce the interpolation error of GCMs. CanESM5, NESM3, CESM2-WACCM, FIO-ESM-2-0, INM-CM5-0, CESM2-WACCM, NorESM2-LM, ACCESS-CM2, ACCESS-ESM1-5, IPSL-CM6A-LR, and other climate models rank highly. Taking into account of the data integrity and the actual simulation performance of the GCMs, and in order to further reduce the error caused by outliers, ACCESS-ESM1-5, CESM2-WACCM and IPSL-CM6A-LR, which are the top three in the comprehensive ranking, are used to construct the MME dataset (Figure 3). The correlation between the Pre data observed on the ground and the Pre data from ACCESS-ESM1-5, IPSL-CM6A-LR, and CESM2-WACCM is relatively consistent. Overall, the GCM Pre data are smaller than the ground observation data and there are some outliers. The ground observation and the MME dataset are more concentrated than the three independent GCMs (Figure 4).
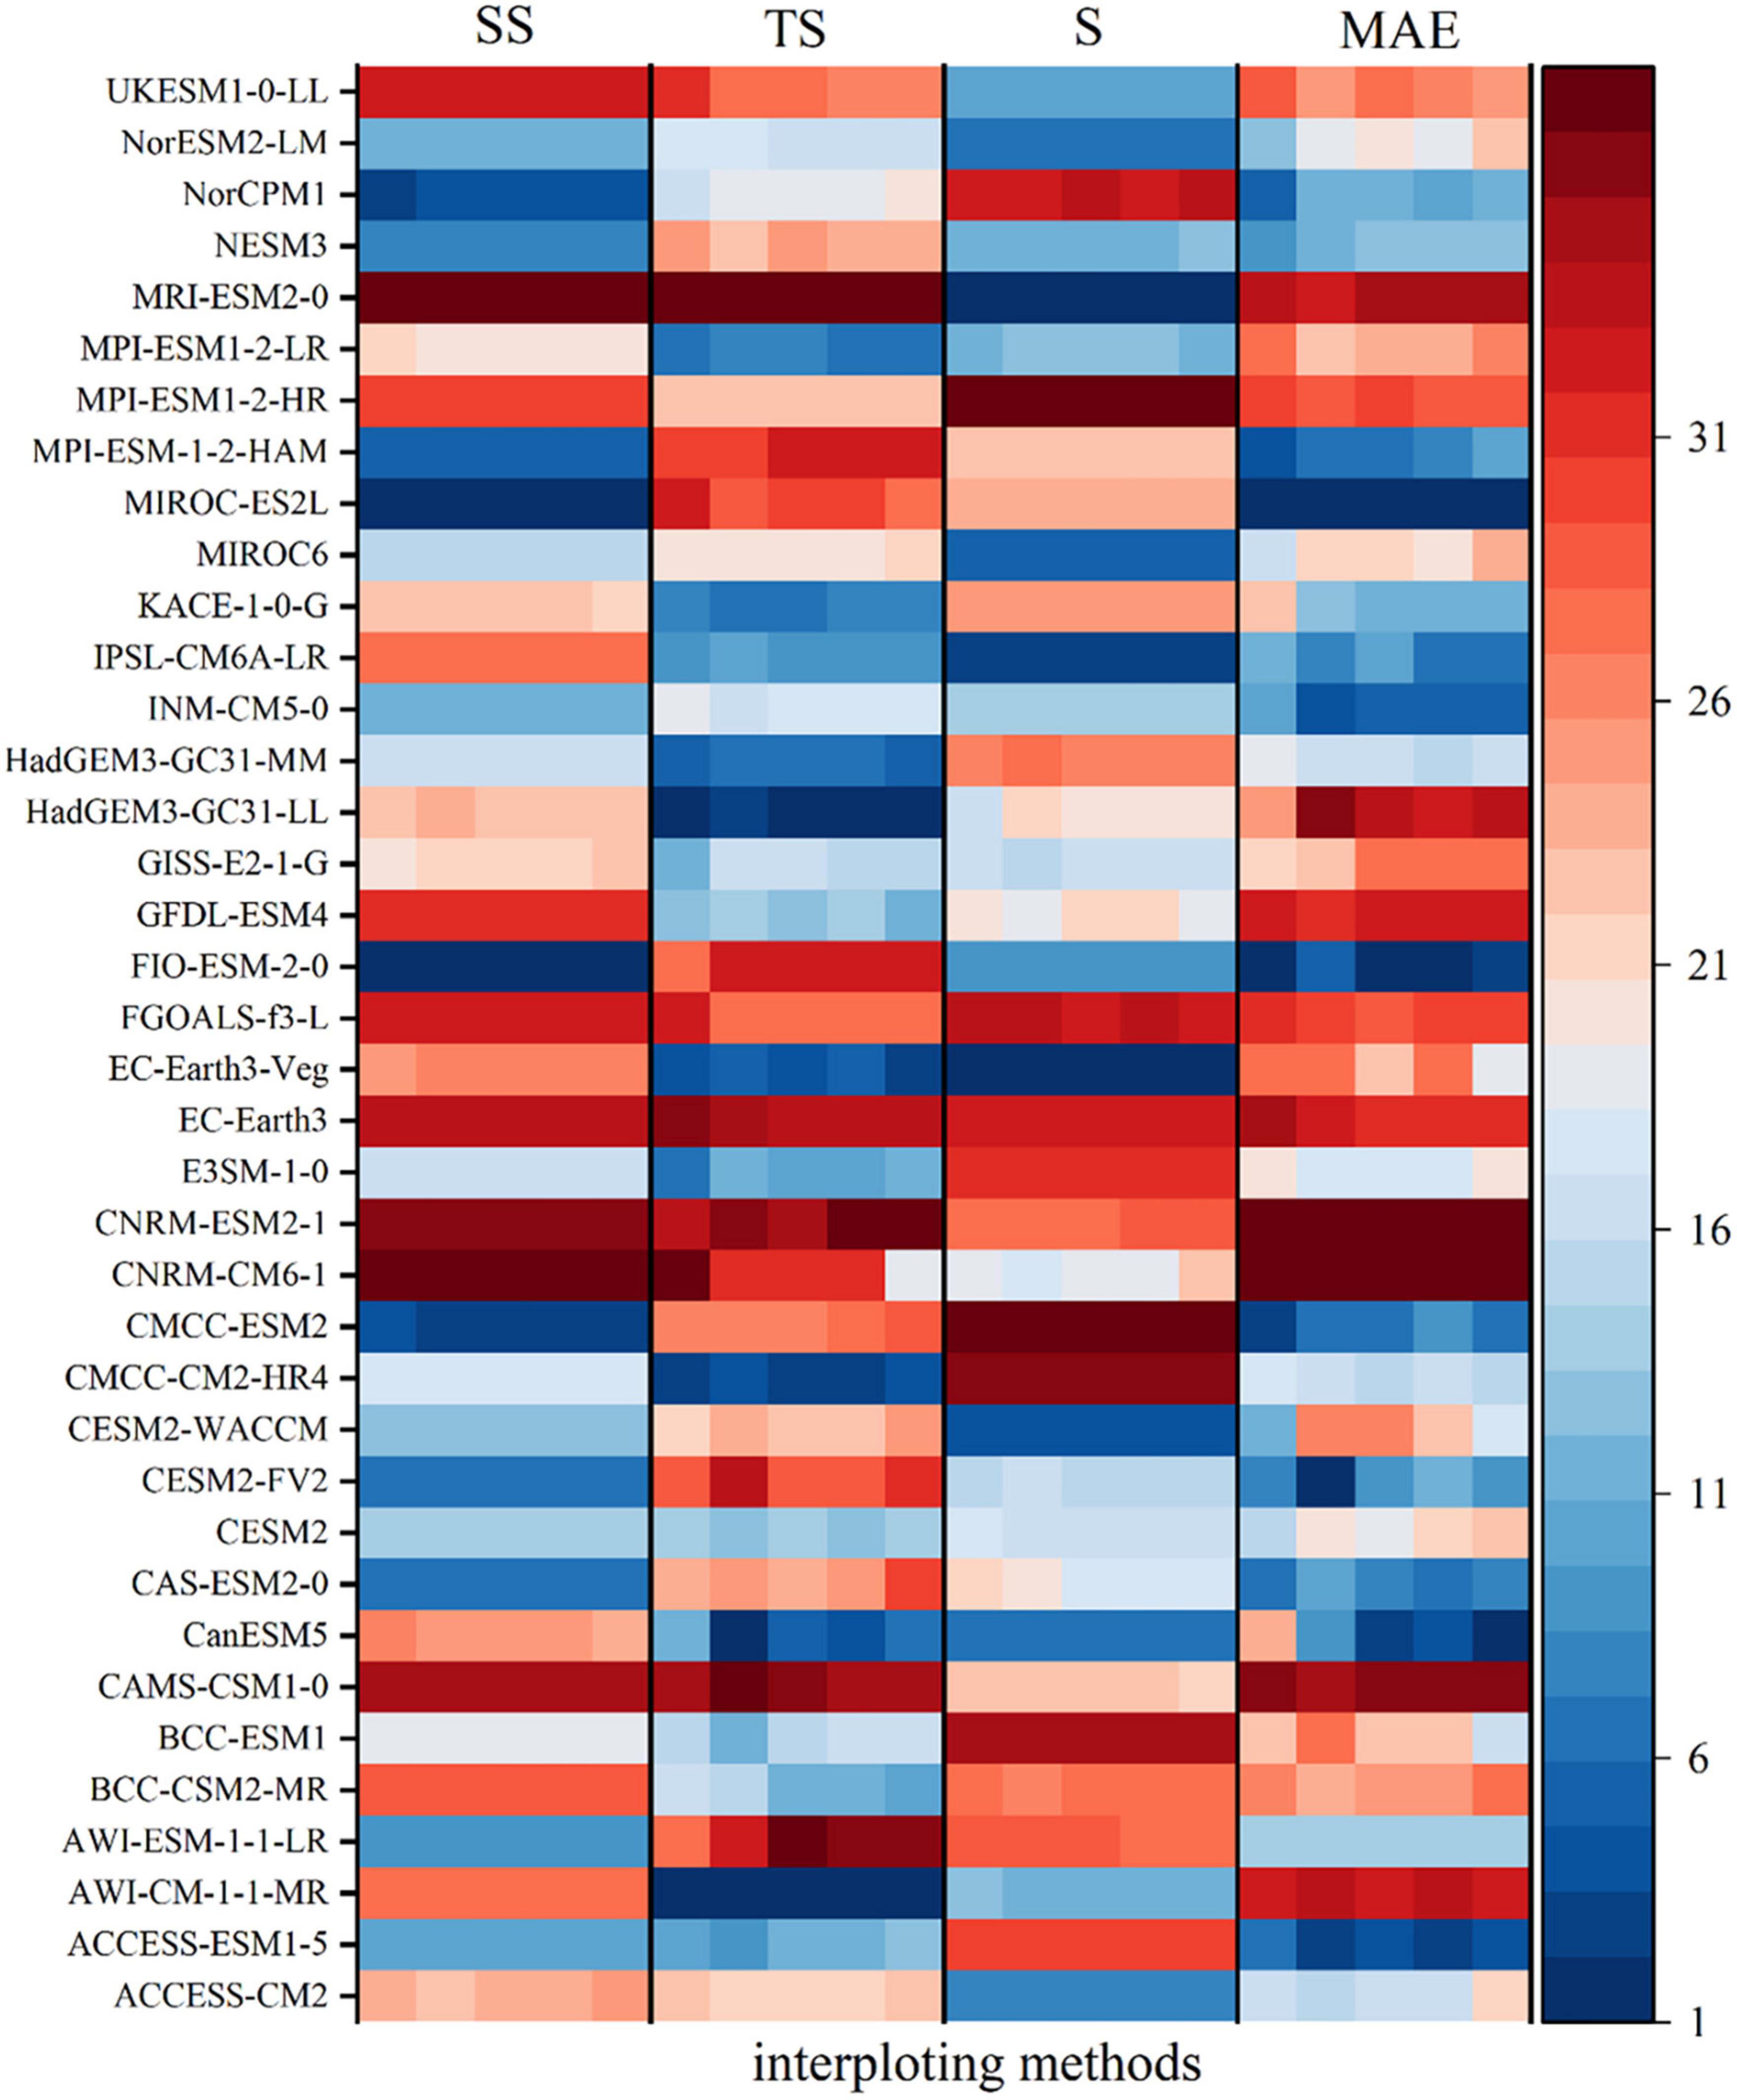
Figure 3. The fitting performance ranking of the monthly Pre series of the Yellow River basin simulated by 39 GCMs and measured at the stations from 1995 to 2014 under different interpolation and evaluation indicators; under each evaluation method is the evaluation ranking of five interpolation methods: Kriging, Idw, BILINEAR, Natural, and Spline.
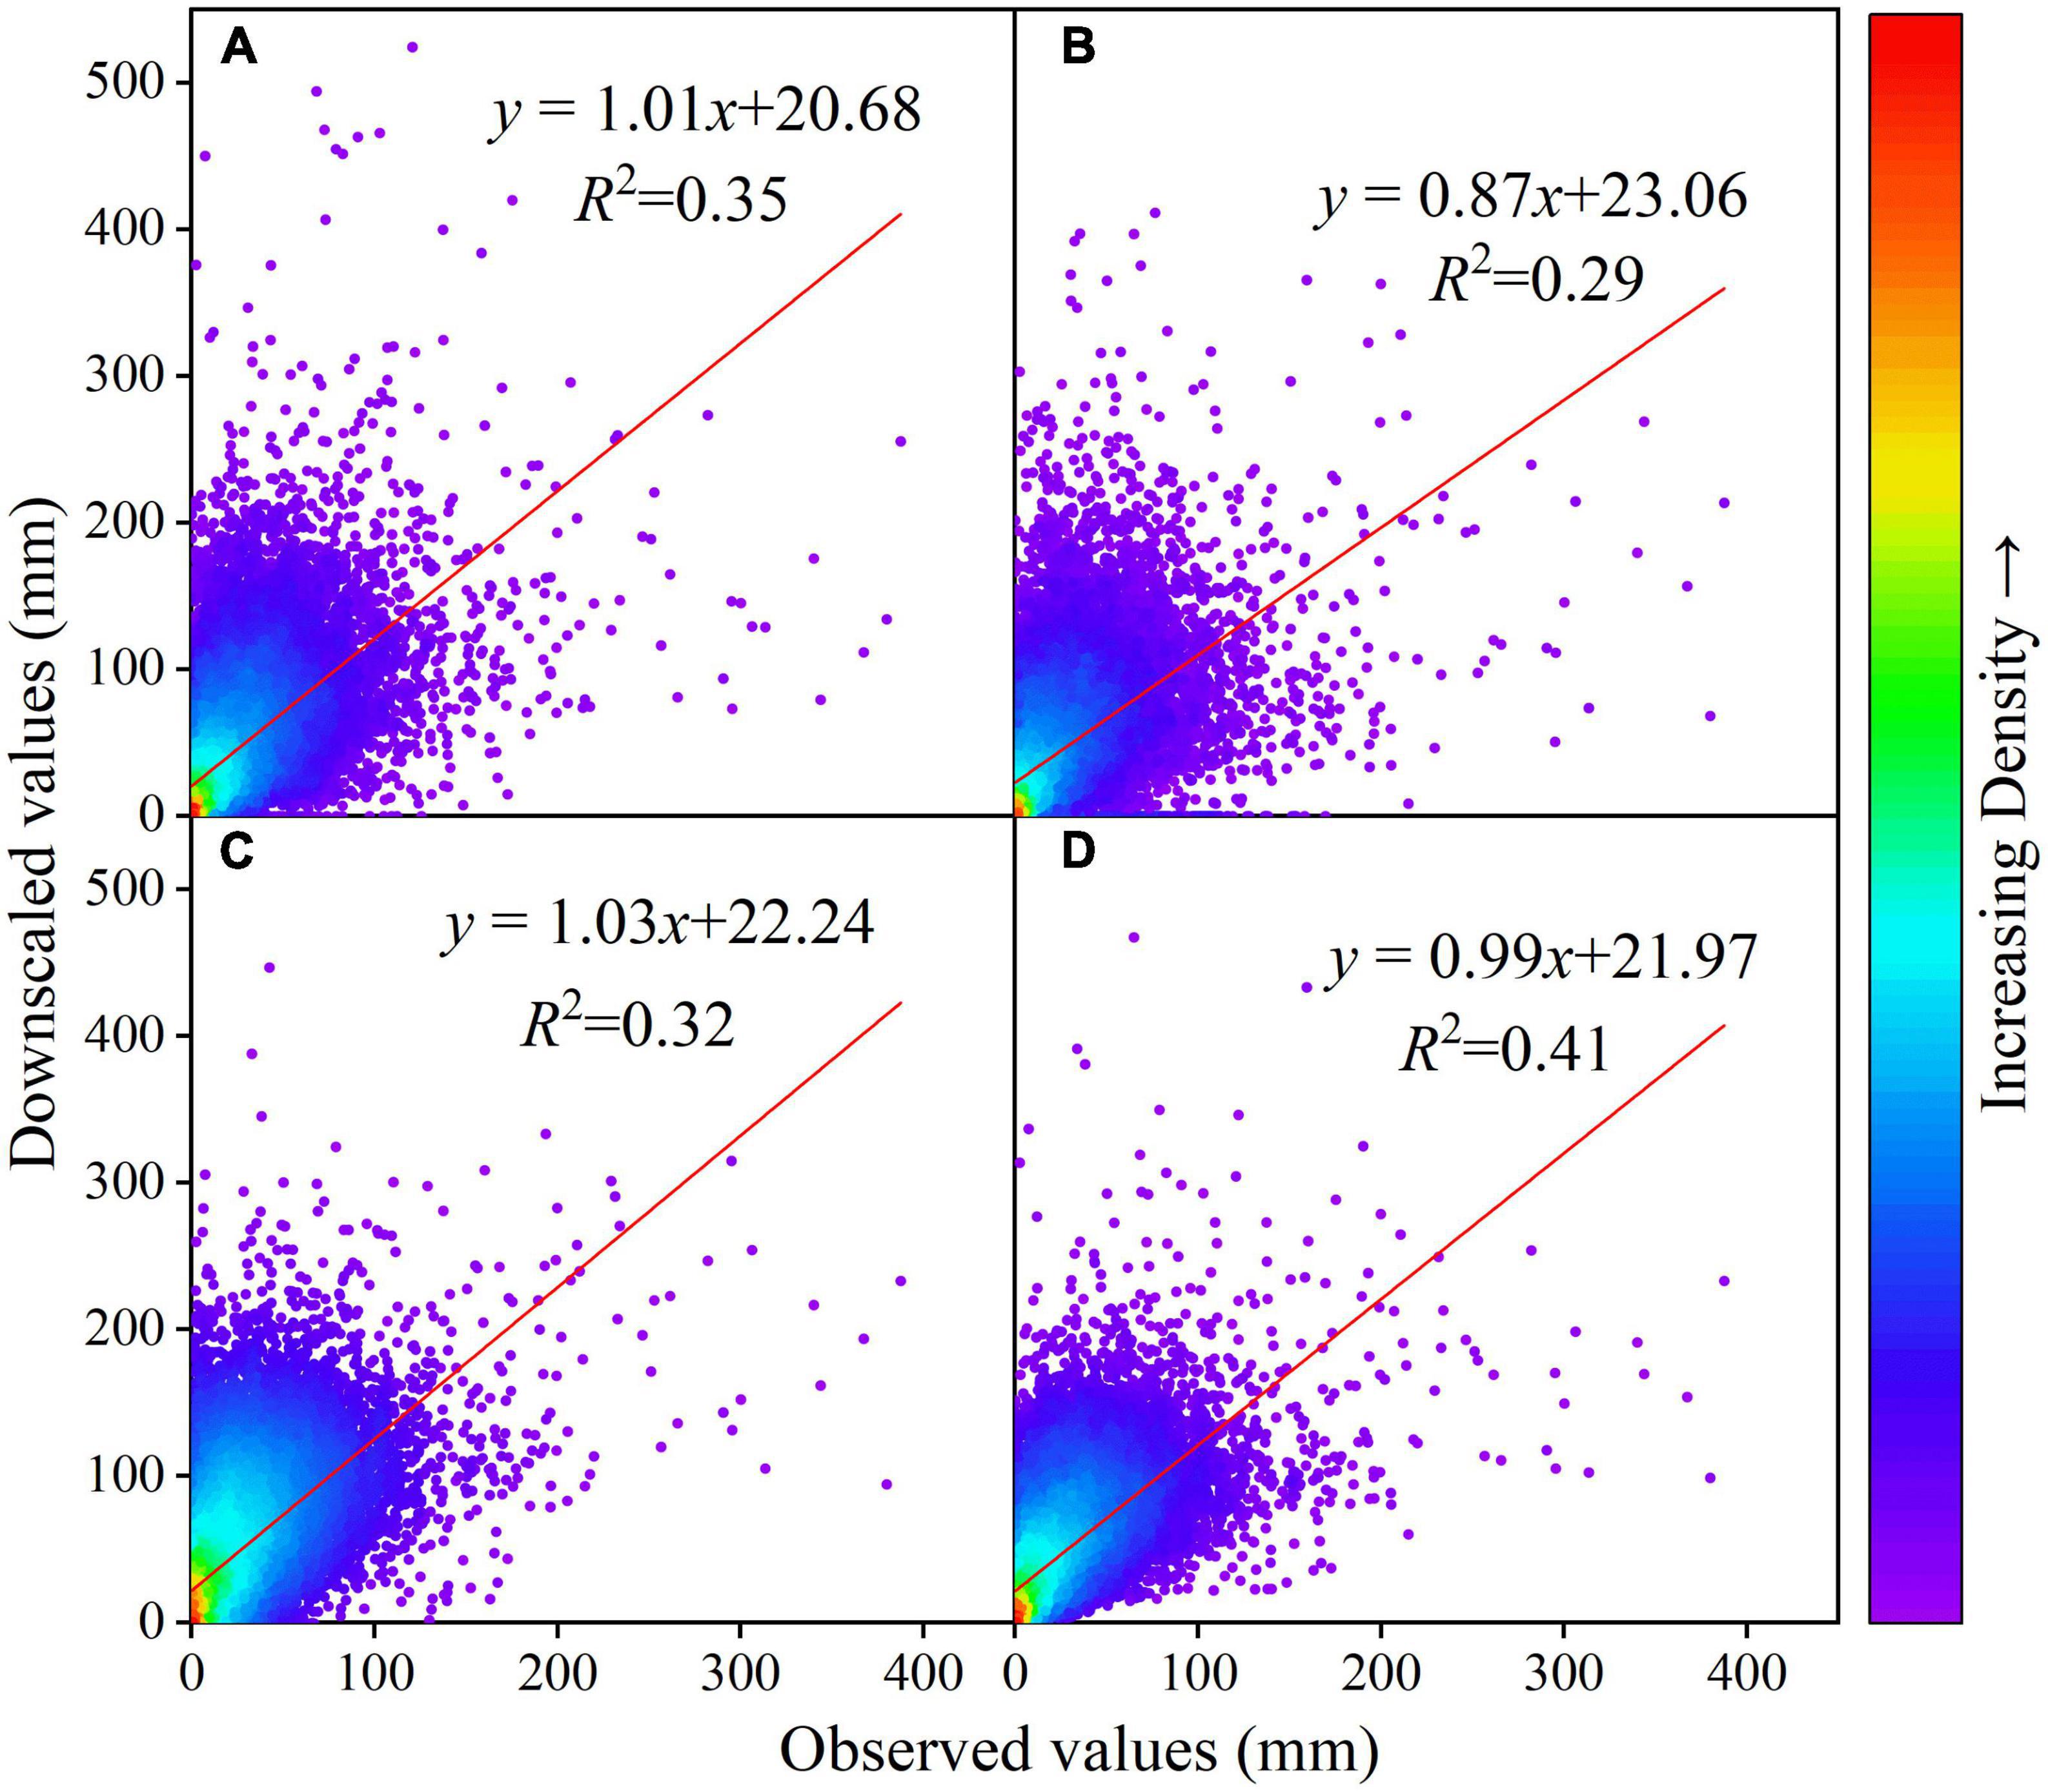
Figure 4. Scatter plot of monthly Pre series in the Yellow River basin simulated by station observation and GCMs from 1995 to 2014 under Kriging interpolation; (A–D) represent ACCESS-ESM1-5, IPSL-CM6A-LR, and CESM2-WACCM, respectively.
For temperature, the BILINEAR interpolation method has the smallest error in four different evaluation indicators, so this interpolation method is used to further evaluate the Tem simulation effect of all GCMs. The evaluation indicators of several GCMs, such as ACCESS-CM2, ACCESS-ESM1-5, CASMS-CSM1-0, CESM2, CESM2-FV, E3SM-1-0, INM-CM-5-0, CanESM5, CESM2-WACCM, FIO-ESM-2-0, INM-CM5-0, NorESM2-LM, rank higher. CESM2-WACCM, NorESM2-LM, and ACCESS-CM2 are used to construct the MME dataset (Figure 5). The R2 of the ground observation and simulated Tem of CESM2-WACCM, NorESM2-LM and ACCESS-CM2 are 0.93, 0.93, and 0.92, respectively, and the regression coefficients are 0.97, 0.97, and 0.96, while the MME dataset is more concentrated (Figure 6).
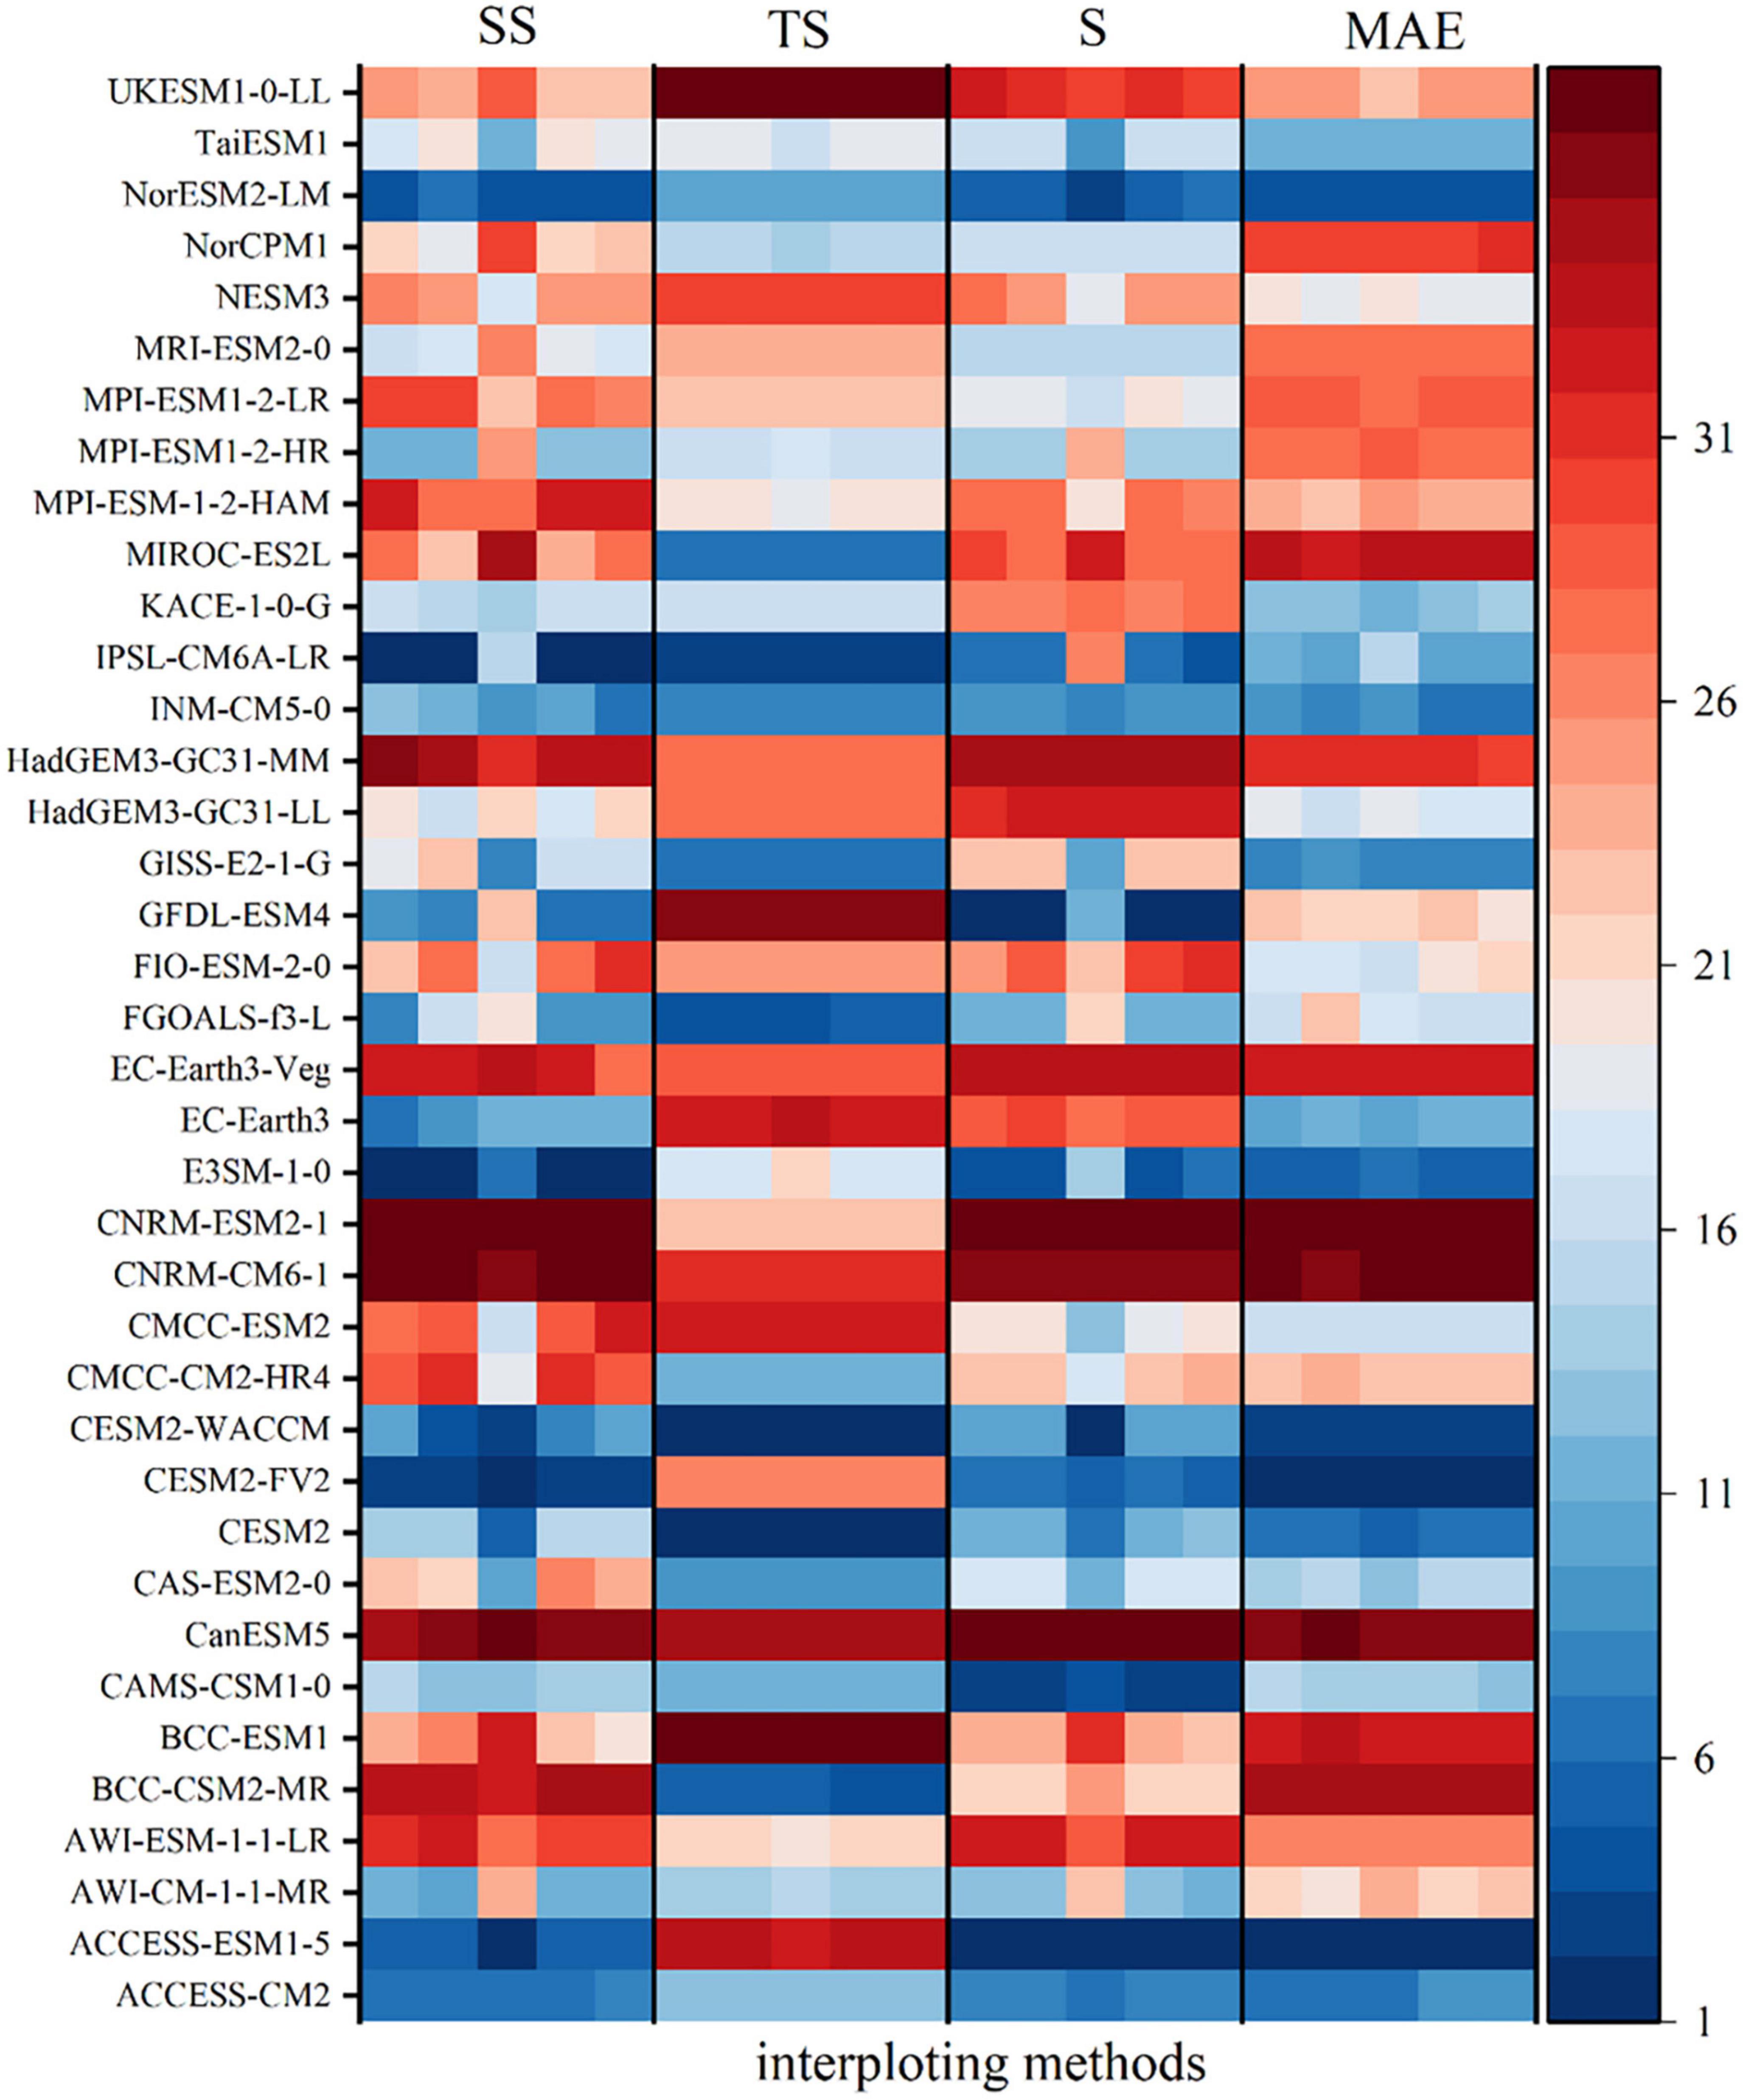
Figure 5. The fitting performance ranking of the monthly Tem series of the Yellow River basin simulated by 39 GCMs and measured at the stations from 1995 to 2014 under different interpolation and evaluation indicators; under each evaluation method is the evaluation ranking of five interpolation methods: Kriging, Idw, BILINEAR, Natural and Spline.
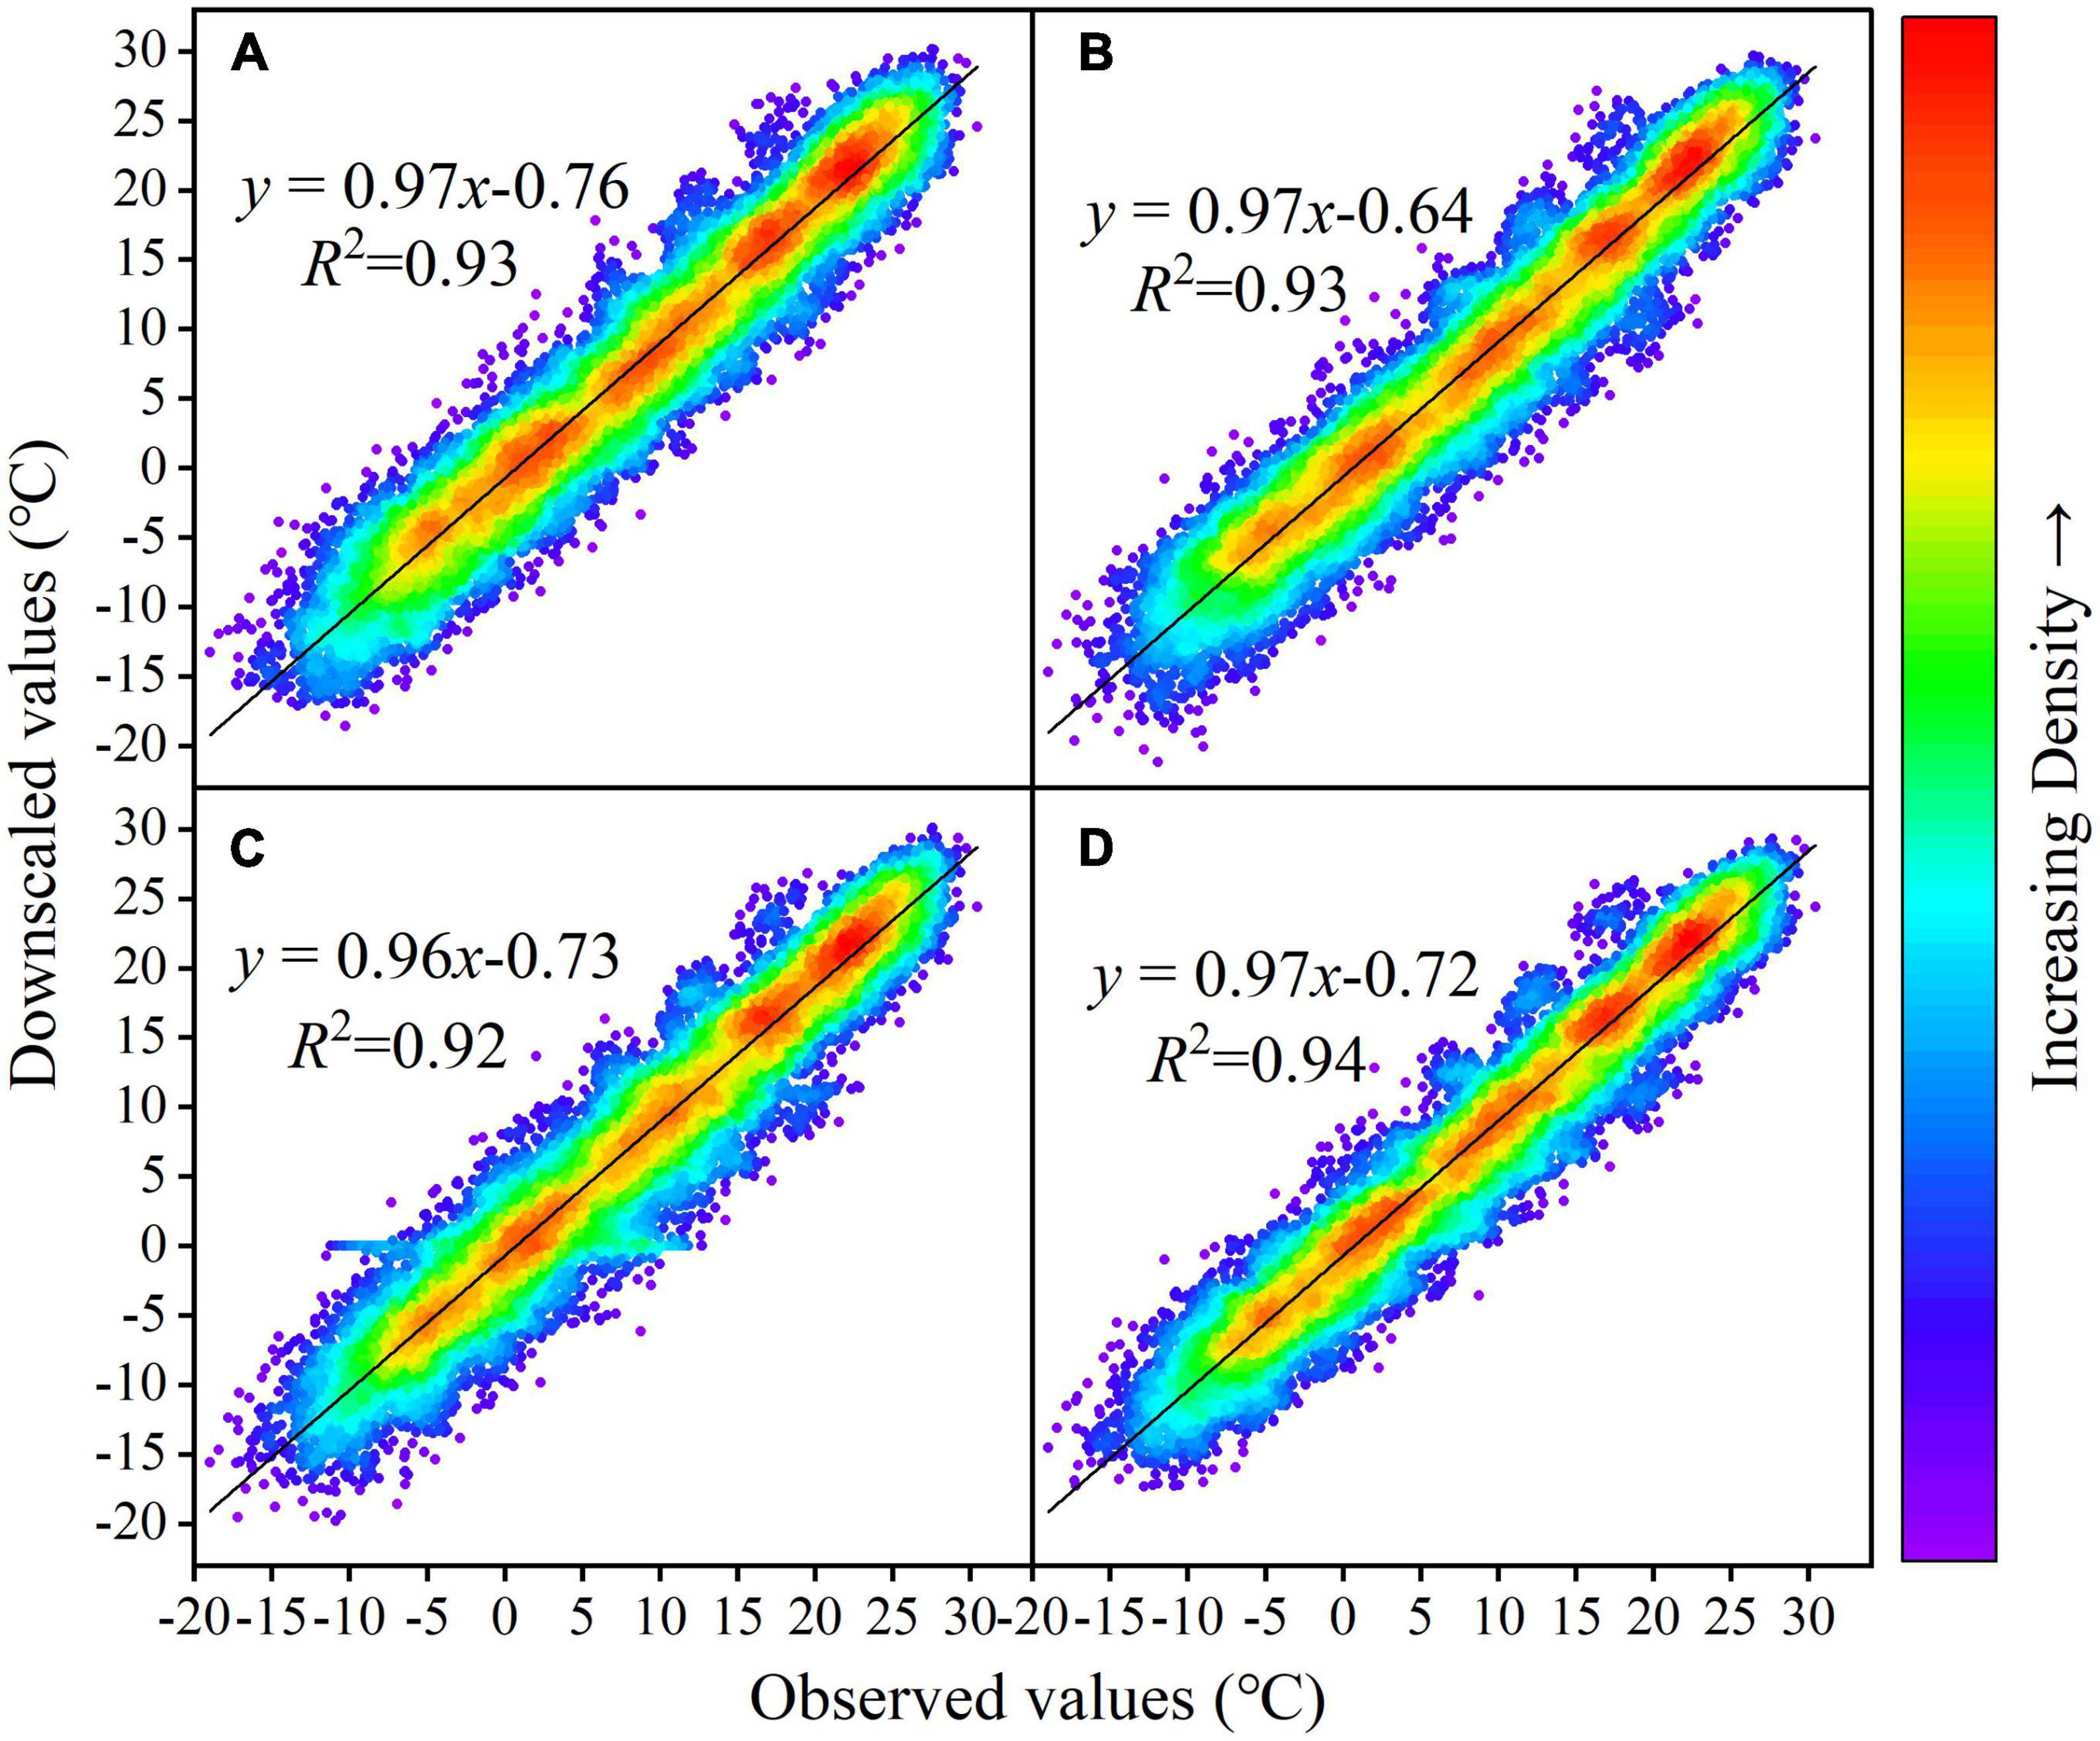
Figure 6. Scatter plot of monthly Tem series of the Yellow River basin simulated by the station observation and GCMs from 1995 to 2014 under BILINEAR interpolation; (A–D) represent CESM2-WACCM, NorESM2-LM, ACCESS-CM2, respectively.
3.1.2. FVC
Among the delta downscaling, BILINEAR interpolation has the best simulation effect on the FVC of the Yellow River basin. Therefore, BILINEAR interpolation is used to obtain three high-resolution GCM data. From the three evaluation indicators of MAE, SS and S, the simulation performance of EC-Earth3-Veg and GFDL-ESM4 on the FVC of the Yellow River basin is better than EC-Earth3-Veg-LR. From the perspective of TS, GFDL-ESM4 is the closest to 0 among the three GCMs, indicating that GFDL-ESM4 is the best GCM for simulating the FVC of the Yellow River basin among the three selected GCMs (Table 2). The regression analysis between FVCobs and FVCGFDL–ESM4 in 1982–1997 shows that the regression coefficient is 1.00 and R2 is 0.83, indicating that the overall agreement between FVCGFDL–ESM and FVCobs is high. Therefore, the GFDL-ESM4 is selected for the next analysis in this paper (Figure 7).

Table 2. Score of FVCGFDL-ESM4, FVCEC-Earth3-Veg, and FVCEC-Earth3-Veg-LR in the validation period under different indicators.
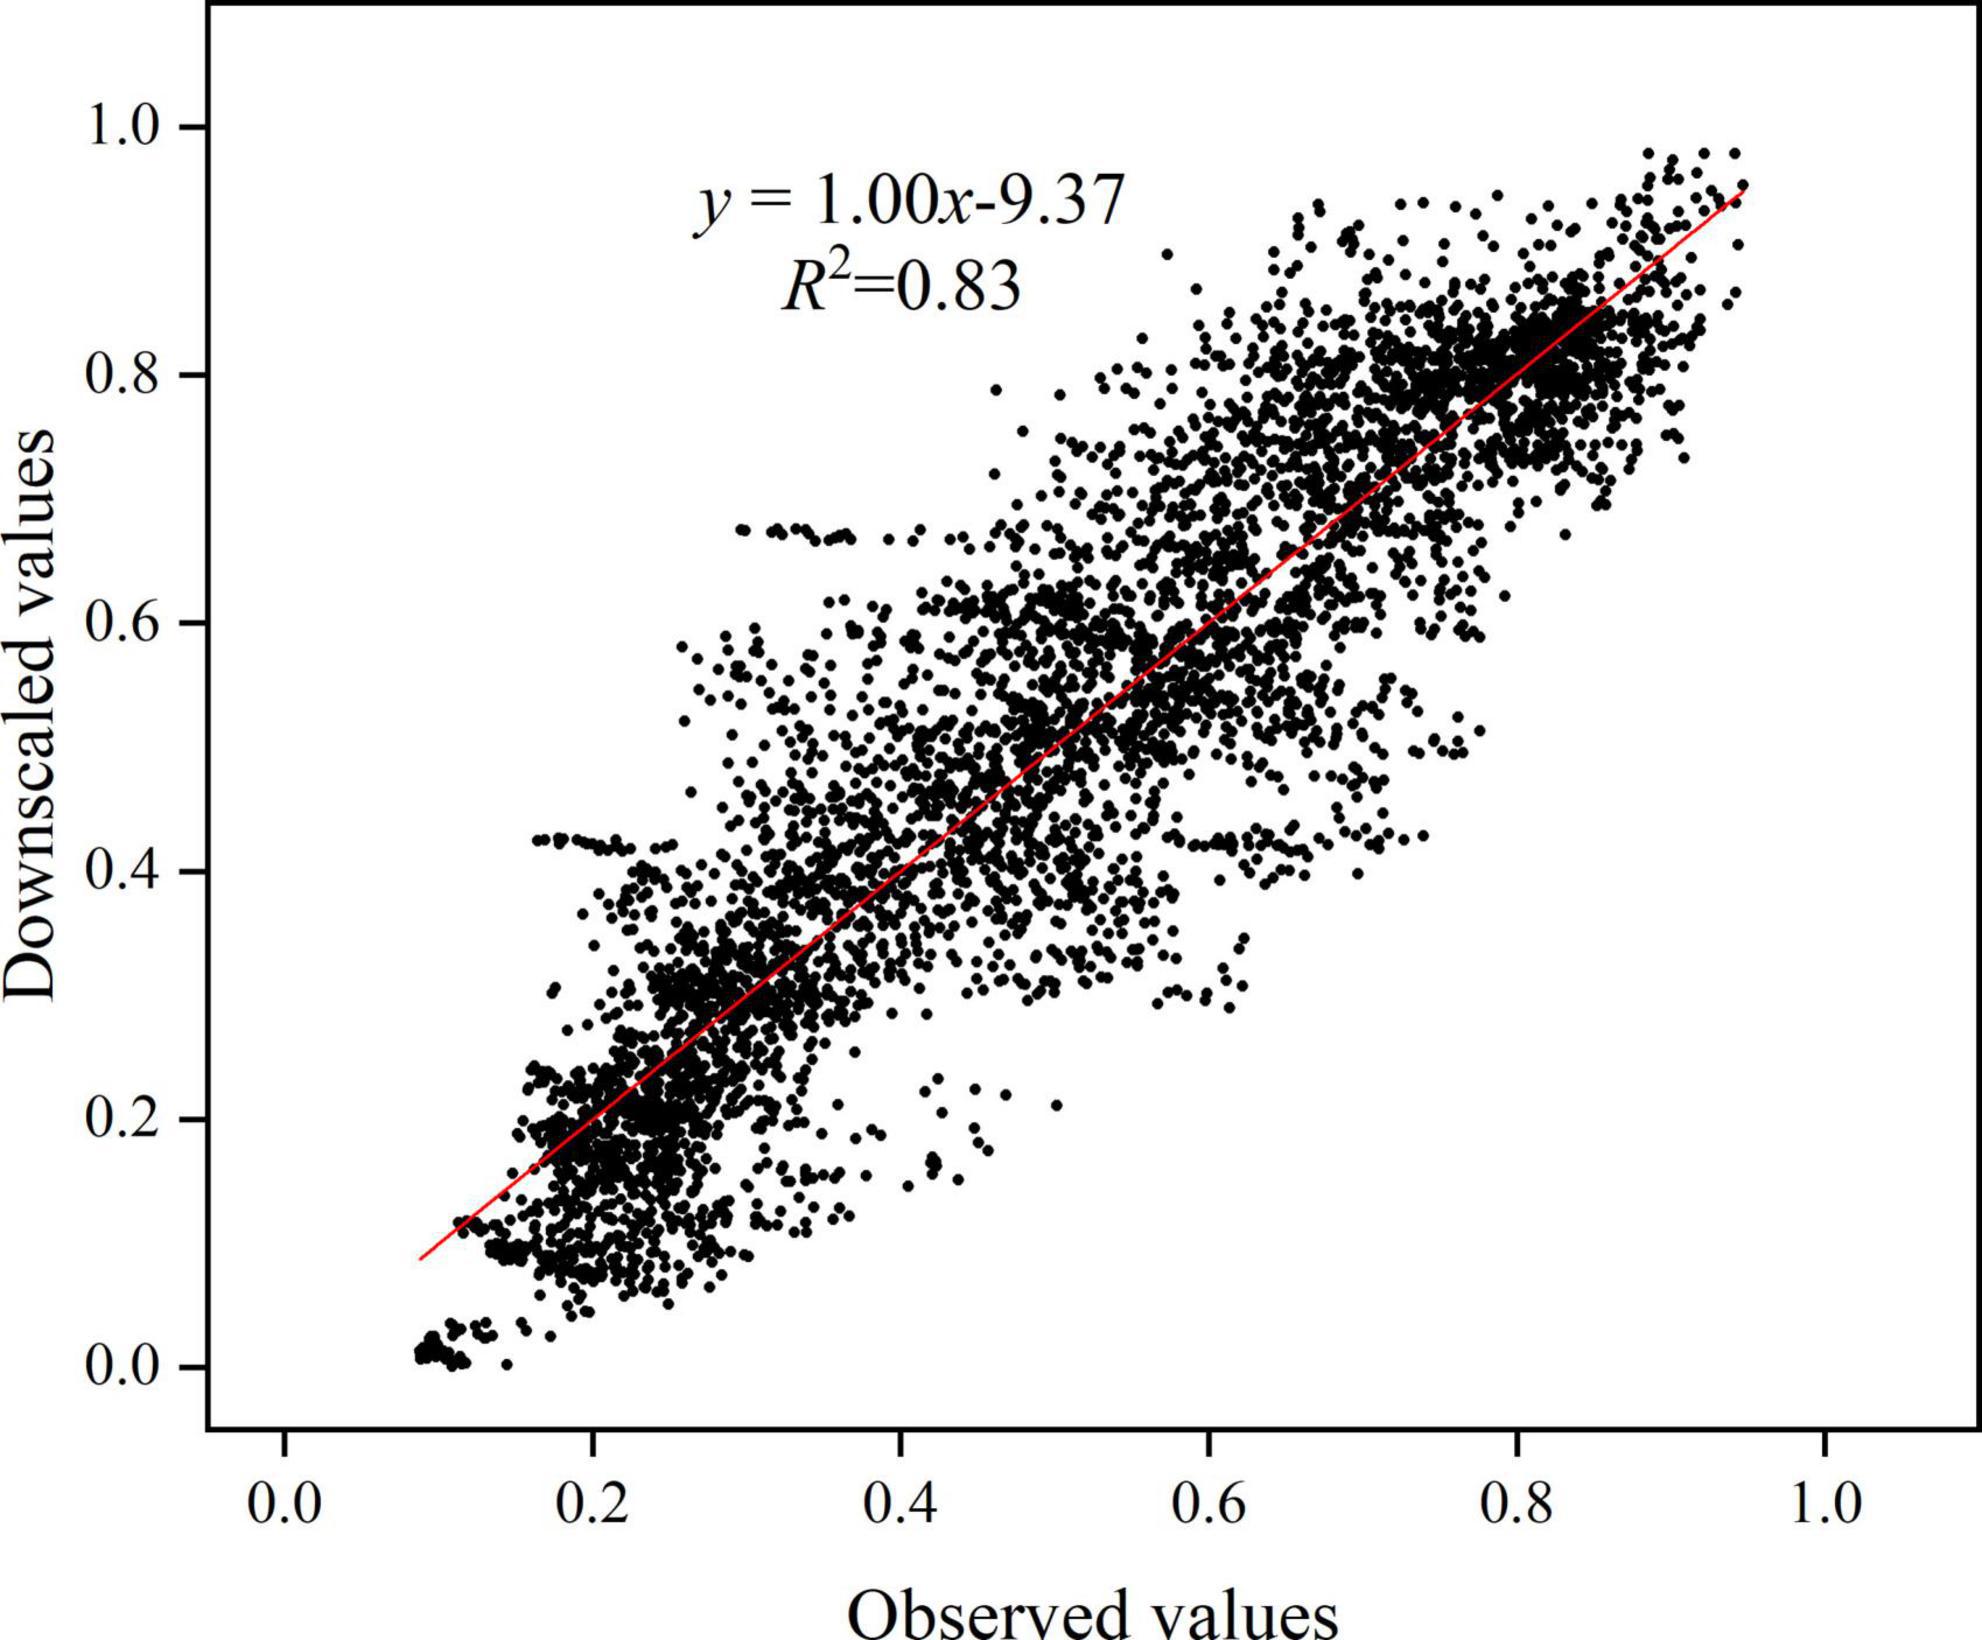
Figure 7. Scatter distribution of FVCobs and FVCGFDL-ESM4 from 1982 to 1997.
3.2. Temporal and spatial variation characteristics of FVC
The FVC of the Yellow River basin experienced three periods: a natural growth period from 1901 to 1961, a significant degradation period from 1962 to 1996, and a significant recovery period from 1997 to 2014. In 1901–1961, there was less human intervention during this period, and the vegetation grew naturally at the rate of 0.0076/10a (P < 0.01); from 1962 to 1996, the process of urbanization and industrialization accelerated, the population continued to grow, and the intensive human activities made the vegetation significantly degraded at the rate of −0.027/10a (P < 0.01); from 1997 to 2014, influenced by the ecological protection project of the Chinese government, the vegetation recovered rapidly at the rate of 0.0137/10a (P < 0.01) (Figure 8). The FVC under the four scenarios in 2022–2100 shows an increasing trend. Under the SSP126 and SSP370, the overall rate of increase of FVC is relatively fast, with the rates of 0.0141/10a (P < 0.01) and 0.0168/10a (P < 0.01), respectively. For the SSP245 and SSP585, the rate of increase in FVC is relatively slow, with the rates of 0.0087/10a (P < 0.01) and 0.0086/10a (P < 0.01), respectively.

Figure 8. Time variation trend of annual FVC in the Yellow River basin from 1901 to 2100; the historical period is divided into three sections: T1 (1901–1961), T2 (1962–1996), T3 (1997–2014).
The contribution rate of the first mode of the four scenarios is more than 60%, which reflects the main spatial distribution characteristics of the vegetation in the Yellow River basin. Although the first mode of the four scenarios is different, it generally reflects the similar characteristics. Jimai, Maqu, and Tangnaihai are in the opposite trend of vegetation growth in other areas of the Yellow River basin, and the high value areas of the four scenarios are concentrated in the Huangshui River basin, Maqu, Wuding River basin and Longmen. The second mode under each scenario is quite different. Although the high value centers of FVC change reflected by the second mode and the first mode under the SSP126 and SSP585 scenarios are different, the distribution characteristics are very similar, i.e., the vegetation growth in the Yellow River headwaters area is opposite to that in other regions. The second mode under the SSP245 and SSP370 scenarios shows that the vegetation growth in the southeastern and northwestern areas of the Yellow River basin shows the opposite trend. The contribution rate of the third mode under the four scenarios is low, so only the change center reflected by the mode, namely, the headwaters area of the Yellow River and Wuding River basin, needs to be concerned. In general, the headwaters of the Yellow River, the Wuding River basin, the Huangshui basin and the Longmen basin are high-value areas of vegetation change, and the FVC changes strongly (Figure 9).
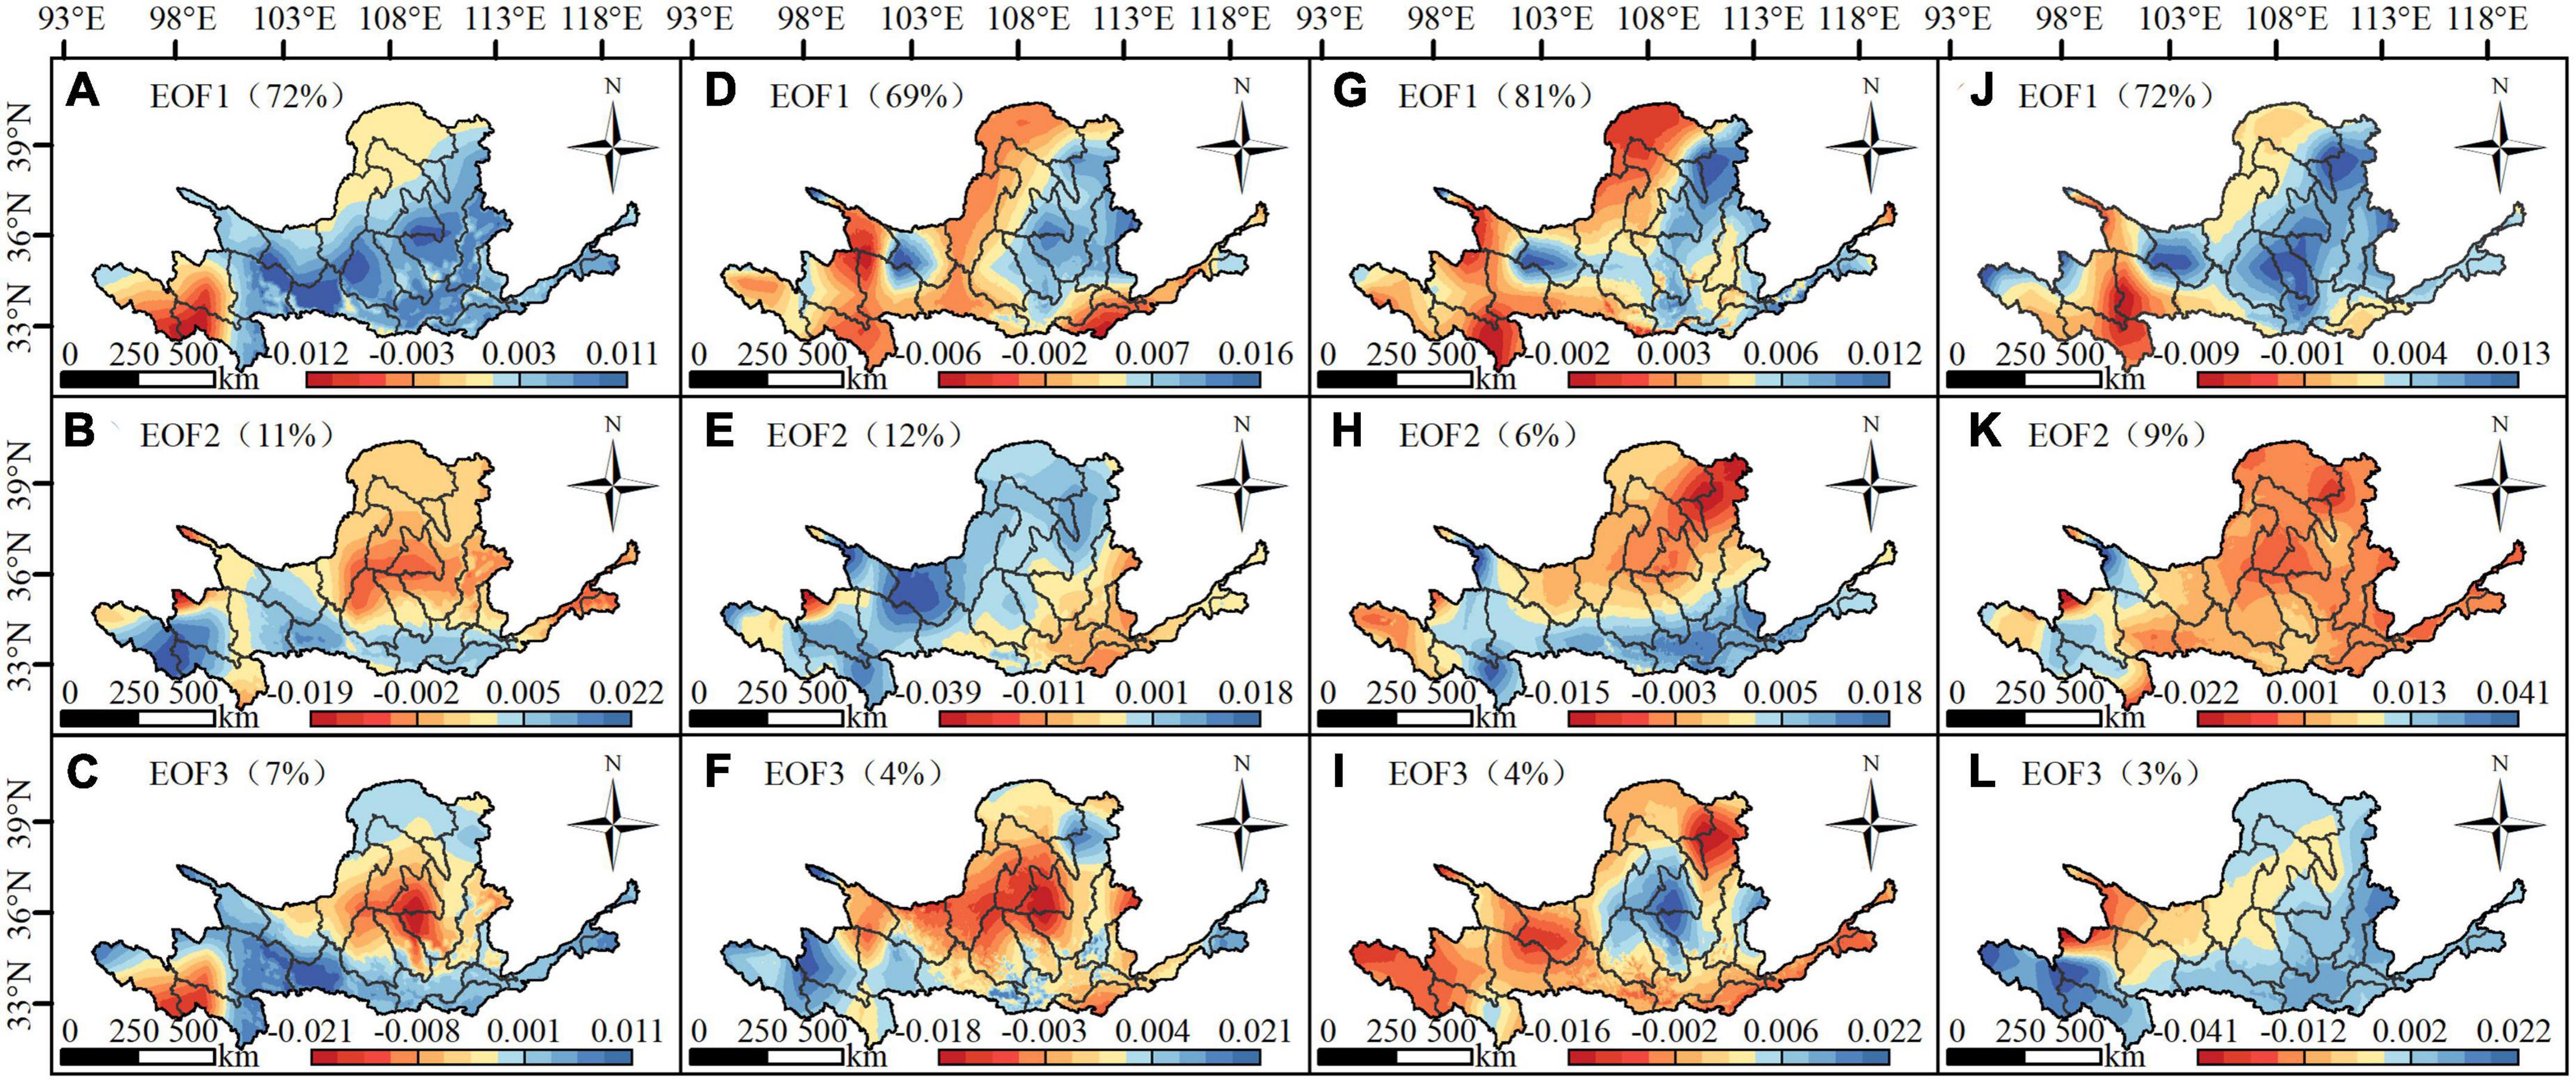
Figure 9. The first three modes (EOF1–EOF3) of the FVC of the Yellow River basin from 2022 to 2100 under the four scenarios SSP126 (A–C), SSP245 (D–F), SSP370 (G–I) and SSP585 (J–L); the contribution rate of this mode is shown in brackets.
The time coefficient PC1 corresponding to the first mode of the four climate scenarios is very similar, with slopes greater than 0, and the time coefficient changes positively and negatively around 2060. Combined with its contribution rate of about 70%, it shows that the vegetation in the negative EOF1 area of each scenario will continue to deteriorate in 2022–2100, while the opposite will occur in the eastern region. Therefore, the continuous recovery of vegetation in the eastern region is the main reason for the significant increase of FVC in the four scenarios in 2022–2100. The time coefficient PC2 corresponding to the second mode of the four climate scenarios is very similar. The slope of the time coefficient changes positively and negatively between 2060 and 2070, indicating that the vegetation in the positive area of the second mode of each scenario is in a recovery state in the year 2022–2070, and in the negative area of the second mode of each scenario in the year 2070–2100, the vegetation is in a degradation state. The time coefficient PC3 corresponding to the third mode of the four climate scenarios fluctuates strongly without a clear trend, and the contribution of the third mode of each scenario is less than 1% (Figure 10).
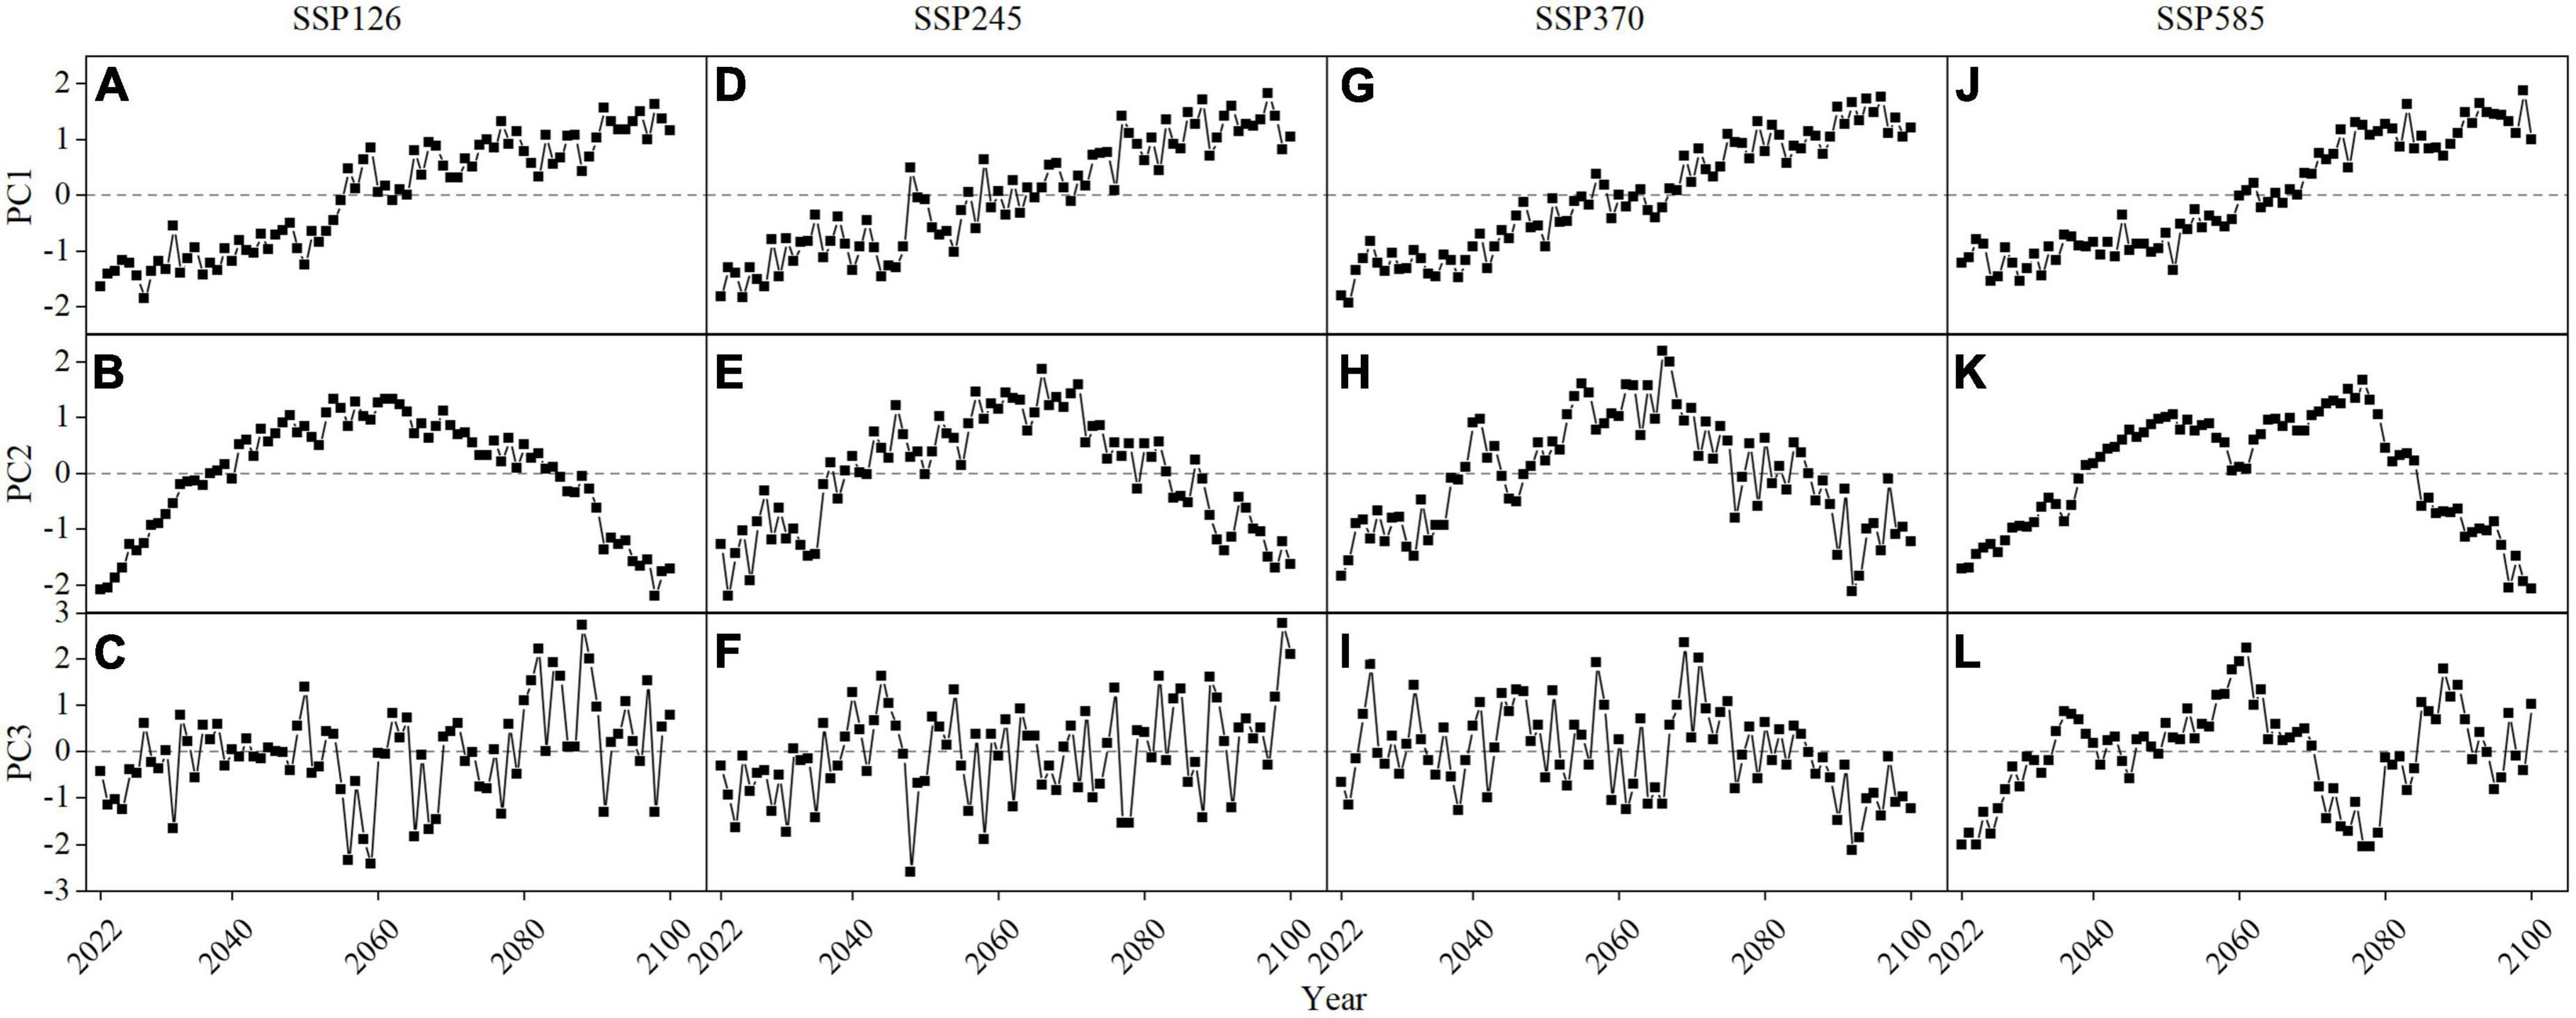
Figure 10. The time coefficient PC1–PC3 of the first three modes EOF1–EOF3 of FVC in the Yellow River basin from 2022 to 2100 under four scenarios: SSP126 (A–C), SSP245 (D–F), SSP370 (G–I) and SSP585 (J–L).
3.3. Influence of climatic factor on FVC
Singular value decomposition is carried out for the FVC, Pre, and Tem fields of the Yellow River basin in 2022–2100 under four scenarios. Since the contribution rate of the first mode is more than 90%, only the first mode is used to analyze the impact of Pre and Tem on FVC (Table 3).
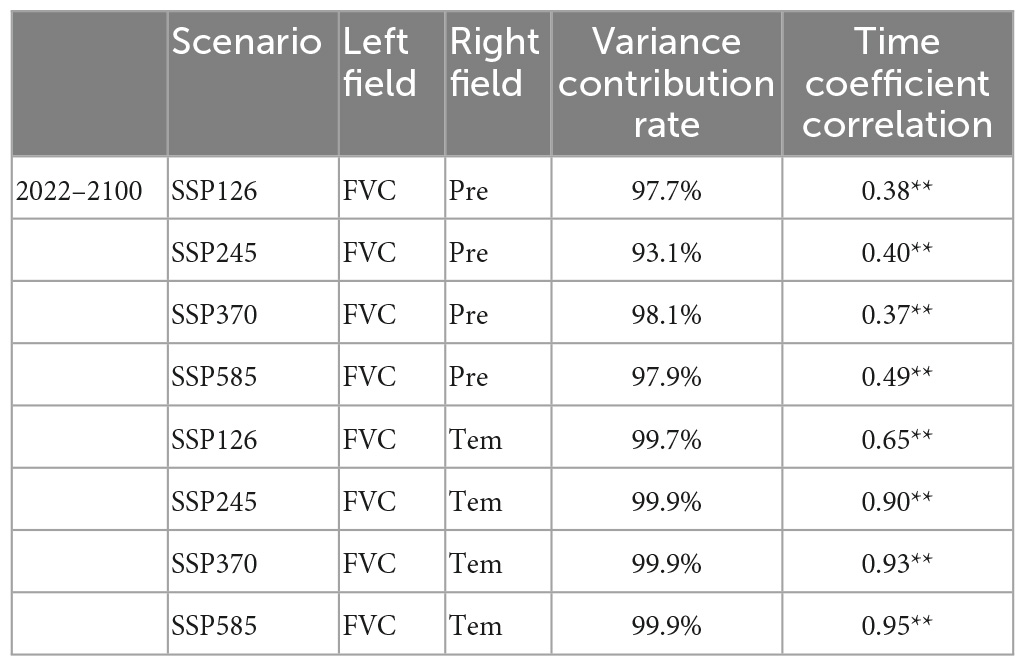
Table 3. FVC, Pre and Tem in the Yellow River basin from 2022 to 2100 under four scenarios after SVD (**Indicates that the correlation passed 0.01 significance test).
In the first coupling mode of FVC and annual Pre (Figures 11A–D), the four scenarios have the trend of shifting from the Yellow River headwater area and the southern area of the Yellow River basin to the east with the increase of emission scenario, while the inner flow area, Wuding River basin and Shizuishan are not significant in any scenario. Although the response of vegetation to Pre in different regions is different under different scenarios, the heterotypic correlation coefficient of the right field of Pre is negative, and the heterotypic correlation coefficient of the left field of FVC is also basically negative, indicating that the FVC and Pre in these regions are mainly positively correlated, and only in Maqu under SSP126 and SSP370, the FVC and Pre show negative correlation. In contrast to Pre, almost all regions in the first coupling mode of FVC and Tem are significant under the four scenarios (Figures 11E–H). The heterotypic correlation coefficients of the right field of Tem under the four scenarios are all negative, and the heterotypic correlation coefficients of the left field of FVC are basically negative, indicating that the FVC and Tem in these areas are mainly positive correlation, only in the areas of Jimai and Maqu under the SSP126 and in the areas of Maqu, Xiaochuan and Tangnaihai under the SSP585 have positive values, showing negative correlation.

Figure 11. The first coupling mode obtained by SVD of FVC, Pre and Tem fields in the Yellow River basin from 2022 to 2100 under four scenarios: SSP126 (A,E), SSP245 (B,F), SSP370 (C,G), and SSP585 (D,H); (A–D) are the first coupling modes of FVC and Pre, and (E–H) are the first coupling modes of FVC and Tem; The bottom map of panels (A–D) is Pre, the bottom map of panels (E–H) is Tem, and the contour line is FVC, where the dotted line is positive and the solid line is negative; Point represents the area where the FVC and Pre (Tem) field are significant at the same time.
From the perspective of FVC and Pre time coefficient in four climate scenarios (Figures 12A–D), the fluctuation range of Pre time coefficient is larger than that of FVC, and there is no obvious change in the same direction between Pre and FVC. The correlation between FVC and Pre time coefficient in the four scenarios is poor (Table 3), which indicates that the FVC and Pre do not change synchronously on an annual basis in each scenario. Under the SSP585, the FVC and Pre are clearly lagged, with a lag period of about 3 years. The correlation coefficient between FVC and Pre time coefficient under the SSP585 is the largest among the four scenarios, indicating that the vegetation in this scenario is the most sensitive to Pre among the four scenarios. According to the time coefficients of FVC and Pre in the four scenarios (Figures 12E–H), there are very obvious changes in the same direction, indicating that the FVC and Tem in each scenario are mainly synchronous changes in the inter-annual. According to the correlation of time coefficient (Table 3), the correlation between FVC and Tem time coefficient is high under the four scenarios, while the correlation coefficient under SSP126 scenario is the lowest, indicating that SSP126 is the least sensitive scenario of vegetation to Tem among the four scenarios.
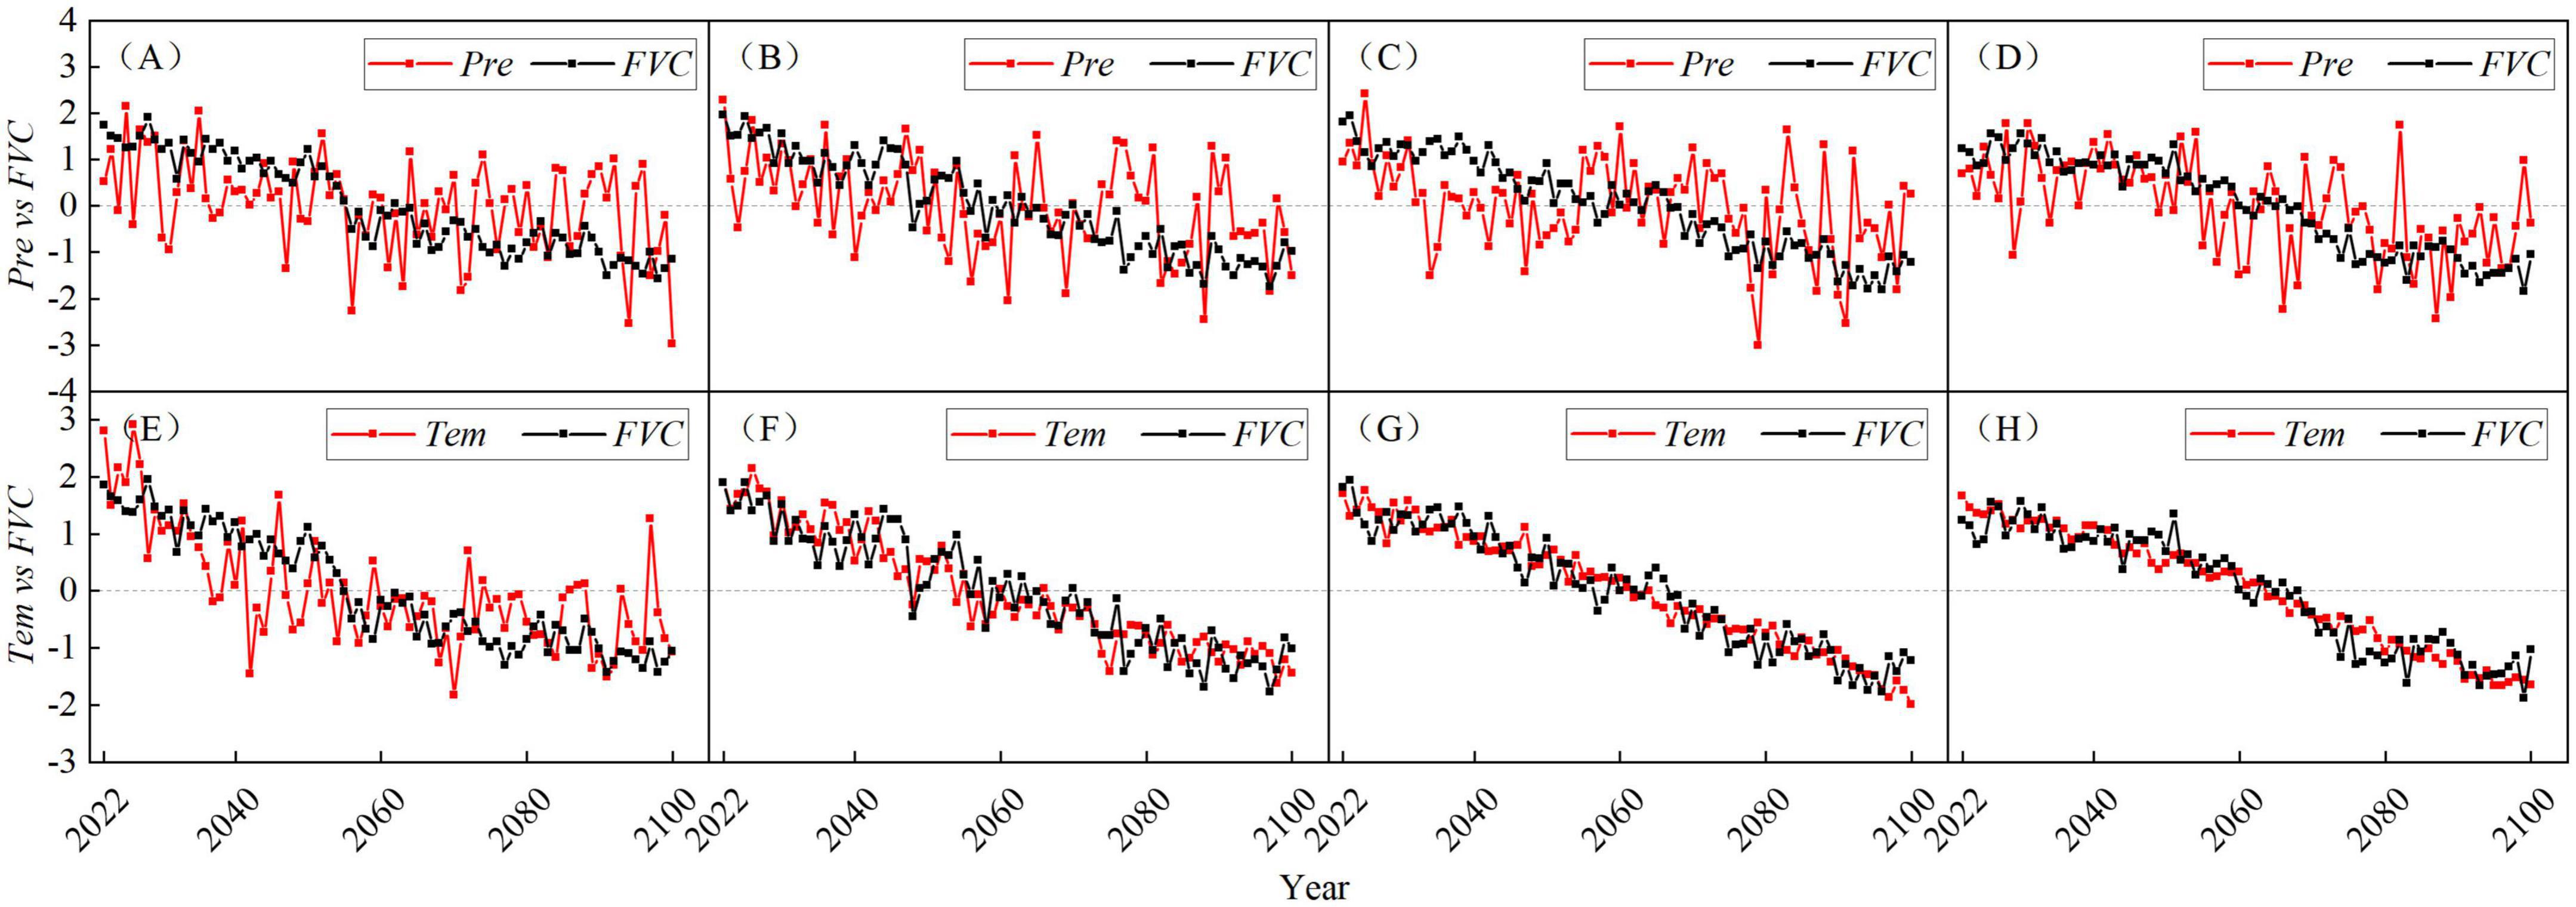
Figure 12. The time coefficients corresponding to the first coupling mode of the FVC and Pre and Tem fields in the Yellow River basin from 2022 to 2100 under the four scenarios of SSP126 (A,E), SSP245 (B,F), SSP370 (C,G), and SSP585 (D,H), where (A–D) are the time coefficients of FVC and Pre, and (E–H) are the time coefficients of FVC and Tem.
4. Discussions
4.1. Temporal and spatial change characteristics of FVC
The FVC of the Yellow River basin shows an increasing trend under the four scenarios from 2022 to 2100, which is basically consistent with the researches of other scholars (Ouyang et al., 2020; Li et al., 2022a). The rate of change of FVC in the Yellow River basin is different under the four scenarios (Figure 8), and SSP126 and SSP370 increase the fastest, and the spatial distribution characteristics of FVC are also different (Figure 9), which may be caused by different hydrothermal conditions and CO2 concentrations under different scenarios. PC2 in Figure 8 shows that the trend of FVC in some areas of the Yellow River basin first increased and then decreased. We believe that this is due to the scarcity of water resources in the Yellow River basin, and the rising Tem in the future will increase evaporation, which will aggravate the water scarcity in these areas of the basin, thus playing a negative role in the growth of vegetation in these areas. Although this feature shown by PC2 is not the main feature in the future, it is still worth noting, because if the Tem rises faster or longer in the future, this feature is likely to become the main feature of arid and semi-arid areas. Under the four scenarios, the change in FVC in the Yellow River basin is basically positively correlated with Pre and Tem, except for some areas in the headwaters of the Yellow River (Figure 11). The correlation between FVC and Pre and Tem in the Yellow River basin increases with increasing emission concentration, which is basically consistent with the research of other scholars (Li et al., 2022a), indicating that the response of vegetation to climate change is stronger under higher emission scenarios. However, the same type of correlation can be interpreted differently in different regions. For example, future vegetation and temperature are positively correlated in most areas of the Yellow River headwaters and the Gaocun area. However, the Yellow River headwaters are located in the southeast of the Qinghai-Tibet Plateau, and temperature is the main limiting factor for local vegetation activity. Compared with Pre, the increase in Tem can alleviate the local cold climate, which is conducive to the growth of most local vegetation. The Gaocun area is located in the North China Plain, with high background temperature, so the impact of Pre on the vegetation in this area is more significant. Therefore, the spatio-temporal distribution of background climate, water conditions, and Tem conditions is an important reason for the heterogeneity of vegetation activities.
4.2. Uncertainty and impact
In previous studies on predicting future vegetation changes, most of them have established vegetation prediction statistical models on precipitation, temperature and other meteorological factors. These vegetation prediction statistical models are based on the relationship between observed variables. In general, the relationship between vegetation and climate factors is linear by default. However, many studies have shown that the relationship between vegetation and climate is non-linear. Piao et al. (2014) showed that the relationship between interannual temperature change and vegetation activity was weaker in the northern hemisphere. Fu et al. (2015) analyzed the impact of global warming on the phenology of tree leaf expansion in the temperate zone of Europe over the past 30 years, and found that the sensitivity of vegetation leaf expansion phenology to climate warming is significantly reduced. This is due to the complex response mechanism of vegetation to climate change and its non-linear characteristics. For example, before reaching the optimal temperature for photosynthesis, increasing temperature increases the vegetation activity by accelerating nutrient release and improving soil availability (Michaletz et al., 2014). Above this temperature, respiration promotes the acceleration of nutrient use (Brohan et al., 2006). However, the linear vegetation prediction model cannot capture the non-linear relationship between vegetation and climate. This situation can be avoided to some extent by directly using the vegetation data output by GCMs, as GCMs can objectively simulate the interactions and feedbacks between the Earth’s various systems, and are an effective tool for exploring their influence on climate change and its impacts (Taylor et al., 2012). CMIP6 is the most involved model, with the most complete scientific experimental design, and the most simulated data in more than 20 years (Zhou et al., 2019). However, different GCMs have different simulation capabilities for different regions. Currently, most GCMs have too coarse a resolution to fully represent the regional characteristics of terrain and land and sea distribution. There are large uncertainties in studying the regional scale. Downscaling technology can reduce these uncertainties, but the downscaling process itself increases uncertainty. In this paper, several climate models and interpolation methods are optimized in the process of delta downscaling, and the climate model suitable for the Yellow River basin and the interpolation method in the process of delta downscaling are selected, but this is not enough to completely eliminate the uncertainty introduced by the GCMs and the downscaling process.
In addition to precipitation and temperature, vegetation is also affected by other uncertain factors. In recent decades, climate change has exacerbated the instability of the climate system, and the frequency and intensity of extreme weather events have increased in China (Piao et al., 2010). A large amount of evidence from crop yield, tree ring and manipulation experiments shows that the occurrence of extreme high temperature events is followed by higher water stress and evaporation demand, which can have significant impacts on terrestrial ecosystems (Kang et al., 2016; Klesse et al., 2018; Lou et al., 2021; Yan et al., 2021). The prediction of FVC due to human activities will also bring uncertainty. In the historical period, with China’s rapid urbanization and population growth, overgrazing, deforestation and overcultivation have caused serious impacts on the ecological environment (Ma et al., 2021), the Chinese government has successively implemented a series of ecological restoration projects, such as the Three-North Shelter Forest Program (TNSFP) The Grain to Green Program (GGP) and the Natural Forest Protection Program (NFPP), launched in 1999 have become the main factors for vegetation restoration in southern, northeastern, northwestern and central China (Gang et al., 2019; Chen et al., 2021b). As a result, human activities can greatly affect the growth of vegetation in local areas. At the recent climate summit in April 2021, in response to climate warming, the Chinese government proposed to achieve “carbon peak” by 2030 and “carbon neutral” by 2060. To achieve this goal, ecological restoration projects similar to the GGP may be implemented in the future. However, future human activities and extreme events have introduced many uncertainties into the estimation of vegetation that GCMs cannot account for. Therefore, this study only analyses the spatio-temporal change characteristics of FVC under different scenarios and the response relationship between vegetation and climate factors, without considering the impact of human activities and extreme climate events on vegetation.
Vegetation is linked to the carbon and water cycles. Vegetation converts carbon dioxide into organic matter through photosynthesis and evaporates it through stomata. This process helps to cool the surface air, so it is also seen as an ecological way to mitigate climate warming (Seneviratne et al., 2010; Denissen et al., 2021). The effect of water availability on ecosystem function is therefore very important. The ecosystem response depends on whether the vegetation in the area is energy or water limited (Ciais et al., 2005; Flach et al., 2018; Denissen et al., 2020; Kroll et al., 2022). Currently, research on ecosystem water availability of can be divided into two categories. Some studies analyzed water supply through soil moisture (Jung et al., 2010; Berg and McColl, 2021; Jiao et al., 2021; Zhou et al., 2021), while others focused on water demand by considering precipitation and evaporation (Feng and Fu, 2013; Huang et al., 2016; Berg and McColl, 2021). Some studies suggested that, soil moisture is more important in driving vegetation growth (Jiao et al., 2021; Li et al., 2021, 2022b). However, the global extensive vegetation greening in recent decades does not seem to support this conclusion (Donohue et al., 2013; Zhu et al., 2016; Berg and Sheffield, 2019). At the same time, some studies have shown that temperature as an energy proxy, is more important for vegetation growth and carbon uptake than water use efficiency (Wang et al., 2013; Piao et al., 2017; Green et al., 2019; Yuan et al., 2019; Lu et al., 2022). For example, by decoupling air temperature and soil moisture, Dang et al. (2022) suggested that temperature played a more important role in most parts of the world. There is no unified conclusion on whether the current ecosystem energy has changed from energy limitation to water limitation, mainly due to different research methods (Greve et al., 2019). Certainly, the continued rise in temperature and the large increase in net radiation will reduce the energy limit of the ecosystem on the one hand, and increase the demand for atmospheric evaporation on the other hand, thus increasing the water limit of the ecosystem (Humphrey et al., 2021). We believe that the ecosystem should be in the process of transitioning from energy limitation to water limitation, and it is only a matter of time before it fully manifests itself as water limitation. The trend of the ecosystem from energy limitation to water limitation is mainly due to increases in net radiation and temperature. Denissen et al. (2022) found net radiation to be the most important predictor of water limitation. In our study, the factors affecting vegetation growth are analyzed from the perspective of precipitation and temperature, and it is concluded that temperature is the dominant factor of vegetation growth in the Yellow River basin. Some studies have shown that the Qinghai-Tibet Plateau is at a high altitude, where the headwaters of the Yellow River is located, but it has warmed significantly in the past few decades (Li et al., 2010; Yang et al., 2014; Kuang and Jiao, 2016), and it is possible that the energy limitation in this area will be transformed into water limitation. However, Zhao et al. (2023) showed that the headwaters of the Yellow River are still an energy-restricted area with increasing temperature. This research is generally consistent with our research conclusion, but there are differences in the spatial distribution, which may be caused by the poor simulation effect of the method and CMIP6 precipitation data. Because it is difficult to obtain high-precision soil moisture data, this study only analyses the effect of temperature and precipitation on vegetation growth. Next, we will also try to analyze the main factors of vegetation growth in the Yellow River basin from the perspective of water demand and energy.
5. Conclusion
This paper takes the Yellow River basin as the research area. Based on EOF and SVD, the temporal and spatial distribution of vegetation and its response to climate factors are investigated using the downscaled GCMs data, and the following main conclusion are drawn:
Among the five interpolation methods, Spline, Kriging, Inverse Distance Weighted, Natural Neighbor Interpolation and Bilinear Interpolation, Bilinear Interpolation is the most suitable to reduce the error of FVC in the Yellow River basin. GFDL-ESM4 has a strong ability to simulate the FVC of the Yellow River basin.
In terms of time, the fractional vegetation coverage of the Yellow River basin under four scenarios from 2022 to 2100 showed an increasing trend. In terms of space, under the four scenarios, the FVC of almost all areas of the Yellow River basin will increase from 2022 to 2100, and the degraded areas will be concentrated in a small part of the headwaters of the Yellow River.
In the same scenario, the correlation between FVC and mean annual Tem is greater than that of mean annual Pre, indicating that mean annual Tem is the dominant factor of vegetation in the Yellow River basin from 2022 to 2100. In different scenarios, the impact of climate change on FVC is greater in the high emission scenario than in the low emission scenario.
Data availability statement
Publicly available datasets were analyzed in this study. This data can be found here: http://data.cma.cn/, http://www.nesdc.org.cn/, and https://esgf-node.llnl.gov/projects/cmip6/.
Author contributions
SJ and CH: main instructors of this study. SS: main author of this study, responsible for data processing, manuscript writing, and drawing. TZ and JC: help with the raw data and processing methods. All authors contributed to the article and approved the submitted version.
Funding
This research was funded by National Key Research Priorities Program of China (2022YFC300340502), the Training Program for Young Backbone Teachers in Colleges and Universities of Henan Province (2021GGJS003), the Henan Natural Science Foundation (212300410413), and the Henan Youth Talent Promotion Project (2021HYTP030).
Conflict of interest
TZ was employed by PowerChina Guiyang Engineering Corporation Limited.
The remaining authors declare that the research was conducted in the absence of any commercial or financial relationships that could be construed as a potential conflict of interest.
Publisher’s note
All claims expressed in this article are solely those of the authors and do not necessarily represent those of their affiliated organizations, or those of the publisher, the editors and the reviewers. Any product that may be evaluated in this article, or claim that may be made by its manufacturer, is not guaranteed or endorsed by the publisher.
Footnotes
References
Bagcaci, S., Yucel, I., Duzenli, E., and Yilmaz, M. (2021). Intercomparison of the expected change in the temperature and the precipitation retrieved from CMIP6 and CMIP5 climate projections: a mediterranean hot spot case, Turkey. Atmospher. Res. 256:105576. doi: 10.1016/j.atmosres.2021.105576
Berg, A., and McColl, K. (2021). No projected global drylands expansion under greenhouse warming. Nat. Climate Change 11, 331–U71. doi: 10.1038/s41558-021-01007-8
Berg, A., and Sheffield, J. (2019). Evapotranspiration partitioning in CMIP5 models: uncertainties and future projections. J. Climate 32, 2653–2671. doi: 10.1175/jcli-d-18-0583.1
Brohan, P., Kennedy, J., Harris, I., Tett, S., and Jones, P. (2006). Uncertainty estimates in regional and global observed temperature changes: a new data set from 1850. J. Geophys. Research-Atmospheres 111:12106. doi: 10.1029/2005jd006548
Carlson, T., and Ripley, D. (1997). On the relation between NDVI, fractional vegetation cover, and leaf area index. Remote Sens. Environ. 62, 241–252. doi: 10.1016/s0034-4257(97)00104-1
Chen, S., Guo, B., Zhang, R., Zang, W., Wei, C., Wu, H., et al. (2021a). Quantitatively determine the dominant driving factors of the spatial-temporal changes of vegetation NPP in the Hengduan Mountain area during 2000-2015. J. Mountain Sci. 18, 427–445. doi: 10.1007/s11629-020-6404-9
Chen, Y., Feng, X., Tian, H., Wu, X., Gao, Z., Feng, Y., et al. (2021b). Accelerated increase in vegetation carbon sequestration in China after 2010: a turning point resulting from climate and human interaction. Global Change Biol. 27, 5848–5864. doi: 10.1111/gcb.15854
Ciais, P., Reichstein, M., Viovy, N., Granier, A., Ogee, J., Allard, V., et al. (2005). Europe-wide reduction in primary productivity caused by the heat and drought in 2003. Nature 437, 529–533. doi: 10.1038/nature03972
Dang, C., Shao, Z., Huang, X., Qian, J., Cheng, G., Ding, Q., et al. (2022). Assessment of the importance of increasing temperature and decreasing soil moisture on global ecosystem productivity using solar-induced chlorophyll fluorescence. Global Change Biol. 28, 2066–2080. doi: 10.1111/gcb.16043
Denissen, J., Orth, R., Wouters, H., Miralles, D., van Heerwaarden, C., de Arellano, J., et al. (2021). Soil moisture signature in global weather balloon soundings. NPJ Climate Atmospheric Sci. 4:13. doi: 10.1038/s41612-021-00167-w
Denissen, J., Teuling, A., Pitman, A., Koirala, S., Migliavacca, M., Li, W., et al. (2022). Widespread shift from ecosystem energy to water limitation with climate change. Nat. Climate Change 12, 677–684. doi: 10.1038/s41558-022-01403-8
Denissen, J., Teuling, A., Reichstein, M., and Orth, R. (2020). Critical soil moisture derived from satellite observations over Europe. J. Geophys. Research-Atmospheres 125:e2019JD031672. doi: 10.1029/2019jd031672
Ding, Y., Zhang, H., Li, Z., Xin, X., Zheng, X., and Zhao, K. (2016a). Comparison of fractional vegetation cover estimations using dimidiate pixel models and look- up table inversions of the PROSAIL model from Landsat 8 OLI data. J. Appl. Remote Sens. 10:036022. doi: 10.1117/1.Jrs.10.036022
Ding, Y., Zheng, X., Zhao, K., Xin, X., and Liu, H. (2016b). quantifying the impact of NDVIsoil determination methods and NDVIsoil variability on the estimation of fractional vegetation cover in Northeast China. Remote Sens. 8:29. doi: 10.3390/rs8010029
Donohue, R., Roderick, M., McVicar, T., and Farquhar, G. (2013). Impact of CO2 fertilization on maximum foliage cover across the globe’s warm, arid environments. Geophys. Res. Lett. 40, 3031–3035. doi: 10.1002/grl.50563
Duveiller, G., Hooker, J., and Cescatti, A. (2018). The mark of vegetation change on Earth’s surface energy balance. Nat. Commun. 9:679. doi: 10.1038/s41467-017-02810-8
Eyring, V., Bony, S., Meehl, G., Senior, C., Stevens, B., Stouffer, R., et al. (2016). Overview of the coupled model intercomparison project phase 6 (CMIP6) experimental design and organization. Geoscientific Model Dev. 9, 1937–1958. doi: 10.5194/gmd-9-1937-2016
Feng, S., and Fu, Q. (2013). Expansion of global drylands under a warming climate. Atmospheric Chem. Phys. 13, 10081–10094. doi: 10.5194/acp-13-10081-2013
Flach, M., Sippel, S., Gans, F., Bastos, A., Brenning, A., Reichstein, M., et al. (2018). Contrasting biosphere responses to hydrometeorological extremes: revisiting the 2010 western Russian heatwave. Biogeosciences 15, 6067–6085. doi: 10.5194/bg-15-6067-2018
Fu, Y., Zhao, H., Piao, S., Peaucelle, M., Peng, S., Zhou, G., et al. (2015). Declining global warming effects on the phenology of spring leaf unfolding. Nature 526, 104–107. doi: 10.1038/nature15402
Gang, C., Gao, X., Peng, S., Chen, M., Guo, L., and Jin, J. (2019). Satellite observations of the recovery of forests and grasslands in Western China. J. Geophys. Research-Biogeosci. 124, 1905–1922. doi: 10.1029/2019jg005198
Gao, J., Jiao, K., Wu, S., Ma, D., Zhao, D., Yin, Y., et al. (2017). Past and future effects of climate change on spatially heterogeneous vegetation activity in China. Earths Future 5, 679–692. doi: 10.1002/2017ef000573
Ge, W., Deng, L., Wang, F., and Han, J. (2021). Quantifying the contributions of human activities and climate change to vegetation net primary productivity dynamics in China from 2001 to 2016. Sci. Total Environ. 773:145648. doi: 10.1016/j.scitotenv.2021.145648
Gebrechorkos, S., Hulsmann, S., and Bernhofer, C. (2019). Statistically downscaled climate dataset for East Africa. Sci. Data 6:31. doi: 10.1038/s41597-019-0038-1
Green, J., Seneviratne, S., Berg, A., Findell, K., Hagemann, S., Lawrence, D., et al. (2019). Large influence of soil moisture on long-term terrestrial carbon uptake. Nature 565, 476–479. doi: 10.1038/s41586-018-0848-x
Greve, P., Roderick, M., Ukkola, A., and Wada, Y. (2019). The aridity Index under global warming. Environ. Res. Lett. 14:124006. doi: 10.1088/1748-9326/ab5046
Gutman, G., and Ignatov, A. (1998). The derivation of the green vegetation fraction from NOAA/AVHRR data for use in numerical weather prediction models. Int. J. Remote Sens. 19, 1533–1543. doi: 10.1080/014311698215333
Hay, L., Markstrom, S., and Ward-Garrison, C. (2011). Watershed-Scale response to climate change through the twenty-first century for selected basins across the United States. Earth Interact. 15:37. doi: 10.1175/2010ei370.1
Huang, J., Yu, H., Guan, X., Wang, G., and Guo, R. (2016). Accelerated dryland expansion under climate change. Nat. Climate Change 6, 166–171. doi: 10.1038/nclimate2837
Humphrey, V., Berg, A., Ciais, P., Gentine, P., Jung, M., Reichstein, M., et al. (2021). Soil moisture-atmosphere feedback dominates land carbon uptake variability. Nature 592, 65–69. doi: 10.1038/s41586-021-03325-5
Iqbal, Z., Shahid, S., Ahmed, K., Ismail, T., Khan, N., Virk, Z., et al. (2020). Evaluation of global climate models for precipitation projection in sub-Himalaya region of Pakistan. Atmospheric Res. 245:105061. doi: 10.1016/j.atmosres.2020.105061
Jiang, P., Ding, W., Yuan, Y., Ye, W., and Mu, Y. (2022). Interannual variability of vegetation sensitivity to climate in China. J. Environ. Manag. 301:113768. doi: 10.1016/j.jenvman.2021.113768
Jiao, W., Wang, L., Smith, W., Chang, Q., Wang, H., and D’Odorico, P. (2021). Observed increasing water constraint on vegetation growth over the last three decades. Nat. Commun. 12:9. doi: 10.1038/s41467-021-24016-9
Jung, M., Reichstein, M., Ciais, P., Seneviratne, S., Sheffield, J., Goulden, M., et al. (2010). Recent decline in the global land evapotranspiration trend due to limited moisture supply. Nature 467, 951–954. doi: 10.1038/nature09396
Kang, X., Hao, Y., Cui, X., Chen, H., Huang, S., Du, Y., et al. (2016). Variability and changes in climate, phenology, and gross primary production of an alpine wetland ecosystem. Remote Sens. 8:391. doi: 10.3390/rs8050391
Klesse, S., Babst, F., Lienert, S., Spahni, R., Joos, F., Bouriaud, O., et al. (2018). A combined tree ring and vegetation model assessment of european forest growth sensitivity to interannual climate variability. Global Biogeochem. Cycles 32, 1226–1240. doi: 10.1029/2017gb005856
Kroll, J., Denissen, J., Migliavacca, M., Li, W., Hildebrandt, A., and Orth, R. (2022). Spatially varying relevance of hydrometeorological hazards for vegetation productivity extremes. Biogeosciences 19, 477–489. doi: 10.5194/bg-19-477-2022
Kuang, X., and Jiao, J. (2016). Review on climate change on the Tibetan Plateau during the last half century. J. Geophys. Research-Atmospheres 121, 3979–4007. doi: 10.1002/2015jd024728
Li, G., Chen, W., Zhang, X., Bi, P., Yang, Z., Shi, X., et al. (2022a). Spatiotemporal dynamics of vegetation in China from 1981 to 2100 from the perspective of hydrothermal factor analysis. Environ. Sci. Pollution Res. 29, 14219–14230. doi: 10.1007/s11356-021-16664-7
Li, W., Migliavacca, M., Forkel, M., Denissen, J., Reichstein, M., Yang, H., et al. (2022b). Widespread increasing vegetation sensitivity to soil moisture. Nat. Commun. 13:9. doi: 10.1038/s41467-022-31667-9
Li, J., Wang, J., Gong, B., Gan, X., Hu, W., and Liu, W. (2014). Spatiotemporal changes of vegetation cover in response to climate change on the tibetan plateau. Acta Geol. Sinica-English Edition 88, 974–983. doi: 10.1111/1755-6724.12250
Li, L., Chen, X., Wang, Z., Xu, W., and Tang, H. (2010). Climate change and its regional differences over the tibetan plateau. Adv. Climate Change Res. 6, 181–186.
Li, W., Migliavacca, M., Forkel, M., Walther, S., Reichstein, M., and Orth, R. (2021). Revisiting global vegetation controls using multi-layer soil moisture. Geophys. Res. Lett. 48:13. doi: 10.1029/2021gl092856
Liu, C., Zhang, X., Wang, T., Chen, G., Zhu, K., Wang, Q., et al. (2022). Detection of vegetation coverage changes in the Yellow River Basin from 2003 to 2020. Ecol. Indicators 138:15. doi: 10.1016/j.ecolind.2022.108818
Lou, W., Sun, K., Zhao, Y., Deng, S., and Zhou, Z. (2021). Impact of climate change on inter-annual variation in tea plant output in Zhejiang, China. Int. J. Climatol. 41, E479–E490. doi: 10.1002/joc.6700
Lu, H., Qin, Z., Lin, S., Chen, X., Chen, B., He, B., et al. (2022). Large influence of atmospheric vapor pressure deficit on ecosystem production efficiency. Nat. Commun. 13:1653. doi: 10.1038/s41467-022-29009-w
Ma, Z., Guo, J., Li, W., Cai, Z., and Cao, S. (2021). Regional differences in the factors that affect vegetation cover in China. Land Degradation Dev. 32, 1961–1969. doi: 10.1002/ldr.3847
Michaletz, S., Cheng, D., Kerkhoff, A., and Enquist, B. (2014). Convergence of terrestrial plant production across global climate gradients. Nature 512, 39–43. doi: 10.1038/nature13470
O’Neill, B., Tebaldi, C., van Vuuren, D., Eyring, V., Friedlingstein, P., Hurtt, G., et al. (2016). The Scenario Model Intercomparison Project (ScenarioMIP) for CMIP6. Geosci. Model Dev. 9, 3461–3482. doi: 10.5194/gmd-9-3461-2016
Ouyang, W., Wan, X., Xu, Y., Wang, X., and Lin, C. (2020). Vertical difference of climate change impacts on vegetation at temporal-spatial scales in the upper stream of the Mekong River Basin. Sci. Total Environ. 701:134782. doi: 10.1016/j.scitotenv.2019.134782
Piao, S., Ciais, P., Huang, Y., Shen, Z., Peng, S., Li, J., et al. (2010). The impacts of climate change on water resources and agriculture in China. Nature 467, 43–51. doi: 10.1038/nature09364
Piao, S., Liu, Z., Wang, T., Peng, S., Ciais, P., Huang, M., et al. (2017). Weakening temperature control on the interannual variations of spring carbon uptake across northern lands. Nat. Climate Change 7, 359–363. doi: 10.1038/nclimate3277
Piao, S., Nan, H., Huntingford, C., Ciais, P., Friedlingstein, P., Sitch, S., et al. (2014). Evidence for a weakening relationship between interannual temperature variability and northern vegetation activity. Nat. Commun. 5:5018. doi: 10.1038/ncomms6018
Piao, S., Wang, X., Park, T., Chen, C., Lian, X., He, Y., et al. (2020). Characteristics, drivers and feedbacks of global greening. Nat. Rev. Earth Environ. 1, 14–27. doi: 10.1038/s43017-019-0001-x
Qian, C., Shao, L., Hou, X., Zhang, B., Chen, W., and Xia, X. (2019). Detection and attribution of vegetation greening trend across distinct local landscapes under china’s grain to green program: a case study in Shaanxi Province. Catena 183:104182. doi: 10.1016/j.catena.2019.104182
Rundquist, B. (2002). The influence of canopy green vegetation fraction on spectral measurements over native tallgrass prairie. Remote Sens. Environ. 81, 129–135. doi: 10.1016/s0034-4257(01)00339-x
Seneviratne, S., Corti, T., Davin, E., Hirschi, M., Jaeger, E., Lehner, I., et al. (2010). Investigating soil moisture-climate interactions in a changing climate: a review. Earth-Sci. Rev. 99, 125–161. doi: 10.1016/j.earscirev.2010.02.004
Taylor, K., Stouffer, R., and Meehl, G. (2012). An overview of cmip5 and the experiment design. Bull. Am. Meteorol. Soc. 93, 485–498. doi: 10.1175/bams-d-11-00094.1
Wang, W., Ciais, P., Nemani, R., Canadell, J., Piao, S., Sitch, S., et al. (2013). Variations in atmospheric CO2 growth rates coupled with tropical temperature. Proc. Natl. Acad. Sci. U S A. 110, 13061–13066. doi: 10.1073/pnas.1219683110
Wang, Y., Sun, J., He, W., Ye, C., Liu, B., Chen, Y., et al. (2022). Migration of vegetation boundary between alpine steppe and meadow on a century-scale across the Tibetan Plateau. Ecol. Indicators 136:108599. doi: 10.1016/j.ecolind.2022.108599
Wu, D., Wu, H., Zhao, X., Zhou, T., Tang, B., Zhao, W., et al. (2014). Evaluation of spatiotemporal variations of global fractional vegetation cover based on GIMMS NDVI Data from 1982 to 2011. Remote Sens. 6, 4217–4239. doi: 10.3390/rs6054217
Xu, X., Lin, Z., Li, J., and Zeng, Q. (2002). Temporal-spatial characteristics of vegetation cover and desertification of China by using remote sensing data. Prog. Nat. Sci. 12, 45–49.
Yan, Y., Jeong, S., Park, C., Mueller, N., Piao, S., Park, H., et al. (2021). Effects of extreme temperature on China’s tea production. Environ. Res. Lett. 16:044040. doi: 10.1088/1748-9326/abede6
Yang, K., Wu, H., Qin, J., Lin, C., Tang, W., and Chen, Y. (2014). Recent climate changes over the Tibetan Plateau and their impacts on energy and water cycle: a review. Global Plan. Change 112, 79–91. doi: 10.1016/j.gloplacha.2013.12.001
Yuan, W., Wu, S. Y., Hou, S. G., Xu, Z. W., Pang, H. X., and Lu, H. Y. (2021). Projecting future vegetation change for northeast China using CMIP6 model. Remote Sensing 13:18. doi: 10.3390/rs13173531
Yuan, W., Zheng, Y., Piao, S., Ciais, P., Lombardozzi, D., Wang, Y., et al. (2019). Increased atmospheric vapor pressure deficit reduces global vegetation growth. Sci. Adv. 5:eaax1396. doi: 10.1126/sciadv.aax1396
Zeng, X., Dickinson, R., Walker, A., Shaikh, M., DeFries, R., and Qi, J. (2000). Derivation and evaluation of global 1-km fractional vegetation cover data for land modeling. J. Appl. Meteorol. 39, 826–839.
Zhao, F., Wang, X., Ma, S., Wu, Y., Qiu, L., Sun, P., et al. (2023). Widespread increasing ecosystem water limitation during the past three decades in the Yellow River Basin, China. J. Geophys. Res. Biogeosci. 128:e2022JG007140. doi: 10.1029/2022jg007140
Zhou, S., Williams, A., Lintner, B., Berg, A., Zhang, Y., Keenan, T., et al. (2021). Soil moisture-atmosphere feedbacks mitigate declining water availability in drylands. Nat. Climate Change 11, 38–44. doi: 10.1038/s41558-020-00945-z
Zhou, T., Zou, L., and Chen, X. (2019). Commentary on the Coupled Model Intercomparison Project Phase 6 (CMIP6). Prog. Inquisitiones de Mutatione Climatis 15, 445–456.
Zhou, Z., Ding, Y., Shi, H., Cai, H., Fu, Q., Liu, S., et al. (2020). Analysis and prediction of vegetation dynamic changes in China: Past, present and future. Ecol. Indicators 117:106642. doi: 10.1016/j.ecolind.2020.106642
Keywords: CMIP6, Yellow River Basin, fractional vegetation cover, climate change, delta downscaling
Citation: Jian S, Shi S, Cui J, Zhu T and Hu C (2023) Study on fractional vegetation cover dynamic in the Yellow River Basin, China from 1901 to 2100. Front. For. Glob. Change 6:1157285. doi: 10.3389/ffgc.2023.1157285
Received: 02 February 2023; Accepted: 27 March 2023;
Published: 17 April 2023.
Edited by:
Shongming Huang, Alberta Ministry of Agriculture and Forestry, CanadaReviewed by:
Nan Cong, Chinese Academy of Sciences (CAS), ChinaFubo Zhao, Xi’an Jiaotong University, China
Copyright © 2023 Jian, Shi, Cui, Zhu and Hu. This is an open-access article distributed under the terms of the Creative Commons Attribution License (CC BY). The use, distribution or reproduction in other forums is permitted, provided the original author(s) and the copyright owner(s) are credited and that the original publication in this journal is cited, in accordance with accepted academic practice. No use, distribution or reproduction is permitted which does not comply with these terms.
*Correspondence: Caihong Hu, aHVjYWlob25nQHp6dS5lZHUuY24=