 Jinrui Lei1,2†
 Zongzhu Chen
- 1Hainan Academy of Forestry (Hainan Academy of Mangrove), Haikou, China
- 2Key Laboratory of Tropical Forestry Resources Monitoring and Application of Hainan, Haikou, China
- 3College of Forestry, Hainan University, Haikou, China
Tropical rainforests in the central hilly section of Hainan Island are the source of the Nandu, Changhua, and Wanquan rivers, which are crucial for water conservation and ecological protection. The quantitative assessment of water yield in the three basins is beneficial for developing regional water resource protection plans, establishing ecological compensation mechanisms, and maintaining ecological balance. Based on land use data from five periods between 1980 and 2020, this paper adopts the InVEST model and geographic detectors to investigate the spatial-temporal variation characteristics and driving factors of water yield in three major basins of Hainan Island. The results demonstrate that forestland, which makes up more than 70% of the total area in the three basins of Hainan Island, is the predominant land use type. With a depth of 1269.18 mm, Wanquan Basin is the deepest of the three basins, followed by Nandu Basin and Changhua Basin. The total water yield of three basins shows a slightly decreasing trend from 17.991 billion m3 in 1980 to 17.864 billion m3 in 2020. The spatial distribution of water yield is high in the southeast region and low in the northwest region, with strong autocorrelation and significant aggregation. According to geographic detection, land use type is the dominant factor for the spatial differentiation of water yield in the three basins, with a contribution rate of 0.563, and soil type and annual precipitation are important impact factors. The interaction and synergy of soil types and land use types jointly affect the spatial differentiation of water yield in the basin. The results of this study can provide data support and scientific references for biodiversity conservation and ecosystem restoration in the three major basins of Hainan Island.
1. Introduction
Water is the source of life and drives the material and energy cycle of ecosystem activities at different scales (Lü et al., 2015; Liu et al., 2020). It is an indispensable material resource for human survival and social advancement (Li and Qian, 2018). With the escalation of global climate change, population growth, and overexploitation of natural resources, a slew of water-related ecological issues have arisen, including drought and flood disasters, groundwater depletion, water pollution, degradation of water production functions, etc. (Li and Qian, 2018; Di Baldassarre et al., 2019). Moreover, water scarcity and security problems are increasingly prominent worldwide, which have emerged as critical issues limiting the sustainable development of national and regional social economies (Safavi et al., 2016). The Assessment Report on Global Biodiversity and Ecosystem Services published in May 2019 by IPBES (The Intergovernmental Science-Policy Platform on Biodiversity and Ecosystem Services) stated that the ecological environment losses and ecosystem service decline were severe, and that the function degradation of water resources was a major factor (Hu et al., 2022). In this context, expanding research on the evolution of water resources has become an essential prerequisite for ensuring ecological security and promoting the sustainable development of regional water resources.
The drainage basin is a comprehensive geographical ecological unit that serves as the primary research target for ecological environment conservation and governance and a hot spot for investigating complex themes like regional ecological, economic, and social development. The integrity of the ecosystem and the comprehensiveness of ecological elements can be better reflected when discussing environmental issues from the perspective of drainage basins (Zhang et al., 2012). The drainage basin views the river system as the connecting factor that joins the many geographical and physical components of the system into a cohesive whole. For instance, water, sediment, and other substances in the basin circulate material, energy, and information to meet the needs of human wellbeing for various ecosystem services in the basin, which play an important role in irrigation agriculture, aquaculture, industrial production, residents’ life, and so on (Wei et al., 2021). As a result, water yield service assessment is increasingly being used to communicate the value and function of natural ecosystems to management decision-makers, which helps to protect and promote the ecological wellbeing of natural ecosystems to society (Barbier et al., 2011). As human activities increase, land use/land cover change (LUCC) has a direct impact on the landscape pattern, ecosystem service types, and ecological processes of the basin, as well as a significant impact on the basin’s water volume and the water cycle, thereby affecting the service function of the entire ecosystem (Balist et al., 2022). Therefore, LUCC is considered the main factor leading to the spatial-temporal evolution of water yield (Zipper et al., 2018; Li et al., 2020). By simulating the long-term spatial-temporal dynamics of water yield under the background of land use change, and identifying the dominant and inferior regions of water yield, it can provide scientific reference for establishing future water resources management strategies (Deng et al., 2021). The quantitative assessment of water yield is primarily based on biophysical models such as InVEST (Integrated Valuation of Ecosystem Services and Trade-offs), SWAT (Soil and Water Assessment Tool), VIC (Variable Infiltration Capacity), etc., which couple hydrological and biogeochemical processes (Yin et al., 2020). Specifically, the InVEST model provides a method for evaluating water yield from the perspective of ecosystem services, which overcomes the drawbacks of conventional research, such as single evaluation results and lack of spatial dynamic analysis (Lü et al., 2022), making it suitable for evaluating the variations of ecosystem service functions caused by land use change or climate change (Yin et al., 2020). For instance, González-García et al. (2020) employed the InVEST model to establish a supply-demand relationship diagram for water supply, climate management, and outdoor recreation in order to quantify the regional supply-demand mismatch in ecosystem services. Similarly, Scordo et al. (2018) examined the effects of future climate change and land use change on the water security of a semi-arid forest basin using the Water Yield module of the InVEST model to simulate the basin’s water security risk. The preceding studies have provided an important reference for assessing the spatial distribution of water yield in basins under land use change.
In terms of water yield, the relevant research primarily employed the methods of correlation analysis, local statistical analysis, and spatial mapping to qualitatively describe or quantitatively analyze the driving factors of water yield services, ignoring the differences between the driving factors and water yield services in geographical space (Huang et al., 2022). Geographic Detector is a novel spatial statistical method that detects the consistency of the spatial distribution pattern of dependent and independent variables through spatial heterogeneity, as well as measures the interpretation of dependent variables to independent variables and their interrelationships (Wang and Xu, 2017). Therefore, it has been widely used in research on land use, ecosystem services, regional economies, and environmental pollution (Song et al., 2020; Huang et al., 2022; Kang et al., 2022). A compelling argument was made for the preservation and recovery of water yield services by using geographic detectors to investigate the spatial variations among the driving factors of water yield (Grizzetti et al., 2019). In Yunnan Province, for instance, Huang et al. (2022) utilized geographical detectors to analyze the spatial driving characteristics of climate, vegetation, soil, terrain, and other factors on water yield services, and the results showed that climate factors are the main driving factors leading to spatial heterogeneity of water yield services.
The central mountainous area of Hainan Island is an essential ecological functional area in China and one of the global biodiversity hot spots. Here are the sources of three major rivers on the island, the Nandu, Changhua, and Wanquan. Its three major river basins provide crucial ecological purposes, such as protecting biodiversity, water quality, and soil and water conservation, and also serve as vital water sources for drinking and agricultural irrigation on Hainan Island. As a result, the central mountainous area is often referred to as the “Hainan Water Tower” and the origin of Hainan’s three rivers. Since the establishment of Hainan Province in 1988, particularly with the establishment of the Hainan Free Trade Port, the transformation of regional land use types has accelerated, habitat fragmentation has increased, and the regional water shortage and soil erosion problems in the province have become increasingly prominent. In order to develop reasonable management strategies for drainage basins and scientific policy guidelines to reduce the development lag and ecological vulnerability brought on by a lack of water, the relevant stakeholders and management departments urgently need to have a thorough and objective understanding of the spatial-temporal evolution and the driving factors of water yield in the three major drainage basins of Hainan Island.
Therefore, this study used the InVEST model to assess the spatial distribution characteristics of water yield in different periods in the three major drainage basins of Hainan Island based on the land use data in 1980, 1990, 2000, 2010, and 2020. Additionally, geographical detectors were employed in this study to analyze the impact of natural geographical and environmental factors such as temperature, rainfall, soil type, population density, per capita GDP, and other socioeconomic factors on the study’s findings. The objectives of this study are as follows: (1) to reveal the characteristics of land use change in the three major drainage basins of Hainan Island from 1980 to 2020; (2) to evaluate and visualize the spatial-temporal evolution patterns of water yield in the three major basins from 1980 to 2020; and (3) to investigate the driving mechanism of water yield services in the three major basins, as well as the characteristics and laws of their spatial response to the driving factors.
2. Materials and methods
2.1. Study area overview
Located south of the Tropic of Cancer (18.80°–20.10°N, 108.37°–111.03°E), Hainan Island is typical of a tropical monsoon marine climate, with a slight annual temperature difference and a high average temperature and has abundant resources for light, heat, and water. The entire island is low and flat around the perimeter and high in the center, with Wuzhi Mountain (1,867 m) and Yingge Mountain (1,811 m) serving as the core of the uplift, and the mountains, hills, mesas, and plains gradually descend from the center to the periphery (Figure 1). The rivers Nandu, Changhua, and Wanquan originate from Bawang Ridge, Wuzhi Mountain, and other central mountain areas. The three rivers have a total length of 774.18 km and a drainage area of 15,748 km2, accounting for 46% of the island’s area. They run through Baisha, Qiongzhong, Danzhou, Tunchang, Chengmai, Ding’an, and other important cities and counties, occupying a commanding height position that impacts and balances the ecological security of Hainan Island. Hainan Tropical Rainforest National Park is home to the higher reaches of the three major drainage basins, which was formally established as China’s of first group national parks in October 2021. The park, one of the world’s 34 biodiversity hot spots, is home to a variety of typical tropical rainforest habitats and is abundant in both plant and animal resources. In the middle and lower reaches of the three basins, cropland and forestland predominate, together with a dense population. Human activities like agricultural production and fast urbanization have a significant negative impact on the basins’ ecosystems and biodiversity preservation.
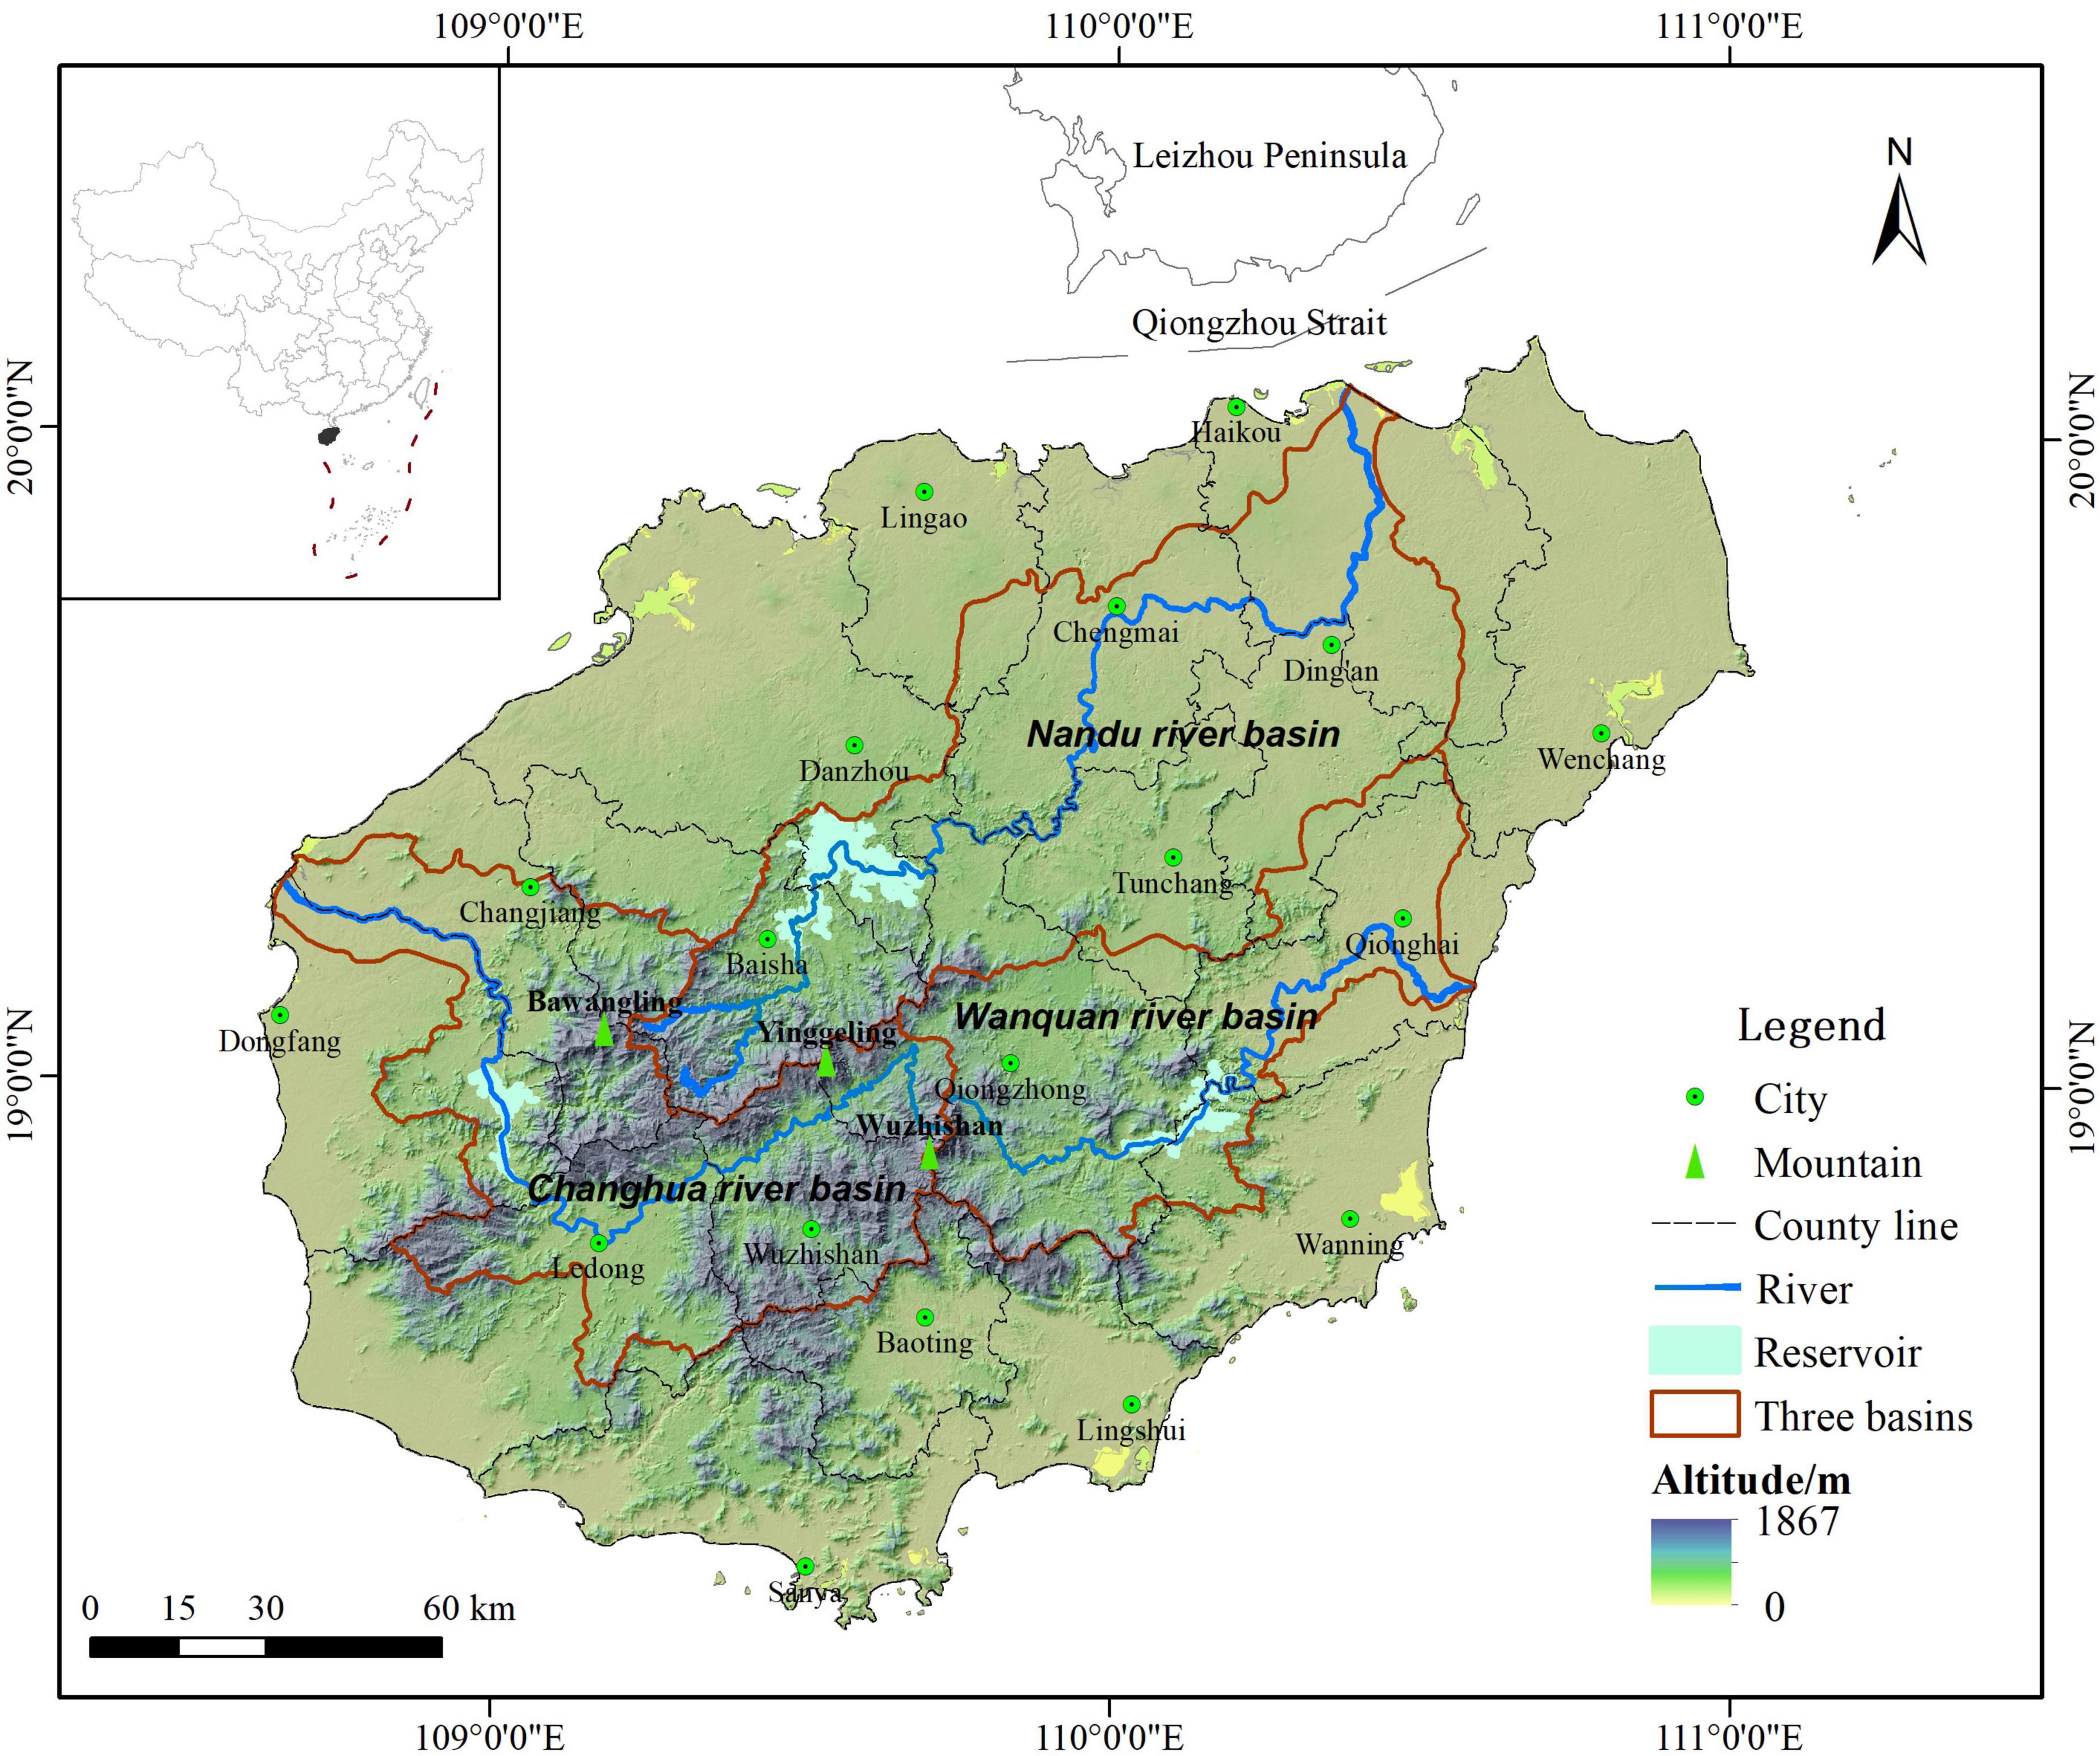
Figure 1. Location of the study area.
2.2. Data sources and processing
The data used in this study covered land use type, meteorology data, soil, social economy, potential evapotranspiration (ET0), digital elevation model (DEM), normalized difference vegetation index (NDVI), basin vector boundary, etc. Table 1 displays the data sources and specifics. Table 2 displays the biophysical coefficients used in the InVEST model, representing the characteristics of land use and land cover in the study area. The values of pertinent coefficients are based on earlier studies (Li et al., 2022). Notably, all data were resampled at a spatial resolution of 30 m and projected using the coordinate system CGCS2000_3_Degree_GK_CM_111E.
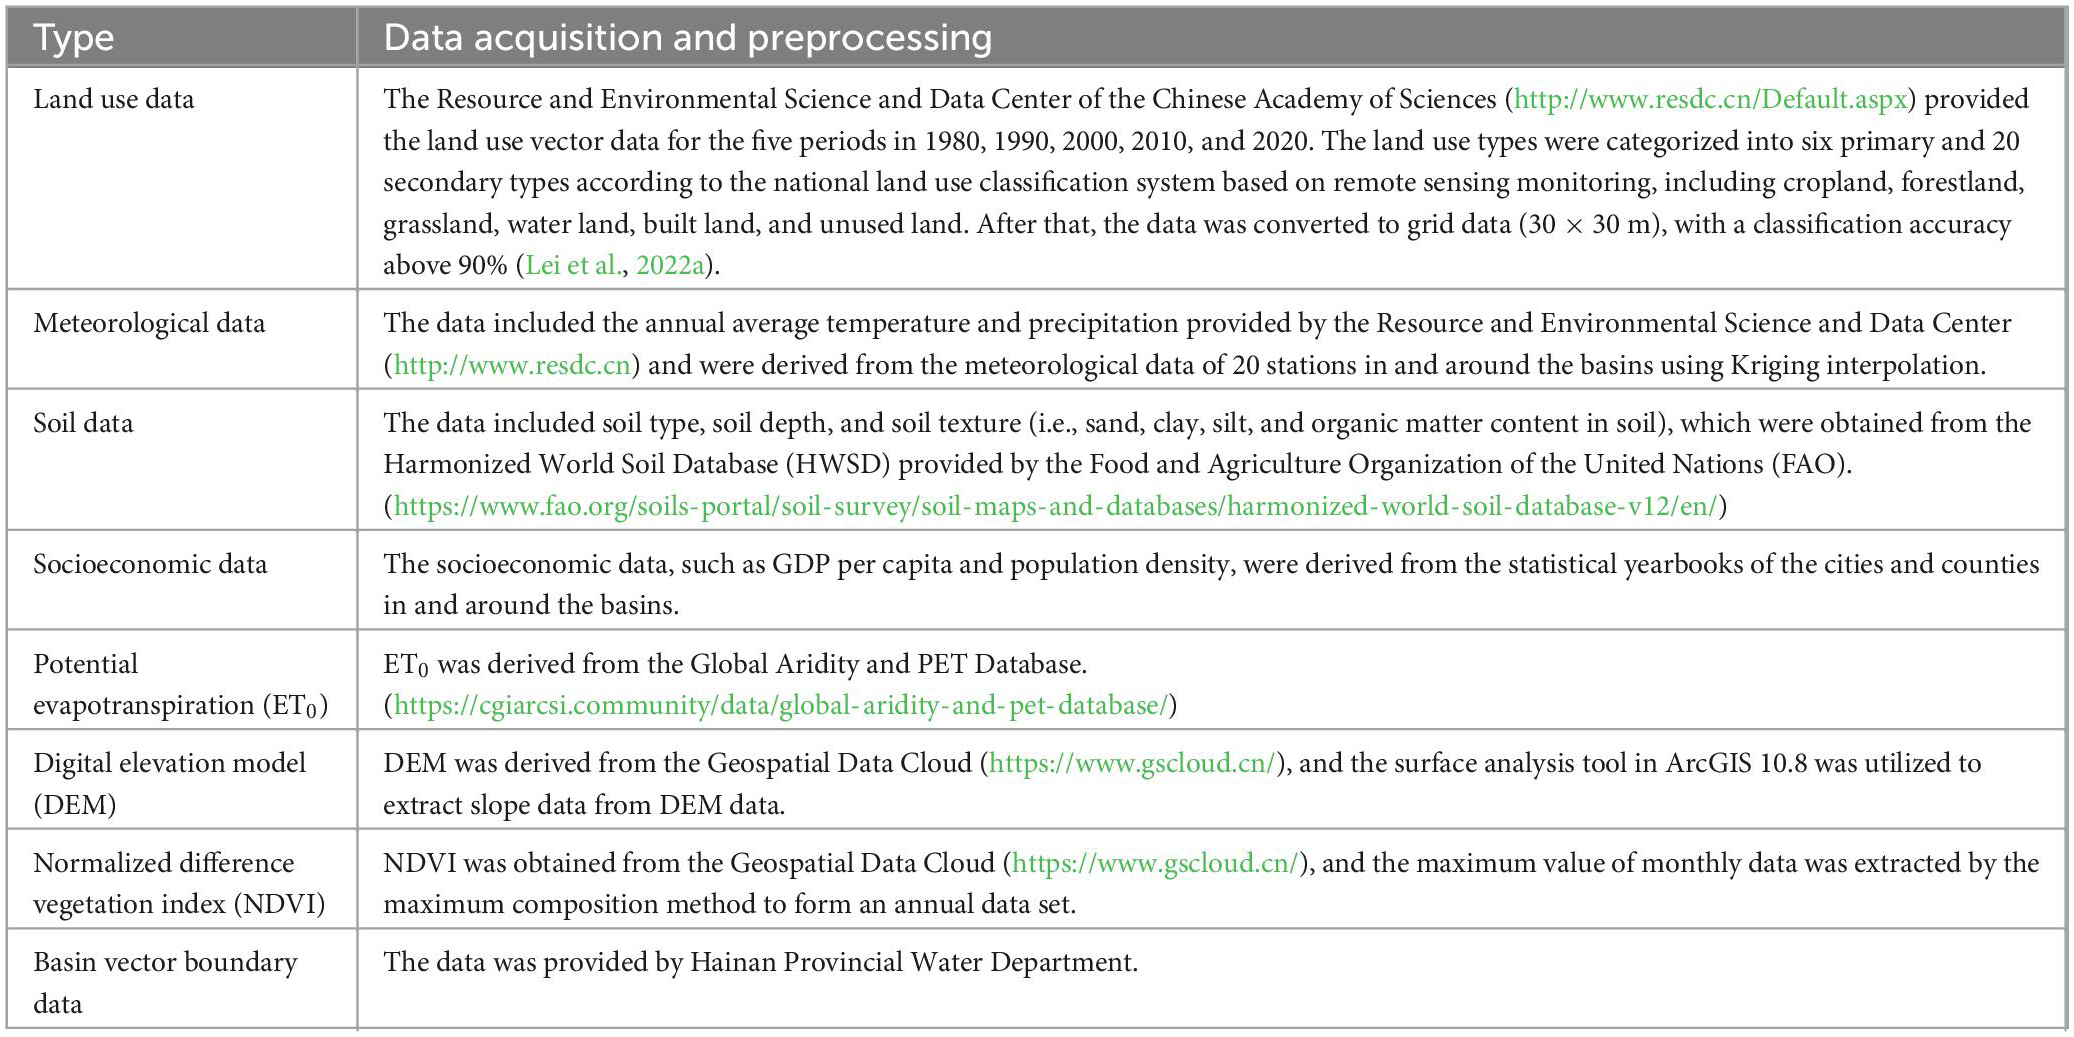
Table 1. Data acquisition and preprocessing.
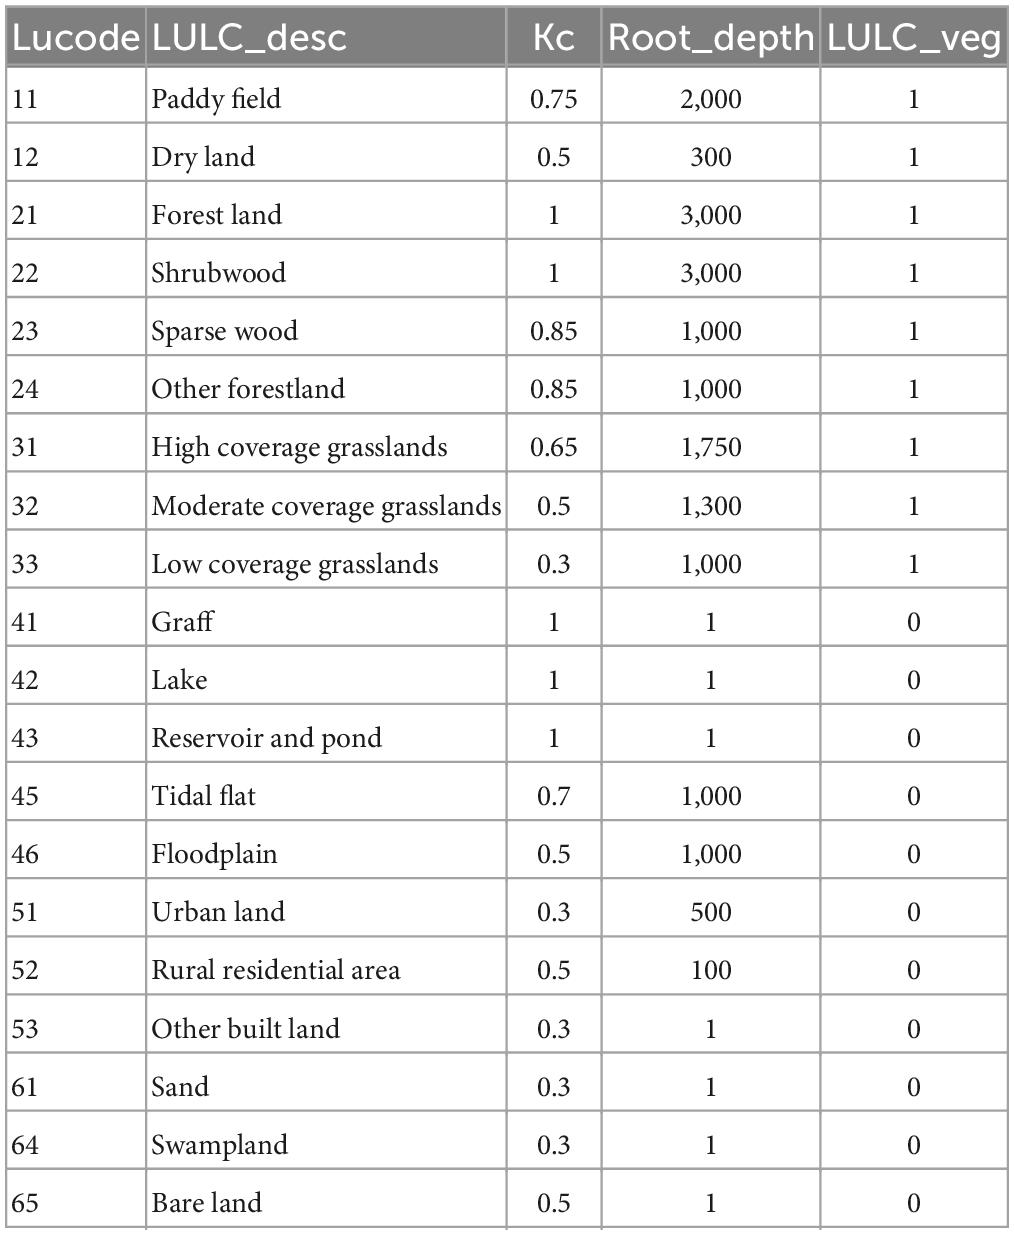
Table 2. Biophysical coefficients.
2.3. Research method
2.3.1. Water yield assessment
The InVEST model has become one of the crucial tools for evaluating water yield services due to its easy data access, adjustable parameter calibration, and accurate assessment results (Bai et al., 2019; Yang et al., 2019). Based on the Water Yield module of the InVEST model, this study determined the water yield of the three major basins by combining the local climate, LUCC type, root depth, and soil type in accordance with the water balance principle. The calculating formulas are as follows:
where Yxj is the annual water yield of grid x in the jth land use type (mm); AETxj is the actual annual evapotranspiration of grid x in the jth land use type (mm); Px is the average annual rainfall of grid x in the jth land use type (mm); AETxj/Px is the ratio of actual evapotranspiration to rainfall, which was calculated by the empirical model proposed by Zhang et al. (2001); ωx is a non-physical parameter representing the physioclimate–soil properties, dimensionless; Rxj is the dryness index of grid x in the jth land use type, dimensionless; AWCx is the available water content of plants in grid x (mm), which is related to soil texture and effective soil depth; kxj is the vegetation evapotranspiration coefficient, which is expressed by the ratio of the evapotranspiration of grid x in the jth land use type to the potential evapotranspiration (ET0). The Z coefficient, a seasonal constant, has a positive relationship with the annual frequency of precipitation. Z is taken as 2.6 according to the reference value of Hainan Island in previous literature (Han et al., 2022a). ET0 is the potential evapotranspiration (mm); MSDx (max soil depth x) is the maximum soil depth; RDx (root depth x) is the root depth; PAWCx is the soil water content (%), which is calculated by the empirical formula of soil available water content (Gupta and Larson, 1979).
2.3.2. Spatial statistical analysis
Exploratory spatial data analysis is a geostatistical analysis method, which computes spatial autocorrelation coefficients to describe the spatial aggregation and anomaly of the spatial distribution pattern of visualized things or phenomena (Lei et al., 2022a). This analysis method is frequently employed in investigating water-related ecosystem services (Yang J. et al., 2021; Zou and Cong, 2021). Moran’s I was used in this study to describe the global spatial autocorrelation characteristics of water yield services in the three major basins. was used to explore the aggregation and differentiation characteristics of spatial variations of water yield services in the three major basins, namely, the distribution pattern of “hot spots” and “cold spots,” so as to obtain the spatial autocorrelation pattern of water yield services. The calculation formulas are as follows:
where n is the number of spatial grid cells; xi and xj refer to the observed values of cell i and j, respectively,represents the deviation between the observed values and the average values of the ith spatial cell; wij is the spatial weight matrix established based on the k spatial adjacency relation; is the average of the observed values of all geographical units. Moran’s I has a value range of (–1, 1). A value higher than 0 indicates a positive spatial correlation. The higher the value, the higher the correlation, and the stronger the geographical aggregation. A value less than 0 denotes a negative spatial correlation. A value of 0 denotes no spatial correlation with randomly distributed spatial units. The typical probability is represented by the P-value of Getis-Ord index. 0.01, 0.05, and 0.1 correspond to 99, 95, and 90% of the typical confidence intervals, respectively, indicating the degree of aggregation and differentiation of spatial units’ hot spots or cold spots (Lei et al., 2022a).
In this study, the fishnet function of ArcGIS 10.8 was used to divide the three major basins into grid cells with a square of 1 × 1 km. Neighborhood statistics were used for numerical statistics on the grid map of water yield at various stages, followed by assigning values to grid cells for spatial statistical analysis to obtain hot spot maps of water yield of the three major basins in Hainan Island in different periods.
2.3.3. Geographical detector analysis
Geographic detectors are statistical methods for detecting spatial differentiation and determining its driving forces (Wang and Xu, 2017). Natural, economic, and human factors all have an impact on water yield, making it a very complex process (Su and Wang, 2018). Referring to a large number of research results on the driving factors of water yield (Table 3), this study finally selected annual rainfall, annual temperature, elevation, slope, normalized difference vegetation index (NDVI), soil type, land use type, population density, and GDP per capita as the impact factors. A 1 × 1 km grid was constructed based on the data of water yield and impact factors, and the grid center value was read as an input for the R programming. By calling the optidisc function of the “GD” package in R language (Song et al., 2020), the data level was set between 5 and 15, and five alternative discretization methods were set, including equal, natural, quantitative, geometric, and sd. After that, the optimal discretization method and classification combination could be selected by comparison to maximize the q value. Finally, the discretized category variables were introduced into the geographic detectors for factor detection, risk detection, and interactive detection, and the impact factors of the spatial-temporal variation of water yield services and their interactions were quantitatively analyzed to determine the impact factors of water yield in the three major basins and their response mechanisms. The following is the calculation formula for q:
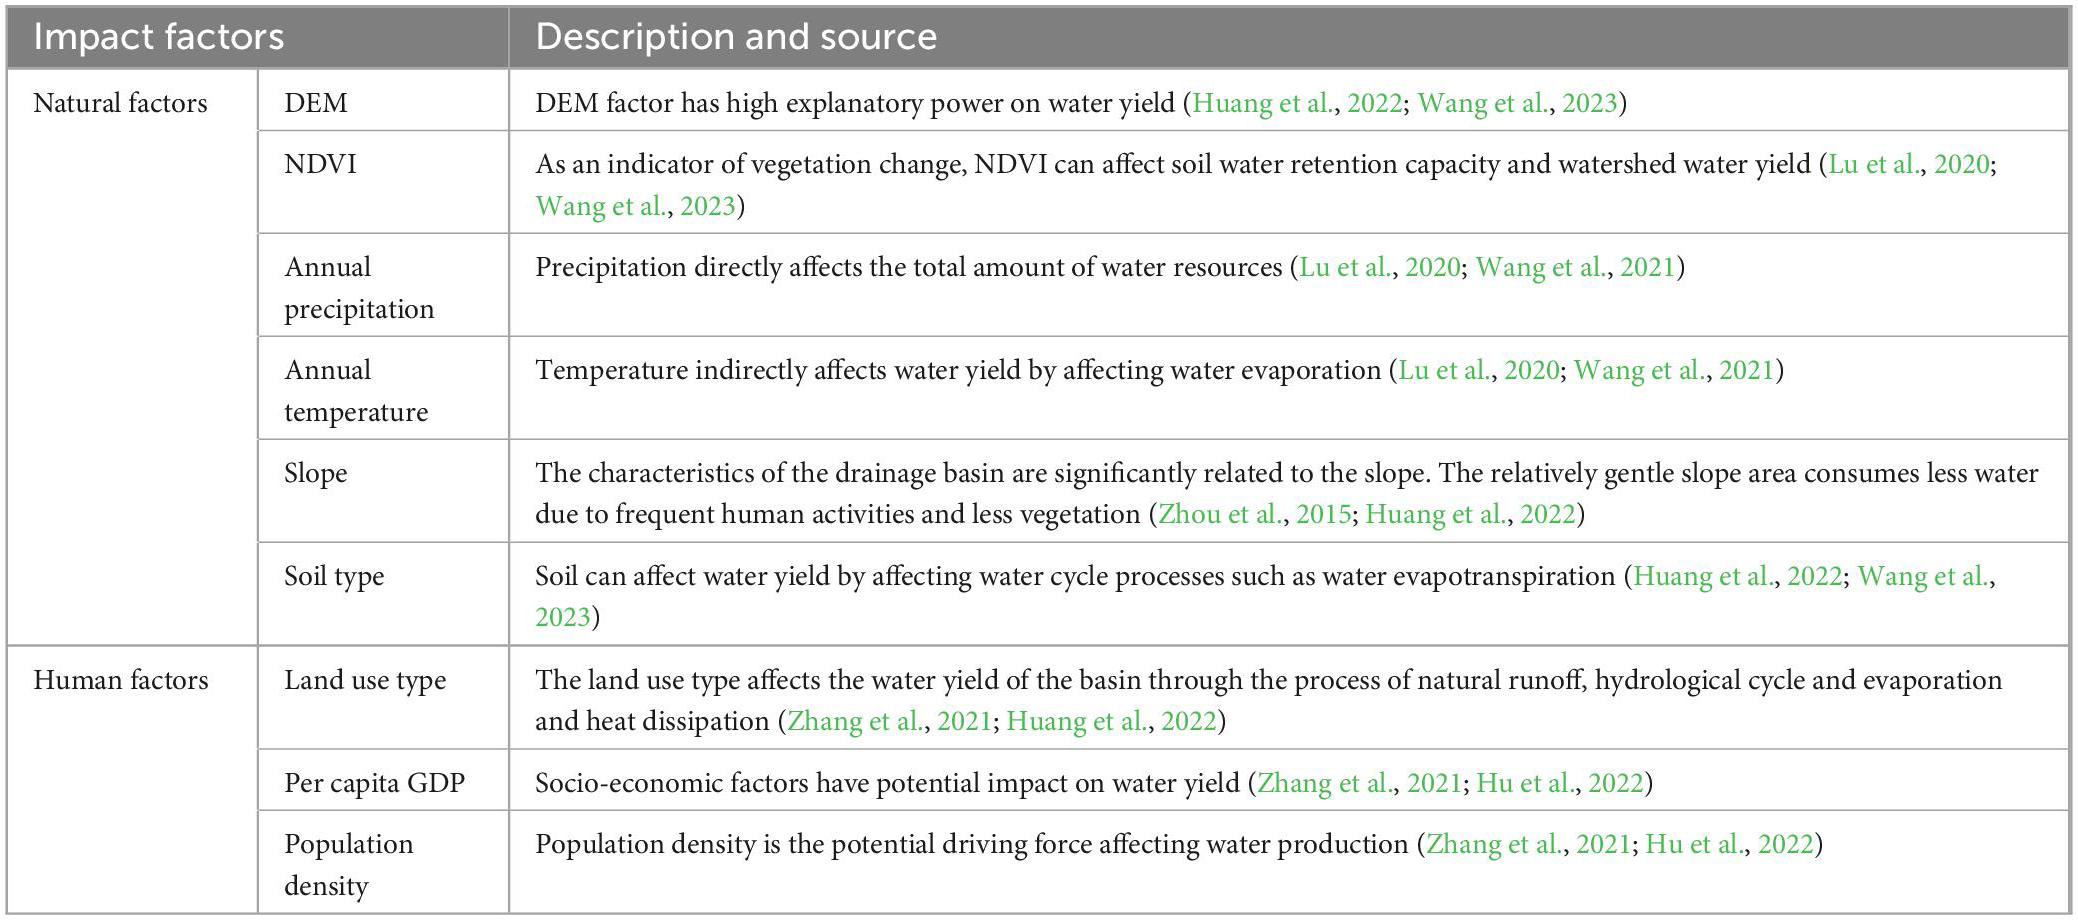
Table 3. The main influencing factors of water yield.
where q reflects the influencing degree of a factor on the spatial-temporal distribution of water yield, with a range of (0, 1). The larger the q value, the greater the influence of factors on the spatial distribution of water yield in the study area. L represents the total sample number of impact factors, N and Nh represent the water yield of the entire study area and subarea h, respectively; σ2 and σh2 represent the discrete variance of water yield in the entire study area and subarea h, respectively.
3. Results
3.1. Dynamic variation characteristics of land use in basins
3.1.1. Land use type change
Figure 2 demonstrates the calculation results of land use change in the three major basins of Hainan Island from 1980 to 2020. It can be discovered that forestland has been the main type of land use in the three major basins in recent 40 years, accounting for more than 70% of the total area, followed by cropland, accounting for 20%. The area of other land use types is relatively small. On the whole, the changes of land use types in the three major basins is mainly reflected in the continuous increase of built land and water land, with an increase of 169.20 and 101.01 km2, respectively. The area of grassland and cropland decreased by 160.19 and 157.91 km2, respectively; The forestland area increased from 11,227.60 km2 in 1980 to 11,373.11 km2 in 2000, but then declined significantly and decreased to 11,293.07 km2 in 2020.
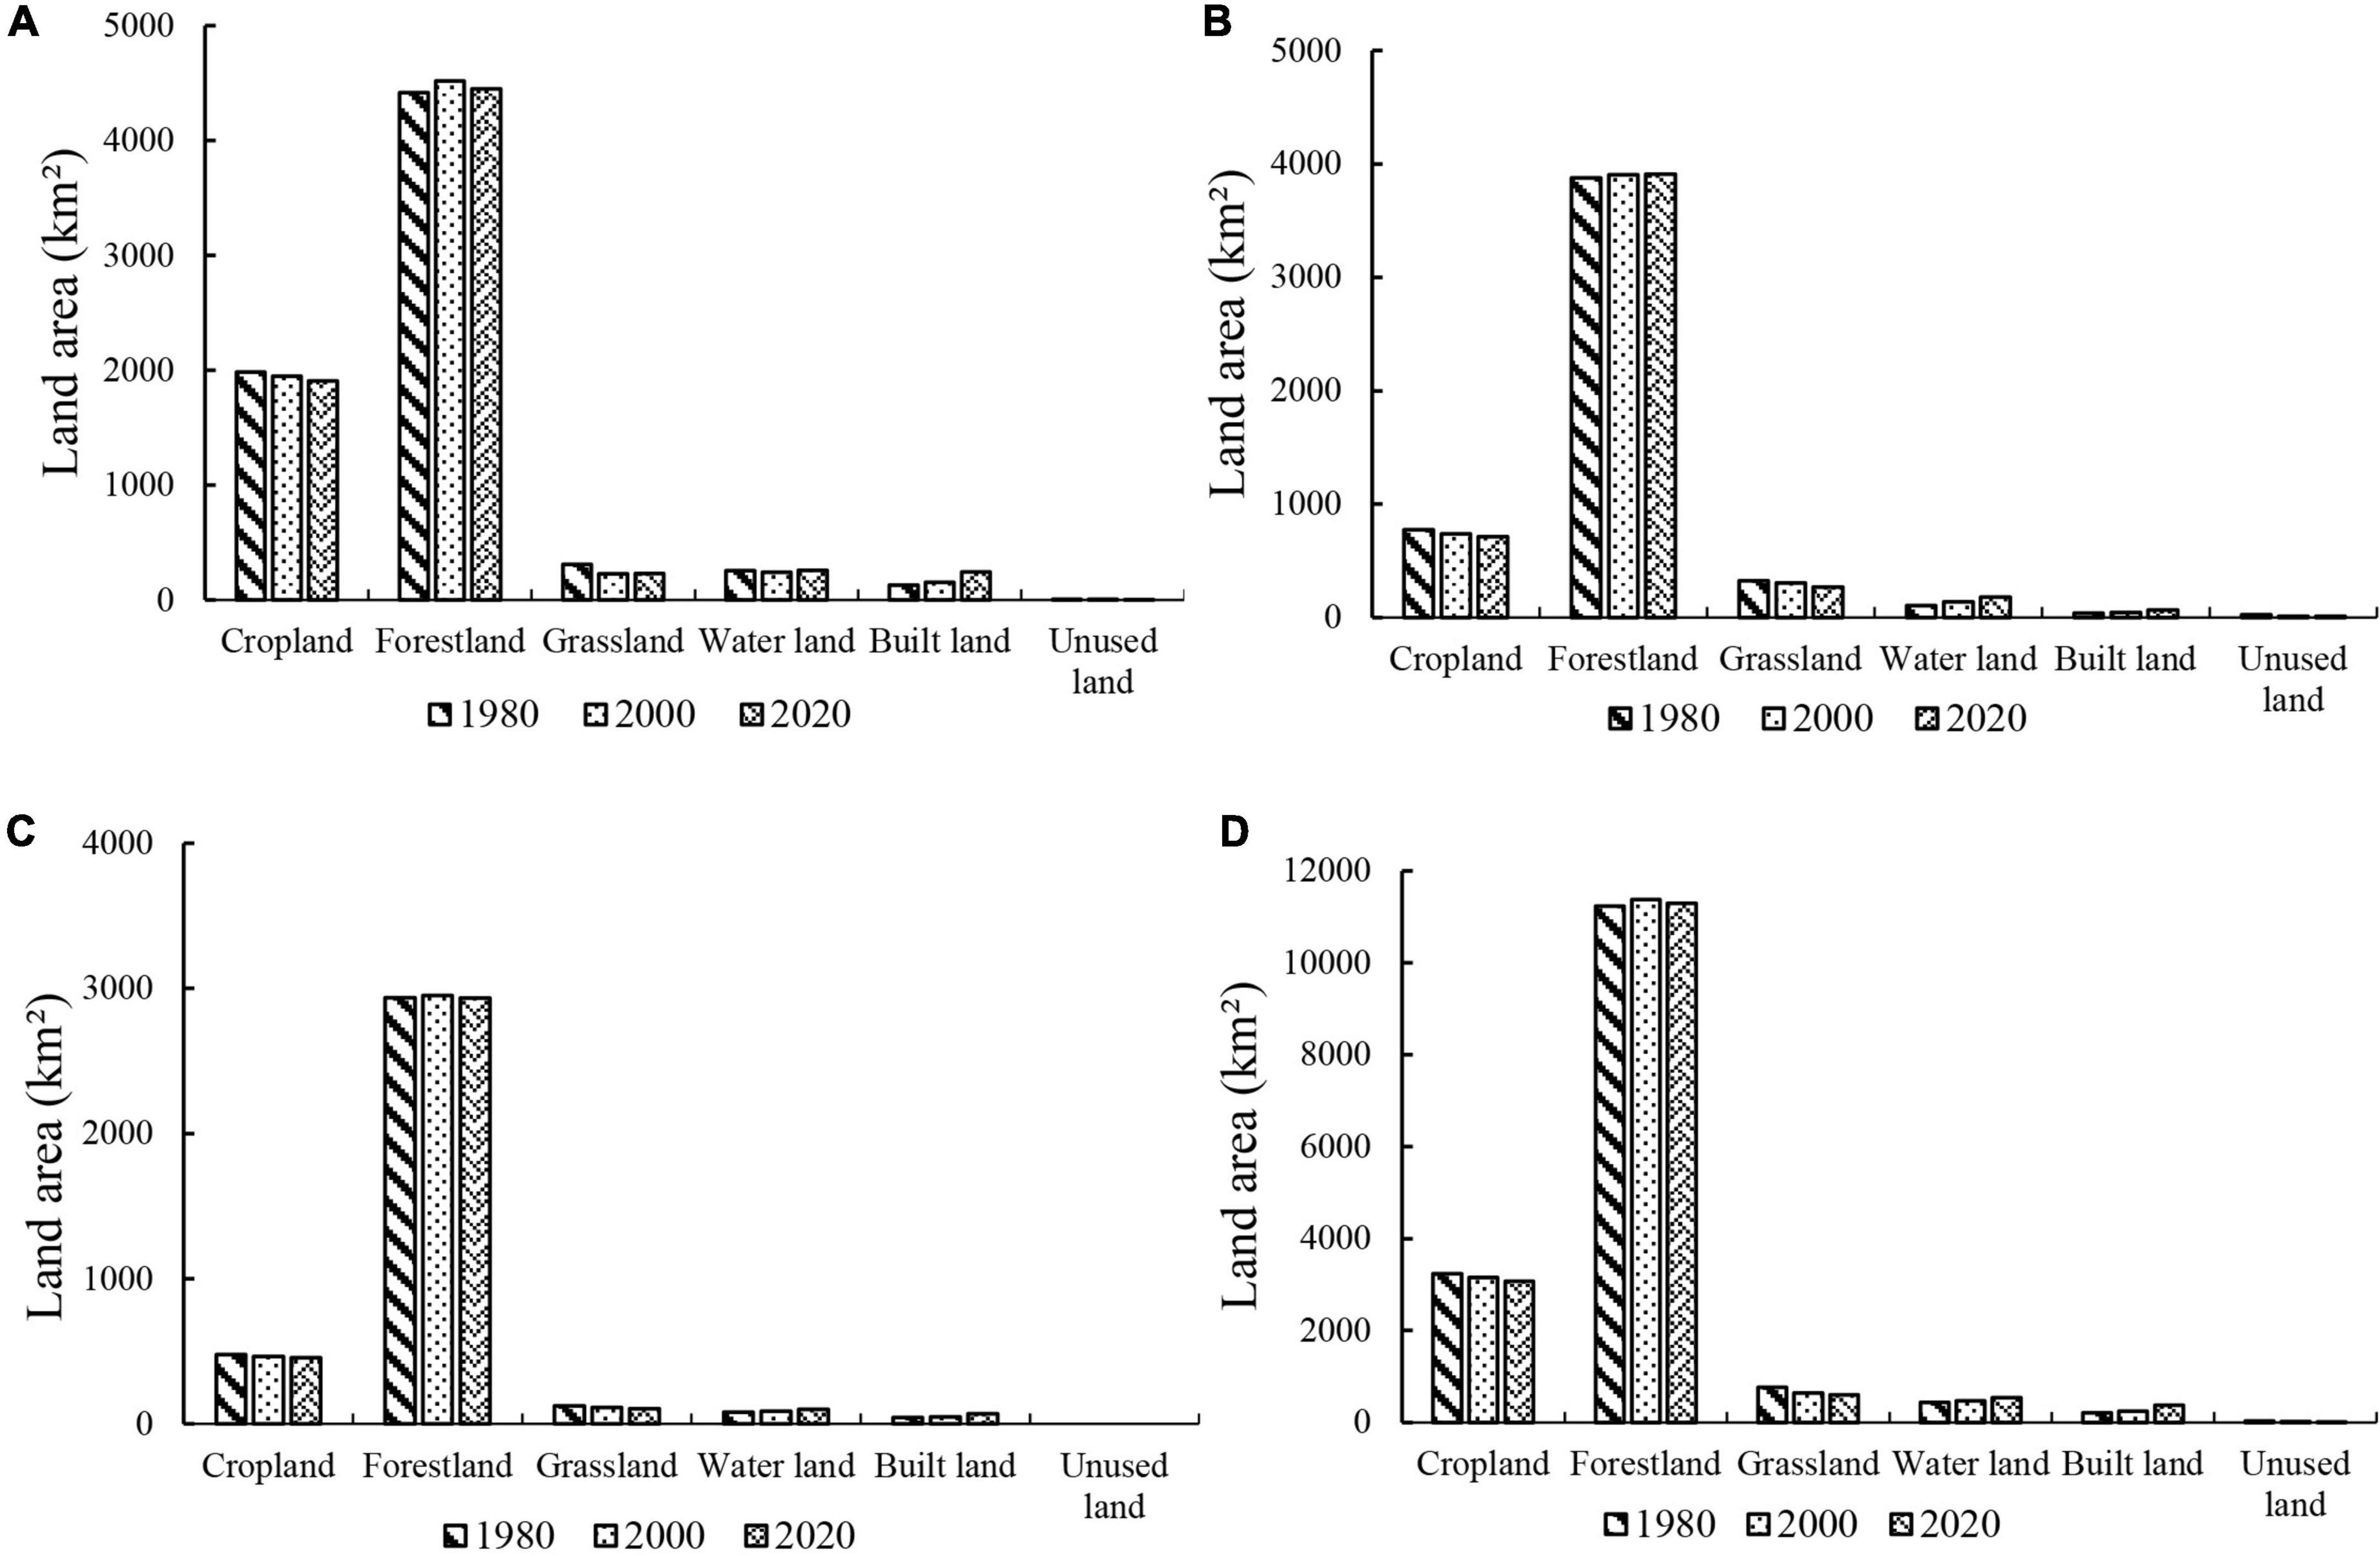
Figure 2. Area of different land use types in the three major basins of Hainan Island (1980–2020), of which (A) Nandu Basin, (B) Changhua Basin, (C) Wanquan Basin, and (D) three major drainage basins.
Specifically, the dynamic change of land use types in the Wanquan Basin is relatively slight, whereas that is more intensive in the Nandu Basin and Changhua Basin. Between 1980 and 2020, the built land of Nandu Basin and Wanquan Basin increased the most, with 116.22 and 26.52 km2, respectively. The water land of the Changhua Basin increased the most, with 76.24 km2. The cropland in the three major basins decreased significantly, and the forestland in the Wanquan Basin decreased slightly. From the perspective of stage characteristics, the increase of built land and water land in the three major river basins between 2000 and 2020 is significantly more than that between 1980 and 2000.
3.1.2. Land use transition matrix
The Sankey diagram of land use transfer (Figure 3) illustrates that the three major basins have experienced a rather frequent land use/land cover conversion over the past 40 years. On the whole, from 1980 to 2020, the transferred-out areas of cropland and grassland were 160.19 and 157.91 km2, respectively; the transferred-in areas of forestland, water land and built land were 65.47, 101.01, and 169.20 km2, respectively. Between 1980 and 2000, the area of grassland decreased the most, with 137.47 km2 transformed into forestland. Cropland had the second largest area reduction, with 64.78, 36.83, and 24.95 km2 transformed into forestland, water land, and built land, respectively. Forestland had the third largest area reduction, with 28.05, 19.24, 11.96, and 7.96 km2 transformed into cropland, grassland, water land, and built land, respectively. Unused land continued to decline, primarily due to the conversion to cropland and forestland, indicating that unused land obtained gradual utilization and development. Moreover, the transferred area of forestland was the largest, with 64.78 km2 of cropland and 137.47 km2 of grassland transformed into forestland, respectively, and the area of water land increased by 73.83 km2.
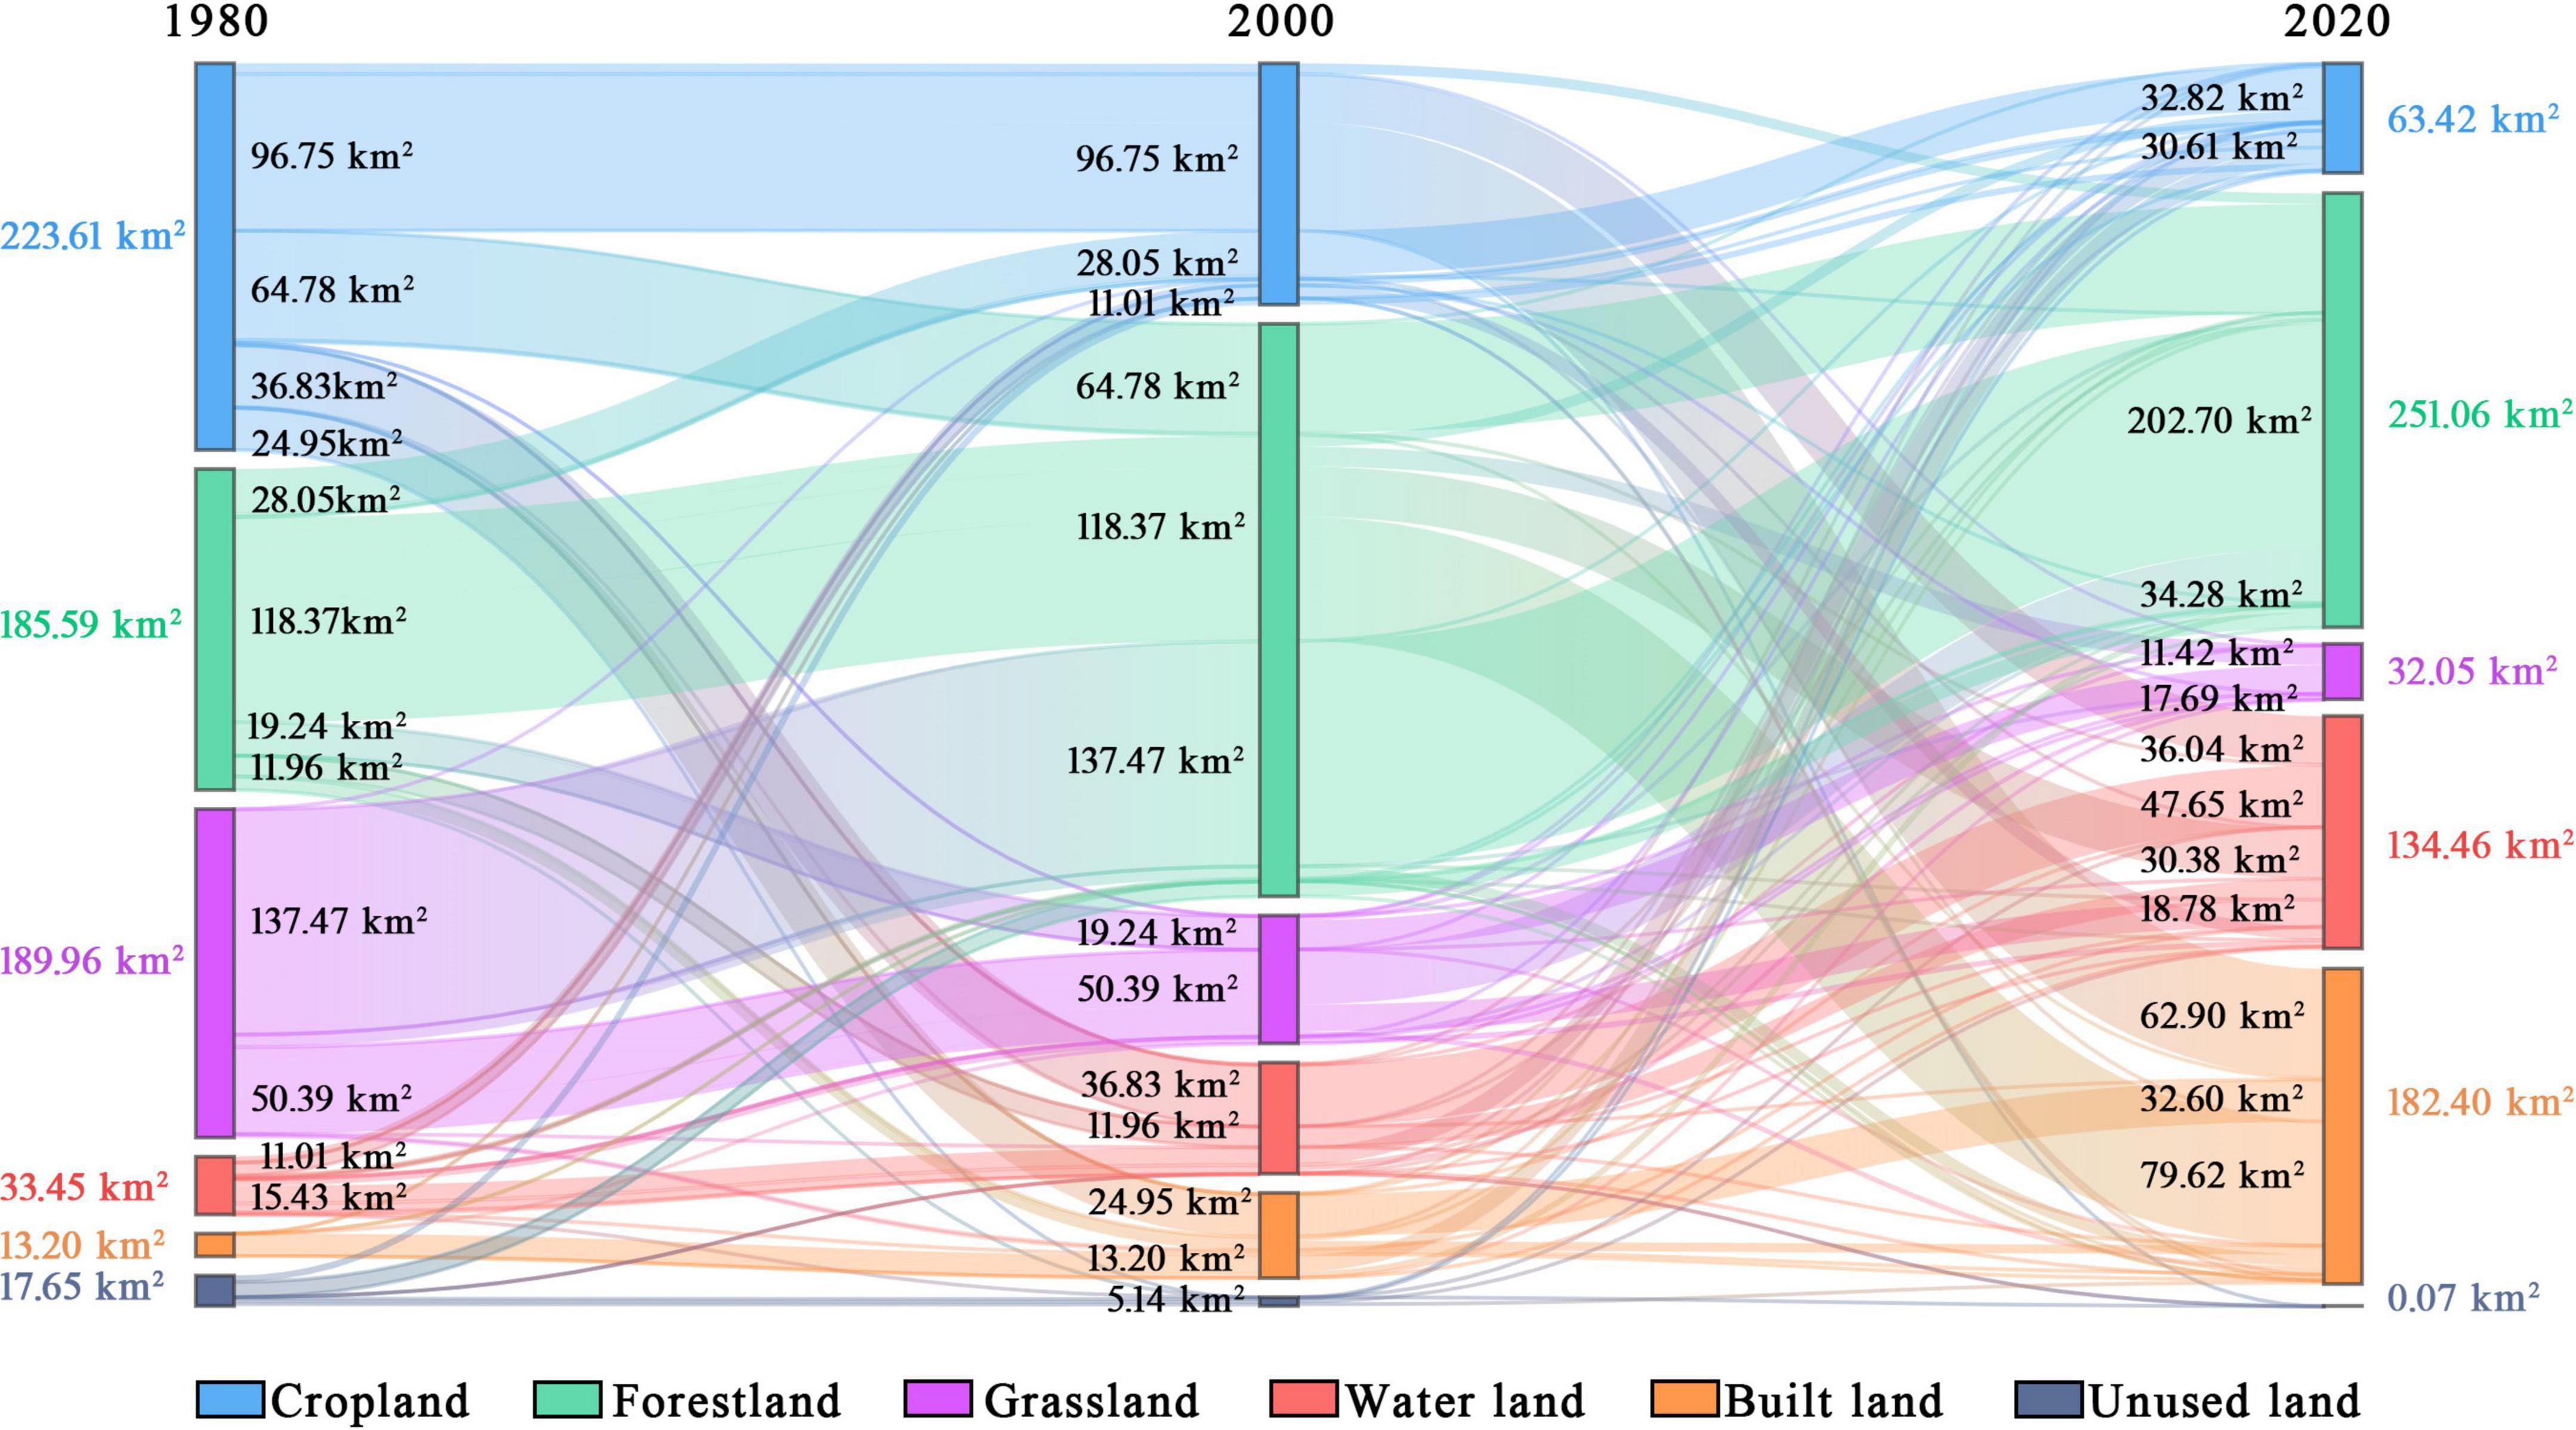
Figure 3. Sankey diagram of land use transfer in three major basins of Hainan Island (1980–2020) (Some data less than 10 km2 are not marked in the Sankey diagram).
Between 2000 and 2020, the forestland area decreased the most, with 11.42, 30.38, and 79.62 km2 converted to grassland, water land, and built land, respectively. Cropland had the second largest area reduction, with 7.47, 36.04, and 62.90 km2 transformed into forestland, water land, and built land, respectively. The transferred area of built land was the largest, with 62.90 km2 of cropland and 79.62 km2 of forestland transformed into built land. There was a significant increase in the area of water land, primarily from cropland and forestland, which were 36.04 and 30.38 km2, and the area change of grassland and unused land was not obvious.
3.2. Spatial-temporal variation characteristics of water yield in three major basins
From the perspective of spatial scale, the water yield in Hainan Island’s three major basins exhibited a similar spatial distribution pattern (Figure 4) between 1980 and 2020, with a high yield in the southeast and a low yield in the northwest. There was also an obvious spatial difference in water yield between different basins. As shown in Table 4, Wanquan Basin had the highest water yield in 2020, reaching 1269.18 mm, followed by Nandu Basin of 1150.06 mm and Changhua Basin of 985.87 mm. From the time scale, the water yield of three major basins showed a slight increase between 1980 and 2020, followed by a significant decrease and a slight increase. The water yield was the largest in 1990, reaching 17.994 billion mł, and the lowest in 2010, which was 17.856 billion mł. In the past 40 years, the water yield of the three major basins decreased by 127 million mł in total. Among them, the water yield of the Changhua Basin, Nandu Basin, and Wanquan Basin decreased by 82, 38, and 8 million mł, respectively. Additionally, the changing trend in water yield over time was obviously different. From 1980 to 1990, there was a slight upward trend, with a growth rate of 230 thousand mł/a. From 1990 to 2010, there was a significant downward trend, with a reducing rate of 13.81 million mł/a. From 2010 to 2020, the growth trend is relatively slow, with a growth rate of 860 thousand mł/a.
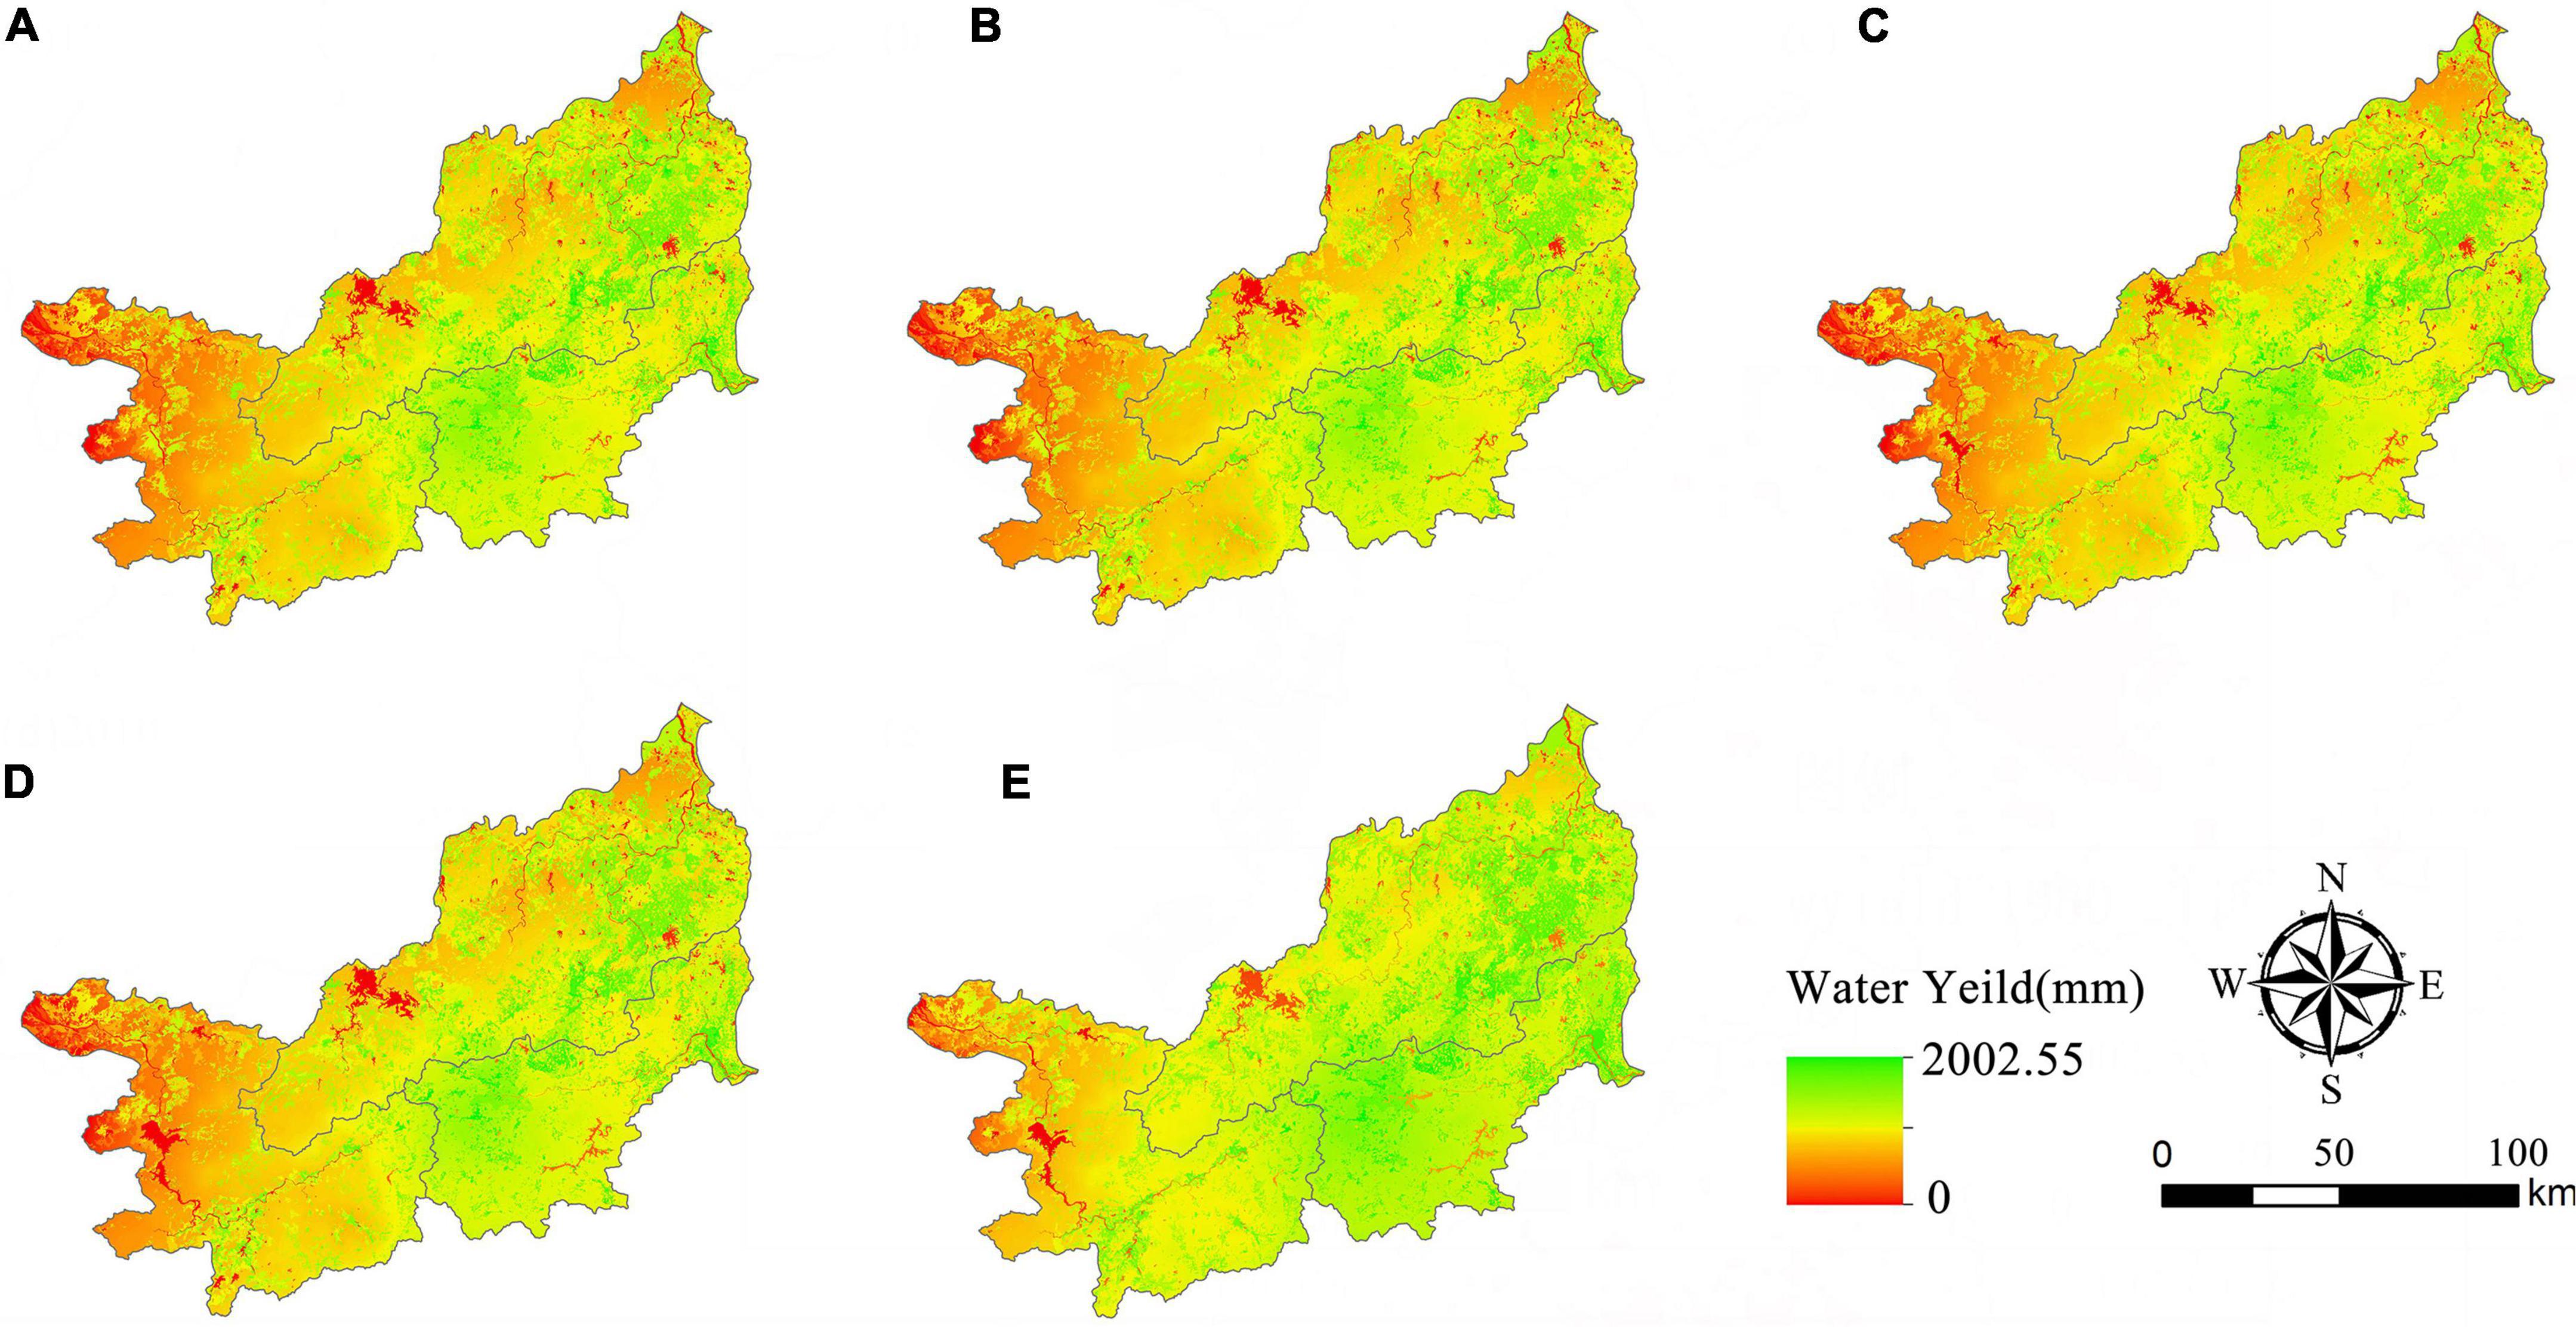
Figure 4. (A–E) Represent the spatial distribution of water yield in three major basins of Hainan Island in the five periods of 1980, 1990, 2000, 2010, and 2020.
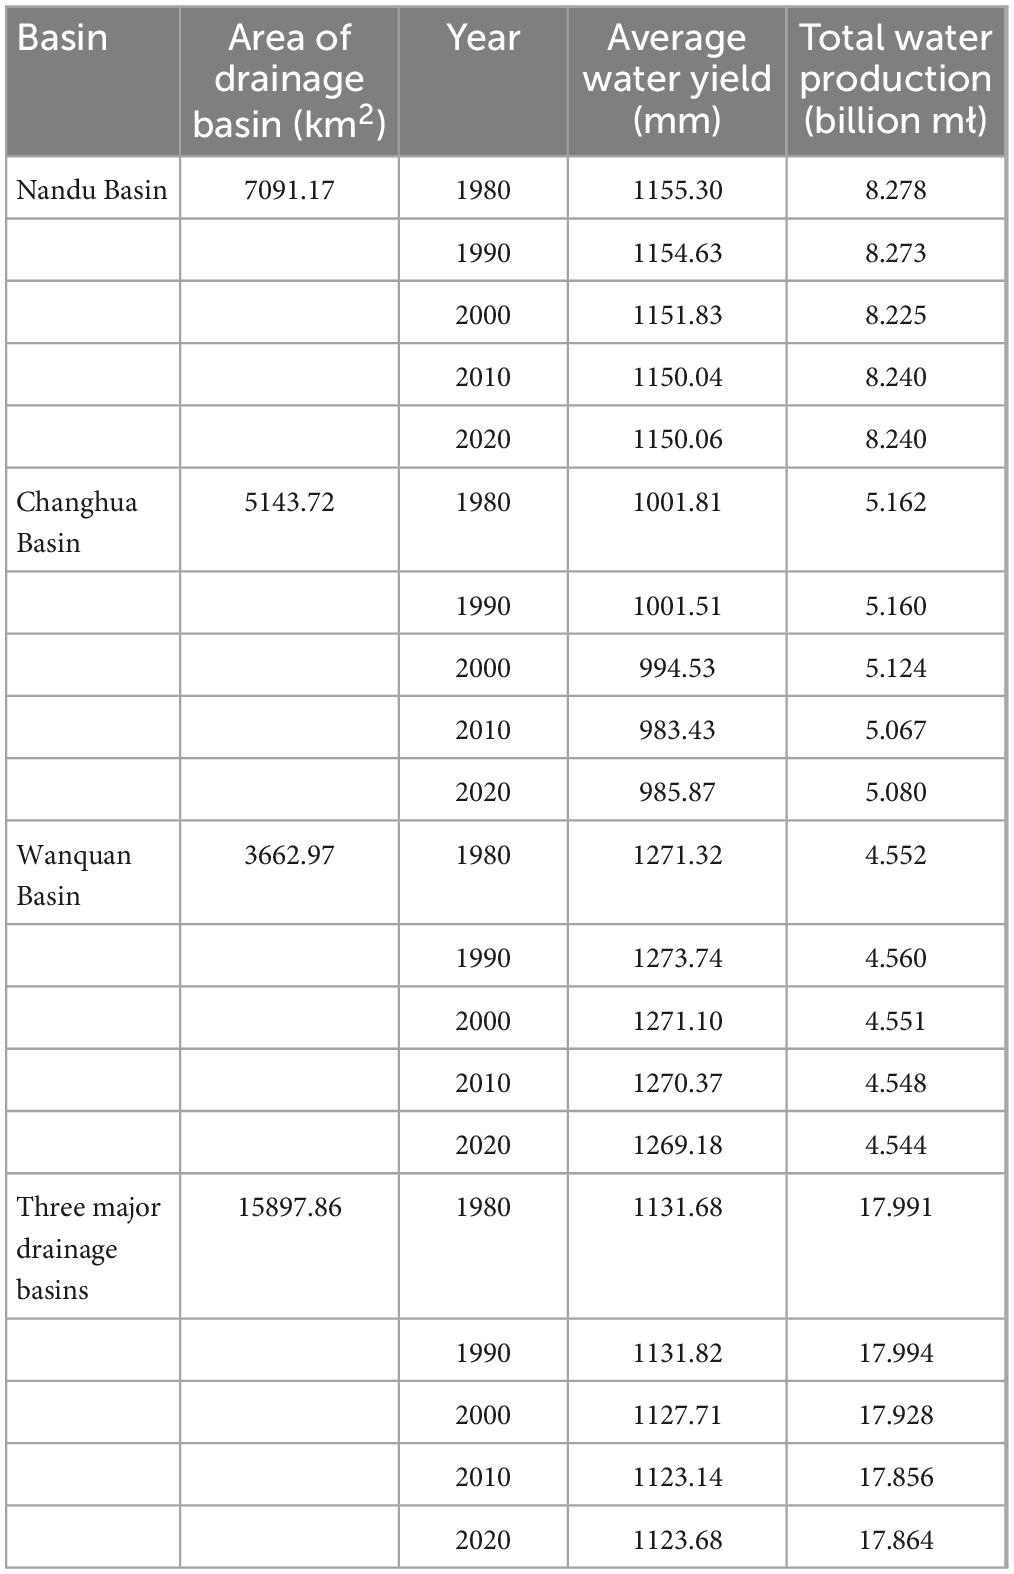
Table 4. Statistics of water yield of three major basins in Hainan Island from 1980 to 2020.
3.3. Spatial statistical analysis of water yield in three major basins
3.3.1. Global spatial autocorrelation analysis
According to the global spatial autocorrelation results (Table 5), the global Moran’s I values of water yield in the three major basins of Hainan Island during the five time periods from 1980 to 2020 are 0.542, 0.544, 0.549, 0.560, and 0.562, respectively. This suggests that the spatial distribution of water yield in the study area has a significant positive autocorrelation (P < 0.001). The global Moran’s I value of the three major basins increased over the course of five periods, indicating a progressive increase in the spatial autocorrelation of the study area’s water yield services as well as the aggregation degree of their spatial distribution.
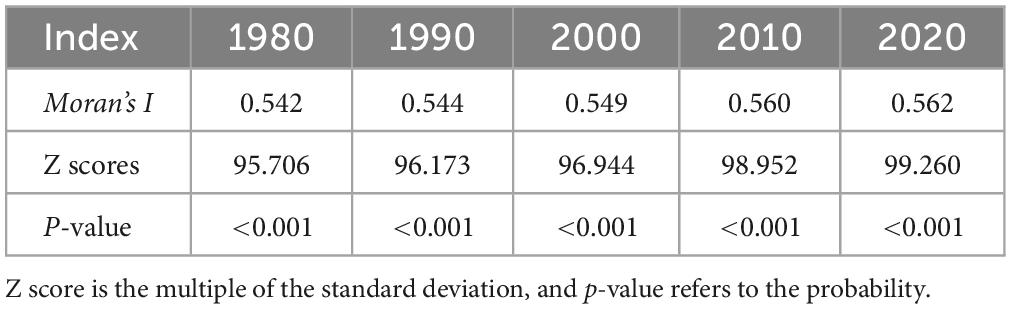
Table 5. Spatial autocorrelation of water yield in three major basins of Hainan Island (1980–2020).
3.3.2. Cold spot and hot spot analysis of water yield
This study investigated the hot and cold spots of spatial Getis-Ord based on the global spatial autocorrelation results, and the spatial distribution results of local water yield of the three basins are shown in Figure 5. Between 1980 and 2020, the water yield of Hainan Island’s three major basins exhibited similar spatial distribution pattern of hot and cold spots. The hot spot areas were mostly concentrated in the Wuzhishan mountain region in the middle and northeast of the basins. The high degree of spatial correlation in these areas is due to the high rainfall. The cold spot areas were concentrated in the lower reaches of the Changhua River, where cropland dominated, with low water yield, little rainfall, and a high degree of spatial differentiation.
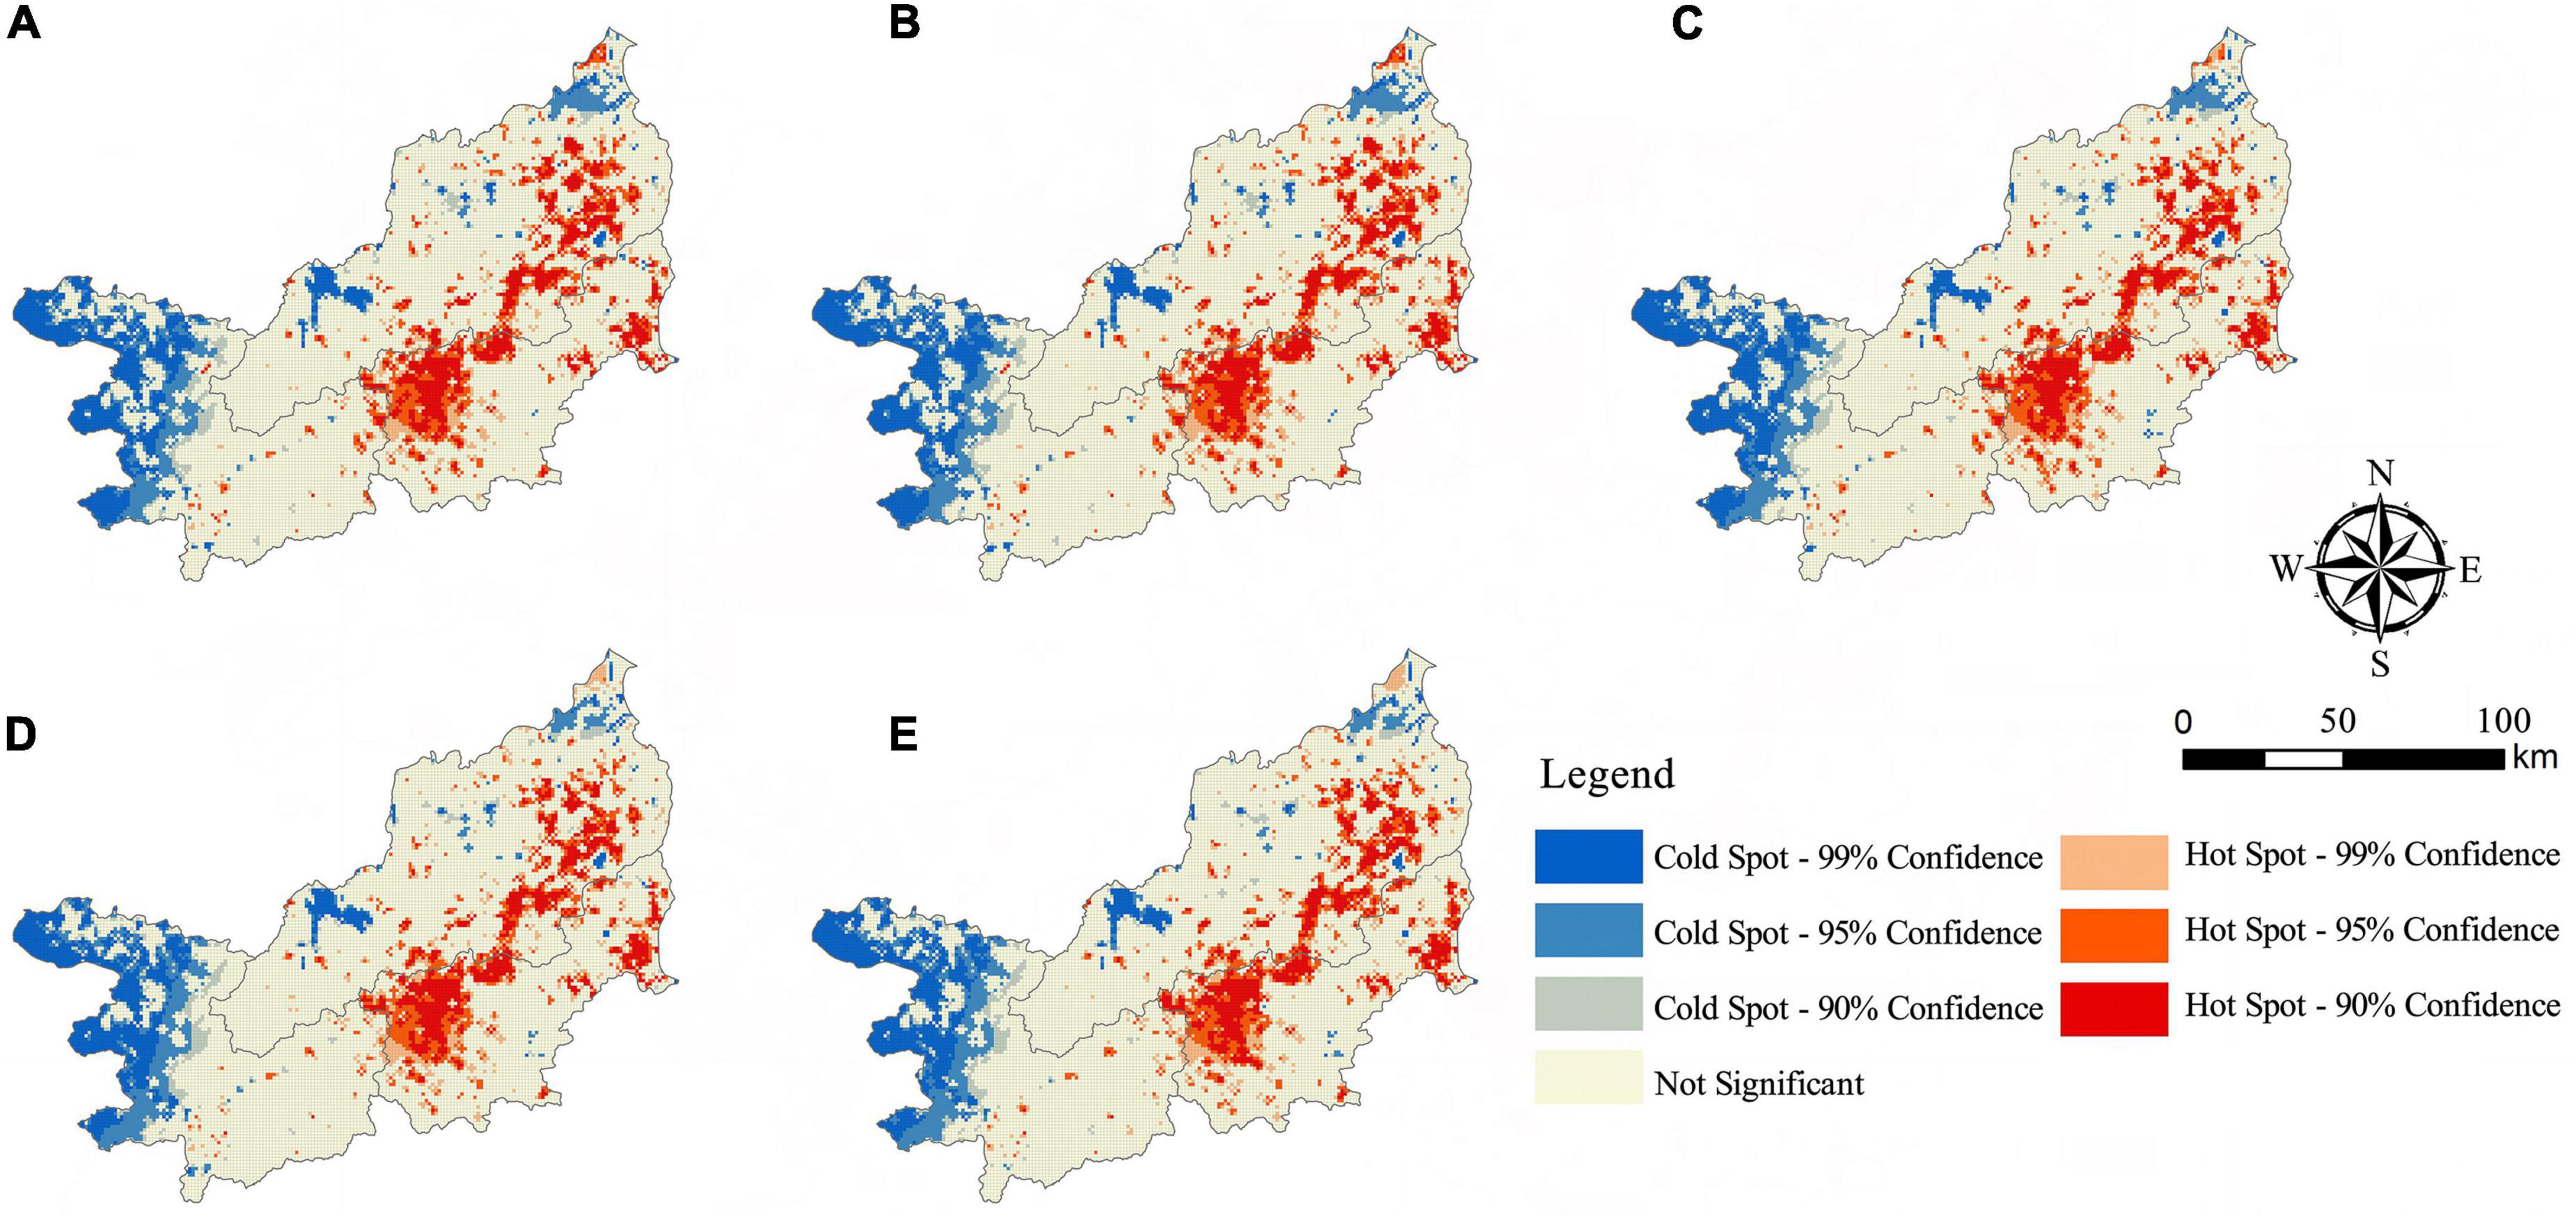
Figure 5. (A–E) Represent the spatial distribution of hot and cold spots of water yield in different periods of the study area in 1980, 1990, 2000, 2010, and 2020.
3.4. Driving factor analysis of water yield in three major basins
3.4.1. Single-factor detection attribution of water yield
The results in Table 6 demonstrate that all factors have an impact on the spatial distribution pattern of water yield, and the influencing degree ranges from 0.012 to 0.563, indicating that both natural and socioeconomic factors have an impact on the spatial-temporal evolution of water yield in the study area. The impact factors are sorted as follows based on the q value: land use type > soil type > annual precipitation > per capita GDP > annual temperature > population density > slope > NDVI > DEM. The q value of land use type is 0.563, with an explanatory power of more than 50%, indicating that land use type is the most important factor affecting the spatial distribution of water yield. Soil type and annual precipitation are also important impact factors.
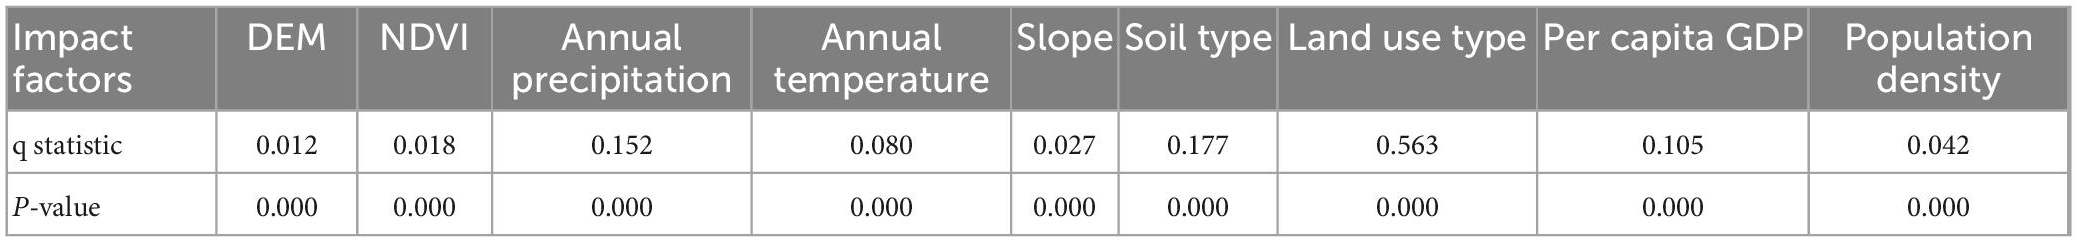
Table 6. Factor detection results.
3.4.2. Interactive and ecological detection attribution of water yield
As shown in Table 7, the results of interactive and ecological detection demonstrate that the spatial distribution of water yield is more significantly impacted by the interaction of any two impact factors than the impact of a single factor, indicating that the spatial differentiation characteristics of water yield in the three major basins are substantially impacted by a number of factors. When combined with other impact factors, the influence of land use type improved significantly. Specifically, the interaction value of land use type ∩ soil type is the largest, with a q value of 0.786, indicating that the explanatory power of the spatial differentiation after the interaction between the two is more than 75%, which is the main reason for the spatial differentiation of water yield. Land use type ∩ annual precipitation and land use type ∩ per capita GDP had the second and third largest interaction value, with q values of 0.732 and 0.718, respectively. The interaction value of the DEM∩NDVI is the smallest, with a q value of 0.045, indicating that the combined effect of the two factors is less than that of other impact factors on water yield. Moreover, the interactive detection results of any two impact factors are a mostly non-linear enhancement, and only the interaction of land use type ∩ population density and land use type ∩ slope is a dual-factor enhancement, indicating that the combined effect of multiple impact factors will have a greater impact on water yield in three major basins and significantly improve the explanatory power of spatial differentiation. Under complex conditions, a variety of changes in the above impact factors will also have a significant impact.
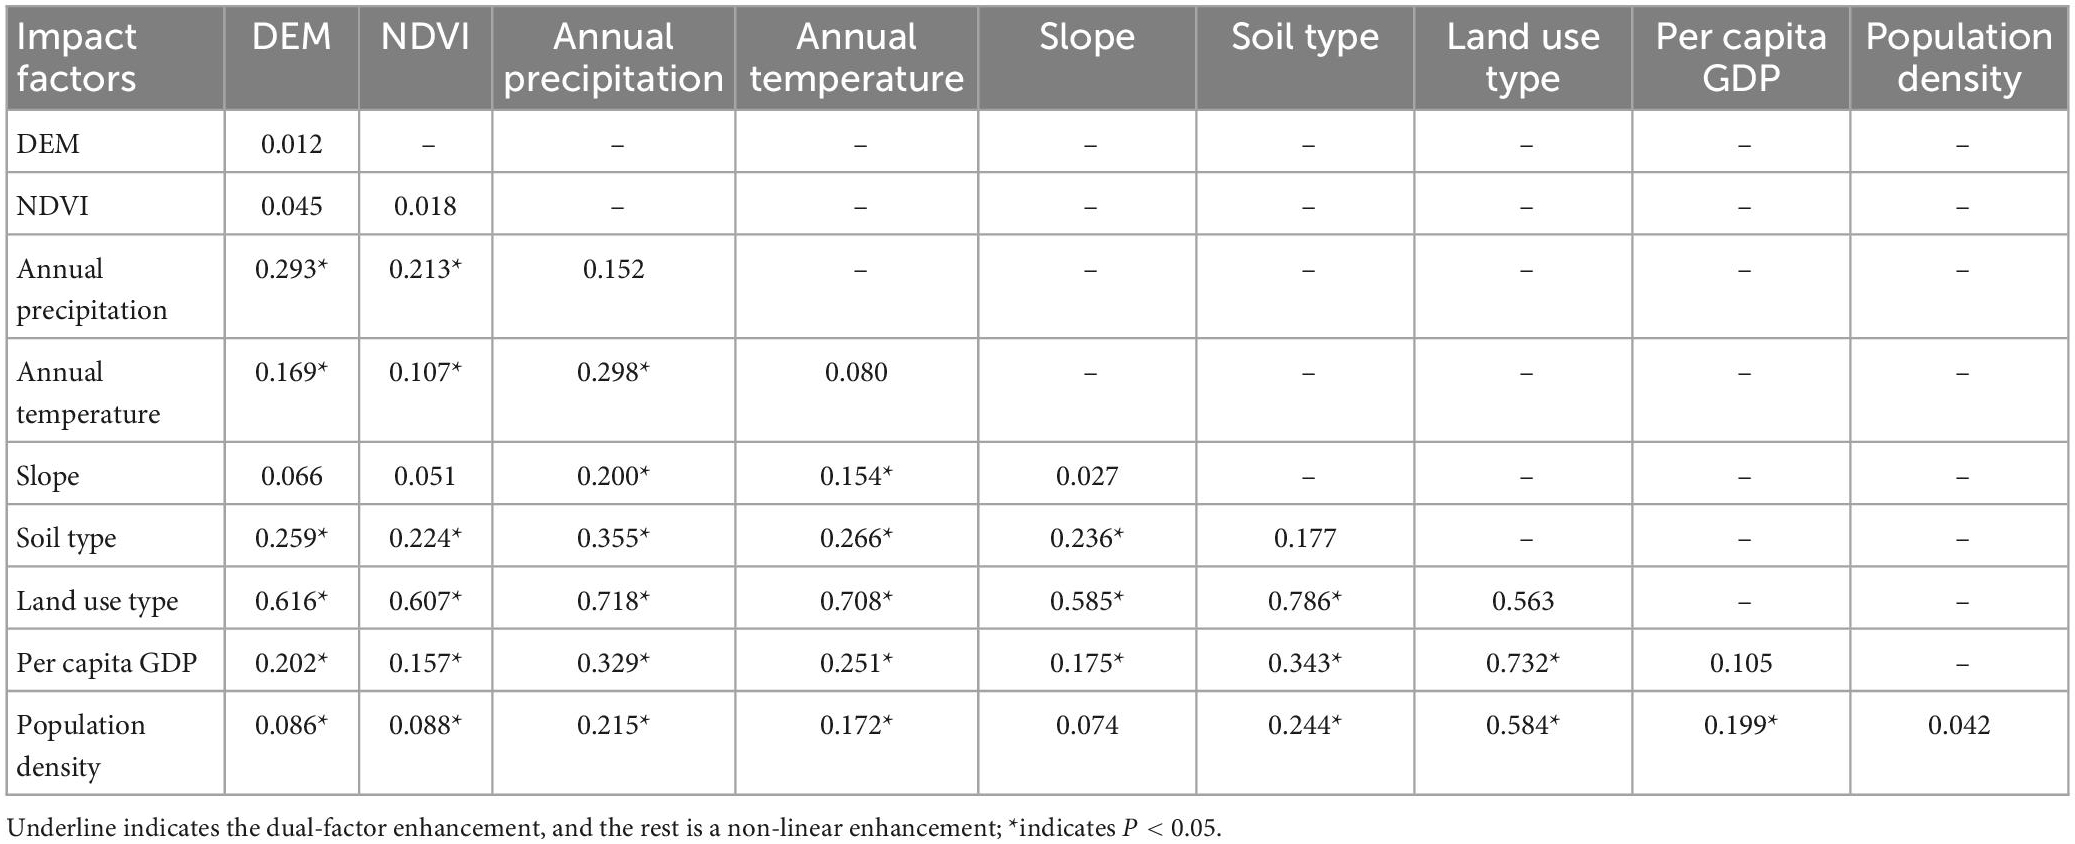
Table 7. Results of interactive and ecological detection.
4. Discussion
4.1. Spatial-temporal variation analysis of water yield in three major basins
The three major basins of Hainan Island were evaluated in this study using the InVEST model for water yield, the results show that the average water yield of the three major basins from 1980 to 2020 was 17.927 billion mł. The annual average total surface water resources of Hainan Island from 1998 to 2020 published in the Hainan Provincial Water Resources Bulletin is 35.3 billion mł (Han et al., 2022b). According to the proportion of the area occupied by the three major basins in Hainan Island, it is estimated that the water production of the three major basins is about 16.238 billion mł, which is similar to the calculation results of this study, indicating that the calculation results are relatively reliable. In addition, the findings demonstrate a regional pattern of high water yield in the southeast and low water yield in the northwest, with strong autocorrelation and large aggregation. From 1980 to 2020, the water yield of three major basins generally exhibited a minor increase at first, a substantial decline, and then a slight increase, especially in Nandu Basin and Changhua Basin. The Nandu Basin and Changhua Basin have experienced large-scale urban expansion and farmland contraction, and the construction of Daguangba, Hongling and other large reservoirs in Hainan Island has caused a large number of farmland and grassland to be converted into built land and water land. Land use has changed the surface cover and thus affected the regional environment, and the surface cover has also affected the characteristics of evapotranspiration, interception, infiltration and so on in the basin (Dias et al., 2015), which ultimately led to changes in the water cycle path in the basin. Soil type is also an important reason for the spatial difference of water yield in the three major basins. The Nandu Basin and Wanquan Basin develop large areas of lateritic soil and paddy soil, while the Changhua Basin is mostly sandy loam soil. Compared with sandy loam soil, lateritic soil and paddy soil have stronger fertility, thicker soil layer, better vegetation development and stronger water retention capacity. In terms of climate, the Nandu Basin and Wanquan Basin are mainly affected by the tropical monsoon from the northeast of Hainan Island. The tropical monsoon carries a large amount of water vapor in the Pacific Ocean. A large amount of water vapor condenses and falls when climbing up the windward slope in the central mountain area of Hainan Island, bringing abundant precipitation to the basin. The sufficient precipitation makes the region become a high-yield area. On the contrary, the Changhua Basin is located on the leeward slope of the central mountain area, resulting in significantly less rainfall, which is also an important reason for the difference in water yield.
4.2. Study on impact factors of water yield in three major river basins
According to this study, land use type is the key factor determining the geographical differentiation of water yield in three major basins, which is in line with the findings of Liu et al. (2020) and Huang et al. (2021). Land use change is the result of the interaction between human activities and natural ecological environment, which reflects different economic development models and land management strategies (Deng et al., 2021), such as the development of cropland, urbanization construction, transportation construction, etc. From 1990 to 2010, the water yield of the three major drainage basins changed most acutely. During this period, Hainan Island Expressway was built and opened to traffic, and the policy of Hainan International Tourism Island was implemented. Driven by policy and economy, the land spatial pattern of the three major drainage basins changed dramatically. The main feature is the occupation of cropland and forestland by built land, which is also a manifestation of the rapid urbanization process (Liu et al., 2010). Urbanization fundamentally changes the balance between rainfall and evapotranspiration in the basin, thus affecting the water yield service (Li et al., 2020), which is consistent with the research results of the Heihe Basin (Zhao et al., 2022) and Yongjiang Basin (Yang Y. et al., 2021). Climate factors such as temperature and rainfall directly affect surface runoff and thus determine the water yield (Lang et al., 2017). The Nandu Basin and Wanquan Basin are rich in precipitation, dense vegetation, good soil structure, and strong soil water holding capacity, resulting in high water yield and strong water conservation capacity in the region. Furthermore, socioeconomic factors have a significant impact on the spatial distribution of water yield services (Yang et al., 2015). In the estuary areas of the three major basins, the high population density, per capita GDP, and the large impervious surfaces in areas with dense urban built land will easily form surface runoff, reducing the regional water conservation function.
4.3. Suggestions on water resources management in three major river basins
The distribution of water resources in Hainan is projected to face more issues as a result of the rapid population growth and rising level of industry and agriculture in recent decades (O’Connell, 2017). The protection and management of water resources is the focus of the future sustainable development of the three major river basins. Due to the uneven distribution of precipitation in the three major basins and the imperfect water conservancy infrastructure, problems such as seasonal and engineering water shortages and flood disasters have always existed in the basin. For example, in 2015, Wuzhishan, Changjiang and other regions located in the Changhua Basin experienced severe drought and large-scale water shortage, while Tunchang, Ding’an, Qionghai and other regions located in the Nandu Basin and Wanquan Basin experienced relatively serious rainstorm and flood disasters, and the distribution of water resources in the basin was extremely uneven. In the process of planning the three major basins, we should strengthen the inter-basin allocation of water resources, strengthen the construction of water conservancy infrastructure, establish a transregional coordination mechanism for water resource allocation and an ecological compensation mechanism, and expand the scope of water production services through natural resources management (Anantha et al., 2021) to solve the problem of uneven distribution of water resources in the basin. In addition, this study found that land use change is the main factor affecting the spatial pattern of water yield in the three major basins of Hainan Island, and the intensification of urbanization process may lead to the reduction of water yield in the basin. With the construction of the Hainan Free Trade Port, the built land in the three major basins will continue to expand (Lei et al., 2022b), as well as the urbanization level. Therefore, in the planning process, the scale and development speed of towns in the basin should be controlled, and attention should be paid to optimizing the land structure, guiding the rational layout of cropland and forestland, and taking into account the hydrological and ecological effects produced in the process of urban development, so as to avoid the continuous reduction of water production in the three major basins.
5. Conclusion
Based on the land use data between 1980 and 2020, this study employed the InVEST model and geographical detectors to investigate the spatial-temporal variation characteristics and driving factors of water yield in the three major basins of Hainan Island. According to the findings, the combined water yield of three major river basins exhibited a slight downward trend from 17.991 billion m3 in 1980 to 17.864 billion m3 in 2020, with a spatial distribution high in the southeast and low in the northwest. Wanquan Basin had the largest water yield, followed by Nandu Basin, while Changhua Basin had the lowest. Between 1980 and 2020, the water supply of Hainan Island’s three major basins showed a positive spatial correlation, with all p-values less than 0.001, indicating a significant regional aggregation and a rapidly increasing spatial auto-correlation. Additionally, the Wuzhishan mountain in the middle and the northeast regions of the three major basins of Hainan Island are hot spots with high water yield. The lower reaches of the Changhua River are the cold spots with low water yield. Furthermore, land use type is the most important factor influencing spatial differentiation of water yield in three major river basins, and the interaction between land use type and soil type also has an impact on spatial differentiation. The findings of this study will serve as data support and scientific references for water resource research, planning and utilization, biodiversity conservation, and ecosystem restoration of water resources in the three major river basins.
Data availability statement
The raw data supporting the conclusions of this article will be made available by the authors, without undue reservation.
Author contributions
JL and LZ: investigation, methodology, software, visualization, and writing—original draft. TW, XC, and YL: visualization, supervision, and review. ZC: conceptualization, validation, and writing—review and editing. All authors revised the manuscript and approved the submitted version.
Funding
This research was supported by the Hainan Provincial Natural Science Foundation of China (423RC551) and the National Natural Science Foundation of China (32260106).
Acknowledgments
We are very grateful to the boundary data of the study area provided by Hainan Provincial Water Department.
Conflict of interest
The authors declare that the research was conducted in the absence of any commercial or financial relationships that could be construed as a potential conflict of interest.
The handling editor declared a shared affiliation with the author LZ at the time of review.
Publisher’s note
All claims expressed in this article are solely those of the authors and do not necessarily represent those of their affiliated organizations, or those of the publisher, the editors and the reviewers. Any product that may be evaluated in this article, or claim that may be made by its manufacturer, is not guaranteed or endorsed by the publisher.
References
Anantha, K. H., Garg, K. K., Moses, D. S., Patil, M. D., Sawargaonkar, G. L., Kamdi, P. J., et al. (2021). Impact of natural resource management interventions on water resources and environmental services in different agroecological regions of India. Groundw. Sustain. Dev. 13:100574. doi: 10.1016/j.gsd.2021.100574
Bai, Y., Ochuodho, T. O., and Yang, J. (2019). Impact of land use and climate change on water-related ecosystem services in Kentucky, USA. Ecol. Indic. 102, 51–64. doi: 10.1016/j.ecolind.2019.01.079
Balist, J., Malekmohammadi, B., Jafari, H. R., Nohegar, A., and Geneletti, D. (2022). Detecting land use and climate impacts on water yield ecosystem service in arid and semi-arid areas. A study in Sirvan River Basin-Iran. Appl. Water. Sci. 12, 1–14. doi: 10.1007/s13201-021-01545-8
Barbier, E. B., Hacker, S. D., Kennedy, C., Koch, E. W., Stier, A. C., and Silliman, B. R. (2011). The value of estuarine and coastal ecosystem services. Ecol. Monogr. 81, 169–193. doi: 10.1890/10-1510.1
Dias, L. C. P., Macedo, M. N., Costa, M. H., Coe, M. T., and Neill, C. (2015). Effects of land cover change on evapotranspiration and streamflow of small catchments in the Upper Xingu River Basin, Central Brazil. J. Hydrol. Reg. Stud. 4, 108–122. doi: 10.1016/j.ejrh.2015.05.010
Deng, C., Liu, J., Nie, X., Li, Z., Liu, Y., Xiao, H., et al. (2021). How trade-offs between ecological construction and urbanization expansion affect ecosystem services. Ecol. Indic. 122:107253. doi: 10.1016/j.ecolind.2020.107253
Di Baldassarre, G., Sivapalan, M., Rusca, M., Cudennec, C., Garcia, M., Kreibich, H., et al. (2019). Sociohydrology: Scientific challenges in addressing the sustainable development goals. Water Resour. Res. 55, 6327–6355. doi: 10.1029/2018WR023901
González-García, A., Palomo, I., González, J. A., López, C. A., and Montes, C. (2020). Quantifying spatial supply-demand mismatches in ecosystem services provides insights for land-use planning. Land Use Policy 94:104493. doi: 10.1016/j.landusepol.2020.104493
Grizzetti, B., Liquete, C., Pistocchi, A., Vigiak, O., Zulian, G., Bouraoui, F., et al. (2019). Relationship between ecological condition and ecosystem services in European rivers, lakes and coastal waters. Sci. Total Environ. 671, 452–465. doi: 10.1016/j.scitotenv.2019.03.155
Gupta, S., and Larson, W. E. (1979). Estimating soil water retention characteristics from particle size distribution, organic matter percent, and bulk density. Water Resour. Res. 15, 1633–1635. doi: 10.1029/WR015i006p01633
Han, N., Zhang, Y., and Zhang, W. (2022a). Simulation of temporal and spatial changes of land use and water yield in Hainan Island. Water Resour. Prot. 38, 119–127. doi: 10.3880/j.issn.1004-6933.2022.02.017
Han, N., Liu, Z., Jia, P., and Zhang, W. (2022b). Spatial-temporal changes and geographical exploration of water conservation on Hainan Island from 1996 to 2020. Bull. Soil Water Conserv. 42, 193–201. doi: 10.13961/j.cnki.stbctb.2022.05.025
Hu, W., Yang, R., Jia, G., Yin, Z., Li, Y., Shen, S., et al. (2022). Response of water yield function to land use change and its driving factors in the Yangtze River Basin. Acta Ecol. Sin. 42, 7011–7027. doi: 10.5846/stxb202108312454
Huang, X., Peng, S., Wang, Z., Huang, B., and Liu, J. (2022). Spatial heterogeneity and driving factors of ecosystem water yield service in Yunnan Province, China based on Geodetector. J. Appl. Ecol. 33, 2813–2821. doi: 10.13287/j.1001-9332.202210.025
Huang, Z., Zhao, J., Xiao, H., Guo, W., Yang, Z., and Liu, J. (2021). Water service supply and demand situation and driving factors in Shiyang River Basin. J. Soil Water Conserv. 35, 228–235. doi: 10.13870/j.cnki.stbcxb.2021.03.032
Kang, L., Jia, Y., and Zhang, S. (2022). Spatiotemporal distribution and driving forces of ecological service value in the Chinese section of the “Silk Road Economic Belt”. Ecol. Indic. 141:109074. doi: 10.1016/j.ecolind.2022.109074
Lang, Y., Song, W., and Zhang, Y. (2017). Responses of the water-yield ecosystem service to climate and land use change in Sancha River Basin, China. Phys. Chem. Earth 101, 102–111. doi: 10.1016/j.pce.2017.06.003
Lei, J., Chen, Y., Li, L., Chen, Z., Chen, X., Wu, T., et al. (2022a). Spatiotemporal change of habitat quality in Hainan Island of China based on changes in land use. Ecol. Indic. 145:109707. doi: 10.1016/j.ecolind.2022.109707
Lei, J., Chen, Y., Chen, Z., Chen, X., Wu, T., and Li, Y. (2022b). Spatiotemporal evolution of habitat quality in three basins of Hainan Island based on InVEST model. J. Appl. Ecol. 33, 2511–2520. doi: 10.13287/j.1001-9332.202209.019
Li, A., Ye, C., Zhu, L., Wang, Y., Liang, X., and Zou, Y. (2022). Impact from land use/land cover change on water yield service: A case study on national park of hainan tropical rainforest. Water. Resour. Hydropower. Eng. 53, 36–45. doi: 10.13928/j.cnki.wrahe.2022.05.004
Li, C., Sun, G., Cohen, E., Zhang, Y., Xiao, J., McNulty, S. G., et al. (2020). Modeling the impacts of urbanization on watershed-scale gross primary productivity and tradeoffs with water yield across the conterminous United States. J. Hydrol. 583:124581. doi: 10.1029/2019WR026574
Li, P., and Qian, H. (2018). Water resources research to support a sustainable China. Int. J. Water Resour. Dev. 34, 327–336. doi: 10.1080/07900627.2018.1452723
Liu, J., Zhang, Z., Xu, X., Kuang, W., Zhou, W., Zhang, S., et al. (2010). Spatial patterns and driving forces of land use change in China during the early 21st century. J. Geogr. Sci. 20, 483–494. doi: 10.1007/s11442-010-0483-4
Liu, D., Cao, E., Zhang, J., Gong, J., and Yan, L. (2020). Spatiotemporal pattern of water conservation and its influencing factors in Bailongjiang Watershed of Gansu. J. Nat. Resour. 35, 1728–1743. doi: 10.31497/zrzyxb.20200716
Lu, H., Yan, Y., Zhu, J., Jin, T., Liu, G., Wu, G., et al. (2020). Spatiotemporal water yield variations and influencing factors in the Lhasa River Basin, Tibetan Plateau. Water 12:1498.
Lü, L., Li, Q., and Yang, Y. (2022). Change and influencing factors of water conservation in Liaoning province during 2001—2020. Bull. Soil Water Conserv. 42, 290–296. doi: 10.13961/j.cnki.stbctb.20220321.001
Lü, Y., Hu, J., Sun, F., and Zhang, L. (2015). Water retention and hydrological regulation: Harmony but not the same in terrestrial hydrological ecosystem services. Acta Ecol. Sin. 35, 5191–5196. doi: 10.5846/stxb201404140717
O’Connell, E. (2017). Towards adaptation of water resource systems to climatic and socio-economic change. Water Resour. Manag. 31, 2965–2984. doi: 10.1007/s11269-017-1734-2
Safavi, H. R., Mehrparvar, M., and Szidarovszky, F. (2016). Conjunctive management of surface and ground water resources using conflict resolution approach. J. Irrig. Drain. Eng. 142:05016001. doi: 10.1061/(ASCE)IR.1943-4774.0000991
Scordo, F., Lavender, T. M., Seitz, C., Perillo, V. L., Rusak, J. A., Piccolo, M. C., et al. (2018). Modeling water yield: assessing the role of site and region-specific attributes in determining model performance of the InVEST seasonal water yield model. Water 10:1496. doi: 10.3390/w10111496
Song, Y., Wang, J., Ge, Y., and Xu, C. (2020). An optimal parameters-based geographical detector model enhances geographic characteristics of explanatory variables for spatial heterogeneity analysis: Cases with different types of spatial data. GIsci Remote Sens. 57, 593–610. doi: 10.1080/15481603.2020.1760434
Su, C., and Wang, Y. (2018). Evolution of ecosystem services and its driving factors in the upper reaches of the Fenhe River watershed, China. Acta Ecol. Sin. 38, 7886–7898. doi: 10.5846/stxb201711061986
Wang, J., and Xu, C. (2017). Geodetector: Principle and prospective. Acta Geogr. Sin. 72, 116–134. doi: 10.11821/dlxb201701010
Wang, X., Chu, B., Feng, X., Li, Y., Fu, B., Liu, S., et al. (2021). Spatiotemporal variation and driving factors of water yield services on the Qingzang Plateau. Geogr. Sustain. 2, 31–39.
Wang, D., Tian, Y., Zhang, Y., Huang, L., Tao, J., Yang, Y., et al. (2023). Evaluation and quantitative attribution analysis of water yield services in the peak-cluster depression basins in Southwest of Guangxi, China. Chin. Geogr. Sci. 33, 116–130. doi: 10.1007/s11769-023-1329-1
Wei, P., Chen, S., Wu, M., Deng, Y., Xu, H., Jia, Y., et al. (2021). Using the InVEST model to assess the impacts of climate and land use changes on water yield in the upstream regions of the Shule River Basin. Water 13:1250. doi: 10.3390/w13091250
Yang, D., Liu, W., Tang, L., Chen, L., Li, X., and Xu, X. (2019). Estimation of water provision service for monsoon catchments of South China: Applicability of the InVEST model. Landsc. Urban Plan. 182, 133–143. doi: 10.1016/j.landurbplan.2018.10.011
Yang, G., Ge, Y., Xue, H., Yang, W., Shi, Y., Peng, C., et al. (2015). Using ecosystem service bundles to detect trade-offs and synergies across urban–rural complexes. Landsc. Urban Plan. 136, 110–121. doi: 10.1016/j.landurbplan.2014.12.006
Yang, J., Xie, B., Zhang, D., and Tao, W. (2021). Climate and land use change impacts on water yield ecosystem service in the Yellow River Basin, China. Environ. Earth Sci. 80, 1–12. doi: 10.1007/s12665-020-09277-9
Yang, Y., Tian, P., Zhang, H., Shen, X., Cao, L., and Li, J. (2021). Spatiotemporal variation characteristics of water supply function of Yongjiang River Basin based on InVEST Model. J. Water Resour. Water Eng. 32, 107–117.
Yin, G., Wang, X., Zhang, X., Fu, Y., Hao, F., and Hu, Q. (2020). InVEST model-based estimation of water yield in North China and its sensitivities to climate variables. Water 12:1692. doi: 10.3390/w12061692
Zhang, L., Dawes, W. R., and Walker, G. R. (2001). Response of mean annual evapotranspiration to vegetation changes at catchment scale. Water Resour. Res. 37, 701–708. doi: 10.1029/2000WR900325
Zhang, Z., Cheng, L., Shang, H., and Li, Y. (2012). Review and trend of eco-compensation mechanism on river basin. Acta Ecol. Sin. 32, 6543–6552. doi: 10.5846/stxb201201310130
Zhang, X., Zhang, G., Long, X., Zhang, Q., Liu, D., Wu, H., et al. (2021). Identifying the drivers of water yield ecosystem service: A case study in the Yangtze River Basin, China. Ecol. Indic. 132:108304. doi: 10.1016/j.ecolind.2021.108304
Zhao, J., Shao, Z., Xia, C., Fang, K., Chen, R., and Zhou, J. (2022). Ecosystem services assessment based on land use simulation: A case study in the Heihe River Basin, China. Ecol. Indic. 143:109402. doi: 10.1016/j.ecolind.2022.109402
Zhou, G., Wei, X., Chen, X., Zhou, P., Liu, X., Xiao, Y., et al. (2015). Global pattern for the effect of climate and land cover on water yield. Nat. Commun. 6:5918. doi: 10.1038/ncomms6918
Zipper, S. C., Motew, M., Booth, E. G., Chen, X., Qiu, J., Kucharik, C. J., et al. (2018). Continuous separation of land use and climate effects on the past and future water balance. J. Hydrol. 565, 106–122. doi: 10.1016/j.jhydrol.2018.08.022
Keywords: three major drainage basins, water yield, spatial statistics, InVEST model, geographical detector, Hainan Island
Citation: Lei J, Zhang L, Wu T, Chen X, Li Y and Chen Z (2023) Spatial-temporal evolution and driving factors of water yield in three major drainage basins of Hainan Island based on land use change. Front. For. Glob. Change 6:1131264. doi: 10.3389/ffgc.2023.1131264
Received: 24 December 2022; Accepted: 28 February 2023;
Published: 16 March 2023.
Edited by:
Licong Dai, Hainan University, ChinaReviewed by:
Dezhi Wang, Key Laboratory of Aquatic Botany and Watershed Ecology, Wuhan Botanical Garden (CAS), ChinaHuaiqing Zhang, Chinese Academy of Forestry, China
Copyright © 2023 Lei, Zhang, Wu, Chen, Li and Chen. This is an open-access article distributed under the terms of the Creative Commons Attribution License (CC BY). The use, distribution or reproduction in other forums is permitted, provided the original author(s) and the copyright owner(s) are credited and that the original publication in this journal is cited, in accordance with accepted academic practice. No use, distribution or reproduction is permitted which does not comply with these terms.
*Correspondence: Zongzhu Chen, Y2hlbnpvbmd6aHVAZm94bWFpbC5jb20=
†These authors have contributed equally to this work