- 1Jiangxi Province Key Laboratory for Restoration of Degraded Ecosystems, Nanchang Institute of Technology, Nanchang, China
- 2Laboratory of Ecology and Evolutionary Biology, Yunnan University, Kunming, China
- 3Key Laboratory of Forest Cultivation in Plateau Mountain of Guizhou Province, Institute for Forest Resources & Environment of Guizhou, College of Forestry, Guizhou University, Guiyang, China
Assessing how fruit tree expansion and climate variability affect hydrological components (e.g., water yield, surface runoff, underground runoff, soil water, evapotranspiration, and infiltration) at different spatial scales is crucial for the management and protection of watersheds, ecosystems, and engineering design. The Jiujushui watershed (259.32 km2), which experienced drastic forest changes over the past decades, was selected to explore the response mechanisms of hydrological components to fruit tree expansion and climate variability at different spatial scales (whole basin and subbasin scale). Specifically, we set up two change scenarios (average temperature increase of 0.5°C and fruit tree area expansion of 18.97%) in the SWAT model by analyzing historical data (1961∼2011). Results showed that climate change reduced water yield, surface runoff, and underground runoff by 6.75, 0.37, and 5.91 mm, respectively. By contrast, the expansion of fruit trees increased surface runoff and water yield by 2.81 and 4.10 mm, respectively, but decreased underground runoff by 1 mm. Interestingly, the sub-basins showed different intensities and directions of response under climate change and fruit tree expansion scenarios. However, the downstream response was overall more robust than the upstream response. These results suggest that there may be significant differences in the hydrological effects of climate change and fruit tree expansion at different spatial scales, thus any land disturbance measures should be carefully considered.
1. Introduction
Two main factors influencing hydrological processes are climate change and land use/cover change (LUCC) (Sherwood and Fu, 2014; Wang et al., 2014). According to the sixth report by the government’s Intergovernmental Panel on Climate Change (IPCC), global temperatures have continued to rise since the 1880s (Masson-Delmotte et al., 2021), with the rate accelerating over the next 20 years. In addition, global warming will further change the spatial and temporal distribution patterns of rainfall, altering the annual frequency and intensity of floods and increasing the risk of floods, droughts, and other disasters.
Forests are crucial in mitigating climate change because they act as carbon storehouses (Fearnside et al., 2000; Notaro et al., 2013; Duveiller et al., 2018). However, forest cover change (e.g., deforestation, reforestation) have generated severe concerns and debates on water supply, that is, forestation or deforestation can either decrease or increase annual streamflow (Filoso et al., 2017; Zhang et al., 2017; Wei et al., 2018; Sokolova et al., 2019; Holl and Brancalion, 2020). Zhang and Wei (2021), through a global survey, found that 60% of the afforested watershed had a 0.7–65.1% reduction in annual runoff with a 0.7–100% forestation forest cover gain, whereas 30% of the smallest watersheds had a 7–167.7% increase in annual streamflow with a 12–100% forest cover gain (Zhang and Wei, 2021). Sokolova et al. (2019), through long-term observations of 14 pair of moderate-size watersheds (around 250 acres) in the north-west of the USA, found that after the falling down of a broadleaf forest, the daily surface flow increased on average by 2–3 mm during the first 5 years, and after cutting down coniferous forests, this amount increases almost by threefold. On the contrary, in some forest cover loss instances, the stream runoff failed to find definitive changes (Scott, 1993; Stednick, 1996; Buttle and Metcalfe, 2000; Bart and Hope, 2010; Zhang et al., 2017).
The widely documented literature review shows that previous studies have mainly evaluated the effects of forest harvesting or restoration (Croke et al., 1999; Mwangi et al., 2016), rarely with attention to the conversion of different vegetation types. Considering the gap between root uptake and canopy interception between different vegetation types, vegetation type changes may be an essential factor affecting hydrological processes (Duan et al., 2016; Hayati et al., 2018). For example, replacing grassland and shrubland with eucalyptus and pine forests in South Africa significantly reduced annual runoff in the succeeding 3–6 years (Scott and Lesch, 1997; Slingsby et al., 2021). In southern Brazil, planting natural forests in the catchment had no significant effect on runoff in the first 2 years (Ferraz et al., 2021), while the planting of eucalyptus forests significantly reduced runoff in the initial 2 years (Iroumé et al., 2021). The Dong Nai River Basin in Vietnam converted natural forests to coffee plantations, significantly increasing surface runoff and reducing underground runoff (Truong et al., 2022).
In addition, previous studies have less focused on the hydrological effects at different spatial scales. Theoretically, more heterogeneities in the landscape, climate, geology, topography, and vegetation can occur as watershed size increases, therefore leading to different response mechanisms (Huff et al., 2000; Andréassian, 2004; Arrigo and Salvucci, 2005; Kirchner, 2006; Crouzeilles and Curran, 2016). Zhang et al. (2017) found that the response extent of annual runoff to forest cover change declined with increasing watershed size in large watersheds (≥ 1000 km2), but were statistically insignificant for small watersheds (<1000 km2) (Zhang et al., 2017). Therefore, it is problematic to extrapolate conclusions from one watershed to another, which requires more cases to explore the hydrological effects of forest cover change at different spatial scales.
The Jiujushui Watershed is located in the upper reaches of Poyang Lake, covering an area of 259.3 km2. In the past few decades, the rapid expansion of fruit tree areas in the watershed has raised attention in the academic community. Fruit planting is a unique afforestation practice generally considered to increase forest coverage while gaining economic benefits. Previous studies have demonstrated that fruit tree planting can significantly increase intra-annual runoff fluctuations, surface runoff, and the risk of soil erosion (Xu et al., 2019; Liu et al., 2020). However, the effects of fruit tree planting on water resources at different spatial scales are rarely assessed, especially in subtropical. To this end, this study established the SWAT model to understand the responses of key hydrological components to climate change and fruit tree expansion at different spatial scales.
The objectives of this study were as follows:
(1) To effectively simulate the hydrological effects of different vegetation types conversions through the SWAT model.
(2) To determine the hydrological effects of climate change and fruit tree expansion at different spatial scales by using SWAT to conduct scenario simulations.
2. Research area and data collection
2.1. Research area
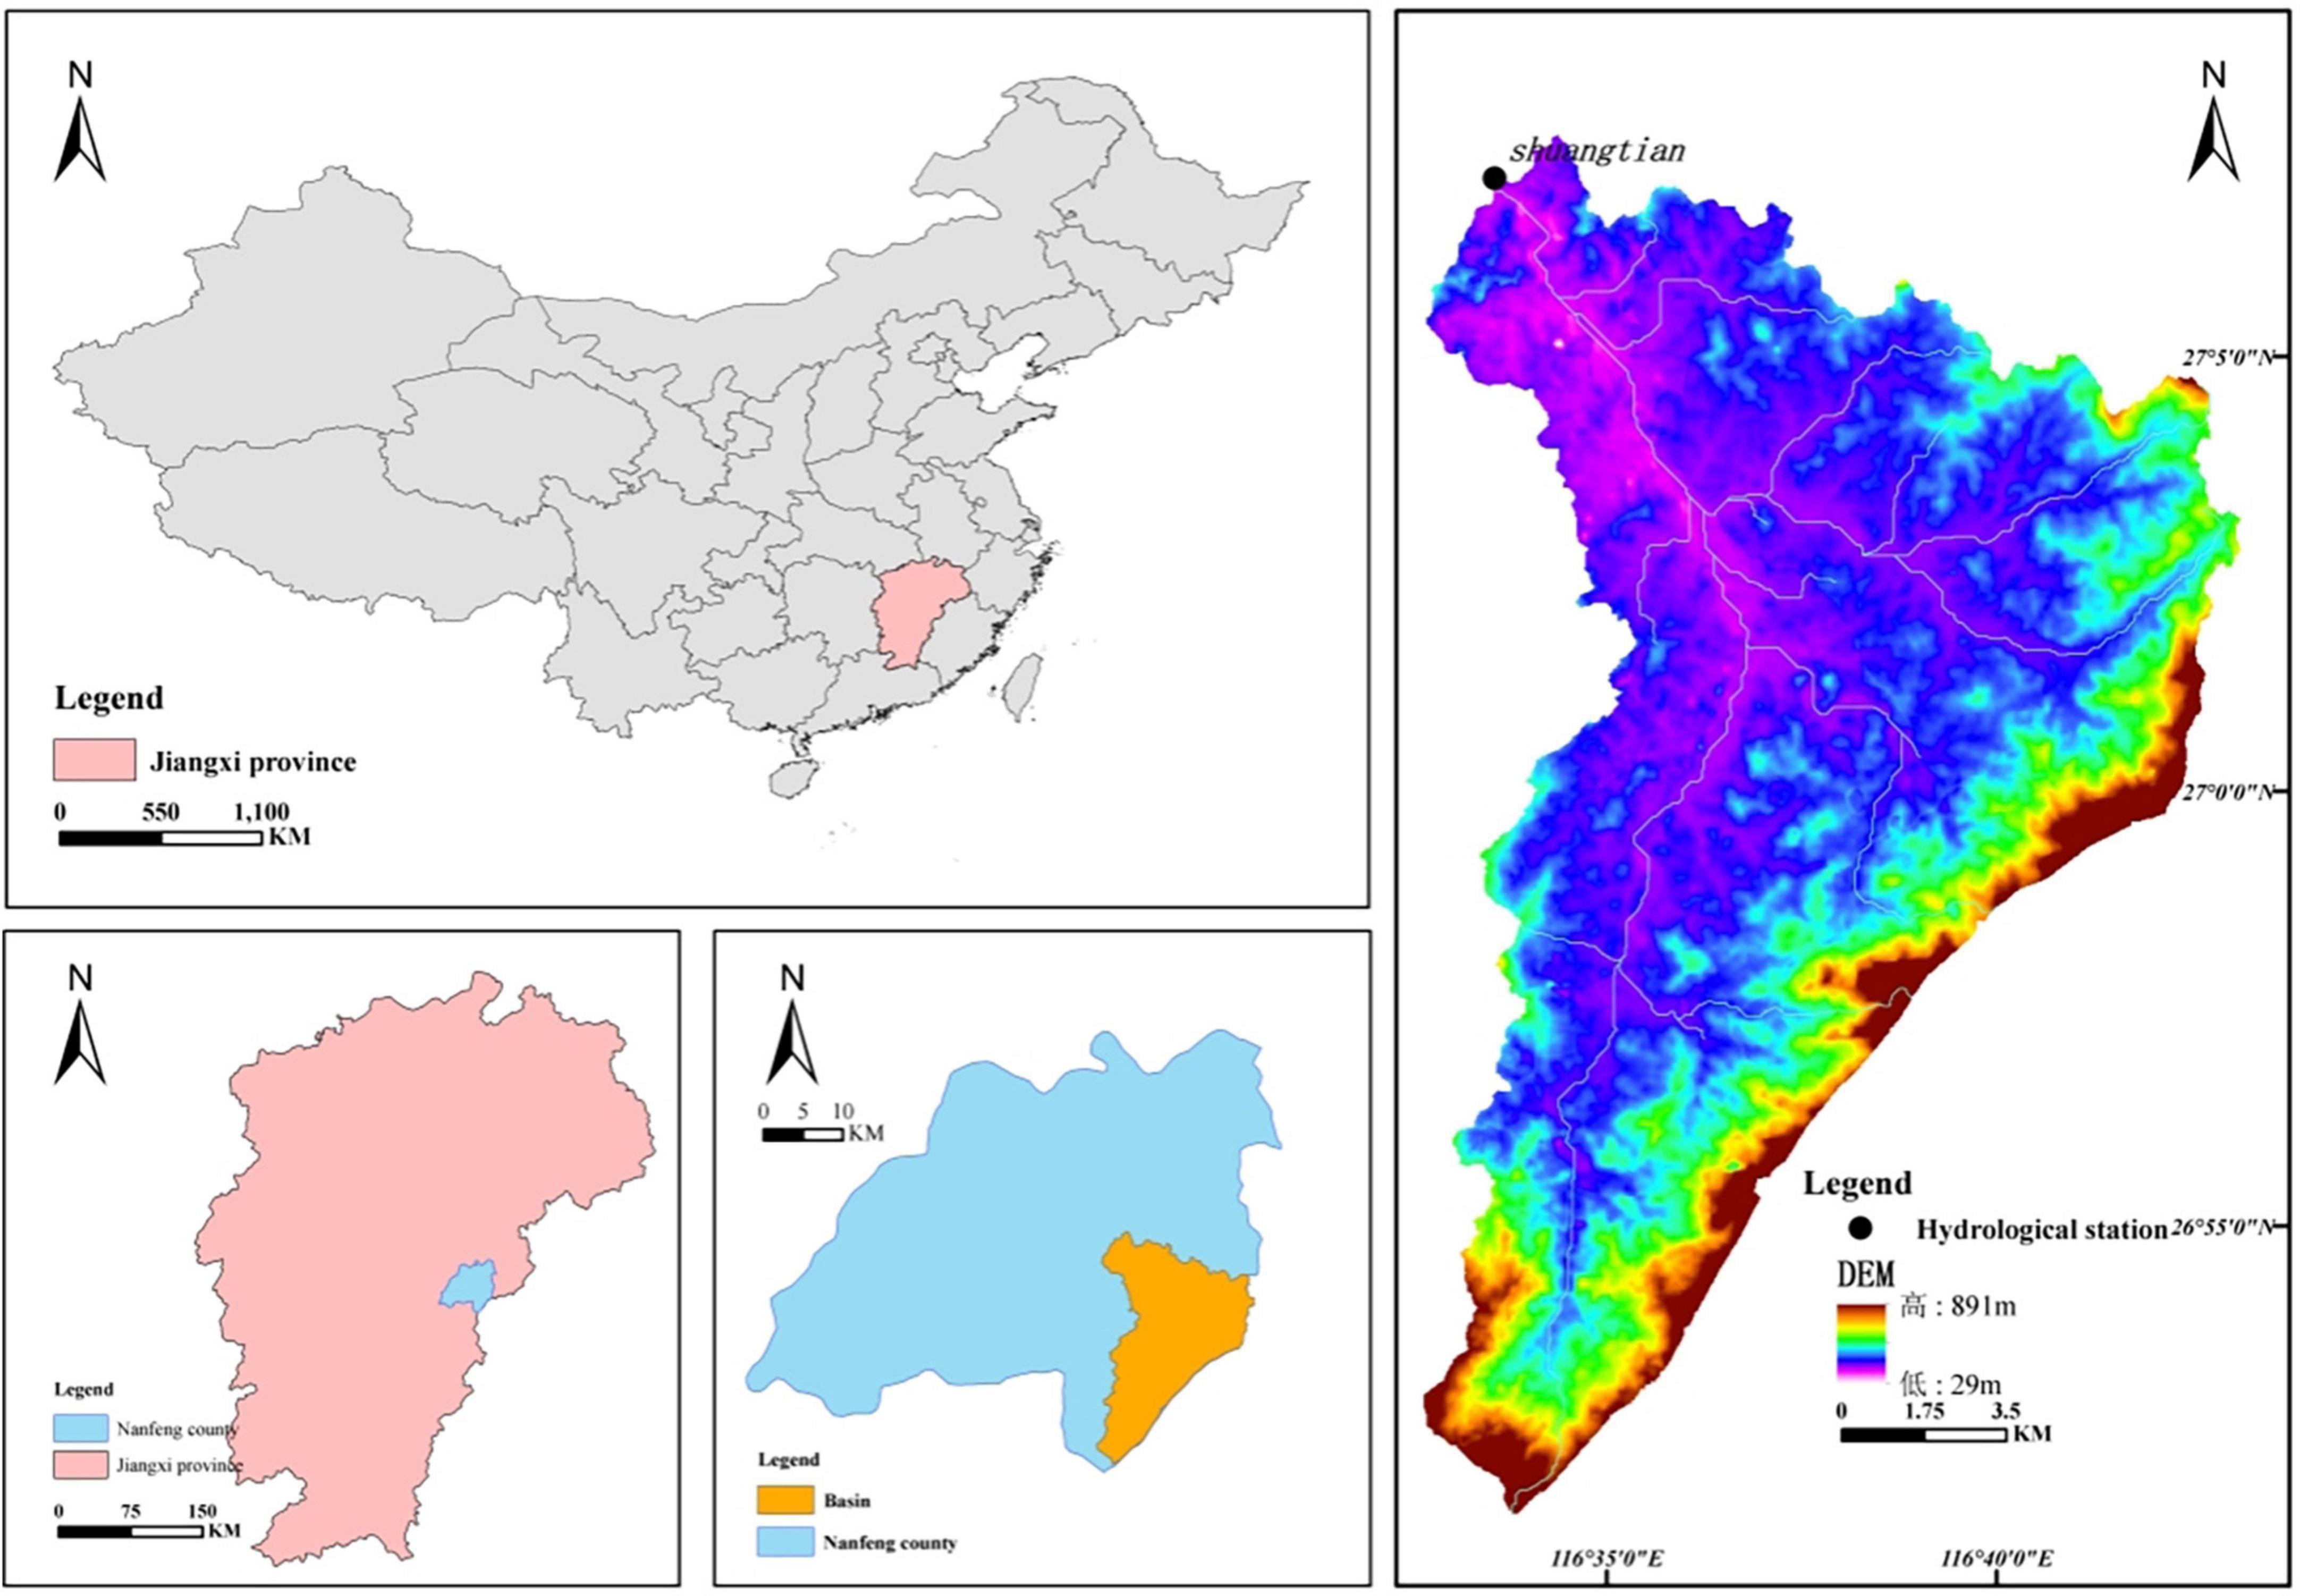
The Jiujushui watershed, which covers an area of about 259.3 km2, belongs to the humid subtropical monsoon zone, with geographical coordinates of 116°30′–116°48′E and 26°50′–27°08′N in the southeast of Jiangxi province, China (Figure 1). The watershed is steep in the southeast and flat in northwest, with an average elevation of 231 m and a slope between 0–25 degrees. The main types of soil were Humic Acrisols (77.83%) and Cumulic Anthrosols (19.37%). According to the Jiangxi Meteorological Bureau data, the mean annual precipitation was 1742 mm between 1961 and 2011, with 842.4 mm (48.36%) in the wet season from April to June and 212.2 mm (12.18%) in the dry season from September to November. The mean annual temperature was 18.41°C between 1961 and 2011.
2.2. Data source
2.2.1. Digital elevation map
The ASTER GDEM 30 M resolution digital elevation data from the Geospatial Data Cloud were available for download.1
2.2.2. Soil data
Information on soil properties was taken from the 1:100,000 scale soil map of China provided by the World Soil Harmonization Database (HSWD). The data were classified using the FAO-90 criteria, which can be directly applied to the SWAT model without soil grain size conversion. According to the soil properties and classification criteria, the soils in the study area can be roughly divided into five parts: Cumulic Anthrosols (19.37%), Haplic Acrisols (77.83%), Humic Acrisols 1 (0.60%), Humic Acrisols 2 (0.66%), and Eutric Gleysol (1.53%) which soil structure is SL-L (Silty Loam-Loam), SL-SCL (Sandy Loam-Sandy Clay Loam), C-C (Clay-Clay), SCL-CL (Sandy Clay Loam-Clay Loam), L-CL (Loam-Clay Loam).
2.2.3. Land use data
In this study, we used the LUCC data from 1980 at a 30-m resolution as the baseline L1 with ten types of land use: paddy field, dry land, forest land, shrub land, sparse forest land, other woodlands, high-density grassland, medium-density grassland, water area, and urban and built-up area (Sourced from the Data Centre for Resource and Environmental Sciences, Chinese Academy of Sciences).2
2.2.4. Meteorological data
Meteorological data were collected from the Jiangxi Provincial Meteorological Bureau, which records daily rainfall, average temperature, maximum temperature, minimum temperature, and average wind speed between 1961 and 2011.
2.2.5. Runoff data
Daily runoff data were supplied by the Shuangtian Hydrological Station of Jiangxi Provincial Hydrological Bureau (No. 62406200), which was available from 1961 to 2011.
3. Materials and methods
3.1. M-K trend test
The Mann-Kendall (M-K) trend analysis method is a non-parametric statistical method that can effectively distinguish whether a natural process (e.g., rainfall, runoff, temperature, etc.) is a natural fluctuation or an inevitable trend. Due to the simplicity and effectiveness of the M-K, it has been widely used to examine hydrometeorological trends (Nyikadzino et al., 2020; Nguyen et al., 2022). The statistical variable S was tested by using time series data X.
It is noted that the statistic S depends only on the level of the observations instead of the value itself so that the statistic results are unaffected by the actual distribution of the considered datasets (Hamed, 2008). Assuming that sampled data are independently distributed, we compared the normalized variance with the standardized variable at the desired significance level to determine Significant trends. The variance is expressed as:
When the MK statistic |Zc| > Z1−a/2, the original hypothesis is unacceptable at the confidence level. That is, it shows a clear upward or downward trend in the time series data (with the statistic Zc > 0 representing an upward trend and vice versa) (Hisdal et al., 2001; Karlsson et al., 2014).
3.2. Sen slope
We applied the Sen slope method to estimate the variation amplitude of the meteorological variable trend. The strength of this method can effectively avoid the influence of missing values and outliers by using the slope and intercepts median values of pairs of points as judgment tools (Sen, 1968; Attaur and Dawood, 2016; Li et al., 2022).
1 < j < i < n. In Eq. 5, x represents the median value of overall combinations recorded in the entire dataset, where positive values show an “up trend” and negative values show a “drop trend.”
3.3. The SWAT model
In the early 1990s, the USDA’s Agricultural Research Service (ARC) created the SWAT model, a semi-distributed hydrological model of watersheds based on physical principles. It is used to assess the effects of land use management and climate change at the watershed scale on water transport, nutrients, pesticides, and other materials (Arnold et al., 1998). Features data, such as climate, topography, soils, and land use, into the SWAT model, which subdivided the watershed into multiple hydrological response units (HRU) with homogenous properties. The final runoff of the watershed is calculated by applying the water balance equation to each HRU. Due to its explicit physical foundation and detailed description of hydrological processes, SWAT has been widely applied worldwide (Wallace et al., 2018; Nkwasa et al., 2020).
The equation for water balance was as follows:
Where SWt is the soil’s ultimate moisture content (mm), SW0 is the initial moisture content (mm), Rday is the precipitation (mm), Qsurf is the surface runoff (mm), Ea is the evapotranspiration (mm), Wseep is the water flow to the unsaturated zone from the soil profile (mm), and Qgw is the water flow the watershed from underground (mm).
3.4. Calibration and validation of the SWAT model
Thirty-year’s time series from 1980 to 2009 were chosen as the studied period to build daily scale SWAT models, dividing into the warm-up period from 1980 to 1984, the calibration period from 1984 to 1996, and the validation period from 1997 to 2009. In this study, we set up the SWAT-CUP procedure and applied LH-OAT (Latin-hypercube one-factor-at-a time) approach and the sequential uncertainty fitting (SUFI-2) program to calibrate the sensitivity parameters (Xu et al., 2013; Abbaspour, 2015). T-stat and p-value were used to determine the sensitivity of the parameters. The higher the absolute value of the parameter t-stat is, the more sensitive it is, and the smaller the p-value is, the more important it is. In this work, we first calibrated the wide-range meaningful and high-sensitive parameters, which captured most of the observation data within the range of 95PPU. We then operated various iterations to decrease the uncertainty of the parameters. After one iteration, we updated the scope of the parameters for the next iteration until getting a satisfactory result. Three indicators were selected for this study to evaluate the performance of the model (Moriasi et al., 2007; Wang et al., 2017; Yang et al., 2017), including the correlation coefficient R2, the Nash–Sutcliffe efficiency coefficient NSE (Nash and Sutcliffe, 1970), and the percentage error (PBIAS) detailed in the following equations:
where Qobsi and Qsimi are the observed and simulated values, respectively, Qobsave and Qsimave are the observed and simulated averages, respectively, n is the length of the time series. The SWAT model simulation can be judged as “satisfactory” if the NSE > 0.5 and PBIAS ≤ ± 25 for a month time step (Moriasi et al., 2007). Details are shown in Table 1.
3.5. Separation of impacts of land use cover and climate change
For convenience in separating the effects of land use/cover and climate change on hydrological processes, it has been common to treat both as being independent of each other in previous studies (Yin et al., 2017), which ignores the interaction and causes the contribution of both not to equal 100% in total. To this end, we followed Yang et al. (2017) to reach a more accurate separation of the contributions of climate and land-use factors to key hydrological components (Figure 2).

Figure 2. A diagram showing how climate change (A) and changes in how land is used (B) affect hydrological processes. C1 and C2 represent different climatic conditions, L1 and L2 represent different land use types. A, B, C, D represent the values of hydrological components (water yield, evapotranspiration, etc.) under the conditions of , , , respectively.
Due to different cover conditions, there are some differences in the hydrological effect of the same climate change. Therefore, in this study, hydrological impacts ΔQC1 and ΔQC2 were calculated under different land use conditions. The arithmetic average of ΔQC1 and ΔQC2 represents the separate impacts of climate change.
Likewise, the arithmetic mean represents the individual effects of land use change on hydrological components (ΔQL).
Differences in observed hydrological components between the baseline and impact recording periods may also be used to evaluate the changes:
Where the overall change in the hydrological process and the hydrological components may be used to calculate statistical mean values throughout yearly and monthly time frames.
3.6. Scenario settings
3.6.1. Fruit tree expansion scenario
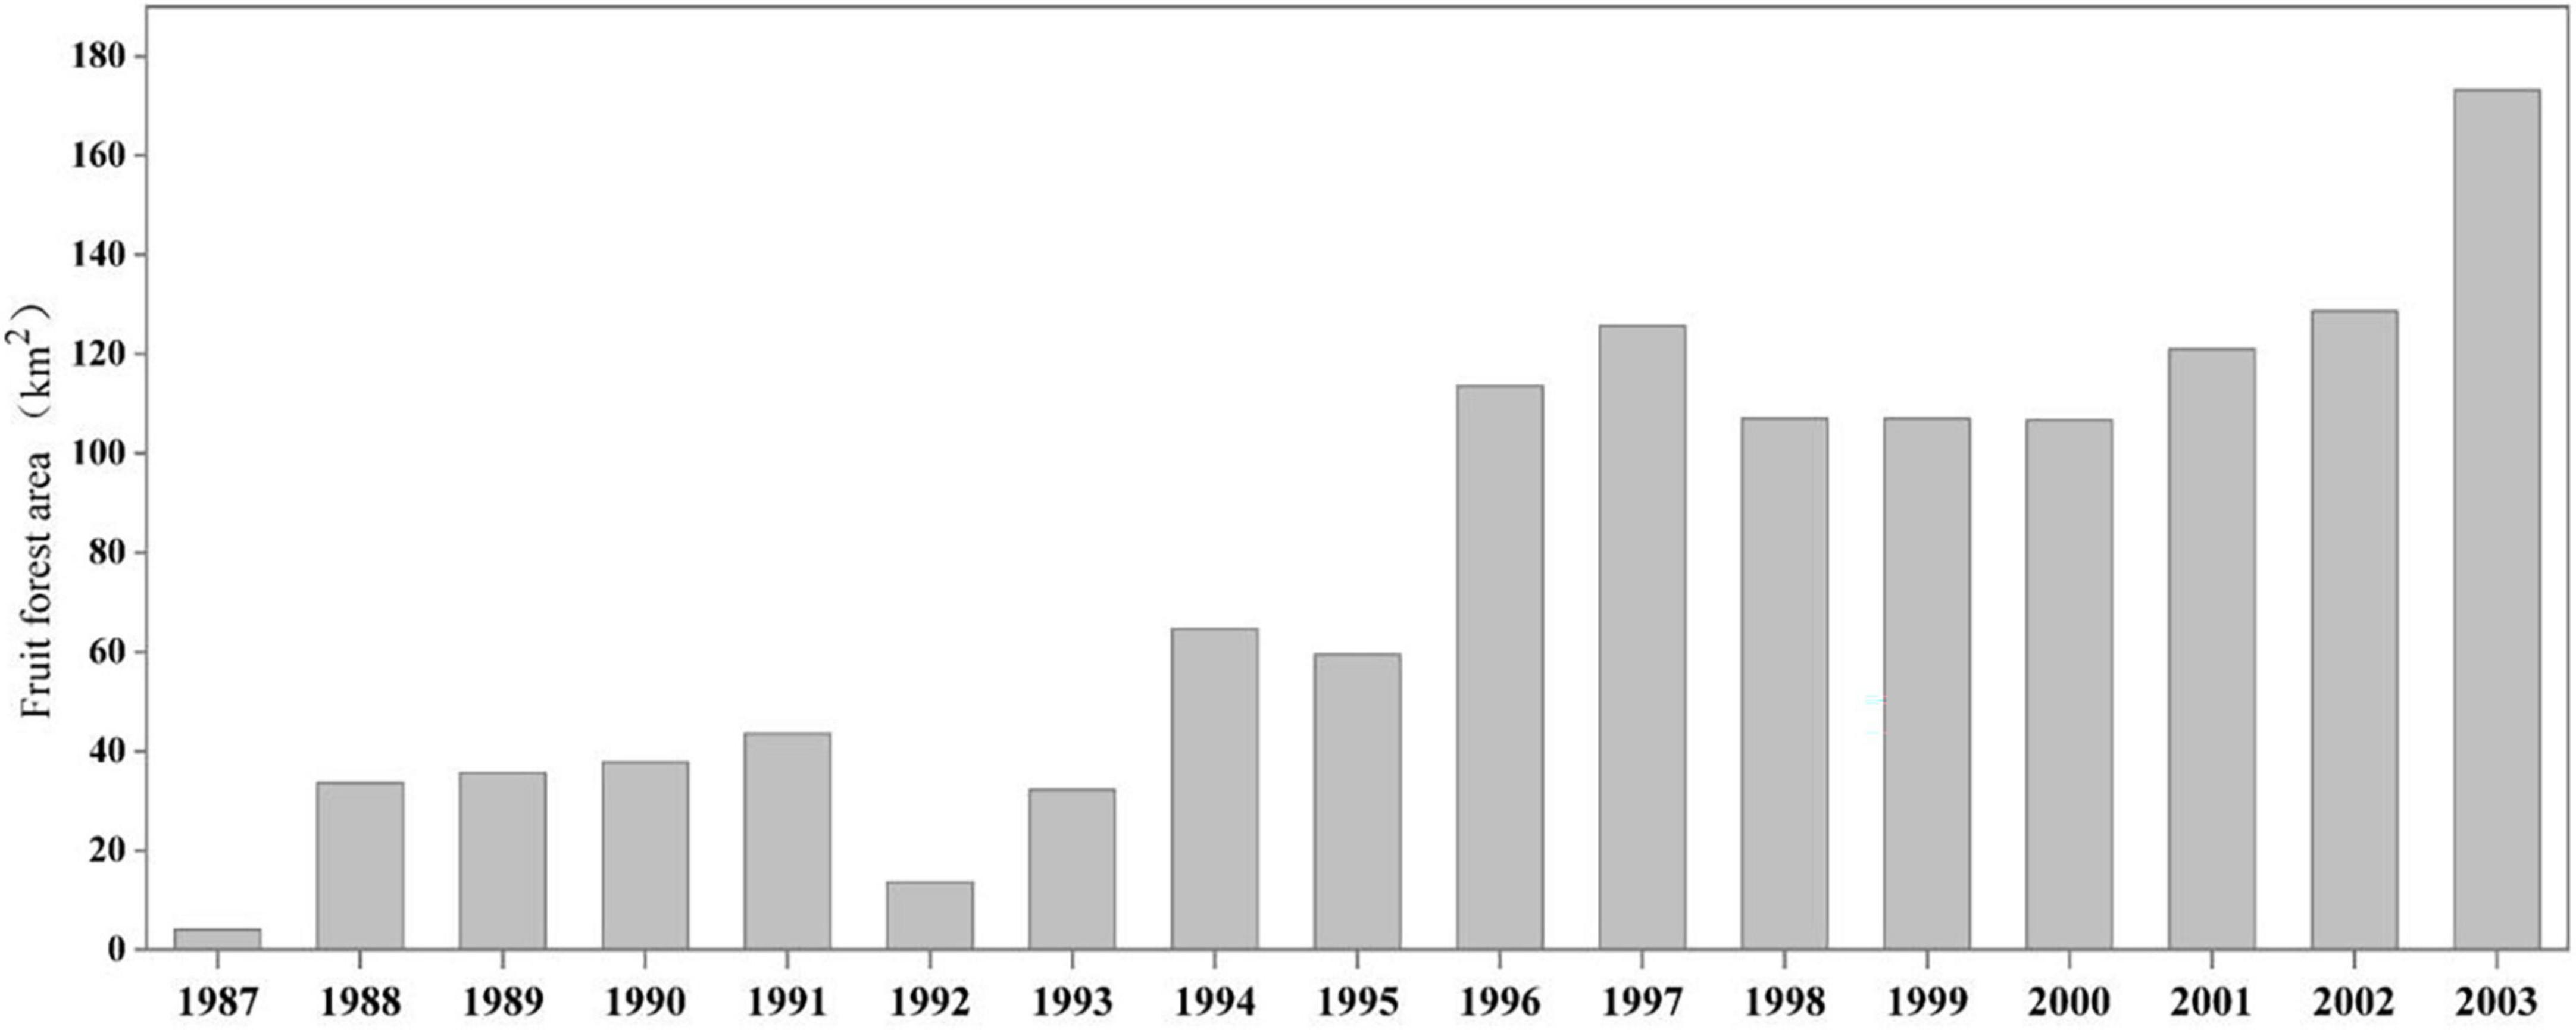
The study area is located in the Jiujushui watershed of Nanfeng County, Fuzhou City, Jiangxi Province, where China has emphasized and taken measures for the planting and producing citrus since 1978. Based on the records from 1987 to 2003, the area of fruit forests expanded dramatically, with the plantation area increasing from 4.10 to 173.15 km2 (Figure 3).
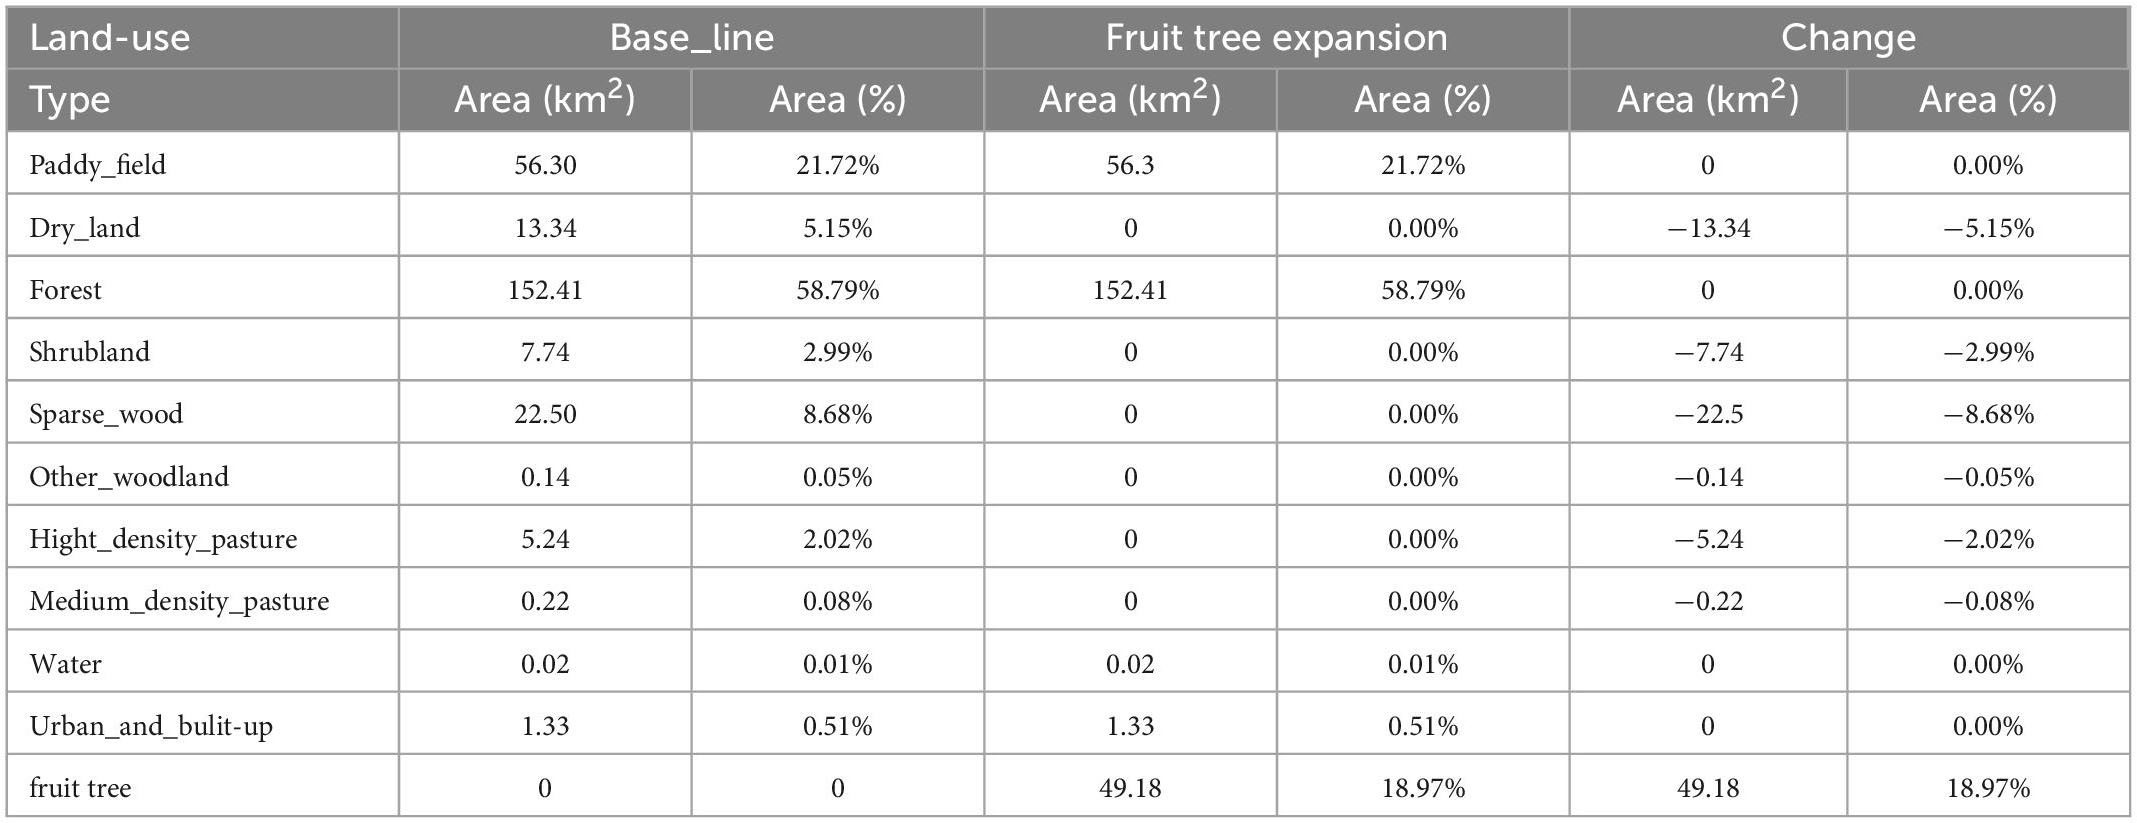
This study lacked historical image data of fruit tree planting in this basin, so the scale and direction of fruit tree expansion were assumed in the study. This study assumes that under baseline conditions (L1 1980s), the future priority is given to converting all of the low-value lands (e.g., dryland, grassland, shrub land, other woodland) to fruit forests, while other land use types (e.g., paddy field, forest land, urban and construction land) remain unchanged. Thus, a fruit tree expansion scenario (L2) was constructed, as shown in Table 2 and Figure 4.
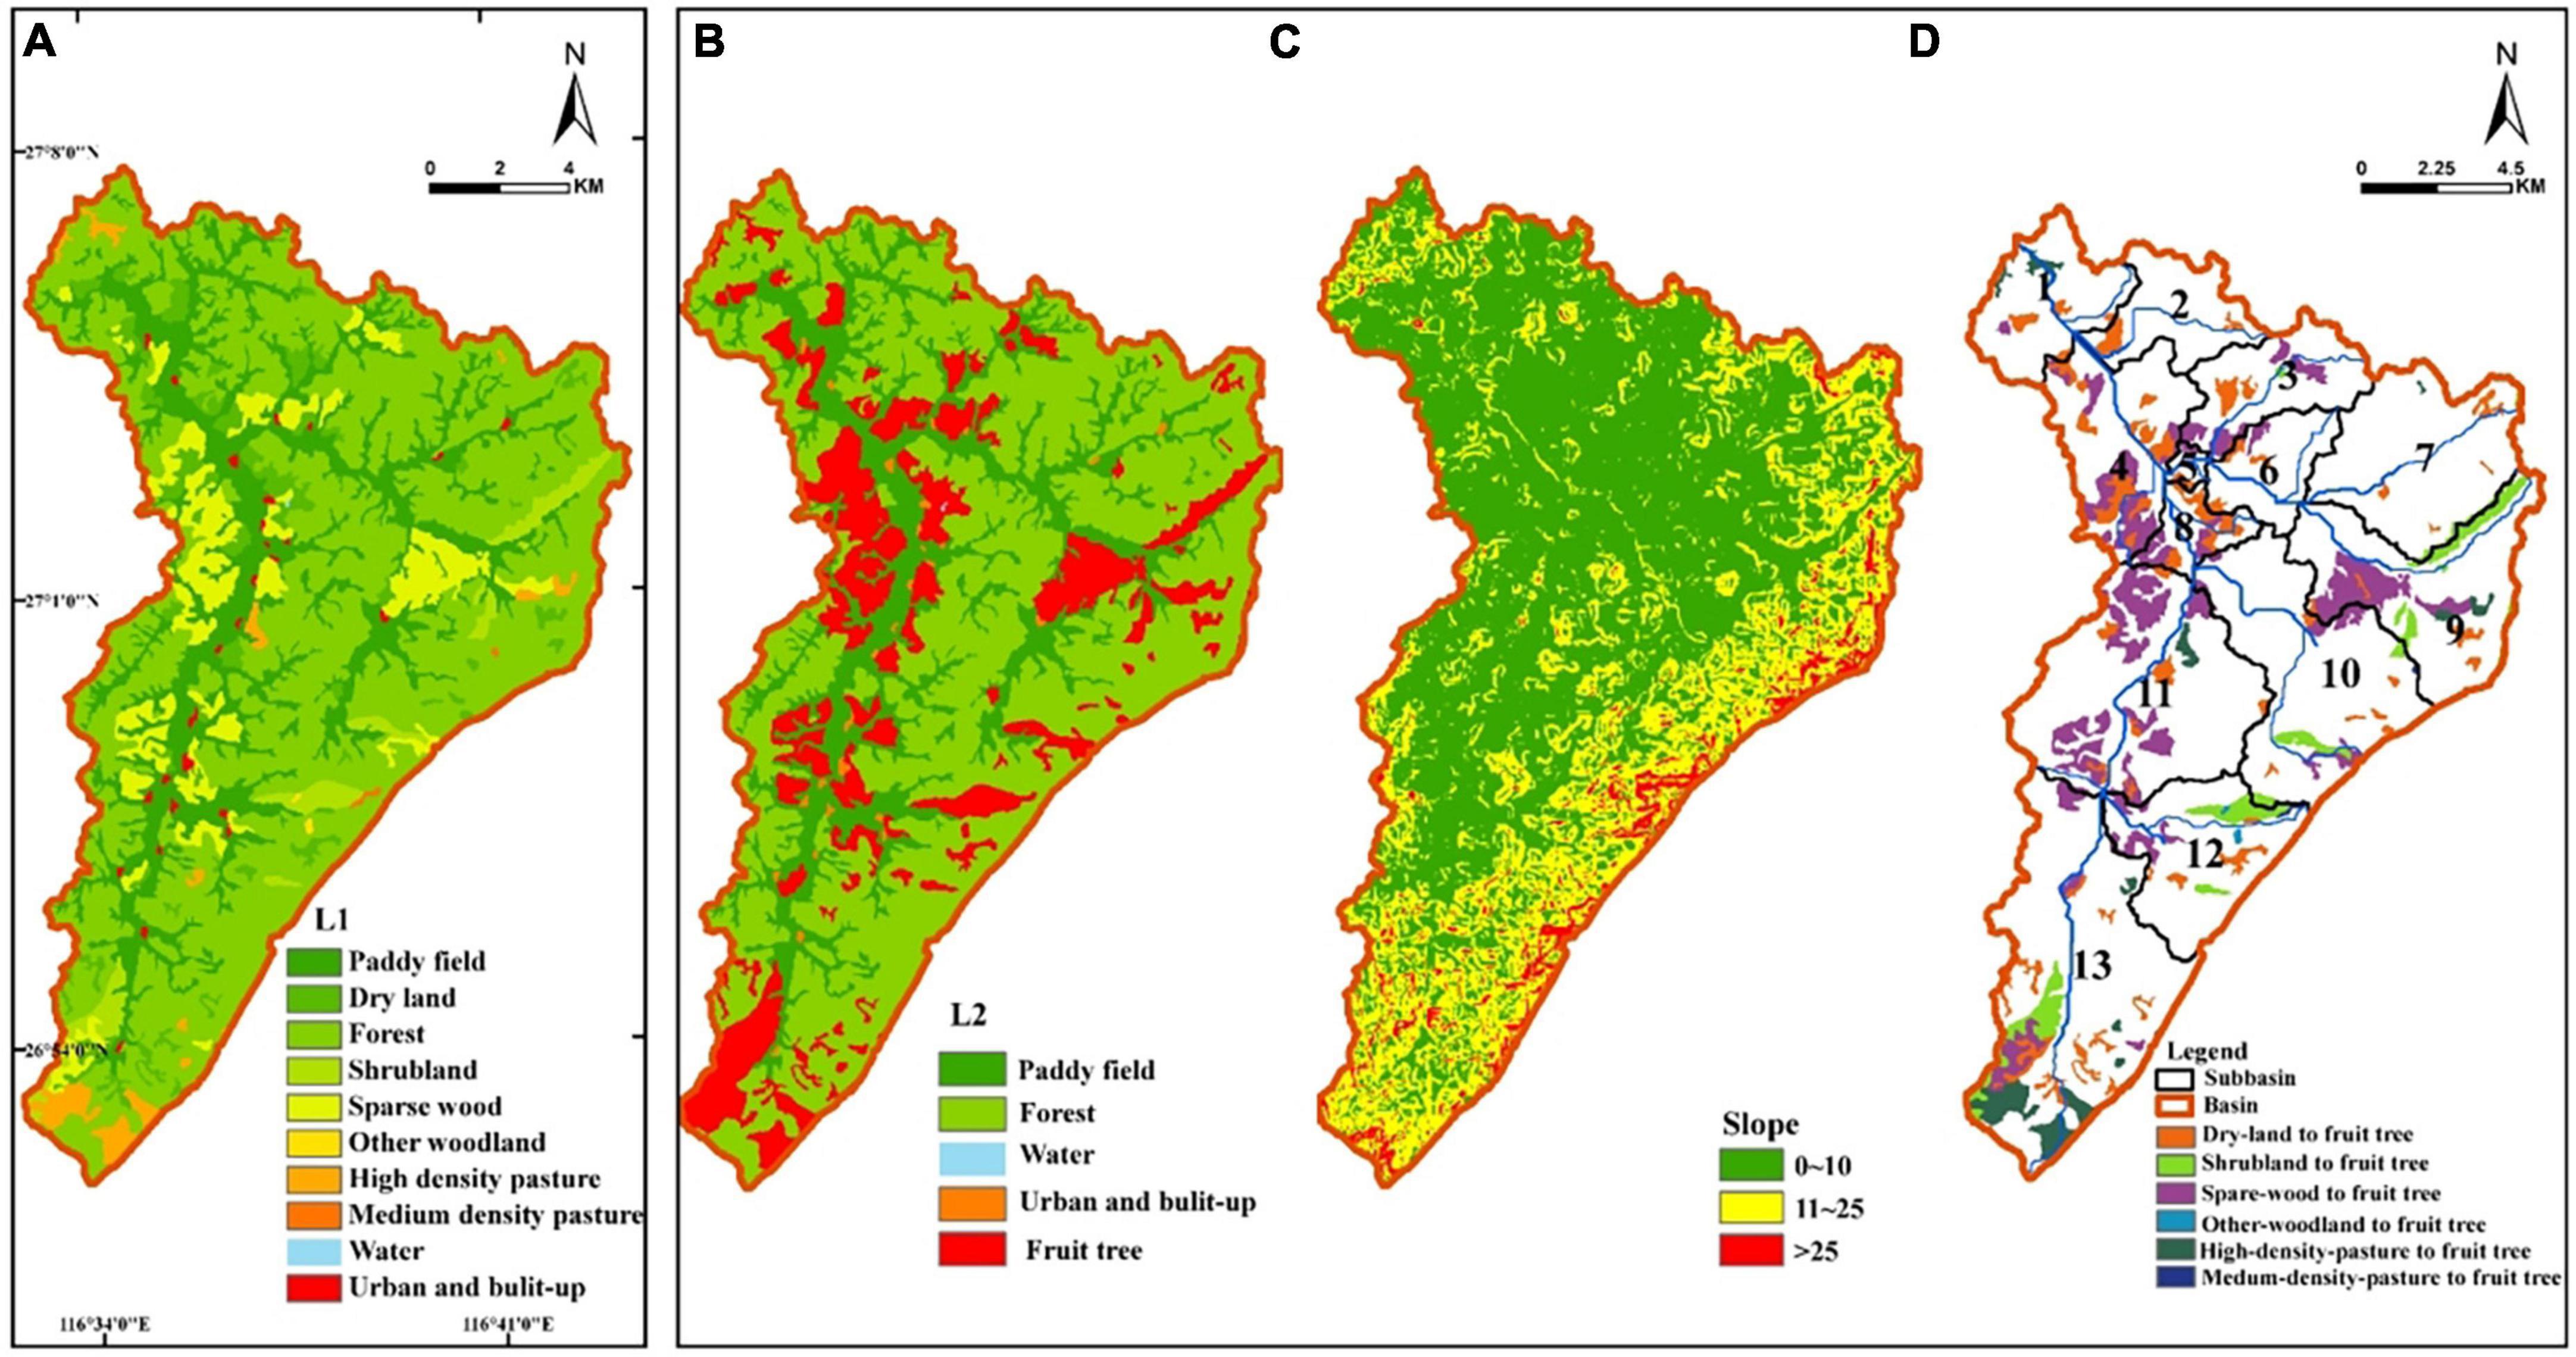
Figure 4. (A) Baseline period, (B) land use during fruit tree expansion, (C) slope of the study area, (D) land use transfer from baseline to fruit tree expansion.
3.6.2. Climate change scenarios
Three hydrometeorological elements, including annual average rainfall, runoff, and temperature, were analyzed using the Theil–Sen estimator for the past 51 years, from 1961 to 2011. Precipitation displayed a slight downward trend over the last 51 years, with a climatic tendency of −0.79 mm/10a, which was not significant (P > 0.1). Runoff showed an increasing trend with a climatic tendency of 15.4 mm/10a, which was not significant (P > 0.1). The average temperature exhibited a significant increasing trend with a climatic tendency of 0.1°C/10 a (P < 0.01) (Figure 5).
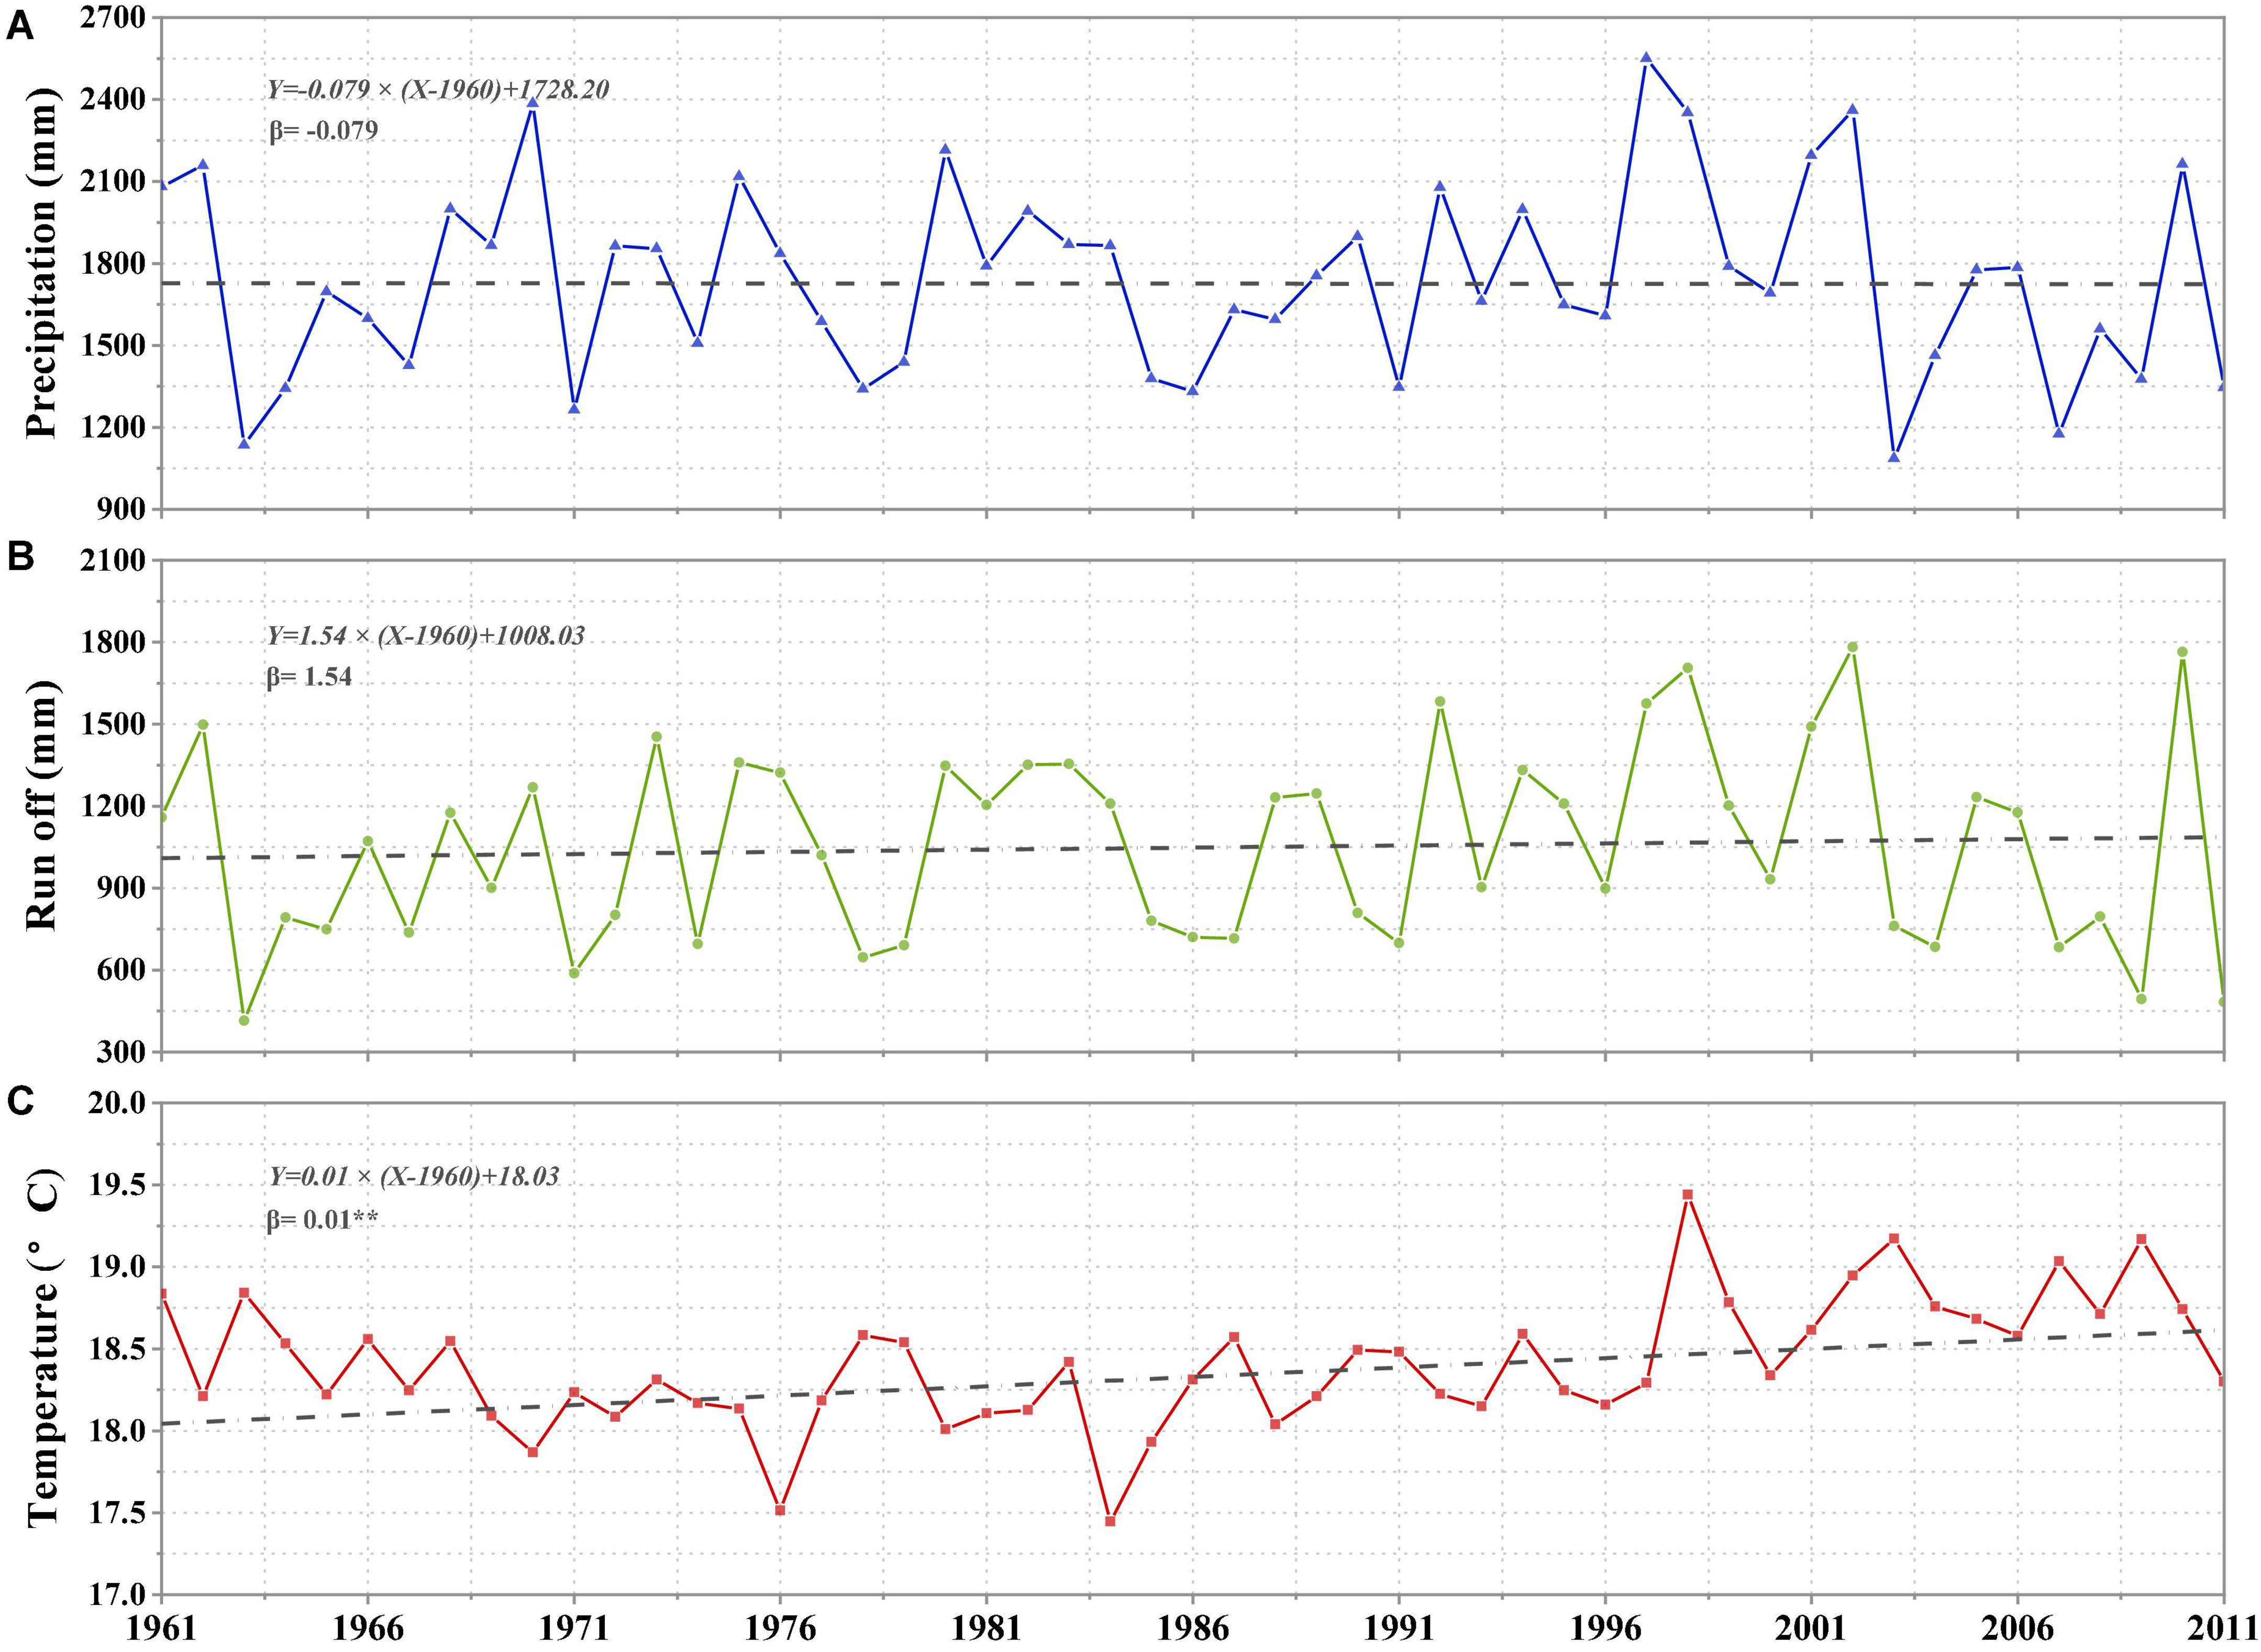
Figure 5. (A) Precipitation, (B) runoff, and (C) temperature changes throughout time, together with their respective rates of change (β). Asterisk (*) and (**) denote significant trends at the P 0.1 and P 0.05 levels, respectively.
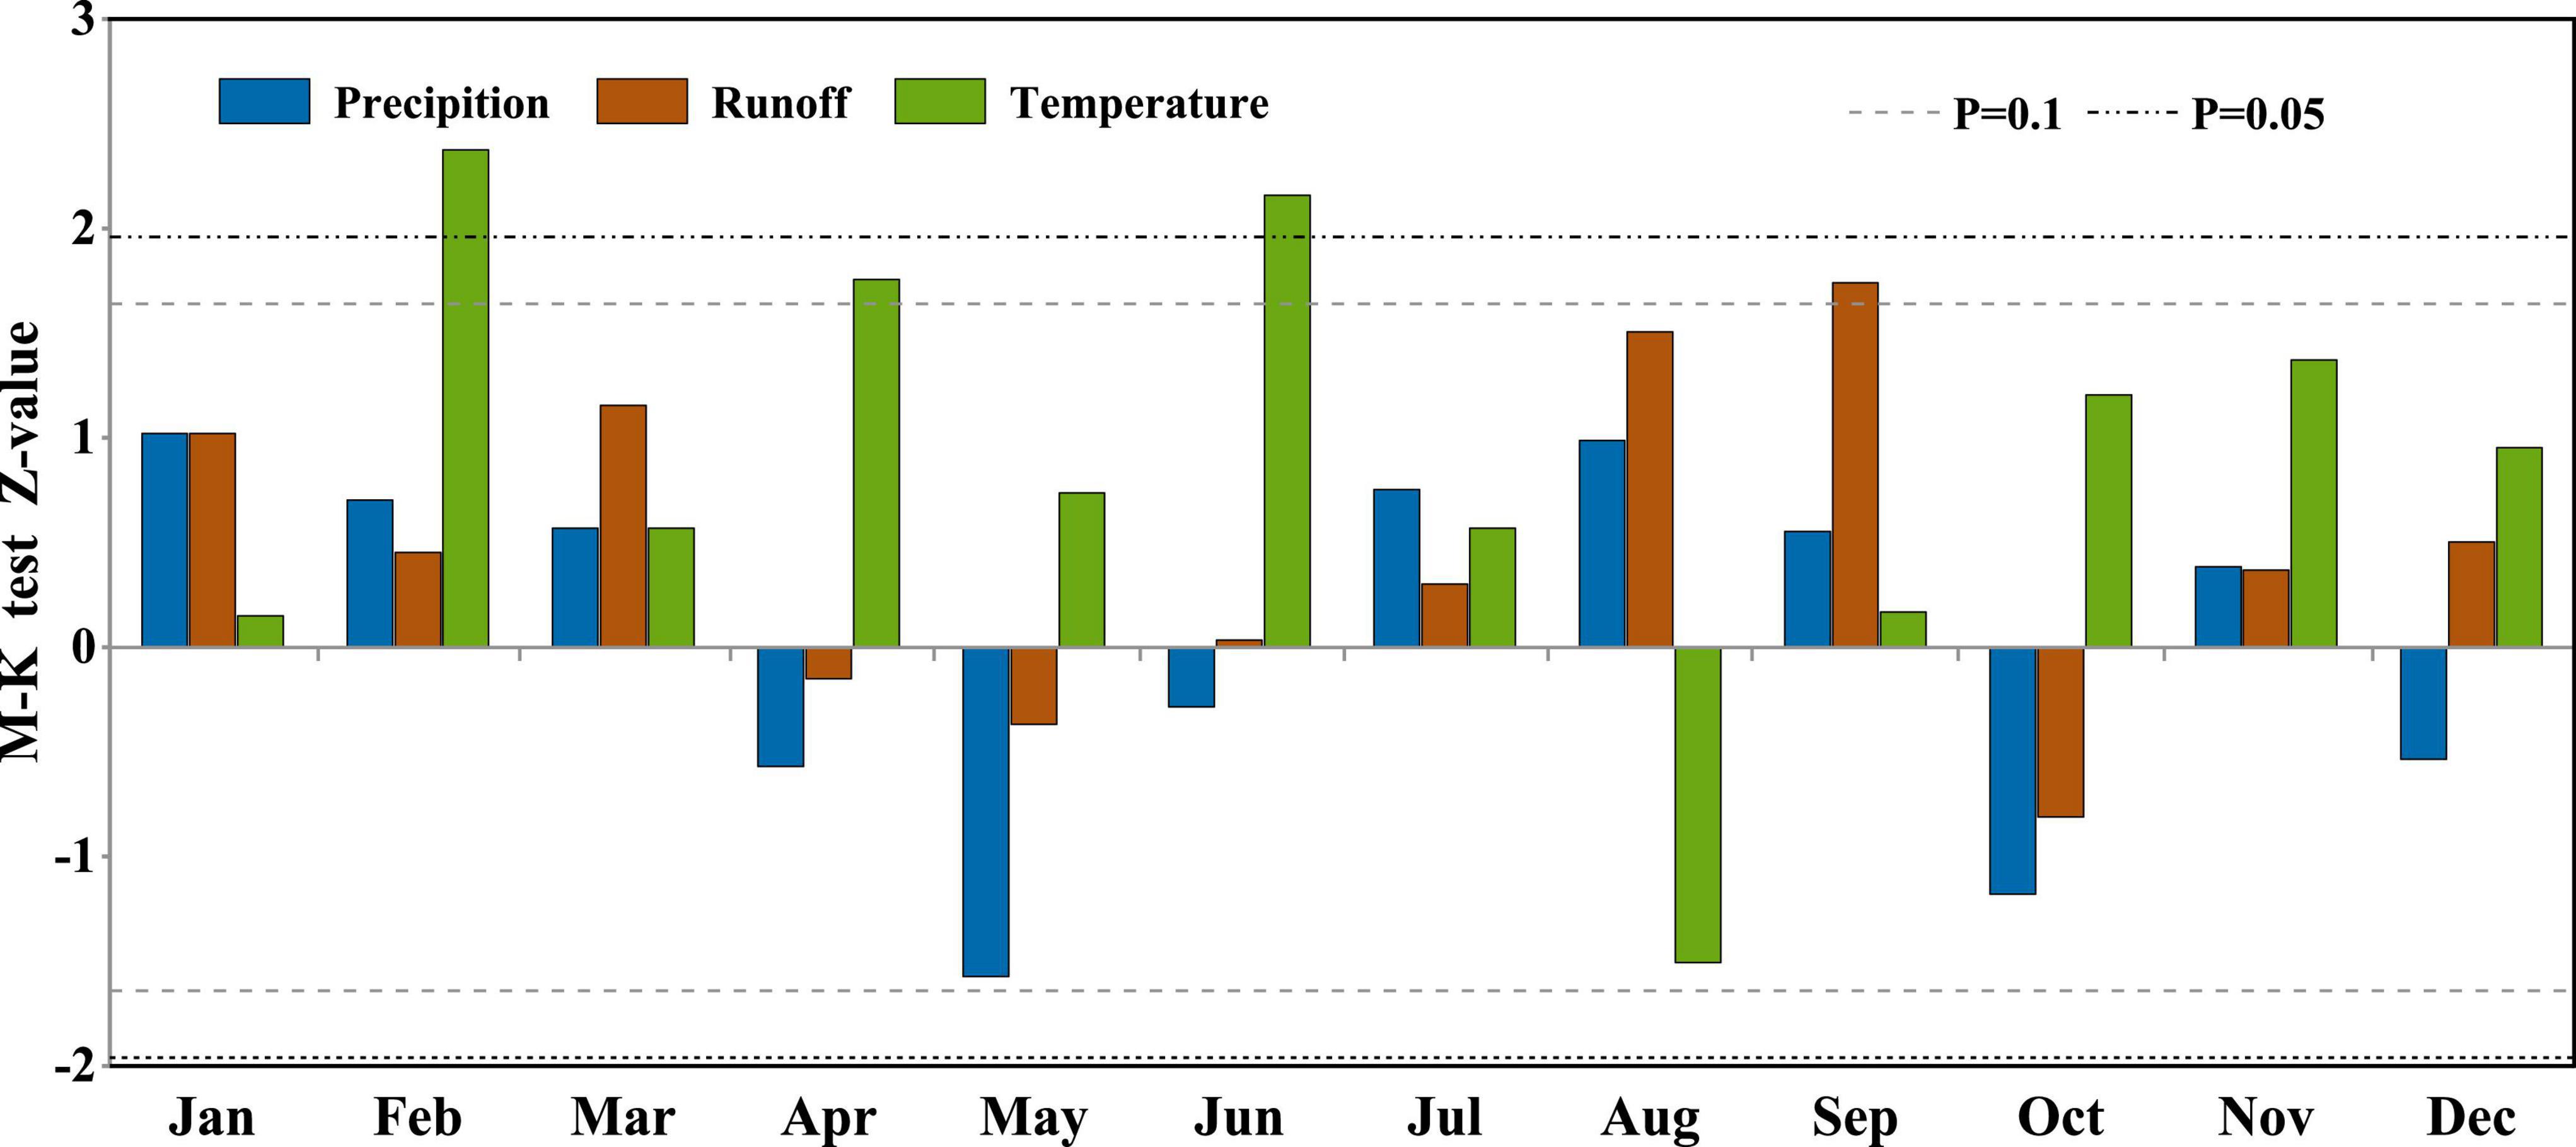
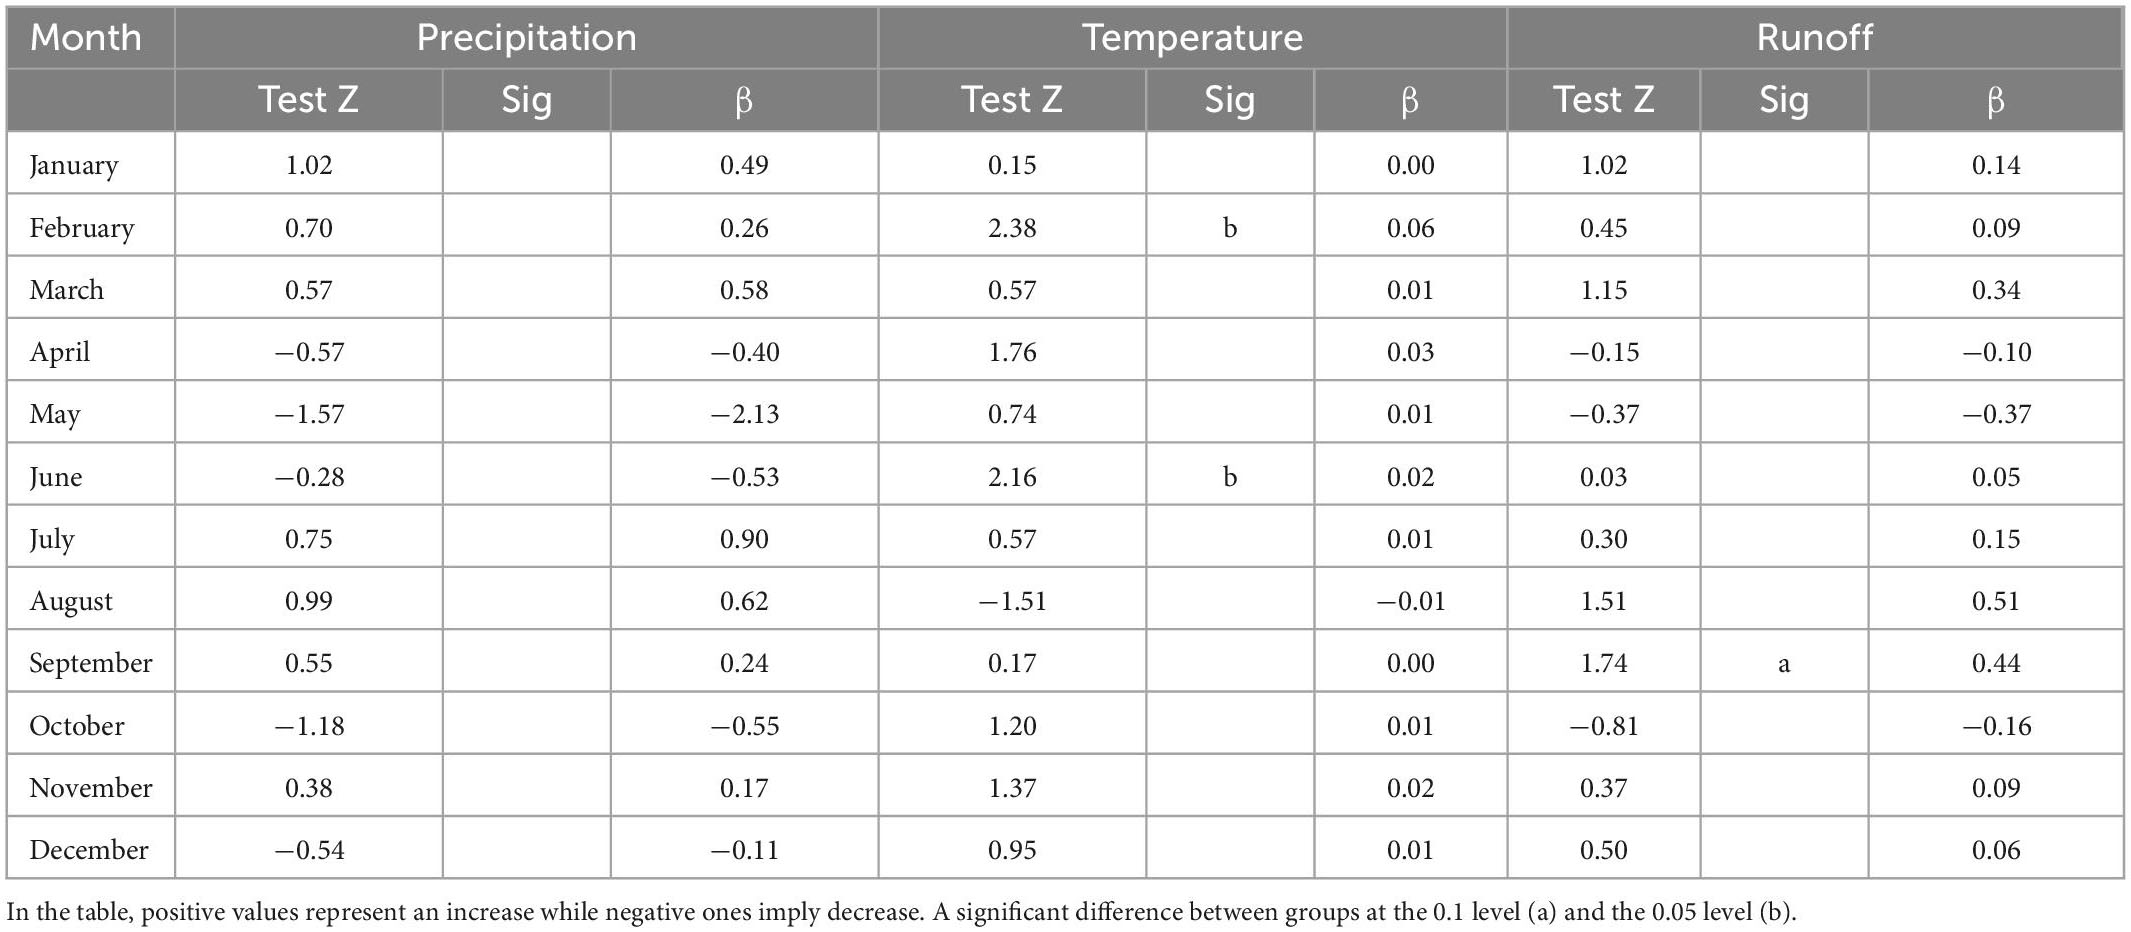
In addition, the MK test at the monthly scale showed that runoff was only significant in September (P < 0.1). The average temperature was significant in April (P < 0.1), February and June (P < 0.05; Figure 6 and Table 3). In summary, our study constructed an increase in the average temperature of 0.5°C and maintain rainfall as future climate conditions C2.
In this study, 1980–2009 was selected as the study period to establish the SWAT model. The baseline (L1) and fruit tree expansion periods (L2) were taken as two periods of land use patterns, whereas pre-change climatic conditions (C1) and post-change climatic conditions (C2) were taken as two climatic patterns. We obtained four scenarios by combining the above four patterns, as detailed in Table 4.
1. S1 (L1 land use and C1 climatic conditions).
2. S2 (L2 land use and C1 climatic conditions).
3. S3 (L1 land use and C2 climatic conditions).
4. S4 (L2 land use and C2 climatic conditions).
4. Results
4.1. Model performance
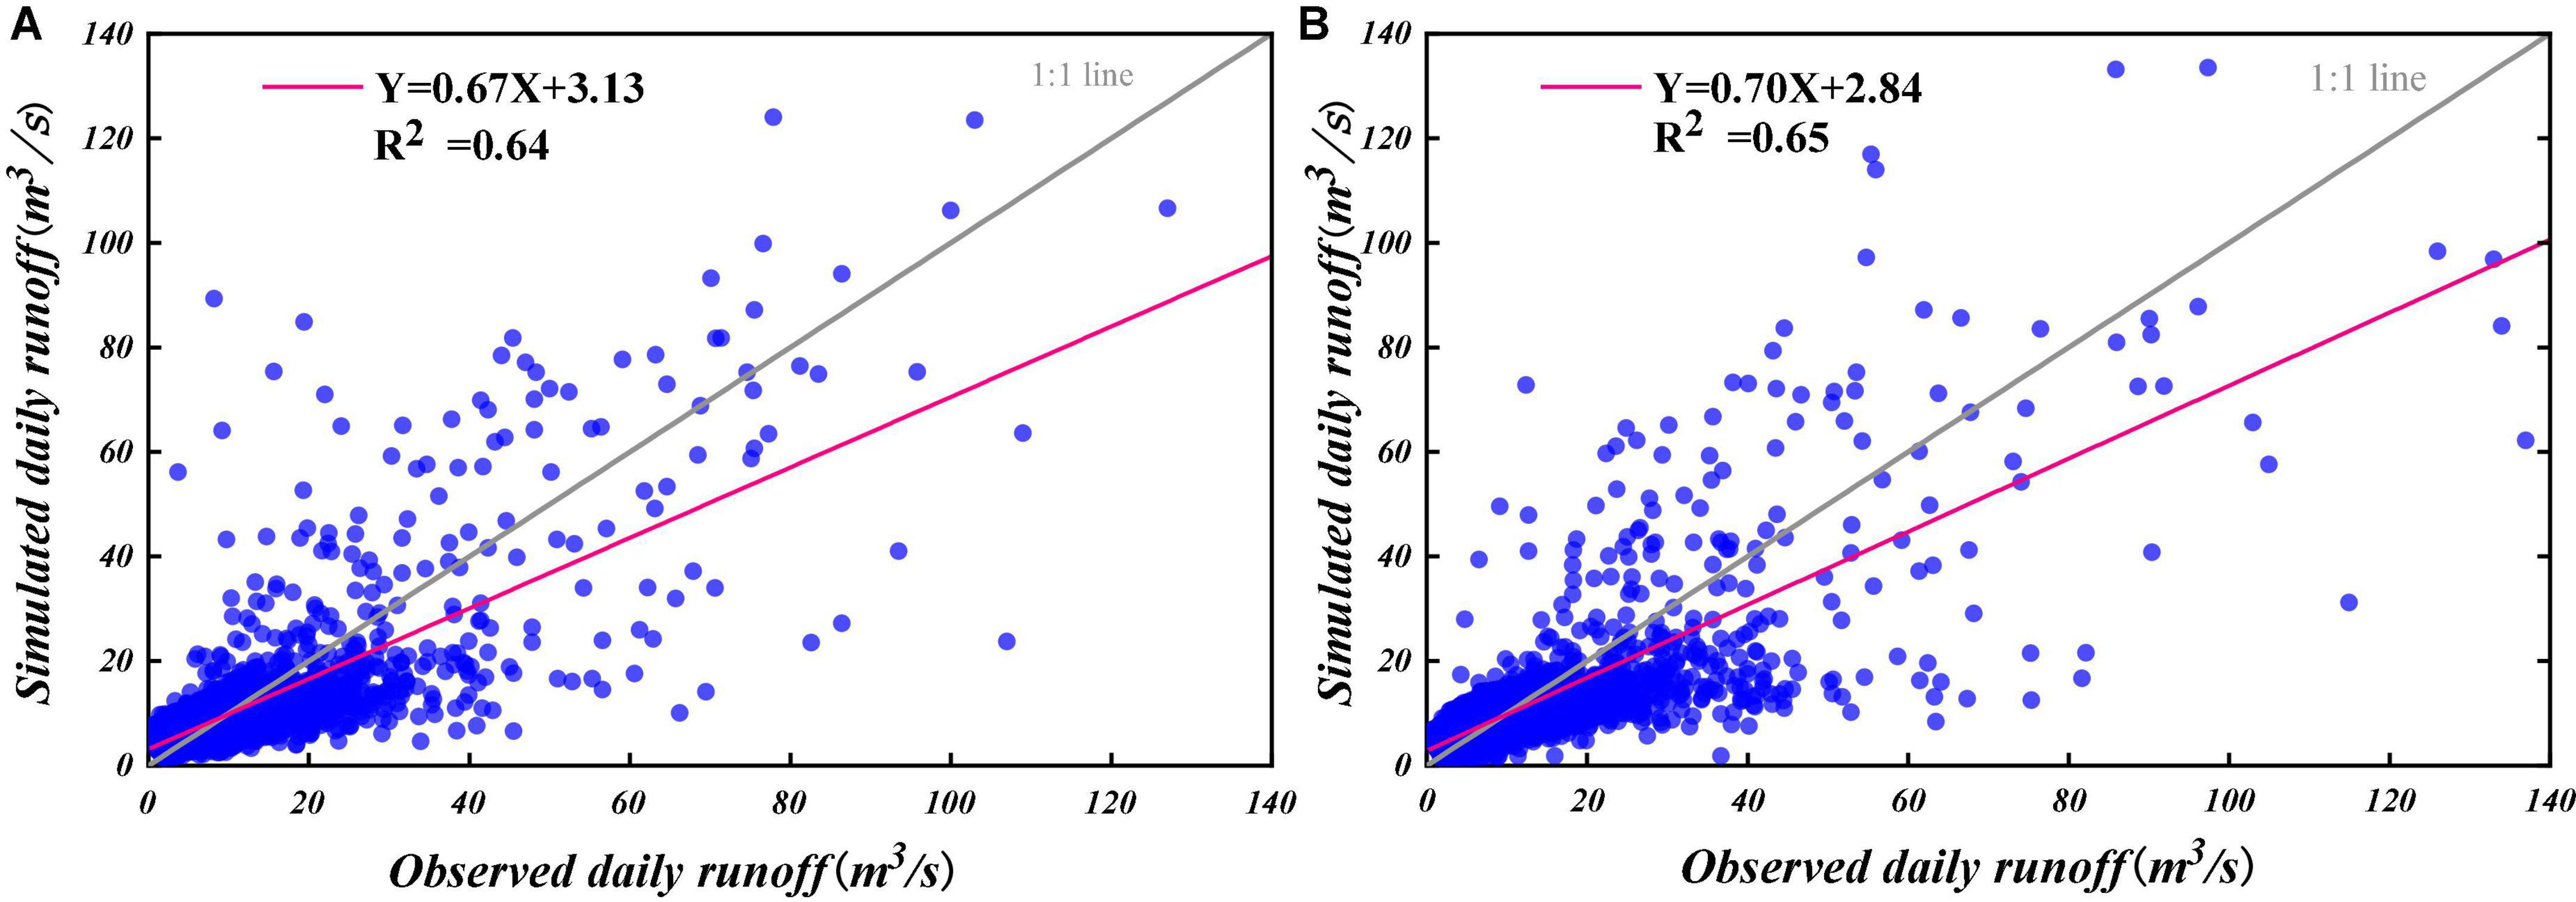
The daily scale SWAT model established that the simulation of runoff by the model had distinct overestimations and underestimations at peak locations (Figure 7). The simulated and measured values were mainly concentrated around the 1:1 line by comparing each point (Figure 8). In the calibration period, SWAT model’s correlation coefficient R2, NSE, and percentage error (PBIAS) were 0.64, 0.64, and −4.3%. These values were 0.65, 0.65, and −0.58% in the validation period (Table 5). According to the evaluation standard of Moriasi et al. (2007) for hydrological models, this study established SWAT models in a reasonable range. Therefore, it still well reflected the hydrological relationship between rainfall and runoff in the watershed, which can be used to simulate hydrological processes in our study area. Optimal parameters, model parameter ranges, and parameter sensitivity rankings are shown in Table 6.
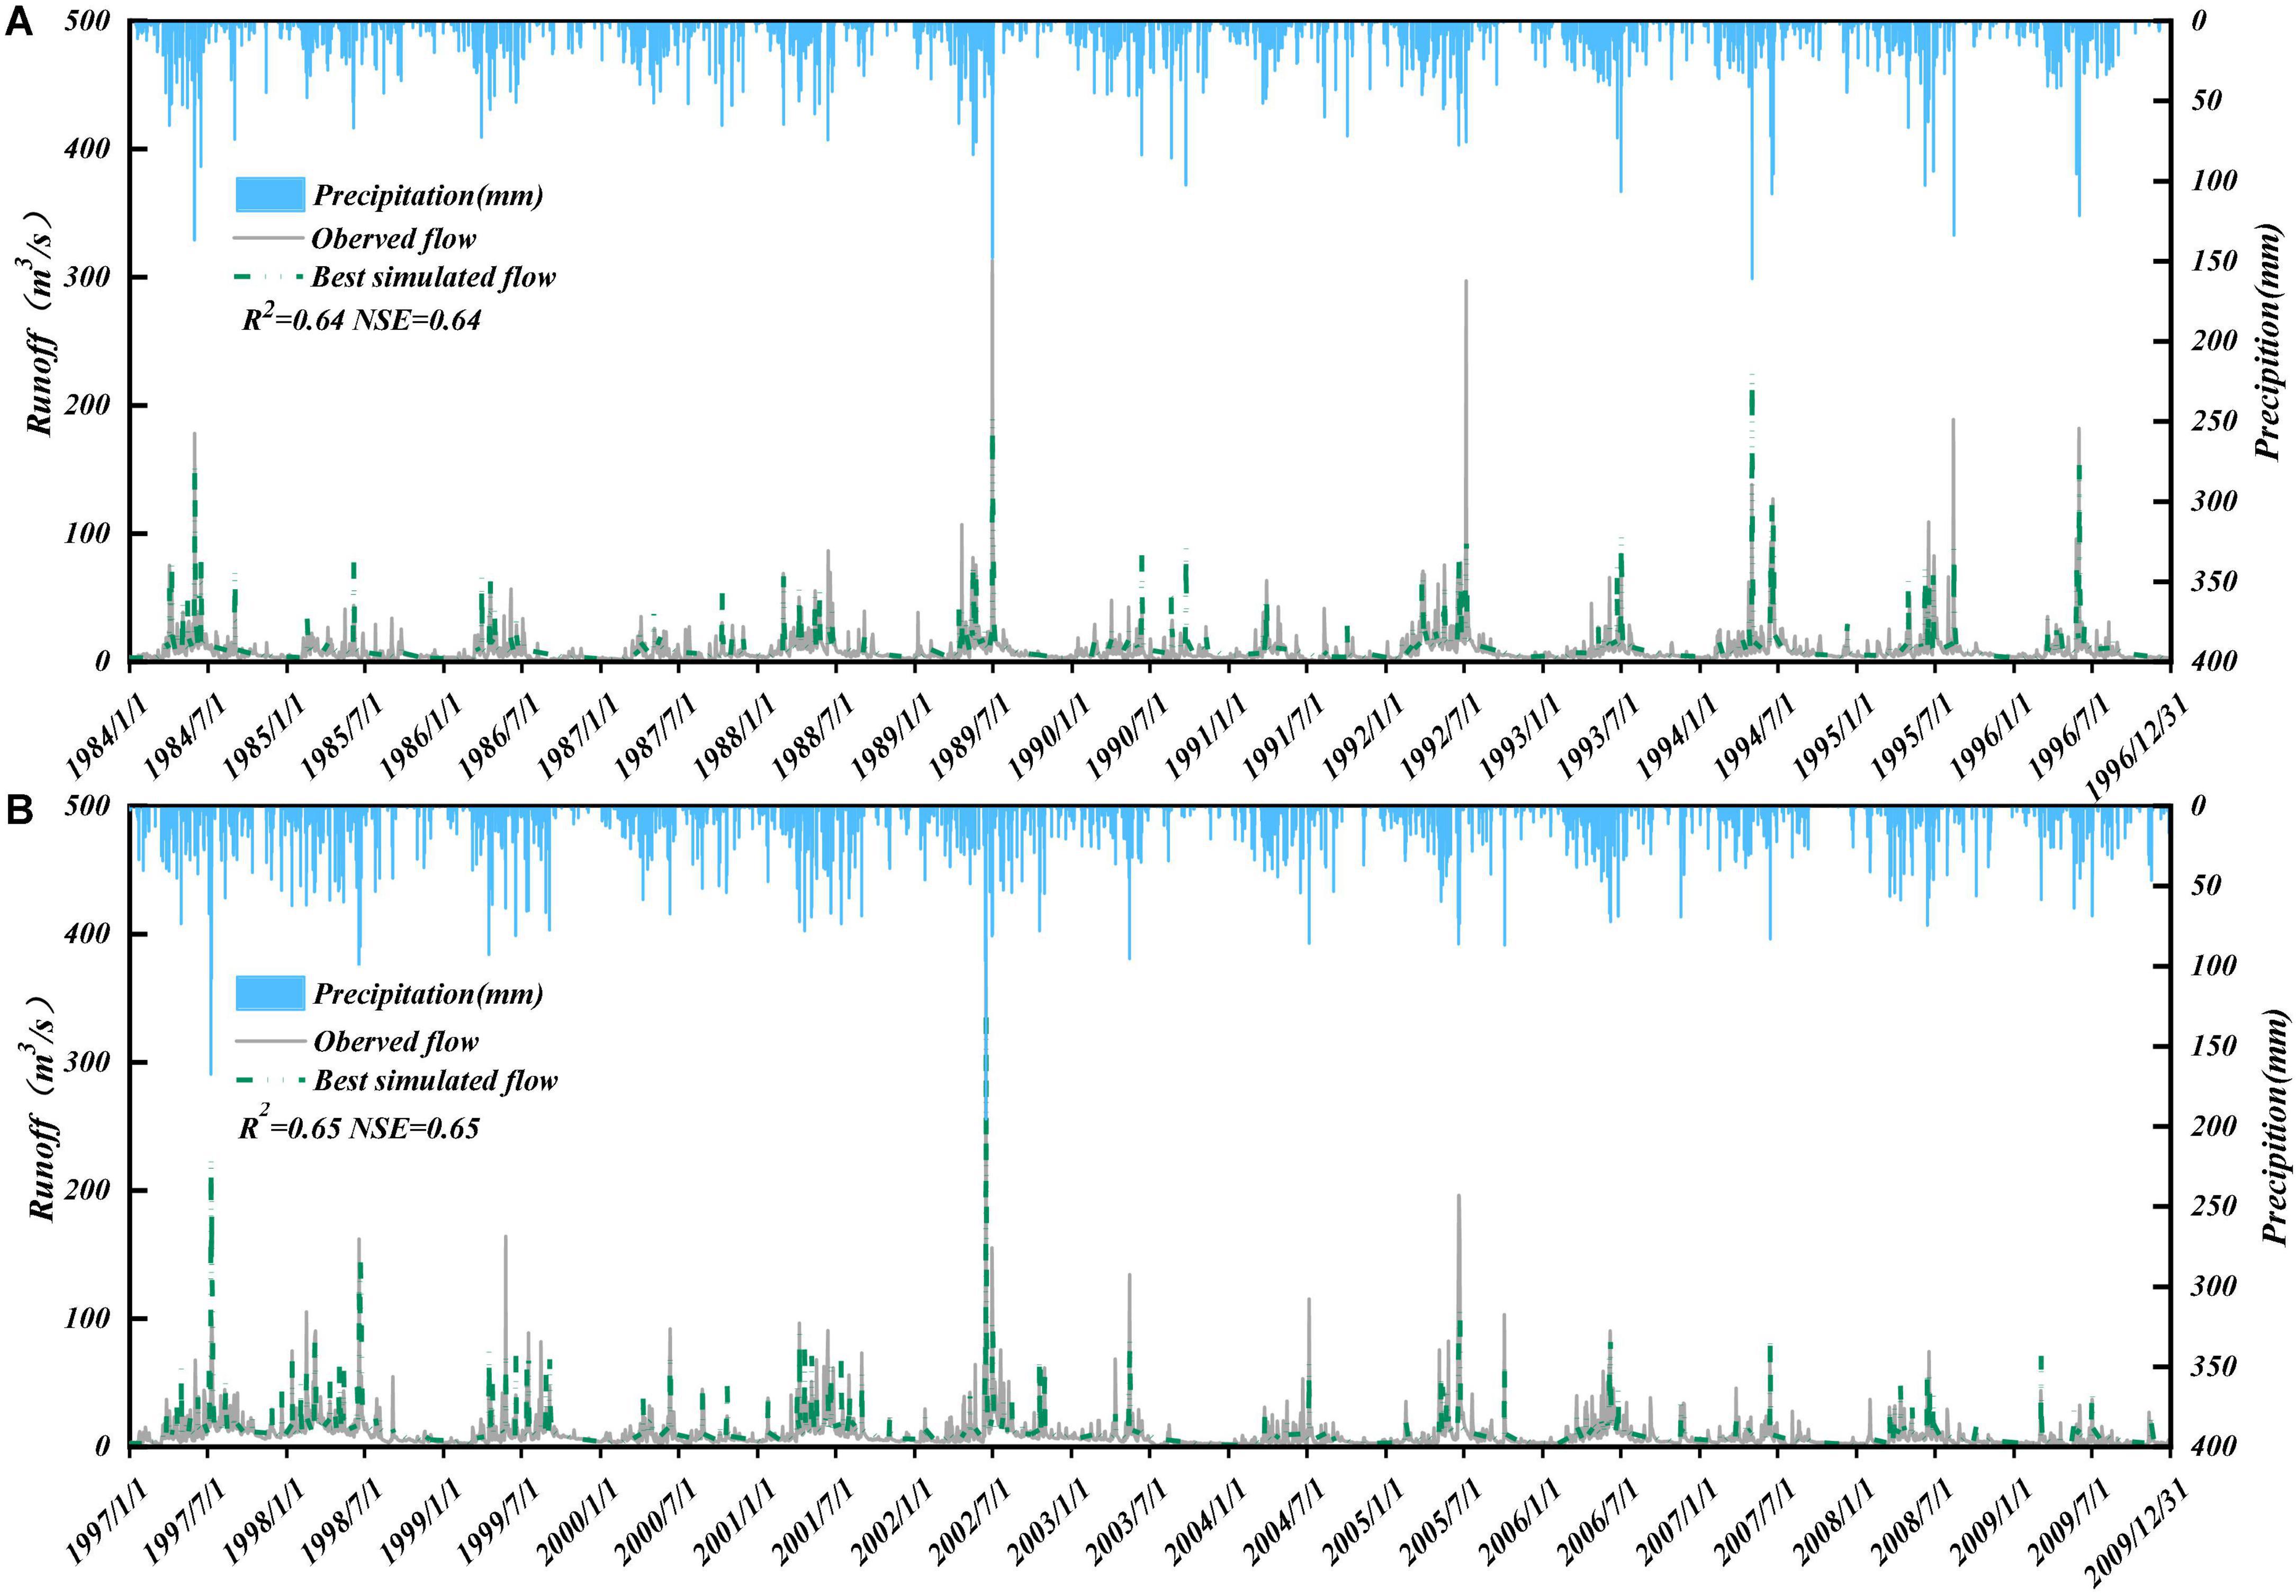
Figure 7. The Shuangtian hydrological station’s calibration period (A) and validation period (B) time series of simulated and observed data.

Table 5. Evaluation of the Jiujushui watershed’s SWAT model’s accuracy and reliability during calibration and validation.
4.2. Effects of climate change and fruit tree expansion on key hydrological components at the whole basin scale
4.2.1. Impact of climate change on key hydrological components
The effects of climate change on key hydrological components were separated using Equations 10–12. As shown in Figure 9 compared with the baseline period (S1), the change in climatic factors (average temperature increased by 0.5°C) reduced water yield, surface runoff, underground runoff, infiltration, and soil water by 6.75, 0.37, 5.91, 6.01, and 0.04 mm, respectively, and increased evapotranspiration by 6.41 mm.
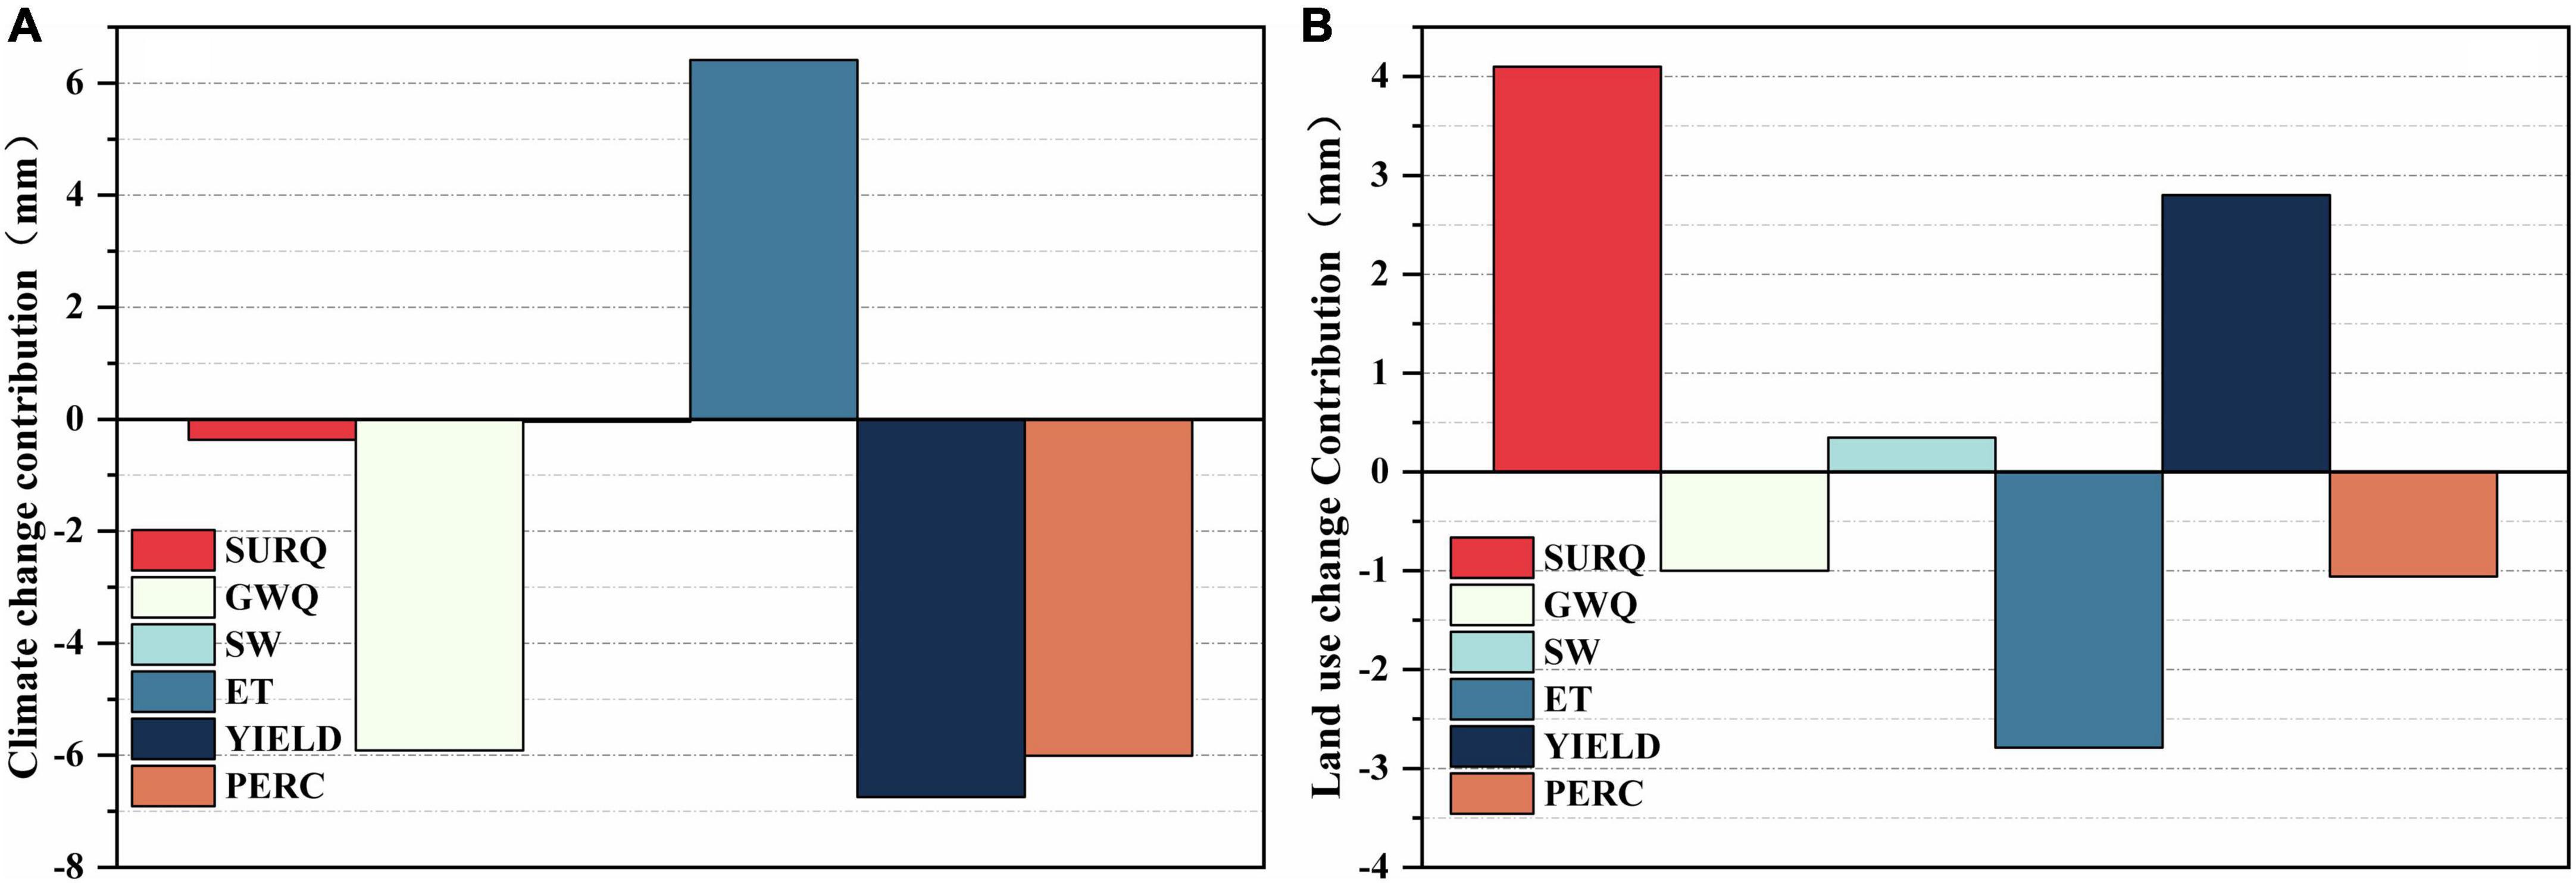
Figure 9. Contribution of (A) climate change and (B) LUCC to key hydrological components. SURQ represents surface runoff, GW represents underground runoff, SW represents soil moisture, YIELD represents water yield, PERC represents infiltration; ET represents evapotranspiration.
4.2.2. Effects of fruit tree expansion on key hydrological components
Similarly, the impact of fruit tree expansion on hydrological processes was separated. Based on Figure 9, compared with the baseline period (S1), fruit tree expansion increased water yield, surface runoff, and soil water by 2.81, 4.10, and 0.35 mm, respectively, while decreased evapotranspiration, underground runoff, and infiltration by 2.79, 1, and 1.06 mm, respectively.
4.3. Impacts of climate change and fruit tree expansion on key hydrological components at the sub-basin scale
4.3.1. Impact of climate change on key hydrological components
In our research, the SWAT model was divided into 13 sub-basins and 322 hydrological response units according to the characteristics of the basin. A response intensity distribution map of key hydrological components to climate change at the sub-basin scale was drawn through the previous (10–12) formulae, combined with the GIS and output results of SWAT models (Figure 10). The response direction (increase or decrease) of key hydrological components to climate change at the sub-basin scale was consistent with the response direction of the whole basin scale, but the response intensity between sub-basins differed. Overall, the response of the key hydrological components downstream was stronger than upstream. Compared with the baseline period (S1), climate change reduced water yield, surface runoff, underground runoff, infiltration, and soil water by 6.42–6.53, 0.34–0.36, 5.60–5.79, 5.66–5.85, and 0.003–0.04 mm, respectively, and increased evapotranspiration by 6.10–6.20 mm upstream (sub-basins 9, 11, and 12), but downstream (sub-basins 5, 6, and 8), water yield, surface runoff, underground runoff, infiltration, and soil water decreased by 7.16–7.55, 0.10–0.32, 6.47–7.06, 6.21–7.18, and 0.03–0.06 mm, respectively, and increased evapotranspiration by 6.58–7.53 mm.
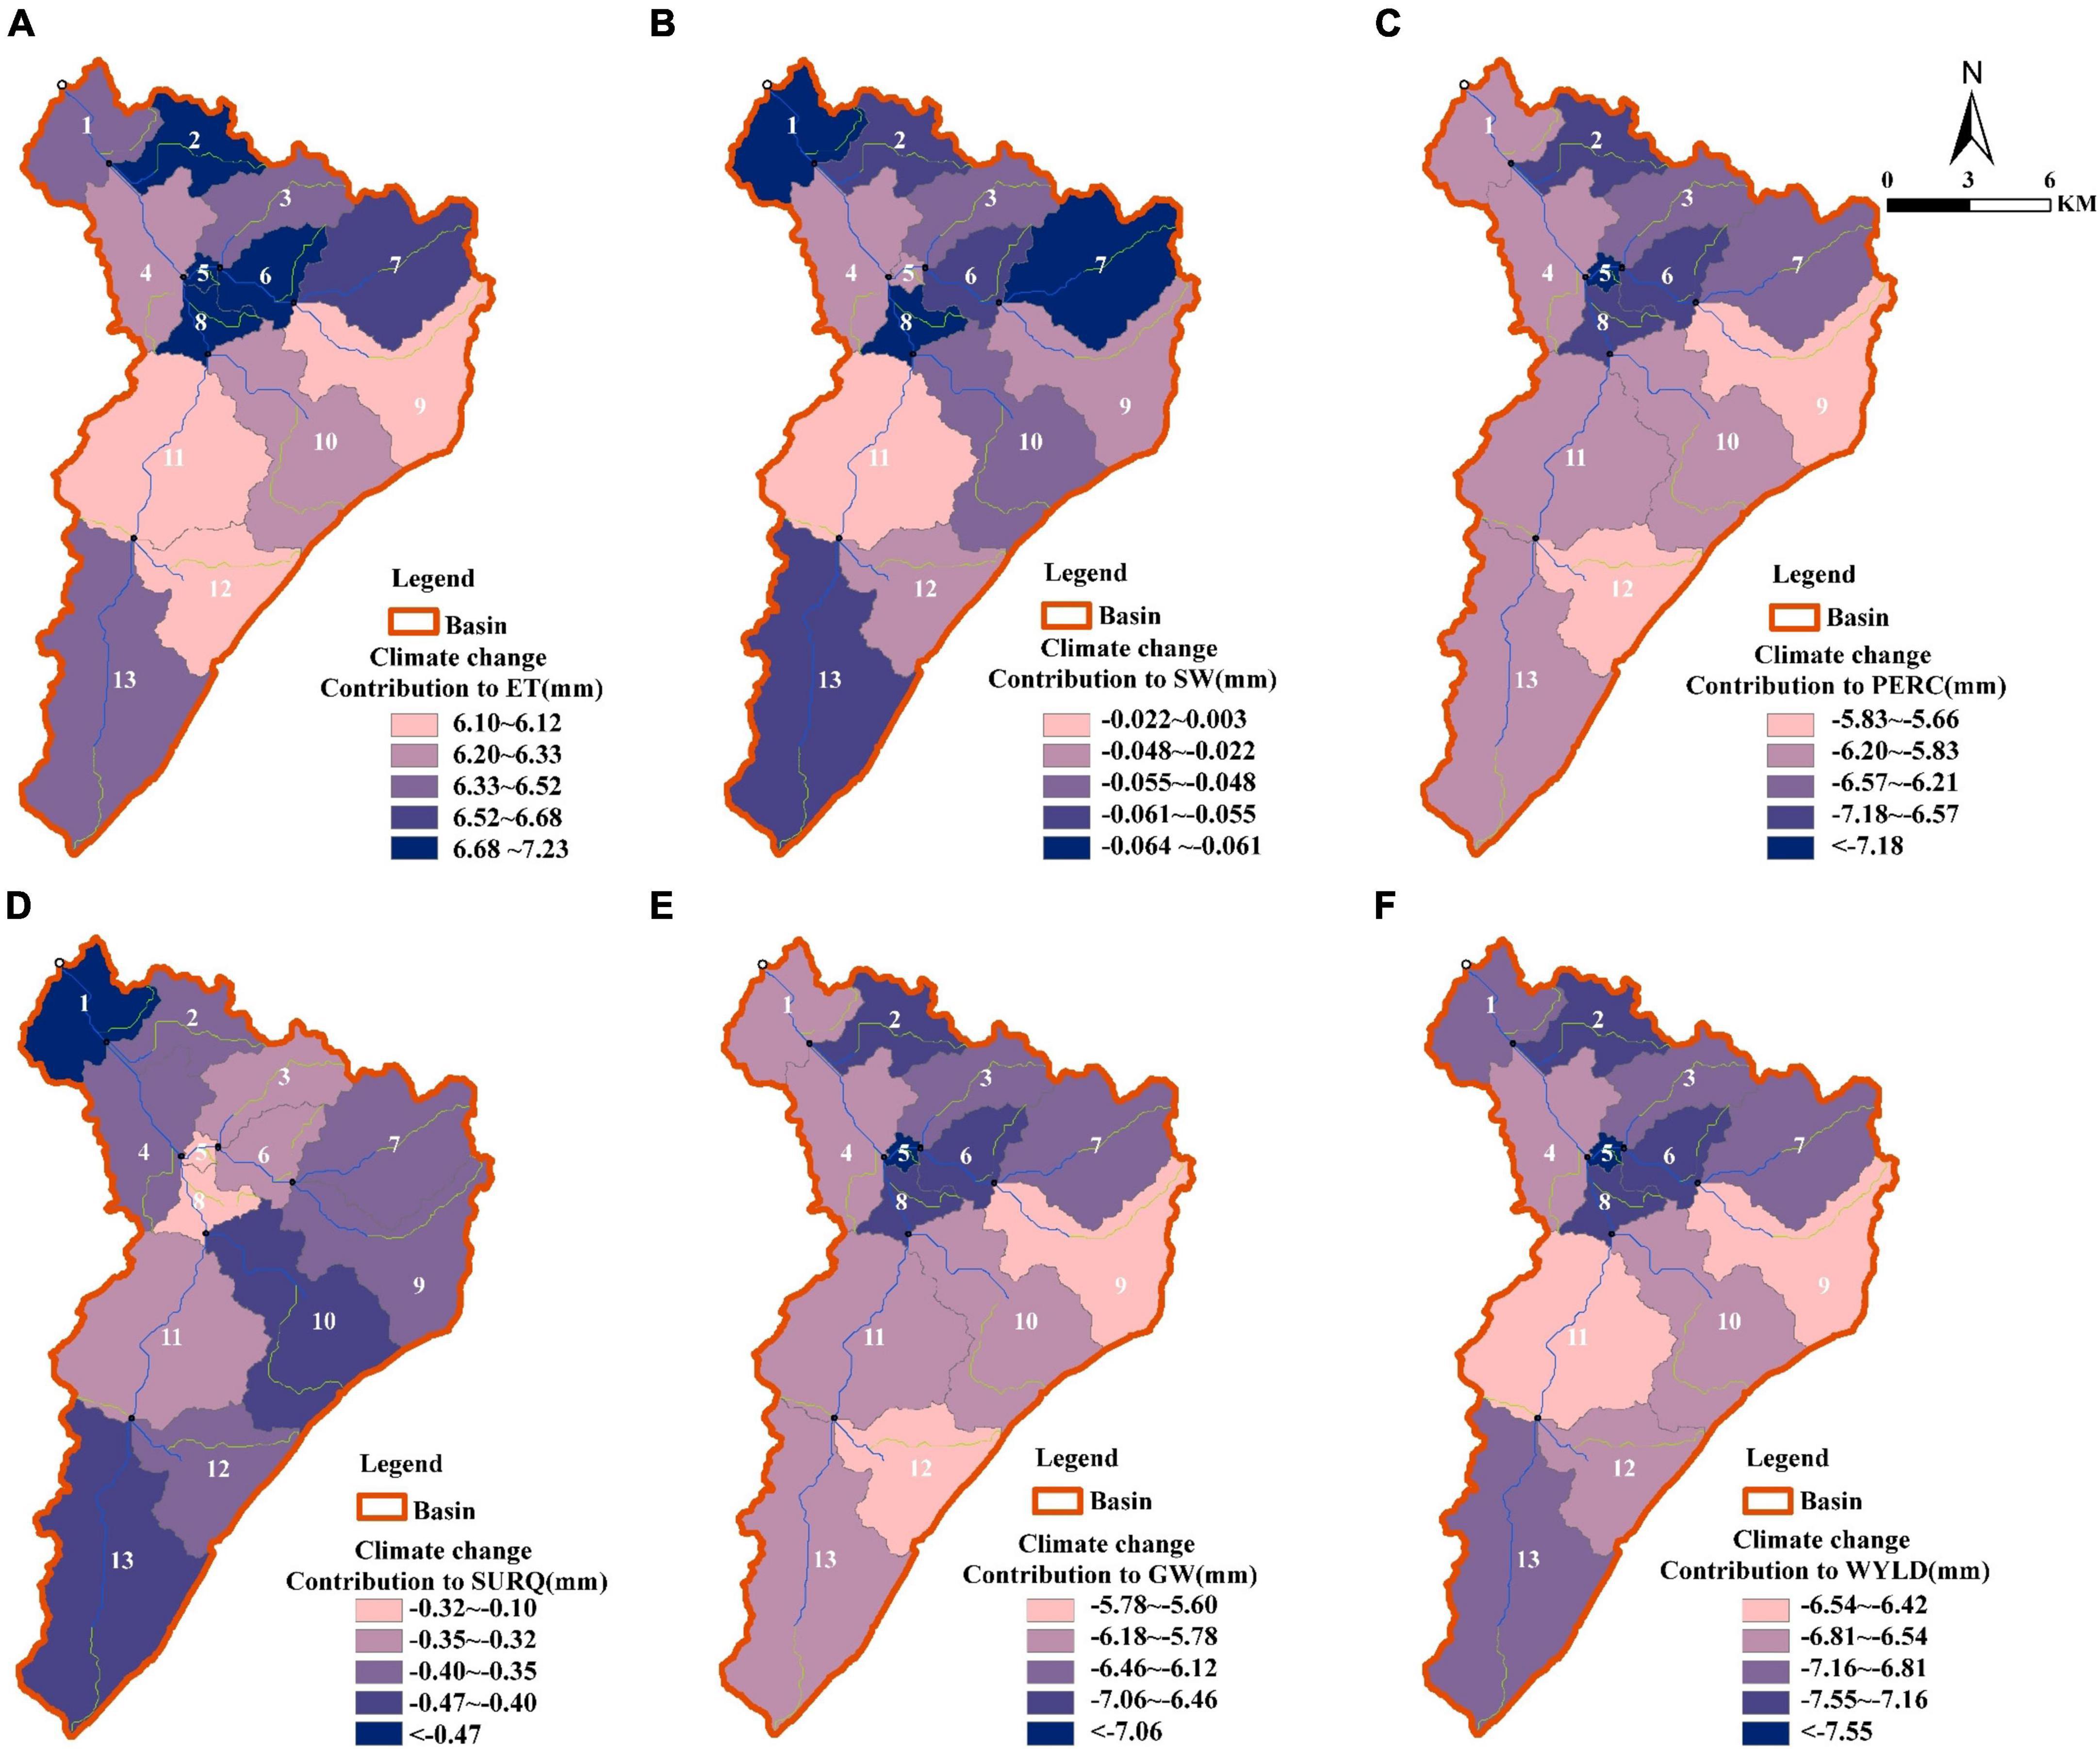
Figure 10. Response intensity distribution of key hydrological components to climate change at subbasin scale. (A) Evapotranspiration; (B) soil water; (C) infiltration; (D) surface runoff; (E) underground runoff; (F) water yield.
4.3.2. Effects of fruit tree expansion on key hydrological components
Similarly, we mapped the response intensity of the key hydrological components to fruit tree expansion on the sub-basin scale (Figure 11), showing that each sub-basin also exhibited different response intensities to fruit tree expansion and that the response direction (increasing or decreasing) of the key hydrological components was different from the response direction at the whole basin scale. Overall, (1) the response of the key hydrological components downstream was more robust than that upstream. Compared with the baseline period (S1), fruit tree expansion reduced water yield, underground runoff, infiltration, and soil water by 1.01–1.16, 4.24–6.13, 4.46–6.43, and 0.05–0.16 mm, respectively, and increased evapotranspiration and surface runoff by 0.97–1.15 and 4.10–6.55 mm, respectively, upstream (sub-basins 9 and 12). However, downstream (sub-basins 5 and 8), water yield, surface runoff, underground runoff, infiltration, and soil water increased by 12.86–21.99, 7.49–13.77, 5.30–7.67, 5.64–8.11, and 1.51–2.53 mm, respectively, while evapotranspiration decreased by 12.87–22 mm. (2) The hydrological components’ response directions in the sub-basins differed from the whole basin scale. Upstream (sub-basins 9 and 12), surface runoff, underground runoff, and infiltration had a consistent response direction with the whole basin, but water yield, soil water, and evapotranspiration had the opposite response direction with the whole basin. Downstream (sub-basins 5 and 8), water yield, surface runoff, soil water, and evapotranspiration had a consistent response direction with the whole basin. However, underground runoff and infiltration had the opposite response direction with the whole basin.
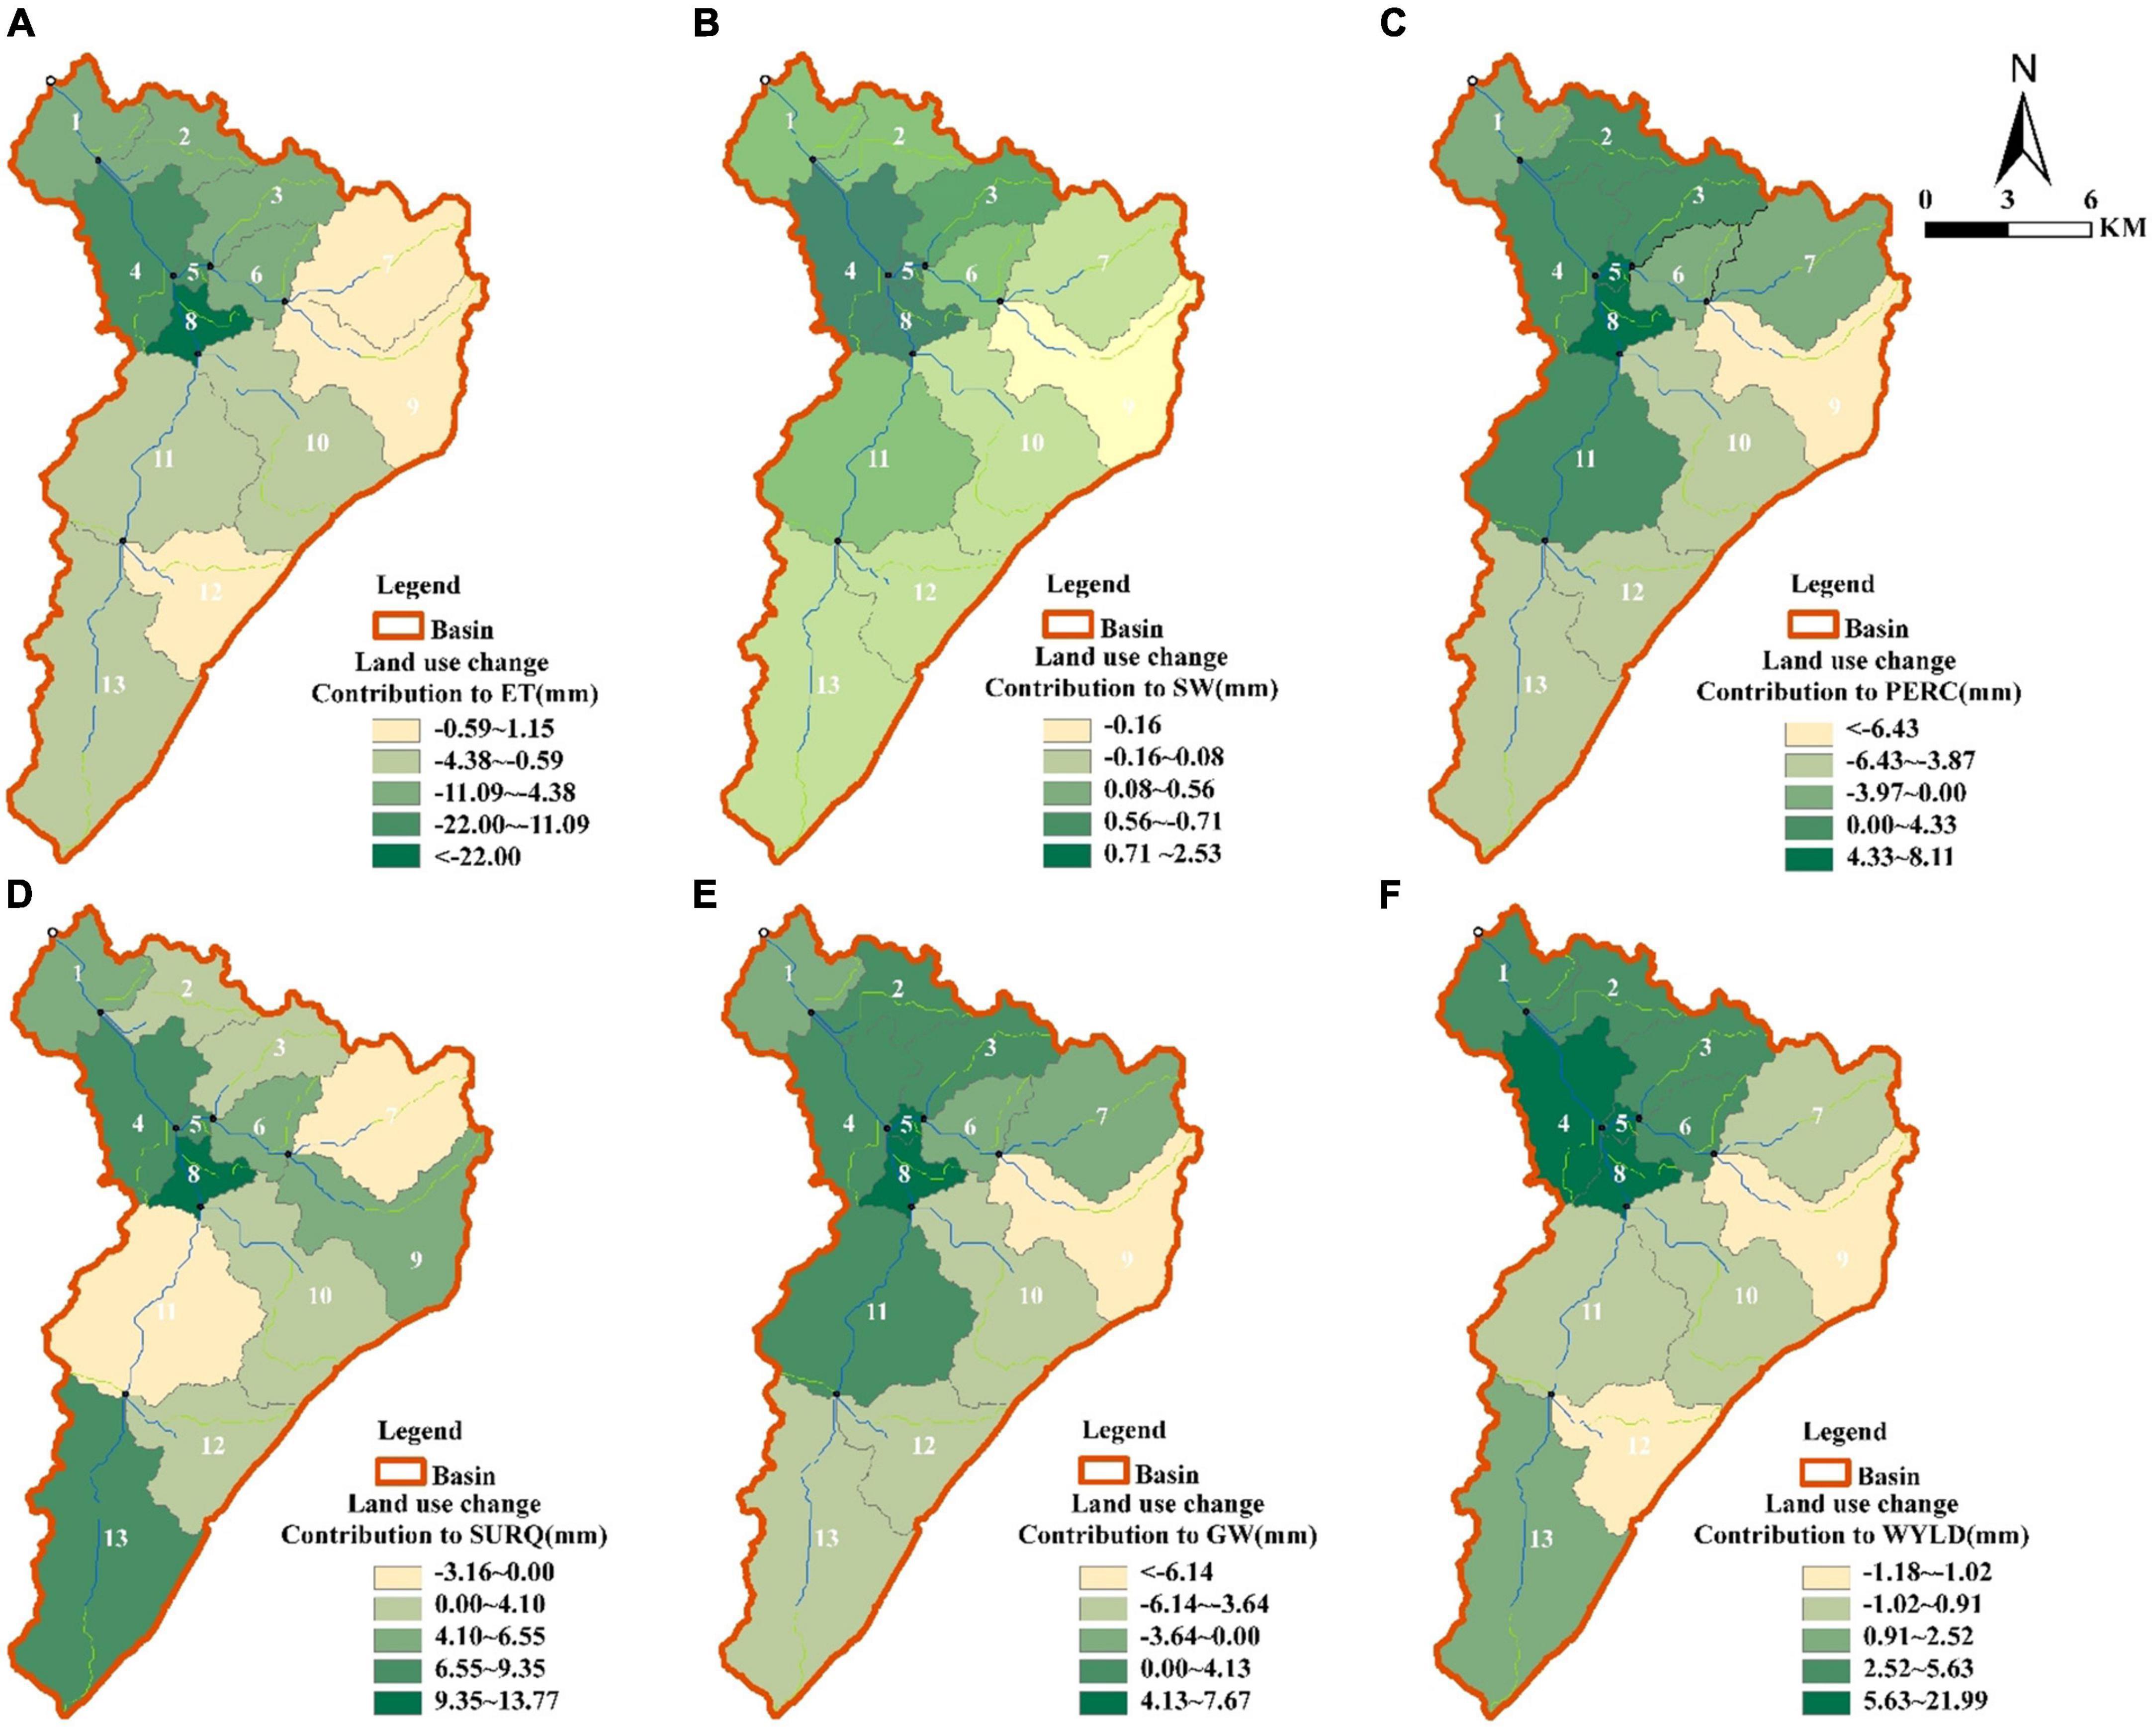
Figure 11. Response intensity distribution of key hydrological components to land use change at subbasin scale. (A) Evapotranspiration; (B) soil water; (C) infiltration; (D) surface runoff; (E) Underground runoff; (F) water yield.
5. Discussion
At the whole basin scale, the response of water yield and evapotranspiration to climate change (average temperature increase of 0.5°C) in the humid area investigated in this study was as follows: compared with the baseline period (S1), water yield decreased by 0.61%, and evapotranspiration increased by 1.06%. The magnitude of the water yield response was similar to that reported by Chen et al. (2022), with a 0.58% reduction in water yield for a temperature increase of 1°C in the Maoershan basin of Guangxi in the humid region. In contrast, the magnitude of the water yield was significantly smaller than that of Shi et al. (2016), with a 2.59% reduction in water yield for a temperature increase of 1°C in the Luan River basin, in the semi-humid zone, and Zhang et al. (2013), with a 12% reduction in water yield for a temperature increase of 1°C upstream of the Jing River, in the arid region. In addition, the magnitude of the effect of a temperature increase of 1°C on the evapotranspiration in the Maoershan basin in the humid region, in the Luan River basin in the semi-humid region, and the upstream Jing River in the arid zone showed increases in 1.65, 0.65, and 1.5%, respectively. In summary, the increase in temperature will lead to a decrease in water yield and an increase in evapotranspiration, and the magnitude of change is quite different from that in different climate zones.
Across the watershed (whole basin), the primary conversion pattern was shrubland and sparse-wood (natural forest) covering a fruit tree (artificial forest) (61.49%) in our study, which may reduce the leaf area index, causing evapotranspiration to weaken (Yang et al., 2014; Truong et al., 2022). In addition, the expansion of fruit trees in this study led to increased surface runoff and reduced underground runoff and infiltration in the watershed (whole basin), due to ground disturbances (e.g., land preparation, removing litterfall or vegetation) in planting fruit trees. Those disturbances not only reduced the roughness of the ground surface but also destroyed the forest understorey’s water retention capacity, resulting in more rainfall being directly converted into surface runoff (Schellekens et al., 2007; Pathak et al., 2013; Huang et al., 2015). To our surprise, each sub-basin has different vegetation conversion patterns, resulting in inconsistent hydrological effects among the sub-basins. For example, the main vegetable converting patterns of cropland to the fruit tree in the downstream (such as sub-basins 5 and 8), which led to an increase in water yield by 12.86–21.99 mm, which is consistent with Wang et al. (2017) study of the hydrological effects of converting cropland to the forest. In the upstream (sub-basins 9 and 12), there were multiple vegetation type conversions (e.g., grassland to fruit forest and natural to fruit forest). Therefore, to some extent, multiple vegetation types are converted to produce a mutual offsetting effect so that the final effect is weakened or inversed (Rodriguez et al., 2010; Lu et al., 2016). The hydrological effects of each sub-basin are superimposed to constitute the hydrological effects of the watershed (whole basin). Therefore, the difference in the hydrological effect of different sub-basins may eventually weaken the hydrological effect of the whole basin.
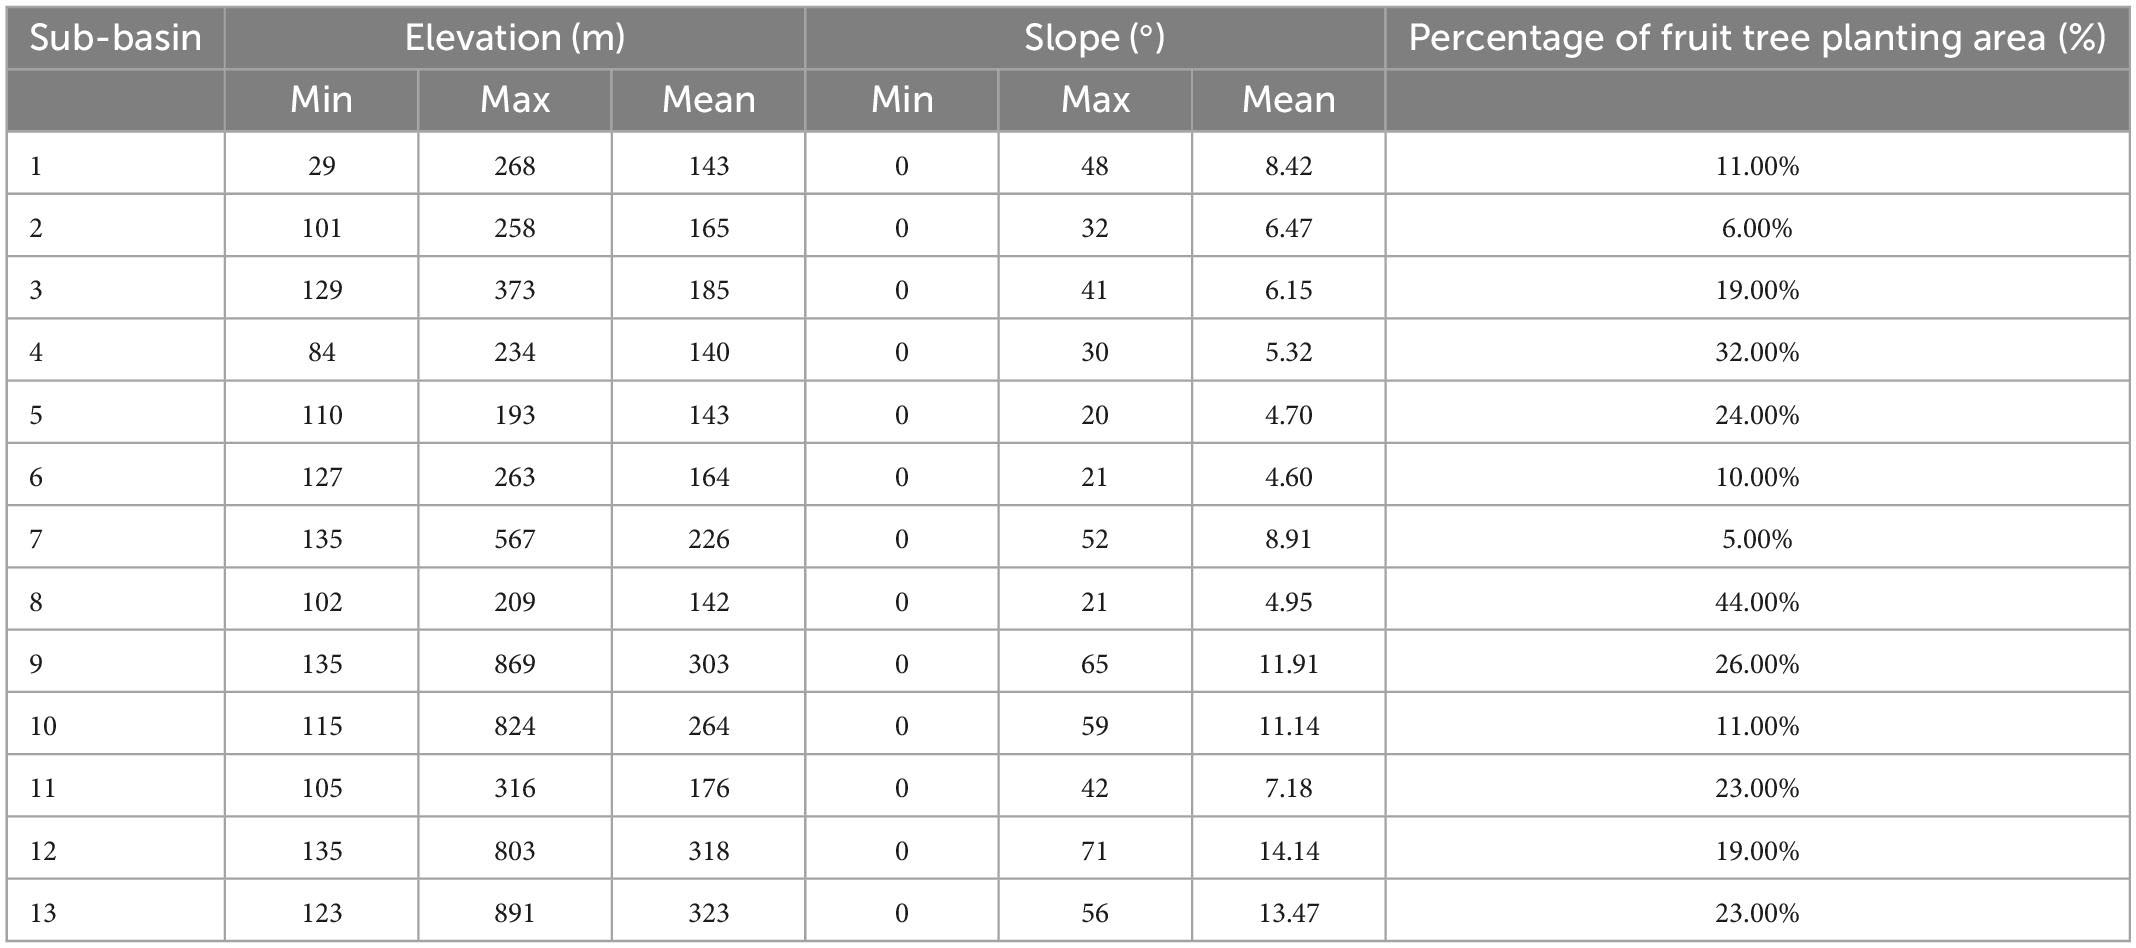
Watersheds can buffer changes caused by disturbances (e.g., changes in vegetation type) (Zhang and Wei, 2012). A hypothetical threshold of disturbance level must exist below which the impacts of disturbance on hydrology may not be significant. The terrain, vegetation, geology, and climate of a watershed all play a role in determining the threshold. For example, in the Appalachian Mountains of the United States, the mean annual runoff changed significantly with only a 10% reduction in forest cover (Swank et al., 1988), while in the Central United States, a 50% harvest might be required for a significant change in mean annual runoff (Stednick, 1996). Downstream of this study area, the percentage change in vegetation area (fruit forest) in sub-basins 5 and 8 was 24 and 44%, respectively, which were mainly from cropland to fruit forest, and the relatively significant change in vegetation area may explain the more robust response in basins 5 and 8 (Table 7).
Kirkby et al. found that steeper slopes generally had thinner soils. Therefore, vegetation became sparer so that the plant and litter interception also tended to decrease with slope resulting in the decrease of water retention ability (Kirkby et al., 2002). In addition, steep slopes reinforced the drainage performance of the watershed (Beven and Kirkby, 1993; Bull et al., 2000). In this study, the upstream slope (sub-basins 9 and 12, 11.91° ≤ slope ≤ 14.14°) was significantly steeper than the downstream (sub-basins 5 and 8, 4.70° ≤ slope ≤ 4.95°), which means that the upstream had a higher runoff velocity and lower water retention capacity than the downstream. So that under the fruit tree expansion scenario, runoff continues to accumulate downstream at the expense of upstream losses, eventually leading to a significant increase in downstream water yield, surface runoff, and underground runoff (Table 7). Similarly, under the climate change scenario, downstream (sub-basins 5, 6, and 8) changes were more significant than upstream (sub-basins 9, 11, and 12). However, it is interesting to note that surface runoff presents a different response intensity than the other hydrological components. The main reason can be attributed to the flat slope and lower terrain conditions in the downstream, which allows more groundwater to supplementary to the surface runoff to compensate for evaporation loss (Fu et al., 2022).
6. Uncertainty of the results of this study
The uncertainty of the model is mainly caused by the limitations of the model algorithm and parameters, as it is challenging to evaluate the hydrological impact of climate and land-use change in large watersheds. In this study, the SWAT model performed well. However, it is presumed that changes in hydrological components were influenced only by land use change and climate change due to uncertainty in the model’s description of the interaction of both. These changes alone drove the effect, and with both together, they drove the cumulative sums slightly differently. Although the method of Yang et al. (2017) was used to eliminate the cumulative sum of climate and land use changes, which was not 100%, this reduced uncertainty to some extent but did not eliminate it. In addition, the meteorological data used in this study were obtained by spatial interpolation of multiple meteorological stations around the basin through Anusplin software. The basin center was used as the basin meteorological station. Under these conditions, the expression of spatial precipitation variability was poor, resulting in uncertainty in the runoff simulation results. Furthermore, this study obtained data that were not sufficiently precise, and high-precision data were a key factor in reducing model uncertainty (Masih et al., 2011; Pierini et al., 2014; Qiao et al., 2015; Shope and Maharjan, 2015). Also, this study did not consider the coupling effects between warming and wind speed, precipitation, and other meteorological factors, which may increase some uncertainties (Trenberth, 2011; Wu et al., 2016).
7. Conclusion
In our study, the SWAT hydrological model was set up to explore the effects of climate change and fruit tree expansion on key hydrological components (water yield, surface runoff, underground runoff, soil water, evapotranspiration, and infiltration) in the Jiujushui watershed at different scales by combining historical meteorological data, measured flow data, land use data and soil data. This finding shows that the effects of fruit tree expansion and climate change on hydrological components had different magnitudes and response characteristics at different watershed scale. Hence, land use change patterns in the forested watershed should be carefully considered (especially the expansion of fruit trees in our study area), which may cause a series of knock-on effects that ultimately increase the risk to water resources (e.g., a surge in water yield downstream in our research). These results indicate that it is not accurate to evaluate the hydrological effects of forest and climate change only by focusing on the changes in the watershed outlet.
Data availability statement
The original contributions presented in this study are included in the article/supplementary material, further inquiries can be directed to the corresponding author.
Author contributions
YX: conceptualization, methodology, software, investigation, data curation, and writing—original draft. WL: writing—reviewing, editing, and methodology. HF: writing—reviewing and supervision and methodology. FS, DS, HD, and WC: writing—reviewing. JW and WQ: data curation. PL: supervision and methodology. All authors contributed to the article and approved the submitted version.
Funding
This work was supported by the National Natural Science Foundation of China (31660234).
Conflict of interest
The authors declare that the research was conducted in the absence of any commercial or financial relationships that could be construed as a potential conflict of interest.
Publisher’s note
All claims expressed in this article are solely those of the authors and do not necessarily represent those of their affiliated organizations, or those of the publisher, the editors and the reviewers. Any product that may be evaluated in this article, or claim that may be made by its manufacturer, is not guaranteed or endorsed by the publisher.
Footnotes
References
Abbaspour, K. C. (2015). SWAT calibration and uncertainty programs–a user manual. Duebendorf: Swiss Federal Institute of Aquatic Science and Technology, Eawag, 17–66.
Andréassian, V. (2004). Waters and forests: From historical controversy to scientific debate. J. Hydrol. 291, 1–27. doi: 10.1016/j.jhydrol.2003.12.015
Arnold, J. G., Srinivasan, R., Muttiah, R. S., and Williams, J. R. (1998). Large area hydrologic modeling and assessment part I: Model development 1. JAWRA 34, 73–89. doi: 10.1111/j.1752-1688.1998.tb05961.x
Arrigo, J. A. S., and Salvucci, G. D. (2005). Investigation hydrologic scaling: Observed effects of heterogeneity and nonlocal processes across Hillslope, watershed, and regional scales. Water Resour. Res. 41:W11417. doi: 10.1029/2005WR004032
Attaur, R., and Dawood, M. (2016). Spatio-statistical analysis of temperature fluctuation using Mann–Kendall and Sen’s slope approach. Clim. Dyn. 48, 783–797. doi: 10.1007/s00382-016-3110-y
Bart, R., and Hope, A. (2010). Streamflow response to fire in large catchments of a Mediterranean-climate region using paired-catchment experiments. J. Hydrol. 388, 370–378. doi: 10.1016/j.jhydrol.2010.05.016
Bull, L. J., Kirkby, M. J., and Shannon, J. (2000). The impact of rainstorms on floods in ephemeral channels in southeast Spain. Catena 38, 191–209. doi: 10.1016/S0341-8162(99)00071-5
Buttle, J. M., and Metcalfe, R. A. (2000). Boreal forest disturbance and streamflow response, northeastern Ontario. Can. J. Fish. Aquat. Sci. 57(Suppl. 2), 5–18. doi: 10.1139/f00-107
Chen, X. M., Zhai, R. X., Yang, Y., and Xue, K. Y. (2022). Response of ecohydrological processes in artificial bamboo forest to climate change. Res. Soil Water Conserv. 29, 189–196+204. doi: 10.13869/j.cnki.rswc.2022.03.008
Croke, J., Hairsine, P., and Fogarty, P. (1999). Sediment transport, redistribution and storage on logged forest hillslopes in south-eastern Australia. Hydrol. Process. 13, 2705–2720. doi: 10.1002/(SICI)1099-1085(19991215)13:17<2705::AID-HYP843<3.0.CO;2-Y
Crouzeilles, R., and Curran, M. (2016). Which landscape size best predicts the influence of forest cover on restoration success? A global meta-analysis on the scale of effect. J. Appl. Ecol. 53, 440–448. doi: 10.1111/1365-2664.12590
Duan, L. X., Huang, M. B., and Zhang, L. D. (2016). Differences in hydrological responses for different vegetation types on a steep slope on the Loess Plateau, China. J. Hydrol. 537, 356–366. doi: 10.1016/j.jhydrol.2016.03.057
Duveiller, G., Hooker, J., and Cescatti, A. (2018). The mark of vegetation change on Earth’s surface energy balance. Nat. Commun. 9:679. doi: 10.1038/s41467-017-02810-8
Fearnside, P. M., Lashof, D. A., and Moura-Costa, P. (2000). Accounting for time in mitigating global warming through land-use change and forestry. Mitig. Adapt. Strateg. Glob. Change 5, 239–270.
Ferraz, S. F. B., Rodrigues, C. B., Garcia, L. G., Peña-Sierra, D., Fransozi, A., and Ogasawara, M. E. K. (2021). How do management alternatives of fast-growing forests affect water quantity and quality in southeastern Brazil? Insights from a paired catchment experiment. Hydrol. Process. 35:e14317. doi: 10.1002/hyp.14317
Filoso, S., Bezerra, M. O., Weiss, K. C., and Palmer, M. A. (2017). Impacts of forest restoration on water yield: A systematic review. PLoS One 12:e0183210. doi: 10.1371/journal.pone.0183210
Fu, D., Jin, X., Jin, Y. X., Mao, X. F., and Zhai, J. Y. (2022). Modelling of the surface-ground water exchange yield in Zelinggou Basin, middle reaches of the Bayin River based on SWAT-MODFLOW coupled model. Sci. Geogr. Sin. 42, 1124–1132. doi: 10.13249/j.cnki.sgs.2022.06.018
Hamed, K. H. (2008). Trend detection in hydrologic data: The Mann–Kendall trend test under the scaling hypothesis. J. Hydrol. 349, 350–363. doi: 10.1016/j.jhydrol.2007.11.009
Hayati, E., Abdi, E., Saravi, M. M., Nieber, J. L., Majnounian, B., and Chirico, G. B. (2018). Soil water dynamics under different forest vegetation cover: Implications for hillslope stability. Earth Surf. Process. Landf. 43, 2106–2120. doi: 10.1002/esp.4376
Hisdal, H., Stahl, K., Tallaksen, L. M., and Demuth, S. (2001). Have streamflow droughts in Europe become more severe or frequent? Int. J. Climatol. 21, 317–333. doi: 10.1002/joc.619
Holl, K. D., and Brancalion, P. H. S. (2020). Plantio De Árvores Não É Uma Solução Simples. Science 368, 580–581. doi: 10.1126/science.aba8232
Huang, Q., He, B. H., and Qin, W. (2015). The infiltration characteristics of disturbed soil under natural rainfall conditions. Irrig. Drain. Eng. 34, 91–95.
Huff, D. D., Hargrove, B., Tharp, M. L., and Graham, R. (2000). Managing forests for water yield: The importance of scale. J. For. 98, 15–19. doi: 10.1093/jof/98.12.15
Iroumé, A., Jones, J., and Bathurst, J. C. (2021). Forest operations, tree species composition and decline in rainfall explain runoff changes in the Nacimiento experimental catchments, south central Chile. Hydrol. Process. 35:e14257. doi: 10.1002/hyp.14257
Karlsson, I. B., Sonnenborg, T. O., Jensen, K. H., and Refsgaard, J. C. (2014). Historical trends in precipitation and stream discharge at the Skjern River catchment, Denmark. Hydrol. Earth Syst. Sci. 18, 595–610. doi: 10.5194/hess-18-595-2014
Kirchner, J. W. (2006). Getting the right answers for the right reasons: Linking measurements, analyses, and models to advance the science of hydrology. Water Resour. Res. 42. doi: 10.1029/2005WR004362
Kirkby, M., Bracken, L., and Reaney, S. (2002). The influence of land use, soils and topography on the delivery of hillslope runoff to channels in SE Spain. Earth Surf. Process. Landf. 27, 1459–1473. doi: 10.1002/esp.441
Li, Z., Ali, Z., and Cui, T. (2022). A comparative analysis of pre–and post-industrial spatiotemporal drought trends and patterns of Tibet Plateau using Sen slope estimator and steady-state probabilities of Markov Chain. Nat. Hazards 113, 547–576. doi: 10.1007/s11069-022-05314-x
Liu, W. F., Xu, Z. P., Wei, X. H., Li, Q., and Fan, H. B. (2020). Assessing hydrological responses to reforestation and fruit tree planting in a sub-tropical forested watershed using a combined research approach. J. Hydrol. 590:125480. doi: 10.1016/j.jhydrol.2020.125480
Lu, X., Kang, L., and Zuo, Z. (2016). Effects of different vegetation types on slope runoff process under rainstorm condition. Agric. Sci. 1, 79–83. doi: 10.16768/j.issn.1004-874x.2016.01.015
Masih, L., Maskey, S., Uhlenbrook, S., and Smakhtin, V. (2011). Assessing the impact of areal precipitation input on streamflow simulations using the SWAT model 1. JAWRA 47, 179–195. doi: 10.1111/j.1752-1688.2010.00502.x
Masson-Delmotte, V., Zhai, P., Pirani, A., Connors, S., Péan, C., and Berger, S. (2021). Contribution of working group I to the sixth assessment report of the intergovernmental panel on climate change. Cambridge: Cambridge University Press.
Moriasi, D. N., Arnold, J. G., Van, L. M. W., Bingner, R. L., and Harmel, R. D. (2007). Model evaluation guidelines for systematic quantification of accuracy in watershed simulations. Trans. ASABE 50, 885–900. doi: 10.13031/2013.23153
Mwangi, H. M., Julich, S., Patil, S. D., McDonald, M. A., and Feger, K. (2016). Modelling the impact of agroforestry on hydrology of Mara river basin in east Africa. Hydrol. Process. 30, 3139–3155. doi: 10.1002/hyp.10852
Nash, J. E., and Sutcliffe, J. V. (1970). River flow forecasting through conceptual models part I—A discussion of principles. J. Hydrol. 10, 282–290. doi: 10.1016/0022-1694(70)90255-6
Nguyen, H. M., Ouillon, S., and Vu, V. D. (2022). Sea level variation and trend analysis by comparing Mann–Kendall test and innovative trend analysis in front of the red river Delta, Vietnam (1961–2020). Water 114:1709. doi: 10.3390/w14111709
Nkwasa, A., Chawanda, C. J., Msigwa, A., Komakech, H. C., Verbeiren, B., and Van, G. A. (2020). How can we represent seasonal land use dynamics in SWAT and SWAT+ models for african cultivated catchments? Water 12:1541. doi: 10.3390/w12061541
Notaro, M., Zarrin, A., Vavrus, S., and Bennington, V. (2013). Simulation of heavy lake-effect snowstorms across the great lakes basin by RegCM4: Synoptic climatology and variability. Mon. Weather Rev. 141, 1990–2014. doi: 10.1175/mwr-d-11-00369.1
Nyikadzino, B., Chitakira, M., and Muchuru, S. (2020). Rainfall and runoff trend analysis in the Limpopo river basin using the Mann Kendall statistic. Phys. Chem. Earth 117:102870. doi: 10.1016/j.pce.2020.102870
Pathak, P., Wani, S. P., Sudi, R., and Budama, N. (2013). Inter-row tillage for improved soil and water conservation and crop yields on crusted Alfisols. Agric. Sci. 4, 36–45. doi: 10.4236/as.2013.48A006
Pierini, N. A., Vivoni, E. R., Robles-Morua, A., Scott, R. L., and Nearing, M. A. (2014). Using observations and a distributed hydrologic model to explore runoff thresholds linked with mesquite encroachment in the Sonoran Desert. Water Resour. Res. 50, 8191–8215. doi: 10.1002/2014wr015781
Qiao, L., Zou, C. B., Will, R. E., and Stebler, E. (2015). Calibration of SWAT model for woody plant encroachment using paired experimental watershed data. J. Hydrol. 523, 231–239. doi: 10.1016/j.jhydrol.2015.01.056
Rodriguez, D. A., Tomasella, J., and Linhares, C. (2010). Is the forest conversion to pasture affecting the hydrological response of Amazonian catchments? Signals in the Ji-Paraná Basin. Hydrol. Process. Int. J. 24, 1254–1269. doi: 10.1002/hyp.7586
Schellekens, J., Bruijnzeel, L. A., and Rawaqa, T. T. (2007). Changes in catchment runoff after harvesting and burning of a Pinus caribaea plantation in Viti Levu, Fiji. For. Ecol. Manag. 251, 31–44. doi: 10.1016/j.foreco.2007.06.050
Scott, D. F. (1993). The hydrological effects of fire in South African mountain catchments. J. Hydrol. 150, 409–432. doi: 10.1016/0022-1694(93)90119-T
Scott, D. F., and Lesch, W. (1997). Streamflow responses to afforestation with Eucalyptus grandis and Pinus patula and to felling in the Mokobulaan experimental catchments, South Africa. J. Hydrol. 199, 360–377. doi: 10.1016/S0022-1694(96)03336-7
Sen, P. K. (1968). Estimates of the regression coefficient based on Kendall’s tau. J. Am. Stat. Assoc. 63, 1379–1389. doi: 10.1080/01621459.1968.10480934
Shi, X. L., Yang, Z. Y., Lu, J., and Liu, F. (2016). Hydrological response to climate change in luanhe river basin. Res. Soil Water Conserv. 23, 123–127. doi: 10.13869/j.cnki.rswc.2016.02.023
Shope, C. L., and Maharjan, G. R. (2015). Modeling spatiotemporal precipitation: Effects of density, interpolation, and land use distribution. Adv. Meteorol. 2015:174196. doi: 10.1155/2015/174196
Slingsby, J. A., de Buys, A., Simmers, A. D. A., Prinsloo, E., Forsyth, G. G., and Glenday, J. (2021). Jonkershoek: Africa’s oldest catchment experiment-80 years and counting. Hydrol. Process. 35:e14101. doi: 10.1002/hyp.14101
Sokolova, G. V., Verkhoturov, A. L., and Korolev, S. P. (2019). Impact of deforestation on streamflow in the Amur River Basin. Geosciences 9:262. doi: 10.3390/geosciences9060262
Stednick, J. D. (1996). Monitoring the effects of timber harvest on annual water yield. J. Hydrol. 176, 79–95. doi: 10.1016/0022-1694(95)02780-7
Swank, W. T., Swift, J. L. W., and Douglass, J. E. (1988). Streamflow changes associated with forest cutting, species conversions, and natural disturbances. For. Hydrol. Ecol. Coweeta 66, 297–312. doi: 10.1007/978-1-4612-3732-7_22
Trenberth, K. E. (2011). Changes in precipitation with climate change. Clim. Res. 47, 123–138. doi: 10.3354/cr00953
Truong, N. C. Q., Khoi, D. N., Nguyen, H. Q., and Kondoh, A. (2022). Impact of forest conversion to agriculture on hydrologic regime in the large basin in Vietnam. Water 14:854. doi: 10.3390/w14060854
Wallace, C. W., Flanagan, D. C., and Engel, B. A. (2018). Evaluating the effects of watershed size on SWAT calibration. Water 10:898. doi: 10.3390/w10070898
Wang, H., Sun, F. B., Xia, J., and Liu, W. B. (2017). Impact of LUCC on streamflow based on the SWAT model over the Wei River basin on the Loess Plateau in China. Hydrol. Earth Syst. Sci. 21, 1929–1945. doi: 10.5194/hess-21-1929-2017
Wang, R. Y., Kalin, L., Kuang, W. H., and Tian, H. Q. (2014). Individual and combined effects of land use/cover and climate change on Wolf Bay watershed streamflow in southern Alabama. Hydrol. Process. 28, 5530–5546. doi: 10.1002/hyp.10057
Wei, X., Li, Q., Zhang, M., Giles-Hansen, K., Liu, W., and Fan, H. (2018). Vegetation cover—another dominant factor in determining global water resources in forested regions. Glob. Change Biol. 24, 786–795. doi: 10.1111/gcb.13983
Wu, Y., Liu, S., and Yan, W. (2016). Climate change and consequences on the water cycle in the humid Xiangjiang River Basin, China. Stoch. Environ. Res. Risk Assess. 30, 225–235. doi: 10.1007/s00477-015-1073-x
Xu, Y. D., Fu, B. J., and He, C. S. (2013). Assessing the hydrological effect of the check dams in the Loess Plateau, China, by model simulations. Hydrol. Earth Syst. Sci. 17, 2185–2193. doi: 10.5194/hessd-9-13491-2012
Xu, Z. P., Liu, W. F., Wei, X. H., Fan, H. B., and Ge, Y. Z. (2019). Contrasting differences in responses of streamflow regimes between reforestation and fruit tree planting in a subtropical watershed of China. Forests 10:212. doi: 10.3390/f10030212
Yang, J. X., Huang, B. S., Ouyang, X. L., Chen, L. X., Lin, S. J., and Fan, F. L. (2014). Forest Evapotranspiration in Pearl River delta based on remote sensing technology. Agric. Sci. Technol. 15, 457–462. doi: 10.16175/j.cnki.1009-4229.2014.03.042
Yang, L. S., Feng, Q., Yin, Z. L., Wen, X. H., Si, J. H., and Li, C. B. (2017). Identifying separate impacts of climate and land use/cover change on hydrological processes in upper stream of Heihe River, Northwest China. Hydrol. Process. 31, 1100–1112. doi: 10.1002/hyp.11098
Yin, J., He, F., Xiong, Y. J., and Qiu, G. Y. (2017). Effects of land use/land cover and climate changes on surface runoff in a semi-humid and semi-arid transition zone in northwest China. Hydrol. Earth Syst. Sci. 21, 183–196. doi: 10.5194/hess-21-183-2017
Zhang, M., and Wei, X. (2012). The effects of cumulative forest disturbance on streamflow in a large watershed in the central interior of British Columbia, Canada. Hydrol. Earth Syst. Sci. 16, 2021–2034. doi: 10.5194/hess-16-2021-2012
Zhang, M., and Wei, X. (2021). Deforestation, forestation, and water supply. Science 371, 990–991. doi: 10.1126/science.abe7821
Zhang, M., Liu, N., and Harper, R. (2017). A global review on hydrological responses to forest change across multiple spatial scales: Importance of scale, climate, forest type and hydrological regime. J. Hydrol. 546, 44–59. doi: 10.1016/j.jhydrol.2016.12.040
Keywords: SWAT model, different spatial scales, expansion of fruit trees, climate change, Jiujushui watershed
Citation: Xu Y, Liu W, Fan H, Shen F, Wu J, Liu P, Sang D, Qiu W, Duan H and Cai W (2023) Impacts of climate change and fruit tree expansion on key hydrological components at different spatial scales. Front. For. Glob. Change 6:1114423. doi: 10.3389/ffgc.2023.1114423
Received: 02 December 2022; Accepted: 12 January 2023;
Published: 27 January 2023.
Edited by:
Osbert Jianxin Sun, Beijing Forestry University, ChinaReviewed by:
Tanzeel J. A. Farooqi, Yibin University, ChinaSuria Tarigan, IPB University, Indonesia
Copyright © 2023 Xu, Liu, Fan, Shen, Wu, Liu, Sang, Qiu, Duan and Cai. This is an open-access article distributed under the terms of the Creative Commons Attribution License (CC BY). The use, distribution or reproduction in other forums is permitted, provided the original author(s) and the copyright owner(s) are credited and that the original publication in this journal is cited, in accordance with accepted academic practice. No use, distribution or reproduction is permitted which does not comply with these terms.
*Correspondence: Wenfei Liu,  bGl1d2Y3MjlAMTI2LmNvbQ==
 Yarui Xu
 Wenfei Liu
 Houbao Fan
 Fangfang Shen
 Jianping Wu
 Peng Liu1
 Honglang Duan