 Graciela Tejada1*
 Luciana V. Gatti1,2
 Luana S. Basso1
 Henrique L. G. Cassol1
 Celso H. L. Silva-Junior3,4,5
 Guilherme Mataveli1Luciano Marani1Egidio Arai1Manuel Gloor6John B. Miller7
 Camilla L. Cunha1
 Lucas G. Domingues1,2
 Alber Ipia1Caio S. C. Correia1,2Stephane P. Crispim1Raiane A. L. Neves1
 Celso Von Randow1
- 1General Coordination of Earth Science (CGCT), National Institute for Space Research (INPE), São José dos Campos, Brazil
- 2Nuclear and Energy Research Institute (IPEN), São Paulo, Brazil
- 3Amazon Environmental Research Institute, Brasília, Brazil
- 4Graduate Program in Biodiversity Conservation, Federal University of Maranhão, São Luís, Brazil
- 5Department of Geography, School of Environment Education and Development (SEED), The University of Manchester, Manchester, United Kingdom
- 6School of Geography, University of Leeds, Leeds, United Kingdom
- 7Global Monitoring Laboratory, National Oceanic and Atmospheric Administration (NOAA), Boulder, CO, United States
Amazon forests are the largest forests in the tropics and play a fundamental role for regional and global ecosystem service provision. However, they are under threat primarily from deforestation. Amazonia's carbon balance trend reflects the condition of its forests. There are different approaches to estimate large-scale carbon balances, including top-down (e.g., CO2 atmospheric measurements combined with atmospheric transport information) and bottom-up (e.g., land use and cover change (LUCC) data based on remote sensing methods). It is important to understand their similarities and differences. Here we provide bottom-up LUCC estimates and determine to what extent they are consistent with recent top-down flux estimates during 2010 to 2018 for the Brazilian Amazon. We combine LUCC datasets resulting in annual LUCC maps from 2010 to 2018 with emissions and removals for each LUCC, and compare the resulting CO2 estimates with top-down estimates based on atmospheric measurements. We take into account forest carbon stock maps for estimating loss processes, and carbon uptake of regenerating and mature forests. In the bottom-up approach total CO2 emissions (2010 to 2018), deforestation and degradation are the largest contributing processes accounting for 58% (4.3 PgCO2) and 37% (2.7 PgCO2) respectively. Looking at the total carbon uptake, primary forests play a dominant role accounting for 79% (−5.9 PgCO2) and secondary forest growth for 17% (−1.2 PgCO2). Overall, according to our bottom-up estimates the Brazilian Amazon is a carbon sink until 2014 and a source from 2015 to 2018. In contrast according to the top-down approach the Brazilian Amazon is a source during the entire period. Both approaches estimate largest emissions in 2016. During the period where flux signs are the same (2015–2018) top-down estimates are approximately 3 times larger in 2015–2016 than bottom-up estimates while in 2017–2018 there is closer agreement. There is some agreement between the approaches–notably that the Brazilian Amazon has been a source during 2015–2018 however there are also disagreements. Generally, emissions estimated by the bottom-up approach tend to be lower. Understanding the differences will help improve both approaches and our understanding of the Amazon carbon cycle under human pressure and climate change.
1. Introduction
Amazon forests are the greatest continuous tropical forest in the world, fundamental for the maintenance of global ecosystem services including carbon sequestration, water supply, climate regulation, and hosting an incredible amount of biodiversity. In the carbon budget over past decades, primary Amazon forests have been attributed to be the main tropical carbon sink (Pan et al., 2011). Because of the large extent of Amazonia, anthropogenic or climate perturbation can have impacts on the global carbon cycle (Aragão et al., 2014). Brazil has 49% of the Amazon forests but is also the country with the highest net deforestation reaching 18% of the Brazilian Amazon biome in 2021 (INPE, 2022). Between 2004 and 2012, deforestation decreased by 80% reaching its lowest level in 2012 with 4,571 km2. From there, deforestation has been increasing again, reaching 13,038 km2 in 2021 (INPE, 2022). Decades of deforestation, degradation, and fragmentation have increased the vulnerability of a large portion of these forests to global change impacts including droughts and anthropogenic fires as well (Aragão et al., 2014; Silva et al., 2020).
Trends in the carbon balance are a large-scale indicator of how these forests are responding to external pressures. There are different approaches to estimating carbon balances, which can broadly be classified as “top-down” and “bottom-up.” Bottom-up approaches use local information, which is then upscaled spatially. Such information may range from plot scale forest inventory data to eddy fluxes towers results (local scale) to regional scale remote sensing-based land use and cover maps. Top-down approaches exploit the information about sources and sinks contained in spatial and temporal patterns of atmospheric CO2 (and CO) dry air molar fractions. To extract this information, atmospheric transport models are used in an inverse mode (so-called atmospheric transport inversions; Cassol et al., 2020). Previous studies comparing both approaches show that the bottom-up approaches provide detail that the top-down atmospheric approach does not capture; in addition, when upscaling local data to the entire Amazon, differences begin to appear. That is why it is necessary to understand CO2 fluxes from deforestation, forest degradation, and secondary forest separately (Grace, 2016).
As in many tropical countries, more than 46% of Brazilian greenhouse gas (GHG) emissions come from land use and cover change (LUCC; Albuquerque et al., 2020; MCTI, 2020a). LUCC and biomass content in forests are the base for the carbon emissions and removal estimations in tropical countries (Aguiar et al., 2012; Baccini et al., 2012; Harris et al., 2012). There are several regional LUCC datasets (maps) for the Brazilian Amazon, derived from Landsat images. Between them is the Project for Remote Deforestation Monitoring (PRODES) project, which measures the annual and official deforestation rate in the Brazilian Legal Amazon since 1988. TerraClass is a project that maps the land use and cover of PRODES deforested areas, but only for the years 2004, 2008, 2010, 2012, and 2014 (Almeida et al., 2016). Also, the Brazilian Institute of Geography and Statistics (IBGE) has LUCC datasets for the years 2010, 2012, 2014, 2016, and 2018 (IBGE, 2016, 2018). MapBiomas is a collaborative network (Souza et al., 2020), which provides annual LUCC datasets also derived from Landsat images, from 1985 to 2021. However, none of these datasets cover all the LUCC processes related to forest degradation, secondary forest spatial coverage, and deforestation or the same temporal scale (e.g., annual LUCC).
Estimates from the top-down lower troposphere greenhouse gas (GHG) monitoring program (CARBAM; Gatti et al., 2014, 2021) covering 9 years (2010–2018) based on in situ flight atmospheric CO2 measurements at four sites of the Brazilian Amazon indicate a decreasing capacity of the Amazon forests to absorb carbon as a result of deforestation and climate change patterns in the most deforested part of the Amazon (southeast). Gatti et al. (2021) found a correlation between the total PRODES deforested areas, the decrease in forest CO2 removals, and high fire emissions from 2010 to 2018. To better understand these top-down flux results, it is important to compare them with bottom-up LUCC dynamics data for the same areas.
The purpose of this study is to provide bottom-up LUCC estimates and to determine whether they help understand and are consistent with the CARBAM top-down CO2 atmospheric fluxes estimates from 2010 to 2018. Here, we assess LUCC (including secondary forest and forest degradation) CO2 flux estimates in four regions of the Amazon and compare them with the CO2 flux estimates based on atmospheric CO2 and CO vertical profiles and the trajectory-based atmospheric transport inverse model (Gatti et al., 2021).
For this purpose, we merged different LUCC datasets. For land use and land cover and forest loss, we used MapBiomas collection 4.1 (MapBiomas, 2020); for degradation, we used the data from Bullock et al. (2020), and for secondary forest gain and loss, we used the data from Silva et al. (2020). Using an annual LUCC map from 2010 to 2018, we calculated the emissions and removals with a methodology specific to each LUCC class, also considering forest biomass. Then, we compared both approaches (top-down and bottom-up), remarking on their similarities and differences. We also state the limitations of the top-down, LUCC, and biomass data when understanding the bottom-up flight atmospheric measurements approach.
2. Materials and methods
We generated LUCC bottom-up CO2 estimates and compared them with the results of the top-down study of Gatti et al. (2014, 2021). We first explain the process of estimating the top-down fluxes based on atmospheric CO2 concentration of dry air molar fraction vertical profiles. We also discuss the determination of representative regions of top-down flux estimates, referred to as “influence regions.” Then, we describe how we merged the different LUCC datasets to have an annual map from 2010 to 2018 for each influence region. Finally, we explain the specific analyses to calculate the emission/removal factors by LUCC class in the bottom-up approach.
2.1. Top-down atmospheric measurements and regions of influence (study area)
There are four sites in the Brazilian Amazon where the top-down flight atmospheric measurements were collected (Gatti et al., 2014, 2021). The sites are ALF (8.8°S, 56.7°W) at the southeast, SAN (2.8°S, 54.9°W) at the northeast, RBA (9.3°S, 67.6°W) at southwest-central, and TAB (5.9°S, 70.0°W) until 2012, which has been replaced by TEF in 2013 (3.7°S, 66.5°W), at northwest central region (Figure 1). The influence region of each flight site is estimated as the envelope of backward air mass trajectories reaching the sites. In this study, we have considered the mean annual influence region of all years (2010–2018) of each flight collection site (Figures 1B–F) to estimate the bottom-up emissions and removals. Our study area follows the Brazilian Amazon forest biome delimitation of Olson et al. (2001) with an area of 4,215,763 km2 (Figure 1A; from now on, we will refer to it as the Brazilian Amazon) and the influence regions of TAB, TEF, RBA, SAN, and ALF inside the Brazilian Amazon (Figures 1B–F).
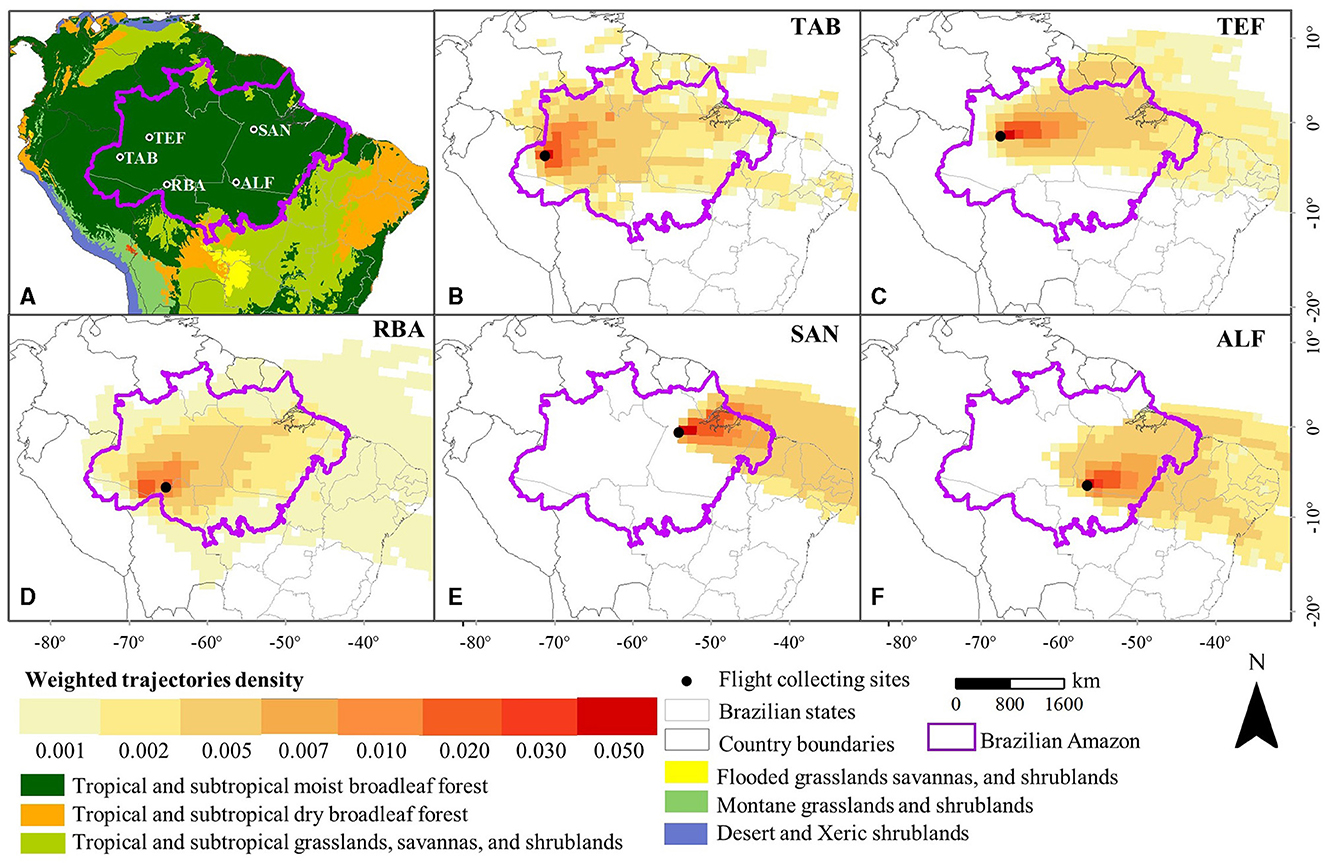
Figure 1. (A) Study area in purple line (Brazilian Amazon). (B–F) Normalized mean annual influence regions of all years (2010–2018) by flight collection site: TAB, TEF, RBA, SAN, and ALF.
At the air-sampling sites, samples were collected in a descending vertical profile from 4,420 m above sea level (a.s.l.) to ~300 m a.s.l. The sampling system was installed on board in a small aircraft. All vertical profiles were made during the period when the planetary boundary layer tends to be well-mixed (between 12:00 and 13:00 local time), such that the profiles integrate gas fluxes from large regions under its region of influence. Air samples were analyzed by a non-dispersive infrared analyzer for CO2 and by gas chromatography with HgO reduction detection for CO.
For each vertical profile, the flux from the influence region of the site was estimated as the difference of ΔCO2 of the observed vertical profile CO2 mole fraction at the site, a so-called background mole representing the amount of CO2 of the atmospheric column entering the Amazon from the tropical Atlantic via the trade winds. Then, ΔCO2 is divided by the travel time of air parcels from the Atlantic, to the vertical profiling site, obtaining an average CO2 flux estimate for the influence region of the site, following the equation:
where CO2 is carbon dioxide dry air mole fraction in units of (mol m−3), z is the height above sea level (m), and t(z) is air mass travel time (s) from the coast to the site at level z. A detailed description of the vertical profile sampling and flux calculation is available in Gatti et al. (2014, 2021) and Basso et al. (2016, 2021)'s studies.
The method to calculate the influence regions uses individual air parcel back trajectories of each vertical profile calculated by the Hybrid Single-Particle Lagrangian Integrated Trajectory Model (HYSPLIT; Stein et al., 2015). This model uses 1-h resolution to get the trajectory density (number of back trajectories passed over a 1 × 1° grid cell), between ~300 and 3,500 m a.s.l. A total of 590 CO2 profiles (flights) from 2010 to 2018, considering a minimum density of trajectories of 2.5% were used. Detailed methods of the calculation of influence regions and weighted trajectory density are given by Cassol et al. (2020) and Gatti et al. (2021).
The top-down carbon flux estimate integrates the effect of all the surface sources and sinks between the coast and the sampling site, i.e., it is the total carbon flux due to all natural and anthropogenic surface sources and sinks including fire flux (biomass burning emission), fossil fuel emissions, and NBE flux (Net Biome Exchange: total flux minus the fire flux; Gatti et al., 2021).
2.2. LUCC annual map
We combine multiple Landsat-based datasets to represent annual LUCC related to forest carbon change (Table 1). Here, we describe the bottom-up datasets and methods to create the annual LUCC map from 2010 to 2018, including deforestation, secondary forest, and forest degradation processes. We calculated the LUCC areas for the Brazilian Amazon (Figure 1A) and the influence regions of each site (Figures 1B–F). For the forest class, we used the MapBiomas collection 4.1 dataset (MapBiomas, 2020), hereafter referred to MapBiomas.
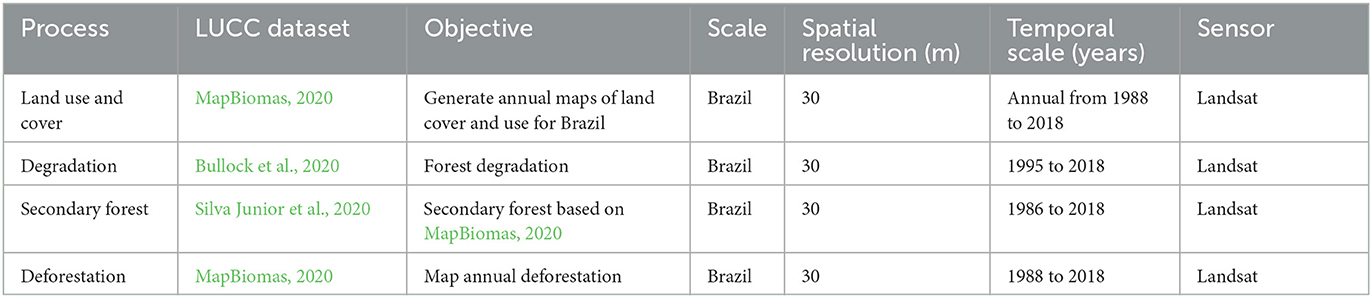
Table 1. Land use and cover change datasets.
As the secondary forest class is missing in MapBiomas, we obtained this class from Silva Junior et al. (2020), which is based on the same version of MapBiomas. A secondary forest is defined as a pixel with an anthropogenic class (e.g., agriculture or pasture) that turns into a forest again. The deforestation data were also derived from MapBiomas using an algorithm similar to that of Silva Junior et al. (2020). Deforestation is defined as a forest pixel that was replaced with any other class. For forest degradation, we used the data from Bullock et al. (2020), in which any pixel containing a forest disturbance is considered as forest degradation (e.g., selective logging, fire, and wind damage that did not result in a change in land cover or deforestation at a 0.09-ha scale). Bullock et al. (2020) methods used Landsat spectral endmember fractions to calculate the Normalized Degradation Fraction Index (NDFI). Other LUCC classes, planted forest, pasture, agriculture, and other non-forest natural formation, were obtained from MapBiomas as well. We merged some MapBiomas classes (Table 2) according to the Brazilian Third and Fourth National Communications on greenhouse gasses (3NC and 4NC; MCTI, 2016, 2020a) to the United Nations Framework Convention on Climate Change (UNFCCC) and the Brazilian System for Estimating Greenhouse Gas Emissions 8th (SEEG8) (Albuquerque et al., 2020; Alencar et al., 2020).
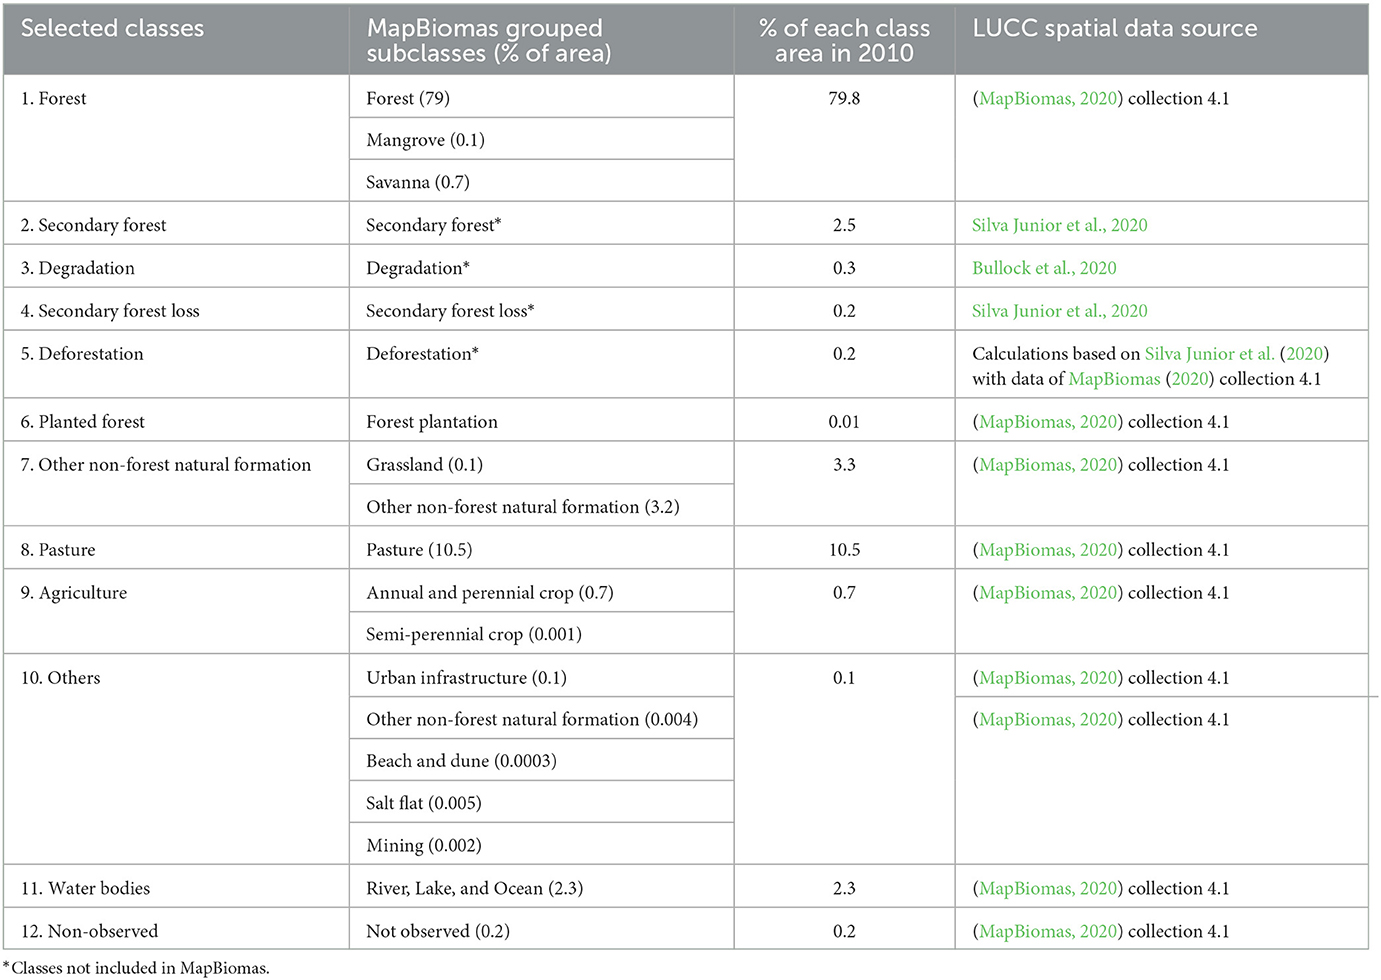
Table 2. Land use and cover change classes.
Considering that the LUCC dataset employed different objectives and methods for mapping secondary forest (also secondary forest loss), degradation and deforestation classes, there may be some overlap between these classes. For example, one pixel classified as degradation by Bullock et al. (2020) can be classified as a secondary forest by Silva Junior et al. (2020). That is why we made an overlaying analysis between these datasets containing deforestation, degradation, and secondary forest gain and loss for 3 years (2010, 2014, and 2018). The overlaps between these classes are equal to or <1.8% of the total pixels (see Supplementary Table 1). Thus, we made our annual LUCC maps merging the datasets according to the order shown in Figure 2.
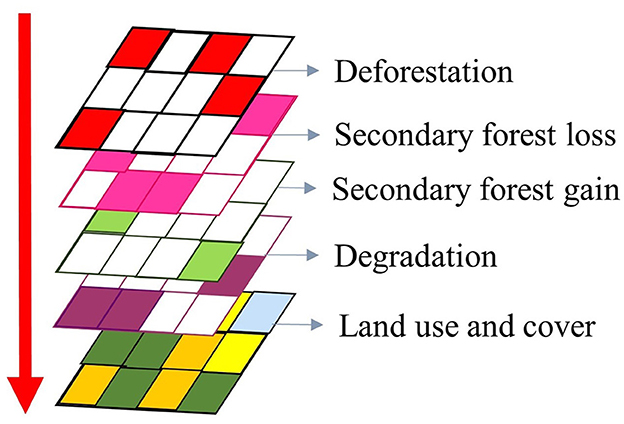
Figure 2. Land use and cover change (LUCC) map order. Deforestation (MapBiomas, 2020), secondary forest loss and gain (Silva Junior et al., 2020), degradation (Bullock et al., 2020), and LUCC (MapBiomas, 2020).
2.3. Bottom-up emission/removal factors
To quantify the CO2 emissions and removals, different spatial analyses for each annual LUCC class in each influence region and within the Brazilian Amazon were made (Figure 3). In the case of TAB, we used the emission/removal estimates from 2010 to 2012 and for TEF from 2013 to 2018 because the TAB flight site was replaced by TEF in 2013. According to the IPCC (2006), to calculate GHG emissions, you multiply the activity data (our annual areas of each LUCC) by an emission/removal factor (representative value to quantify the emissions or removals). To designate emission/removal factors, we made a separate spatial analysis for each LUCC (Figure 3). The detailed emission/removal factors ratios are described in Table 3.
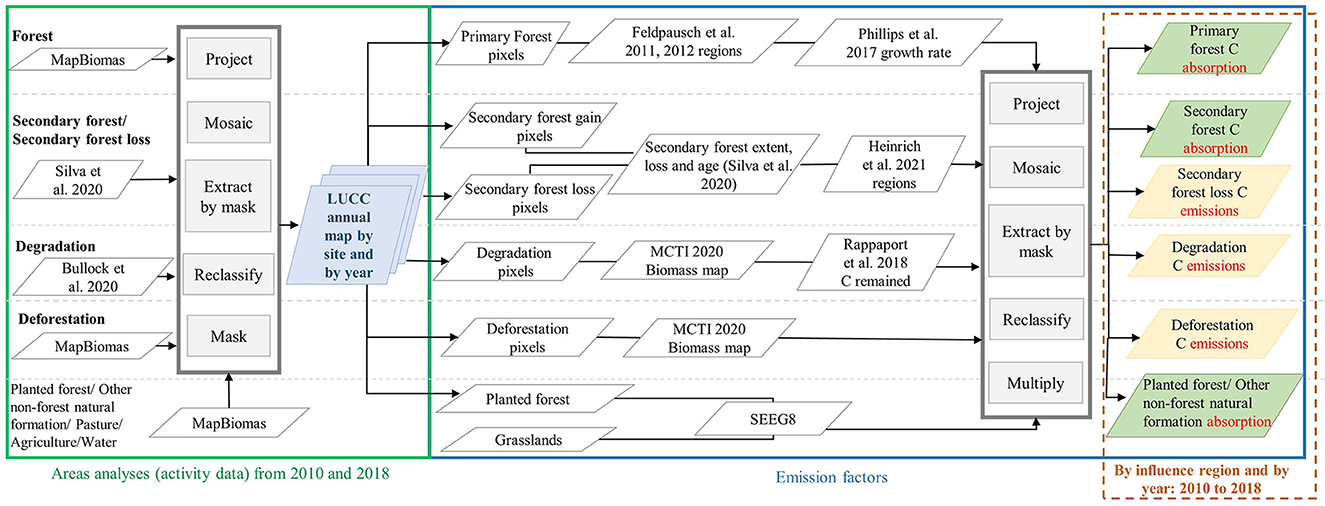
Figure 3. Flowchart of CO2 emission factors calculation scheme.
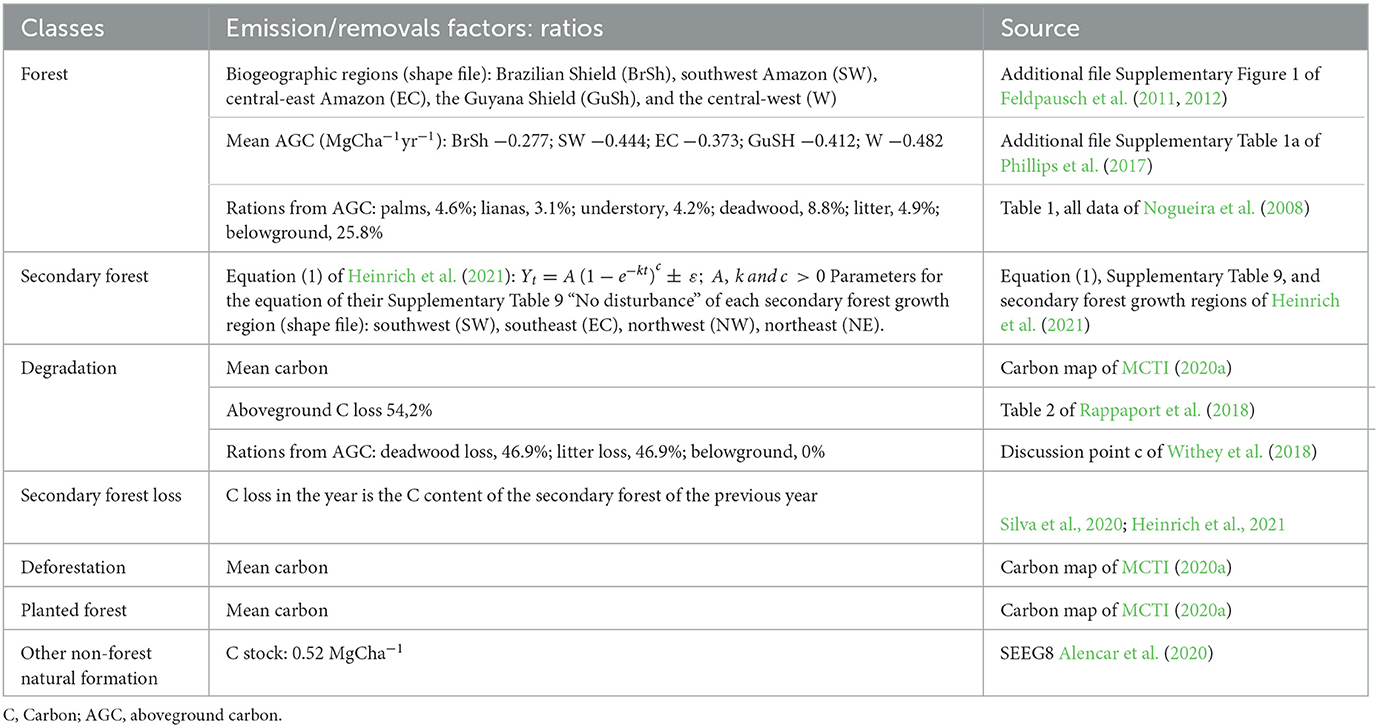
Table 3. Emission factor ratios.
The carbon stored in the forest and other non-forest natural formation classes also released into the atmosphere by deforestation, degradation, and secondary forest loss is determined by the biomass, assuming a carbon fraction of 0.5 in forest biomass (IPCC, 2006). To quantify the amount of carbon in the forest and the CO2 emissions by deforestation and degradation, we used the carbon map of the 4NC (Fourth National Communications on greenhouse gasses) of Brazil to the UNFCCC (MCTI, 2020a). The 4NC map is based on field biomass (from the Brazilian Forest National Inventory and other projects) and airborne LiDAR data from the EBA project (EBA, 2016), which was extrapolated from 2016 to 2010 (the base year of the 4NC; MCTI, 2020b). The 4NC carbon map represents the carbon stocks in 2010, including aboveground biomass, belowground biomass, dead wood, and litter, derived from carbon ratios of the aboveground biomass (MCTI, 2020b).
Intact forest carbon stocks are not accounted for in national communications (NCs) on greenhouse gases, which only consider anthropogenic emissions/removals. As carbon stock changes in intact forests are relevant for our study, we used the annual mean carbon change of ground forest biomass plots of RAINFOR (Phillips et al., 2017) from 2000 to 2009 (last decade with data). We used the forest class of the 4NC map only to account for the C stocks. The mean carbon change values for each Amazon biogeographic region [Brazilian Shield (BrSh), southwest Amazon (SW), the central-east Amazon (EC), the Guyana Shield (GuSh), and the central-west (W)] of Feldpausch et al. (2011, 2012) were multiplied by our total intact forest area of each biogeographic region (Table 3).
In the case of deforestation, we assumed that all the CO2 from the forest carbon pools (aboveground biomass, belowground biomass, dead wood, and litter) is released to the atmosphere at the moment of the clear cut, the forest carbon data are from the 4NC map. To calculate the carbon removal and loss of secondary forest, we used the secondary forest extent and loss data of Silva Junior et al. (2020) and the secondary forest growth regions of Heinrich et al. (2021; Table 3). Furthermore, we assumed that the secondary forest carbon content of the prior year is released into the atmosphere the following year (secondary forest loss class).
For the forest degradation class, we used the 4NC biomass map as a base of forest biomass before degradation, assuming that 45.8% of aboveground carbon remains (54.2% of carbon is lost), according to Rappaport et al. (2018) and Assis et al. (2020). For belowground carbon, dead wood, and litter, see the ratios used in Table 3.
The removal factors (C stocks and annual increment) of other non-forest natural formation classes (which includes the grassland class) and planted forests class were obtained from the SEEG8 (based on the 3NC), which used the same MapBiomas LUCC classes. As we are focusing on the land use, land use change, and forestry (LULUCF) classes, in the carbon emissions or removal analyses, we excluded the classes: others, pasture, agriculture, water bodies, and non-observed. The SEEG8 and the 3NC (MCTI, 2016; Alencar et al., 2020) also do not include these classes. In the bottom-up approach, we are not including specifically the fire fluxes, even though part of fire fluxes is already included in the deforestation and forest degradation processes. Also, energy (fossil fuels), industrial processes, and agriculture sectors are not considered.
Each influence region has a different trajectory density; warmer colors represent the highest densities (Figures 1B–F). The bottom-up CO2 emissions and removals were calculated using the weight of the trajectories' density. After calculating the CO2 emissions and removals of the bottom-up approach, we compared them with the top-down CO2 fluxes.
3. Results
3.1. Annual LUCC areas
To compare bottom-up with top-down estimates, we projected bottom-up analyses on the influence regions of each of the atmospheric CO2 observation sites. The largest influence region is from RBA, covering 95% of the Brazilian Amazon area. TAB is the second largest area (82%), followed by TEF with 56%. RBA and TAB had the largest forest area in 2010 with 82 and 85%, respectively. TEF forest area was 82% of the total area in 2013. ALF (in the southeast) and SAN (in the northeast) have a smaller influence region with 35 and 16%, respectively, and the forest area in 2010 is also smaller (59 and 79% of the total area). All the annual LUCC areas are shown in Figure 4 and Supplementary Table 2, and their percentages in Figure 5. As observed in Figure 1, the influence regions may overlap and, therefore, are not cumulative.
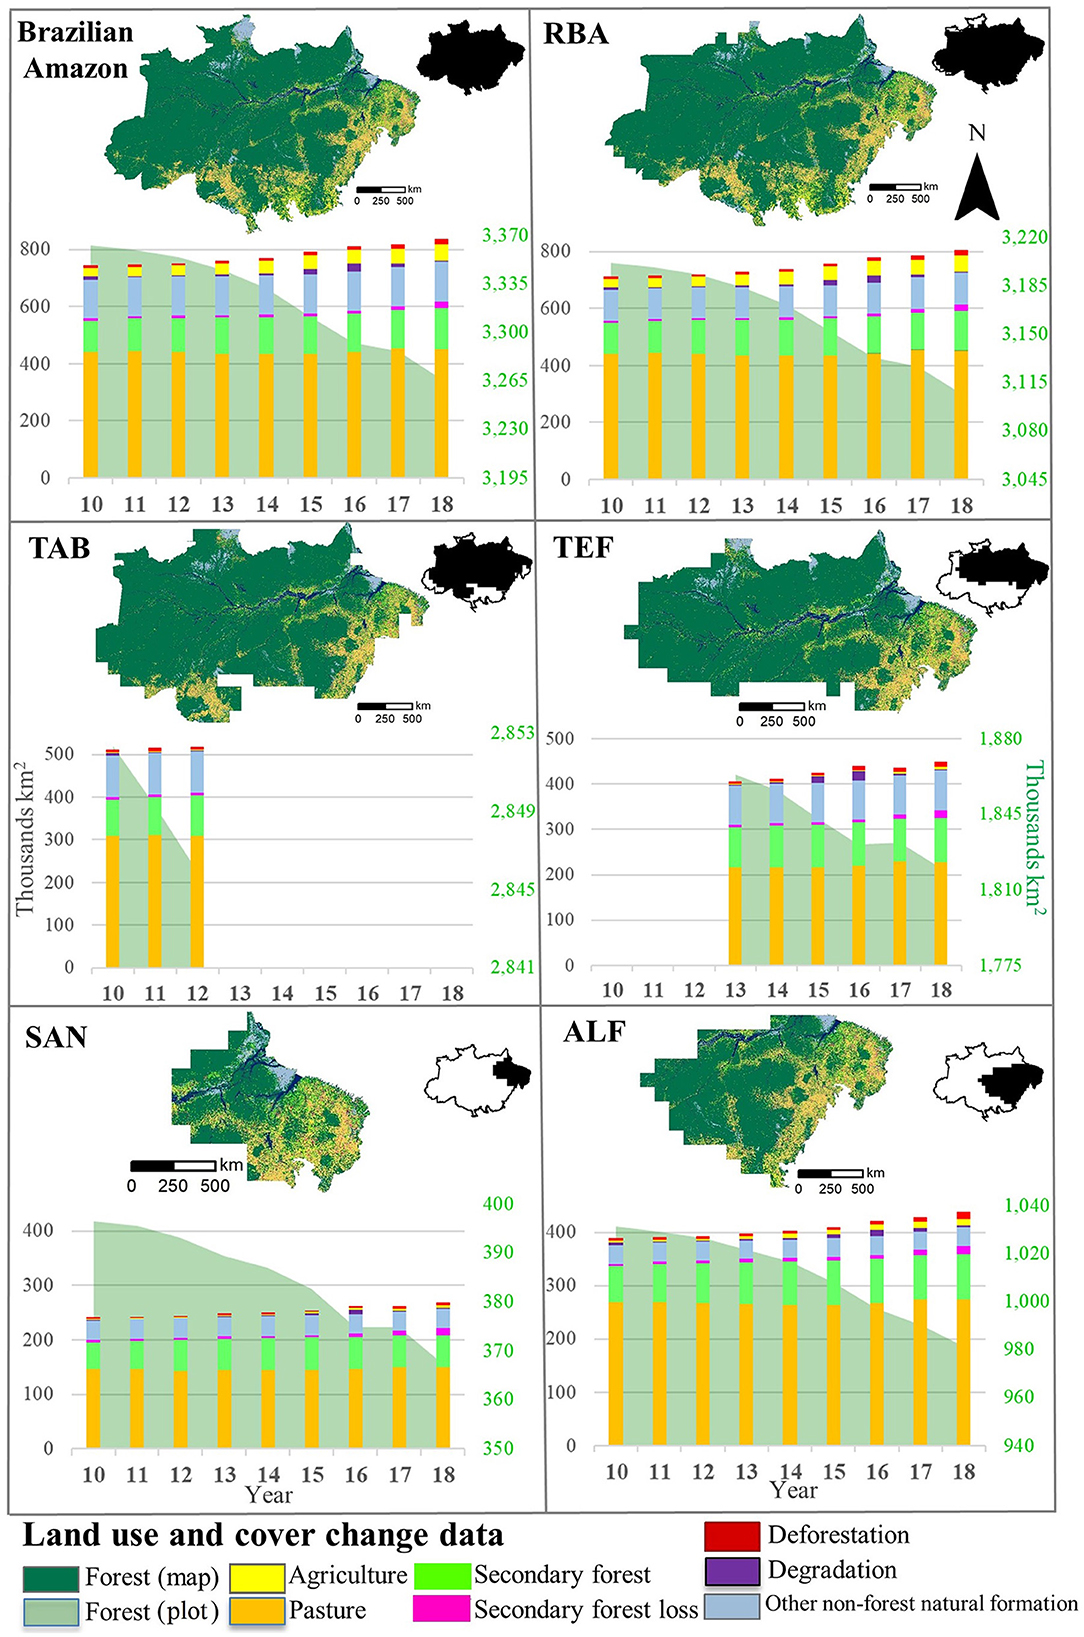
Figure 4. Land use and cover change (LUCC) in the Brazilian Amazon and each influence region. On the right Y axis are all the LUCC classes except forest which is represented in the left Y axis as area. Units are thousands of km2. The legend applies to maps and bars; only the forest has a dark green for the map and a light green for the area graph. Detailed sources of the LUCC annual map are in Table 2. Detailed areas are in Supplementary Table 2.
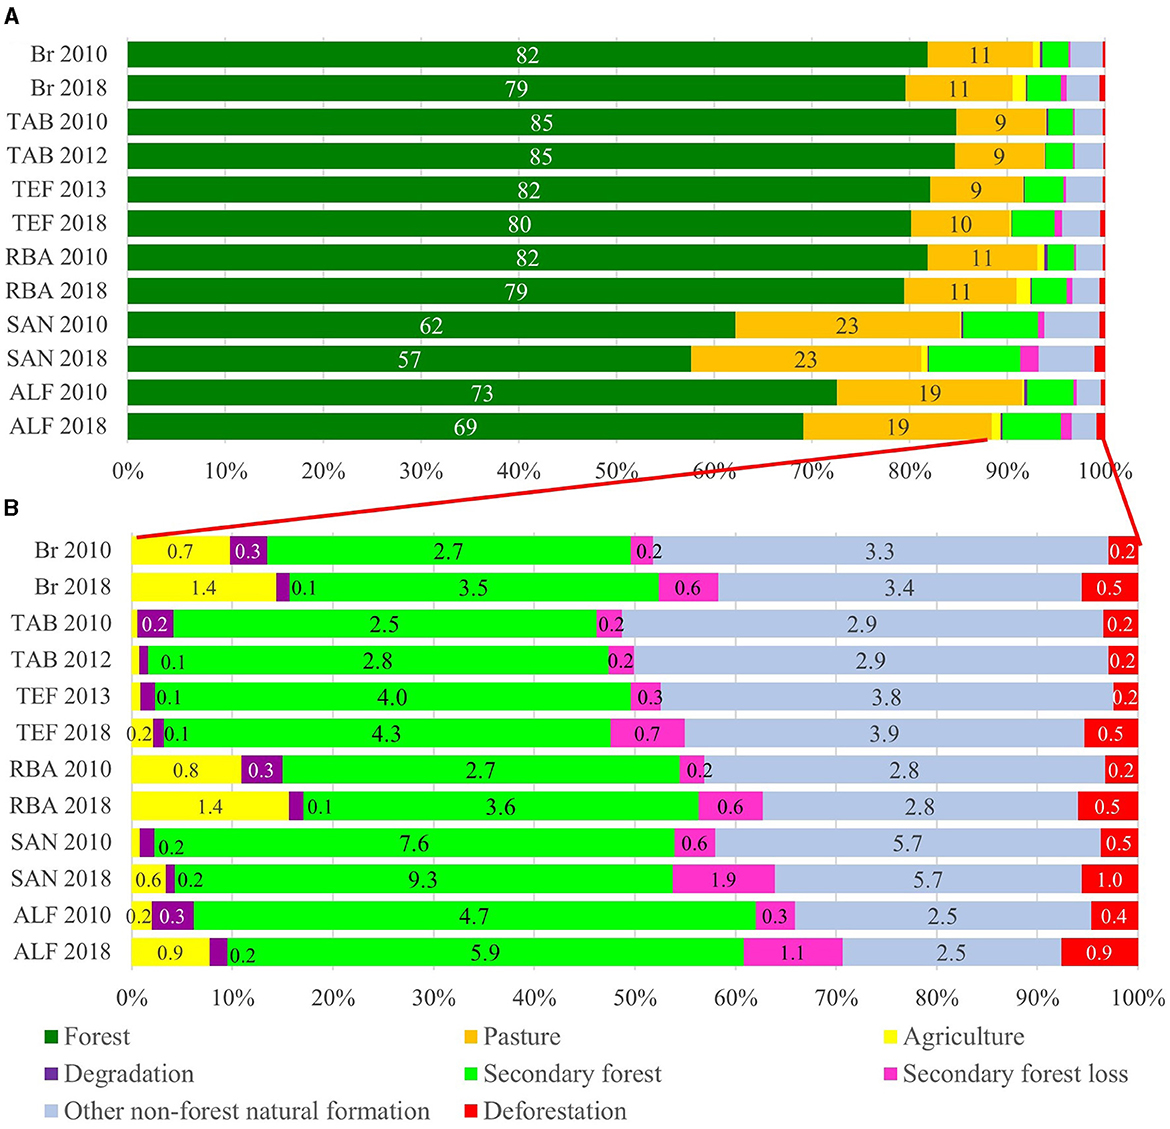
Figure 5. Percentage of land use and cover change (LUCC) in the Brazilian Amazon and each influence region in 2010 and 2018. (A) All LUCC classes; (B) LUCC without forest and pasture (to see better the rest of the classes).
In 2010, the Brazilian Amazon had 82% (3,265,968 km2) of its area covered by forest. Between 2010 and 2018, ~97,066 km2 of its forests were lost, an area larger than Portugal (Figure 4), even though it was only 3% of the Brazilian Amazon forested area. In the same period, the forest loss in the TEF region of influence was 43,239 km2 (2%), in RBA 94,921 km2 (3%), in SAN 29,036 km2 (5%), and in ALF 50,031 km2 (4%; Figure 5).
The second largest land use class in the Brazilian Amazon is pasture (452,039 km2 in 2018; Figures 4, 5). It is also the class for which the total area varied the least. During the period 2010–2018, in the whole Brazilian Amazon, the pasture had increased by 10,455 km2; in RBA, the pasture increased by 9,361 km2 (Figure 5); in TAB, pasture remained constant; in TEF, the increase was 11,774 km2 reaching 226,998 km2 in 2018. In percentage, SAN (23%) and ALF (19%) have almost double the pasture area in 2018 than RBA (11%), TAB (9%), and TEF (11%). Agriculture was very small in TAB (1,123 km2) and SAN (731 km2) in 2010 and TEF (1,659 km2) in 2013. In the Brazilian Amazon and RBA, agriculture areas almost doubled in 2018, reaching 1.4% (25,855 km2). In ALF and SAN, the agricultural area tripled in 2018 compared with 2010, increasing 3,345 and 10,290 km2, respectively. Secondary forest is the third largest LUCC class in all the influence regions. In ALF and SAN, the secondary forest percentage is larger than the other sites; these were 7.6% (48,879 km2) in SAN and 4.7% (67,221 km2) in ALF in 2010, reaching 9.3% (59,215 km2) and 5.9% (84,242 km2) in 2018, respectively (Figure 5).
The water class covers an area of 139,878 km2, and the other non-forest natural formation class covers an area of 100,477 km2. Other non-forest natural formation classes covered 2 and 3% by area in all influence regions except for TEF with 3.9% and SAN with 5.7%. Water class is also ~3%, except for SAN, which is the influence region with the most water at 5.2% (Supplementary Table 2).
The main LUCC classes related to carbon emissions including deforestation, degradation, and secondary forest loss cover a smaller area when compared to other LUCC classes, but they are by far the most important for carbon emissions. In general, secondary forest loss is larger than deforestation and degradation. Nonetheless, in dry years like 2010, 2015, and 2016, degradation emissions are larger than deforestation and secondary forest loss emissions. The area of these three classes increased at all sites, in terms of the percentage of each influence region, and is largest in ALF and SAN (Figure 5).
3.2. Forest carbon stocks
Forest carbon stocks are smaller near deforested areas. The mean forest carbon stocks for each influence region are shown in Figure 6 and Table 4. The highest carbon density areas are in the Guyana Shield biogeographic region, mainly northeast of TAB, TEF, and RBA, with a mean carbon stock of 316 MgCha−1. The central-east Amazon biogeographic region has a mean carbon stock of 260 MgCha−1, with high C stocks in the west and less in the east where part of ALF and SAN are, due to the high historical deforestation. The west biogeographic region covers the southwest of all influence regions, with lower carbon stocks than the central and north Amazon, with a mean of 202 MgCha−1. The lowest carbon stocks are found in the southwest Amazon biogeographic region, with 172 MgCha−1 in part of Acre State, which also represents the smallest area.
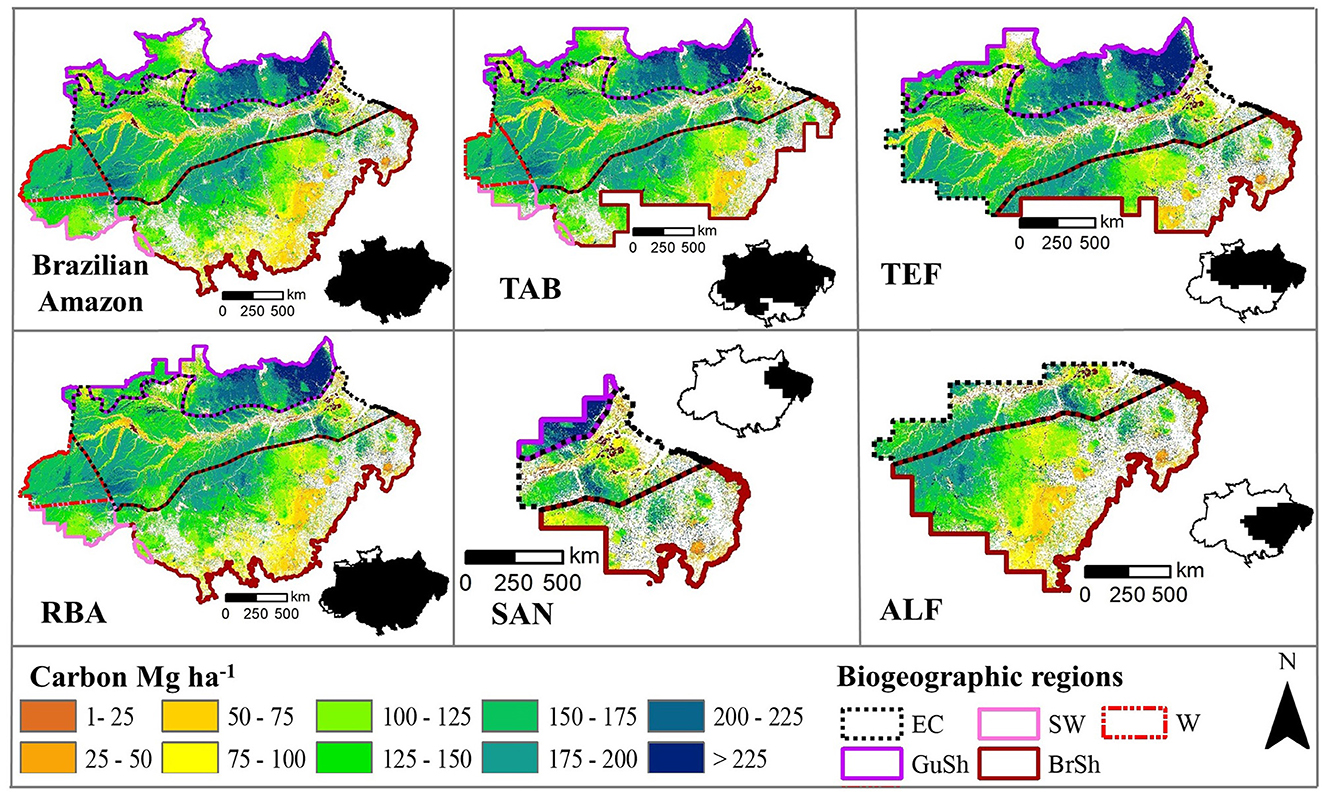
Figure 6. Forest carbon in the Brazilian Amazon in each influence region. Lines represent the biogeographic regions [Brazilian Shield (BrSh), southwest Amazon (SW), the central-east Amazon (EC), the Guyana Shield (GuSh), and the central-west (W)] of Feldpausch et al. (2012) used in Phillips et al. (2017). Forest carbon data from MCTI (2020a).
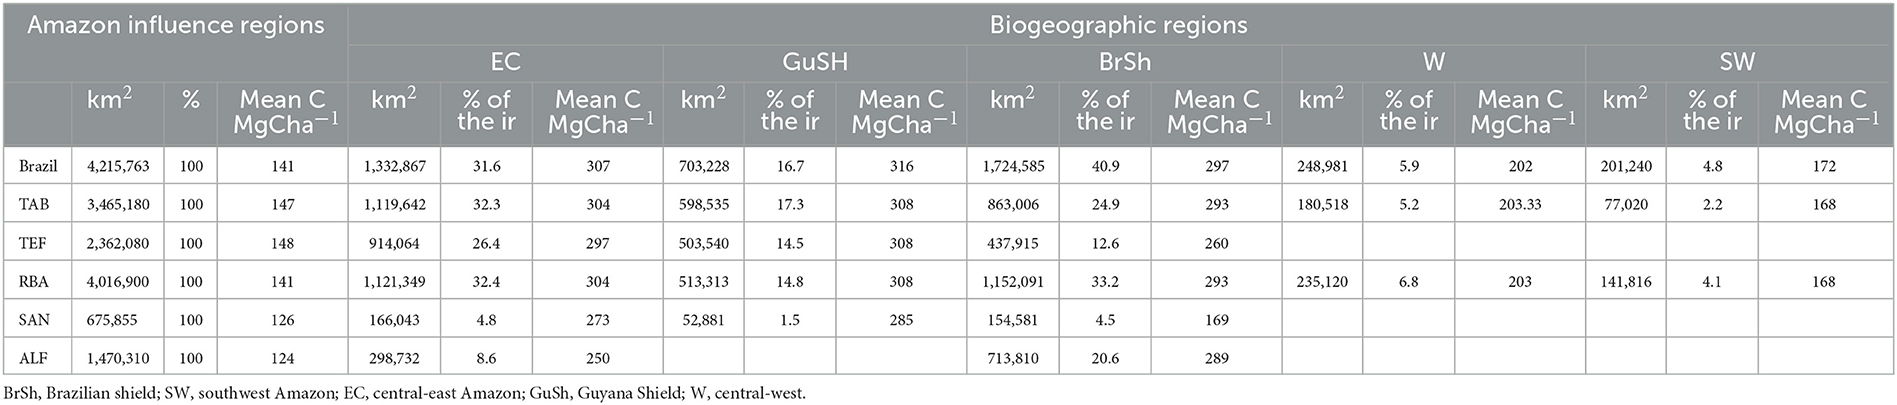
Table 4. Mean forest carbon stocks in the influence regions (ir), by biogeographic regions of Feldpausch et al. (2012) used in Phillips et al. (2017).
The mean forest carbon stocks per influence region follow the same pattern, higher in the north, and northeast than in the central and eastern Amazon. TAB, TEF, and RBA have mean carbon stock close to 145 MgCha−1. SAN has a small area of high carbon stocks in the northeast, but the rest are forest patches with less carbon density than the rest of the influence regions. ALF has more carbon stocks in the east, but in the southeast, there are forest patches with less carbon density. For both the SAN and ALF influence regions, the mean carbon stock is ~125 MgCha−1 (Table 4).
3.3. Top-down and bottom-up CO2 emission and removal estimates
There are conspicuous differences between the bottom-up and top-down CO2 fluxes in our study period (2010–2018), in both the Brazilian Amazon and each influence region (Figure 7 and Supplementary Table 3). First, we show the results of the bottom-up emissions and removal estimates considering the total (sum) fluxes from 2010 to 2018, also looking at each year and then the net bottom-up estimates (emissions less removals). In the case of top-down estimates, we show the total flux, fire flux, and NBE flux (total CO2 estimates minus fire emissions; Figure 7). The top-down fire emissions are not explicitly considered in the bottom-up estimates, but deforestation, degradation, and secondary forest carbon loss emissions partially result from fire. Thus, we indicate the differences between the top-down total CO2 flux with the net bottom-up CO2 flux.
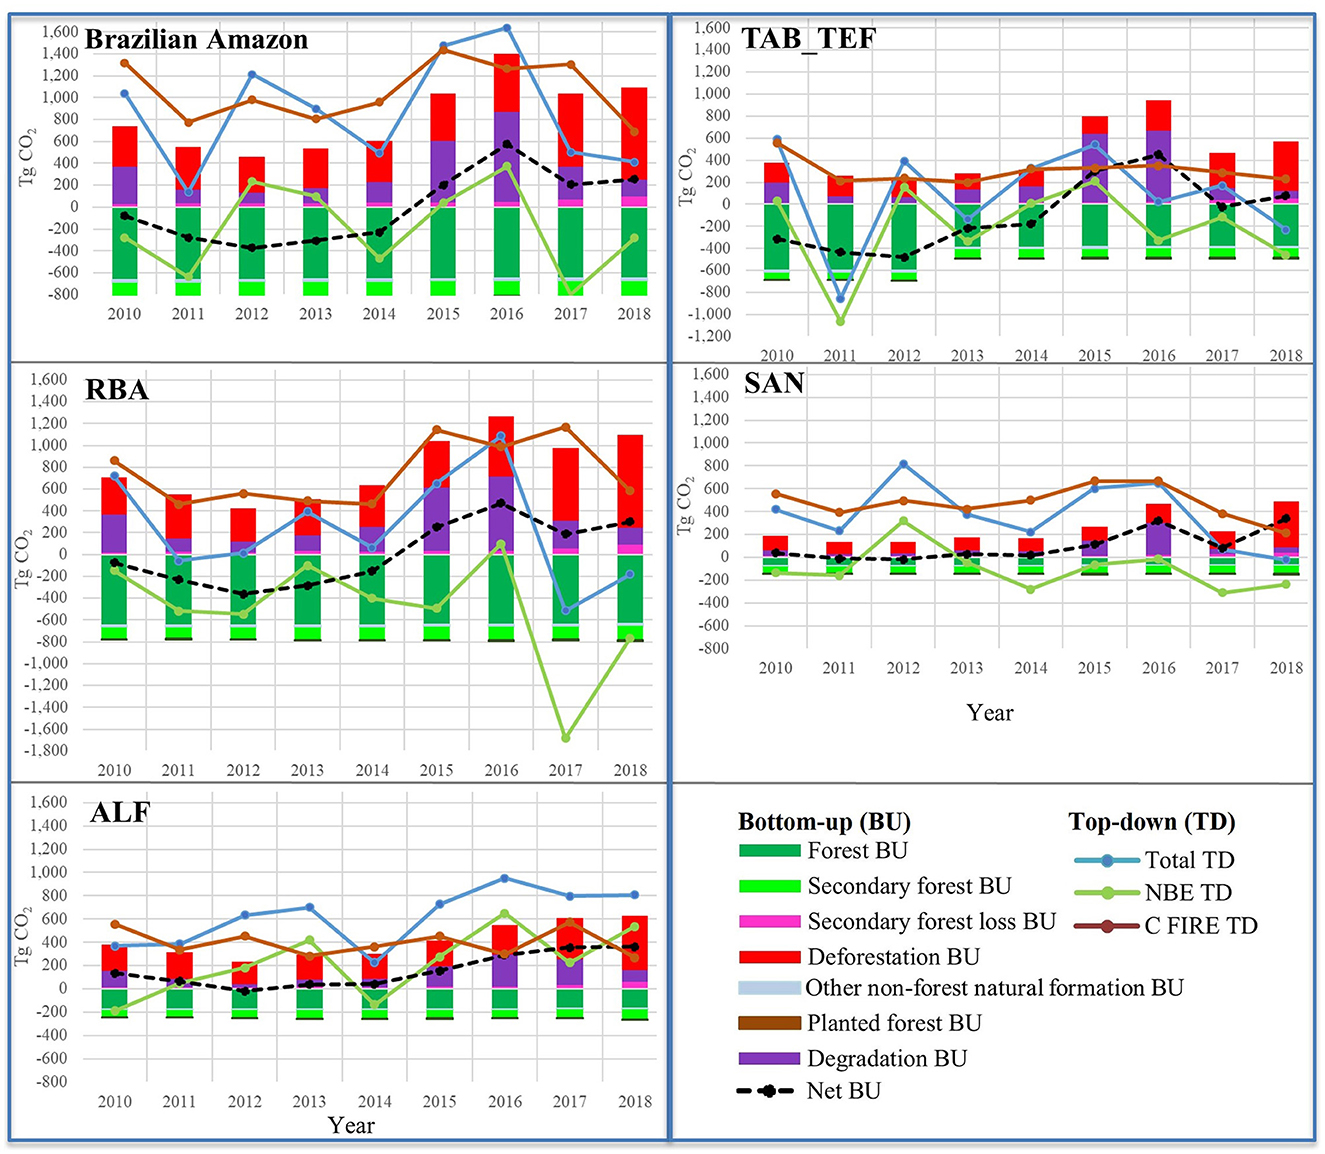
Figure 7. CO2 estimates by the CARBAM measurements (top-down) and land use and cover change (LUCC) estimates (bottom-up). NBE, Net biome exchange; TD, top-down; BU, bottom-up. Detailed CO2 fluxes for each influence region and their 9-year mean are in Supplementary Tables 3, 4.
3.3.1. Bottom-up emissions
For the whole Brazilian Amazon, the bottom-up CO2 emissions, deforestation, and degradation are the largest contributing classes with 58 and 37%, with a total emission (2010–2018) of 4,283 and 2,740 TgCO2, respectively (Supplementary Table 3). Secondary forest loss emissions are smaller (6%) with a total emission of 417 TgCO2.
When analyzing influence regions, total deforestation emissions (2010–2018) in RBA are 4,260 TgCO2 and in TAB_TEF 2,018 TgCO2, followed by degradation emissions with 2,598 and 2,004 TgCO2, respectively. Secondary forest loss total emissions are smaller with 340 TgCO2 in RBA and 200 TgCO2 in TAB_TEF. Considering the relative proportion, for RBA and TAB_TEF deforestation is 59 and 48% and degradation is 36 and 47%, respectively, and secondary forest loss is 5% for both. For SAN and ALF, total deforestation CO2 emissions represent 63 and 64%, degradation 31 and 30%, and secondary forest loss 6 and 8%, respectively. The total deforestation emissions for SAN and ALF are 1,412 and 2,371 TgCO2, respectively, very large emissions considering that these influence regions have a smaller area than RBA and TAB_TEF (Figure 7 and Supplementary Table 3).
3.3.2. Bottom-up estimates of carbon uptake
Looking at the absorption process, primary forests play a fundamental role. From 2010 to 2018 primary forest absorption is 79% (−5,901 TgCO2) in the Brazilian Amazon, 82% (−5,795 TgCO2) in RBA, and 82% (−4,121 TgCO2) in TAB_TEF. In SAN and ALF, primary forest absorption is 47% (−629 TgCO2) in SAN and 67% (−1,554 TgCO2) in ALF. Secondary forest growth is 17% (−1,243 TgCO2) in the Brazilian Amazon, 14% (−1,018 TgCO2) in RBA, 13% (−679 TgCO2) in TAB_TEF, 43% (−582 TgCO2) in SAN, and 27% (−625 TgCO2) in ALF of total removal. The remaining fractional absorption is 3% for other non-forest natural formation classes in the Brazilian Amazon, RBA, TAB_TEF, and ALF, and 5% in SAN. Planted forest class accounts for 1% in the Brazilian Amazon and RBA and 2% in TAB_TEF, 3% in ALF, and 6% in SAN. More details can be found in Supplementary Table 3.
3.3.3. Net bottom-up estimates
In the bottom-up approach between 2010 and 2014, the net CO2 flux (emissions less removals) is a sink in the Brazilian Amazon and the TAB_TEF and RBA influence regions (Figure 7). Since 2015, these influence regions became a carbon source. In the case of SAN, during 2011 (−13 TgCO2yr−1) and 2012 (−17 TgCO2yr−1), the net flux was a sink; but in 2010, 2013, and 2014, the net flux was a source with < 40 TgCO2yr−1, and from 2015 to 2018, it was a source with emissions between 81 and 338 TgCO2yr−1. For ALF, 2012 is the only year as a sink (−18 TgCO2yr−1), in 2011, 2013, and 2014 net flux was a source with < 65 TgCO2yr−1, and from 2015 to 2018, net emissions ranged from 156 to 362 TgCO2yr−1 (Supplementary Table 3).
The year with the highest net carbon emissions from the bottom-up approach was 2016 in the Brazilian Amazon with 577 TgCO2yr−1, RBA with 471 TgCO2yr−1, and TAB_TEF with 450 TgCO2yr−1. SAN had 319 TgCO2yr−1 and ALF 292 TgCO2yr−1 in 2016, but the highest emission was in 2018 with 338 and 362 TgCO2yr−1, respectively. In all the influence regions, forest degradation area peaked in 2016 (Figure 4).
3.3.4. Top-down estimates
In the top-down approach, 2016 was also the year with the highest net emissions in the Brazilian Amazon (1,639 TgCO2yr−1) and the RBA (1,086 TgCO2yr−1) and ALF (950 TgCO2yr−1) influence regions. The exception is TAB_TEF with a peak in 2015 (540 TgCO2yr−1) and very low emissions in 2016 (23 TgCO2yr−1). For SAN, the highest emission year is 2012 (817 TgCO2yr−1) but high emissions also occurred in 2016 (651 TgCO2yr−1; Figure 7 and Supplementary Table 4).
3.3.5. Differences between top-down and bottom-up estimates
Comparing the total CO2 top-down flux and the net bottom-up flux, we see that top-down estimates are considerably higher than the bottom-up estimates in the Brazilian Amazon. From 2010 to 2014, the bottom-up net flux is a sink, and in the total top-down approach, 2010–2018 is a source (Figure 7 and Supplementary Table 3). In 2010, the absolute difference between the approaches reaches 1,121 TgCO2yr−1, and in 2012, it is 1,588 TgCO2yr−1. Since 2015, both approaches are a source in the Brazilian Amazon, but 2015 and 2016 also exhibit a difference in the flux with 1,274 and 1,062 TgCO2yr−1, respectively. In 2017 and 2018, the differences are minor with 296 and 157 TgCO2yr−1, respectively.
In the top-down total flux, TAB_TEF is a sink in 2011 (−854 TgCO2yr−1), 2013 (−138 TgCO2yr−1), and 2018 (−231 TgCO2yr−1). In 2018, the net bottom-up flux (76 TgCO2yr−1) in TAB_TEF is a source. In RBA, the total top-down flux is a sink in 2011 (−58 TgCO2yr−1), the same as the bottom-up flux (−229 TgCO2yr−1). In RBA, 2017 (−516 TgCO2yr−1) and 2018 (−180 TgCO2yr−1) top-down total fluxes are considerable sinks, opposite to the bottom-up fluxes, having an absolute difference of 704 and 482 TgCO2yr−1, respectively. For the rest of the years, the total top-down flux is a source in these influence regions with higher emissions in 2010 (589 TgCO2yr−1) and 2015 (540 TgCO2yr−1) for TAB_TEF and 2016 (1,086 TgCO2yr−1) for RBA. In ALF and SAN, the top-down fluxes suggest a net emission source in all years, also higher than the bottom-up estimates. The only exception is in SAN in 2018, the top-down total flux is a sink (−22 TgCO2yr−1), and the bottom-up net flux (338 TgCO2yr−1) is a source with an absolute difference of 361 TgCO2yr−1 (Figure 7).
4. Discussion
4.1. LUCC annual map
Constructing an annual LUCC map from 2010 to 2018 using several datasets was essential to show the relevance of the different LUCC dynamics, including deforestation, forest degradation, and secondary forest growth and loss. The forest is the largest class within the Brazilian Amazon, but anthropogenic activities related to pasture, secondary vegetation, deforestation, and forest degradation areas have a large extent. There are large and constant pasture areas that could be used to expand agriculture in the Brazilian Amazon and are also potential areas for secondary forest growth. Thus, some studies suggest that there is no need to open new deforestation frontiers (Souza et al., 2020).
The influence regions used in this study represent the annual mean air mass back-trajectory densities from all flights from 2010 to 2018, so we showed the annual LUCC in these areas. However, if additional years of atmospheric measurements (e.g., 2019 and 2020) are included, the number of trajectories would increase, and the boundary of each influence region may change. These modifications could impact the calculation of CO2 fluxes.
Forest degradation, unlike deforestation, has challenges in terms of mapping and monitoring using remote sensing techniques (Costa et al., 2019). As a result, only a few datasets are available for this variable. Consequently, forest degradation is not currently included in NCs or SEEG GHG estimates (Wiltshire et al., 2022). However, our study along with the findings of Assis et al. (2020) indicates that forest degradation areas exceed deforestation and secondary forest loss during dry years (2010, 2015, and 2016). Therefore, we agree with the recommendation of Silva Junior et al. (2021), for the inclusion of forest degradation emissions in NCs.
As expected, the utilization of LUCC datasets employing different methodologies and approaches leads to variations in LUCC extent, consequently resulting in differences in CO2 bottom-up estimates. Fortunately, LUCC datasets continue to progress. For example, the new MapBiomas collections now include secondary forests, deforestation, and fire. Additionally, TerraClass and IBGE are preparing updated versions including new years. As a result, the accuracy and representation of LUCC will continue to improve.
4.2. Forest carbon stocks
The northeast Amazon region exhibits areas of high forest carbon stocks. Interestingly, these high-carbon areas also show significant divergences in biomass datasets, including both field measurements and biomass maps (Ometto et al., 2014; Tejada et al., 2020). On the other hand, areas with higher agreement between datasets, such as the southeast Amazon (Brazilian arc of deforestation), are located in regions with lower carbon stocks, closer to previously deforested or degraded forest areas.
The spatial and temporal scales of biomass maps present limitations for estimating CO2 emissions/removals related to deforestation, degradation, and secondary forest dynamics. Biomass maps represent carbon stocks for specific years; for instance, the 4NC map represents the carbon stocks in 2010 and the Baccini et al. (2012) map represents the carbon stocks in 2000. Unfortunately, the availability of multitemporal (yearly) biomass data is insufficient to assess the carbon changes in secondary forests and degradation. However, with the advent of BIOMASS (Carreiras et al., 2017) and GEDi (Dubayah et al., 2022) new remote sensing missions, designed to have high-resolution, and improved temporal and spatial data, assessing secondary forest and forest degradation annual carbon change will become more feasible.
4.3. Bottom-up and top-down implications
For the bottom-up estimates, we aggregated several methodologies and approaches to designate the appropriate emission/removals factors for each LUCC class dynamics. Environmental factors influencing the growth of primary and secondary forests have been considered for carbon removal estimations. While primary forest carbon stocks are not considered in NCs (or SEEG), except for protected areas, they play a significant role in carbon sequestration. Therefore, we used the mean carbon change (growth of primary forest) derived from the RAINFOR field data (Phillips et al., 2017), considering the biogeographic regions determined by Feldpausch et al. (2011, 2012). The mean carbon change forest growth, as indicated by Phillips et al. (2017), shows a decline in carbon sink over the decades. We used the last decade of the study (2000–2010), which exhibits a 40% decrease in mean forest carbon change compared with the 1980–1990 period. If this trend continues, we can expect a further decline in mean forest carbon change during the 2010–2020 decade. Regarding secondary forest growth, we considered forest age and the location in the Amazon, based on the regions identified by Heinrich et al. (2021). Considering the great extent of secondary forests, it is crucial to map the dynamics of this LUCC class.
In estimations of bottom-up emissions, the main emission classes are deforestation, forest degradation, and secondary forest loss. These classes have contributed to the Amazon region becoming a carbon source since 2015. It is crucial to include these LUCC classes in estimates of emissions. Forest degradation, despite not being considered in NCs (or SEEG), is the largest emission source during dry years (i.e., 2010, 2015, and 2016). Dry years (mainly 2015 and 2016) have high emissions in the estimates of bottom-up and top-down fluxes. Furthermore, removals of primary forests, except those in protected areas, are also not included in the NCs and SEEG despite being a large carbon sink, having absorbed −5,901 TgCO2 in the Brazilian Amazon from 2010 to 2018.
Although the bottom-up and the top-down approaches are not completely comparable, this study reveals interesting insights when comparing both approaches. The bottom-up carbon fluxes depend on LUCC input data (activity data) and the emission/removal factors designation; we assumed constant emission factors without including climate variability. The difference in CO2 flux estimates, according to the LUCC data, is clear when comparing the SEEG and NC estimates (Wiltshire et al., 2022). On the other hand, top-down estimates capture the forest response to climatic conditions during drier or wetter years, as well as the seasonality of atmospheric fluxes. The top-down atmospheric measurements implicitly include sectors of more emissions and removals (e.g., agriculture, industry) than the LULUCF sector fluxes considered in this study. This may explain why the total top-down estimates are higher than the net bottom-up estimates. To better assess the bottom-up net fluxes, it would be pertinent to include specific fire emissions and consider additional sectors such as agriculture. The continuity of the Amazonian atmospheric measurements is essential to understand the carbon balance in the Amazon, as the deforestation and forest degradation processes have been increasing sharply in recent years. Analyzing both bottom-up and top-down approaches will be necessary to reach the climate targets set by the Paris Agreement (Wiltshire et al., 2022).
5. Conclusion
Land use and cover change dynamics are crucial to understand CO2 emissions and removals in the Brazilian Amazon. Our bottom-up analyses conducted from 2010 to 2018 reveal that forest is the predominant land cover class, capturing 79% (−5,901 TgCO2) of the total CO2 removals. Secondary forest is an important carbon sink, capturing 17% of the CO2 total removals. Throughout the study period, forest cover decreased by 97,066 ha, primarily driven by deforestation and degradation, resulting in emissions of 7,023 TgCO2. Forest carbon stocks are higher in RBA, TAB, and TEF influence regions. SAN and ALF influence regions feature smaller areas of high carbon stocks, with most areas containing patches of forests with lower carbon density.
In the bottom-up estimates, from 2010 to 2014, the net CO2 flux in the Brazilian Amazon, TAB_TEF, and RBA influence regions indicates a carbon sink. Since 2015, an increase in deforestation and forest degradation has transformed these influence regions into carbon sources, with the highest emission observed in 2016. Regarding SAN and ALF influence regions, the net CO2 flux shows a sink in 2 years (2011 and 2012), while for the remaining years, it represents a carbon source.
The comparison between the total CO2 top-down and net bottom-up fluxes reveals that top-down estimates are considerably higher than the bottom-up in the Brazilian Amazon and all influence regions, except for 2017 and 2018. The absolute mean difference between the top-down and the bottom-up is larger in the Brazilian Amazon than in the separate influence regions. Additionally, the bottom-up net CO2 exhibits less interannual variation compared to the total top-down fluxes.
Regarding CO2 bottom-up estimates, future methods should focus on evaluating the sensitivity of utilizing multiple datasets, whether derived from remote sensing or in situ data, and assess their impacts on the results. The evolution of remote sensing-derived LUCC information is promising, but additional field validation sites are required to enhance and calibrate these datasets. Top-down atmospheric measurements are essential to understand the Amazon forest's CO2 emissions and removals, and it is important to expand data collection sites in primary forest regions with high carbon density. By considering these aspects, a more robust comparison between bottom-up and top-down approaches may be achieved.
Among other findings, this study shows the relevance of including forest degradation emissions and carbon uptake from primary forests in the national communications on GHG to the UNFCCC to better reflect the efforts needed to accomplish the Nationally Determined Contribution (NDC) under the Paris Agreement.
Data availability statement
The original contributions presented in the study are included in the article/Supplementary material, further inquiries can be directed to the corresponding author.
Author contributions
GT designed the study, collected, analyzed, and reviewed the data and wrote the manuscript. LG, LB, HC, CS-J, GM, and CV participated in the study design, conceptualization, and refinement. LG, LB, MG, JM, AI, HC, GM, and CS-J provided a thorough review and comments on the manuscript. LG, MG, and JM conceived the basinwide atmospheric measurement program and approach. LD, EA, AI, LB, HC, GT, LM, and LG contributed to the region of influence analysis. CS-J processed the secondary forest and deforestation data. LM, LD, CLC, SC, RN, and CC participated in the GHG concentration analysis. All authors read and approved the final manuscript.
Funding
This study was part of the São Paulo Research Foundation (FAPESP) (Grant Nos. 2018/18493-7; 2018/14006-4; 2016/2016/02018-2; 2019/25701-8), UK Environmental Research Council (NERC) AMAZONICA project (NE/F005806/1), NASA grants (11-CMS11-0025, NRMJ1000-17-00431, and NNX17AK49G), European Research Council (ERC) under Horizon 2020 (649087), 7FP EU (283080), MCTI/CNPq (2013), CNPq (134878/2009-4), CNPq (314780/2020-3), and CNPq project (444418/2018-0) and process: (350820/2022-8). Part of this study was also funded by The University of Manchester through the Forest fragmentation mapping of Amazon and its vulnerable margin Amazon Cerrado transition forests project.
Acknowledgments
We are grateful to Ted Feldpaush for the biogeographic regions map and Oliver Phillips for the valuable advice. We also want to thank Eric Bullock for the degradation data. For the valuable comments on this article, we are also grateful to Alex Ovando.
Conflict of interest
The authors declare that the research was conducted in the absence of any commercial or financial relationships that could be construed as a potential conflict of interest.
Publisher's note
All claims expressed in this article are solely those of the authors and do not necessarily represent those of their affiliated organizations, or those of the publisher, the editors and the reviewers. Any product that may be evaluated in this article, or claim that may be made by its manufacturer, is not guaranteed or endorsed by the publisher.
Supplementary material
The Supplementary Material for this article can be found online at: https://www.frontiersin.org/articles/10.3389/ffgc.2023.1107580/full#supplementary-material
References
Aguiar, A. P. D., Ometto, J. P., Nobre, C., Lapola, D. M., Almeida, C., Vieira, I. C., et al. (2012). Modeling the spatial and temporal heterogeneity of deforestation-driven carbon emissions: the INPE-EM framework applied to the Brazilian Amazon. Glob. Chang. Biol. 18, 3346–3366. doi: 10.1111/j.1365-2486.2012.02782.x
Albuquerque, I., Alencar, A., Angelo, C., Azevedo, T., Barcellos, F., Coluna, I., et al (2020). SEEG 8 Análise das Emissões Brasileiras de Gases de Efeito Estufa e Suas Implicações Para as Metas de Clima do Brasil 1970-2019. Available online at: https://seeg-br.s3.amazonaws.com/Documentos~Analiticos/SEEG_8/SEEG8_DOC_ANALITICO_SINTESE_1990-2019.pdf
Alencar, A., Zimbres, B., Shimbo, J., Brandão Jr, A, Arruda, V., et al (2020). Nota Metodológica SEEG 8 Setor Mudança de Uso da Terra e Florestas (Versão 1). Available online at: https://seeg-br.s3.amazonaws.com/2019-v7.0/notas-metodologicas/SEEG8_NOTA_METODOLOGICA_MUT_2020.11.03.pdf
Almeida, C. A., De Coutinho, A. C., César, J., Mora, D., Adami, M., Venturieri, A., et al. (2016). High spatial resolution land use and land cover mapping of the Brazilian Legal Amazon in 2008 using Landsat-5 / TM and MODIS data. ACTA Amaz. 46, 291–302. doi: 10.1590/1809-4392201505504
Aragão, L. E. O. C., Poulter, B., Barlow, J. B., Anderson, L. O., Malhi, Y., Saatchi, S., et al. (2014). Environmental change and the carbon balance of Amazonian forests. Biol. Rev. 89, 913–931. doi: 10.1111/brv.12088
Assis, T. O., de Aguiar, A. P. D., von Randow, C., Melo de Paula Gomes, D., Kury, J. N., Ometto, J., et al. (2020). CO2 emissions from forest degradation in Brazilian Amazonia. Environ. Res. Lett. 15:104035. doi: 10.1088/1748-9326/ab9cfc
Baccini, A., Goetz, S. J., Walker, W. S., Laporte, N. T., Sun, M., Sulla-Menashe, D., et al. (2012). Estimated carbon dioxide emissions from tropical deforestation improved by carbon-density maps. Nat. Clim. Change 2, 182–185. doi: 10.1038/nclimate1354
Basso, L. S., Gatti, L. V., Gloor, M., Miller, J. B., Domingues, L. G., Correia, C. S. C., et al. (2016). Seasonality and interannual variability of CH 4 fluxes from the eastern Amazon Basin inferred from atmospheric mole fraction profiles. J. Geophys. Res. Atmos. 121, 168–184. doi: 10.1002/2015JD023874
Basso, L. S., Marani, L., Gatti, L. V., Miller, J. B., Gloor, M., Melack, J., et al. (2021). Amazon methane budget derived from multi-year airborne observations highlights regional variations in emissions. Commun. Earth Environ. 2:246. doi: 10.1038/s43247-021-00314-4
Bullock, E. L., Woodcock, C. E., Souza, C., and Olofsson, P. (2020). Satellite-based estimates reveal widespread forest degradation in the Amazon. Glob. Chang. Biol. 26, 2956–2969. doi: 10.1111/gcb.15029
Carreiras, J. M. B., Quegan, S., Le Toan, T., Ho Tong Minh, D., Saatchi, S. S., Carvalhais, N., et al. (2017). Coverage of high biomass forests by the ESA BIOMASS mission under defense restrictions. Remote Sens. Environ. 196, 154–162. doi: 10.1016/j.rse.2017.05.003
Cassol, H. L. G., Domingues, L. G., Sanchez, A. H., Basso, L. S., Marani, L., Tejada, G. P., et al. (2020). Determination of region of influence obtained by aircraft vertical profiles using the density of trajectories from the hysplit model. Atmosphere 11:1073. doi: 10.3390/atmos11101073
Costa, O. B., da Matricardi, E. A. T., Pedlowski, M. A., Miguel, E. P., and Gaspar, R. (2019). Selective Logging Detection in the Brazilian Amazon. Floresta Ambient 26, 1–10. doi: 10.1590/2179-8087.063417
Dubayah, R., Armston, J., Healey, S. P., Bruening, J. M., Patterson, P. L., Kellner, J. R., et al. (2022). GEDI launches a new era of biomass inference from space. Environ. Res. Lett. 17:095001. doi: 10.1088/1748-9326/ac8694
EBA (2016). EBA– Estimativa de Biomassa na Amazônia. Melhor. Dos Métodos Estim. Biomassa e Model. Estim. Emiss. Por Mudança Uso Da Terra. Available online at: http://www.ccst.inpe.br/projetos/eba-estimativa-de-biomassa-na-amazonia/ (accessed June 6, 2016).
Feldpausch, T. R., Banin, L., Phillips, O. L., Baker, T. R., Lewis, S. L., Quesada, C. A., et al. (2011). Height-diameter allometry of tropical forest trees. Biogeosciences 8, 1081–1106. doi: 10.5194/bg-8-1081-2011
Feldpausch, T. R., Lloyd, J., Lewis, S. L., Brienen, R. J. W., Gloor, M., Monteagudo Mendoza, A., et al. (2012). Tree height integrated into pantropical forest biomass estimates. Biogeosciences 9, 3381–3403. doi: 10.5194/bg-9-3381-2012
Gatti, L. V., Basso, L. S., Miller, J. B., Gloor, M., Domingues, L. G., Cassol, H. L. G., et al. (2021). Amazonia as a carbon source linked to deforestation and climate change. Nature 595, 388–393. doi: 10.1038/s41586-021-03629-6
Gatti, L. V., Gloor, M., Miller, J. B., Doughty, C. E., Malhi, Y., Domingues, L. G., et al. (2014). Drought sensitivity of Amazonian carbon balance revealed by atmospheric measurements. Nature 506, 76–80. doi: 10.1038/nature12957
Grace, J. (2016). “The Amazon carbon balance: an evaluation of methods and results” in Interactions Between Biosphere, Atmosphere and Human Land Use in the Amazon Basin, eds L. Nagy, B. R. Forsberg, and P. Artaxo (Berlin, Heidelberg: Springer Berlin Heidelberg), 79–100. doi: 10.1007/978-3-662-49902-3_5
Harris, N. L., Brown, S., Hagen, S. C., Saatchi, S. S., Petrova, S., Salas, W., et al. (2012). Baseline map of carbon emissions from deforestation in tropical regions. Science 336, 1573–1576. doi: 10.1126/science.1217962
Heinrich, V. H. A., Dalagnol, R., Cassol, H. L. G., Rosan, T. M., de Almeida, C. T., Silva Junior, C. H. L., et al. (2021). Large carbon sink potential of secondary forests in the Brazilian Amazon to mitigate climate change. Nat. Commun. 12, 1–11. doi: 10.1038/s41467-021-22050-1
IBGE (2016). Mudanças Na Cobertura e Uso da Terra 2000-2010-2012-2014. Rio de Janeiro: IBGE. Available online at: ftp://geoftp.ibge.gov.br/informacoes_ambientais/cobertura_e_uso_da_terra/mudancas/documentos/mudancas_de_cobertura_e_uso_da_terra_2000_2010_2012_2014.pdf
IBGE (2018). Monitoramento da Cobertura e Uso da Terra do Brasil 2014-2016. Rio de Janeiro: IBGE. Available online at: https://www.ibge.gov.br/apps/monitoramento_cobertura_uso_terra/v1/ (accessed April 2, 2019).
INPE (2022). Amazon Deforestation Monitoring Project (PRODES). INPE. Available online at: http://terrabrasilis.dpi.inpe.br/downloads/
IPCC (2006). “ IPCC guidelines for national greenhouse gas inventories volume - iv agriculture, forestry and other land use,” in 2006 IPCC Guidelines for National Greenhouse Gas Inventories, eds H. S. Eggleston, L. Buendia, and K. Miwa (Hayama: Institute for Global Environmental Strategies (IGES)), 1–83.
MapBiomas (2020). Projeto MapBiomas – Coleção [4.1] da Série Anual de Mapas de Cobertura e Uso de Solo do Brasil. Available online at: https://mapbiomas.org/colecoes-mapbiomas-1?cama_set_language=pt-BR (accessed September 14, 2020).
MCTI (2016). Third National Communication of Brazil to the United Nations Framework Convention on Climate Change – Volume III. Ministério da Ciência Brasília.
MCTI (2020a). Fourth National Communication of Brazil to the UNFCCC. Available online at: https://unfccc.int/documents/267657 (accessed January 15, 2021).
MCTI (2020b). Relatório de Referência: Setor Uso da Terra, Mudança do Uso da Terra e Florestas. Quarta Comunicação Nacional de Emissões e Remoções Antrópicas de Gases de Efeito Estufa. Available online at: https://www.gov.br/mcti/pt-br/acompanhe-o-mcti/sirene/publicacoes/relatorios-de-referencia-setorial
Nogueira, E. M., Fearnside, P. M., Nelson, B. W., Barbosa, R. I., and Keizer, E. W. H. (2008). Estimates of forest biomass in the Brazilian Amazon: new allometric equations and adjustments to biomass from wood-volume inventories. For. Ecol. Manage. 256, 1853–1867. doi: 10.1016/j.foreco.2008.07.022
Olson, D. M., Dinerstein, E., Wikramanayake, E. D., Burgess, N. D., Powell, G. V. N., Underwood, E. C., et al. (2001). Terrestrial ecoregions of the world: a new map of life on earth. Bioscience 51:933. doi: 10.1641/0006-3568(2001)051[0933:TEOTWA]2.0.CO;2
Ometto, J. P., Aguiar, A. P., Assis, T., Soler, L., Valle, P., Tejada, G., et al. (2014). Amazon forest biomass density maps: tackling the uncertainty in carbon emission estimates. Clim. Change 124, 545–560. doi: 10.1007/s10584-014-1058-7
Pan, Y., Birdsey, R., Fang, J., Houghton, R., Kauppi, P. E., Kurz, W., et al. (2011). A large and persistent carbon sink in the world's forests. Science 333, 988–993. doi: 10.1126/science.1201609
Phillips, O. L., Brienen, R. J. W., Gloor, E., Baker, T. R., Lloyd, J., Lopez-Gonzalez, G., et al. (2017). Carbon uptake by mature Amazon forests has mitigated Amazon nations' carbon emissions. Carbon Balance Manag. 12, 1–9. doi: 10.1186/s13021-016-0069-2
Rappaport, D. I., Morton, D. C., Longo, M., Keller, M., Dubayah, R., and Dos-Santos, M. N. (2018). Quantifying long-term changes in carbon stocks and forest structure from Amazon forest degradation. Environ. Res. Lett. 13:065013. doi: 10.1088/1748-9326/aac331
Silva Junior, C. H. L., Carvalho, N. S., Pessôa, A. C. M., Reis, J. B. C., Pontes-Lopes, A., Doblas, J., et al. (2021). Amazonian forest degradation must be incorporated into the COP26 agenda. Nat. Geosci. 14, 634–635. doi: 10.1038/s41561-021-00823-z
Silva Junior, C. H. L., Heinrich, V. H. A., Freire, A. T. G., Broggio, I. S., Rosan, T. M., Doblas, J., et al. (2020). Benchmark maps of 33 years of secondary forest age for Brazil. Sci. Data 7:269. doi: 10.1038/s41597-020-00632-w
Silva, C. H. L., Aragão, L. E. O. C., Anderson, L. O., Fonseca, M. G., Shimabukuro, Y. E., Vancutsem, C., et al. (2020). Persistent collapse of biomass in Amazonian forest edges following deforestation leads to unaccounted carbon losses. Sci. Adv. 6:eaaz8360. doi: 10.1126/sciadv.aaz8360
Souza, C. M., Shimbo, J. Z., Rosa, M. R., Parente, L. L., Alencar, A. A., Rudorff, B. F. T., et al. (2020). Reconstructing three decades of land use and land cover changes in Brazilian biomes with landsat archive and earth engine. Remote Sens. 12:2735. doi: 10.3390/rs12172735
Stein, A. F., Draxler, R. R., Rolph, G. D., Stunder, B. J. B., Cohen, M. D., Ngan, F., et al. (2015). NOAA's HYSPLIT atmospheric transport and dispersion modeling system. Bull. Am. Meteorol. Soc. 96, 2059–2077. doi: 10.1175/BAMS-D-14-00110.1
Tejada, G., Görgens, E. B., Ovando, A., and Ometto, J. P. (2020). Mapping data gaps to estimate biomass across Brazilian Amazon forests. For. Ecosyst. 7:25. doi: 10.1186/s40663-020-00228-1
Wiltshire, A. J., Randow, C., Rosan, T. M., Tejada, G., and Castro, A. A. (2022). Understanding the role of land-use emissions in achieving the Brazilian Nationally Determined Contribution to mitigate climate change. Clim. Resil. Sustain. 1:e31. doi: 10.1002/cli2.31
Keywords: Amazon, land use and cover change, CO2 atmospheric measurements, CO2 emissions, emission factors, bottom-up top-down approaches
Citation: Tejada G, Gatti LV, Basso LS, Cassol HLG, Silva-Junior CHL, Mataveli G, Marani L, Arai E, Gloor M, Miller JB, Cunha CL, Domingues LG, Ipia A, Correia CSC, Crispim SP, Neves RAL and Von Randow C (2023) CO2 emissions in the Amazon: are bottom-up estimates from land use and cover datasets consistent with top-down estimates based on atmospheric measurements? Front. For. Glob. Change 6:1107580. doi: 10.3389/ffgc.2023.1107580
Received: 25 November 2022; Accepted: 24 July 2023;
Published: 23 August 2023.
Edited by:
Barry Alan Gardiner, Institut Européen De La Forêt Cultivée (IEFC), FranceReviewed by:
Leonardo Montagnani, Free University of Bozen-Bolzano, ItalyEkena Rangel Pinage, Oregon State University, United States
Copyright © 2023 Tejada, Gatti, Basso, Cassol, Silva-Junior, Mataveli, Marani, Arai, Gloor, Miller, Cunha, Domingues, Ipia, Correia, Crispim, Neves and Von Randow. This is an open-access article distributed under the terms of the Creative Commons Attribution License (CC BY). The use, distribution or reproduction in other forums is permitted, provided the original author(s) and the copyright owner(s) are credited and that the original publication in this journal is cited, in accordance with accepted academic practice. No use, distribution or reproduction is permitted which does not comply with these terms.
*Correspondence: Graciela Tejada, Z3JhY2llbGF0ZWphZGFwQGdtYWlsLmNvbQ==