
95% of researchers rate our articles as excellent or good
Learn more about the work of our research integrity team to safeguard the quality of each article we publish.
Find out more
ORIGINAL RESEARCH article
Front. For. Glob. Change , 14 February 2023
Sec. Forest Management
Volume 6 - 2023 | https://doi.org/10.3389/ffgc.2023.1019277
This article is part of the Research Topic Mountainous Forest Ecosystems: Challenges and Management Implications View all 16 articles
 Zishan A. Wani1
 Vikram S. Negi2
 Jahangeer A. Bhat3
 K. V. Satish4
 Ashish Kumar5
 Sajid Khan1
 Rupesh Dhyani2Sazada Siddiqui6Rahmah N. Al-Qthanin6
 Shreekar Pant1*
Elevational gradient, slope, and aspect offer a unique opportunity to explore the response of plant species under changing environmental conditions. The present study aimed to analyze the species diversity and distribution patterns with respect to altitude, aspect, and habitat types in the Kashmir Himalayas. Considering major aspects and habitats, a total of 123 representative sites were selected along the elevational gradients for the present study. The plant species composition of each selected site was studied by organized sampling following the standard ecological methods. During the present study, a total of 361 vascular plant species belonging to 71 families and 214 genera were identified in the study area. At the lower altitudes, the southern aspect and drier habitats showed the highest diversity. Moreover, a significant amount of compositional dissimilarity was observed between the studied aspects, habitats, and elevation belts and was mainly due to species turnover rather than the nestedness component. Further, among the studied variables, altitude was the most important contributing variable, explaining the greatest variation in the species composition. The paired effects of altitude and habitat explained the maximum variation in plant species composition. It may be concluded that floristic diversity should be studied not only with reference to elevational gradients but should also include aspects and habitats. The current study will act as a reference in this direction. A similar study must be replicated in other parts of the Himalayan region in the future to improve our understanding of the distribution and preferences of plant species in mountainous zones. This, in turn, will be immensely helpful in the conservation and sustainable utilization of resources in these ecologically fragile regions.
In an ecosystem, the vegetational structure, composition, and function are among the significant attributes showing considerable variation with changing biotic and abiotic variables (Bisht and Bhat, 2013; Rawat et al., 2018; Wani et al., 2022a). Slope, aspect, elevation, and edaphic factors are some examples of the widely studied variables that shape the community structure and distribution of species, especially in mountainous ecosystems (Gairola et al., 2011; Dar and Sundarapandian, 2016). Among these factors, the topographic factors significantly impact vegetation and plants' growth (Davies et al., 2007), especially when the research scale is narrow (Zhang et al., 2021). Therefore, it is imperative to undertake site-specific studies instead of regional and national ones to better understand the changing patterns of biodiversity and its key drivers, especially in mountainous regions. In mountainous regions, the topographic alterations are considerable, and local environmental conditions are complex. Topographic variations act as significant indicators because of their key role in influencing the temperature and moisture of the habitat (Raulings et al., 2010). The biotic and abiotic gradients on mountains have the enormous potential to improve our understanding of species distributions and richness patterns (McCain and Grytnes, 2010). The main biotic and abiotic factors under the local topographic influence are hydrology, incident solar radiation, wind exposure, geochemistry, and biotic conditions (Moeslund et al., 2013). Micro-climatic conditions may vary significantly over short spatial scales in mountainous areas due to the steep environmental gradients and thus substantially influence vegetation distribution and species richness patterns (McCain and Grytnes, 2010). Hamid et al. (2021) found significant differences in the edaphic properties along elevation gradients and changing aspects in their study. They also discovered that aspect play an important role, in addition to elevation, in determining the survival of plant populations in mountainous areas.
On a habitat scale, the presence of a species is limited by the vegetation structure, edaphic gradients, and management-related gradients of the habitat (Wamelink et al., 2014). These gradients within the habitats not only affect the overall vegetation composition but also substantially impact the distribution of native and alien plant species (Khuroo et al., 2011). According to previous studies (McCain and Colwell, 2011), altitudinal gradients in mountainous regions provide valuable natural settings for investigating the long-term ecological and evolutionary effects of environmental changes on different species. These gradients are characterized by several predictable changes in environmental factors, including a decline in temperature with increasing elevation and an average of 0.6°C per 100 m (Barry, 2008). Other abiotic factors that vary along the elevation gradients include decreasing air pressure and increasing solar radiation (Barry, 2008; McCain and Grytnes, 2010). However, precipitation does not change consistently with elevation on all mountains but varies greatly due to regional mountains and weather conditions (Barry, 2008). The gradients in these abiotic factors strongly influence the distribution of species along the elevation gradient. Owing to these changing abiotic factors with increasing elevations, it is believed that diversity decreases linearly with elevation (MacArther, 1972; Korner, 1998); however, recent studies (Trigas et al., 2013; Zhou et al., 2018; Rawat et al., 2021) showed that plant diversity often peaks at mid-elevations (reflecting hump-shaped patterns of species richness), which vary among taxa and mountainous ranges in different climatic conditions across the world (McCain, 2007; Sharma et al., 2019). Therefore, altitude is one of the foremost ecological factors influencing the distribution of species and composition of the ecosystem and is thus significant for understanding the patterns of biodiversity in an ecosystem (Rezende et al., 2015).
The Himalayan mountains are among the highest in the world and act as treasure troves of biodiversity. The higher level of endemism in the region suggests the presence of diverse critical habitats and ecoregions of global importance in the region. Owing to the rich biodiversity of the region, it is among the world's major biodiversity hotspots (Khoshoo, 1992; Myer et al., 2000). The Himalayan mountains provide an altitudinal range representing the world's longest bioclimatic gradient (Grytnes and Vetaas, 2002). All these features have made the Himalayas an interesting candidate for biodiversity studies along the altitudinal gradients. Many researchers have studied patterns of species diversity along altitudinal gradients in the Himalayan region (Rawat et al., 2018; Ahmad et al., 2020; Bhat et al., 2020; Sharma and Kala, 2022). However, due to the remote and difficult-to-reach terrains in high-altitude areas, only a few studies have been conducted on the species composition and diversity in these remote areas of the Himalayas. As a result, the available information about vegetation distribution and its core drivers in the Himalayan mountains is scarce (Wani et al., 2022b). To address this knowledge gap, the present study attempts to examine plant species diversity and distribution patterns with respect to changing elevations, aspects, and habitat types in the Kashmir Himalaya—an integral part of the Himalayan Biodiversity Hotspot. The present study hypothesizes that species diversity and composition change with changes in elevation, aspect, and habitat types and that species diversity and richness decrease with an increase in elevation, with elevation being the most important factor determining changes in species diversity and composition.
The Gulmarg Wildlife Sanctuary (GWLS) is located between 74°17′-74°79′ N latitude and 34°55′-34°60′ E longitude (Figure 1). The sanctuary is situated 52 km southwest of the Baramulla district, on the western side of Kashmir Himalaya within the Pir Panjal range. This sanctuary encompasses two administrative units: the Ferozpora/Tangmarg Block and the Gulmarg Block, covering a total area of 180 km2. Furthermore, the sanctuary is composed of two distinct altitudinal regions, with 120 km2 of the area falling in the alpine zone and the remaining 60 km2 lying in the lower altitudinal area (www.jkwildlife.com, assessed on 15 April 2021). The natural beauty of Gulmarg and its proximity to Srinagar make it a popular destination for tourists, both local and international, attracting a huge influx of visitors annually (Nanda et al., 2019). The forest area of the sanctuary is primarily dominated by Abies pindrow, Pinus wallichiana, Cedrus deodara, Picea smithiana, and Betula utilis, with the latter forming the tree line in the region (Naqshi et al., 1984).
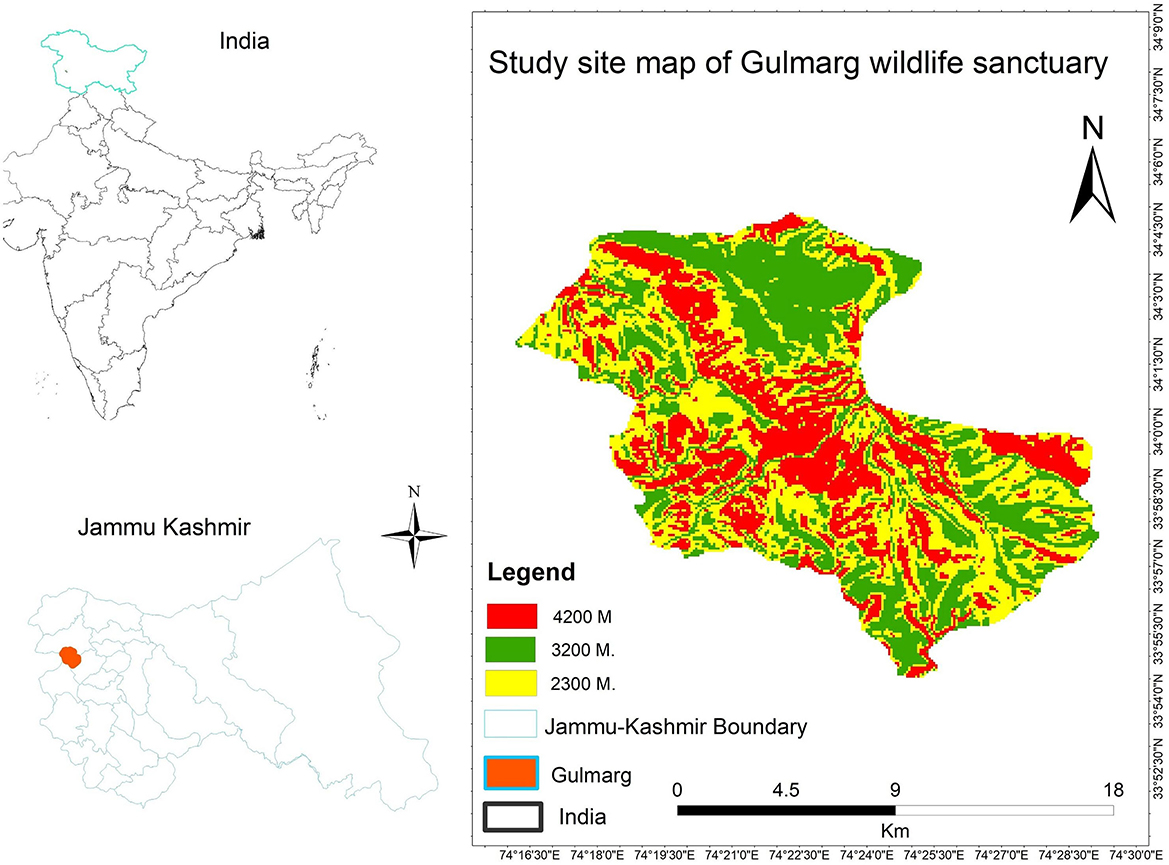
Figure 1. Location map of the study area.
Sites were selected randomly to represent each accessible aspect and habitat type along the vertical gradient. Physical characters and dominance of the vegetation were analyzed for habitat identification. The study classified habitats according to canopy cover, humus content, and moisture levels. Habitats with closed canopies and high levels of humus and moisture were referred to as “shady, moist habitats,” while habitats with low levels of humus and moisture were referred to as “dry habitats.” Habitats with high moisture concentrations but no canopy cover were designated as “moist habitats.” Habitats with more than 50% of their area covered by boulders were classified as “boundary habitats,” and habitats with more than 50 rocks were classified as “rocky habitats.” Grassland patches within forests were considered “open habitats.” Additionally, habitats facing high levels of human-induced degradation, such as deforestation, overgrazing, and trampling, were classified as “degraded habitats.” To assess the pattern of plant diversity in these habitats, vegetational sampling was conducted throughout the study area, taking into consideration environmental variables such as altitude, aspect, and habitat type. The plant species composition of each selected site was studied using the quadrat method, which is a widely-used and unbiased method of sampling (Bhatta et al., 2012). Elevation and aspect measurements were recorded using a Garmin GPS 73. The study area was mapped using ArcGIS 10.3. To assess diversity, plots of 50 × 50 m in the forest zone and 20 × 20 m in the alpine zone were established at each site. Within each plot, 10 (10 × 10 m) quadrats for trees, 10 (5 × 5 m) quadrats for shrubs, and 20 (1 × 1 m) quadrats for herbs were laid out at each elevational belt, representing different aspects and habitat types, following previous studies (Samant et al., 2007a; Negi et al., 2018; Rawat et al., 2018). As the alpine zone is devoid of trees, only 10 (5 × 5 m) quadrats for shrubs and 20 (1 × 1 m) quadrats for herbs were laid in each plot. Vascular plant species encountered during field surveys were collected, tagged, and brought to the laboratory, where they were mounted on herbarium sheets using standard herbarium techniques (Smith, 1971; Jain and Rao, 1976; Smith and Chinnappa, 2015). All the collected specimens were identified to the species level using local floras (Bhat, 1984; Naqshi et al., 1984; Singh et al., 2002) and further authenticated at the Centre for Biodiversity and Taxonomy, University of Kashmir. The correct nomenclature and family were assigned to each identified plant species using the Plants of the World Online database1.
Abundance data from all the sampling sites were analyzed in relation to aspect and habitat types. However, to study the diversity patterns along the altitudinal gradient, the total sampling sites were grouped into 20 100-m elevation belts, and the average species abundance at each 100-m elevational interval from 2,300 to 4,200 m above sea level was calculated. To estimate the total plant diversity at each site and each 100-m elevational belt, we used the Renyi diversity profiles within the vegan 2.5–7 package (Oksanen et al., 2020). The values of the Renyi diversity profiles (Hα) were calculated from the average abundance values of the quadrats laid out at each site and the elevational belt using a scaling parameter (α) ranging from zero to infinity (Kindt and Coe, 2005) according to the following formula:
where pi is the average abundance of a species at a site and α is the scaling parameter (Kindt and Coe, 2005; Oksanen et al., 2020). Diversity values were calculated for the default α scale of 0 to infinity following the study of Wani et al. (2022b). Further, a generalized additive model using the “mgcv” package was performed to analyze the impact of altitude on total species richness and the Shannon diversity index.
For analyzing the difference in the observed species composition among the selected sites and elevational belts, non-metric multidimensional scaling (NMDS) using abundance data was performed in a vegan 2.5-7 package (Oksanen et al., 2020). According to the NMDS, the studied sites are ordered in a multidimensional space so that the sites with comparable floristic compositions are assembled in the ordination diagram (Hochstedler et al., 2007; Rawat et al., 2021). Further, to evaluate its accuracy, the associated stress value was calculated. The value of associated stress ranges from 0 to 1; 0 represents no stress, whereas 1 represents a complete lack of fit (Legendre and Legendre, 2012; Rawat et al., 2021; Shahabuddin et al., 2021). The observed degree of compositional dissimilarities between the selected sites was statistically tested using the permutational analysis of variance (PERMANOVA), wherein both the Bray–Curtis and Jaccard indices were used to investigate whether species relative abundances or the presence and/or absence of species are responsible for the observed compositional differences (Shahabuddin et al., 2021). The associated statistical significance was calculated by setting alpha at 0.05 based on 999 permutations.
Moreover, the overall and pairwise β diversity between the studied sites and elevational belts was calculated using the beta version 1.5.4 package (Baselga et al., 2021). This method uses presence/absence data and separates the observed dissimilarity (βSOR) into species turnover (βSIM) and nestedness (βSNE) (Baselga and Orme, 2012). It also clusters different aspects and habitat types along elevation belt-based dissimilarity resulting from both βSIM and βSNE components separately. Additionally, variation partitioning was performed to investigate the relative effects of altitude, aspect, and habitat type on plant species composition using the varpart function from the vegan package version 2.5-7 (Oksanen et al., 2020). This method partitions the total variation into seven fractions attributed to (i) the individual effect of altitude (A), (ii) the individual effect of aspect (AS), (iii) the individual effect of habitat (H), and the shared effect due to each possible pair (iv) altitude and aspect (A n AS), (v) altitude and habitat (A n H), (vi) aspect and habitat (AS n H) and the combined effect of all three underlying variables, and (vii) altitude, aspect, and habitat (A n AS n H). We evaluated the associated statistical significance based on the Monte Carlo permutation test using 999 permutations. As the shared effects were obtained simply by subtraction, they were not tested for statistical significance (Legendre and Legendre, 2012).
In the present study, a total of 123 sites were sampled, representing all possible aspects and habitat types in the study area. Of these sites, the greatest number (25) were in the southern aspect, followed by the northern (20), northwest (19), eastern (17), southeast (13), northeast (11), southwest (10), and western (8) aspects. The habitats of the sites were primarily represented by shady moist at 27 sites, followed by rocky (24), bouldary (20), degraded (17), riverine (13), dry (12), open (6), and moist (4). A total of 361 plant species from 71 families and 214 genera were identified from the study area (Supplementary Table S1). The Asteraceae were the dominant family with 54 species, followed by the Lamiaceae, Rosaceae, and Ranunculaceae with 23, 20, and 19 species, respectively. The Ranunculus genus was the most prevalent with seven species, followed by Anaphalis and Nepeta with six and five species, respectively. The dominant growth form was represented by herbaceous forms (82.7%), followed by shrubs (10.5%), trees (5.7%), and climbers (1.1%).
The Renyi diversity profiles for the selected aspects are presented in Figure 2A. The diversity profile revealed that the highest plant species diversity was found in the southern aspect at the scaling parameter (α) values between 0 and 1, while the diversity was higher in the southeast aspect for the rest of the scaling parameter (α) values. In contrast, the lowest plant species diversity was observed at the northeast aspect at all scaling parameter (α) values (Figure 2A). Furthermore, the Renyi diversity profiles for the studied habitat types are presented in Figure 2B. The highest plant species diversity was observed in dry habitats at α values between 0 and 2 and in moist habitats for the remaining scaling parameters. In contrast, the lowest plant species diversity was found in open aspects at α values between 0 and 2 but in rocky and degraded habitats for the remaining α values (Figure 2B). Additionally, the Renyi diversity profiles for the selected elevation belts showed that the highest plant species diversity was found at an elevation of 2,400 m for α values between 0 and 1 but at a 2,700-m elevation belt for the remaining α values. In contrast, the lowest species diversity was found at an elevation of 4,200 m for α values between 0 and 1 but at 3,700 m for the remaining α values (Figure 2C). Furthermore, GAM analysis revealed that total species richness and diversity decreased with an increase in elevation and follow a unimodal pattern (Figure 3).
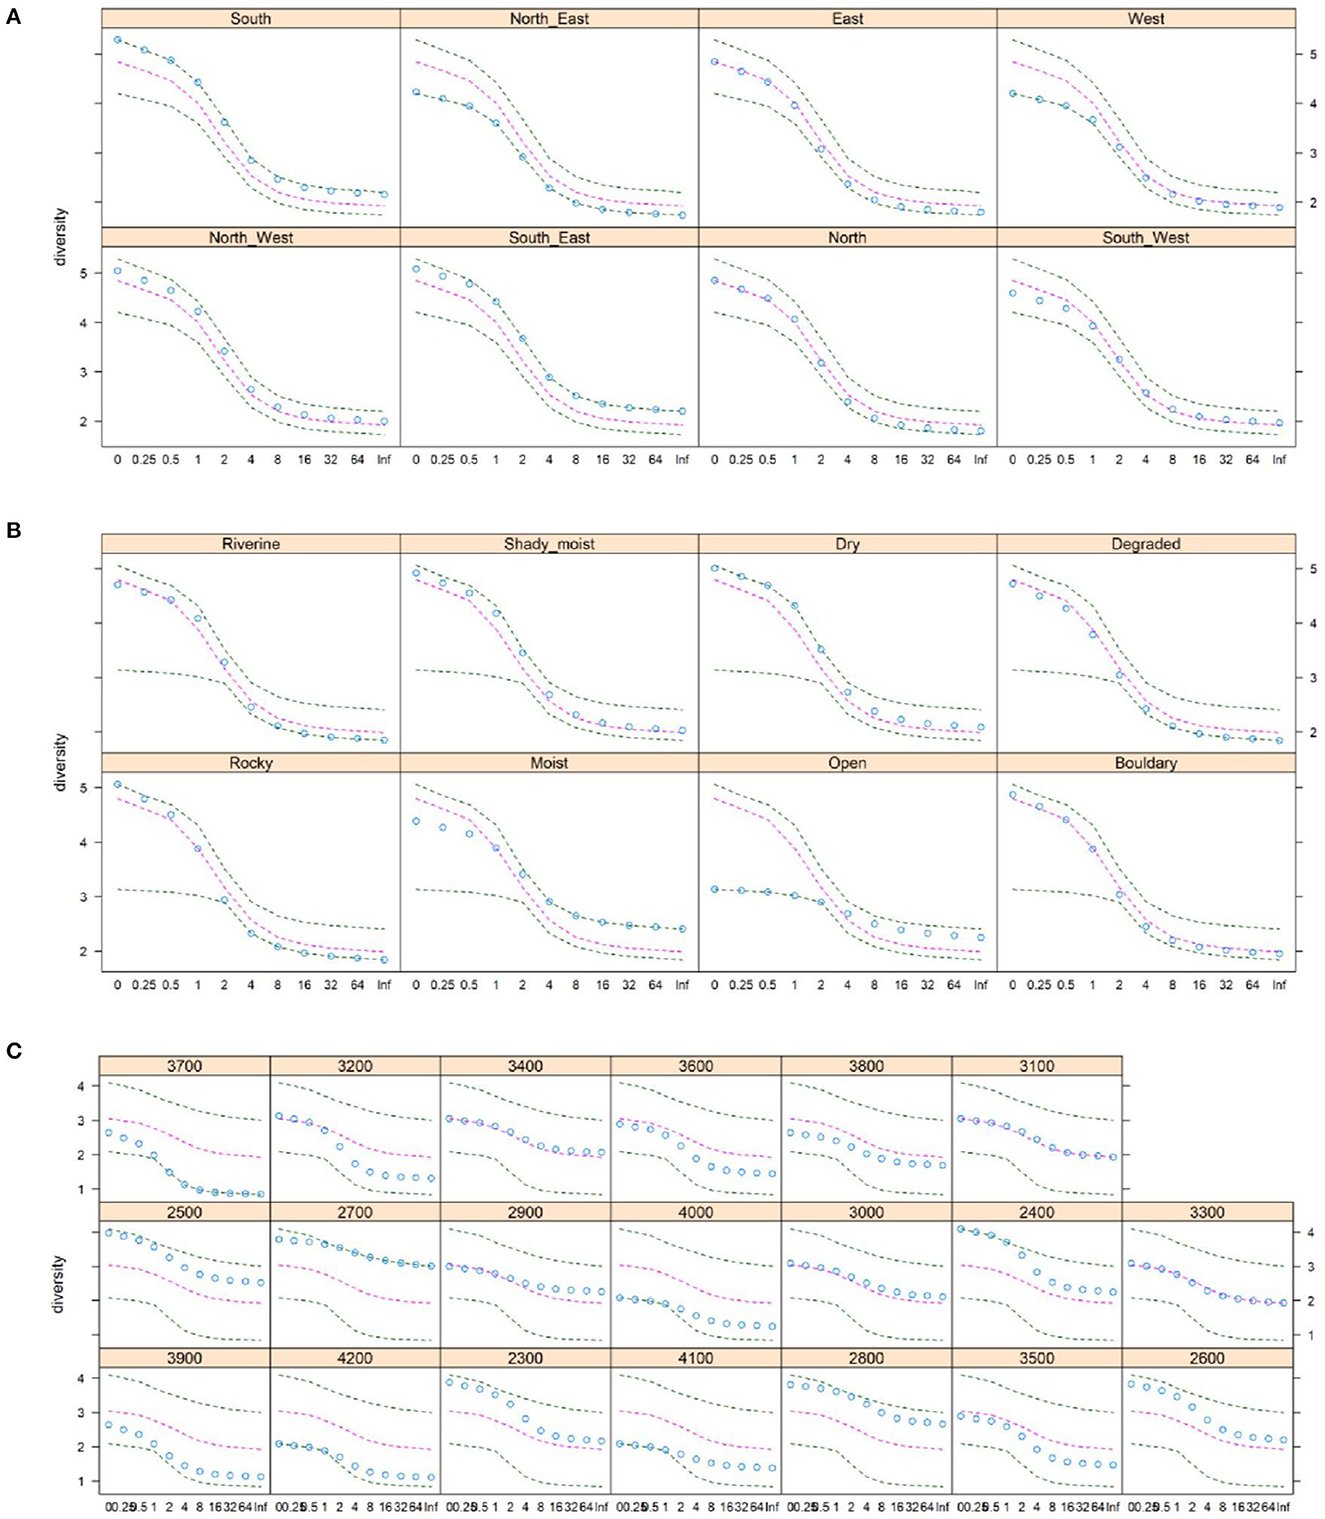
Figure 2. The Renyi diversity profiles, showing the total plant species diversity along the selected (A) aspects, (B) habitats, and (C) 100-m elevational belts. The dots represent the diversity value at different values of the scaling parameter (α). The outer two black dashed lines represent the extremes, and the inner pink lines represent the median in the data.
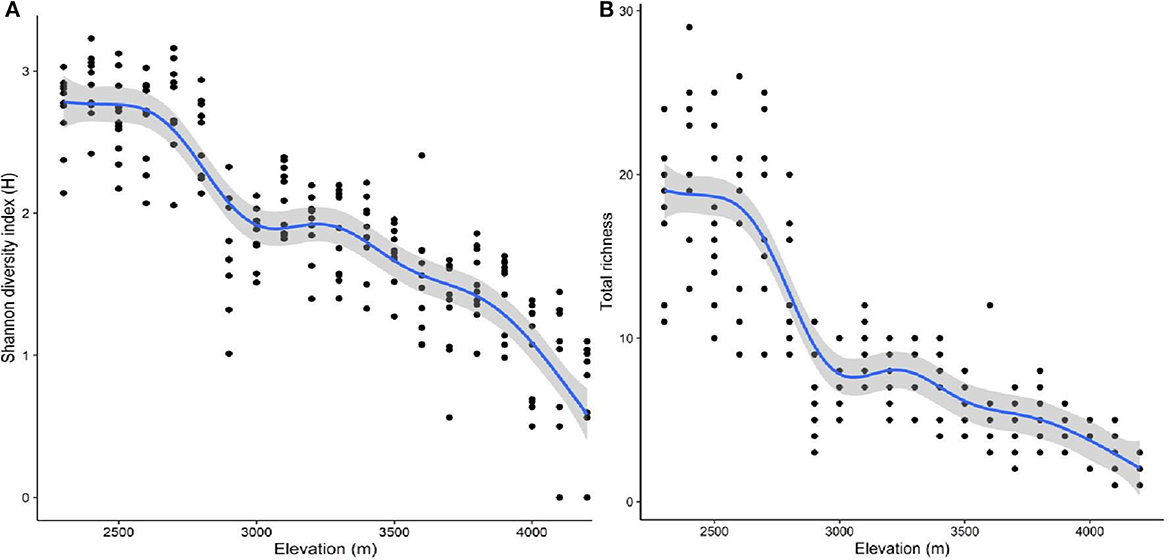
Figure 3. The relationship between elevation and (A) the Shannon diversity index and (B) total species richness. *The blue lines represent the best-fit regression splines from GAM; the gray shading represents the standard errors; and the black dots represent the observations.
The NMDS analysis revealed greater compositional dissimilarity among the selected aspects. More precisely, a varying degree of overlap was observed between the southwest (SW), northwest (NW), and south (S) aspects. The west (W) aspect was the most dissimilar in terms of plant species composition from the rest of the aspects. However, the partially overlapping ellipses indicate that the composition of the plant species in other aspects was not as significantly different (Figure 4). Moreover, the associated stress level for the NMDS plot was very low (0.10) for the first three dimensions. The PERMANOVA analysis indicated significant compositional differences among the studied aspects due to both changes in the number and relative abundance of species (Jaccard: F = 31.88, p < 0.001; Bray-Curtis: F = 25.20; p < 0.001).
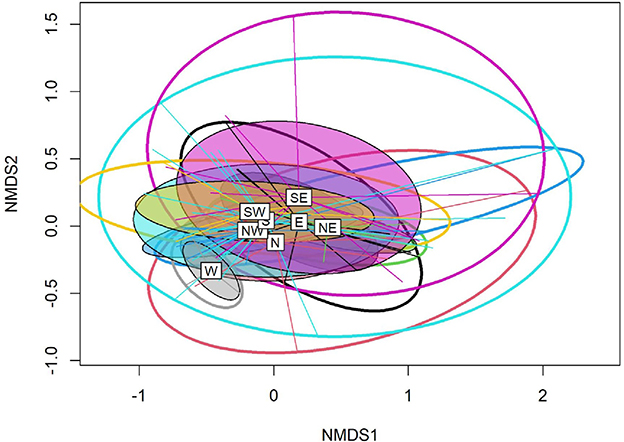
Figure 4. A non-metric multidimensional scaling (NMDS) plot showing compositional differences between the studied aspects.
Based on the studied habitat types, the NMDS analysis revealed a significant extent of compositional differences among the studied habitats (Figure 5). The open habitats were the most dissimilar in terms of plant species composition from the rest of the studied habitats. Moreover, the associated stress level for the NMDS plot was very low (0.13) for the first three dimensions. The PERMANOVA analysis indicated significant compositional differences among the studied habitats due to both changes in the number and relative abundance of species (Jaccard: F = 43.14, p < 0.001; Bray–Curtis: F = 36.01; p < 0.001).
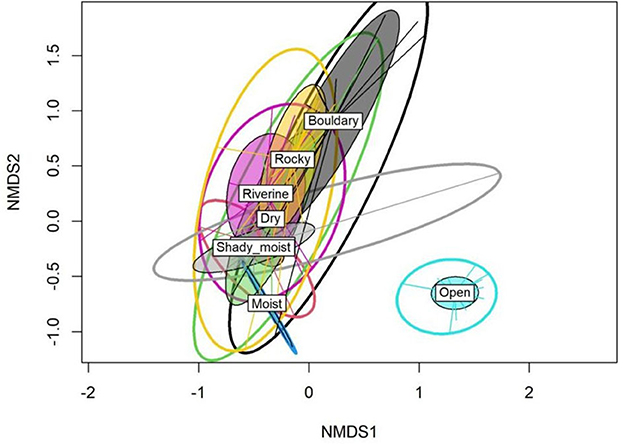
Figure 5. The non-metric multidimensional scaling (NMDS) plot showing a difference in total plant species composition between the studied habitats.
Based on altitude, the results of the NMDS analysis revealed a significant extent of dissimilarity in the total plant species composition between the studied elevation belts (Figure 6). A significant degree of overlap was observed between the sites at lower altitudes, except for those at 2,500-m above the sea level, and the sites at higher altitudes, representing the forest and alpine communities, respectively. Additionally, the cluster formed by the lower elevational belts is connected to the higher elevational cluster by four elevation belts, e.g., 3,100–3,400 m, representing the ecotone. Similar to aspect and habitat types, the associated stress level for the NMDS plot was very low (0.11) for the first three dimensions. The PERMANOVA analysis indicated a significant compositional difference among the altitudinal belts due to both changes in the number and relative abundance of species (Jaccard: F = 17.63, p < 0.001; Bray–Curtis: F = 29.69; p < 0.001).
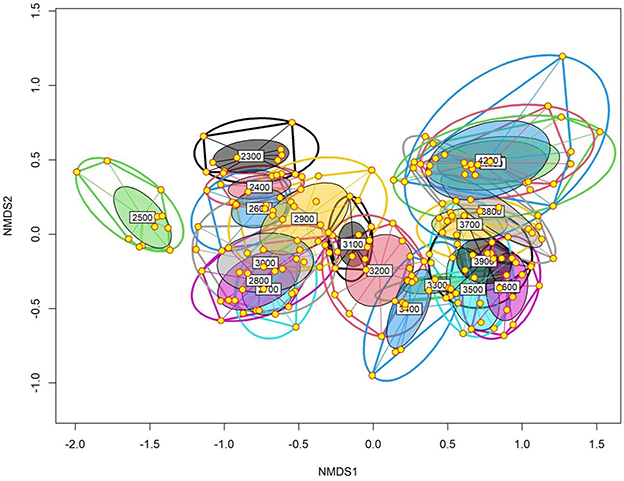
Figure 6. The non-metric multidimensional scaling (NMDS) plot showing the difference in total plant species composition between the studied 100-m elevational belts.
Overall, the observed multiple-site Sorensen dissimilarity index among the selected aspects was high (βSOR = 0.71). The contribution of species turnover to the observed dissimilarity was relatively much higher (βSIM = 0.57) than the nestedness component (βSNE = 0.13). Furthermore, a significant variation was observed for the pairwise Sorensen dissimilarity index, with the highest βSOR found between the west and southeast aspects (βSOR = 0.70). The contribution of βSIM to the resulting pairwise dissimilarity was greater than that of the βSNE component in most comparisons (Supplementary Table S2). This suggests that the observed dissimilarity was greater due to βSIM than the βSNE component (Figure 7A). A cluster analysis based on the βSIM component revealed the southwest aspect was significantly different from the rest of the selected aspects in terms of species composition, followed by the southeast and east aspects (Figure 7B). In contrast, a cluster analysis approach based on the βSNE component indicated that the south aspect was highly dissimilar in terms of species composition from the rest of the selected aspects (Figure 7C).
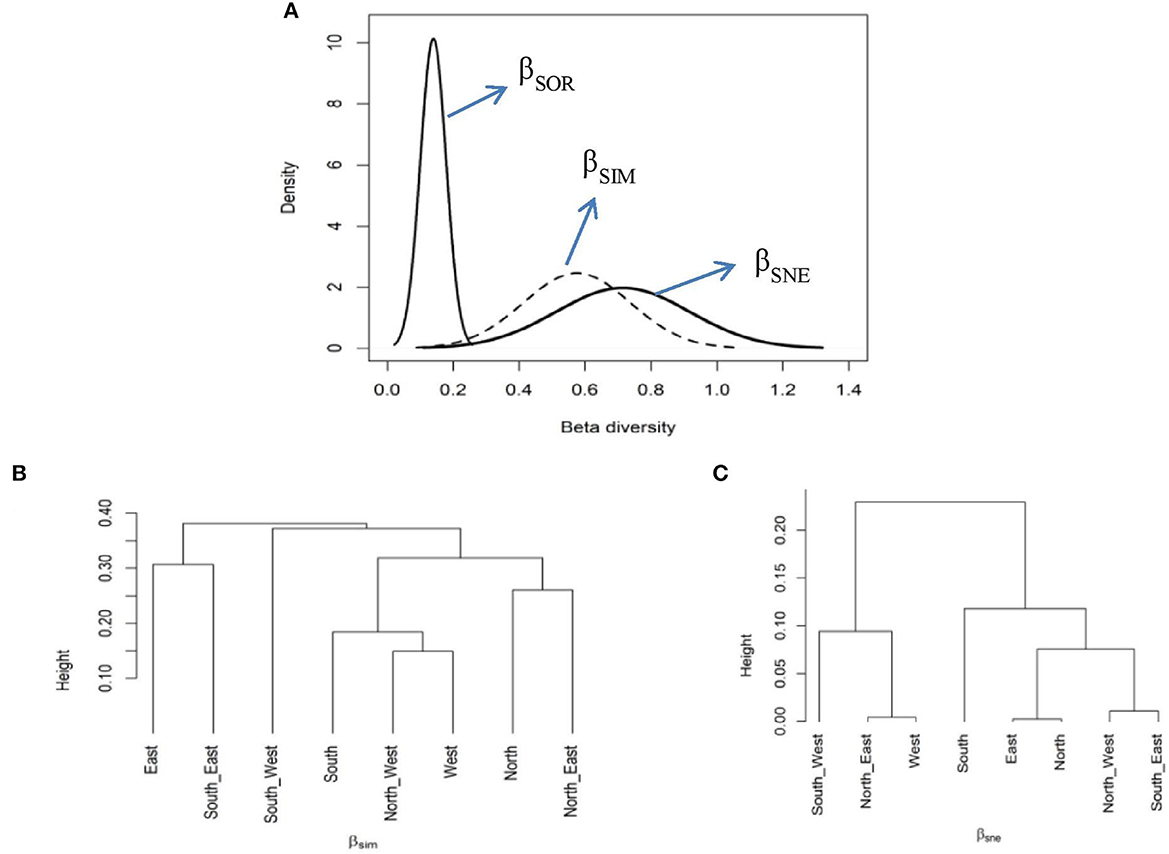
Figure 7. The multiple-site β dissimilarity patterns across the selected aspects using total plant species composition. The figure shows the partitioning of total dissimilarity (βSOR–solid black line) into species turnover (βSIM–dashed line) and nestedness (βSNE–solid gray line) components (A) and average clustering based on βSIM (B) and βSNE (C) components of total plant species dissimilarity among the studied aspects.
An analysis of habitat types revealed a high multiple-site Sorensen dissimilarity index (βSOR = 0.75). The contribution of the turnover component to this dissimilarity was higher (βSIM = 0.64) than that of the nestedness component (βSNE = 0.10). Further, a significant difference was also observed for the pairwise Sorensen dissimilarity index, with the highest βSOR found between the open and riverine habitats (βSOR = 0.84). The contribution of βSIM to the resulting pairwise dissimilarity was greater than that of the βSNE component (Supplementary Table S2). This suggests that the observed dissimilarity was primarily due to the βSIM component rather than the βSNE component (Figure 8A). A cluster analysis based on the βSIM component identified the moist habitat as being highly different from the rest of the other selected habitats in terms of plant species composition, followed by bouldary and riverine habitats (Figure 8B). In contrast, a cluster analysis approach based on the βSNE component indicated that open habitats have a highly distinct plant species composition compared to the other studied habitats (Figure 8C).
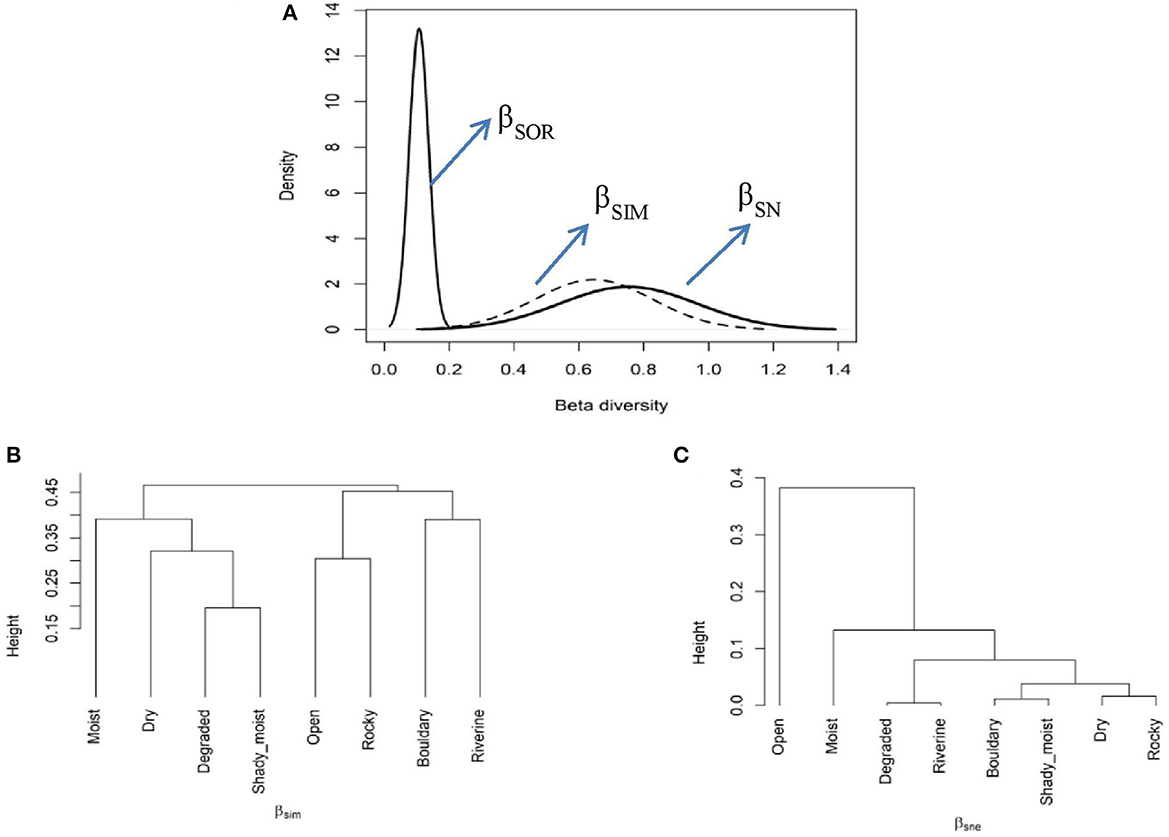
Figure 8. The multiple-site β dissimilarity patterns across the selected habitats using total plant species composition. The figure illustrates the partitioning of total dissimilarity (βSOR–solid black line) into components of species turnover (βSIM–dashed line) and nestedness (βSNE–solid gray line) components (A) average clustering based on βSIM (B) and βSNE (C) components of total plant species dissimilarity among the studied habitats.
The analysis of the selected elevational belts revealed a much higher multiple-site Sorensen dissimilarity index (βSOR = 0.92), with a greater contribution from species turnover (βSIM = 0.88) than from nestedness (βSNE = 0.04). Further, a significant difference was observed for the pairwise Sorensen dissimilarity index, and once again, the contribution of βSIM to this pairwise dissimilarity was greater than that of the βSNE component (Supplementary Table S2). This indicates that the observed dissimilarity was primarily due to βSIM than the βSNE component (Figure 9A). A cluster analysis based on the βSIM component resulted in four major clusters, representing lower, higher, sub-alpine elevational belts (ecotones), and a distinct cluster at 2,500-m altitude (Figure 9B). In contrast, a cluster analysis approach based on the βSNE component resulted in three clusters representing lower, higher, and extreme higher elevation belts (Figure 9C).
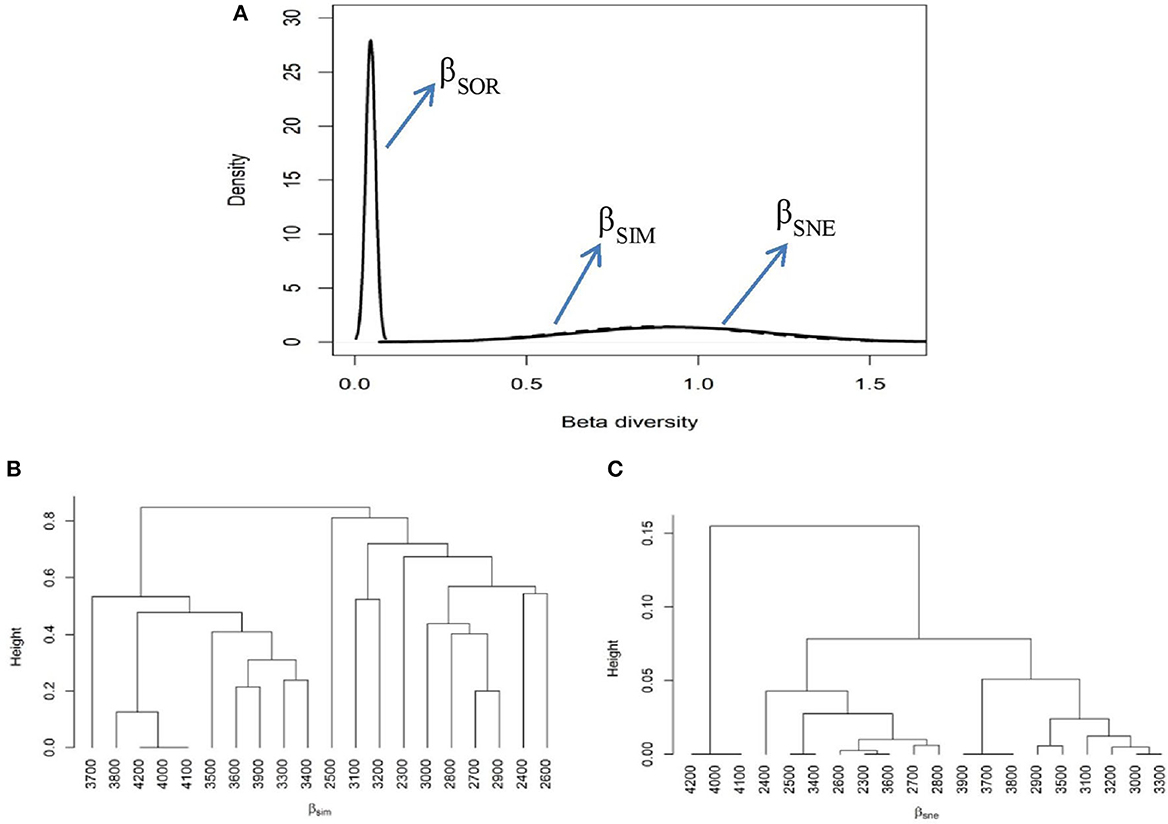
Figure 9. The multiple-site β dissimilarity patterns for the selected elevation belts using total plant species composition. The partitioning of total dissimilarity (βSOR–solid black line) into components of species turnover or replacement (βSIM–dashed line) and nestedness (βSNE–solid gray line) components (A) is shown. This figure represents the average clustering based on βSIM (B) and βSNE (C) components of total plant species dissimilarity among the studied elevational belts.
In terms of variation partitioning, the results for plant species composition showed that the total variation explained by the three variables (altitude, aspect, and habitat) was 16.5% (Figure 10). Of the individual effects, altitude (A) turned out to be the most important contributing variable, explaining the greatest amount of variation (9.7%) in plant species composition (Table 1). In addition, the individual effects of aspect (AS) and habitat type (H) were relatively small at 3.4 and 9.4%, respectively (Figure 10; Table 1). Furthermore, the variation explained by each variable was statistically significant (Table 1). Notably, the paired effect of altitude and habitat (A n H) explained the maximum variation (14.2%) in plant species composition.

Figure 10. The variation in total plant species composition explained by altitude, aspect, and habitat types, as indicated by the adjusted R2 values.
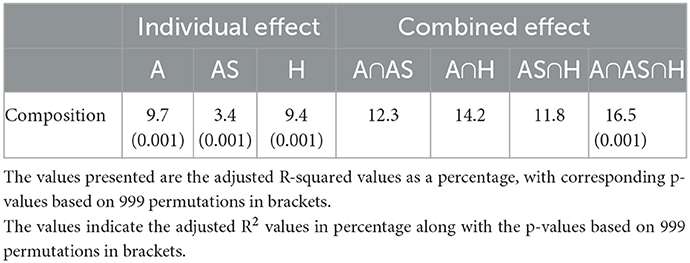
Table 1. A variation partitioning analysis, displaying the individual and combined effects of altitude (A), aspect (AS), and habitat type (H) on plant species composition.
Topographic and environmental conditions in the Himalayan region vary significantly, leading to variations in biodiversity patterns with respect to aspect, elevation, and habitat types (Rana et al., 2020; Ahmad et al., 2021). Many workers in the Himalayan region have studied the effects of topography on plant species diversity and composition (Vetaas and Grytnes, 2002; Carpenter, 2005; Kharkwal et al., 2005; Paudel and Vetaas, 2014; Subedi et al., 2020; Rawat and Negi, 2021; Wani S. A. et al., 2022). These studies have revealed that species diversity and composition vary significantly with changes in the topographic features of a region. The Gulmarg Wildlife Sanctuary (GWLS) embodies a broad elevation range with complex topography, providing a large variation in environmental variables to harbor higher species richness in a smaller area. The species richness reported in the present study was comparatively higher (361 species) than earlier reports from the Indian Himalayan region, i.e., Chawla et al., 2008 (313 species), Haq et al., 2018 (183 species), Ahmad et al., 2020 (255 species), and Haq et al., 2021 (181 species). The higher species richness recorded in the present study may be attributed to the fact that the present study was extensive and covered forest and alpine zones of the study area. Asteraceae, Lamiaceae, and Ranunculaceae were the most dominant families in the study area; these families have also been reported as being dominant in the Himalayan region (Dar and Khuroo, 2013; Ahmad et al., 2021; Altaf et al., 2021). These plant families have larger ecological amplitudes and wide distributions, increasing the possibility of encountering the members of these families (Mumshad et al., 2021). The dominance of herbaceous growth forms in the present study is in accordance with several other studies conducted in the Indian Himalayan region (Samant et al., 2007b; Malik et al., 2015; Sharma et al., 2019; Haq et al., 2021; Rawat et al., 2021). It may be due to the fact that herbs are considered common growth forms in most mountainous regions owing to their ability to acclimate to an extensive range of ecological settings (Wani S. A. et al., 2022).
In the present study, we calculated the plant species diversity more robustly than the randomly chosen single diversity index method, which led to biased generalizations and outcomes (Ahmad et al., 2019). The present study revealed that southern and southeast aspects favor rich plant species diversity, which is in accordance with the findings of previous studies (Winkler et al., 2016). This pattern may be attributed to the differential degree of exposure to sunlight and, thus, temperature differences with respect to changing aspects (Korner and Hiltbrunner, 2018). Aspect causes prominent temperature alterations and therefore affects species richness and composition in the mountains indirectly by affecting the soil-plant-atmosphere continuum (SPAC) (Aalto et al., 2013). The south aspect receives higher inputs of solar radiation in comparison to the north and west-facing aspects (Nepali et al., 2021). Furthermore, in temperate mountain regions like the study area, convective cloud formation is a common phenomenon (Geiger, 1950). This results in reduced daily solar radiation on the western aspect compared to the southern aspect.
Temperature is the most significant abiotic factor affecting plant growth and physiology at higher elevations (Korner and Hiltbrunner, 2018). Aspect causes prominent alterations in the thermal input and thus considerably affects the biodiversity on a mountain slope (Hamid et al., 2020). Further, the heterogeneity in aspect and altitude within a landform shows an important correlation with habitat heterogeneity (Aguilar-Santelises and del Castillo, 2013). During the present study, it was found that certain species, such as Oxyria digyna, Nasturtium officinale, Rorippa islandica, Caltha alba, Ranunculus trichophyllus, and Polygonum amphibia, prefer riverine habitats, whereas species such as Valeriana jatamansii, Viola odorata, Silene baccifera, Epimedium elatum, and Ainsliaea Aptera prefer shady, moist habitats. These species, which have narrow habitat preferences and specialized ecological niches, are less tolerant and less resilient, making them more susceptible to extinction (Wani S. A. et al., 2022; Wani et al., 2022c) compared to those species with wider habitat preferences.
Further, open and degraded sites were populated with exotic species such as Rumex sp., Digitalis grandiflora, Sambucus wightiana, Leucanthemum vulgare, and Achillea millifolium. Thus, due to habitat destruction, plant species with specific habitat preferences may suffer, and the whole community structure may be altered due to the increasing invasion of alien species (Fletcher et al., 2018; Fahrig et al., 2019). Habitats not only play an imperative role in the growth and development of species but also maintain species diversity. Habitat fragmentation and degradation are considered the primary causes of biodiversity loss (Su et al., 2022). As such, the preservation of habitats is equally important to the conservation of particular species.
The plant species diversity and richness decreased with increasing altitude due to environmental filtering and the dominance of plant species tolerant of extreme environmental conditions at higher altitudes (Trigas et al., 2013; Rana et al., 2020). According to the climate hypotheses, if the temperature is the main determinant of elevational species richness, the pattern predicted is decreasing diversity with increasing elevation (Heaney, 2001; McCain, 2007). The disparity in species composition and richness with changing altitude is a common phenomenon in the Himalayan and other mountainous ecosystems across the globe (Khuroo et al., 2011; Rawat et al., 2018). In the present study, species composition at lower altitudes was different than at higher altitudes. Mid-altitudes (3,100 and 3,400m) representing the ecotone form a transition between the lower and higher altitudes and are occupied by species from both lower and higher altitudes, forming a distinct cluster in terms of species composition.
Further, the 2,500-m elevation belt was found to be dissimilar from the rest of the lower altitudinal belts. The possible reason for this can be the observed anthropogenic pressure owing to the nomadic (Gujjars and Bakerwals) settlements at particular elevational belts. In the present study, total plant species richness and diversity followed a unimodal pattern, which is considered a general pattern (Stevens, 1992). However, analysis of wide-ranging elevational gradients usually results in hump-shaped patterns, while the exclusion of elevations of the gradient at the higher or lower ends favors a monotonic upsurge or decline with elevation (Fontana et al., 2020). At higher altitudes, plant species are exposed to various eco-physiological limitations, which in turn reduce species richness and diversity (Ahmad et al., 2020). In contrast, the higher species richness and diversity at lower and mid-elevations are chiefly associated with favorable environmental settings (Manish, 2021).
β-diversity, a central element of species diversity, provides insights into the extent to which environmental heterogeneity is partitioned by different species (Rawat et al., 2003). Greater β-diversity values indicate a higher level of species variation in response to environmental gradients (Bisht and Bhat, 2013). In the present study, we found relatively higher plant species diversity in southern aspects and dry habitats, likely due to the prominence of heliophytes and early successional species in forest gaps (Li et al., 2019). The patterns of β-diversity may be associated with the degree of variation in habitats along altitudinal gradients and changing aspects (Tang and Fang, 2004). Comparing compositional dissimilarities among the studied sites, further partitioned into species replacement and nestedness as attempted in this study, allows a better understanding of how biodiversity is assembled across environmental variables. Both these components of β-diversity have been acknowledged to sufficiently perceive spatial diversity patterns due to the underlying dissimilarity measures which compare species composition between two sampling units. Species replacement is supposed to be driven by environmental influences, while nestedness may reflect extinction patterns (Fontana et al., 2020). The present study revealed that turnover was more prominent than nestedness for all the studied variables (aspect, habitat, and elevation), which is consistent with the idea that the environmental filtering effects on vegetation structure along environmental gradients primarily result in turnover (Anderson et al., 2011; Zellweger et al., 2017). Furthermore, we found that the values of turnover and total β-diversity were more prominent along the elevational gradient than variation in aspects and habitat types. Temperature and solar radiations are the most important variables that influence β-diversity along an elevational gradient. Additionally, a significant percentage of plant species (specialists) is restricted to certain ecological zones and does not colonize entire environmental gradients (Broennimann et al., 2006; Trigas et al., 2013).
Environmental and topographic variables are significant factors in the distribution of plant species within an ecosystem. In the present study, variation in altitude was found to be the main factor leading to variation among the studied sites. Rawat and Negi (2021) also found that elevation is the most influential variable influencing species distribution patterns. The combined effect of altitude and habitat on species composition and richness among the sites was also found to be significant. Environmental and resource parameters determine the growth and competitive interactions of species, while environmental heterogeneity parameters tend to enhance coexistence and favor higher species richness. It is crucial to consider both levels of environmental parameters and heterogeneity concurrently to distinguish between the two types of parameters. Environmental heterogeneity is scale dependent and may create high niche diversity, allowing species to coexist at a large spatial scale.
The present study revealed that elevation is the most important factor contributing to variations in plant species diversity and composition. However, the present study also highlighted the importance of aspect and habitat heterogeneity in determining plant species richness. The southern aspect was found to support higher plant diversity compared to other studied aspects due to its greater exposure to sunlight. Furthermore, the plant species found in the study region exhibit distinct ecological preferences. For example, Betula utilis is found along northern aspects.
Similarly, the recorded species have varying habitat preferences. Therefore, the present study suggests that floristic diversity should be studied not only in relation to elevational gradients but also in relation to aspects and habitats. This study serves as a model for future research in this direction. Similar studies should be conducted in other parts of the Himalayan region to expand our understanding of the distribution and preferences of plant species in mountainous areas. This, in turn, will greatly aid in the conservation and sustainable utilization of resources in these ecologically fragile regions.
The original contributions presented in the study are included in the article/Supplementary material, further inquiries can be directed to the corresponding author.
ZW: conceptualization, methodology, data collection, curation and analysis, investigation, and writing an original draft. VN and JB: writing—review and validation. KS, SK, RD, and RA-Q: writing—review. AK: prepared the map of the study area and writing—review. SS: writing—review and funding acquisition. SP: conceptualization, methodology, supervision, validation, and writing—review. All authors contributed to the article and approved the submitted version.
The authors extend their appreciation to the Deanship of Scientific Research at King Khalid University for funding this work through a Large Group Research Project under grant number (RGP2/90/44).
The authors are thankful to Dr. Akhtar H. Malik of the University of Kashmir's Centre for Biodiversity and Taxonomy for his assistance in identifying plant specimens.
The authors declare that the research was conducted in the absence of any commercial or financial relationships that could be construed as a potential conflict of interest.
All claims expressed in this article are solely those of the authors and do not necessarily represent those of their affiliated organizations, or those of the publisher, the editors and the reviewers. Any product that may be evaluated in this article, or claim that may be made by its manufacturer, is not guaranteed or endorsed by the publisher.
The Supplementary Material for this article can be found online at: https://www.frontiersin.org/articles/10.3389/ffgc.2023.1019277/full#supplementary-material
1. ^Powo (2022). Available online at: https://powo.science.kew.org.
Aalto, J., le Roux, P. C., and Luoto, M. (2013). Vegetation mediates soil temperature and moisture in arctic-alpine environments. Arc. Ant. Alpine. Res. 45, 429–439. doi: 10.1657/1938-4246-45.4.429
Aguilar-Santelises, R., and del Castillo, R. F. (2013). Factors affecting woody plant species diversity of fragmented seasonally dry oak forests in the Mixteca Alta, Oaxaca, Mexico. Rev. Mex. de. Biodiv. 84, 575–590. doi: 10.7550/rmb.30458
Ahmad, M., Sharma, P., Rathee, S., Singh, H. P., Batish, D. R., Lone, G. R., et al. (2021). Niche width analyses facilitate identification of high-risk endemic species at high altitudes in western Himalayas. Ecol. Eng. 126. doi: 10.1016/j.ecolind.2021.107653
Ahmad, M., Uniyal, S. K., Batish, D. R., Singh, H. P., Jaryan, V., Rathee, S., et al. (2020). Patterns of plant communities along vertical gradient in Dhauladhar Mountains in Lesser Himalayas in North-Western India. Sci. Tot. Env. 716, 136919. doi: 10.1016/j.scitotenv.2020.136919
Ahmad, R., Khuroo, A. A., Hamid, M., Malik, A. H., and Rashid, I. (2019). Scale and season determine the magnitude of invasion impacts on plant communities. Flora. 260, 151481. doi: 10.1016/j.flora.2019.151481
Altaf, A., Haq, S. M., Shabnum, N., and Jan, H. A. (2021). Comparative assessment of Phyto diversity in Tangmarg Forest division in Kashmir Himalaya, India. Acta. Ecol. Sin. doi: 10.1016/j.chnaes.2021.04.009
Anderson, M. J., Crist, T. O., Chase, J. M., Vellend, M., Inouye, B. D., Freestone, A. L., et al. (2011). Navigating the multiple meanings of b diversity: A roadmap for the practicing ecologist. Ecol. Lett. 14, 19–28. doi: 10.1111/j.1461-0248.2010.01552.x
Baselga, A., and Orme, C. D. L. (2012). The relationship between species replacement, dissimilarity derived from nestedness, and nestedness. Glo. Eco. Biogeo. 21, 1223–1232. doi: 10.1111/j.1466-8238.2011.00756.x
Baselga, A., Orme, D., Villeger, S., De Bortoli, J., Leprieur, F., Logez, M., et al. (2021). Betapart: Partitioning beta diversity into turnover and nestedness components. R package version 1 5.4. Available online at: https://CRAN.R-project.org/package=betapart (assessed May 28, 2022).
Bhat, J. A., Kumar, M., Pala, N. A., Shah, S., Dayal, S., Gunathilake, C., et al. (2020). Influence of altitude on the distribution pattern of flora in a protected area of Western Himalaya. Acta. Ecol. Sin. 40, 30–43. doi: 10.1016/j.chnaes.2018.10.006
Bhat, N. A. (1984). Floristic Composition of Gulmarg (Baramulla). Ph. D. Thesis, University of Kashmir, Srinagar.
Bhatta, K. P., Chaudhary, R. P., and Vetaas, O. R. (2012). A comparison of systematic versus stratified-random sampling design for gradient analyses: a case study in sub-alpine Himalaya, Nepal. Phytocoeno. 42, 191–202. doi: 10.1127/0340-269X/2012/0042-0519
Bisht, A. S., and Bhat, A. B. (2013). Vegetation structure and plant diversity relation in a sub-alpine region of Garhwal Himalaya, Uttarakhand, India. Afr. J. Plant. Sci. 7, 401–406. doi: 10.5897/AJPS11.013
Broennimann, O., Thuiller, W., Hughes, G., Midgley, G. F., Alkemade, J. R., Guisan, A., et al. (2006). Do geographic distribution, niche property and life form explain plants' vulnerability to global change?. Glo. Chan. Biol. 12, 1079–1093. doi: 10.1111/j.1365-2486.2006.01157.x
Carpenter, C. (2005). The environmental control of plant species density on a Himalayan elevation gradient. J. Biogeogr. 32, 999–1018. doi: 10.1111/j.1365-2699.2005.01249.x
Chawla, A., Rajkumar, S., Singh, K. N., Lal, B., Singh, R. D., Thukral, A. K., et al. (2008). Plant species diversity along an altitudinal gradient of Bhabha Valley in western Himalaya. J. Mount. Sci. 5, 157–177. doi: 10.1007/s11629-008-0079-y
Dar, G. H., and Khuroo, A. A. (2013). Floristic diversity in the Kashmir Himalaya: progress, problems and prospects. Sains. Malay. 42, 1377–1386.
Dar, J. A., and Sundarapandian, S. (2016). Patterns of plant diversity in seven temperate forest types of Western Himalaya, India. J. Asia-Pac. Biod. 9, 280–292. doi: 10.1016/j.japb.2016.03.018
Davies, K. W., Bates, J. D., and Miller, R. F. (2007). Environmental and vegetation relationships of the Artemisia. tridentata spp. wyomingensis alliance. J. Arid. Envir. 70, 478–498. doi: 10.1016/j.jaridenv.2007.01.010
Fahrig, L., Arroyo-Rodriguez, V., Bennett, J. R., et al. (2019). Is habitat fragmentation bad for biodiversity? Biol Conser. 230, 179–186. doi: 10.1016/j.biocon.2018.12.026
Fletcher, R. J., Didham, R. K., Banks-Leite, C., et al. (2018). Is habitat fragmentation good for biodiversity? Biol. Conser. 226, 9–15. doi: 10.1016/j.biocon.2018.07.022
Fontana, V., Guariento, E., Hilpold, A., Niedrist, G., Steinwandter, M., Spitale, D., et al. (2020). Species richness and beta diversity patterns of multiple taxa along an elevational gradient in pastured grasslands in the European Alps. Sci. Rep. 10, 12516. doi: 10.1038/s41598-020-69569-9
Gairola, S., Sharma, C. M., Suyal, S., and Ghildiyal, S. K. (2011). Species composition and diversity in mid-altitudinal moist temperate forests of the western Himalaya. J. For. Envir. Sci 27, 1–15. doi: 10.7747/JFS.2011.27.1.1
Grytnes, J. A., and Vetaas, O. R. (2002). Species richness and altitude: a comparison between null models and interpolated plant species richness along the Himalayan altitudinal gradient, Nepal. Am. Nat. 159, 294–304. doi: 10.1086/338542
Hamid, M., Khuroo, A. A., Malik, A. H., Ahmad, R., and Singh, C. P. (2020). Assessment of alpine summit flora in Kashmir Himalaya and its implications for long-term monitoring of climate change impacts. J. Moun. Sci 17, 1974–1988. doi: 10.1007/s11629-019-5924-7
Hamid, M., Khuroo, A. A., Malik, A. H., Ahmad, R., and Singh, C. P. (2021). Elevation and aspect determine the differences in soil properties and plant species diversity on Himalayan mountain summits. Ecol. Res. 36, 340–352. doi: 10.1111/1440-1703.12202
Haq, S. M., Malik, A. H., Khuroo, A. A., and Rashid, A. (2018). Floristic composition and biological spectrum of Keran—a remote valley of northwest Himalaya. Acta. Ecol. Sin. 39, 372–379. doi: 10.1016/j.chnaes.2018.12.001
Haq, S. M., Singh, B., Bashir, B., Farooq, A. J., Singh, B., Calixtod, E. S., et al. (2021). Exploring and understanding the floristic richness, life-form, leaf-size spectra and phenology of plants in protected forests: A case study of Dachigam National Park in Himalaya, Asia. Acta. Ecol. Sin. 41, 479–790. doi: 10.1016/j.chnaes.2021.07.010
Heaney, L. R. (2001). Small mammal diversity along elevational gradients in the Philippines: an assessment of patterns and hypotheses. Global. Ecol. Biogeogr. 10, 15–39. doi: 10.1046/j.1466-822x.2001.00227.x
Hochstedler, W. W., Slaughter, B. S., Gorchov, D. L., Suander, L. P., and Stevens, M. H. (2007). Forest floor plant community response to experimental control of the invasive biennial, Alliaria. petiolata (garlic mustard). J. Tor. Bot. Soc. 134, 155–165. doi: 10.3159/1095-5674(2007)134155:FFPCRT2.0.CO;2
Jain, S. K., and Rao, R. R. (1976). Handbook of Field and Herbarium Methods. New Delhi: Today and Tomorrows Printers and Publishers.
Kharkwal, G., Mehrotra, P., Rawat, Y. S., and Pangtey, Y. P. S. (2005). Phytodiversity and growth form in relation to altitudinal gradient in the Central Himalayan (Kumaun) region of India. Curr. Sci. 873–878.
Khoshoo, T. N. (1992). Plant Diversity in the Himalaya: Conservation and Utilization, II. Pl. G.B. Pant memorial lecture Almora (India): G.B. Pant Institute of Himalayan Environment and Development. p. 120.
Khuroo, A. A., Weber, E., Malik, A. H., Reshi, Z. A., and Dar, G. H. (2011). Altitudinal distribution pattern of the native and alien woody flora in Kashmir Himalaya, India. Envir. Res. 111, 967–977. doi: 10.1016/j.envres.2011.05.006
Kindt, R., and Coe, R. (2005). Tree Diversity Analysis. A manual and software for common statistical methods for ecological and biodiversity studies. Nairobi, Kenya: World Agroforestry Centre (ICRAF).
Korner, C. (1998). A re-assessment of high elevation treeline positions and their explanation. Oecologia. 115, 445–459. doi: 10.1007/s004420050540
Korner, C., and Hiltbrunner, E. (2018). The 90 ways to describe plant temperature. Persp. Plant. Ecol. Evol. Syst. 30, 16–21. doi: 10.1016/j.ppees.2017.04.004
Legendre, P., and Legendre, L. (2012). “Developments in environmental modelling,” in Numerical Ecology, 3rd Edition. Amsterdam: Elsevier.
Li, C., Wangya, H., Dan, L., and Guohua, L. (2019). How forest gaps shaped plant diversity along an elevational gradient in Wolong National Nature Reserve. J. Geog. Sci. 29, 1081–1097. doi: 10.1007/s11442-019-1646-6
Malik, A. H., Rashid, I., Ganie, A. H., Khuroo, A. A., and Dar, G. H. (2015). Benefitting from geoinformatics: estimating floristic diversity of Warwan valley in Northwestern Himalaya, India. J. Mount. Sci. 12, 854–863. doi: 10.1007/s11629-015-3457-2
Manish, K. (2021). Species richness, phylogenetic diversity and phylogenetic structure patterns of exotic and native plants along an elevational gradient in the Himalaya. Ecol. Proc. 10, 64. doi: 10.1186/s13717-021-00335-z
McCain, C. M. (2007). Could temperature and water availability drive elevational species richness? A global case study for bats. Global. Ecol. Biogeogr. 16, 1–13. doi: 10.1111/j.1466-8238.2006.00263.x
McCain, C. M., and Colwell, R. K. (2011). Assessing the threat to montane biodiversity from discordant shifts in temperature and precipitation in a changing climate. Ecol. Lett. 14, 1236–1245. doi: 10.1111/j.1461-0248.2011.01695.x
McCain, C. M., and Grytnes, J. A. (2010). Elevational Gradients Species Richness Encyclopidia Life Sciences. Chichester: John Wiley and Sons.
Moeslund, J. E., Arge, L., Bøcher, P. K., Dalgaard, T., and Svenning, J. C. (2013). Topography as a driver of local terrestrial vascular plant diversity patterns. Nordic. J. Bot. 31, 129–144. doi: 10.1111/j.1756-1051.2013.00082.x
Mumshad, M., Ahmad, I., Khan, S. M., Rehman, K., Islam, M., Sakhi, S., et al. (2021). Phyto-ecological studies and distribution pattern of plant species and communities of Dhirkot, Azad Jammu and Kashmir, Pakistan. PLoS ONE. 16, e0257493. doi: 10.1371/journal.pone.0257493
Myer, N., Muttermeier, R. A., Muttermeier, C. A., da Fornseca, G. A. B., and Kent, J. (2000). Biodiversity hotspots for conservation priorities. Nature. 403, 853–858. doi: 10.1038/35002501
Nanda, A. B., and Nelofar Lone, R. A. (2019). Study of phenology of woody flora of Gulmarg and its neighbourhood for landscape use. J. Sci. Res. Rep. 22, 1–7. doi: 10.9734/jsrr/2019/v22i430095
Naqshi, A. R., Malla, M. Y., and Dar, G. H. (1984). Plants of Gulmarg. J. Eco. Tax. Bot. 5, 709–741.
Negi, V. S., Giri, L., and Sekar, K. C. (2018). Floristic diversity, community composition and structure in Nanda Devi National Park after prohibition of human activities, Western Himalaya, India. Curr. Sci. 115, 1056–1064. doi: 10.18520/cs/v115/i6/1056-1064
Nepali, B. R., Skartveit, J., and Baniya, C. B. (2021). Impacts of slope aspects on altitudinal species richness and species composition of Narapani-Masina landscape, Arghakhanchi, West Nepal. J. Asia. Pac. Biod. 14, 415–424. doi: 10.1016/j.japb.2021.04.005
Oksanen, J., Blanchet, F. G., Friendly, M., Kindt, R., Legendre, P., McGlinn, D., et al. (2020). vegan: Community Ecology Package. R package version 2, 5–7. Available online at: https://CRAN.R-project.org/package=vegan (assessed May 28, 2022).
Paudel, S., and Vetaas, O. R. (2014). Effects of topography and land use on woody plant species composition and beta diversity in an arid Trans-Himalayan landscape, Nepal. J. Mount. Sci. 11, 1112–1122. doi: 10.1007/s11629-013-2858-3
Rana, D., Kapoor, K. S., Samant, S. S., and Bhatt, A. (2020). Plant species conservation priority index for preparing management strategies: A case study from western Himalayas of India. Small. Scale. For. 19, 461–481. doi: 10.1007/s11842-020-09447-4
Raulings, S., Morris, K., Roache, M., et al. (2010). The importance of water regimes operating at small spatial scales for the diversity and structure of wetland vegetation. Freshwater. Biol. 55, 701–715. doi: 10.1111/j.1365-2427.2009.02311.x
Rawat, A. S., Pharswan, A. S., and Nautiyal, M. C. (2003). Propagation of Aconitum. atrox. (Bruhl) Muk. (Ranunculaceae). A regionally threatened medicinal herb. Eco. Bot. 46, 337–338.
Rawat, B., Gaira, K. S., Gairola, S., Tewari, L. M., and Rawal, R. S. (2021). Spatial prediction of plant species richness and density in high-altitude forests of Indian west Himalaya. Trees,. For. Peo. 6, 100132. doi: 10.1016/j.tfp.2021.100132
Rawat, B., and Negi, A. S. (2021). Plant diversity patterns along environmental gradients in Nanda Devi Biosphere Reserve, West Himalaya. Tropl. Ecol. 62, 61–70. doi: 10.1007/s42965-020-00122-5
Rawat, R. S., Rawal, R., Rawat, B., Negi, V. S., and Pathak, R. (2018). Plant species diversity and rarity patterns along altitude range covering treeline ecotone in Uttarakhand: conservation implications. Trop. Ecol. 59, 225–239.
Rezende, V. L., de Miranda, P. L., Meyer, L., Moreira, C. V., Linhares, M. F., de Oliveira-Filho, P. V., et al. (2015). Tree species composition and richness along altitudinal gradients as a tool for conservation decisions: the case of Atlantic semideciduous forest. Biod. Conser. 24, 2149–2163. doi: 10.1007/s10531-015-0939-z
Samant, S. S., Butola, J. S., and Sharma, A. (2007a). Assessment of diversity, distribution, conservation status and preparation of management plan for medicinal plants in the catchment areas of Parbati Hydroelectric Power Project Stage–III in Northwestern Himalaya. J. Mountain. Science 4, 34–56. doi: 10.1007/s11629-007-0034-3
Samant, S. S., Pant, S., Singh, M., Lal, M., Singh, A., Sharma, A., et al. (2007b). Medicinal plants in Himachal Pradesh, north western Himalaya, India. Inter. J. Biod. Sci. Managt. 3, 234–251. doi: 10.1080/17451590709618177
Shahabuddin, G., Goswami, R., Krishnadas, M., and Menon, T. (2021). Decline in forest bird species and guilds due to land use change in the Western Himalaya. Glob. Ecol. Conser. 25, e01447. doi: 10.1016/j.gecco.2020.e01447
Sharma, N., Behera, M. D., Das, A. P., and Panda, R. M. (2019). Plant richness pattern in an elevation gradient in the Eastern Himalaya. Biod. Conser. 28, 2085–2104. doi: 10.1007/s10531-019-01699-7
Sharma, N., and Kala, C. P. (2022). Patterns in plant species diversity along the altitudinal gradient in Dhauladhar mountain range of the North-West Himalaya in India. Trees. For. Peo. 7, 100196. doi: 10.1016/j.tfp.2022.100196
Singh, N. P., Singh, D. K., and Uniyal, B. P. (2002). Flora of Jammu and Kashmir. Calcutta: Botanical Survey of India.
Smith, B., and Chinnappa, C. C. (2015). “Plant collection, identification, and herbarium procedures,” in Plant Microtechniques and Protocols (Berlin, Germany: Springer, Cham), 541–572.
Smith, C. E. (1971). Preparing Herbarium Specimens of Vascular Plants (No. 348). US: Agricultural Research Service, US Department of Agriculture.
Stevens, G. C. (1992). The elevational gradient in altitudinal range: an extension of Rapoport's latitudinal rule to altitude. Am. Nat. 140, 893–911. doi: 10.1086/285447
Su, N., Jarvie, S., Yan, Y., Gong, X., Li, F., Han, P., et al. (2022). Landscape context determines soil fungal diversity in a fragmented habitat. Catena. 213, 106163. doi: 10.1016/j.catena.2022.106163
Subedi, C. K., Rokaya, M. B., Münzbergov,á, Z., Timsina, B., Gurung, J., Chettri, N., et al. (2020). Vascular plant diversity along an elevational gradient in the Central Himalayas, western Nepal. Folia. Geobotanica 55, 127–140. doi: 10.1007/s12224-020-09370-8
Tang, Z. Y., and Fang, J. Y. (2004). A review on the elevational patterns of plant species diversity. Biod. Sci. 12, 20–28. doi: 10.17520/biods.2004004
Trigas, P. M., Panitsa, M., and Tsiftsis, S. (2013). Elevational gradient of vascular plant species richness and endemism in Crete-The effect of post-isolation mountain uplift on a continental island system. PLoS. ONE. 8, e59425–e59425. doi: 10.1371/journal.pone.0059425
Vetaas, O. R., and Grytnes, J. A. (2002). Distribution of vascular plant species richness and endemic richness along the Himalayan elevation gradient in Nepal. Glob. Ecol. Biogeogr. 11, 291–301. doi: 10.1046/j.1466-822X.2002.00297.x
Wamelink, G. W. W., Goedhart, P. W., and Frissel, J. Y. (2014). Why some plants are rare. PLoS ONE. 9, e111293. doi: 10.1371/journal.pone.0102674
Wani, S. A., Ahmad, R., Gulzar, R., Rashid, I., Malik, A. H., Khuroo, A. A., et al. (2022). Diversity, Distribution and Drivers of Alien Flora in the Indian Himalayan Region. Glob. Ecol. Conser. e02246. doi: 10.1016/j.gecco.2022.e02246
Wani, Z. A., Islam, T., Satish, K. V., Ahmad, K., Dhyani, S., Pant, S., et al. (2022c). Cultural value and vegetation structure of Buxus. wallichiana Bail. in Rajouri-Poonch region of Indian Himalayan region (VSI: Mountainous regions). Trees. For. Peo. 7, 100182. doi: 10.1016/j.tfp.2021.100182
Wani, Z. A., Khan, S., Bhat, J. A., Malik, A. H., Alyas, T., Pant, S., et al. (2022b). Pattern of β-Diversity and Plant Species Richness along Vertical Gradient in Northwest Himalaya, India. Biology. 11, 1064.
Wani, Z. A., and Akash Pant, S. (2022a). Tree diversity and regeneration dynamics in Gulmarg Wildlife Sanctuary, Kashmir Himalaya. Acta Ecol Sin. doi: 10.1016/j.chnaes.2022.05.003
Winkler, M., Lamprecht, A., Steinbauer, K., Hulber, K., Theurillat, J. P., Breiner, F., et al. (2016). The rich sides of mountain summits–a pan-European view on aspect preferences of alpine plants. J. Biogeo. 43, 2261–2273. doi: 10.1111/jbi.12835
Zellweger, F., Roth, T., Bugmann, H., and Bollmann, K. (2017). Beta diversity of plants, birds and butterflies is closely associated with climate and habitat structure. Glob. Ecol. Biogeo. 26, 898–906. doi: 10.1111/geb.12598
Zhang, Q., Wang, J., and Wang, Q. (2021). Effects of abiotic factors on plant diversity and species distribution of alpine meadow plants. Ecol. Infor. 61, 101210. doi: 10.1016/j.ecoinf.2021.101210
Keywords: Kashmir Himalaya, composition, β-diversity, variation partitioning, elevation
Citation: Wani ZA, Negi VS, Bhat JA, Satish KV, Kumar A, Khan S, Dhyani R, Siddiqui S, Al-Qthanin RN and Pant S (2023) Elevation, aspect, and habitat heterogeneity determine plant diversity and compositional patterns in the Kashmir Himalaya. Front. For. Glob. Change 6:1019277. doi: 10.3389/ffgc.2023.1019277
Received: 14 August 2022; Accepted: 12 January 2023;
Published: 14 February 2023.
Edited by:
Zafar Ahmad Reshi, University of Kashmir, IndiaReviewed by:
Bognounou Fidèle, Laurentian Forestry Centre, CanadaCopyright © 2023 Wani, Negi, Bhat, Satish, Kumar, Khan, Dhyani, Siddiqui, Al-Qthanin and Pant. This is an open-access article distributed under the terms of the Creative Commons Attribution License (CC BY). The use, distribution or reproduction in other forums is permitted, provided the original author(s) and the copyright owner(s) are credited and that the original publication in this journal is cited, in accordance with accepted academic practice. No use, distribution or reproduction is permitted which does not comply with these terms.
*Correspondence: Shreekar Pant, c2hyZWVrYXJwYW50LjJAZ21haWwuY29t
Disclaimer: All claims expressed in this article are solely those of the authors and do not necessarily represent those of their affiliated organizations, or those of the publisher, the editors and the reviewers. Any product that may be evaluated in this article or claim that may be made by its manufacturer is not guaranteed or endorsed by the publisher.
Research integrity at Frontiers
Learn more about the work of our research integrity team to safeguard the quality of each article we publish.