 Samuel Hislop1,2*
 Christine Stone1Rebecca K. Gibson3Adam Roff3
 Brendan Choat4
 Rachael H. Nolan4Trung H. Nguyen2,5
 Angus J. Carnegie1
- 1Forest Science, NSW Department of Primary Industries, Sydney, NSW, Australia
- 2School of Science for RMIT, RMIT University, Melbourne, VIC, Australia
- 3Science, Economics and Insights Division, NSW Department of Planning and Environment, Sydney, NSW, Australia
- 4Hawkesbury Institute for the Environment, Western Sydney University, Richmond, NSW, Australia
- 5Faculty of Environment for Thái Nguyên, Thái Nguyên University of Agriculture and Forestry, Thái Nguyên, Vietnam
Following one of the driest years on record, millions of hectares of forests in southeast Australia were burned in the 2019–2020 “Black Summer” wildfires. In addition to the areas burned, drought related canopy collapse, dieback and tree mortality was widely observed. In this paper, we present a method to map canopy damage due to drought and fire across a large area. Sentinel-2 satellite imagery was used in a monthly time series to highlight areas of forest where the Normalized Burn Ratio index was significantly below a pre-disturbance “stable” period. The stable period was defined as the 3 years prior to 2019 and the disturbance thresholds are based on bioregion specific standard deviations below pre-disturbance means. The novel methods enabled drought impacted forests to be identified, including those which were subsequently burned by wildfire. Across the 20 Mha of forests studied, 9.9 Mha (49%) fell below the disturbance threshold. Of that, 5.8 Mha was disturbed by fire and a further 4.1 Mha by drought outside of the fire extent. Within the fire extent, almost 0.9 Mha was identified as being significantly drought affected prior to being burned. An analysis of spectral recovery following substantial rainfall from February 2020 onward indicates that most of the areas impacted by both drought and fire have similar rates of recovery to those impacted only by fire. There are some areas, however, where the combined effects of the “double disturbance” appears to be hindering recovery. The methods presented here are easily transferrable and demonstrate an approach for monitoring forest disturbance at higher temporal and spatial scales than those typically used.
1. Introduction
Drought and associated hot and windy weather conditions were major drivers behind the 2019–2020 mega-fires in southeast Australia (Nolan et al., 2020; Bowman et al., 2021). The fires have been described as unprecedented in size and severity (Nolan et al., 2020; Collins et al., 2021) and may be representative of global shifts in fire regimes due to climate change (Nolan et al., 2021a). The fires, and their impacts, have received much attention, both in the media and among the academic community (Boer et al., 2020; Nolan et al., 2020, 2021a; Bowman et al., 2021). In addition to the fire impacts, the drought itself caused widespread canopy collapse, dieback and tree mortality in some areas (Nolan et al., 2021b).
Fire and drought are a regular fixture in southeast Australia, often interspersed with flooding rains. The fluctuating weather patterns are largely driven by the El Niño–Southern Oscillation (ENSO) and to some degree, the Indian Ocean Dipole and the Southern Annular Mode (Pui et al., 2012). The links between drought, fuel dryness and the propensity of southeast Australian forests to burn are well established (Bradstock, 2010) and much of the native vegetation has evolved alongside regular fire, with adaptive mechanisms such as epicormic resprouting and other fire response traits that support recovery (Collins, 2020). However, there is a concern, that, due to climate change, the resilience of Australian forests may be challenged by more frequent droughts and fires (Bowman et al., 2021; Nolan et al., 2021b), a concern echoed across the world (Anderegg et al., 2016; Miralles et al., 2019).
In many regions of the world, drought stress can trigger secondary causes of disturbance and tree mortality, such as bark beetle infestations (Negrón et al., 2009; Fettig et al., 2019; Netherer et al., 2019). In Australian native forests, insects and pathogens are not generally implicated in large scale disturbances (Montreal Process Implementation Group for Australia and National Forest Inventory Steering Committee, 2018). Under extreme drought, it is more likely that failure of the plant hydraulic system is the principal mechanism leading to crown death and mortality (Choat et al., 2018). The duration of the drought also impacts the ability of trees to survive, due to the ongoing demand for carbohydrate reserves (Mitchell et al., 2013). While a number of studies have investigated the impacts of drought on native Australian vegetation at the tree and plot level (Matusick et al., 2013; Mitchell et al., 2014; Nolan et al., 2021b), in simulated modeling scenarios (De Kauwe et al., 2020) and using coarse resolution satellite data (Jiao et al., 2020), methods for broadscale, high resolution mapping and monitoring are lacking.
Satellite remote sensing offers the most practical and affordable means of undertaking whole-of-landscape assessments into the impacts of major drought and fire events. One of the key advantages of satellite Earth observation is the continuous and repeatable measurements on offer. Consequently, the use of satellite time series for characterizing forest disturbances and subsequent recovery is increasing (Kennedy et al., 2012; White et al., 2017; Nguyen et al., 2018). Landsat satellites, in particular, have been used extensively, due to the free and accessible archive and data from 1972 onward (Zhu, 2017). The Sentinel-2 satellites (launched in 2015 and 2017) provide comparable multispectral data to Landsat, enabling similar techniques to be applied and the potential for cross-platform harmonization (Claverie et al., 2018; Wulder et al., 2019; White and Gibson, 2022).
Many of the established Landsat time series techniques, particularly those operating across large areas, use one representative image per year, typically from the summer months (White et al., 2014). A time series of a single band, or a spectral index derived from multiple bands, is then analyzed through time at a pixel level to detect disturbances and trends (Kennedy et al., 2010; Hermosilla et al., 2015a). By undertaking the temporal analysis on every pixel in the image stack, maps of disturbance at an annual time step can be created (White et al., 2017). This type of analysis is well suited to large areas and abrupt disturbances. For example, White et al. (2017) presented a nationwide characterization of wildfire and harvesting disturbances across Canadian forests, while Kennedy et al. (2012) investigated four disturbance types (fire, harvest, insect, and other) in the Pacific northwest, USA. Gradual trends, which may indicate ecosystem changes, can also be extracted from satellite time series by using regression techniques (Vogelmann et al., 2012).
Few studies have used moderate resolution satellites to specifically target drought related forest disturbance. Moreno-Fernández et al. (2021) used Landsat time series to explore drought related dieback in Pinus pinaster forests in Spain, while Brouwers et al. (2013) created change maps from Landsat images to map drought impacts in Jarrah forests in Western Australia. Other large area studies of drought impacts used lower spatial resolution data from sensors like the Moderate Resolution Imaging Spectroradiometer (MODIS), and the Advanced Very High Resolution Radiometer (AVHRR). For example, Jiao et al. (2020) used both MODIS and AVHRR data to explore vegetation changes across the Australian continent during a protracted drought period from 1997 to 2009. Caccamo et al. (2011) assessed the sensitivity of various MODIS-derived vegetation indices to drought in high biomass ecosystems in southeast Australia. While coarse resolution satellite data can provide valuable insights into broadscale trends, the finer spatial detail offered by satellites like Landsat and Sentinel-2 is required for many ecological applications (Kennedy et al., 2014).
The common approach of using an annual time step to monitor forest disturbance and recovery is well suited to places like Canada and Scandinavia, where many trees are deciduous or covered in snow during winter, and recovery from disturbance is slower (Bartels et al., 2016; White et al., 2018). However, these techniques have limitations in southeast Australia, where forests often recover remarkably quickly (Gibson and Hislop, 2022) and disturbance is a frequent occurrence (Hislop et al., 2021). Australian vegetation also has unpredictable seasonal phenology, driven by large variations in weather patterns (Moore et al., 2016). Furthermore, when two or more disturbances occur in the one season, an annual time series will only detect a single event and, therefore, the opportunity for a deeper analysis into causal processes is forfeited. While there are some change detection algorithms that are designed to ingest all available images (Zhu and Woodcock, 2014) or a dense time series (Verbesselt et al., 2010), their ability to characterize multiple disturbances in a short time frame is questionable. In order to disentangle drought and fire impacts, such as those experienced in southeast Australia in 2019–2020, both a dense time series and the ability to identify two disturbances in quick succession is required.
We postulated that there were four distinct drought-fire scenarios that broadly impacted southeast Australian forests during the summer of 2019–2020: drought only, fire only, drought followed by fire and fire followed by drought. The aim of this study was therefore to approach the question of how medium resolution satellite imagery could be used to distinguish between these different categories, particularly highlighting areas of forests showing major drought stress prior to being burned. In this paper, we present a novel method using a monthly time series of Sentinel-2 imagery, in conjunction with auxiliary fire information, to identify areas of predominantly eucalypt forest disturbed by drought and/or fire during a monitoring period between August 2019 and March 2020. We defined a pre-disturbance (stable) state in terms of the mean and standard deviation over the preceding 3 years (2016–2018) and characterized disturbance impacts by the number of standard deviations below this mean value. By using this approach, we were able to define areas impacted by drought and fire, along with areas that were drought impacted prior to being burned (a double disturbance). Fires which occurred in the previous season (2018–2019) were also identified (fire followed by drought) and forest spectral recovery in each category was investigated.
2. Materials and methods
2.1. Study area
The study area broadly consists of the eastern halves of Victoria and NSW (including the Australian Capital Territory—ACT), located between 28 and 39°S latitude and 146° to 154° longitude (Figure 1). The area is covered by 10 distinct bioregions, based on common climate, geology and native vegetation (IBRA, 2017) and contains approximately 20 Mha of predominantly native eucalypt forests. The term “eucalypt” is typically used to refer to trees in three genera (Angophora, Corymbia, and Eucalyptus), which together comprise approximately 800 different species (Montreal Process Implementation Group for Australia and National Forest Inventory Steering Committee, 2018). The native forests across the region are diverse, with forest structure and composition influenced by both north-south and east-west climate gradients. In the more arid west, dry sclerophyll woodlands dominate, whereas along the coast, forests are denser and wetter, tending to subtropical in the north and cooler, temperate forest in the south (Fisher et al., 2016). Also in Figure 1 is a chart indicating rainfall variations for 2019, shown as the number of standard deviations below the mean (1980–2018), based on gridded data from the Bureau of Meteorology (2019). The drought occurred from 2017 to 2019, with the most intense period in mid to late 2019 (Nguyen et al., 2021). Fires started in northern NSW as early as August 2019 and progressed southwards over the next 5–6 months (Bowman et al., 2021; Nolan et al., 2021a).
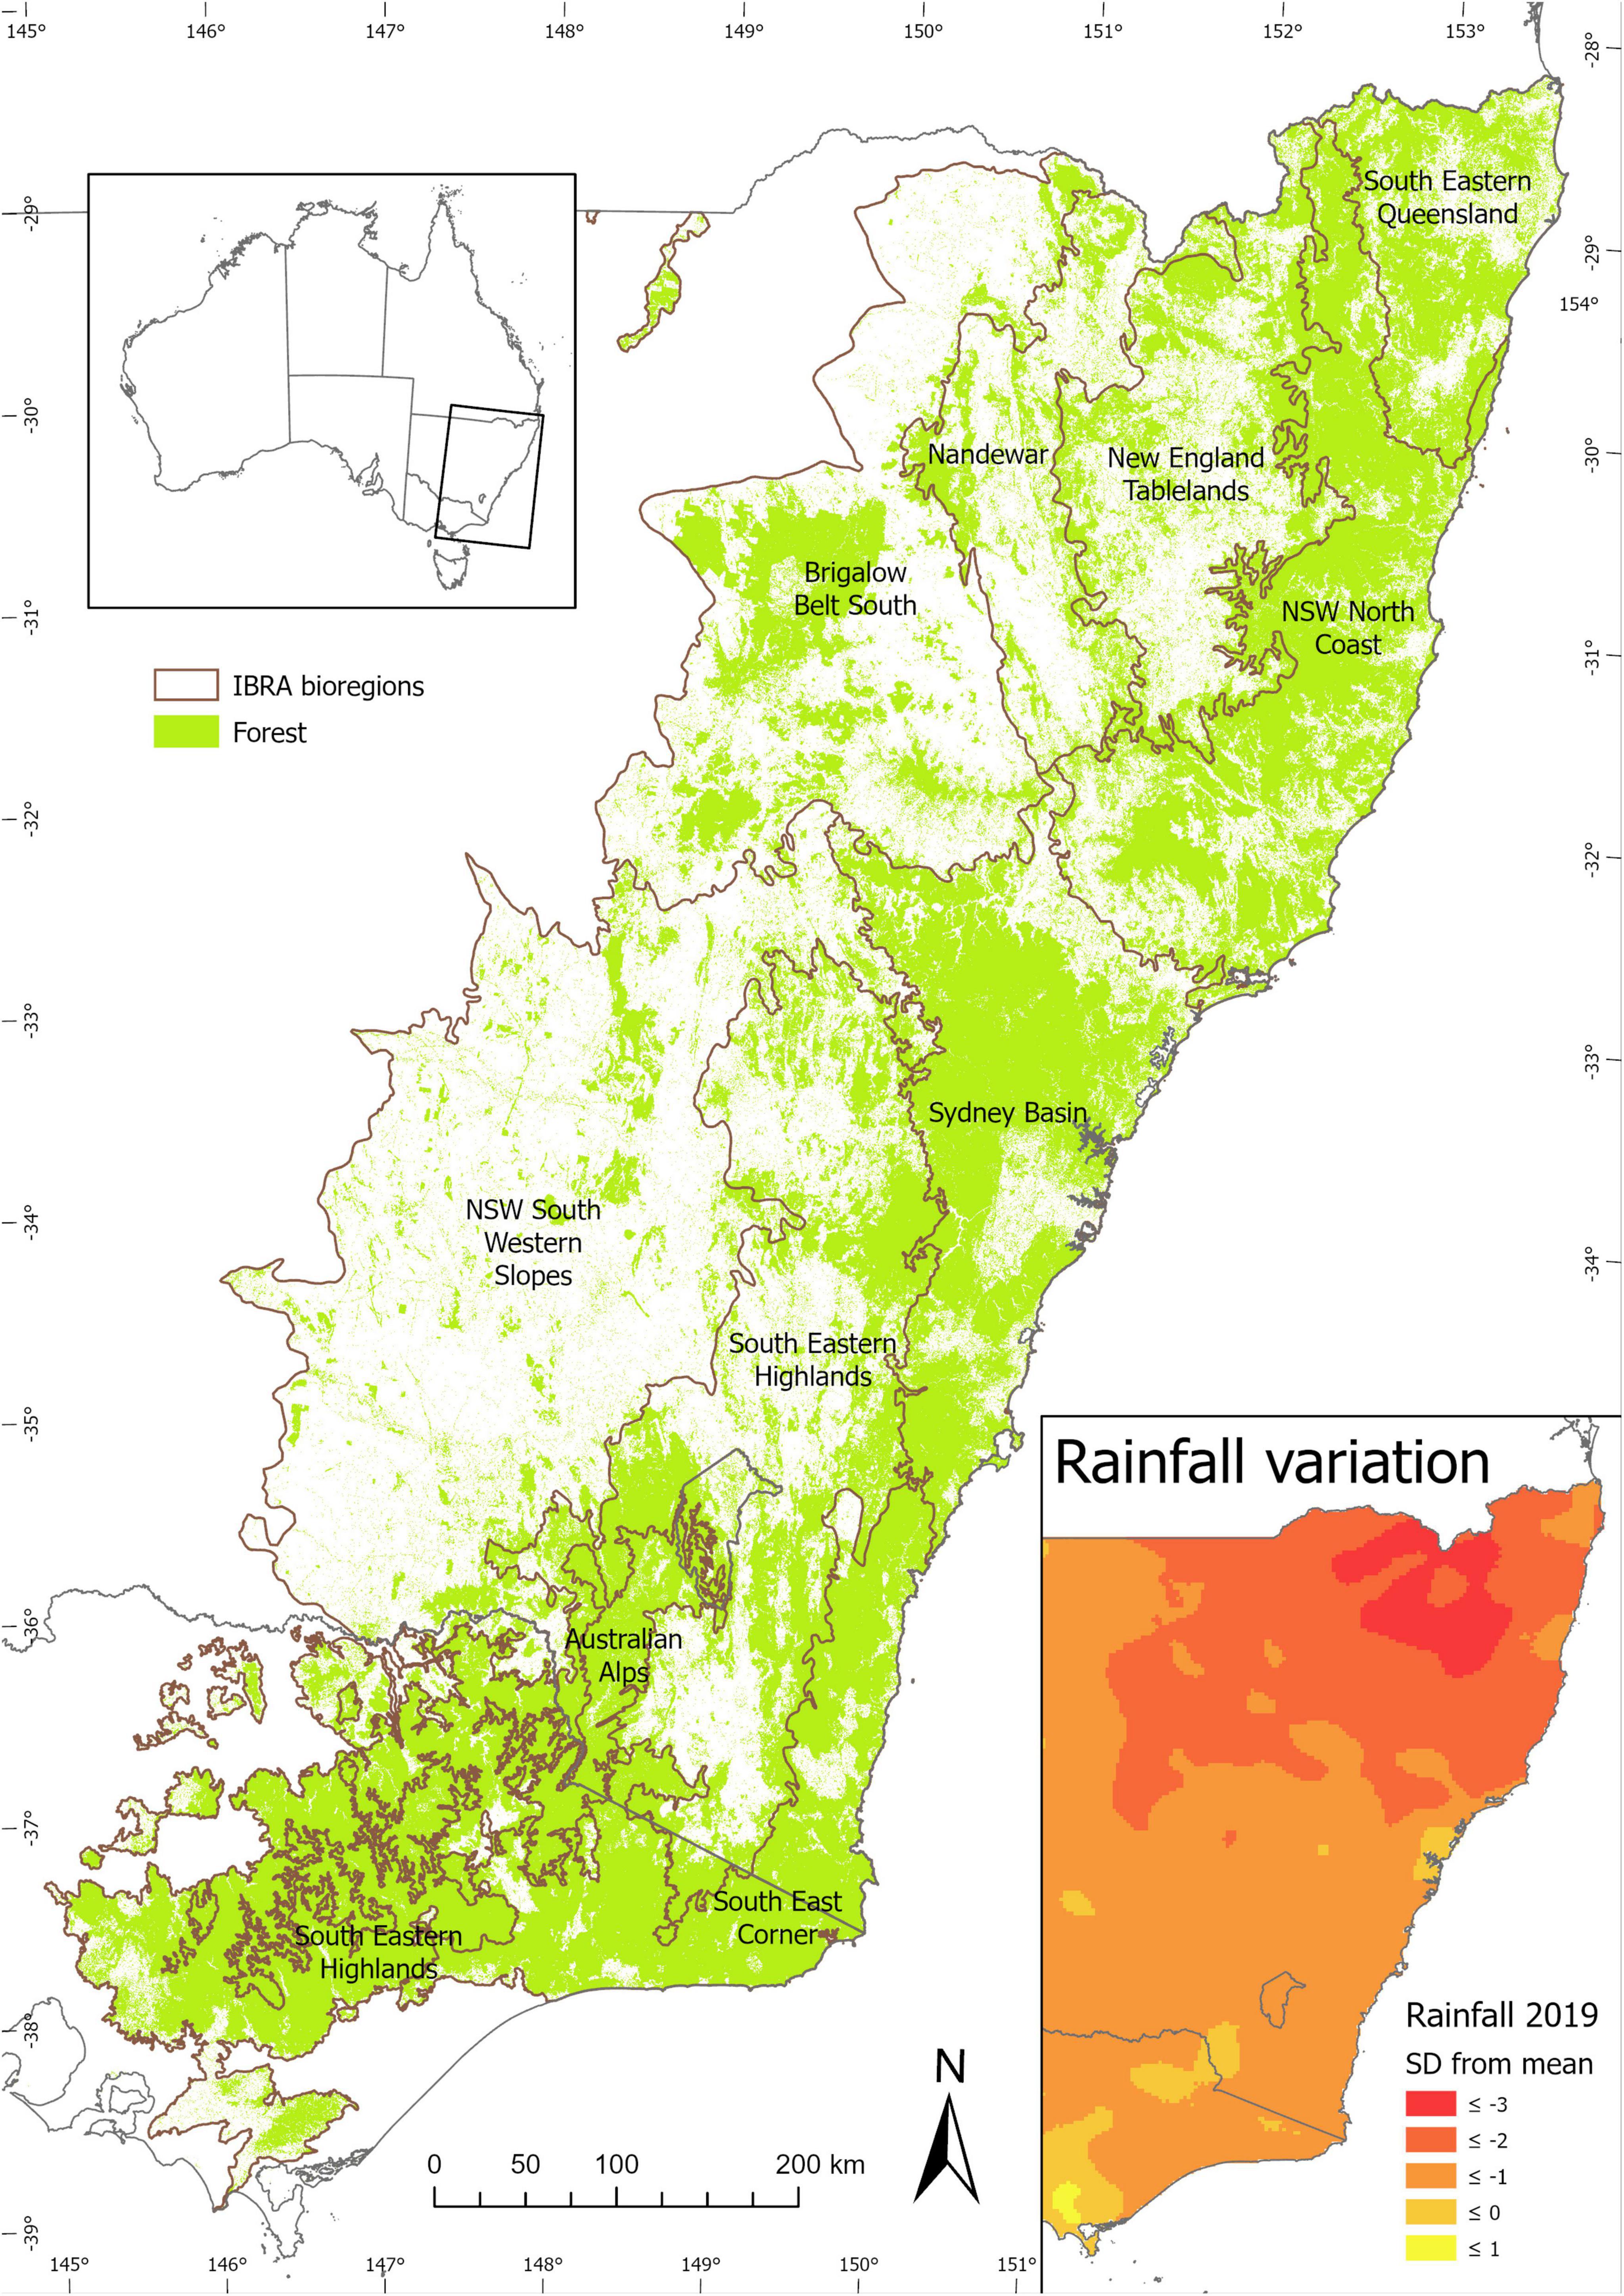
Figure 1. Study area, indicating bioregions and forest cover. Rainfall variations from the annual average (1980–2018) are also shown for 2019.
2.2. Forest and fire masks
Forest areas were delineated using a national forest extent map (Australian Government, 2018), which is modeled from Landsat data and provided at a 25 m resolution. It is based on the Australian definition of forest: mature height greater than 2 m and canopy cover greater than 20% (Montreal Process Implementation Group for Australia and National Forest Inventory Steering Committee, 2018).
Burned areas in NSW and the ACT were defined using the NSW Government’s fire history data (Department of Planning Industry and Environment, 2020). The equivalent was used in Victoria (Department of Environment Land Water and Planning, 2020). To establish the approximate date that areas burned, the Moderate Resolution Imaging Spectroradiometer (MODIS) burned area product (MCD64A1 Collection 6) was used. MCD64A1 is a daily record of burned areas across the globe at 500 m pixel resolution (Giglio et al., 2018). Some areas mapped as burned in the government data were not identified in MCD64A1 (i.e., omission errors). To approximate the date of burn for these areas, an iterative 3 × 3 pixel filter was applied to MCD64A1 product to fill in the data gaps. This involved each null-value pixel being given the mean value of its 8 surrounding pixels, effectively growing the size of the burned area patches by one pixel in each iteration. The process was repeated 50 times until all missing areas were filled. The filled product was then clipped to burned area extent from the government agencies. The forest mask (25 m pixel), fire history layers (polygon) and MODIS (250 m pixel) were all transformed to a common 20 m pixel grid in an Albers Equal Area projection, to align with the Sentinel-2 satellite data.
2.3. Sentinel-2 time series
Sentinel-2 level 1C images were acquired through Google Earth Engine (Gorelick et al., 2017). Firstly, the Normalized Burn Ratio (NBR) index was calculated for all available images in the pre-disturbance baseline period of 2016–2018 (Eq. 1). Although NBR was originally proposed for burn severity assessments (Key and Benson, 2006), it has been widely adopted as a general purpose forest disturbance index (Kennedy et al., 2012, 2018; Hermosilla et al., 2015a; Hislop et al., 2021). NBR makes use of short-wave infrared reflectance, which has been shown to be sensitive to forest structure and moisture (Schroeder et al., 2011).
The mean and standard deviation of the NBR across the entire baseline period were then calculated. This operation was undertaken on a per pixel basis after cloudy pixels were masked with the Sentinel-2 cloud probability layer. The years of 2016 to 2018 were chosen to represent a stable pre-disturbance baseline across the entire region. Although the drought began in 2017, the most intense period was in mid to late 2019 (Nguyen et al., 2021), thus we made the assumption that the worst drought impacts were not evident until 2019, but it may not hold true in all cases. The standard deviation was used as an indicator of the natural variation of the pixel through time. An alternative might have been to first remove the seasonality with a harmonic model (e.g., Verbesselt et al., 2010). However, this approach is much more computationally intensive. In addition, the vegetation in Australia is strongly influenced by irregular rainfall patterns (Moore et al., 2016) and thus may not adhere to regular seasonal profiles.
In the next step, for each month from August 2019 to March 2022 (the disturbance “monitoring” period), a NBR composite image was constructed using the median of all cloud-free pixels. Typically, around 1000 images per month contributed to the composite, resulting in a single representative monthly image. NBR values were then normalized using Eq. 2.
Where μ and σ are the mean and standard deviation of the NBR values from 2016 to 2018 and x is the median NBR value from each month (August 2019 onward). The time series of z-values forms the basis for the main analysis in this paper (Figure 2).
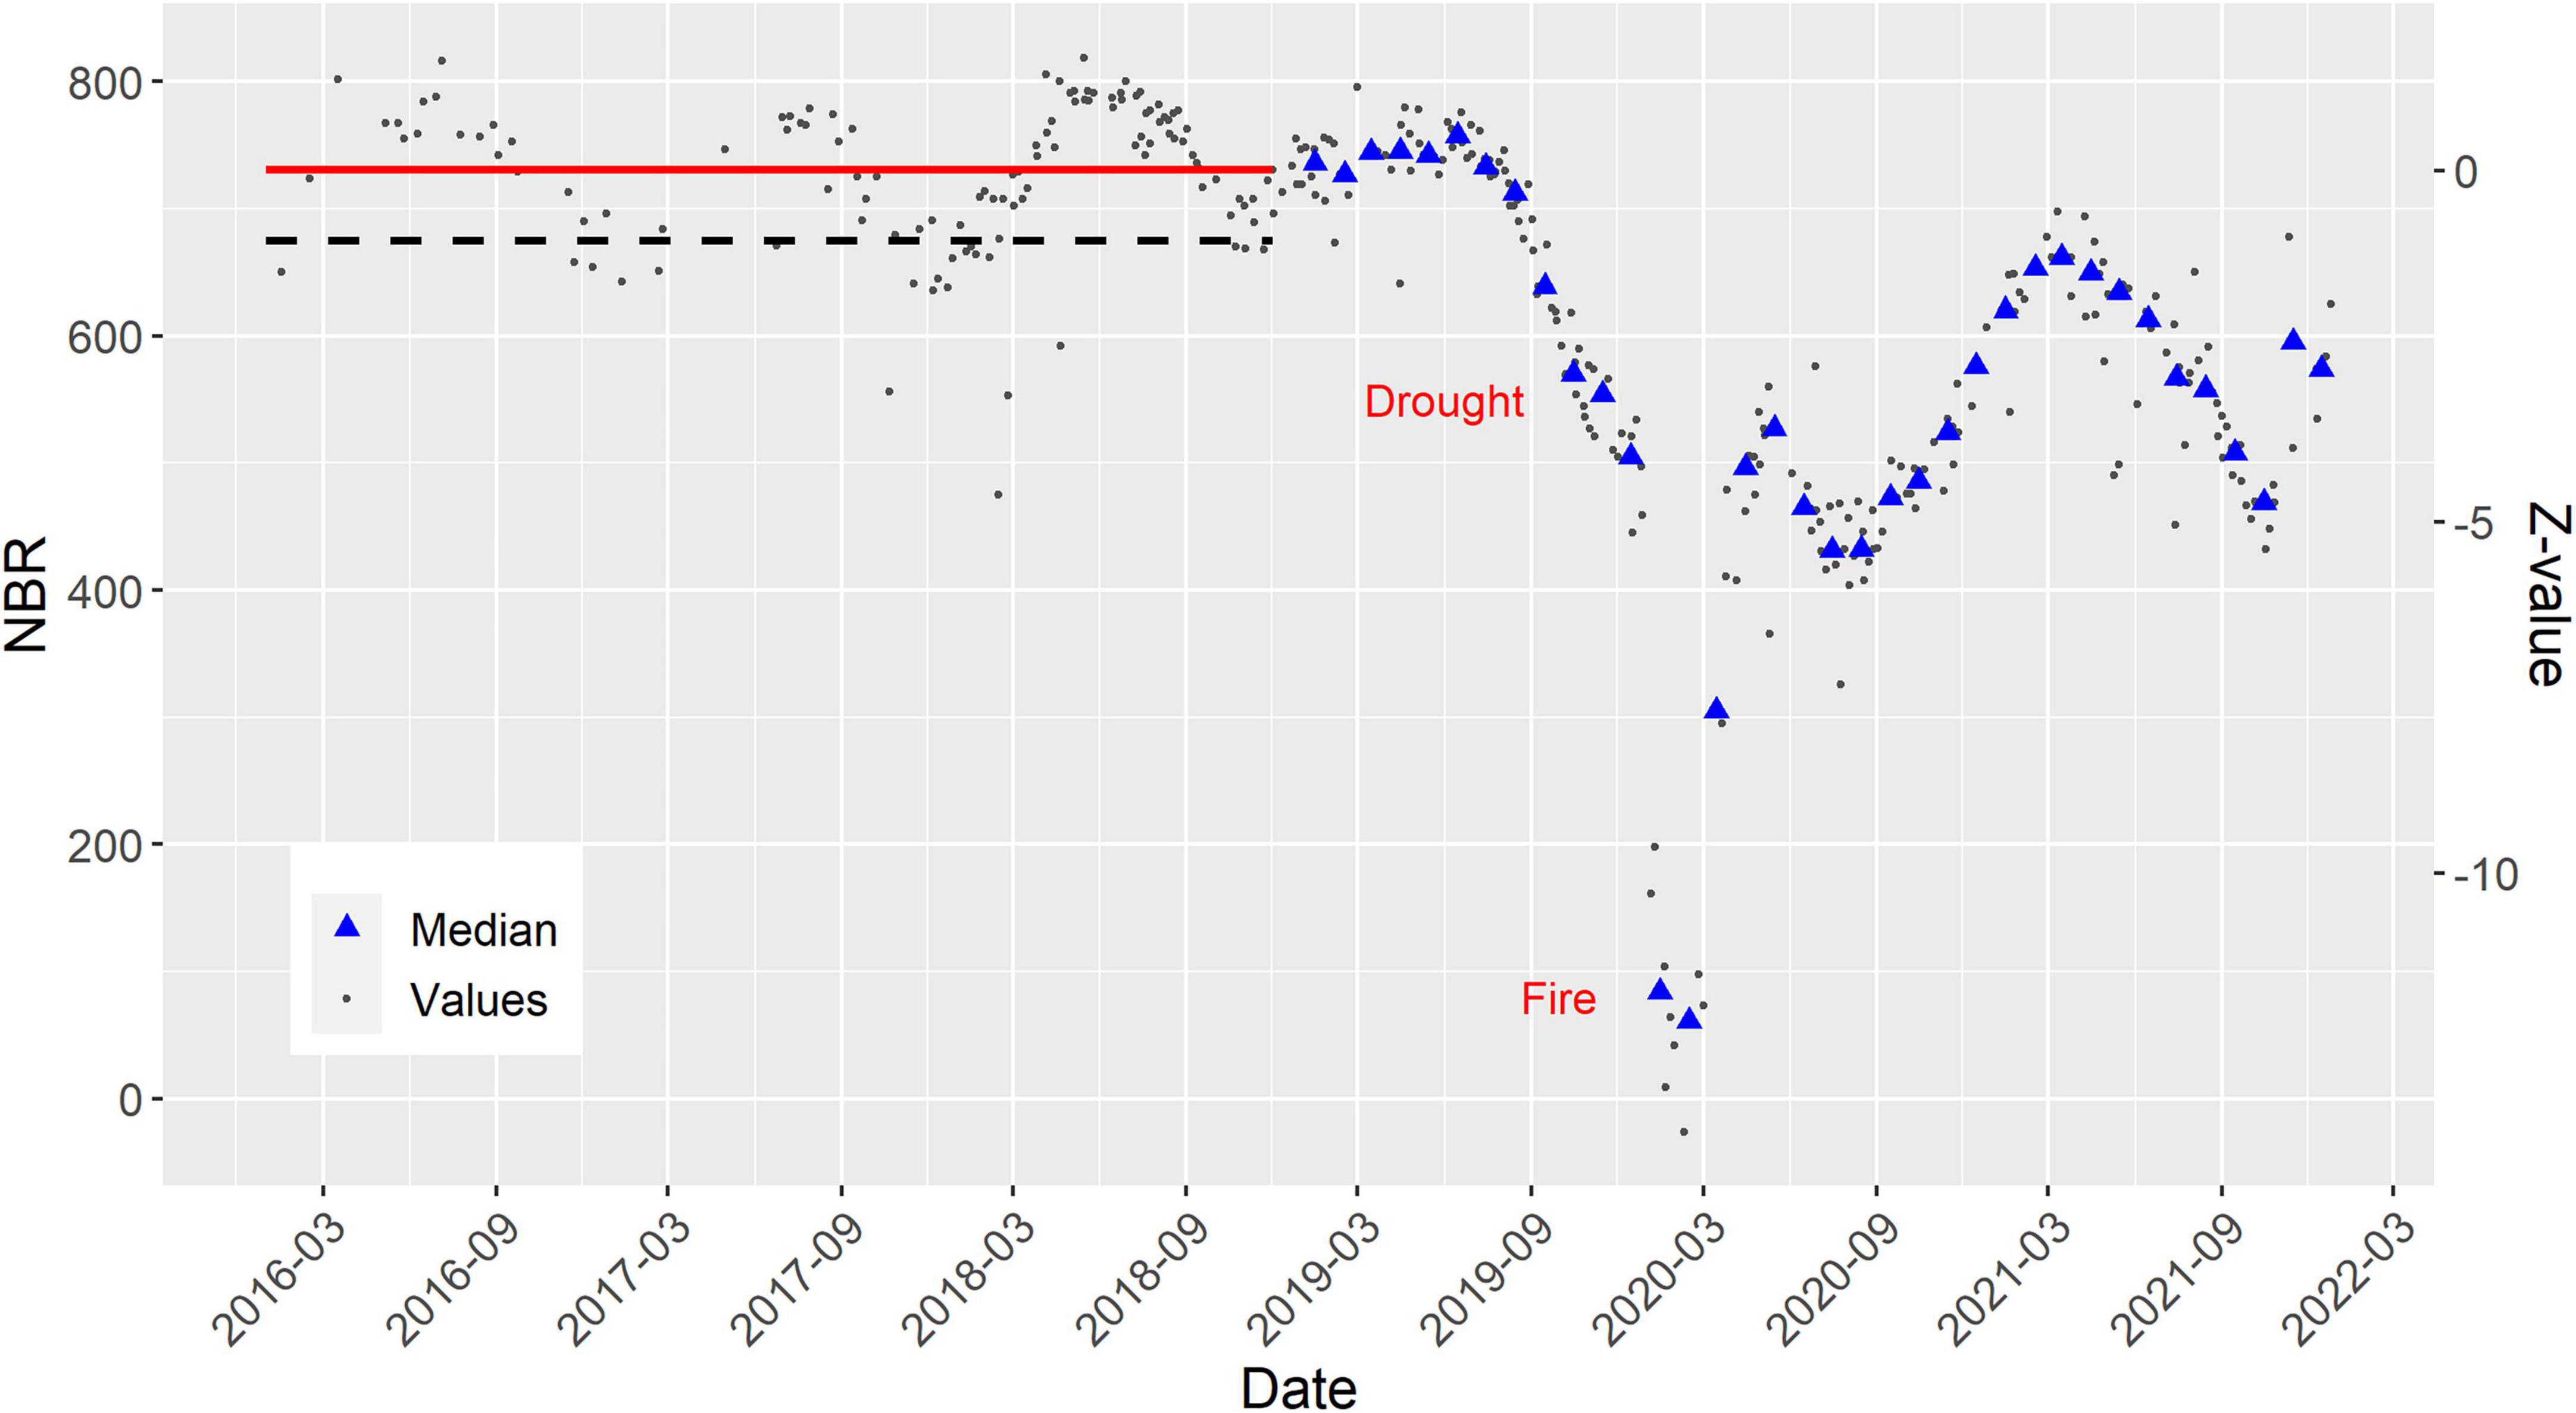
Figure 2. Example of an individual pixel through time. Sentinel-2 NBR values are shown in gray and the monthly median values for 2019 onward in blue. The horizontal lines are the mean and standard deviation for the stable period (2016–2018), used to calculate the z-values (see Eq. 2), as shown on the secondary y-axis.
2.4. Identifying drought and fire affected areas
The monthly NBR time series was analyzed to establish areas impacted by drought and fire between August 2019 and March 2020. Principally, this involved flagging pixels that dropped below a certain z-value threshold in any given month. In the context of this study, the drought related disturbance targeted was that of “canopy collapse,” where the tree foliage has died. This may be followed by tree dieback and mortality in some cases, but canopy collapse was the initial symptom that we aimed to detect. Because forest types vary across the region, they naturally have different spectral and temporal signatures. Therefore, different disturbance threshold values were used for each bioregion.
To objectively define appropriate threshold values, a previously collected human interpreted reference dataset was used (Hislop et al., 2021). The dataset consists of 500 randomly selected 1 ha plots in the forested areas of each bioregion (5,000 in total), which were visually interpreted using Landsat data and available ancillary information to establish disturbance history from 1988 to 2020. Due to the large areas disturbed by either fire or drought during 2019–2020, the reference dataset contained adequate samples to compute baseline thresholds to use in this study.
The threshold computation was achieved by first creating a Sentinel-2 composite image based on the median NBR value from January and February 2020 (the period when the area disturbed was greatest across the entire study area). The composite image was then converted to z-values, using the method described in section 2.3. The corresponding z-values were then extracted for each sample in the reference dataset. Each sample was based on the mean value of all 20 m pixels whose center was within the 1 ha plot. The result of this exercise was a reference dataset with two classes (disturbed and undisturbed), along with corresponding z-values. For each bioregion, the optimal threshold value was computed by incrementally changing the threshold value until the class errors (sensitivity and specificity) were balanced (Table 1).
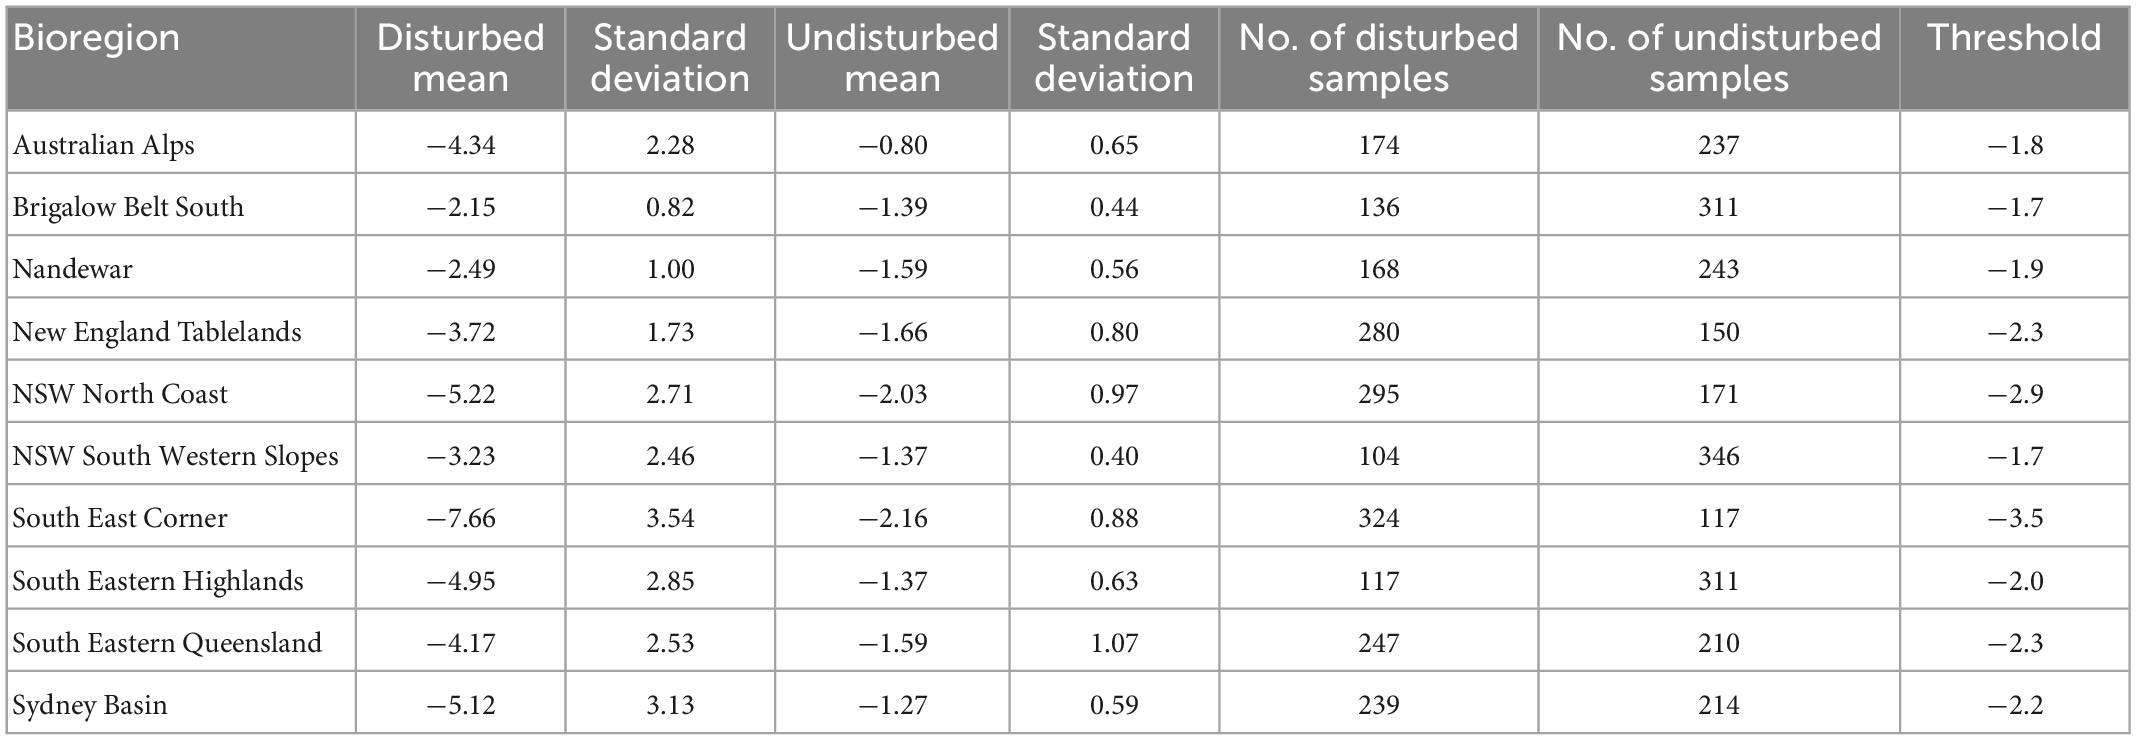
Table 1. Mean and standard deviation of z-values (see Eq. 2) derived from reference data samples and a January–February 2020 NBR composite image, along with the calculated threshold values for each bioregion.
Following the establishment of the bioregion specific thresholds, each month between August 2019 and March 2020 was analyzed to identify areas that were below the threshold values. Each month was then cross-referenced with the monthly fire extent layer (see section 2.3) to assign a label of either fire or drought. This enabled areas within the final fire extent to be classified as drought impacted prior to being burned. A pragmatic decision was made to label disturbances as either fire or drought. Other disturbance agents may have been present, but these were expected to affect a comparatively small area and therefore have little effect on overall results. For example, timber harvesting in any given year has been estimated to impact less than 0.15% of the forest estate (Hislop et al., 2021). To account for outliers (e.g., data anomalies due to unmasked cloud contamination), pixels needed to meet the threshold at least twice during the period from August 2019 to April 2020 (1 month extra than the monitoring period). In addition to capturing the 2019–2020 fires, areas that were flagged as disturbed but corresponded with fire boundaries from the previous season (2018–2019) were also identified, so that they were not incorrectly labeled as drought. Note that the disturbed areas are defined purely with the Sentinel-2 satellite imagery. The fire datasets, which often include unburnt patches and non-forest, were only used to assign the disturbance type label.
2.5. Forest recovery
Across the region, substantial rainfall started falling from February 2020 and all major fires were out by March. The period from March 2020 to February 2022 was analyzed to explore forest recovery in terms of spectral response. Each month was processed as above to determine how long areas remained under the thresholds (i.e., in a “disturbed” state). In addition to this analysis, 10,000 random pixels were selected in each of five categories: (1) undisturbed, (2) disturbed by drought only, (3) fire in 2018–2019, (4) fire in 2019–2020, and (5) both drought and fire. The extracted z-values of these pixels at different time periods represented: (i) just-disturbed (January–February 2020), (ii) 1-year post-disturbance (November–December 2020), and (iii) 2-years post-disturbance (November–December 2021). The months of November and December were used to represent 1- and 2-year recovery because the earlier analysis suggested that, due to seasonal effects, this was the optimal assessment window across the study area as a whole.
2.6. Accuracy assessment
The final maps of drought and fire disturbance were assessed by an independent expert with no previous involvement in the methods development or analysis. For this assessment, 200 random sample pixels were drawn from the samples used in the forest recovery analysis, stratified equally by four categories: (1) undisturbed, (2) disturbed by drought only, (3) fire in 2019–2020, and (4) both drought and fire in 2019–2020. The 2018–2019 fire areas were not assessed, as these events happened before the monitoring period. The reason these areas were identified is that they had not yet recovered by the start of the monitoring period. The interpreter visually inspected monthly Sentinel-2 images and an extracted NBR time-series to assign the correct class for each sample, an approach conceptually similar to previous Landsat-based studies (Cohen et al., 2010; Senf et al., 2018; Hislop et al., 2021). The validation dataset was compared against the final maps by way of a confusion matrix to determine accuracy. The balanced accuracy for each class is presented, which refers to the average of the sensitivity (true positive rate) and the specificity (true negative rate), as recommended by Gibson et al. (2020).
3. Results
3.1. Area disturbed
The analysis of the Sentinel-2 imagery using the bioregion specific z-value thresholds identified 9.86 Mha (49%) of forest impacted across the study area between August 2019 and March 2020 (Table 2). Of that, 5.51 Mha was disturbed by fire in 2019–2020, 250,000 ha by fire in 2018–2019 and 4.10 Mha by drought outside of the fire extent. Within the fire extent, 938,000 ha was identified as being significantly drought affected prior to being burned in 2019–2020. Across the different bioregions, the NSW North Coast, South Eastern Highlands, South East Corner, and Sydney Basin recorded the greatest amount of forest disturbed (Table 2). Drought impacts were found to be more widespread in the north than in the south (Figure 3). The timing and duration (time spent under the threshold) is shown in Figure 3 for slices of latitude that correspond with the map (i.e., disturbed area totals were aggregated for every 50 km in the north-south direction). This shows that the event impacts started earlier in the north and gradually moved south as spring and summer progressed. It also indicates that forests remained under the thresholds for longer (i.e., in a disturbed state) in the south compared with the north. A “zoomed in” map of an example area is also shown in Figure 3 to indicate the spatial detail of the final product.
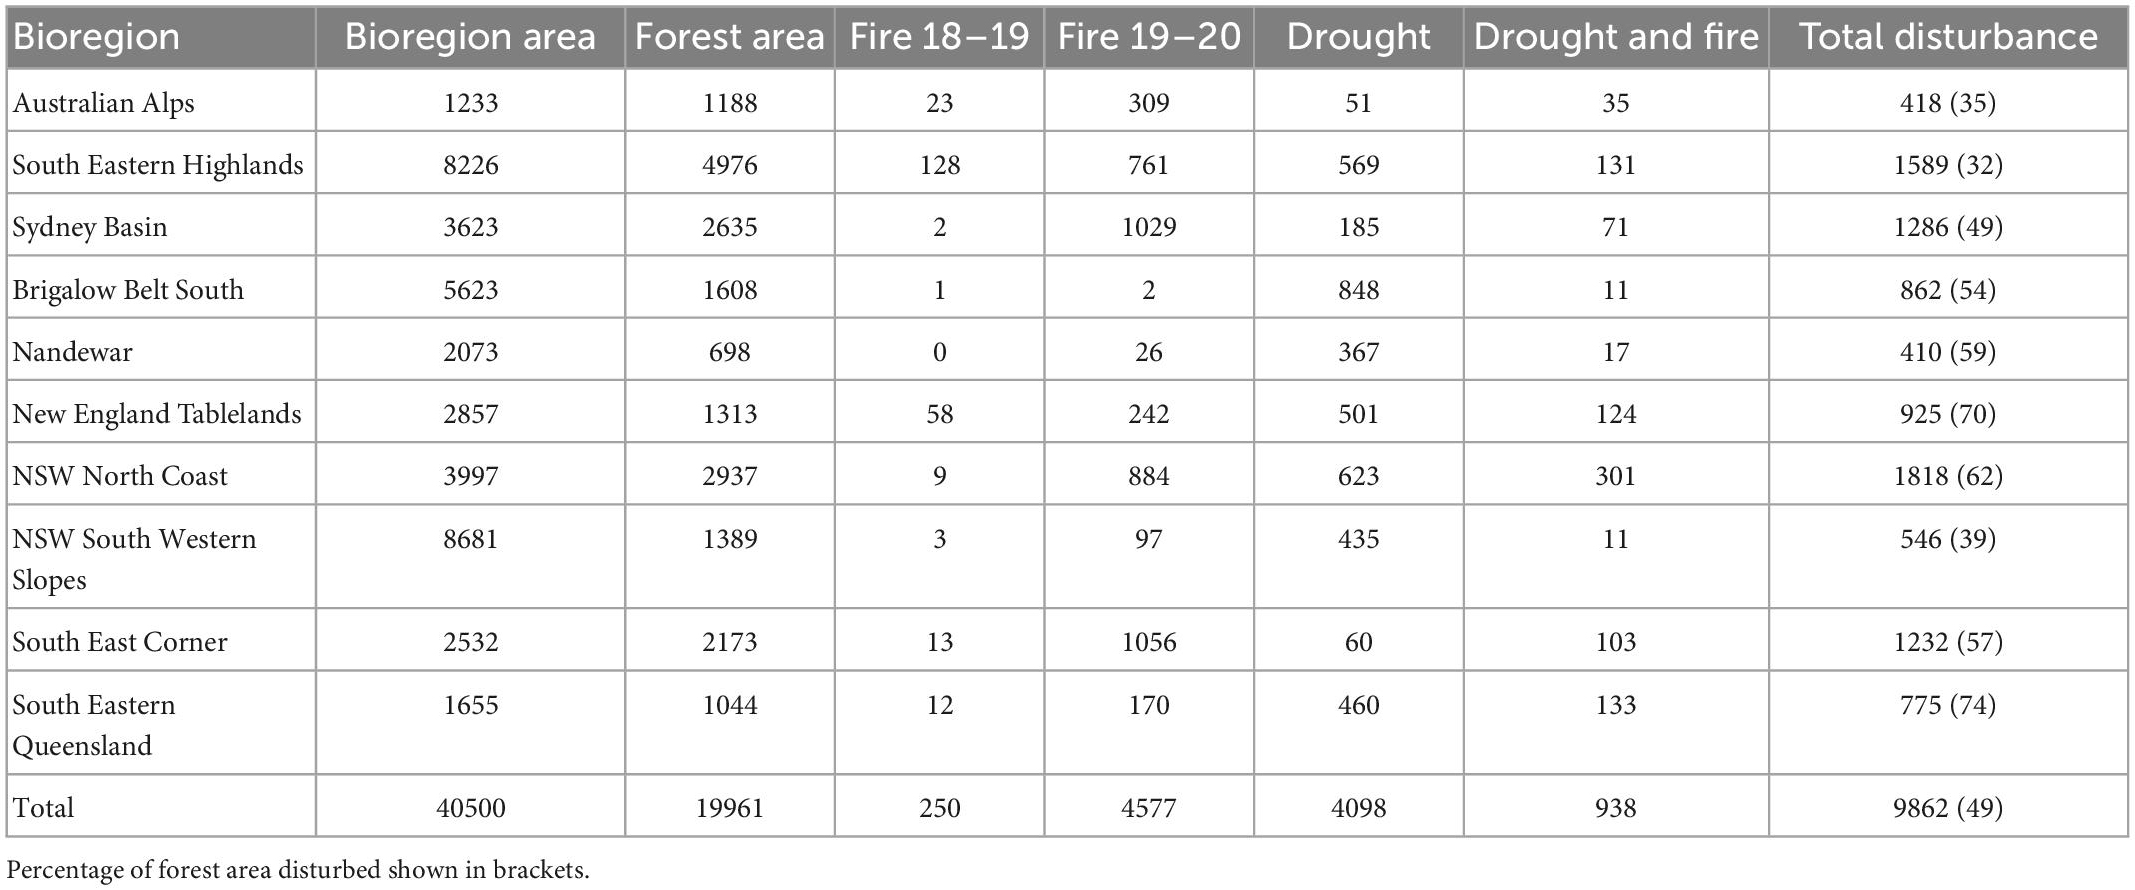
Table 2. Area of forest (‘000 ha) disturbed in each category and bioregion.
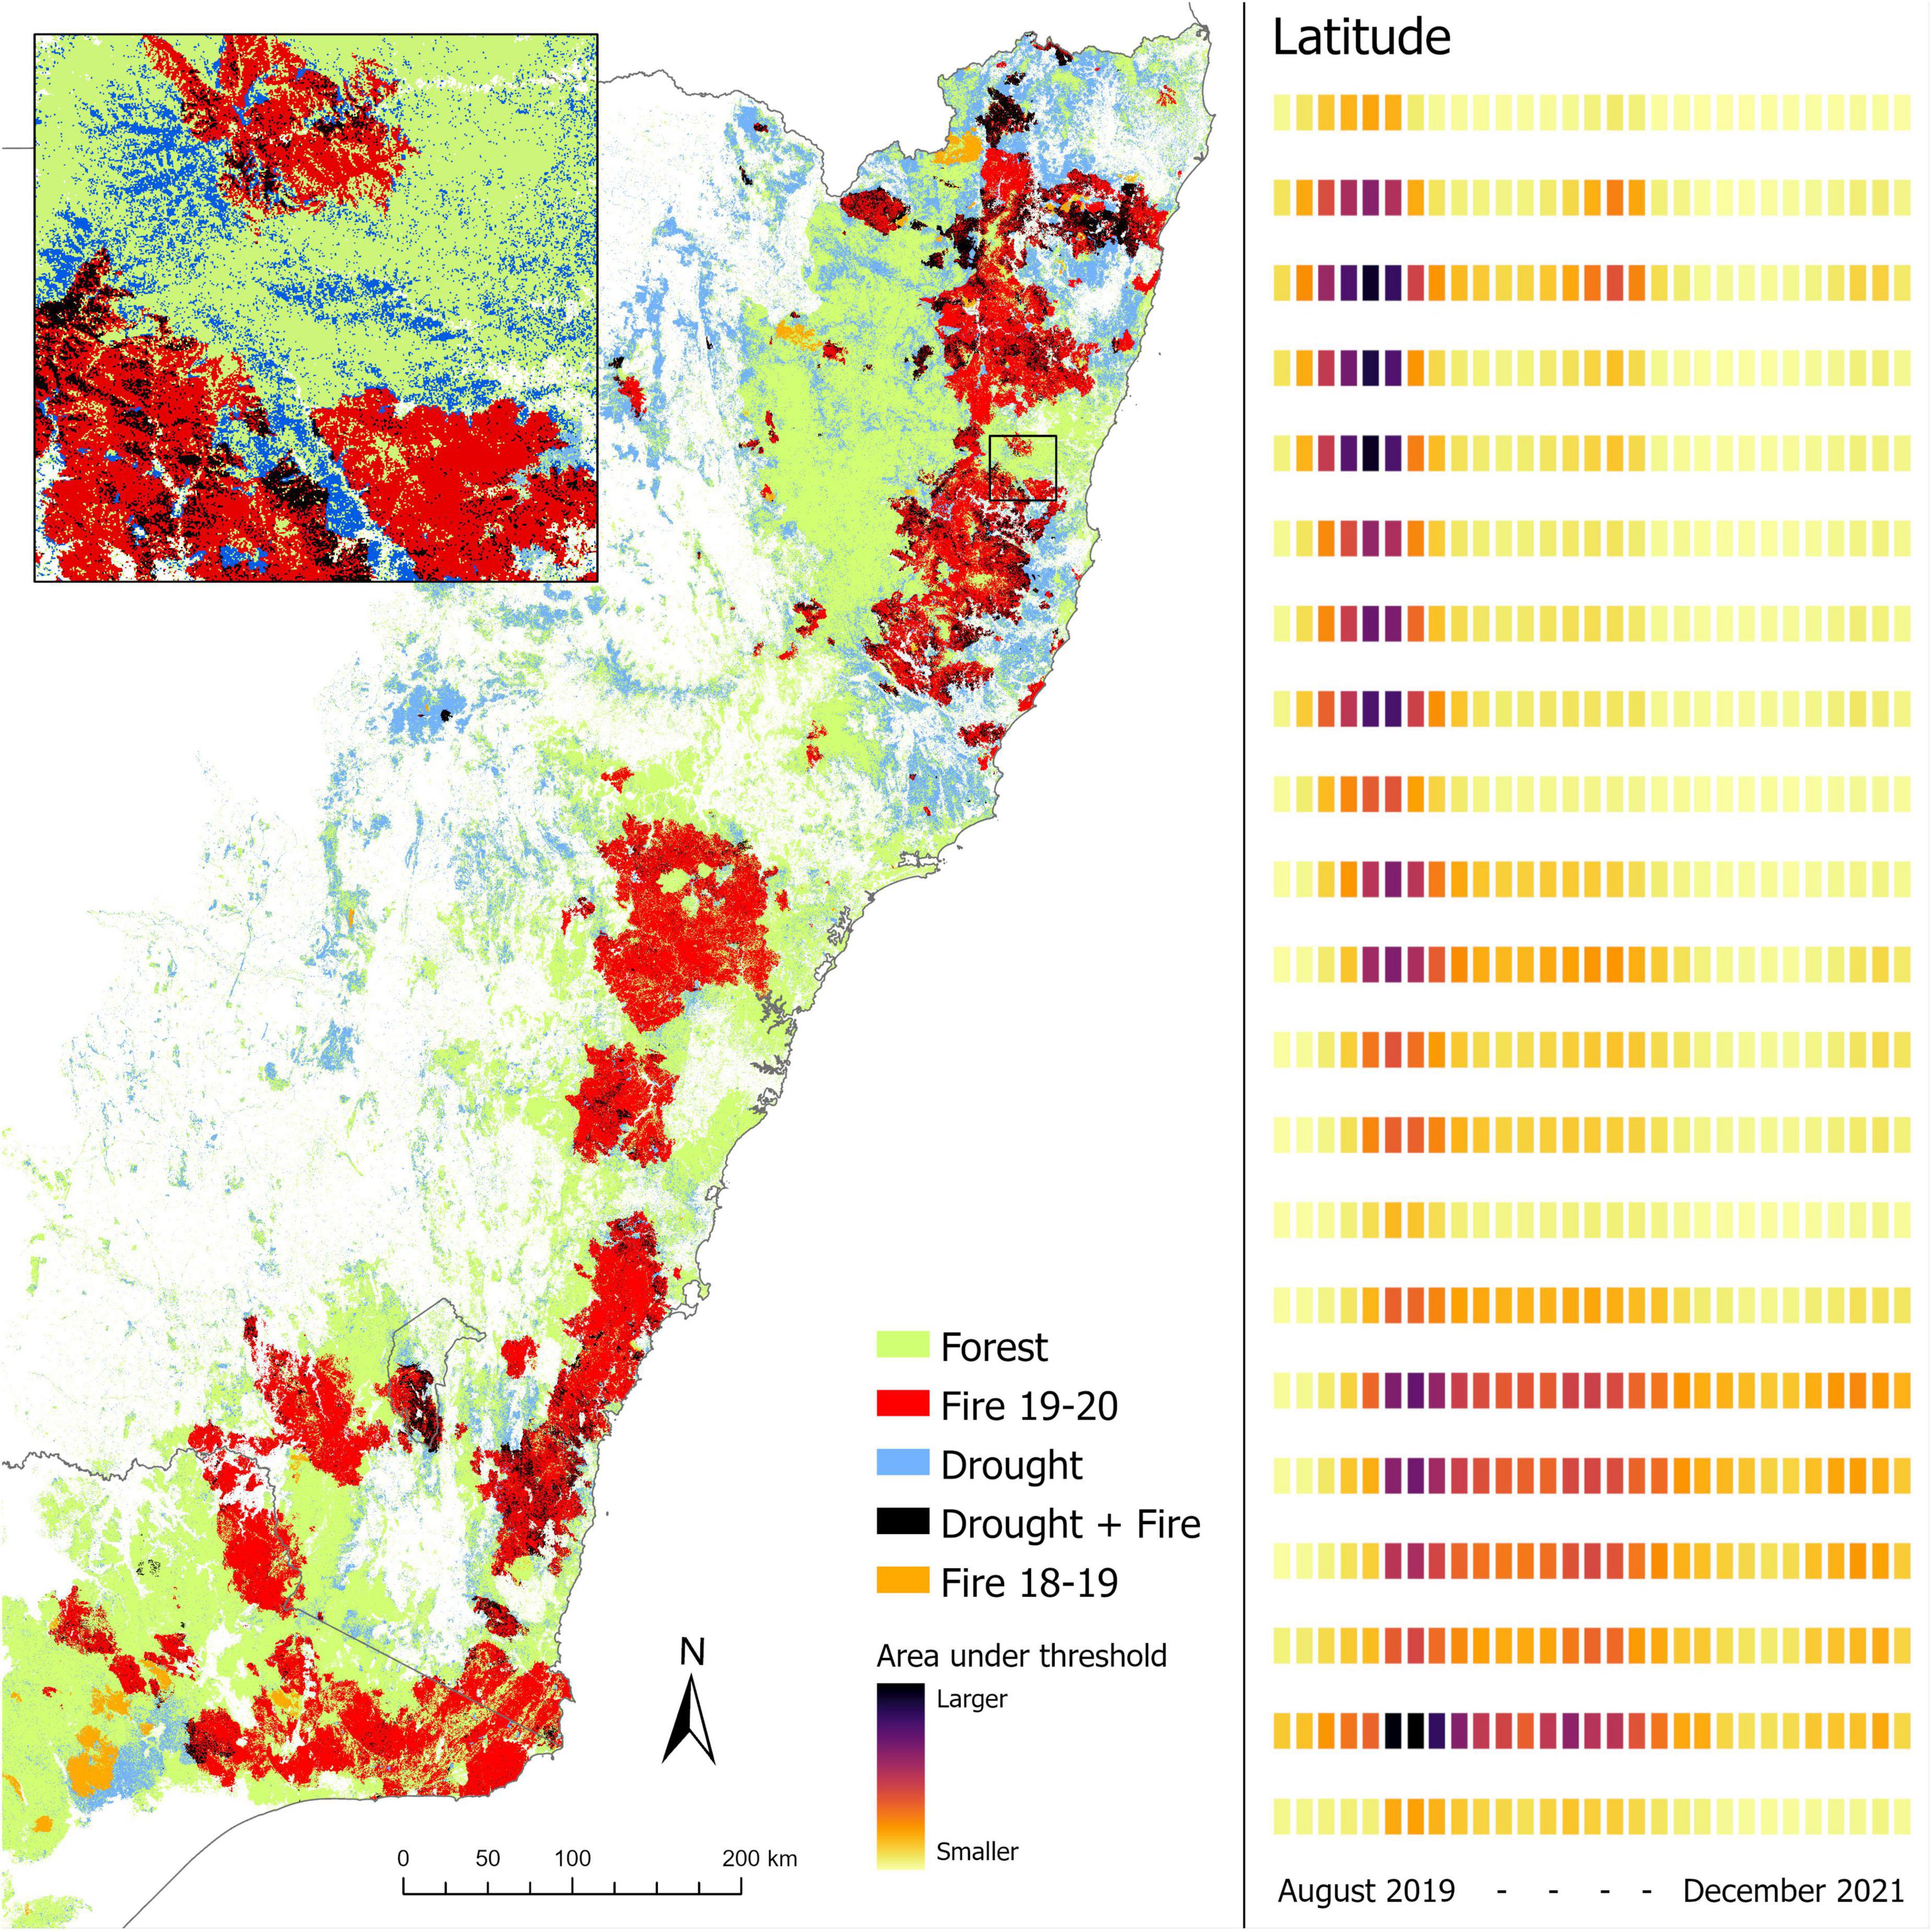
Figure 3. Map of disturbed areas in each class and the corresponding aggregated areas of disturbance across 50 km slices of latitude, where the darker colors indicate a greater area under the threshold. A zoomed in map of a small area is also shown.
3.2. Disturbance-recovery time series
The peak disturbance period with respect to the largest area of forest being in a disturbed state was January 2021, where over 8 Mha of forests were below the bioregion specific disturbance thresholds (Figure 4). By April, following significant rainfall from February onward, two thirds of the disturbed forests no longer fell below the relevant thresholds, indicating substantial and rapid spectral recovery. Figure 4 also indicates that spectral recovery is influenced by seasonal effects, with increased areas of forest switching back to below the threshold around November 2020 and a similar pattern occurring in November 2021.
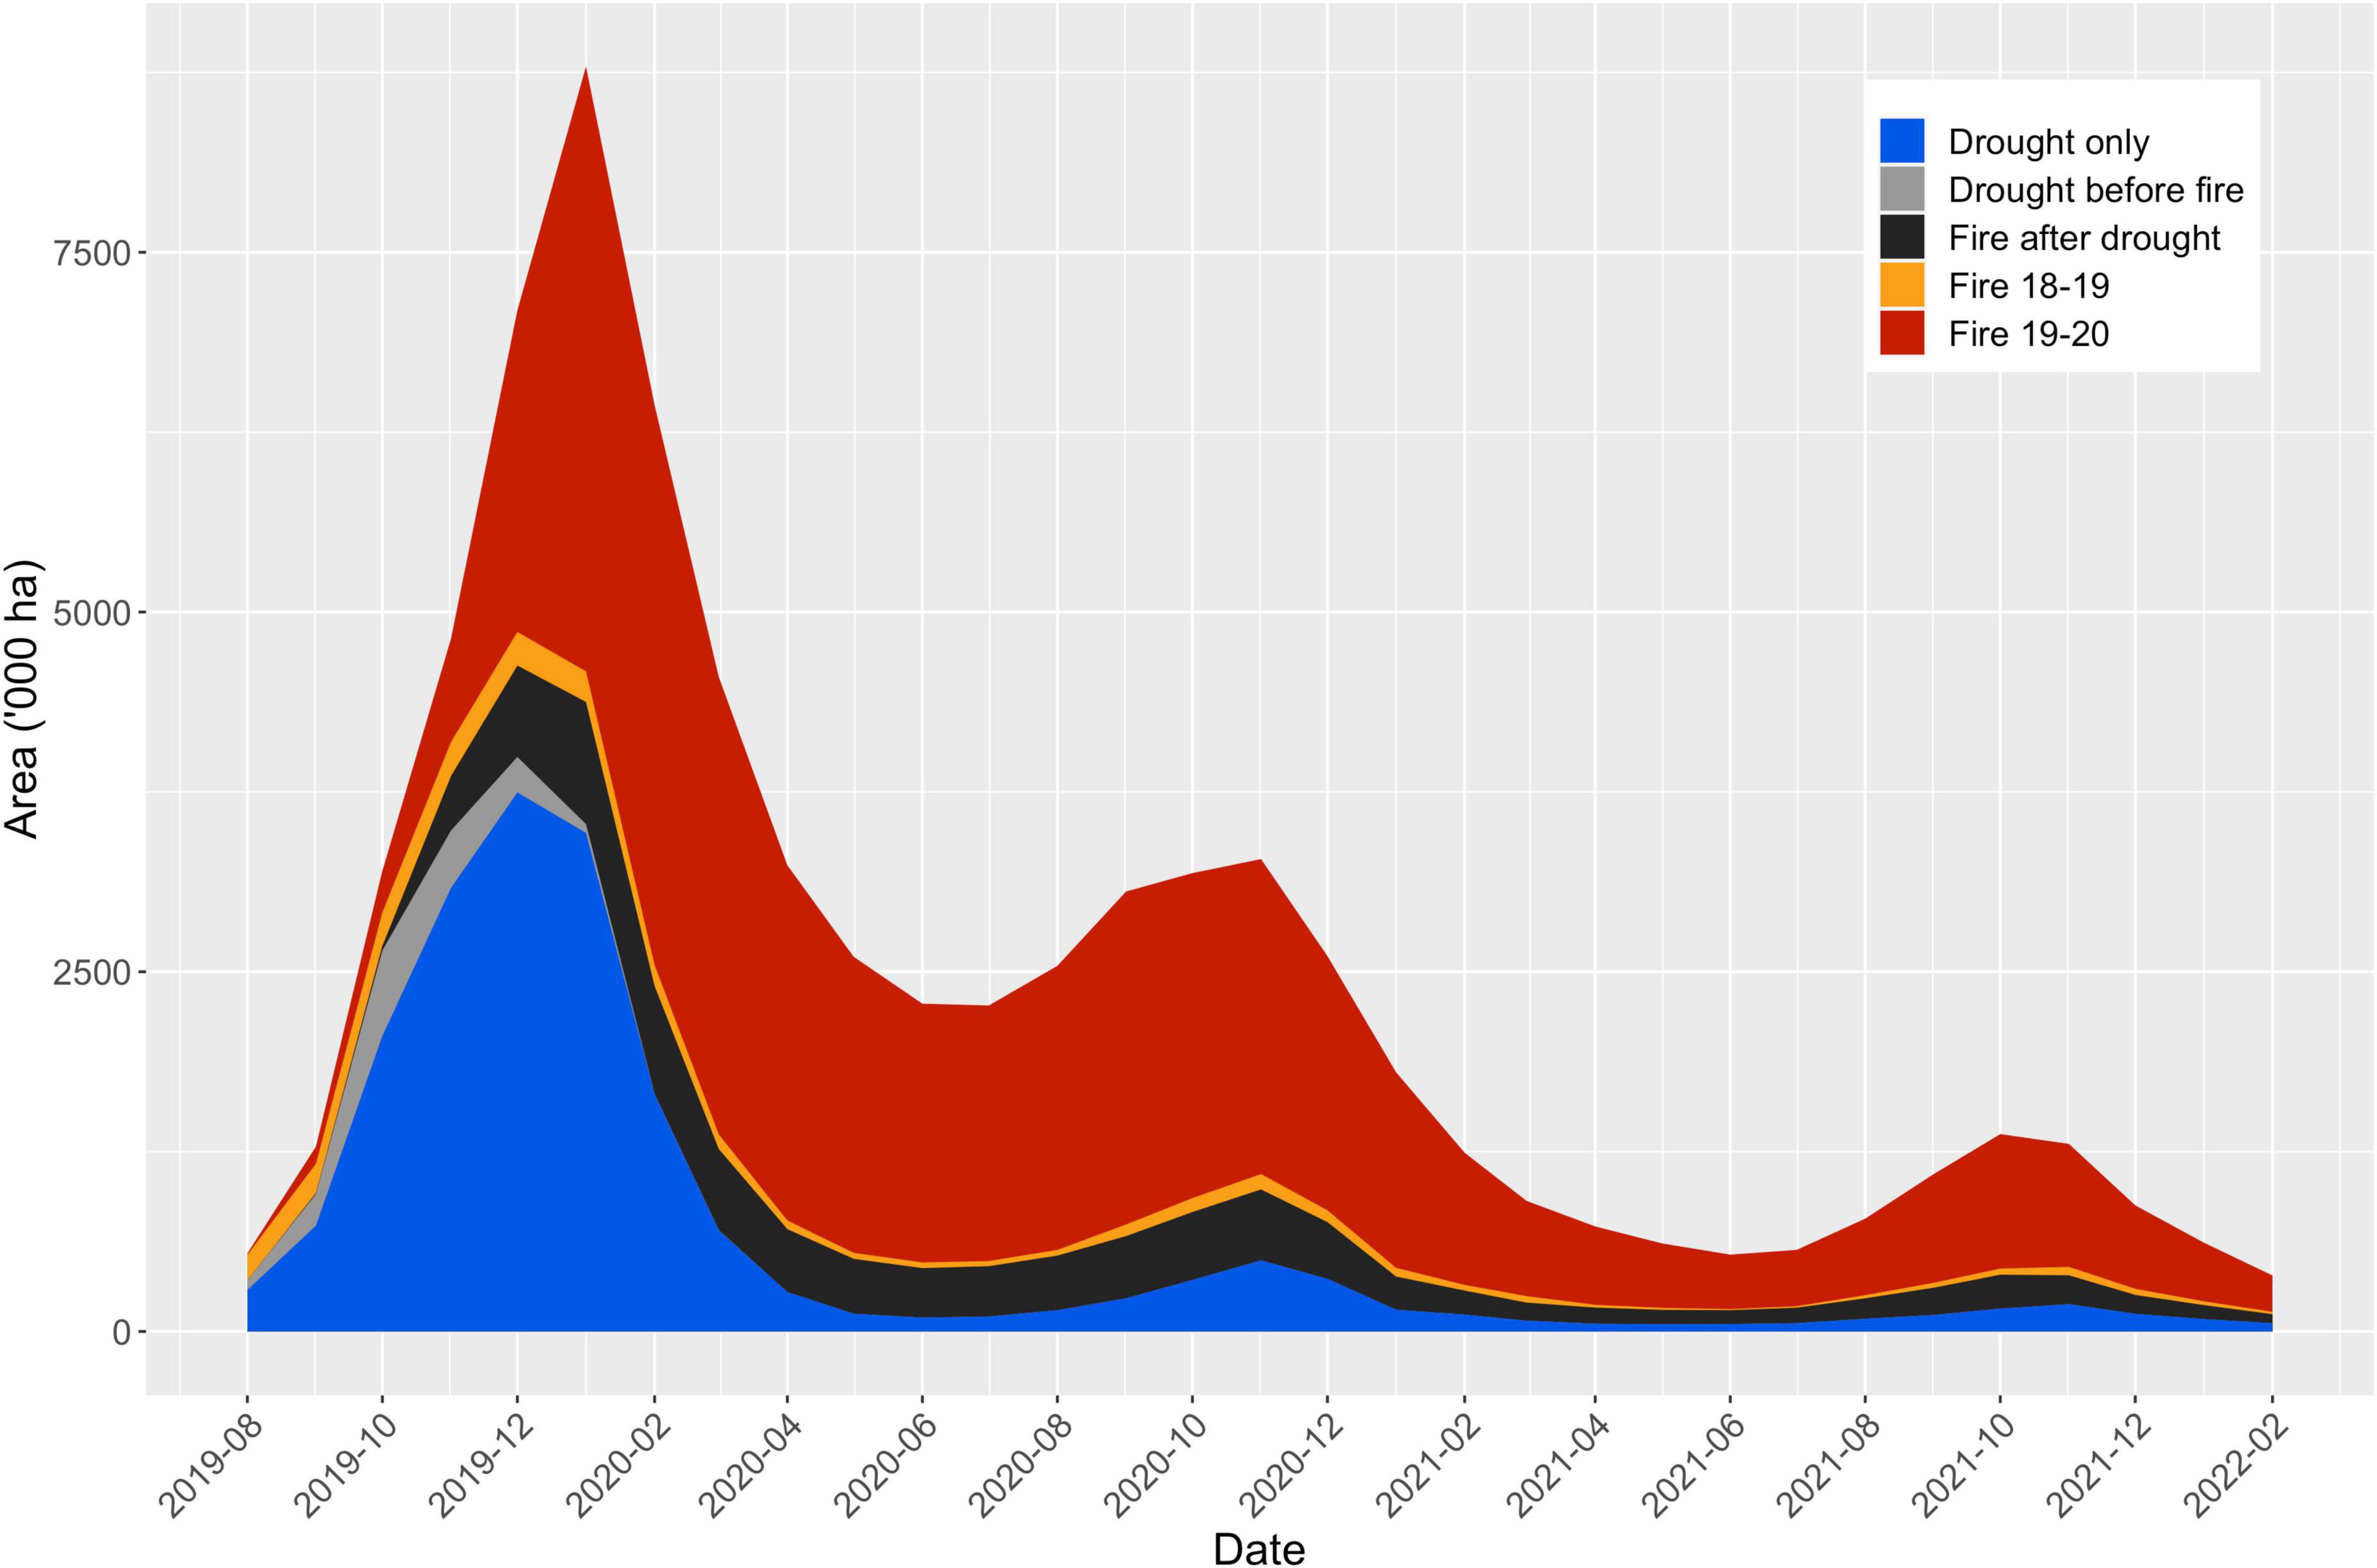
Figure 4. Area disturbed (below the bioregion specific thresholds) in each category across time. Note that the drought and fire class has been separated into pre-fire and post-fire categories.
3.3. Drought-fire impacts on recovery
An analysis of 50,000 random pixels (10,000 in each category) indicated that there was a greater change in NBR immediately post-disturbance for areas impacted by fire compared with those impacted by drought (Figure 5). Areas identified as impacted by both drought and fire showed larger spectral changes (along with a greater variability) than areas flagged as fire only. Due to the peak area below the threshold occurring around November in the recovery period (Figure 4), images from November–December 2020 and 2021 were chosen to represent 1 and 2 years post-disturbance, respectively. After ∼2 years recovery, most areas impacted only by drought had returned to their pre-disturbance NBR values. Areas identified as burned in either 2018–2019 or 2019–2020 and those that were flagged as impacted by both drought and fire appear to be recovering at much the same rates, when viewed overall. However, in some bioregions (New England Tablelands, South East Corner, and Sydney Basin), areas with the double disturbance (drought followed by fire) are showing signs of delayed recovery (Figure 6).
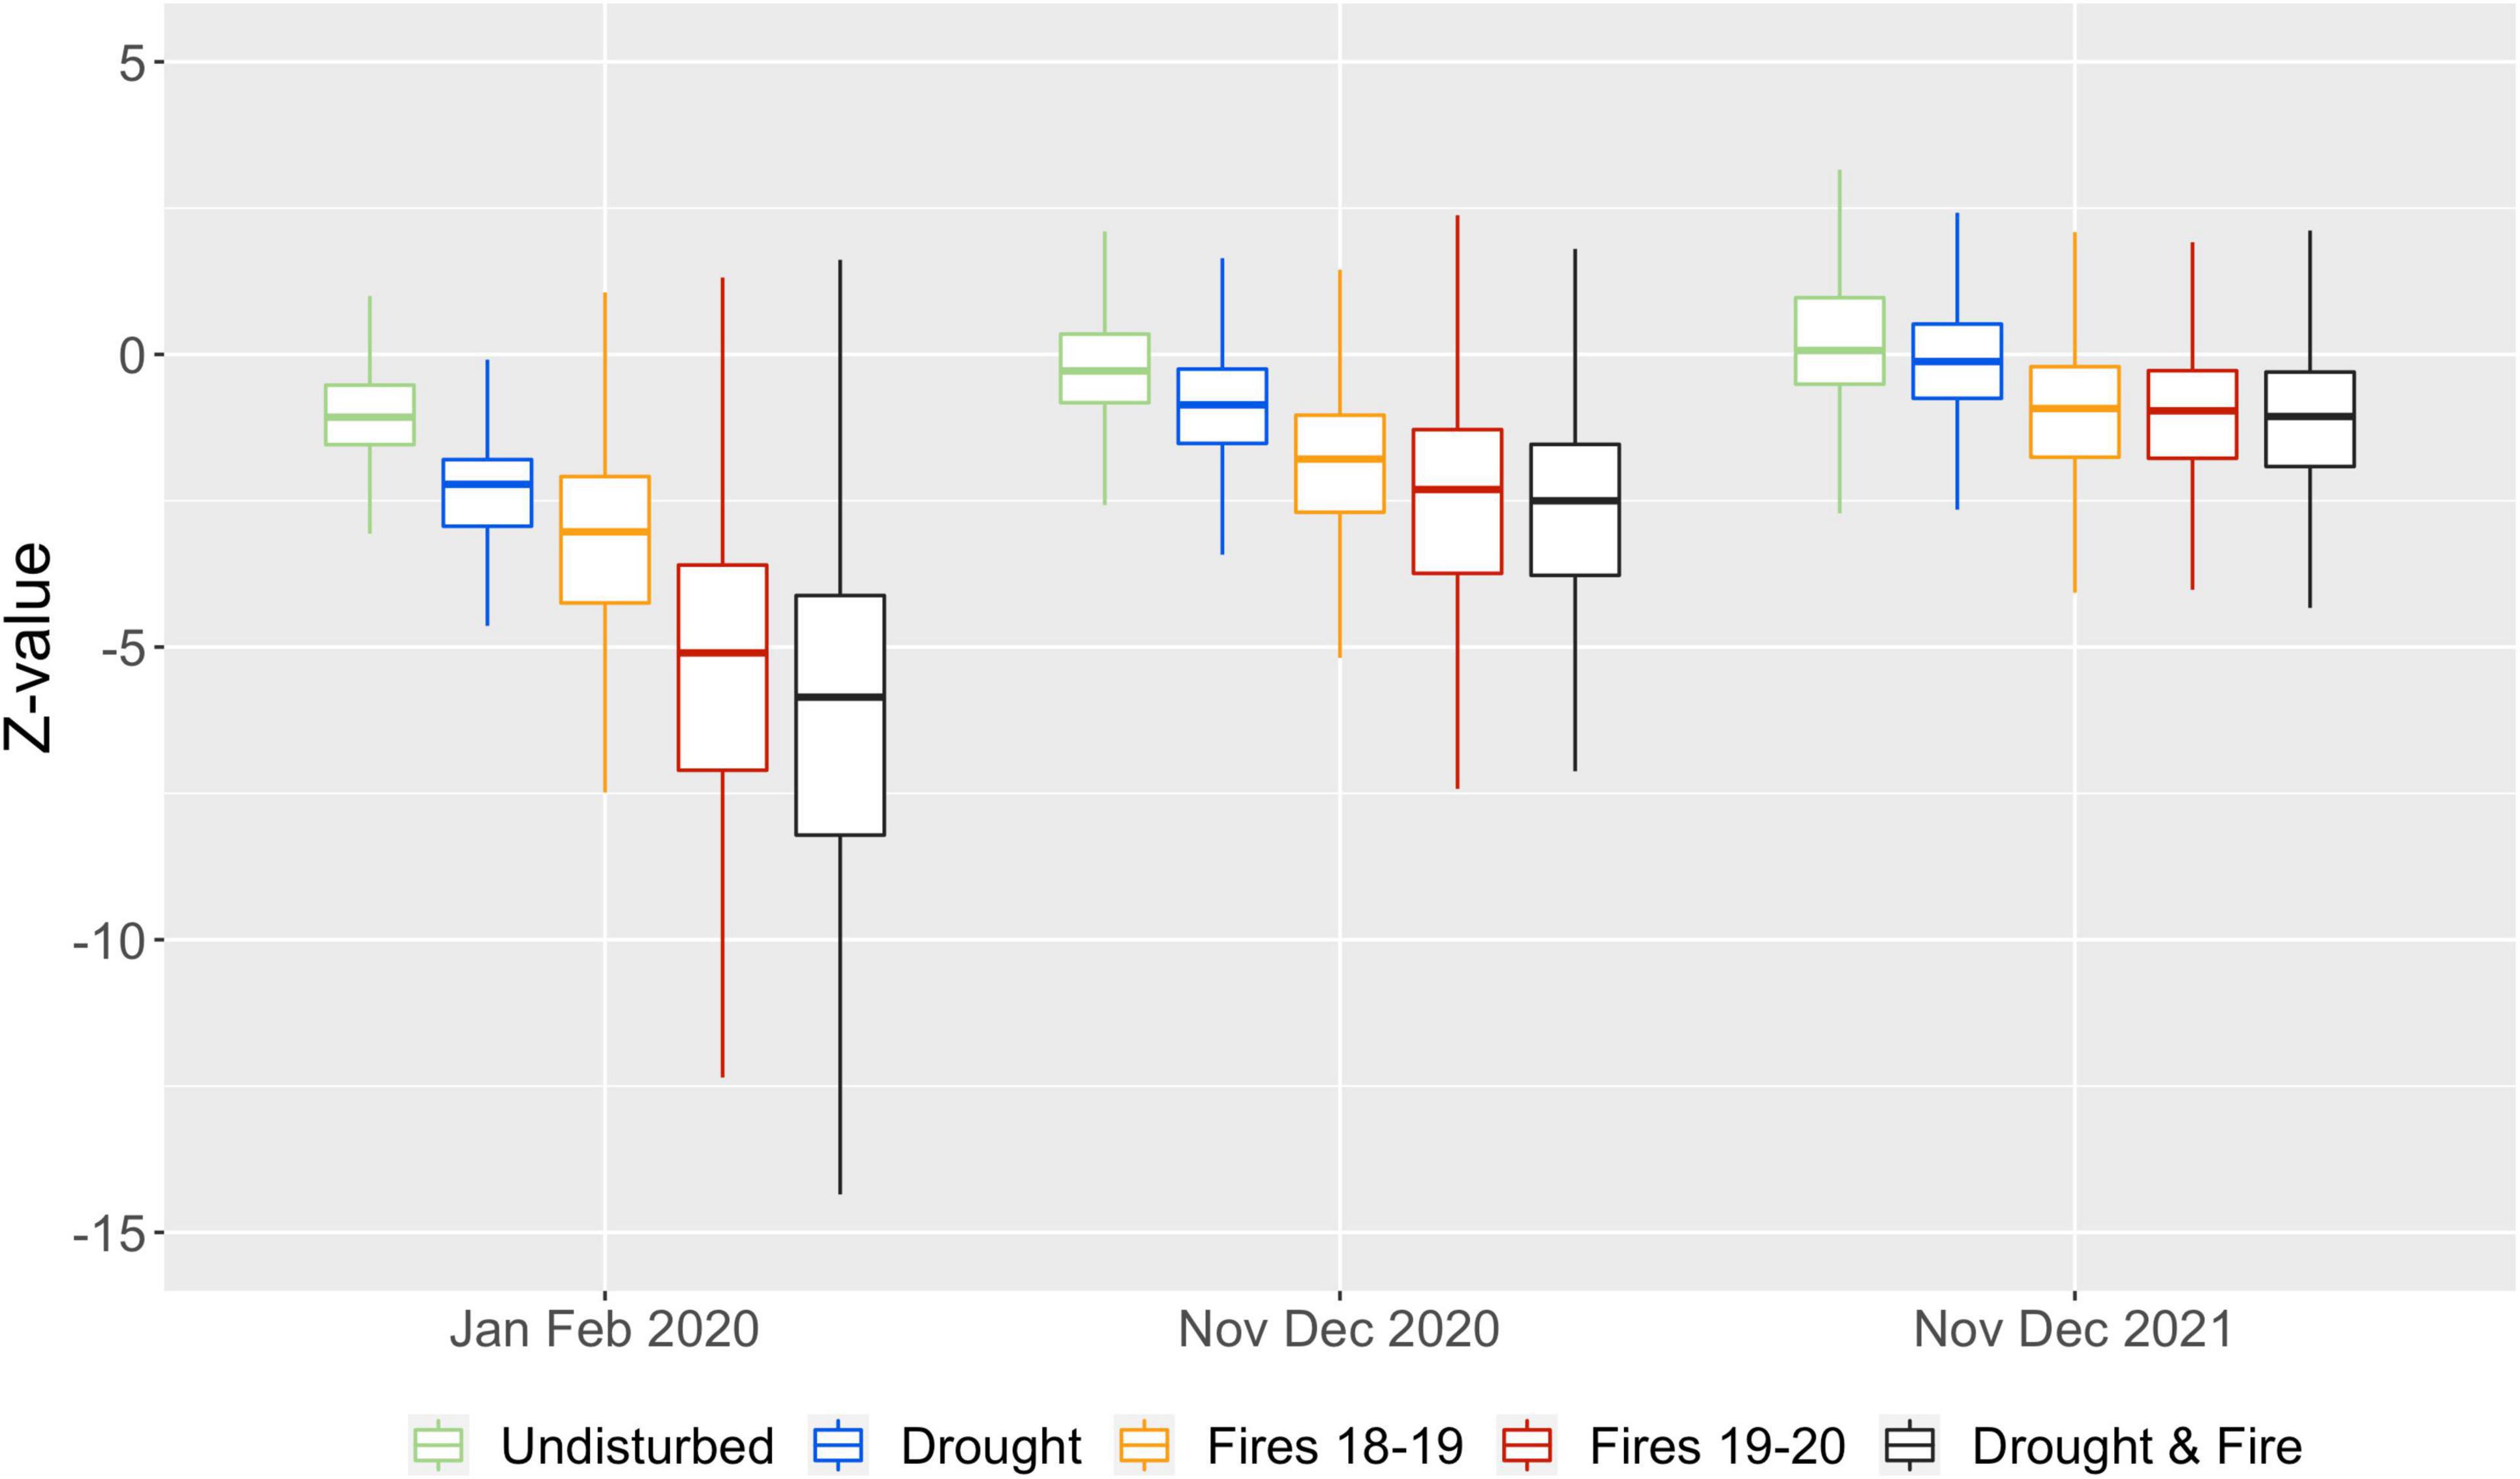
Figure 5. Boxplots showing z-values (see Eq. 2) of 50,000 samples for the four disturbed categories and an undisturbed category in January–February 2020, November–December 2020 (∼1 year recovery) and November–December 2021 (∼2 years recovery).
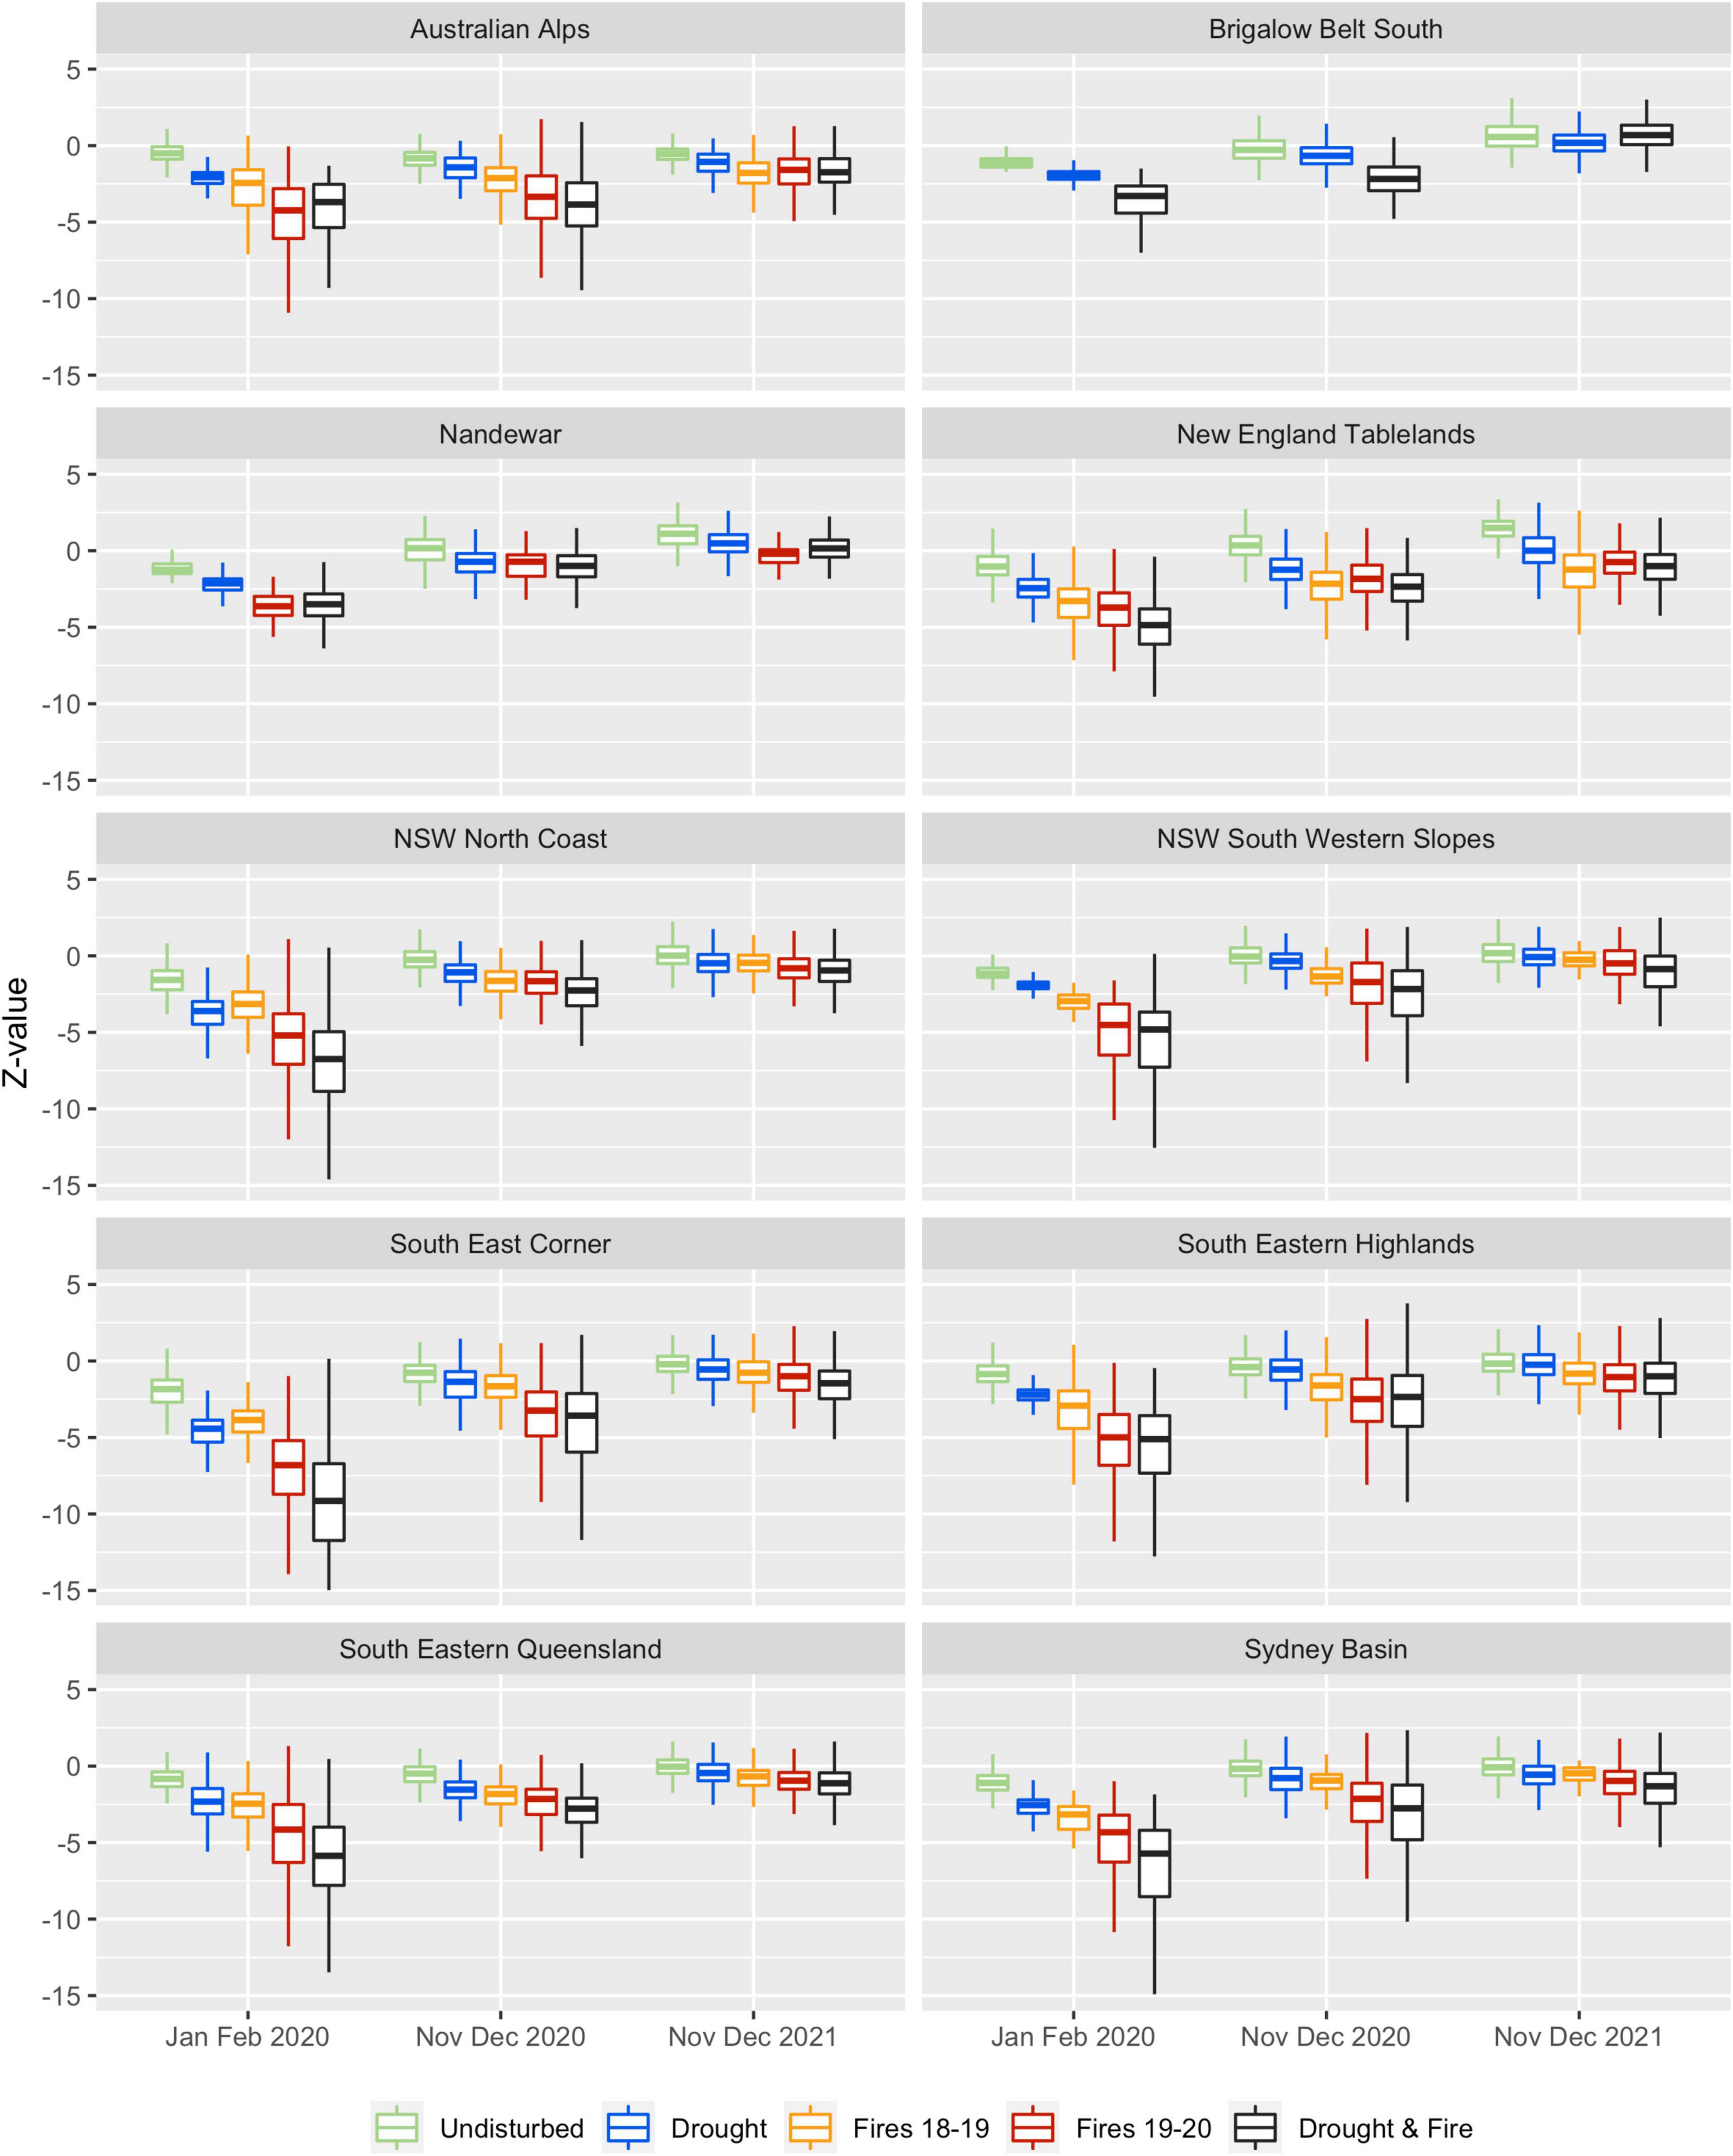
Figure 6. Boxplots showing z-values (see Eq. 2) for each bioregion for the four disturbed categories and an undisturbed category in January–February 2020, November–December 2020 (∼1 year recovery) and November–December 2021 (∼2 years recovery).
3.4. Accuracy assessment
The balanced class accuracies of the final disturbance map compared against the independent interpreter’s visual assessment ranged from 0.74 for the drought class to 0.83 for the fire class (Table 3). The sensitivity (true positive rate) ranged from 0.61 for drought to 0.75 for fire. Overall accuracy was found to be 0.67.
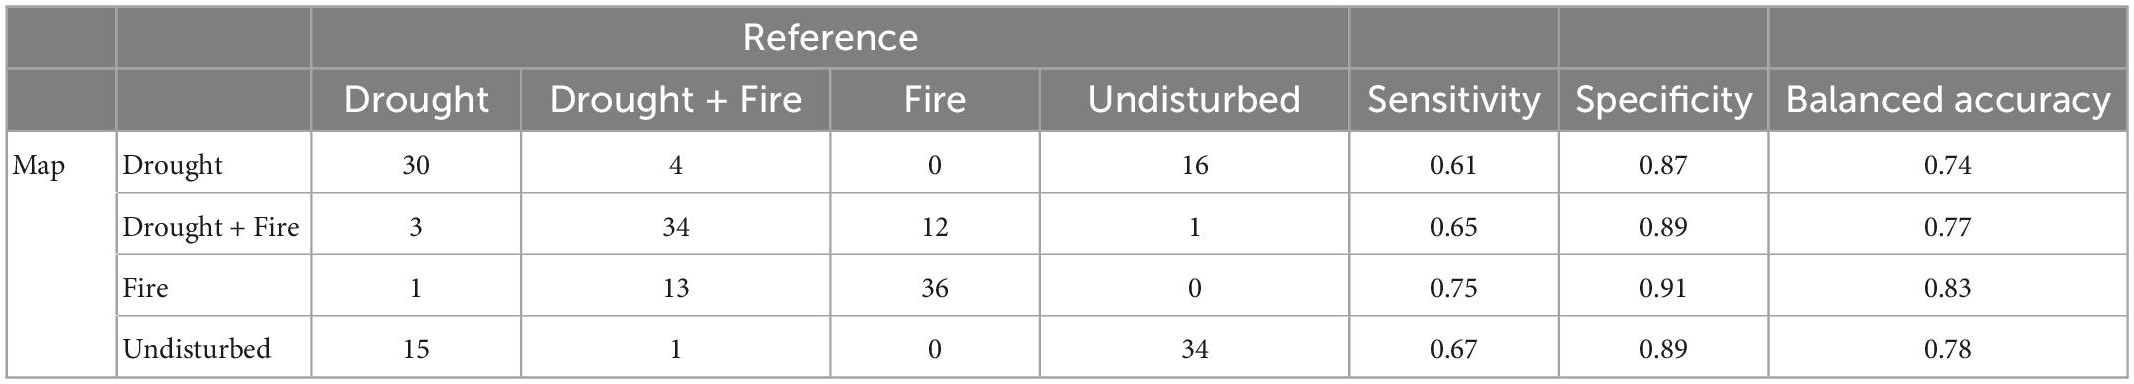
Table 3. Confusion matrix and accuracy statistics from the independent evaluation of 200 sample pixels.
4. Discussion
The recent drought and wildfires in southeast Australia had an enormous impact on the region’s forests. Satellite imagery from medium resolution sensors onboard satellites like Sentinel-2 provide an opportunity to quantify the extent and timing of canopy damage, monitor recovery and identify areas of concern. Our results indicated that almost 10 Mha (∼50%) of forests in the study area were impacted by either or both fire and drought. A defining feature of this study was to highlight areas of forest that were significantly drought affected before being burned. Using a monthly Sentinel-2 time series, cross-referenced with auxiliary information from MODIS and government fire records, provided a way to approach this problem. Our method highlighted 938,000 ha of forest that had drought related canopy damage prior to being burned. This approach contrasts with other satellite-based change detection studies, which are typically geared toward detecting annual disturbances (e.g., Kennedy et al., 2012; Hermosilla et al., 2015b). Using an annual time step means that high severity abrupt disturbances, such as fire, are often given precedence (Hislop et al., 2021) and more subtle or short-lasting disturbances may be missed. This is particularly relevant in an Australian context, where the native forests can recover from disturbances extremely quickly, as shown previously (Gibson and Hislop, 2022) and in this study.
The overall accuracy assessment undertaken by an independent expert showed that the maps have a reasonable accuracy, with balanced accuracies ranging from 0.74 for the drought class to 0.83 for the fire class (Table 3). The overall accuracy, based purely on the correctly classified pixels, was 0.67, which is comparable to other satellite-based classification studies, particularly where more subtle disturbances are included (Kennedy et al., 2012; Haywood et al., 2016; Nguyen et al., 2018). Most of the disagreements between the maps and the validation were found between the fire and fire plus drought classes and between the drought and undisturbed classes. The interpreter found 12 sample pixels that were not forest, due to the original forest mask being a modeled product and therefore not 100% accurate. Most of these were mapped as undisturbed, which was encouraging, given that the methods were designed specifically for forest disturbance.
Normalization using the z-value approach is not particularly common in forest related satellite time series literature. Coops et al. (2009) used the technique with a MODIS based disturbance index, while White et al. (2018) tested the method in terms of its ability to represent spectral recovery. It also forms part of the Tasseled Cap disturbance index proposed by Healey et al. (2005); however, in this case the mean and standard deviation are derived from all forested pixels within a certain area (i.e., spatially, not temporally). In our study, the approach enabled us to highlight areas significantly different from what could be considered their normal state, based on a pre-disturbance baseline. The baseline period of 2016–2018 was constrained by the availability of Sentinel-2 data (2A was launched in 2015 and 2B in 2017). Although 2018 was also a year of drought across the region, we made the assumption that the worst impacts to forests were not widely apparent until 2019, when the drought intensified (Nguyen et al., 2021). The use of a statistical approach for selecting a stable period, as proposed by Verbesselt et al. (2012), may be an alternative in future. However, in the context of our study and given the authors’ knowledge of local conditions, manually selecting the same stable period across the entire region produced the desired outcome and was computationally efficient, particularly in the Google Earth Engine environment.
The previously collected reference dataset (Hislop et al., 2021) that was used here for model calibration was primarily based on Landsat seasonal data and not specifically targeted to the 2019–2020 fire-drought event. In earlier trials, we used the same thresholds across the entire study area (z-values of both −2 and −3 were tested). However, to better represent differences in the forests across the region, bioregion specific thresholds were considered more appropriate, and the reference dataset was an objective way to define these. The z-value approach depends both on the statistics for the stable period and the specific thresholds used. Both elements can undoubtably be improved upon, perhaps with the application of targeted reference data and/or vegetation specific thresholds. As mentioned in section 2.3 removing the seasonal component via harmonic modeling may also be a possibility. While the thresholds used were likely conservative (i.e., between 2 and 3 standard deviations below the mean), using smaller thresholds would result in an even greater area of forest being identified as impacted. The aim in this study was to locate areas where canopy collapse was substantial, as opposed to general dryness, which was evident almost across the entire region. Coincident field or high-resolution data would be needed to more consistently verify whether the thresholds accurately represented canopy collapse. However, given that this study was undertaken retrospectively with limited resources, these data were not available.
Both Figures 3 and 4 show interesting disturbance-recovery patterns, with clear seasonal and latitudinal components. Areas in the north, which are subtropical, spent less time under the thresholds compared with areas in the south, which are more temperate. However, the number of months spent under the threshold value may be better thought of as the time the forest was in a “disturbed” state rather than an indication of how it is recovering post-disturbance.
While spectral recovery is somewhat limited in its ability to represent structural and compositional recovery (Bartels et al., 2016), studies have demonstrated that it can act as a reasonable surrogate (White et al., 2019) and it is an area of research that continues to evolve. In Canada, spectral recovery has been defined as the number of years to recover 80% of a pre-disturbance NBR value (e.g., White et al., 2022), while earlier work in NSW used the number of years to recover the full pre-disturbance NBR value (Hislop et al., 2021). An approach which doesn’t rely on a pre-disturbance baseline at all, but looks at rates of change in the post-fire environment, has been proposed by Gibson et al. (2022).
One of the objectives of this paper was to investigate whether forest spectral recovery over the last 2 years was influenced by the type of disturbance that occurred (drought, fire, or both drought and fire). Fires that occurred in 2018–2019 (the previous season) were also included. These areas essentially experienced a year of drought after being burned, as opposed to the areas burned in 2019–2020, which experienced drought prior to being burned, followed by above average rainfall shortly after. In total, 50,000 random samples (10,000 in each category) were selected to compare spectral recovery after 1 and 2 years of recovery. The selection of 10,000 random pixels was deemed sufficient to represent the class, even though it equates to a small fraction of the population. It is also likely that spatial clustering exists, especially in the smaller classes (Fires 2018–2019, Drought and Fire); thus, results should be interpreted with caution, as there may be other drivers affecting recovery. Overall, the analysis suggests that areas impacted solely by drought have recovered faster than areas burned in the wildfires (Figure 5). All three fire categories (Fires 2018–2019, Fires 2019–2020, Drought and Fire) appear to be recovering at similar rates, indicating that the earlier fires (2018–2019) had a 1-year lag in recovery due to the post-fire drought. There are signs in some bioregions that areas impacted by drought before being burned are recovering more slowly (Figure 6); these areas may warrant further investigations. It is also notable that these areas had larger initial z-values, so the delayed recovery could be related to fire severity rather than the double disturbance. Complicating matters somewhat, the region studied here has had 2 years of above average rainfall since the drought, which has likely led to increased understory greening in many areas. Thus, the strong spectral recovery signal may not always be related to canopy recovery. Nonetheless, it provides a useful broadscale assessment, which cannot be readily achieved over such a large area by any other means. There are opportunities moving forward to explore the data at smaller spatial scales and consider factors such as understory vs. overstory recovery.
5. Conclusion
In this paper, we presented a novel method that allowed us to identify two disturbances in quick succession using a dense time series of Sentinel-2 satellite imagery. This enabled us to produce maps (and associated statistics) of forests disturbed by drought, fire, and both drought and fire during an extreme climate driven event. The different disturbance types were then analyzed to explore broad recovery patterns in the 2 years following the event. Although developed for a specific disturbance event, the time series methods presented here are generally transferrable and demonstrate an effective approach for characterizing two disturbances in quick succession. The study demonstrates the enormous potential of moderate resolution satellites such as Sentinel-2 for monitoring the dynamic nature of forests across a range of spatial and temporal scales.
Data availability statement
The raw data supporting the conclusions of this article will be made available by the authors, without undue reservation.
Author contributions
SH, AC, and CS conceived of the original study design. SH, RG, AR, RN, and BC developed and refined the methods. TN undertook the accuracy assessment. All authors contributed to the writing and preparation of the manuscript.
Funding
Funding for the salary of SH was through the NSW Forest Monitoring and Improvement Program, managed by the NSW Natural Resources Commission.
Conflict of interest
The authors declare that the research was conducted in the absence of any commercial or financial relationships that could be construed as a potential conflict of interest.
The reviewer PM declared a past co-authorship with the author AC to the handling editor.
Publisher’s note
All claims expressed in this article are solely those of the authors and do not necessarily represent those of their affiliated organizations, or those of the publisher, the editors and the reviewers. Any product that may be evaluated in this article, or claim that may be made by its manufacturer, is not guaranteed or endorsed by the publisher.
References
Anderegg, W. R. L., Klein, T., Bartlett, M., Sack, L., Pellegrini, A. F. A., and Choat, B. (2016). Meta-analysis reveals that hydraulic traits explain cross-species patterns of drought-induced tree mortality across the globe. Proc. Natl. Acad. Sci. U.S.A. 113, 2–7. doi: 10.1073/pnas.1525678113
Australian Government (2018). National forest and sparse woody vegetation data version 3. Available online at: https://data.gov.au/data/dataset/national-forest-and-sparse-woody-vegetation-data-version-3-2018-release (accessed August 1, 2019).
Bartels, S. F., Chen, H. Y. H., Wulder, M. A., and White, J. C. (2016). Trends in post-disturbance recovery rates of Canada’s forests following wildfire and harvest. For. Ecol. Manage. 361, 194–207. doi: 10.1016/j.foreco.2015.11.015
Boer, M. M., de Dios Resco, V., and Bradstock, R. A. (2020). Unprecedented burn area of Australian mega forest fires. Nat. Clim. Chang. 10, 170–172. doi: 10.1038/s41558-020-0710-7
Bowman, D. M. J. S., Williamson, G. J., Gibson, R. K., Bradstock, R. A., and Keenan, R. J. (2021). The severity and extent of the Australia 2019–20 Eucalyptus forest fires are not the legacy of forest management. Nat. Ecol. Evol. 5, 1003–1010. doi: 10.1038/s41559-021-01464-6
Bradstock, R. A. (2010). A biogeographic model of fire regimes in Australia: Current and future implications. Glob. Ecol. Biogeogr. 19, 145–158. doi: 10.1111/j.1466-8238.2009.00512.x
Brouwers, N., Matusick, G., Ruthrof, K., Lyons, T., and Hardy, G. (2013). Landscape-scale assessment of tree crown dieback following extreme drought and heat in a Mediterranean eucalypt forest ecosystem. Landsc. Ecol. 28, 69–80. doi: 10.1007/s10980-012-9815-3
Bureau of Meteorology (2019). Archive - Monthly rainfall totals for Australia. Available online at: http://www.bom.gov.au/jsp/awap/rain/archive.jsp (accessed February 1, 2020).
Caccamo, G., Chisholm, L. A., Bradstock, R. A., and Puotinen, M. L. (2011). Assessing the sensitivity of MODIS to monitor drought in high biomass ecosystems. Remote Sens. Environ. 115, 2626–2639. doi: 10.1016/j.rse.2011.05.018
Choat, B., Brodribb, T. J., Brodersen, C. R., Duursma, R. A., López, R., and Medlyn, B. E. (2018). Triggers of tree mortality under drought. Nature 558, 531–539. doi: 10.1038/s41586-018-0240-x
Claverie, M., Ju, J., Masek, J. G., Dungan, J. L., Vermote, E. F., Roger, J. C., et al. (2018). The Harmonized Landsat and Sentinel-2 surface reflectance data set. Remote Sens. Environ. 219, 145–161. doi: 10.1016/j.rse.2018.09.002
Cohen, W. B., Yang, Z., and Kennedy, R. E. (2010). Detecting trends in forest disturbance and recovery using yearly Landsat time series: 2. TimeSync - Tools for calibration and validation. Remote Sens. Environ. 114, 2911–2924. doi: 10.1016/j.rse.2010.07.010
Collins, L. (2020). Eucalypt forests dominated by epicormic resprouters are resilient to repeated canopy fires. J. Ecol. 108, 310–324. doi: 10.1111/1365-2745.13227
Collins, L., Bradstock, R. A., Clarke, H., Clarke, M. F., Nolan, R. H., and Penman, T. D. (2021). The 2019/2020 mega-fires exposed Australian ecosystems to an unprecedented extent of high-severity fire. Environ. Res. Lett. 16:044029. doi: 10.1088/1748-9326/abeb9e
Coops, N. C., Wulder, M. A., and Iwanicka, D. (2009). Large area monitoring with a MODIS-based Disturbance Index (DI) sensitive to annual and seasonal variations. Remote Sens. Environ. 113, 1250–1261. doi: 10.1016/j.rse.2009.02.015
De Kauwe, M. G., Medlyn, B. E., Ukkola, A. M., Mu, M., Sabot, M. E. B., Pitman, A. J., et al. (2020). Identifying areas at risk of drought-induced tree mortality across South-Eastern Australia. Glob. Chang. Biol. 26, 5716–5733. doi: 10.1111/gcb.15215
Department of Environment Land Water and Planning (2020). Fire History Records of Fires Primarily on Public Land. Available online at: www.data.vic.gov.au (accessed June 1, 2020).
Department of Planning Industry and Environment (2020). NPWS Fire History - Wildfires and Prescribed Burns. Available online at: https://datasets.seed.nsw.gov.au/dataset/fire-history-wildfires-and-prescribed-burns-1e8b6 (accessed June 1, 2020).
Fettig, C. J., Mortenson, L. A., Bulaon, B. M., and Foulk, P. B. (2019). Tree mortality following drought in the central and southern Sierra Nevada. California, U.S. For. Ecol. Manage. 432, 164–178. doi: 10.1016/j.foreco.2018.09.006
Fisher, A., Day, M., Gill, T., Roff, A., Danaher, T., and Flood, N. (2016). Large-area, high-resolution tree cover mapping with multi-temporal SPOT5 imagery. New South Wales, Australia. Remote Sens. 8, 1–23. doi: 10.3390/rs8060515
Gibson, R. K., and Hislop, S. (2022). Signs of resilience in resprouting Eucalyptus forests, but areas of concern: 1 year of post-fire recovery from Australia’s Black Summer of 2019–2020. Int. J. Wildl. Fire 31, 545–557. doi: 10.1071/WF21089
Gibson, R. K., White, L. A., Hislop, S., Nolan, R. H., and Dorrough, J. (2022). The post-fire stability index; a new approach to monitoring post-fire recovery by satellite imagery. Remote Sens. Environ. 280:113151. doi: 10.1016/j.rse.2022.113151
Gibson, R., Danaher, T., Hehir, W., and Collins, L. (2020). A remote sensing approach to mapping fire severity in south-eastern Australia using sentinel 2 and random forest. Remote Sens. Environ. 240:111702. doi: 10.1016/j.rse.2020.111702
Giglio, L., Boschetti, L., Roy, D. P., Humber, M. L., and Justice, C. O. (2018). The Collection 6 MODIS burned area mapping algorithm and product. Remote Sens. Environ. 217, 72–85. doi: 10.1016/j.rse.2018.08.005
Gorelick, N., Hancher, M., Dixon, M., Ilyushchenko, S., Thau, D., and Moore, R. (2017). Google Earth Engine: Planetary-scale geospatial analysis for everyone. Remote Sens. Environ. 202, 18–27. doi: 10.1016/j.rse.2017.06.031
Haywood, A., Verbesselt, J., and Baker, P. J. (2016). Mapping Disturbance Dynamics in Wet Sclerophyll Forests Using Time Series Landsat. in ISPRS - International Archives of the Photogrammetry. Remote Sens. Spatial Inform. Sci. 8, 633–641. doi: 10.5194/isprsarchives-XLI-B8-633-2016
Healey, S. P., Cohen, W. B., Zhiqiang, Y., and Krankina, O. N. (2005). Comparison of Tasseled Cap-based Landsat data structures for use in forest disturbance detection. Remote Sens. Environ. 97, 301–310. doi: 10.1016/j.rse.2005.05.009
Hermosilla, T., Wulder, M. A., White, J. C., Coops, N. C., and Hobart, G. W. (2015a). An integrated Landsat time series protocol for change detection and generation of annual gap-free surface reflectance composites. Remote Sens. Environ. 158, 220–234. doi: 10.1016/j.rse.2014.11.005
Hermosilla, T., Wulder, M. A., White, J. C., Coops, N. C., and Hobart, G. W. (2015b). Regional detection, characterization, and attribution of annual forest change from 1984 to 2012 using Landsat-derived time-series metrics. Remote Sens. Environ. 170, 121–132. doi: 10.1016/j.rse.2015.09.004
Hislop, S., Haywood, A., Alaibakhsh, M., Nguyen, T. H., Soto-Berelov, M., Jones, S., et al. (2021). A reference data framework for the application of satellite time series to monitor forest disturbance. Int. J. Appl. Earth Obs. Geoinf. 105:102636. doi: 10.1016/j.jag.2021.102636
IBRA (2017). Interim biogeographic regionalisation for Australia (IBRA). Available online at: https://www.dcceew.gov.au/environment/land/nrs/science/ibra (accessed June 1, 2020).
Jiao, T., Williams, C. A., Rogan, J., De Kauwe, M. G., and Medlyn, B. E. (2020). Drought impacts on australian vegetation during the millennium drought measured with multisource spaceborne remote sensing. J. Geophys. Res. Biogeosci. 125, 1–19. doi: 10.1029/2019JG005145
Kennedy, R. E., Andréfouët, S., Cohen, W. B., Gómez, C., Griffiths, P., Hais, M., et al. (2014). Bringing an ecological view of change to landsat-based remote sensing. Front. Ecol. Environ. 12, 339–346. doi: 10.1890/130066
Kennedy, R. E., Yang, Z., and Cohen, W. B. (2010). Detecting trends in forest disturbance and recovery using yearly Landsat time series: 1. LandTrendr - Temporal segmentation algorithms. Remote Sens. Environ. 114, 2897–2910. doi: 10.1016/j.rse.2010.07.008
Kennedy, R. E., Yang, Z., Cohen, W., Pfaff, E., Braaten, J., and Nelson, P. (2012). Spatial and temporal patterns of forest disturbance and regrowth within the area of the Northwest Forest Plan. Remote Sens. Environ. 122, 117–133. doi: 10.1016/j.rse.2011.09.024
Kennedy, R. E., Yang, Z., Gorelick, N., Braaten, J., Cavalcante, L., Cohen, W. B., et al. (2018). Implementation of the landtrendr algorithm on google earth engine. Remote Sens. 10:691. doi: 10.3390/RS10050691
Key, C. H., and Benson, N. C. (2006). “Landscape assessment: Sampling and analysis methods,” in FIREMON: Fire effects monitoring and inventory system, General Technical Report,, RMRS-GTR-164-CD, ed. D. C. Lutes (Washington, D.C: USDA Forest Service), LA1–LA51.
Matusick, G., Ruthrof, K. X., Brouwers, N. C., Dell, B., and Hardy, G. S. J. (2013). Sudden forest canopy collapse corresponding with extreme drought and heat in a mediterranean-type eucalypt forest in southwestern Australia. Eur. J. For. Res. 132, 497–510. doi: 10.1007/s10342-013-0690-5
Miralles, D. G., Gentine, P., Seneviratne, S. I., and Teuling, A. J. (2019). Land – atmospheric feedbacks during droughts and heatwaves: State of the science and current challenges. Ann. N. Y. Acad. Sci. 1436, 19–35. doi: 10.1111/nyas.13912
Mitchell, P. J., Grady, A. P. O., Tissue, D. T., White, D. A., Ottenschlaeger, M. L., and Pinkard, E. A. (2013). Drought response strategies define the relative contributions of hydraulic dysfunction and carbohydrate depletion during tree mortality. New Phytol. 197, 862–872. doi: 10.1111/nph.12064
Mitchell, P. J., O’Grady, A. P., Hayes, K. R., and Pinkard, E. A. (2014). Exposure of trees to drought-induced die-off is defined by a common climatic threshold across different vegetation types. Ecol. Evol. 4, 1088–1101. doi: 10.1002/ece3.1008
Montreal Process Implementation Group for Australia and National Forest Inventory Steering Committee (2018). Australia’s state of the forests report 2018. Canberra: Montreal Process Implementation Group for Australia and National Forest Inventory Steering Committee.
Moore, C. E., Brown, T., Keenan, T. F., Duursma, R. A., van Dijk, A. I. J. M., Beringer, J., et al. (2016). Reviews and syntheses : Australian vegetation phenology : New insights from satellite remote sensing and digital repeat photography. Biogeosciences 13, 5085–5102. doi: 10.5194/bg-13-5085-2016
Moreno-Fernández, D., Viana-Soto, A., Camarero, J. J., Zavala, M. A., Tijerín, J., and García, M. (2021). Using spectral indices as early warning signals of forest dieback: The case of drought-prone Pinus pinaster forests. Sci. Total Environ. 793:148578. doi: 10.1016/j.scitotenv.2021.148578
Negrón, J. F., McMillin, J. D., Anhold, J. A., and Coulson, D. (2009). Bark beetle-caused mortality in a drought-affected ponderosa pine landscape in Arizona, USA. For. Ecol. Manage. 257, 1353–1362. doi: 10.1016/j.foreco.2008.12.002
Netherer, S., Panassiti, B., Pennerstorfer, J., and Matthews, B. (2019). Acute drought is an important driver of bark beetle infestation in Austrian Norway spruce stands. Front. For. Glob. Chang. 2:39. doi: 10.3389/ffgc.2019.00039
Nguyen, H., Wheeler, M. C., Hendon, H. H., Lim, E., and Otkin, J. A. (2021). The 2019 flash droughts in subtropical eastern Australia and their association with large-scale climate drivers. Weather Clim. Extrem. 32:100321. doi: 10.1016/j.wace.2021.100321
Nguyen, T. H., Jones, S. D., Soto-Berelov, M., Haywood, A., and Hislop, S. (2018). A spatial and temporal analysis of forest dynamics using Landsat time-series. Remote Sens. Environ. 217, 461–475. doi: 10.1016/j.rse.2018.08.028
Nolan, R. H., Boer, M. M., Collins, L., de Dios Resco, V., Clarke, H., Jenkins, M., et al. (2020). Causes and consequences of eastern Australia’s 2019–20 season of mega-fires. Glob. Chang. Biol. 26, 1039–1041. doi: 10.1111/gcb.14987
Nolan, R. H., Bowman, D. M. J. S., Clarke, H., Haynes, K., Ooi, M. K. J., Price, O. F., et al. (2021a). What do the Australian Black Summer fires signify for the global fire crisis? Fire 4:97. doi: 10.3390/fire4040097
Nolan, R. H., Gauthey, A., Losso, A., Medlyn, B. E., Smith, R., Chhajed, S. S., et al. (2021b). Hydraulic failure and tree size linked with canopy die-back in eucalypt forest during extreme drought. New Phytol. 230, 1354–1365. doi: 10.1111/nph.17298
Pui, A., Sharma, A., Santoso, A., and Westra, S. (2012). Impact of the El nino – southern oscillation, indian ocean dipole, and southern annular mode on daily to subdaily rainfall characteristics in East Australia. Am. Meteorol. Soc. 140, 1665–1682. doi: 10.1175/MWR-D-11-00238.1
Schroeder, T. A., Wulder, M. A., Healey, S. P., and Moisen, G. G. (2011). Mapping wildfire and clearcut harvest disturbances in boreal forests with Landsat time series data. Remote Sens. Environ. 115, 1421–1433. doi: 10.1016/j.rse.2011.01.022
Senf, C., Pflugmacher, D., Zhiqiang, Y., Sebald, J., Knorn, J., Neumann, M., et al. (2018). Canopy mortality has doubled in Europe’s temperate forests over the last three decades. Nat. Commun. 9:4978. doi: 10.1038/s41467-018-07539-6
Verbesselt, J., Herold, M., Zeileis, A., and Herold, M. (2012). Near real-time disturbance detection using satellite image time series. Remote Sens. Environ. 123, 98–108. doi: 10.1016/j.rse.2012.02.022
Verbesselt, J., Hyndman, R., Newnham, G., and Culvenor, D. (2010). Detecting trend and seasonal changes in satellite image time series. Remote Sens. Environ. 114, 106–115. doi: 10.1016/j.rse.2009.08.014
Vogelmann, J. E., Xian, G., Homer, C., and Tolk, B. (2012). Monitoring gradual ecosystem change using Landsat time series analyses : Case studies in selected forest and rangeland ecosystems. Remote Sens. Environ. 122, 92–105. doi: 10.1016/j.rse.2011.06.027
White, J. C., Hermosilla, T., Wulder, M. A., and Coops, N. C. (2022). Mapping, validating, and interpreting spatio-temporal trends in post-disturbance forest recovery. Remote Sens. Environ. 271:112904. doi: 10.1016/j.rse.2022.112904
White, J. C., Saarinen, N., Kankare, V., Wulder, M. A., Hermosilla, T., Coops, N. C., et al. (2018). Confirmation of post-harvest spectral recovery from Landsat time series using measures of forest cover and height derived from airborne laser scanning data. Remote Sens. Environ. 216, 262–275. doi: 10.1016/j.rse.2018.07.004
White, J. C., Saarinen, N., Wulder, M. A., Kankare, V., Hermosilla, T., Coops, N. C., et al. (2019). Assessing spectral measures of post-harvest forest recovery with field plot data. Int. J. Appl. Earth Obs. Geoinf. 80, 102–114. doi: 10.1016/j.jag.2019.04.010
White, J. C., Wulder, M. A., Hermosilla, T., Coops, N. C., and Hobart, G. W. (2017). A nationwide annual characterization of 25 years of forest disturbance and recovery for Canada using Landsat time series. Remote Sens. Environ. 194, 303–321. doi: 10.1016/j.rse.2017.03.035
White, J. C., Wulder, M. A., Hobart, G. W., Luther, J. E., Hermosilla, T., Griffiths, P., et al. (2014). Pixel-based image compositing for large-area dense time series applications and science. Can. J. Remote Sens. 40, 192–212. doi: 10.1080/07038992.2014.945827
White, L. A., and Gibson, R. K. (2022). Comparing fire extent and severity mapping between sentinel 2 and landsat 8 satellite sensors. Remote Sens. 14:1661. doi: 10.3390/rs14071661
Wulder, M. A., Loveland, T. R., Roy, D. P., Crawford, C. J., Masek, J. G., Woodcock, C. E., et al. (2019). Current status of Landsat program, science, and applications. Remote Sens. Environ. 225, 127–147. doi: 10.1016/j.rse.2019.02.015
Zhu, Z. (2017). Change detection using landsat time series: A review of frequencies, preprocessing, algorithms, and applications. ISPRS J. Photogramm. Remote Sens. 130, 370–384. doi: 10.1016/j.isprsjprs.2017.06.013
Keywords: drought, fire, forest disturbance and recovery, eucalypt forests, Sentinel-2, time series
Citation: Hislop S, Stone C, Gibson RK, Roff A, Choat B, Nolan RH, Nguyen TH and Carnegie AJ (2023) Using dense Sentinel-2 time series to explore combined fire and drought impacts in eucalypt forests. Front. For. Glob. Change 6:1018936. doi: 10.3389/ffgc.2023.1018936
Received: 14 August 2022; Accepted: 18 January 2023;
Published: 02 February 2023.
Edited by:
Barry Alan Gardiner, Institut Européen De La Forêt Cultivée (IEFC), FranceReviewed by:
Arturo Sanchez-Azofeifa, University of Alberta, CanadaPat Mitchell, Commonwealth Scientific and Industrial Research Organisation (CSIRO), Australia
Copyright © 2023 Hislop, Stone, Gibson, Roff, Choat, Nolan, Nguyen and Carnegie. This is an open-access article distributed under the terms of the Creative Commons Attribution License (CC BY). The use, distribution or reproduction in other forums is permitted, provided the original author(s) and the copyright owner(s) are credited and that the original publication in this journal is cited, in accordance with accepted academic practice. No use, distribution or reproduction is permitted which does not comply with these terms.
*Correspondence: Samuel Hislop,  c2FtdWVsLmhpc2xvcEBybWl0LmVkdS5hdQ==