- 1Department of Forest Resources, University of Minnesota, St. Paul, MN, United States
- 2U.S. Forest Service, Northern Research Station, York, PA, United States
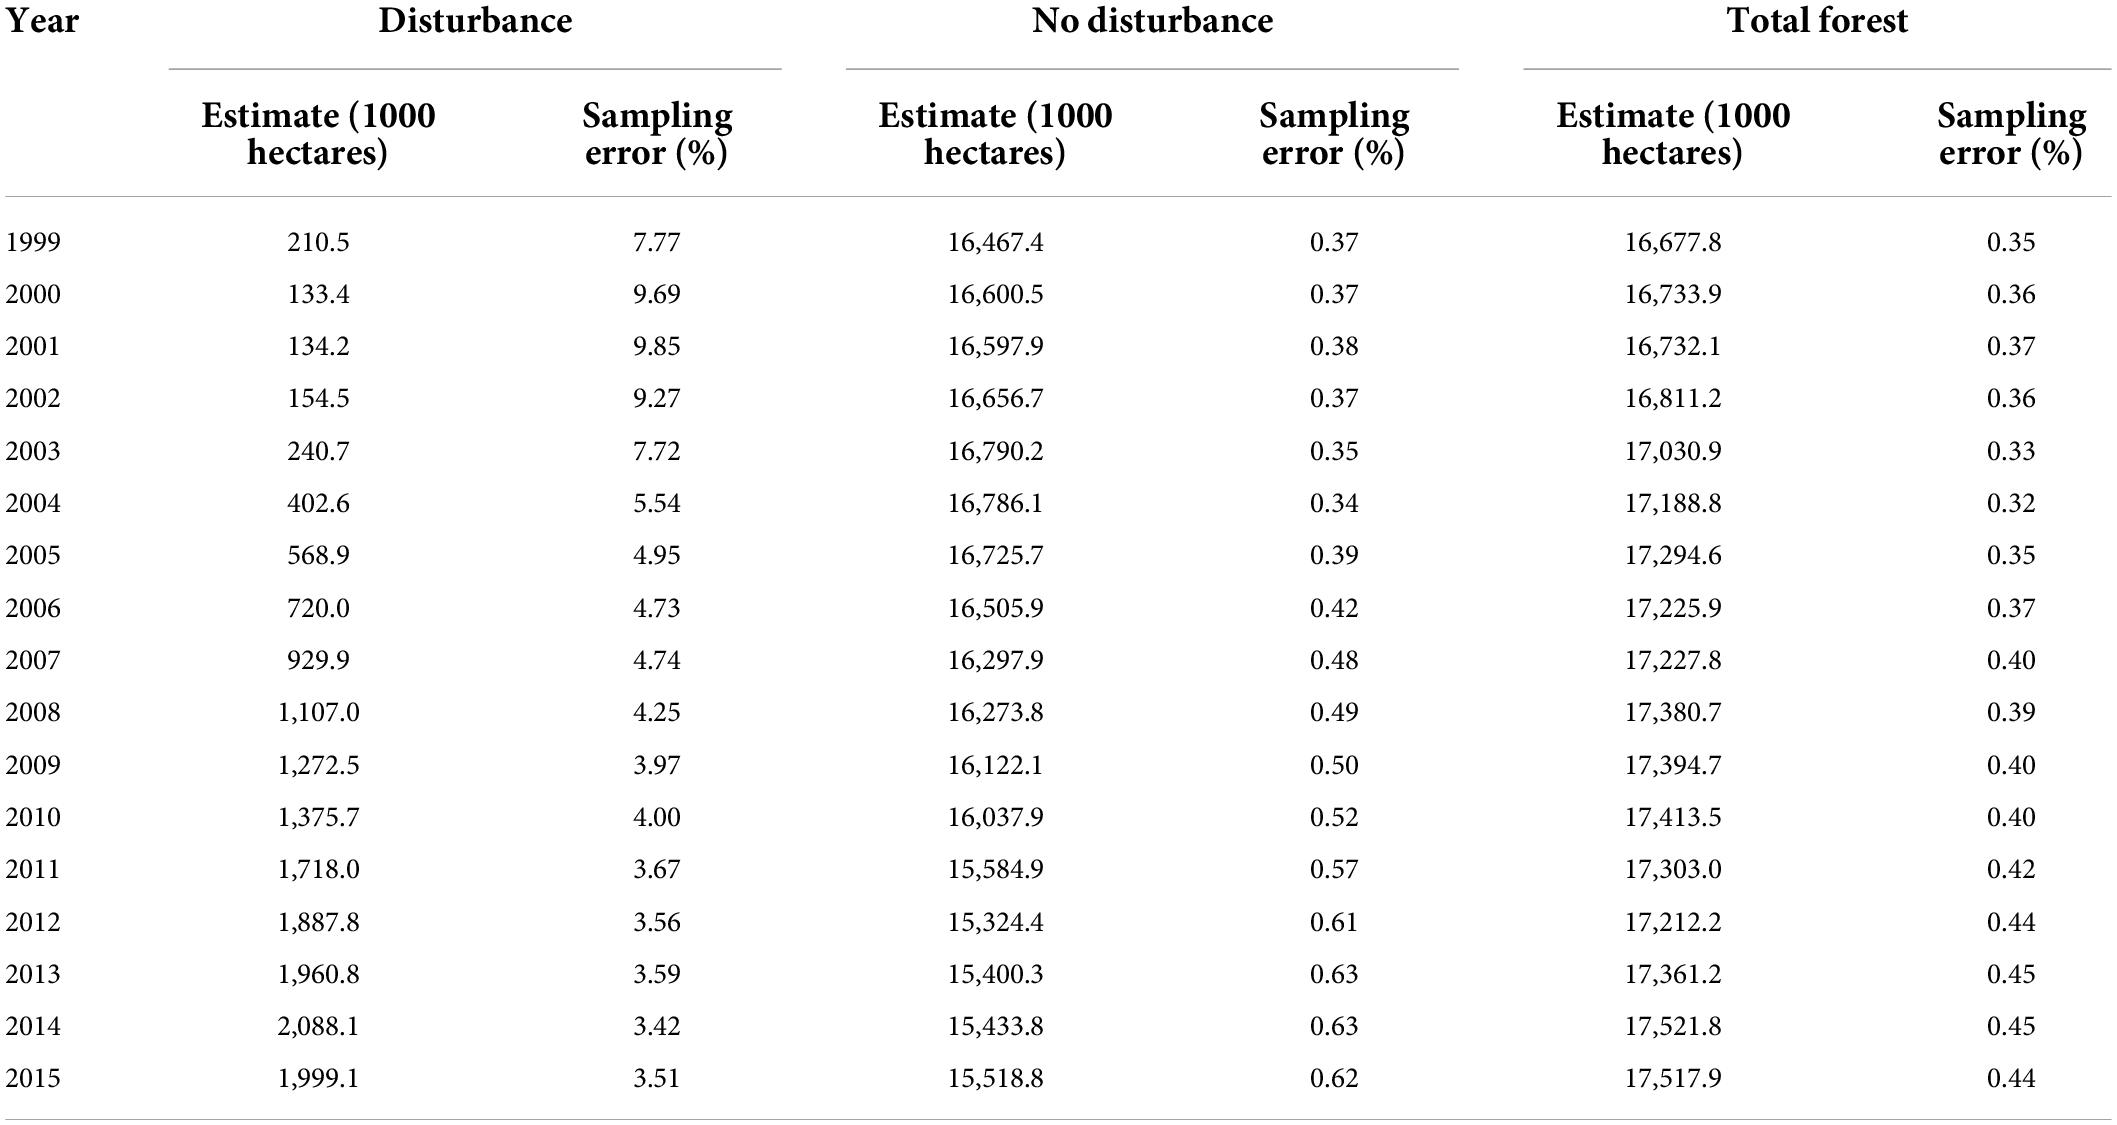
An analysis of United States national forest inventory observations in the Laurentian Mixed Forest reveals a marked increase in forest disturbance between 1999 and 2015. The Laurentian Mixed Forest Province ecological subregion spans the northern sections of Michigan, Minnesota, and Wisconsin and includes forest area of between 16.7 and 17.5 million hectares depending on the year. Forest disturbance ranges from a low of 0.13 million hectares (0.8% of forest area) in 2000 to a high of 2.09 million hectares (11.9% of forest area) in 2014. The year 2015 is notable for being the first year since 2000 where forest disturbance declines, albeit modestly (11.4% of forest area). The marked increase is attributable to disturbances occurring continuously over time between remeasurement. Disturbances with the highest annual averages are insect damage to trees, disease damage to trees, and deer/ungulate at 291 thousand, 189 thousand, and 126 thousand hectares per year, respectively. Disturbances occurring in a specific year, what we term discrete disturbances, show no discernible trend during the period. The most extensive discrete disturbances are wind in 1999, 2011, and 2012 at 108 thousand, 62 thousand, and 61 thousand hectares, respectively. Standard estimates from national forest inventory lack specificity as to the actual year of the disturbance. The estimates reported here are actual annual estimates of disturbance that apply estimation methods accounting for the retrospective nature of the disturbance observation. The timing (year) and location (ecological section) of the two most extensive wind events coincide with historical records.
Introduction
Forests are dynamic systems where trees become established, grow, and die. Disturbance is a universal component of forests systems that alters stand composition and structure. Disturbance can be either positive or negative depending on the changes in stand composition and structure relative to desired conditions and planned outcomes. Impacts of disturbance can range from subtle shifts in composition and structure to stand replacing events. When occurring at sufficient scale and severity, disturbance can alter the forest of a region with important ecological, economic, and social implications.
Broad-scale monitoring of forest disturbance in the United States is primarily accomplished via the national forest inventory (NFI) and remote sensing data sources (Masek et al., 2013; Coulston et al., 2020). The spatial and temporal resolution of remote sensing data can support detailed analyses into the timing and extent of disturbance. For example, Masek et al. (2013) used a geographic sample of Landsat time series to produce annual forest disturbance rates for the conterminous US for the period 1985–2005. Attributing disturbance to specific agents is a developing area in remote sensing studies. For example, Vogeler et al. (2020) utilized spectral, topographic and land protection data to assign agent of change to disturbance.
An alternative source of broad-scale monitoring information is the US NFI. A key feature of the US NFI is the direct observation of tree and forest conditions at sampled plots in the field. Tree mortality and damage are tracked through repeated observations of plots (e.g., every 5 or 7 years in the east and 10 years in the west). Evidence of recent disturbance (i.e., since last measurement) meeting thresholds on size and impact are also recorded. The current design of the US NFI has been in place for more than 20 years and an extensive time series of observations is now available. However, the inventory design and the nature of the observation of disturbance create challenges related to the estimation of the timing and extent of disturbance (Wilson et al., 2019; Coulston et al., 2020). The standard estimation approach of the NFI is known to dampen trends in estimates and obscure annual fluctuations when broad-scale disturbance has occurred (Patterson and Reams, 2005; Edgar et al., 2019). Alternative estimators that leverage the robust design of the NFI are available (e.g., Van Deusen, 2002; Hou et al., 2021), but are not known to have been widely adopted presumably for reasons owing to complexity, data format, or a desire to adhere to standard estimation approaches for consistency.
The primary objective of this study is to estimate the timing and extent of disturbance in the Laurentian Mixed Forest (LMF), a region of 25.8 million hectares spanning the northern sections of the Great Lakes states of Michigan, Minnesota, and Wisconsin. The LMF, like the rest of the northern United States, is confronting unprecedented forest health challenges (Shifley and Moser, 2016). Forest and natural resource managers in the region recognize the threat to forest health and are increasingly focusing on silvicultural practices that promote resistance and resilience (Windmuller-Campione et al., 2020). An improved understanding of forest disturbance will benefit forest and natural resources professionals as they seek to manage the forest in a manner that promotes forest health and ensures sustainability of the resource.
Materials and methods
Study area
The study area is the Laurentian Mixed Forest (LMF), an ecological province spanning the northern sections of the Great Lakes states of Michigan, Minnesota and Wisconsin (Figure 1). Forests currently account for 17.4 million hectares, which is approximately two-thirds of the province’s total of 25.8 million hectares (USDA Forest Service, 2022). Forests in the LMF are a transition between boreal forest to the north and broadleaf deciduous forests to the south. Past glaciation resulted in a low-relief, hilly landscape. Moderately long winters and warm summers typify the area with maritime influence observed in areas adjacent to the Great Lakes (McNab et al., 2007). Prevalent forest type groups include aspen-birch (Populus-Betula; 26% of forest area), maple-beech-birch (Acer-Fagus-Betula; 23%), spruce-fir (Picea-Abies; 19%), oak-hickory (Quercus-Carya; 10%), and white-red-jack pine (Pinus strobus-Pinus resinosa-Pinus banksiana; 10%). Forest area is nearly evenly split between public (48%) and private (52%) ownerships. Public forest area includes state (20%), federal (17%), and county (11%) ownerships (USDA Forest Service, 2022).
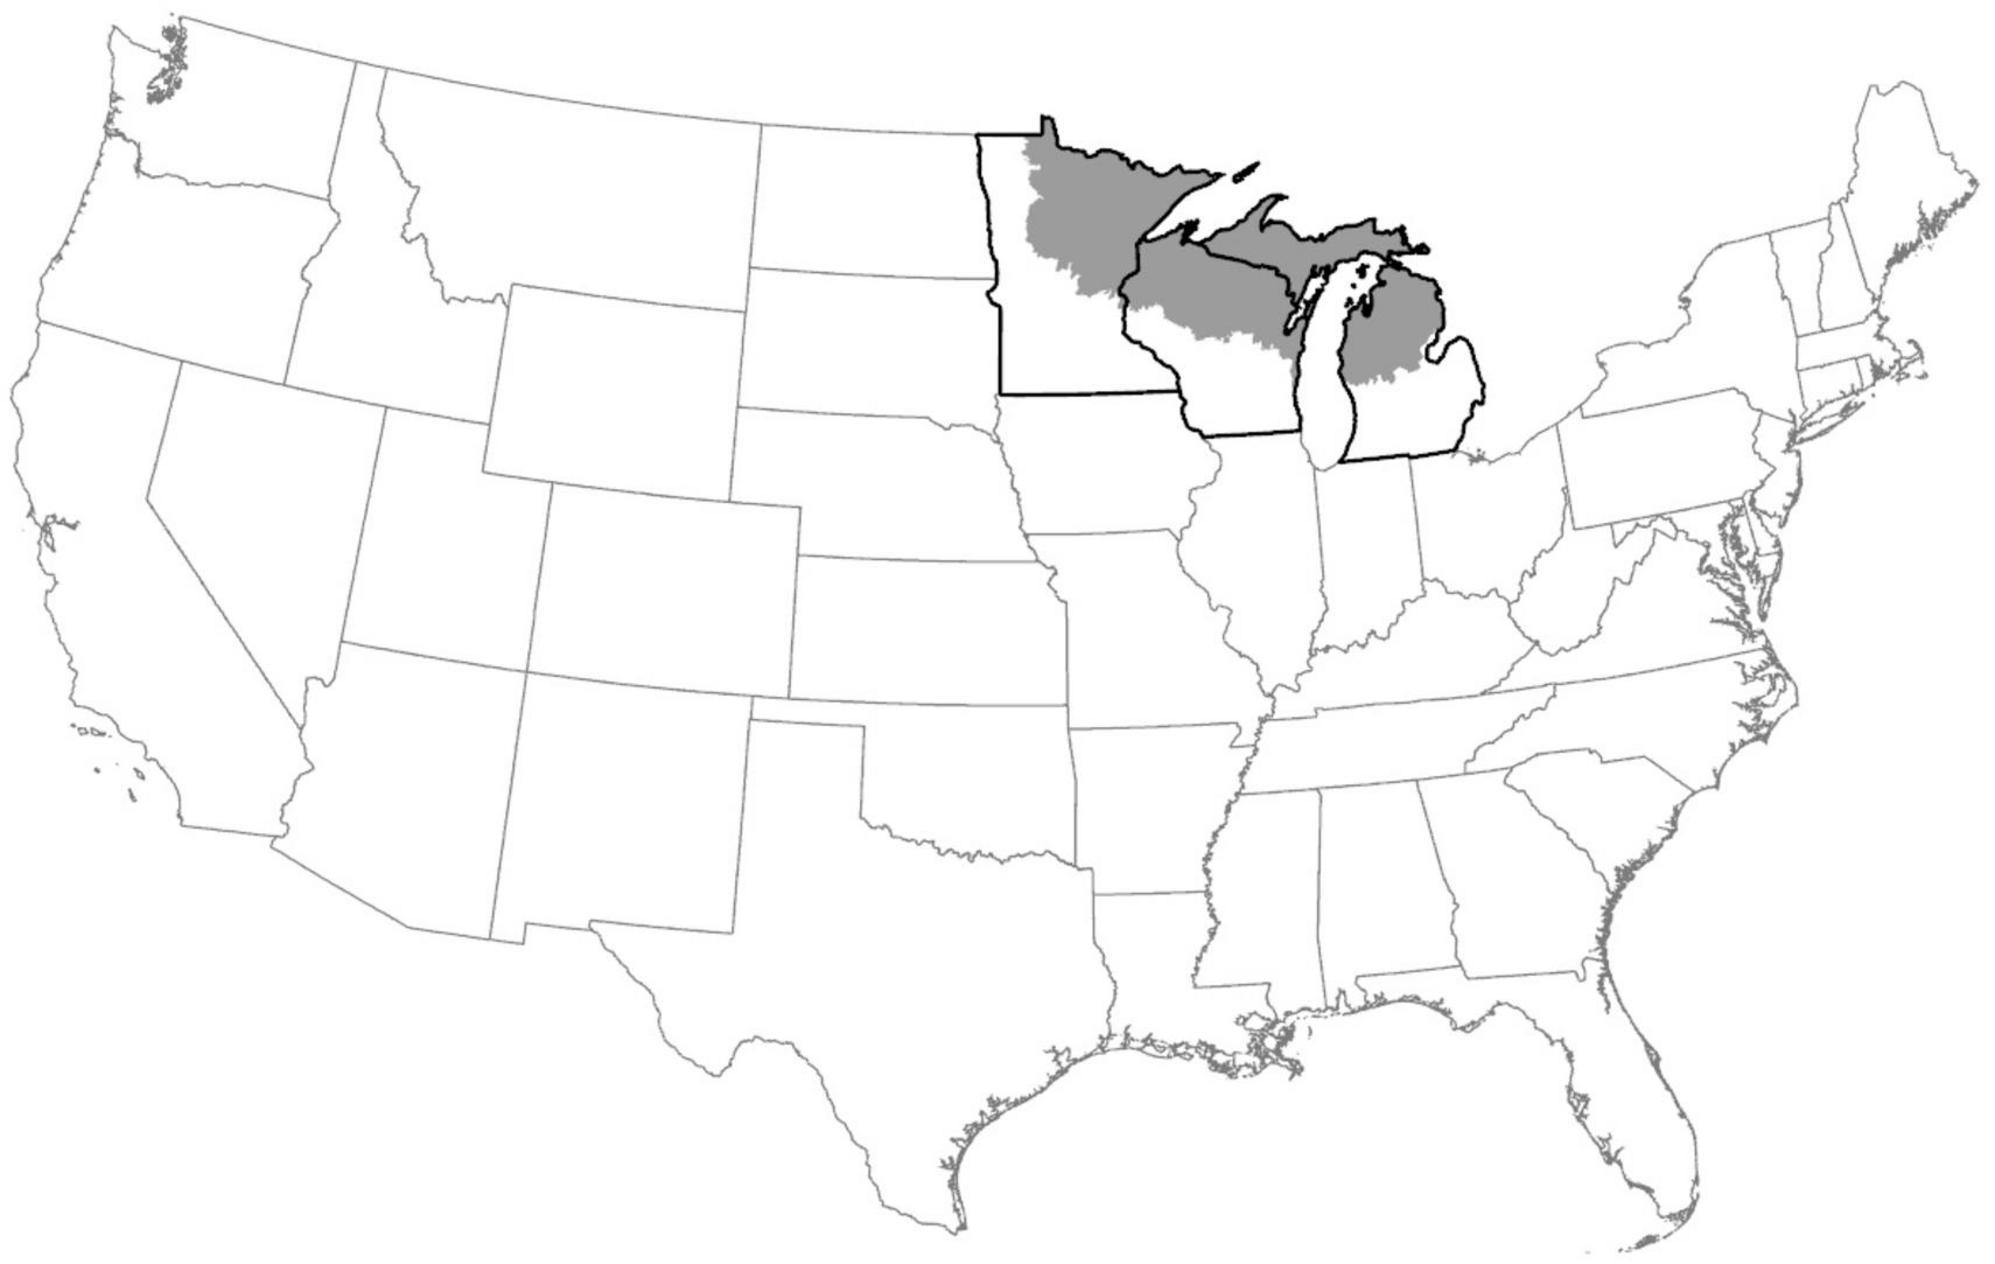
Figure 1. Laurentian Mixed Forest Province (shaded) of the Great Lakes states of Michigan, Minnesota, and Wisconsin (Source: Cleland et al., 2007).
Sampling and response design
The source of data for this study is the United States Forest Service Forest Inventory and Analysis (FIA) program. FIA uses a hexagonal sampling frame as described in Reams et al. (2005). Sampling intensity varies depending on the state and time period with an approximate range of one plot per 1,200 hectares to one plot per 2,400 hectares. FIA employs a rotating panel design where plots are divided into b panels. In Minnesota b = 5 and in Michigan and Wisconsin b = 5 or b = 7 depending on the year. Panels are measured in sequence, one panel a year, with the process repeated such that plots are remeasured every b years (Reams et al., 2005).
In FIA, a plot is a cluster of four subplots with each subplot a circle 0.0168 hectares in size. One subplot occupies the center of the plot and the other three subplots are placed 36.58 m from plot center at azimuths 0, 120, and 240 degrees. Together the four subplots sample an area of 0.0672 hectares (Bechtold and Scott, 2005). Plots are mapped by condition that includes changes in land use or changes in vegetation. Detailed information is collected on each of the forest conditions.
Domains
Domains of interest in this study include forestland, ecological subregion, disturbance agent, and disturbance year. Forestland is defined by FIA as an area having, or had, at least 10 percent canopy cover of live trees, being at least 0.40 hectares in size, and at least 36.58 m wide (Burrill et al., 2018). Definitions and boundaries for ecological subregions are based on the USDA Forest Service National Hierarchical Framework of Ecological Units (Cleland et al., 2007; McNab et al., 2007). The subsection each plot resides is noted in the FIA database. In the hierarchical system, subsections are aggregated into sections and sections into provinces.
In the field, each forest condition is examined for evidence of recent (since previous measurement) disturbance at least 0.40 hectares in size and affecting, either as mortality or damage, at least 25% of the trees. Up to three different disturbances may be recorded for a condition. When a disturbance is observed, field crews are asked to estimate and record the year of disturbance (Burrill et al., 2018). We divided disturbances into discrete and continuous events depending on the disturbance year value. Disturbances with a specific year (e.g., 2011) are termed discrete disturbances in this analysis. Disturbances that occurred continuously since the previous measurement (i.e., code 9999) are termed continuous disturbance.
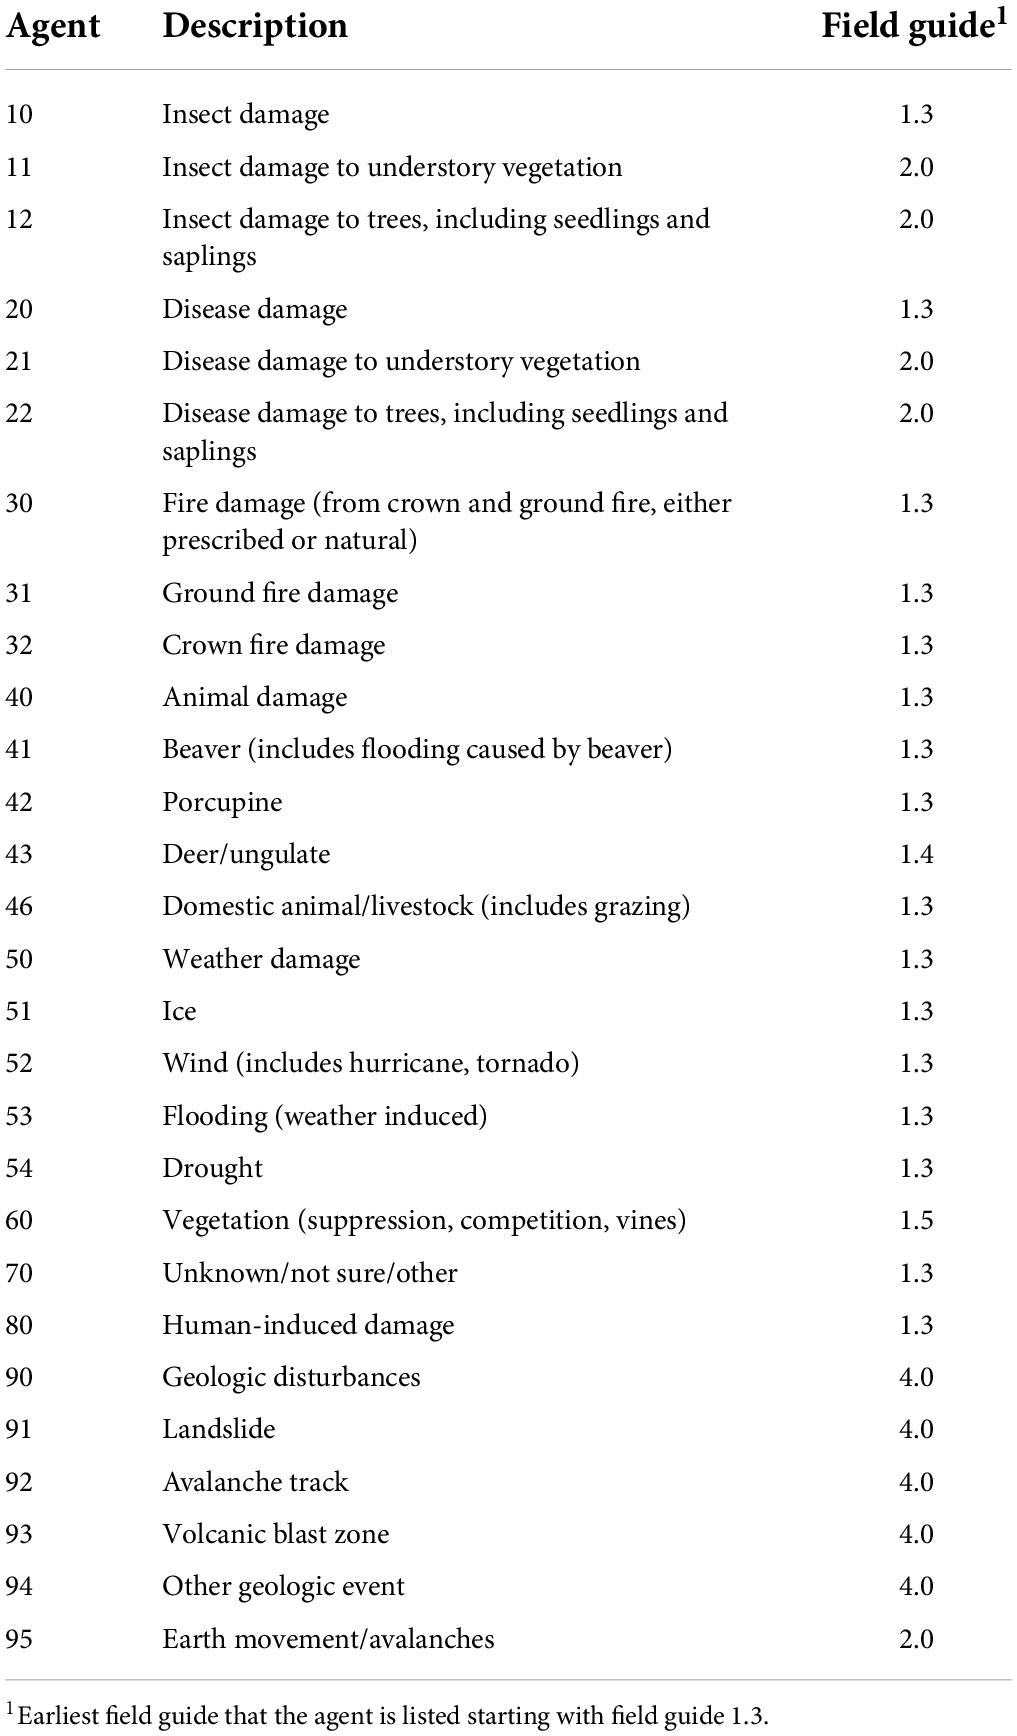
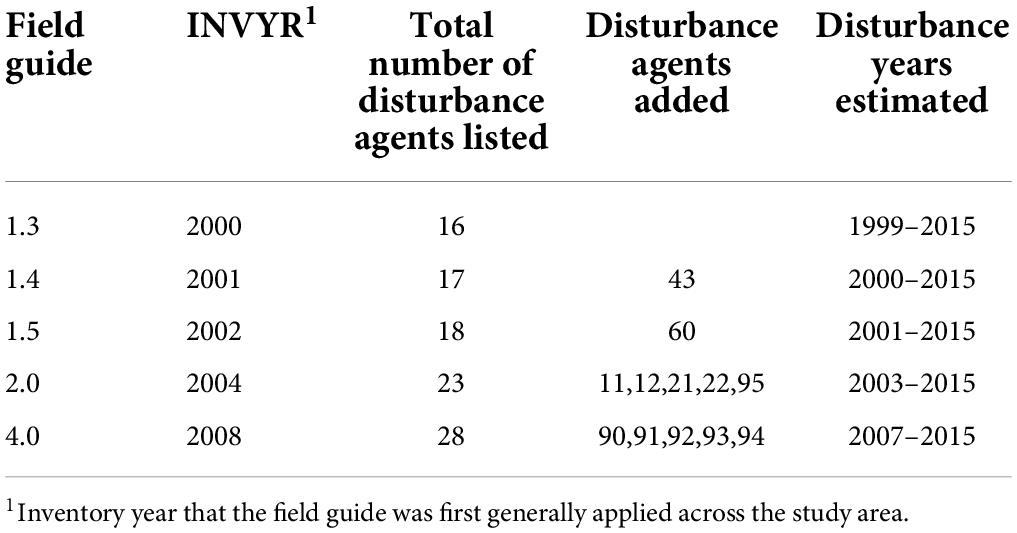
Up to 28 different disturbance agents are currently monitored on the plot network in the LMF (Table 1). Agents group into categories insect, disease, fire, animal, weather, vegetation, human, and geologic. Silvicultural activities such as thinning and harvesting are not considered human disturbance in this analysis. Bear and rabbit are listed in field guides; however, they are optional and are not monitored in the LMF. New disturbance agents were added over time in the early years of the inventory. Of the 28 agents, 16 were present originally (i.e., in field guide 1.3) and have been monitored throughout the period (Tables 1, 2).
Combining panels
Population estimates are computed from the inventory data using post-stratified estimation methods described in Scott et al. (2005). The standard estimation procedure in the FIA database is to combine all panels and apply a single stratification to the combined panels. Strata are defined from thematic maps such as National Land Cover Data, either land cover classes or, as is more common recently, tree canopy cover classes. Each panel is a random sample of the population and the post-stratified estimation methods can be applied to individual panels or combinations of panels (Patterson and Reams, 2005; Edgar et al., 2019).
The retrospective nature of the disturbance observation means there are multiple disturbance observations for each panel (Coulston et al., 2020). For example, in a 5-panel inventory, the panel measured in 2009 would have been previously measured in 2004. The observation in 2009 is a retrospective observation of disturbance since 2004, and the multiple observations include disturbance in 2005, 2006, 2007, 2008, and 2009. Table 3 illustrates the combining of all panels (in a 5-panel inventory) assuming panel 1 was measured in 2009. In that example, it is the single year 2009 that disturbance was observed by every panel. Coulston et al. (2020) demonstrated through Monte Carlo simulation that when all panels are combined, the post-stratified estimation method produces an appropriate annual estimate for the single year in common to all the panels. Annual estimates for other years are underestimated, with bias increasing the further the year being estimated is from the common year.
Estimates of annual disturbance are computed for the period 1999–2015. All the estimates are computed from combinations of 4 panels of plot observations (e.g., annual estimate 2009 computed from combinations of panels measured in inventory years 2010–2013). We opted to combine 4 panels rather than 5 panels to minimize possible bias resulting from incomplete disturbance observations. Measurement of a panel is an intensive process that requires upward of a year or more to complete. Examination of plot measurement dates suggested the potential for incomplete disturbance observations if the panel of plots with inventory year equal to disturbance year were included. For example, a plot visited and measured in June cannot note a disturbance that occurred the following September. The FIA database uses the standard estimation approach, which is to combine all the panels, and thus adjustments to database fields are required when less than the full set of panels are combined. We used the stratifications in the FIA database and made the necessary adjustments to sample sizes and for partially non-sampled plot area. In a few instances, sample sizes in a stratum were not sufficient for estimation and collapsing of strata was required.
In the FIA database, states are divided into estimation units, which are subpopulations. The estimation units do not overlap and taken together account for the entire area of the state. Estimation proceeds by estimation unit. Estimation unit totals and variances are then summed to provide state-level estimates. State-level totals and variances are then summed to provide regional estimates (e.g., LMF).
Estimators
For estimates of the areal extent of disturbance, the plot observation is the proportion of the plot in the domain of interest (Scott et al., 2005). The plot observation is computed from:
where,
Phid = proportion of plot i in the domain of interest d, for plots assigned to stratum h, adjusted for stratum h plots that are partially non-sampled;
amhijk = mapped area (hectares) of subplot j covering condition k on plot i assigned to stratum h;
δhijkd = zero-one domain indicator function, which is 1 if condition k on subplot j of plot i assigned to stratum h belongs to the domain of interest d;
Khij = the number of conditions that exist on subplot j of plot i assigned to stratum h;
am = total area (hectares) of the four subplots;
= mean proportion of stratum h plots that were accessible (excluding fully non-sampled plots).
The stratum mean estimator is:
where,
nh = number of plots in stratum h.
The variance estimator is:
The estimate of total area in the domain of interest for the estimation unit is:
where,
AT = total area (hectares) in the estimation unit;
Wh = weight for stratum h.
The variance estimator is:
where,
n = number of plots in the estimation unit.
The precision of an estimate is reported as a sampling error percentage:
To estimate a ratio (e.g., proportion of the forest that is disturbed), the numerator, and denominator, , of the ratio are computed using the aforementioned formulas. The ratio is:
The variance estimator is:
The covariance in the above formula is estimated:
where,
Estimates using the above formulas were calculated in R (R Core Team, 2021) using data downloaded from the FIA DataMart1. Data for Michigan, Minnesota, and Wisconsin were loaded by FIA to the DataMart on 8/30/21, 9/3/21, and 8/30/21, respectively.
Results
Annual estimates show a marked increase in forest disturbance between 1999 and 2015. At the beginning of the observation period, 1999, disturbance is estimated at 210 thousand hectares or 1.3% of the total forest area (Table 4). At the end of the observation period, 2015, disturbance is estimated at 1,999 thousand hectares or 11.4% of the total forest area. Annual increases occur year over year from 2000 to 2014. The year 2015 is notable for being the first year since 2000 that disturbance declined.
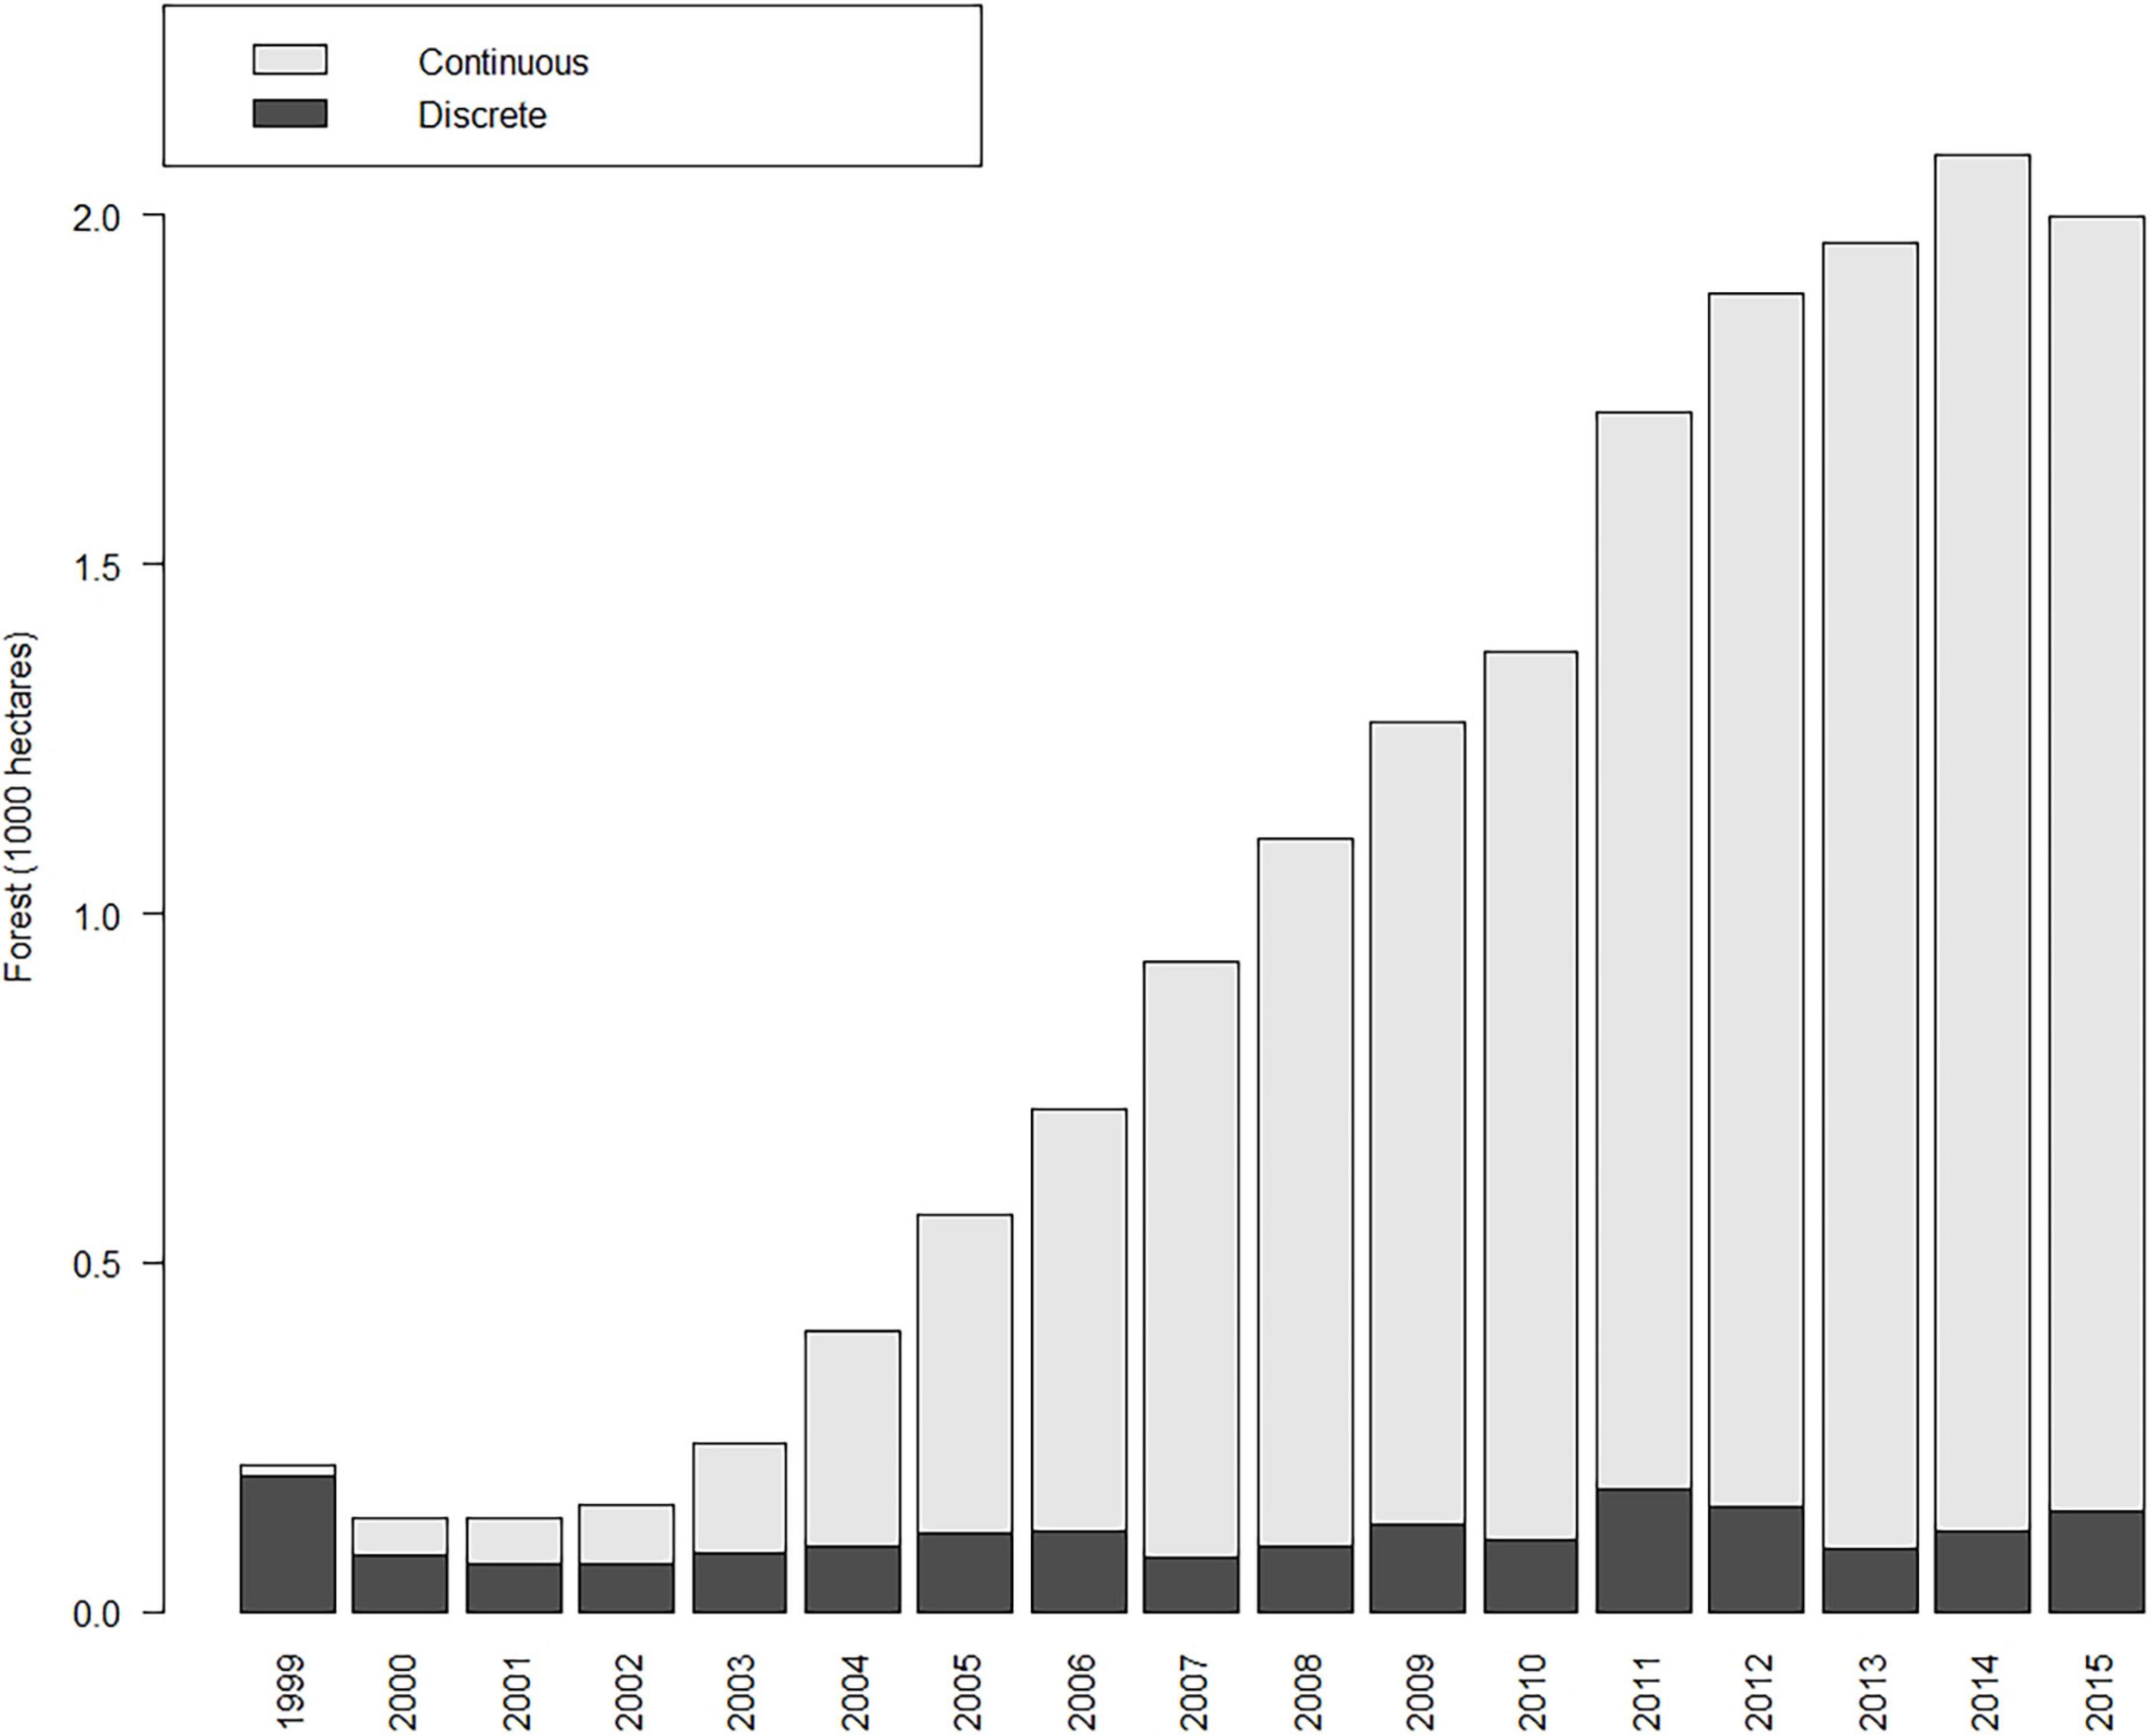
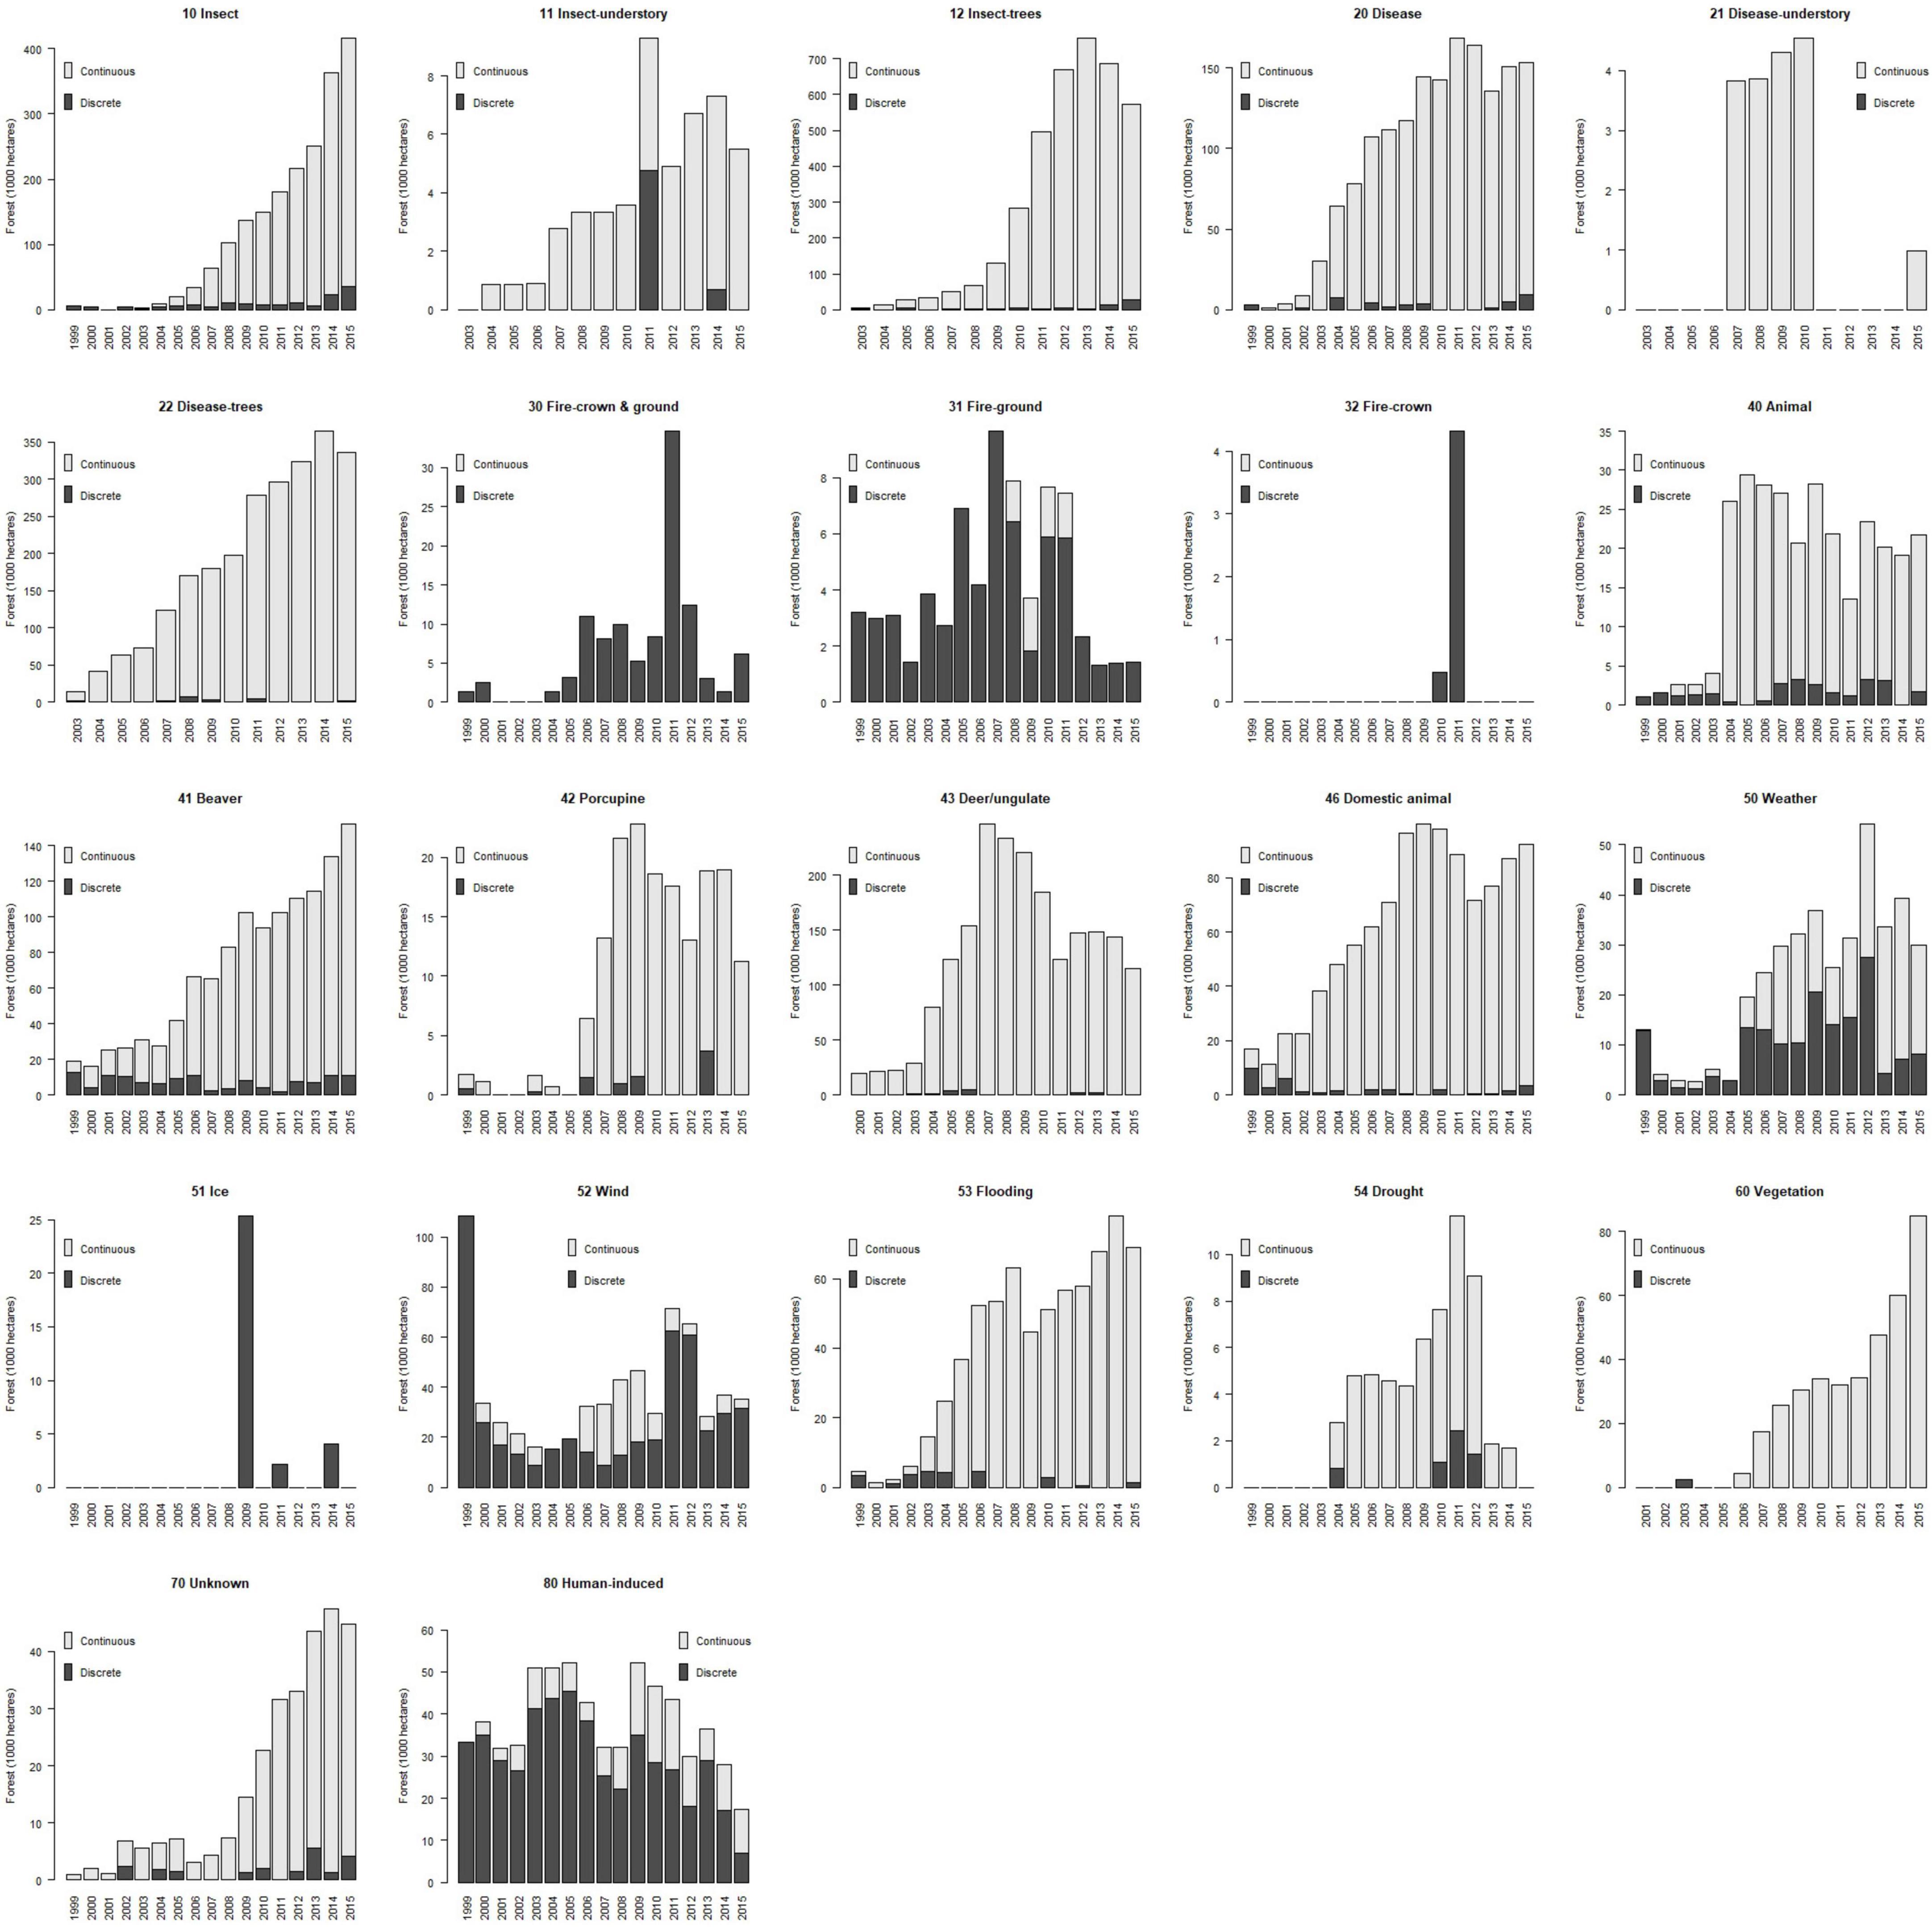
The overall increase in disturbance is attributable to disturbances occurring continuously over time (Figure 2). Discrete disturbances do not exhibit a trend, but rather appear to fluctuate randomly. In the 3 years beginning with 1999, discrete disturbances account for most of the disturbance. Continuous disturbances begin to exceed discrete disturbances in 2002, a trend that continues and expands as the period progresses.
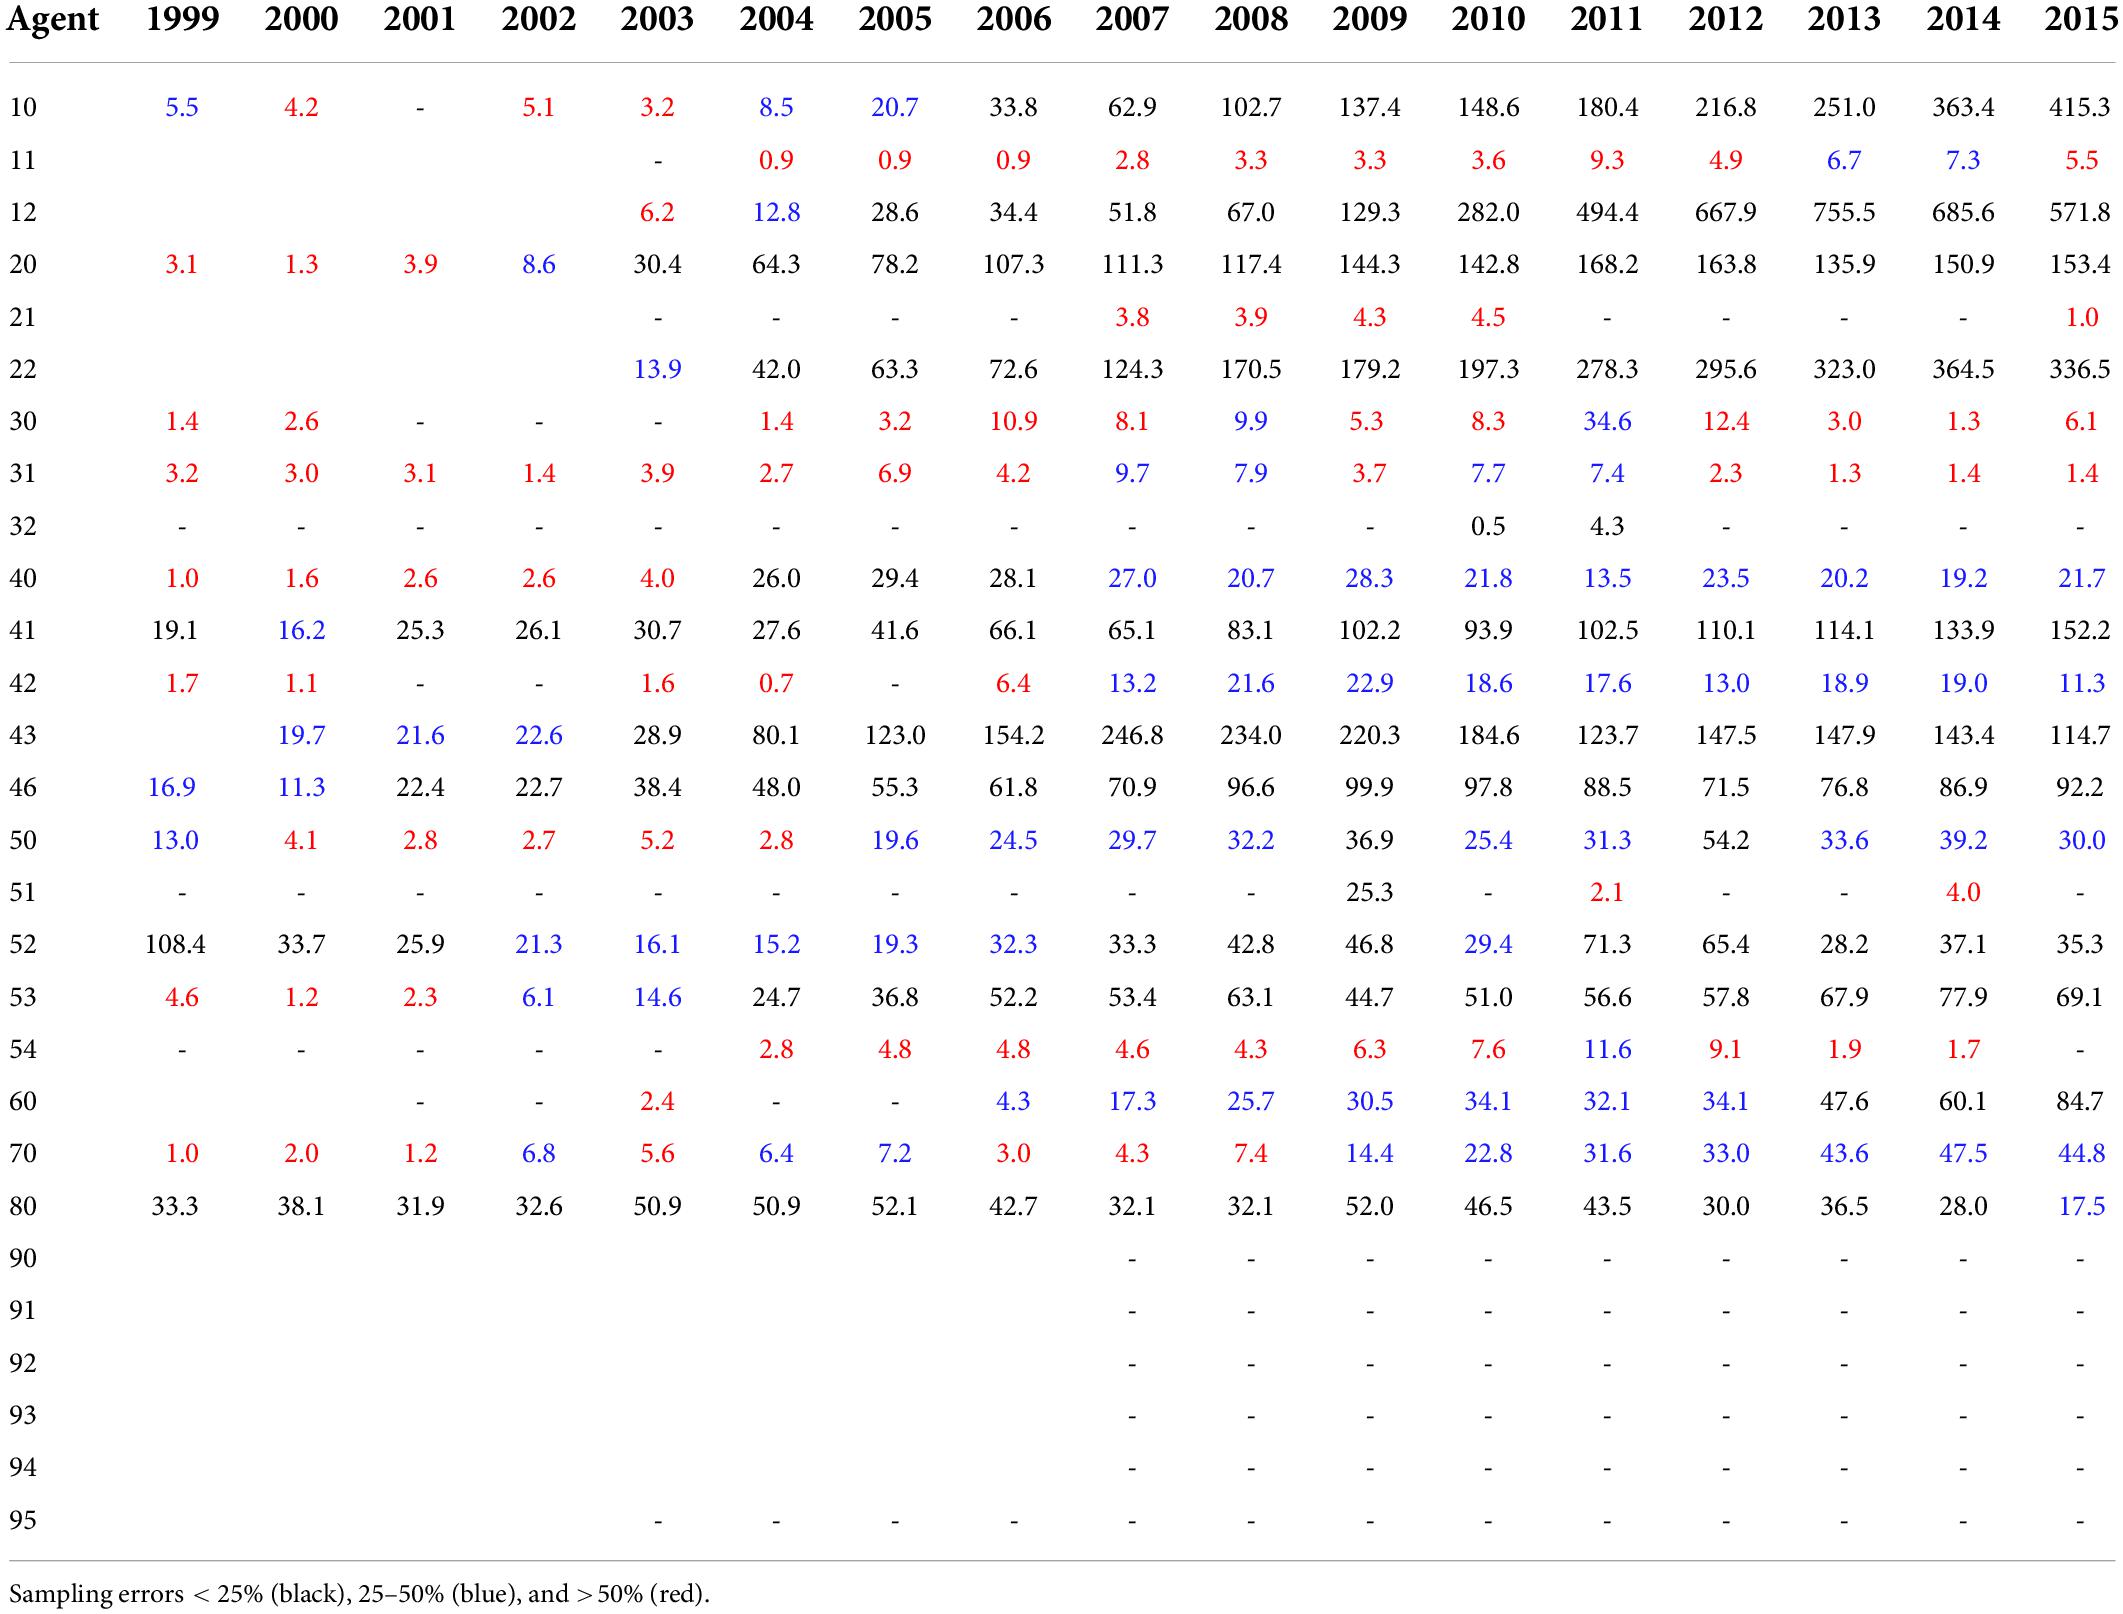
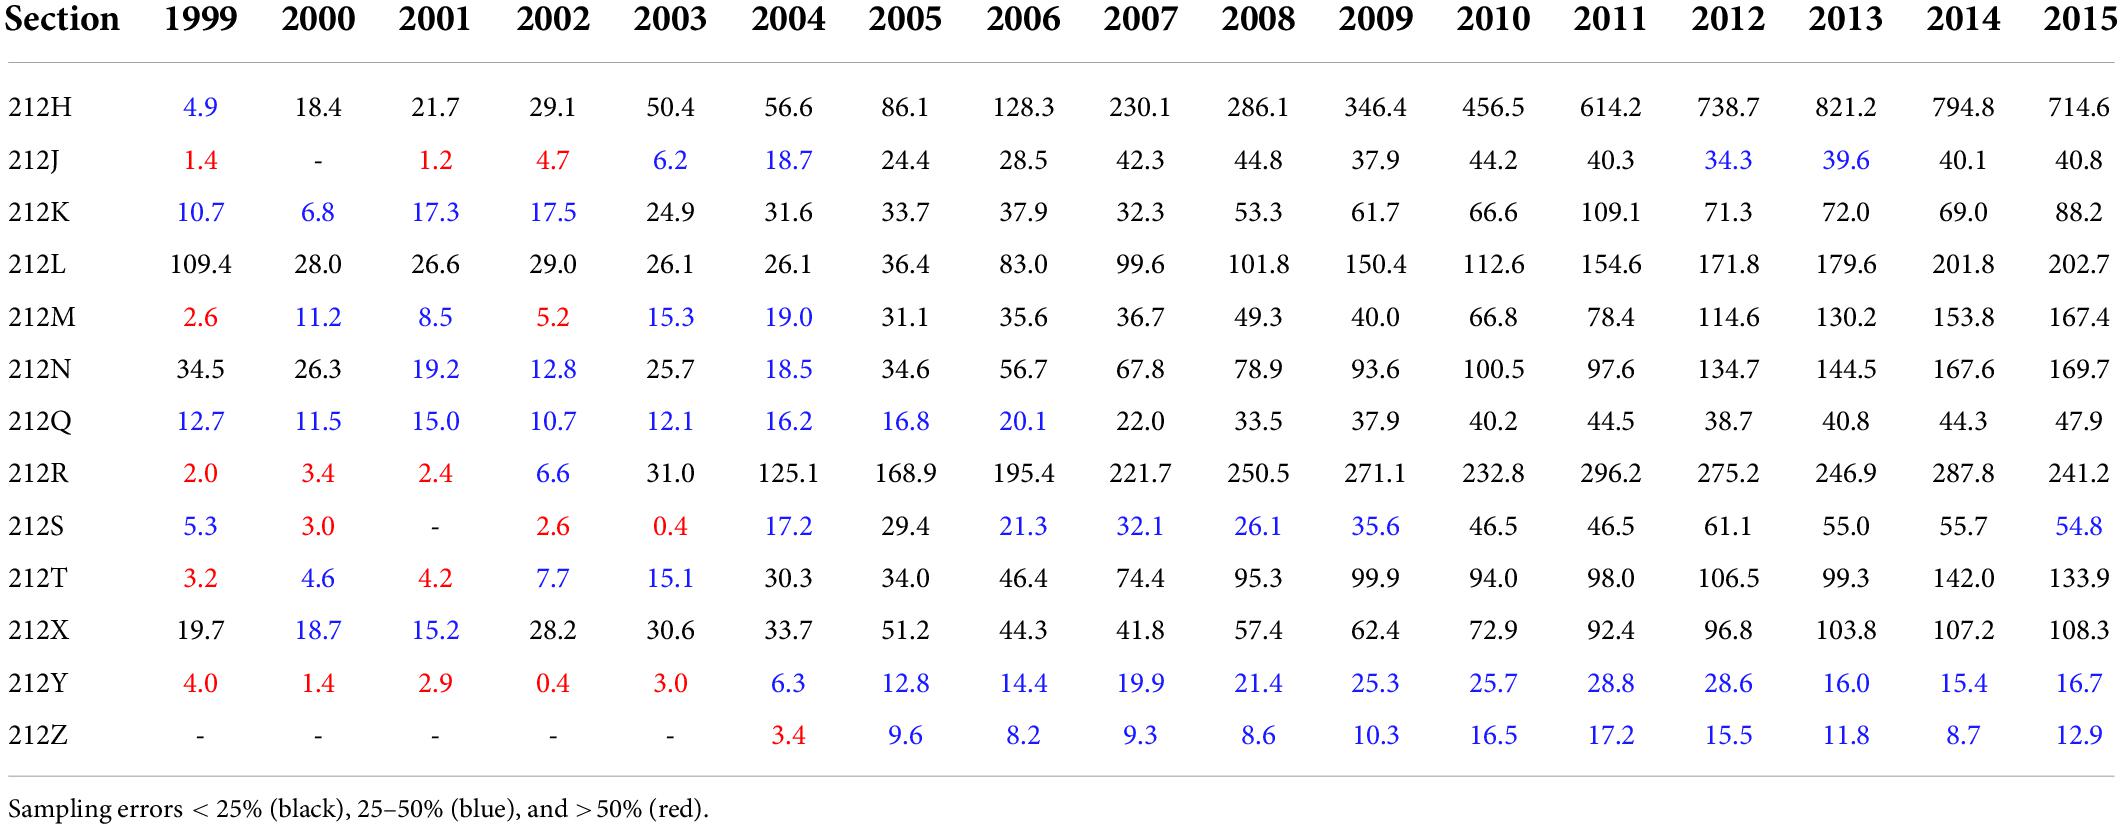
Examination of the annual estimates of disturbance by agent and year show 13 of the 28 agents have some estimate (i.e., non-zero) every year (Table 5). An additional 9 disturbance agents have some estimate, just not every year. The group of 6 geologic disturbance agents (90–95) have estimates of 0 hectares every year. Precisions on annual estimates vary with representation in each precision grouping (i.e., sampling errors < 25%, 25–50%, and >50%). As expected, larger annual estimates tend to the higher precision groupings. Estimates in the lowest precision group (>50%) are not significantly different from 0 at the 95% confidence level.
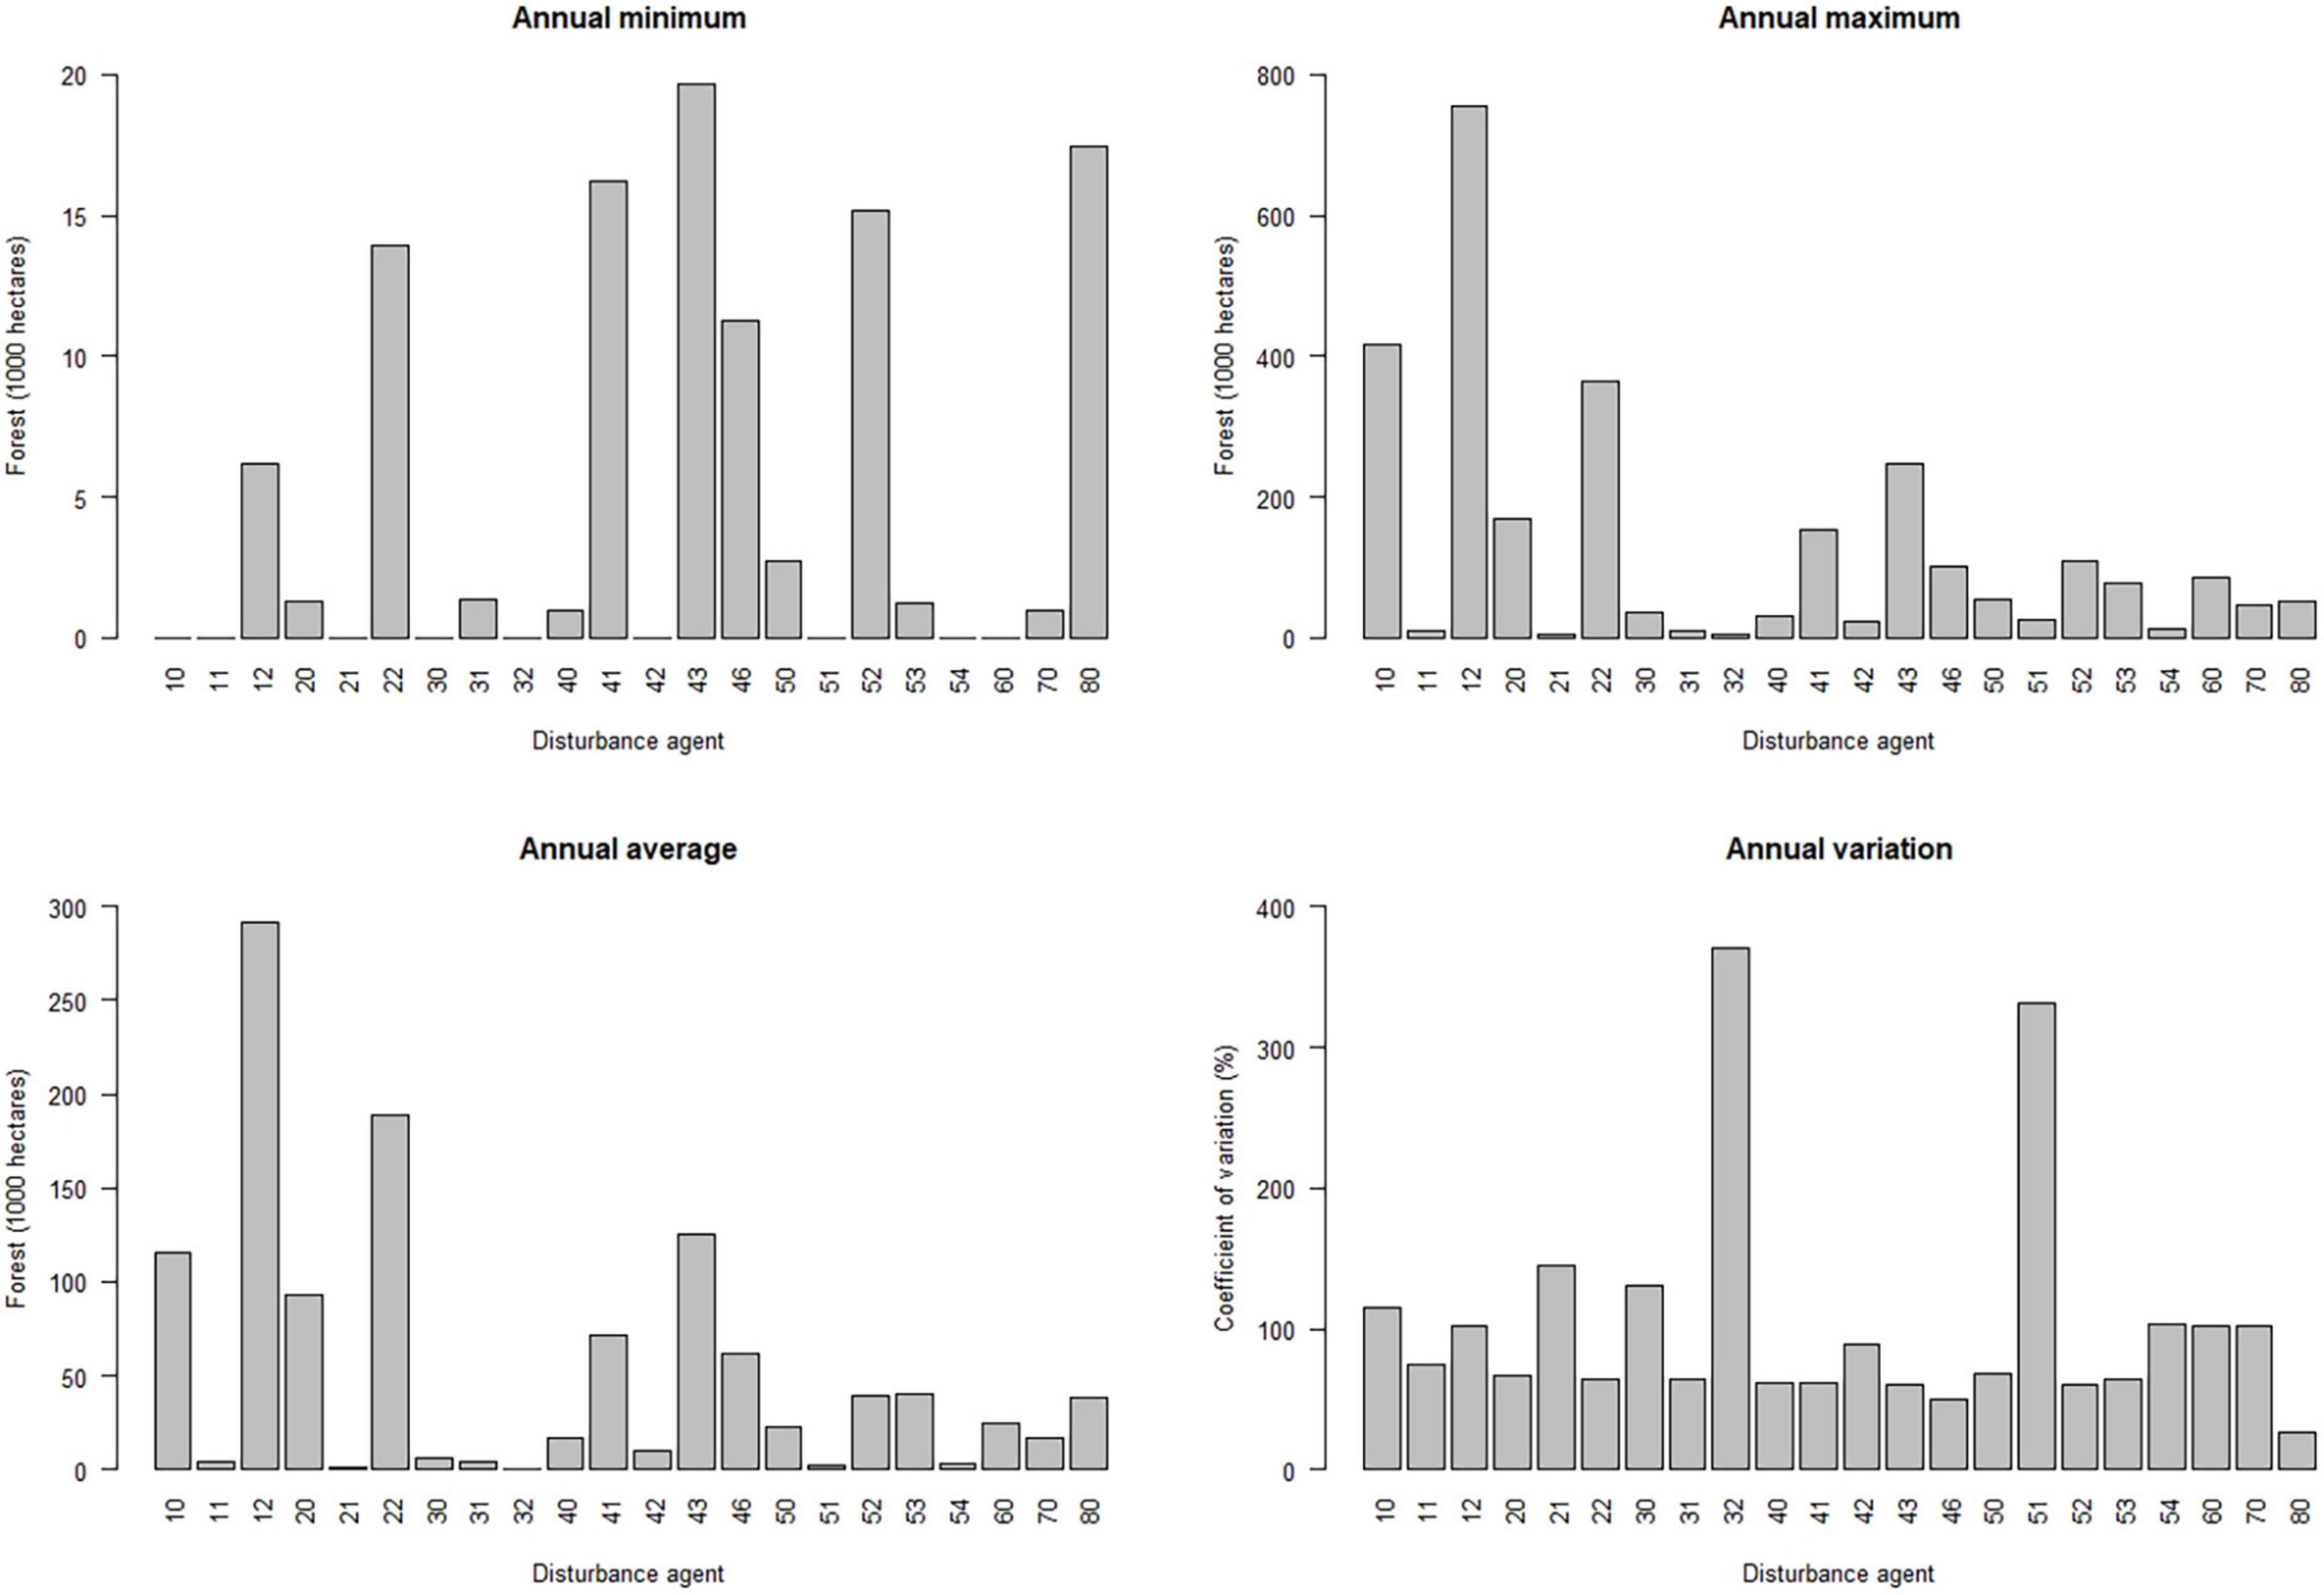
Summary statistics of the annual estimates for the 22 disturbance agents with non-zero observations are presented in Figure 3. The range on the minimum annual estimates was 0 (multiple agents) to 19.6 thousand hectares (deer-ungulate). The range on maximum annual estimates was 4.3 thousand hectares (fire-crown) to 755.5 thousand hectares (insect-trees). The range on average annual estimates was 0.3 thousand hectares (fire-crown) to 291.3 thousand hectares (insect-trees). After insect-trees, disease-trees (189.3 thousand hectares) and deer/ungulate (125.8 thousand hectares) have the highest average annual estimates. Annual estimates for crown-fire and ice are the most variable.
Trends in annual estimates for numerous individual disturbance agents reflect the overall pattern (i.e., marked increase). For example, annual estimates of insect-trees, disease-trees, and beaver disturbance increase substantially during the period (Figure 4). The increase in insect-trees estimates is gradual at first, but jumps sharply from 2010 to 2013, and then declines 2014–2015. Disease-trees estimates closely mirror the overall trend: increases are consistent and steady up to 2014 before declining modestly in 2015. Beaver estimates increase steadily throughout the period except for the interspersion of a few scattered years of modest decline. Not all agents mirror the overall trend. For example, deer/ungulate estimates peak in 2007, then decline four consecutive years to 2011, and then remain relatively flat thereafter. Notable too among many of the annual estimates is the preponderance of continuous disturbance. Exceptions are fire of all types, weather, ice, wind, and human, which are all predominantly discrete disturbances. Estimates for these agents exhibit no consistent trend.
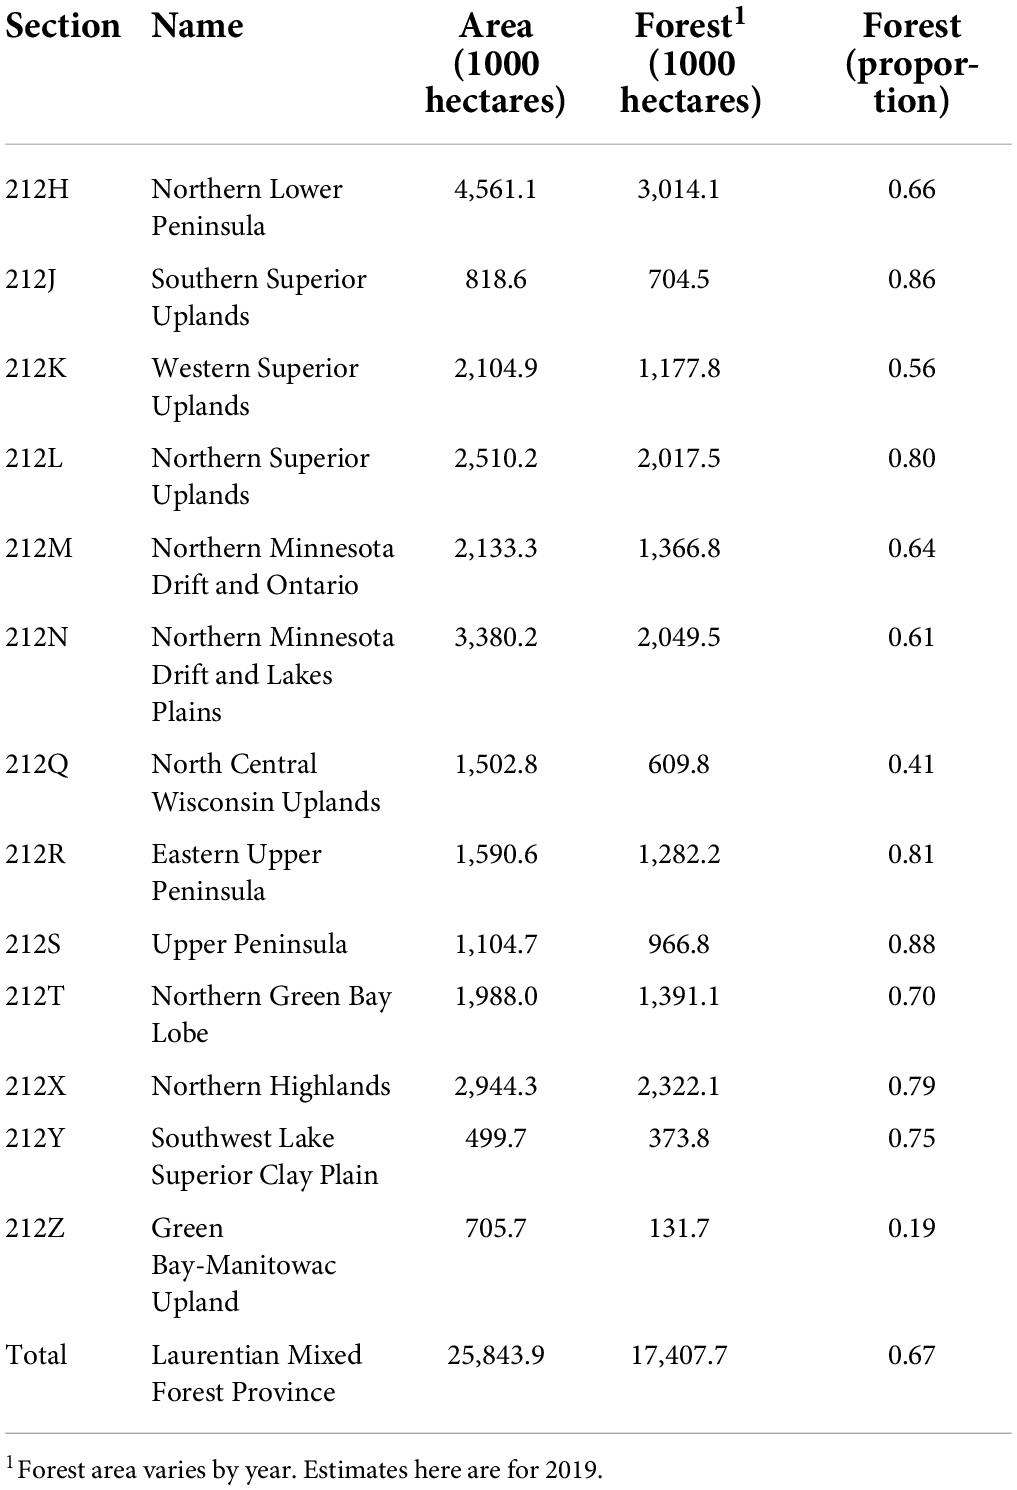
In the hierarchical ecological classification system, provinces are subdivided into sections reflecting differences in lithology and soils (McNab et al., 2007). In the LMF there are 13 sections that range in size between 500 thousand hectares (212Y) and 4,561 thousand hectares (212H) (Table 6). In 11 of the 13 sections, most of the area is forest. The most forested sections are 212S, 212J, 212R, 212L, which are located in the north-central part of the province (Figure 5). The least forested sections are 212Z and 212Q, which are both located in the south-central part of the province.
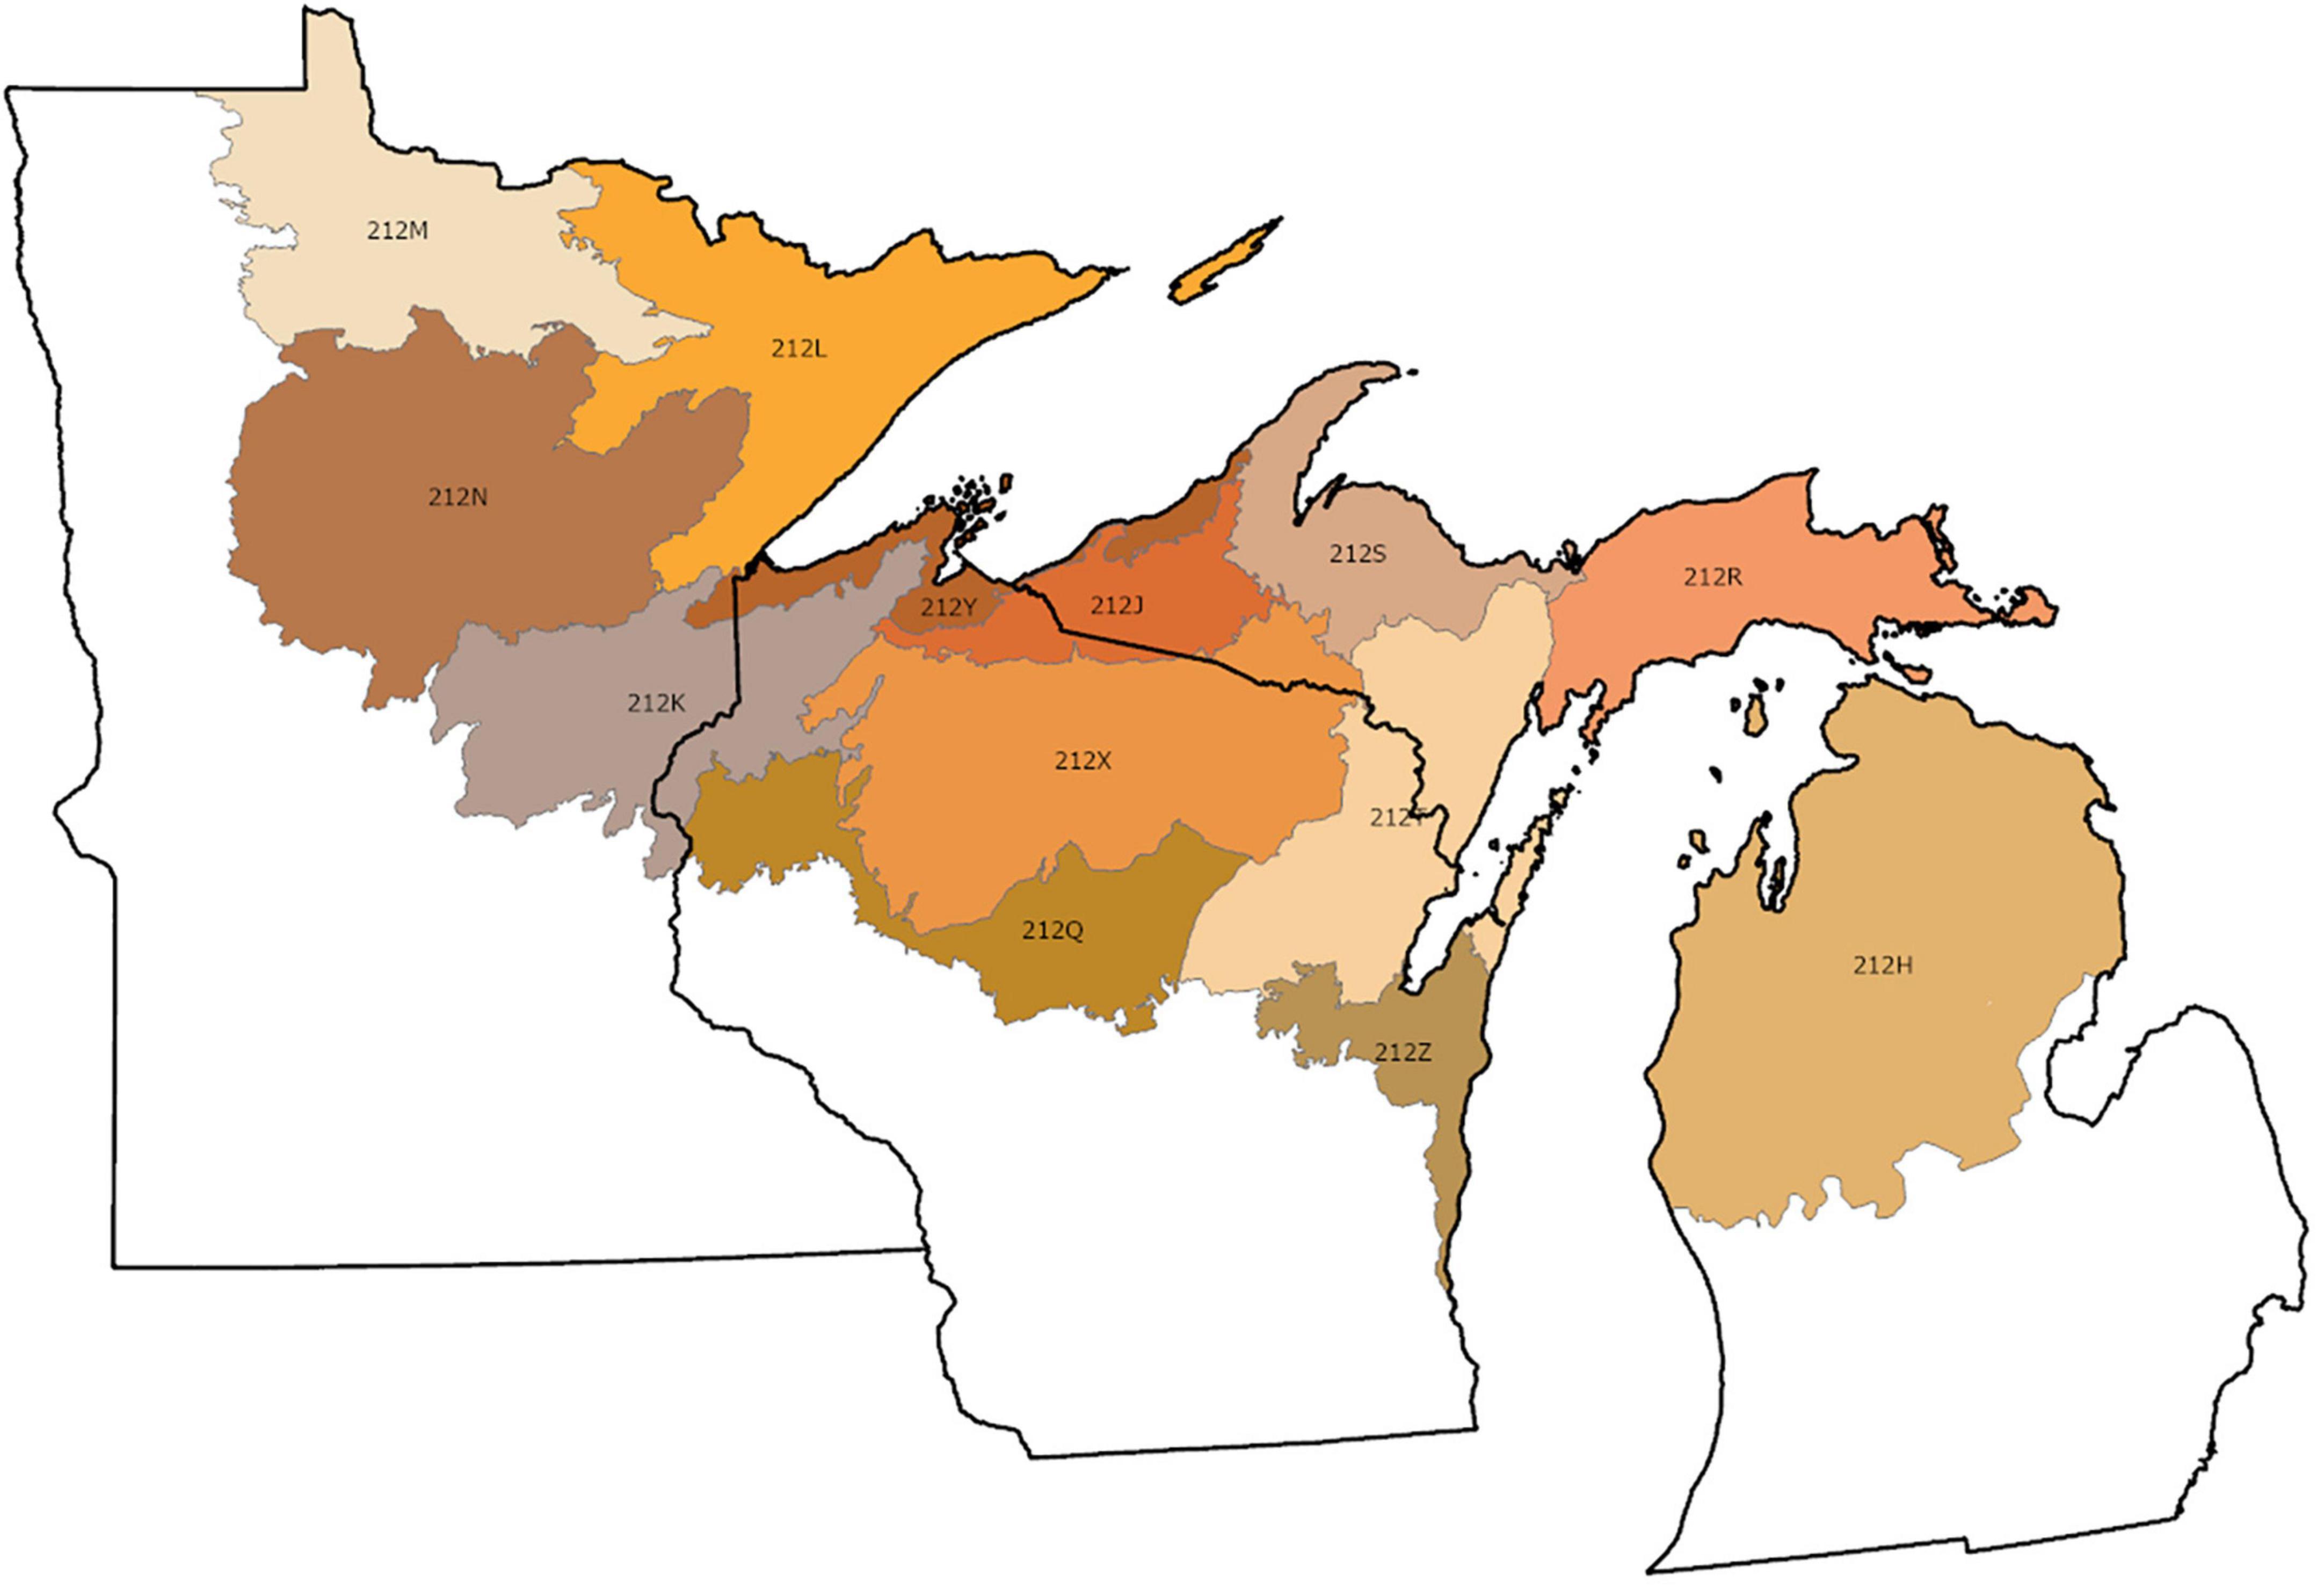
Figure 5. Ecological sections composing the Laurentian Mixed Forest (Source: Cleland et al., 2007).
Annual estimates of disturbance by section are provided in Table 7. In 10 of the 13 sections, disturbance estimates are non-zero every year. Sections 212J, 212S, and 212Z do have at least one year with estimate of 0 and all three sections are on the smaller side in terms of total area. Section 212Z is notable for having smaller forest area, 132 thousand hectares as of 2019. That sections 212J and 212S have a single year where no disturbance was observed is a reminder that the inventory is a sample rather than a census and the realization of a single random sample may provide results that differ from the true (unknown) population value. There are estimates having sampling errors > 50% and thus are not statistically significantly different from 0. This occurs in 7 of the sections and only prior to 2005. Estimates for 2005 and beyond are more precise, with sampling errors < 25% on many of the annual estimates. Annual estimates of disturbance in sections 212Y and 212Z never achieve a sampling error of <25%. These two sections are the smallest sections in both total area and forest area.
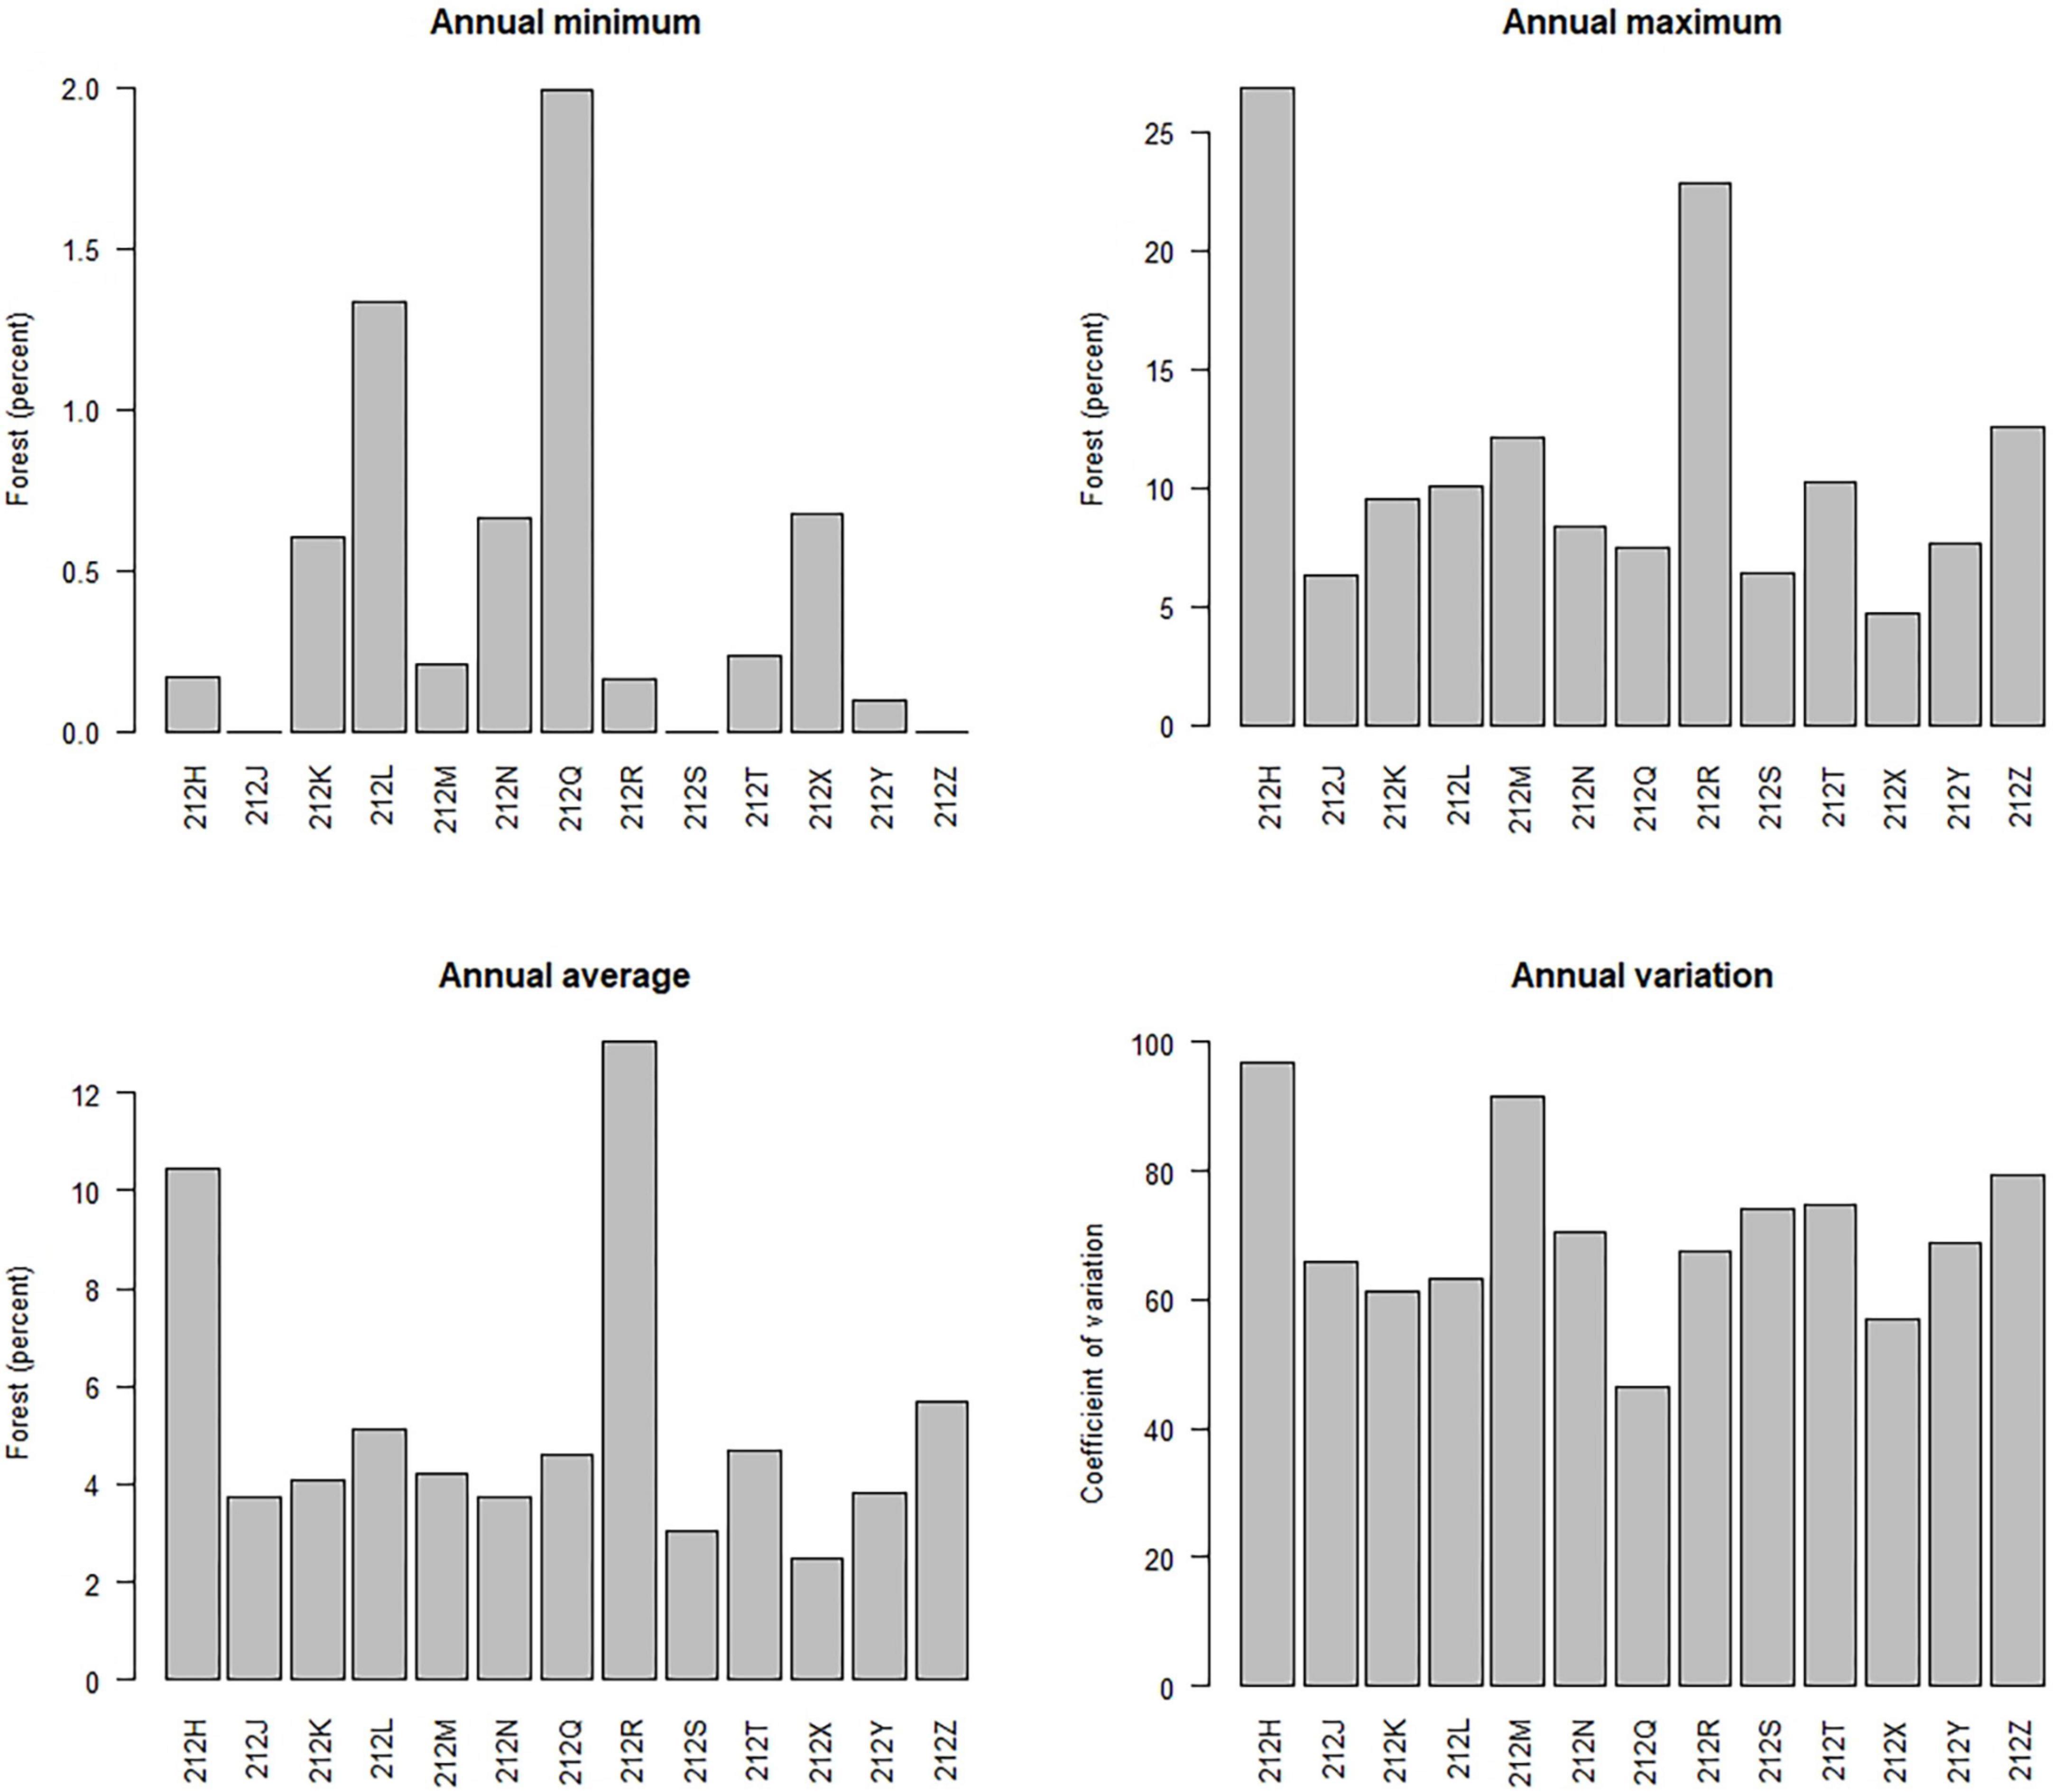
To facilitate comparison of areas with vastly different total forest area, the annual estimates of disturbance in Table 7 were divided by annual estimates of total forest area (e.g., ratio estimate). These ratios, expressed as percentages, were then summarized to minimum, maximum, average, and variation (Figure 6). The range on minimum annual percentages was 0.0 and 2.0%. The range on maximum annual percentages was 4.7–26.9%. Sections 212H and 212R stand apart from the other sections for having considerably higher maximum annual averages. The range on average annual percentages is 2.5% (212X) and 13.0% (212R). Sections 212R (13.0%) and 212H (10.5%) stand out again with average annual percentages well above estimates for other sections, a not too surprising finding given the mean is heavily influenced by outlying observations. The range on variation is 46% (212Q) to 97% (212H).
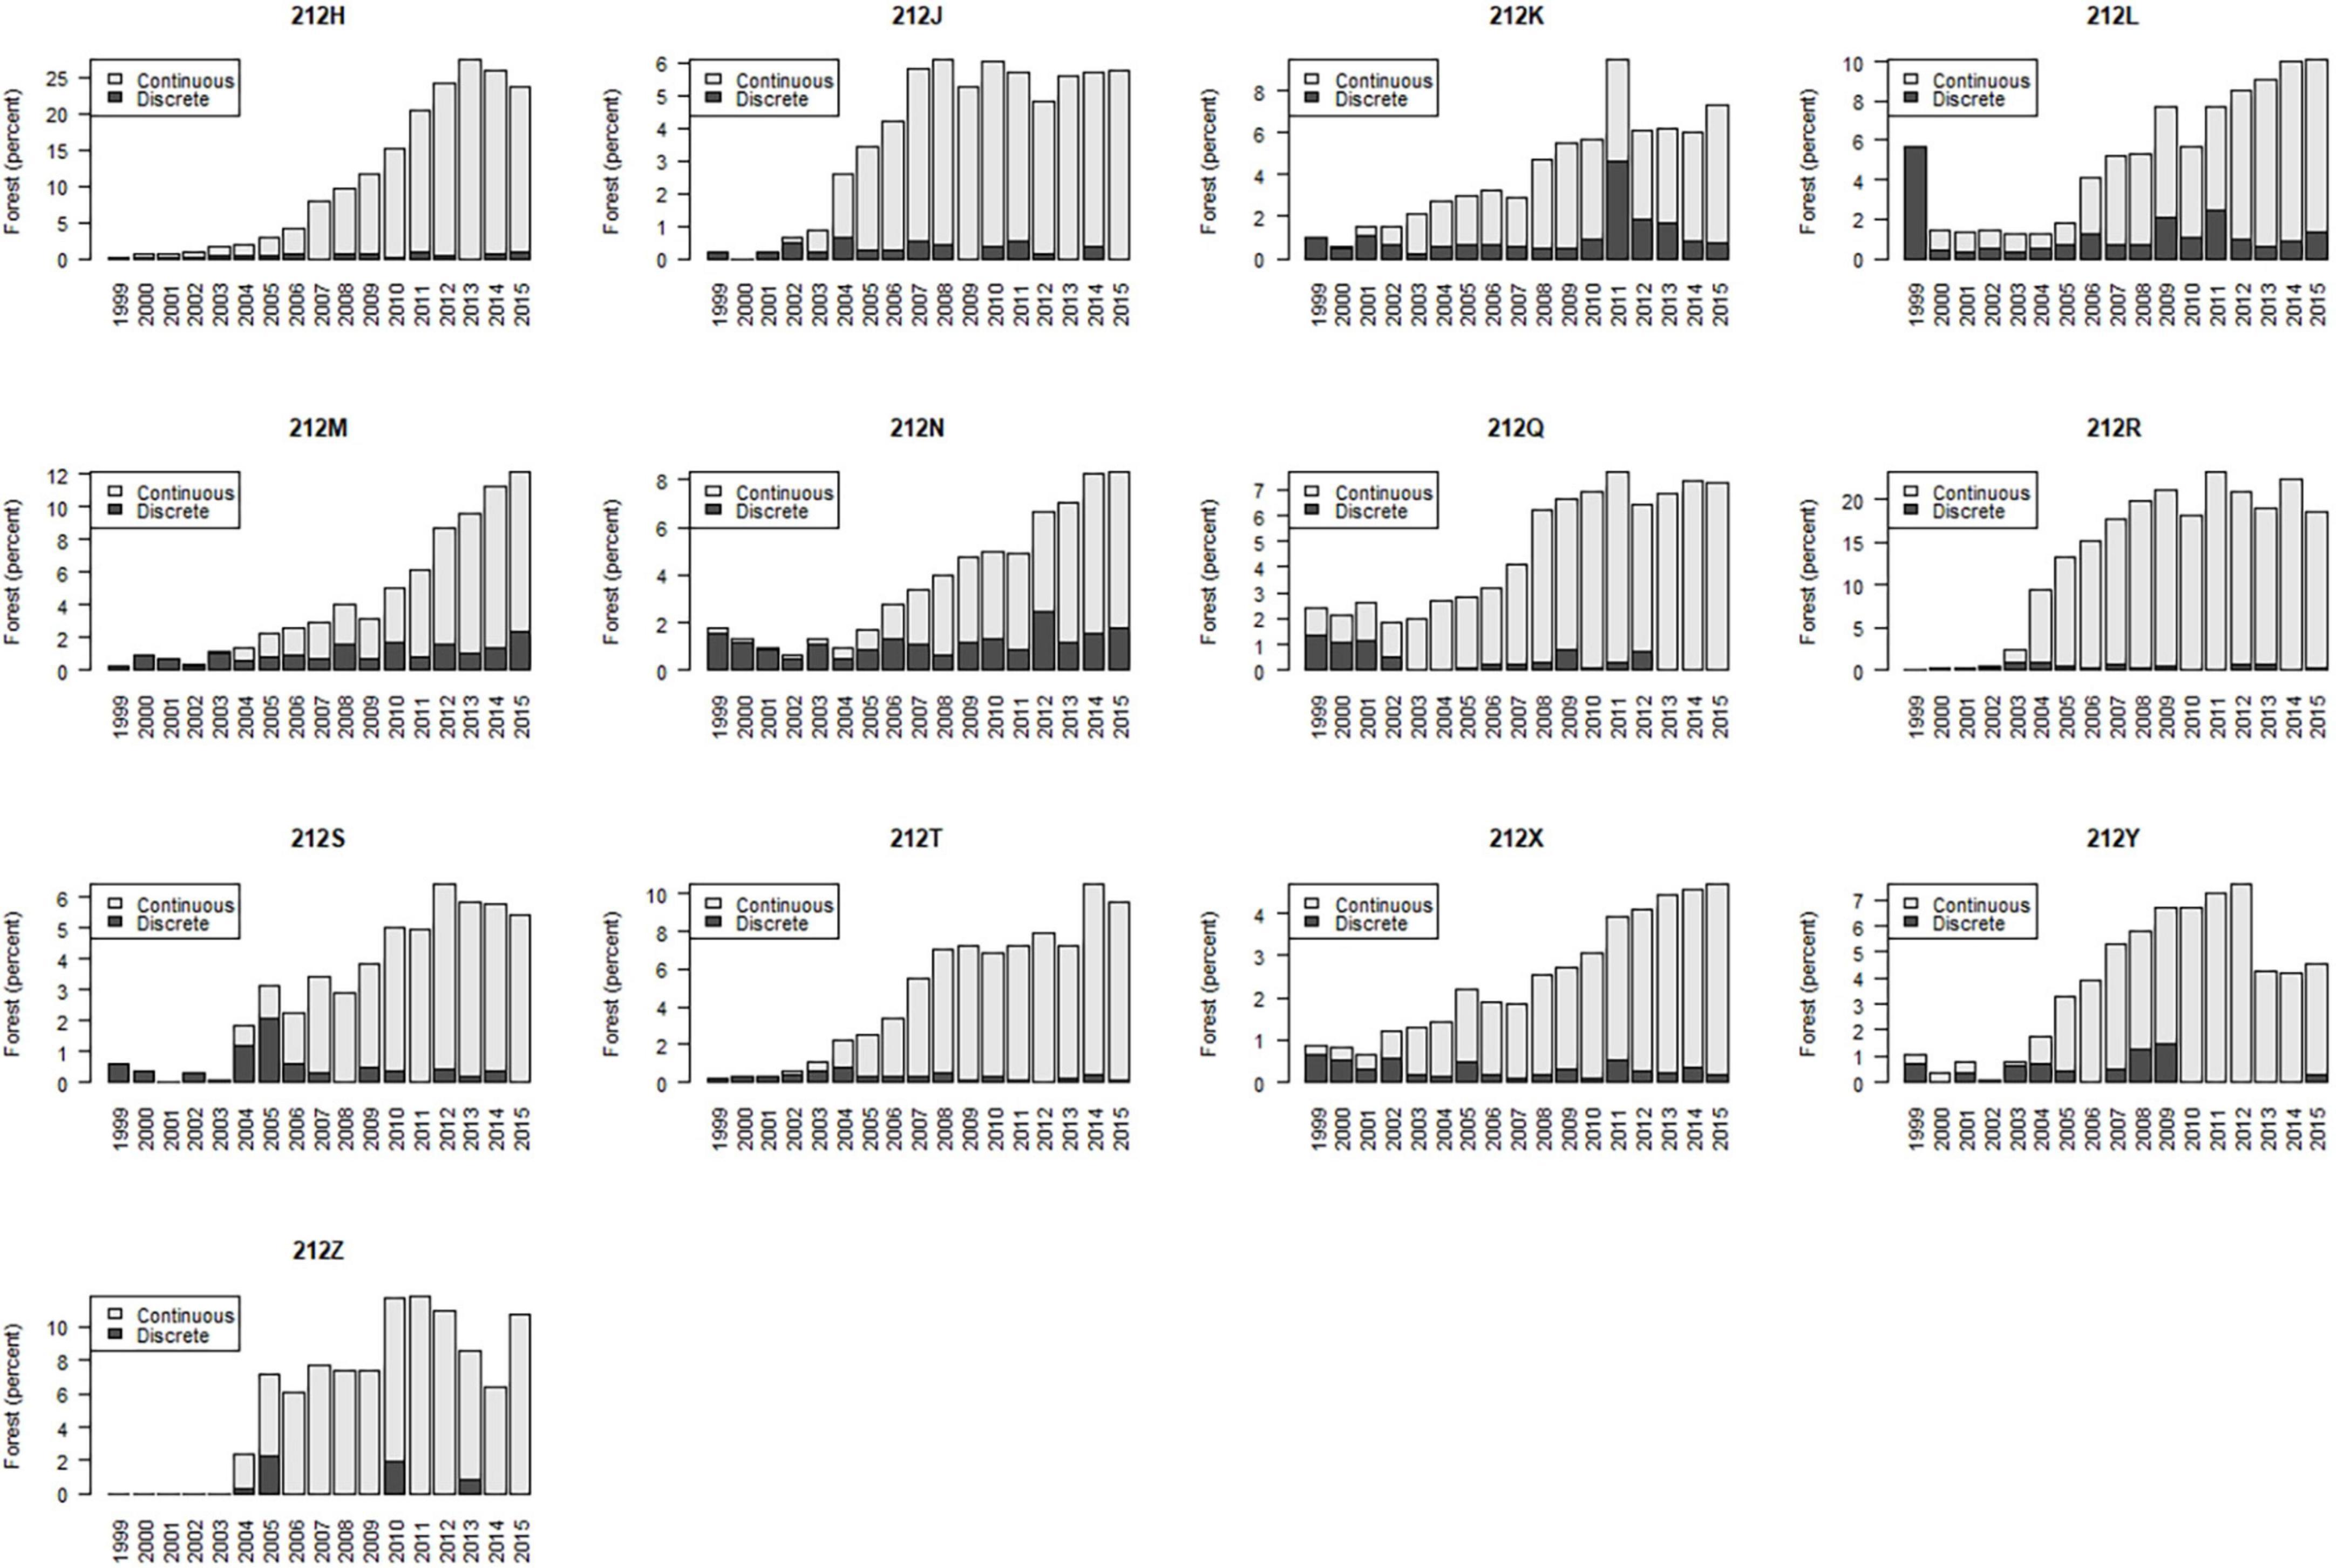
Trends in annual estimates for approximately 7 of the 13 sections reflect the overall pattern (i.e., marked increase). For example, annual estimates for section 212H increase every year from 1999 to 2013 before declining in 2014–2015 (Figure 7). Other sections exhibiting the overall pattern include 212K, 212L, 212M, 212N, 212S, and 212X. Both sections 212K and 212L have a single year (i.e., 2011 and 1999, respectively) where the annual estimate rises well above the estimates of the nearest years. The remaining 6 sections tend to exhibit an increase in annual estimates in the first part of the period followed by a settling of estimates either for the remainder of the period (212J, 212Q, 212R, 212Z), or a settling followed by an increase (212T), or a settling followed by a decline (212Y) in the last years of the period. Notable too among many of the annual estimates is the preponderance of continuous disturbance.
Wind accounted for the three largest annual discrete disturbance events (Table 8). An estimated 108.4 thousand hectares experience wind disturbance in 1999, 62.4 thousand hectares in 2011, and 60.7 thousand hectares in 2012. Estimates by section show that a single section in northeastern Minnesota accounts for most of the disturbance in 1999. A single section in northwestern Wisconsin and east central Minnesota accounts for most of the disturbance in 2011. Four sections in northern Minnesota account for most of the disturbance in 2012.
Discussion
The objective of this study was to estimate the timing and extent of forest disturbance across the Laurentian Mixed Forest. Using the national forest inventory data for Michigan, Minnesota, and Wisconsin, we were able to produce estimates of annual disturbance for the period 1999–2015. Estimates show a marked increase in annual disturbance occurring over the period. Starting from a low of 0.8% of forest area in 2000, annual disturbance estimates increased year after year until reaching a high of 11.9% of forest area in 2014. This marked increased in annual disturbance is attributable to disturbances noted for occurring continuously over time (i.e., spanning the remeasurement period). Discrete disturbances (i.e., specific disturbance year noted) occur every year and initially account for most of the disturbance but by the end of the period are a minor component. The overall trend of marked increase in annual estimates is observed for multiple disturbance agents and ecological sections. The trend is observed in approximately 9 of the 28 disturbances monitored. These agents include insect, insect-understory, insect-trees, disease, disease-trees, beaver, flooding, vegetation, and unknown. The trend is also observed for approximately 7 of the 13 sections that collectively account for nearly three-quarters of the current total forest area. These sections include 212H, 212K, 212L, 212M, 212N, 212S, and 212X.
As field procedures are updated new disturbance agents are added and new additions could be a cause of increases in annual disturbance. The FIA database includes the field guide version in use at the time of measurement. We reviewed the field guides in use throughout the period and reconstructed what codes were added and when. Our estimates were constructed using plot observations from inventory years 2000–2019, which provided the retrospective observation of disturbances for years 1999–2015. At the start in 2000, 16 different agents were monitored. At the end in 2019, 28 different agents were monitored, an increase in 12 agents. One-half of the agents added were in the geologic group, of which no occurrence on plots was noted in any of the years analyzed. There were occurrences on plots for the other six agents. Each agent was added by inventory year 2004, which means they were monitored throughout most of the period studied and therefore we conclude the addition of agents is not a significant factor in the increased disturbance observed.
Multiple studies and reports have documented significant forest health threats in the region. The non-native invasive emerald ash borer is devastating ash forests in the region (Pugh et al., 2011; Morin et al., 2017; Ward et al., 2021). Unprecedented outbreaks of native eastern larch beetle are occurring (Crocker et al., 2016; McKee et al., 2022). Deer browsing is causing significant issues with regeneration (Russell et al., 2017; Patton et al., 2018). Other insects and diseases are damaging and killing trees in the region in numbers sufficient to be considered a significant forest health threat (Karel and Man, 2017). In an assessment of the disturbances recorded in the NFI data, Wilson et al. (2019) reported an increase in forest disturbance across Minnesota from 4.4 to 12.7% between what they termed focal years 2001–2014.
In accounting for the retrospective nature of the observation of disturbance (Coulston et al., 2020), we believe estimates reported here are the most appropriate annual estimates of disturbance computed with US NFI data for the region. We were curious how the annual estimates compare to disturbance events of known timing, severity, and duration. Review of all the annual estimates disturbances in our data returned wind in 1999 as having the largest annual estimate among discrete disturbances. Examination by section showed that section 212L accounted for most of the estimate. An approximate 95% confidence interval on the annual estimate of wind disturbance in section 212L for 1999 is 68 thousand to 112 thousand hectares. The timing and location match well a major windstorm event that occurred in northeastern Minnesota on July 4, 1999. The “Boundary Waters-Canadian Derecho” lasted more than 22 h and traveled more than 1,300 miles. Hundreds of thousands of hectares were impacted with varying degrees of damage that included sizable areas of forest blowdown (Moser et al., 2007; Nelson et al., 2009). The second highest annual estimate of discrete disturbance was wind in 2011. Our estimates place most of the disturbance (41.9 thousand hectares, 18.7% sampling error) in section 212K, which coincides well with a large windstorm noted by the Wisconsin Department of Natural Resources as causing extensive forest blowdown (personal communication, Brian Anderson, Wisconsin DNR, 10/7/21).
This is the first study of disturbance with US NFI data that we are aware of that makes a distinction between discrete and continuous disturbances in the estimation. We think that in terms of impacts (i.e., damage or mortality), distinguishing between the two disturbance durations is important. The definition of disturbance used by FIA implies 25% or more of trees on a condition are affected. When a discrete disturbance occurs, it affects a single annual estimate and it is presumed that 25% or more of trees are affected that year in the estimated area of disturbance. When a continuous disturbance occurs, it impacts multiple annual estimates. The 25% or more of trees are assumed affected over the length of the retrospective observation (i.e., b, number of panels), rather than per year. In other words, an annual estimate of 100,000 hectares of discrete disturbance implies substantially greater impacts in the specified year than 100,000 hectares of continuous disturbance. It is therefore important to distinguish between discrete and continuous disturbances when considering these annual disturbance estimates and potential impacts.
Forests provide ecological, economic, and social services that are vitally important. Every year forest landowners across the LMF make significant investments in monitoring and managing the region’s extensive forests. Forest health is a significant concern of many in the region and the results from this study suggest the concern is warranted. Forest and natural resource managers are adapting silvicultural practices to promote resistance and resilience (Windmuller-Campione et al., 2020). Annual estimates of disturbance across all ownerships provide managers with important insights into forest health beyond what they know from their own agency or corporate inventories. In understanding the timing and extent of disturbance, managers can plan accordingly and take actions to promote forest health. Climate change is also major concern with the potential to amplify the impacts of disturbance agents (Allen et al., 2010; Seidl et al., 2017; McKee et al., 2022). The need for accurate estimates on the timing and extent of forest disturbance is only expected to increase in the future.
Data availability statement
Publicly available datasets were analyzed in this study. Data can be obtained from https://www.fia.fs.fed.us/tools-data/.
Author contributions
CE conceived the research, developed the methodology, performed the analysis, wrote the original draft, and wrote the final draft of the manuscript. JW developed the methodology, wrote the original draft, and wrote the final draft of the manuscript. Both authors contributed to the article and approved the submitted version.
Funding
Funding to support CE in this effort was provided by USDA Forest Service Project Forest Biometrics Research and Program Support (20-JV-11242305-018) and Minnesota Agricultural Experiment Station Project MIN-42-114.
Conflict of interest
The authors declare that the research was conducted in the absence of any commercial or financial relationships that could be construed as a potential conflict of interest.
Publisher’s note
All claims expressed in this article are solely those of the authors and do not necessarily represent those of their affiliated organizations, or those of the publisher, the editors and the reviewers. Any product that may be evaluated in this article, or claim that may be made by its manufacturer, is not guaranteed or endorsed by the publisher.
Footnotes
References
Allen, C. D., Macalady, A. K., Chenchouni, H., Bachelet, D., McDowell, N., Vennetier, M., et al. (2010). A global overview of drought and heat-induced tree mortality reveals emerging climate change risks for forests. For. Ecol. Manage. 259, 660–684. doi: 10.1016/j.foreco.2009.09.001
Bechtold, W. A., and Scott, C. T. (2005). “The forest inventory and analysis plot design,” in The enhanced forest inventory and analysis program – National sampling design and estimation procedures. General Technical Report SRS-80, eds W. A. Bechtold and P. L. Patterson (Asheville, NC: U.S. Department of Agriculture, Forest Service, Southern Research Station), 27–42.
Burrill, E. A., Wilson, A. M., Turner, J. A., Pugh, S. A., Menlove, J., Christensen, G., et al. (2018). The forest inventory and analysis database: Database description and user guide Version 8.0 for phase 2. Available online at: https://www.fia.fs.fed.us/library/database-documentation/current/ver80/FIADB%20User%20Guide%20P2_8-0.pdf (accessed May 14, 2022).
Cleland, D. T., Freeouf, J. A., Keys, J. E., Nowacki, G. J., Carpenter, C. A., and McNab, W. H. (2007). Ecological subregions: Sections and subsections for the conterminous United States. General technical report WO-76D (A.M. Sloan, cartographer). Washington, DC: U.S. Department of Agriculture. doi: 10.2737/WO-GTR-76D
Coulston, J. W., Edgar, C. B., Westfall, J. A., and Taylor, M. E. (2020). Estimation of forest disturbance from retrospective observations in a broad-scale inventory. Forests 11:1298. doi: 10.3390/f11121298
Crocker, S. J., Liknes, G. C., McKee, F. R., Albers, J. S., and Aukema, B. H. (2016). Stand-level factors associated with resurging mortality from eastern larch beetle (Dendroctonus simplex LeConte). For. Ecol. Manage. 375, 27–34. doi: 10.1016/j.foreco.2016.05.016
Edgar, C. B., Westfall, J. A., Klockow, P. A., Vogel, J. G., and Moore, G. W. (2019). Interpreting effects of multiple, large-scale disturbances using national forest inventory data: A case study of standing dead trees in east Texas, USA. For. Ecol. Manage. 437, 27–40. doi: 10.1016/j.foreco.2019.01.027
Hou, Z., Domke, G. M., Russell, M. B., Coulston, J. W., Nelson, M. D., Xu, Q., et al. (2021). Updating annual state- and county-level forest inventory estimates with data assimilation and FIA data. For. Ecol. Manage. 483:118777. doi: 10.1016/j.foreco.2020.118777
Karel, T. H., and Man, G. (2017). Major forest insect and disease conditions in the United States: 2015. FS-1093. Washington, DC: U.S. Department of Agriculture, 45.
Masek, J. G., Goward, S. N., Kennedy, R. E., Cohen, W. B., Moisen, G. G., Schleeweis, K., et al. (2013). United States forest disturbance trends observed using Landsat time series. Ecosystems 16, 1087–1104. doi: 10.1007/s10021-013-9669-9
McKee, F. R., Windmuller-Campione, M. A., Althoff, E. R., Reinikainen, M. R., Dubuque, P. A., and Aukema, B. H. (2022). “Chapter 9 – Eastern larch beetle, a changing climate, and impacts to northern tamarack forests,” in Bark beetle management, ecology, and climate change, eds K. J. K. Gandhi and R. W. Hofstetter (Cambridge, MA: Academic Press), 261–300. doi: 10.1016/B978-0-12-822145-7.00001-5
McNab, W. H., Cleland, D. T., Freeouf, J. A., Keys, J. E., Nowacki, G. J., and Carpenter, C. A. (2007). Description of the ecological subregions: Sections of the conterminous United States. General Technical Report WO-76B. Washington, DC: U.S. Department of Agriculture, Forest Service, 80. doi: 10.2737/WO-GTR-76B
Morin, R. S., Liebhold, A. M., Pugh, S. A., and Crocker, S. J. (2017). Regional assessment of emerald ash borer, Agilus planipennis, impacts in forests of the eastern United States. Biol. Invasions 19, 703–711. doi: 10.1007/s10530-016-1296-x
Moser, W. K., Hansen, M. H., Nelson, M. D., Crocker, S. J., Perry, C. H., Schultz, B., et al. (2007). After the blowdown: A resource assessment of the boundary waters canoe area wilderness. General Technical Report NRS-7. Newtown Square, PA: U.S. Department of Agriculture, 54. doi: 10.2737/NRS-GTR-7
Nelson, M. D., Healey, S. P., Moser, W. K., and Hansen, M. H. (2009). Combining satellite imagery with forest inventory data to assess damage severity following a major blowdown even in northern Minnesota, USA. Int. J. Remote Sens. 30, 5089–5108. doi: 10.1080/01431160903022951
Patterson, P. L., and Reams, G. A. (2005). “Combining panels for forest inventory and analysis estimation,” in The enhanced forest inventory and analysis program – National sampling design and estimation procedures. General Technical Report SRS-80, eds W. A. Bechtold and P. L. Patterson (Asheville, NC: U.S. Department of Agriculture), 69–73. doi: 10.1371/journal.pone.0044795
Patton, S. R., Russell, M. B., Windmuller-Campione, M. A., and Frelich, L. E. (2018). Quantifying impacts of white-tailed deer (Odocoileus virginianus Zimmerman) browse using forest inventory and socio-environmental datasets. PLoS One 13:e0201334. doi: 10.1371/journal.pone.0201334
Pugh, S. A., Liebhold, A. M., and Morin, R. S. (2011). Changes in ash tree demography associated with emerald ash borer invasion, indicated by regional forest inventory data from the Great Lakes States. Can. J. For. Res. 41, 2165–2175. doi: 10.1139/x11-138
R Core Team (2021). R: A language and environment for statistical computing. Vienna: R Foundation for Statistical Computing.
Reams, G. A., Smith, W. D., Hansen, M. H., Bechtold, W. A., Roesch, F. A., and Moisen, G. G. (2005). “The forest inventory and analysis sampling frame,” in The enhanced forest inventory and analysis program – national sampling design and estimation procedures. General Technical Report SRS-80, eds W. A. Bechtold and P. L. Patterson (Asheville, NC: U.S. Department of Agriculture), 11–26.
Russell, M. B., Woodall, C. W., Potter, K. M., Walters, B. F., Domke, G. M., and Oswalt, C. M. (2017). Interactions between white-tailed deer density and the composition of forest understories in the northern United States. For. Ecol. Manage. 384(Suppl. C), 26–33. doi: 10.1016/j.foreco.2016.10.038
Scott, C. T., Bechtold, W. A., Reams, G. A., Smith, W. D., Westfall, J. A., Hansen, M. H., et al. (2005). “Sample-based estimators used by the forest inventory and analysis national information management system,” in The enhanced forest inventory and analysis program – National sampling design and estimation procedures. General Technical Report SRS-80, eds W. A. Bechtold and P. L. Patterson (Asheville, NC: U.S. Department of Agriculture), 43–67.
Shifley, S. R., and Moser, W. K. (2016). Future forests of the northern United States. General Technical Report NRS-151. Newtown Square, PA: U.S. Department of Agriculture, Forest Service, Northern Research Station, 388. doi: 10.2737/NRS-GTR-151
Seidl, R., Thom, D., Kautz, M., Martin-Benito, D., Peltoniemi, M., Vacchiano, G., et al. (2017). Forest disturbances under climate change. Nat. Clim. Change 7, 395–402. doi: 10.1038/nclimate3303
USDA Forest Service (2022). Forest inventory and analysis program, forest inventory evalidator web-application Version 1.8.0.01. St. Paul, MN: U.S. Department of Agriculture.
Van Deusen, P. C. (2002). Comparison of some annual forest inventory estimators. Can. J. For. Res. 32, 1992–1995. doi: 10.1139/x02-115
Vogeler, J. C., Slesak, R. A., Fekety, P. A., and Falkowski, M. J. (2020). Characterizing over four decades of disturbance in Minnesota, USA. Forests 11:362. doi: 10.3390/f11030362
Ward, S. F., Liebhold, A. M., Morin, R. S., and Fei, S. (2021). Population dynamics of ash across the eastern USA following invastion by emerald ash borer. For. Ecol. Manage. 479:118574. doi: 10.1016/j.foreco.2020.118574
Wilson, D. C., Morin, R. S., Frelich, L. E., and Ek, A. R. (2019). Monitoring disturbance intervals in forests: a case study of increase forest disturbance in Minnesota. Ann. For. Sci. 76:78. doi: 10.1007/s13595-019-0858-3
Keywords: insects, disease, wind, Great Lakes, ecological subregion, national forest inventory
Citation: Edgar CB and Westfall JA (2022) Timing and extent of forest disturbance in the Laurentian Mixed Forest. Front. For. Glob. Change 5:963796. doi: 10.3389/ffgc.2022.963796
Received: 07 June 2022; Accepted: 25 July 2022;
Published: 24 August 2022.
Edited by:
Yashwant S. Rawat, Federal Technical and Vocational Education and Training Institute (FTVETI), EthiopiaReviewed by:
Nabi Kanta Jha, Government of West Bengal, IndiaAndressa Ribeiro, Federal University of Piauí, Brazil
Copyright © 2022 Edgar and Westfall. This is an open-access article distributed under the terms of the Creative Commons Attribution License (CC BY). The use, distribution or reproduction in other forums is permitted, provided the original author(s) and the copyright owner(s) are credited and that the original publication in this journal is cited, in accordance with accepted academic practice. No use, distribution or reproduction is permitted which does not comply with these terms.
*Correspondence: Christopher B. Edgar, Y2VkZ2FyQHVtbi5lZHU=
 Christopher B. Edgar
 James A. Westfall