
94% of researchers rate our articles as excellent or good
Learn more about the work of our research integrity team to safeguard the quality of each article we publish.
Find out more
POLICY AND PRACTICE REVIEWS article
Front. For. Glob. Change, 23 September 2022
Sec. Forest Management
Volume 5 - 2022 | https://doi.org/10.3389/ffgc.2022.956196
This article is part of the Research TopicForest Carbon Credits as a Nature-Based Solution to Climate Change?View all 10 articles
The forestry sector has a crucial role to play in mitigating climate change. Given the share of global emissions covered by emissions trading is expected to rise, there is a need to understand how emissions trading might drive behavior change in the forestry sector. To explore this, we analyze the New Zealand Emissions Trading Scheme (NZ ETS) − the only system in the world with symmetrical incentives that reward forest owners who afforest and make liable those who deforest. In theory, these incentives should drive net carbon dioxide removals in the forestry sector, but the sectoral response has proven complex. We evaluate the NZ ETS policies that directly affect forestry and the sectoral response to these policies by analyzing trends in deforestation, afforestation, and participation over 2008 to 2022. Our findings indicate that the forestry sector, and the NZ ETS participants within it, have responded rationally to emissions pricing over time. However, multiple factors such as complex participation requirements, extended periods of policy uncertainty, and weak emissions price signals (particularly over 2011–2016) have likely restricted the effectiveness of the NZ ETS in changing forestry outcomes over much of its operating life. The Climate Change Response (Emissions Trading Reform) Amendment Act, 2020 reformed forestry and other provisions in the NZ ETS to address demonstrated shortcomings, improve policy predictability, and incentivize more ambitious mitigation action in line with Aotearoa New Zealand’s targets. However, the signaling of further changes to NZ ETS forestry policy in 2022 has created new uncertainty for market participants. Despite past challenges, the sector’s dramatic response to rising emissions prices in recent years demonstrates the NZ ETS is changing landowner behavior to produce net forestry removals. The NZ ETS remains a unique and strong model from which other nations can gain insights in how to design and operate emissions trading systems to harness mitigation potential from the forestry sector and help meet their emission reduction targets.
The forestry sector has a crucial role to play in mitigating climate change and can contribute significantly to meeting emissions reduction targets in many countries. Forests can act as a carbon sink, sequestering carbon and counteracting the accumulation of carbon dioxide (CO2) in the atmosphere, which is a main driver of climate change. Conversely, deforestation is a source of CO2 emissions. Using forestry for climate change mitigation can deliver valuable co-benefits for biodiversity, water quality, soil productivity, ecosystem resilience to climate change impacts, and human wellbeing. However, a lack of financing, governance, and institutional capacity are key barriers globally to realizing both climate change mitigation and valuable co-benefits from forestry (Nabuurs et al., in press).
Forests cover about 37% (10 million hectares) of New Zealand’s land area. This comprises about 7.8 million hectares natural (mostly indigenous) forest and 2.1 million hectares planted (mostly exotic) forest (MfE, 2022a). About 96% of exotic planted forest is privately owned (MPI, 2020). Furthermore, about 30% of planted production forest is on Māori land; this could increase to 40% with future settlements under the Treaty of Waitangi (Te Tiriti o Waitangi) (MPI, 2022a). New Zealand experienced a dramatic shift toward privatization of, and growth in, production forest in the 1990s following restructuring of the New Zealand Forest Service (MPI et al., 2021). Alongside growth in production forest, there has been some conversion out of forest, largely to grassland. This has predominately been driven by the profitability of pastoral production (MfE, 2022a).
The forestry sector has significantly helped New Zealand achieve its emissions mitigation targets to date under the United Nations Framework Convention on Climate Change (UNFCCC). During the first commitment period (CP1) under the Kyoto Protocol (2008–2012), eligible net forestry removals under target accounting1 more than completely offset the difference between New Zealand’s Assigned Amount (its emissions target) and its total gross emissions (MfE, 2015). For the target period from 2013 to 2020, New Zealand’s eligible net forestry removals offset 19% of gross emissions and bridged 95% of the target compliance gap, with the remainder met through CP1 Kyoto units carried over post-2012 (MfE, 2022b).
New Zealand is the first, and only, country to include forest landowners as full participants in its Emissions Trading Scheme (NZ ETS). The policy intention behind the forestry component of the NZ ETS is to promote carbon sequestration and storage by discouraging deforestation of pre-1990 forests and encouraging planting of new post-1989 forests (terms defined below) (MfE and The Treasury, 2007). These goals are nested within the overall purpose of the NZ ETS, which is to help New Zealand meet its climate change obligations under the UNFCCC and Climate Change Response Act 2002.
Many papers have analyzed the evolution of the NZ ETS and its effects on participants (e.g., Jiang et al., 2009; Kerr and Chapman, 2009; Bertram and Terry, 2010; Cameron, 2011; Bullock, 2012; Mundaca and Richter, 2013; Richter and Mundaca, 2013; Kerr and Duscha, 2014; Jackson Inderberg et al., 2017; Diaz-Rainey and Tulloch, 2018; Jackson Inderberg and Bailey, 2019; Leining et al., 2019; Kerr et al., 2021). These studies have explored the policy and political drivers for introducing the system and analyzed innovative design features as well as shortcomings of the system. A key finding has been the system’s failure to incentivize significant domestic mitigation, particularly during unconstrained linkage to low-cost and low-quality units from the international Kyoto market from 2008 to mid-2015.
However, relatively little research has focused on forestry policy design within the NZ ETS and its impact on the sector. A key exception is Evison (2017), which examined the system’s outcomes for forest carbon sequestration over 2008–2012. This study assessed rates of forest registration in the NZ ETS as well as afforestation and deforestation in New Zealand. It also considered the impact of emissions units on commercial forest profitability. The author’s primary conclusions were that the NZ ETS: “has not encouraged investment in new planted forests in New Zealand, and in some cases may have encouraged deforestation,” “is unlikely to contribute a long-term positive impact on profitability of commercial forestry,” and “is not the correct policy instrument to encourage carbon sequestration by planted forests.”
Since that study was done, the policy design and operation of the NZ ETS have evolved significantly in ways that are rapidly transforming the forestry sector’s contributions to New Zealand’s emissions reduction targets. In this paper we provide an updated review of NZ ETS policy design for the forestry sector, its role in influencing forestry outcomes, and future challenges. We begin by examining the progression of NZ ETS policy settings. Using a review of relevant literature and descriptive statistics, we evaluate impacts of the system over 2008 through early 2022 in terms of landowner participation, deforestation, afforestation, and forest management practices. We review expectations for the future role of the forestry sector in meeting New Zealand’s climate change targets. We then discuss implications of our review and offer conclusions. Our intention is to help inform the treatment of the forestry sector in other emissions trading systems as well as future development of the NZ ETS.
The NZ ETS was introduced in 2008 to help New Zealand meet its obligations under the UNFCCC and Kyoto Protocol (New Zealand Government, 2008). Under an ETS, parties accountable for emissions are required to surrender to the government one emissions unit for each metric ton of carbon dioxide equivalent emissions for which they are liable. Units can be traded among market participants and banked for future use. When the supply of units is constrained, the market sets a unit price that balances demand with supply. Obligated parties then pass on the ETS compliance cost across the supply chain, increasing the relative cost of emissions-intensive goods and services, and thus incentivizing businesses and consumers to lower their emissions.
The NZ ETS was the world’s first (and remains the only) emissions trading system designed to cover all sectors of the economy. Table 1 lists key milestones in NZ ETS development. The forestry sector entered in 2008, followed by stationary energy, transport, and industrial processes in mid-2010, and synthetic greenhouse gases (GHGs) and waste in 2013. Although emissions reporting has been obligatory for the agriculture sector at the processor level since 2012, unit obligations for biogenic agricultural emissions have been deferred to date. Pricing of agricultural emissions under the NZ ETS or an alternative mechanism is scheduled to begin no later than January 2025 (Leining et al., 2019; Leining, 2022).
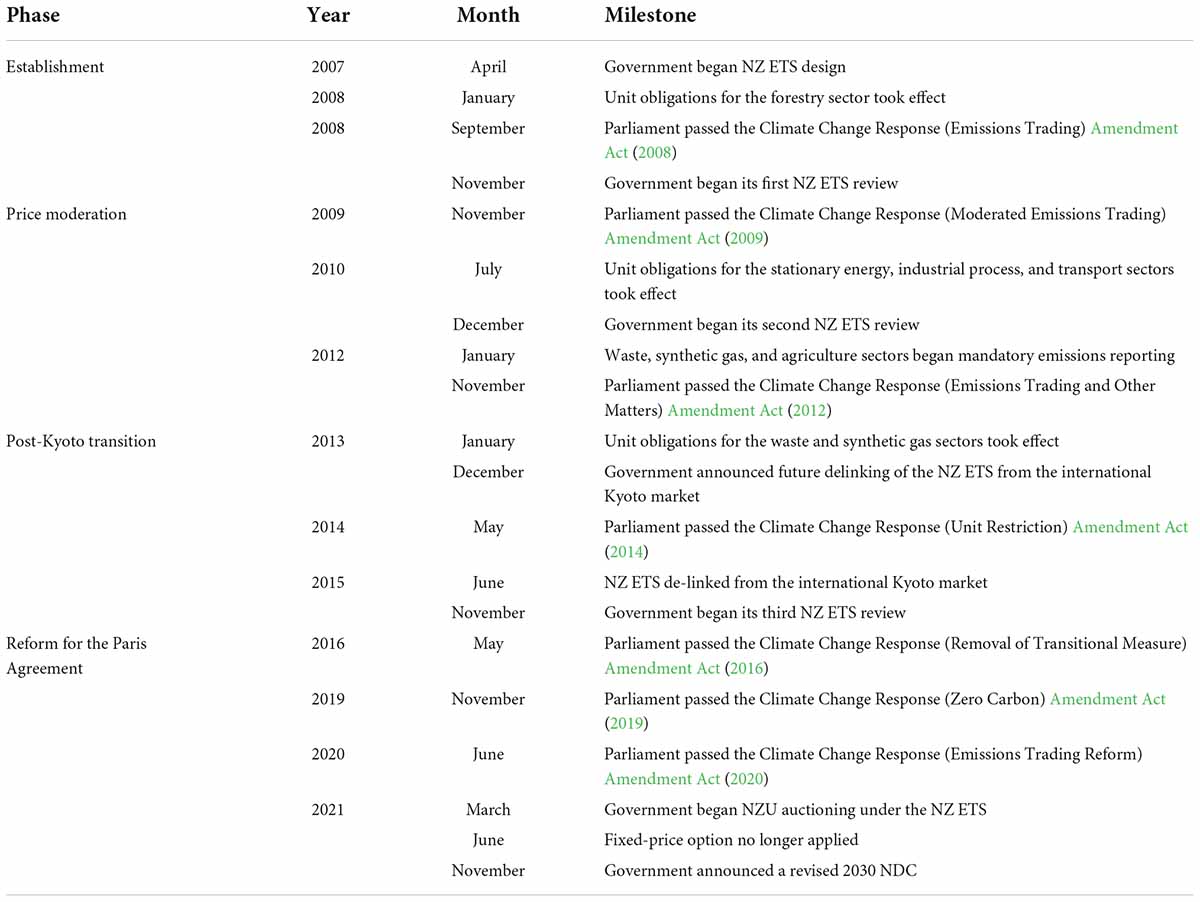
Table 1. Key milestones in the operation of the NZ ETS. Adapted from Leining (2022).
The system underwent major legislative amendments in 2009, 2012, and 2020. The 2009 amendments2 moderated the price impact of the system during the Global Financial Crisis. The 2012 amendments3 extended the price moderation measures and prepared the system for de-linking from the international Kyoto market. The 2020 amendments4 reformed the architecture to enable alignment of key settings with New Zealand’s obligations under the Paris Agreement.
Since the system’s inception, the government has issued New Zealand Units (NZUs) into the market through free allocation and entitlements for eligible removal activities from forestry and industry. As a transitional measure, a fixed amount of free allocation was provided to pre-1990 forest owners in 2008 and 2013, and to the fishing sector in 2010. The rationale for free allocation for pre-1990 forestry was to offset some of the economic impact from introducing deforestation liabilities (MfE and The Treasury, 2007). Eligible industrial producers have received output-based free allocation since mid-2010 to reduce the risk of emissions leakage offshore (Rontard and Leining, 2021).
From 2008 to mid-2015, the NZ ETS accepted eligible offshore Kyoto units with no quantity limit. During linking, domestic emissions prices were driven by the international market, resulting in declining prices from 2011. When the New Zealand government announced in late 2012 that it would take its post-2012 target under the UNFCCC rather than the Kyoto Protocol, this raised the prospect of future NZ ETS de-linking and caused unit price divergence, with NZUs valued above offshore Kyoto units. In late 2013, the government announced it would de-link the NZ ETS from the Kyoto market in mid-2015. Since then, the NZ ETS has operated as a domestic-only system (Leining et al., 2017b; Diaz-Rainey and Tulloch, 2018; Kerr et al., 2021).
Government auctioning of NZUs under an overall limit began in 2021. If the system accepted offshore emissions units in the future, they would also be bound by the overall limit. Removal units for forestry and industrial activities are not bound by the overall limit and add to overall market supply (Leining et al., 2019; Leining, 2022).
Since 2009, the NZ ETS has included price control mechanisms. For emissions from mid-2010 through 2019, participants could pay a fixed price of NZ$25 per ton (a hard price ceiling). This was increased to NZ$35 per ton to cover 2020 emissions, and then discontinued. From mid-2010 through 2016, the unit obligation was reduced to one unit per two tons of emissions in non-forestry sectors while the forestry sector retained a full unit obligation. A full unit obligation for non-forestry sectors was phased in by January 2019. From January 2021, the system has operated with an auction reserve price (a price floor) and a cost containment reserve (a soft price ceiling) that releases a fixed volume of NZUs when a trigger price is reached at auction. A confidential reserve price aligns minimum auction prices with those in the secondary market. Unit price control settings are decided alongside unit supply (Leining, 2022).
These design features have shaped the emissions price pathway in the NZ ETS (Figure 1). The stages of price evolution include certain international linkage (2008–2012), transition to de-linking (2013 to mid-2015), domestic-only supply with a fixed-price option (mid-2015 to 2020), and domestic supply with auctioning (2021 to present). In February 2013, the NZU hit its lowest price of NZ$1.45. In February 2022, the NZU price passed NZ$80 for the first time.
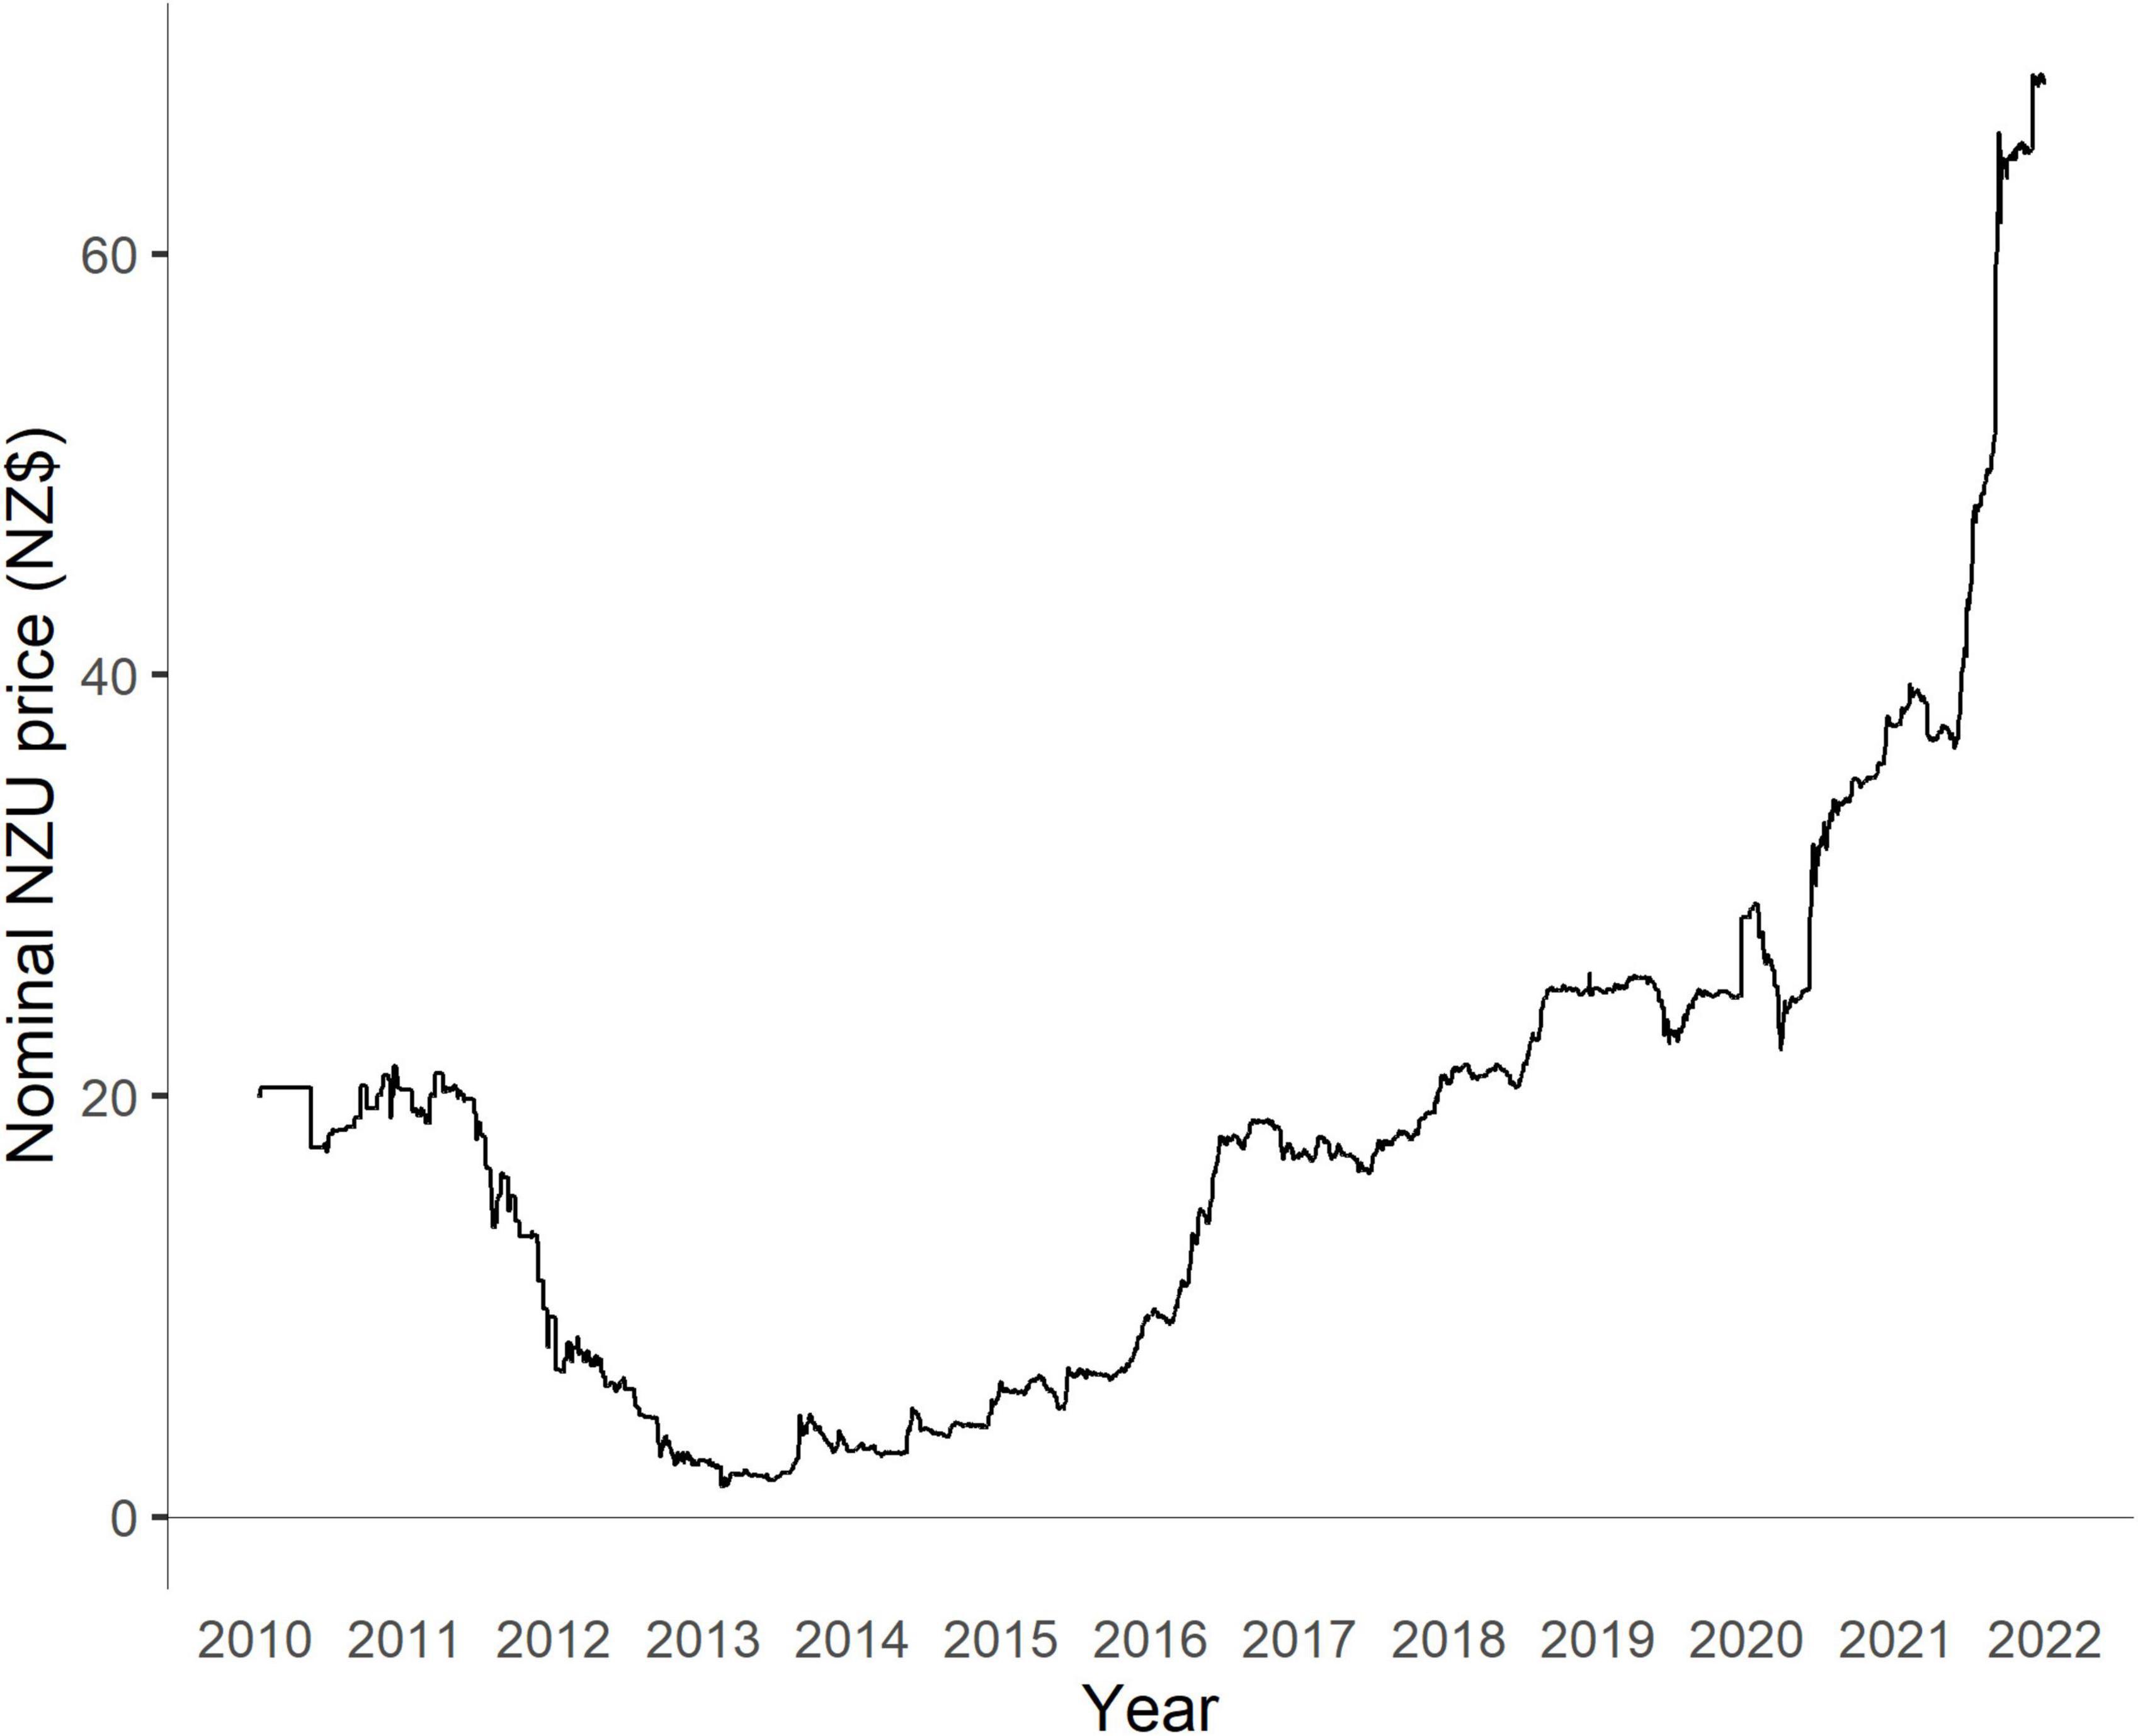
Figure 1. Evolution of NZU prices, 2009–2021. Data from Jarden (2022); used with permission.
In a 2015–2016 review, the government concluded the NZ ETS had not impacted significantly on mitigation in non-forestry sectors and the impacts on forestry mitigation were more pronounced in 2011 and 2012. This outcome was attributed to sustained low emissions prices and policy uncertainty (MfE, 2016). In 2019, the government projected the NZ ETS would contribute mitigation of 2.9 Mt CO2e in 2020, of which roughly 73% could be attributed to the forestry sector. This compared with projected national gross emissions of 81 Mt CO2e in 2020 (MfE, 2019).5
The NZ ETS covers forestry at a sectoral scale, in contrast to other systems that recognize forestry projects as offsetting activities. It applies mandatory liabilities for deforestation of pre-1990 forest (defined below) and the option to earn units for post-1989 afforestation.6 Eligible forest land must be at least one hectare in size with tree crown cover of more than 30 percent in each hectare, from forest species that can reach at least 5 m in height when mature, with an average width of at least 30 m. This includes land that is likely to revert to meet those requirements, and excludes trees grown primarily for fruit or nut crop production (MPI, 2021a).
Eligibility to participate in the NZ ETS varies by the date and type of forest establishment. Land is classified as “pre-1990 forest” in the NZ ETS if it was forested on 31 December 1989 and remained forest land containing mostly exotic forest species on 31 December 2007. Indigenous pre-1990 forests are not included as “pre-1990 forest” in the NZ ETS. Owners7 of pre-1990 forest land become compulsory participants in the NZ ETS if their land is deforested (i.e., cleared and converted to another land use). Upon deforestation, they must notify the Ministry for Primary Industries (MPI) of the deforestation and surrender NZUs equivalent to the full reduction in carbon stock. Exemptions from deforestation liabilities apply. Harvesting pre-1990 forest does not incur any unit liabilities provided the land is re-established and remains in forest. As noted, owners of pre-1990 forest land were eligible to receive a fixed amount of free allocation of NZUs. Applications for free allocation for forestry closed in November 2011 and the NZUs were provided in two tranches in 2008 and 2013 (MPI, 2021a).
The option for “pre-1990 offsetting” was introduced in the 2012 amendments. This was designed to allow landowners to “move” pre-1990 forests from land that would be best used for other purposes (e.g., agriculture) while maintaining previous levels of carbon storage. An offsetting forest must cover at least an equivalent area, sequester at least an equivalent amount of carbon over the usual forest rotation for the existing forest, and be established on eligible post-1989 land or deforested pre-1990 land that has satisfied any relevant carbon liability (MPI, 2016a).
Land is defined as “post-1989 forest” if it is currently forest and was either (1) not forest land on 31 December 1989, (2) deforested between 1 January 1990 and 31 December 2007, or (3) pre-1990 forest land that was deforested after 31 December 2007 with any NZ ETS liability paid. Registration of post-1989 forest in the NZ ETS is voluntary. The eligible party can be the landowner (or alternatively the leaseholder or forestry rights holder upon agreement) or a party to a Crown conservation contract. In the case of forests registered before 2019, parties apply “stock change” accounting: they can claim NZUs for the carbon that is sequestered as their forest grows but must surrender NZUs as their carbon stock decreases. Upon deregistration from the NZ ETS, the NZUs issued for that forest must be surrendered. Unit liabilities for post-1989 forest cannot exceed the net number of units received for that forest.
Under the 2020 amendments, two new forestry classifications and sets of accounting rules will apply to post-1989 forest registered from 1 January 2023. “Standard” post-1989 forests will apply “averaging” accounting, under which participants earn NZUs as their forest grows up to the long-term average level of carbon stocks over multiple forest rotations. They do not have to surrender units for harvesting and do not earn further units following replanting. Compared to stock change accounting, averaging accounting generates more units that are available for trading without the risk that the underlying carbon removals will face future surrender liabilities. From 2023, owners of standard post-1989 forests can opt to use post-1989 offsetting to avoid deforestation liabilities. “Permanent” post-1989 forests are restricted from deforestation and clear-fell harvesting for at least 50 years and earn units using stock change accounting. From 1 January 2024, the new permanent post-1989 forestry activity will replace the Permanent Forest Sink Initiative (PFSI) enacted in 2006 (discussed below). Post-1989 forests registered during the transition period from 2019 through 2022 can choose between stock change and averaging accounting. The introduction of averaging accounting and the new permanent forest activity was intended to incentivize greater afforestation, longer rotation lengths in production forests, and increased investment in permanent forests (Te Uru Rākau, 2018a; MPI, 2019a; Cortes-Acosta et al., 2020). The implications of these changes are analyzed further below.
In the NZ ETS, the eligibility of afforestation for crediting is determined by the date of forest establishment. This aligns with the forestry accounting rules under New Zealand’s international targets and national GHG inventory. This contrasts with project-based crediting mechanisms which seek to determine the “additionality” of afforestation relative to “business as usual” using counterfactual baselines. While the NZ ETS approach could reward landowners for forest establishment that might have happened anyway for reasons beyond emissions pricing, it also reduces administrative costs significantly and makes participation much simpler relative to project-based additionality assessment. The approach in the NZ ETS does not compromise the integrity of compliance with New Zealand’s international targets, which is determined on the basis of observed net removals reported in the national GHG inventory under target accounting rules.
Distinctive compliance requirements apply to the forestry sector. For pre-1990 forests, parties must notify MPI within 20 days of deforestation and submit an emissions return by 31 March in the following year. The date of deforestation is the date either on which conversion begins to another land use, or on which the land fails to meet specified thresholds for replanting or regeneration at 4, 10, and 20 years after clearance. The potential lag between clearance and notification of deforestation can permit flexibility around decisions to replant or convert. For post-1989 forests, emissions returns must be submitted to cover each Mandatory Emissions Reporting Period (MERP) − typically 5 years. Emissions returns are due by June in the following year. Requiring carbon stock reporting at a minimum of once per MERP helps reduce transaction costs. Participants can voluntarily submit annual emissions returns within each MERP, enabling earlier receipt of NZUs. Emissions returns are also required when making changes to the registration (e.g., deregistering from the NZ ETS, deforesting the land, selling the land, or granting a forestry lease or right). As a result of this framework, the timing for reporting of forest carbon stock changes in the NZ ETS does not necessarily align with their timing on the ground or in New Zealand’s national GHG inventory.
Participants are liable to surrender to the government an equivalent number of units if the credited forestry removals are reversed (per rules for stock change and averaging accounting), upon deregistration of the forest, or if registered permanent post-1989 forest is clear-felled within a period of at least 50 years (in this case, further penalties also apply). The unit repayment liability in these cases reduces emissions elsewhere in the system. This is intended to ensure landowners compensate for any reversals of credited forestry removals in a way that maintains the original benefits to the climate. This contrasts with project crediting mechanisms which typically maintain a buffer of uncredited forest reserves to compensate for future reversals.
The effectiveness of the approach in the NZ ETS depends on the government’s ability to enforce the unit repayment liability in perpetuity. In legislation, if the registered NZ ETS participant changes due to the sale or inheritance of land, or changes in registered forestry rights or leases, the NZ ETS liability stays with the land.8 The status of land affected by the NZ ETS must be registered with the land title (MPI, 2021a).9 The legislation clarifies liabilities for directors and managers of companies as well as for companies and persons when others act on their behalf. Questions have been raised about whether the legislated provisions are adequate to manage circumstances such as the insolvency of a limited liability company or the death of a liable individual (Yule, 2022).
Some transitional measures have applied to forestry reporting and compliance. To allow time for institutional development and capacity building, forestry participants had until May 2011 to submit their first emissions returns covering activities since 2008 (Leining et al., 2017a). As post-1989 forestry transitions into new rules from 2023, reduced penalties will apply initially for failure to surrender or repay units (MPI, 2021a).
MPI has prepared look-up tables10 that are used when a participant is reporting emissions and removals. These tables report forest carbon stocks for different forest species and age classes by region. Their use is mandatory for all deforestation of pre-1990 forest. For post-1989 forests, look-up tables must be used by participants with less than 100 hectares. For those with 100 or more hectares, participants must use a Field Measurement Approach involving sample plots. Participants must map the forest areas they register (MPI, 2021a).
The forestry sector has had a distinctive experience with linking. In the system’s initial design, all sectors could buy from and sell to the international Kyoto market. For export, NZUs first had to be converted to New Zealand Assigned Amount Units (NZ AAUs).11 In 2009, the government restricted unit exports to forestry NZUs (after conversion to NZ AAUs) to reduce arbitrage opportunities at taxpayer expense under the new fixed-price option (Leining et al., 2017b). A total of 1.2 million forestry NZUs were transferred offshore in 2009 and 2010 (EPA, 2022). The first parcel of 520,000 forestry NZUs was sold by a New Zealand forestry company, Ernslaw One, to the Norwegian government at a unit price of about NZ$22 (€10) (Carbon News, 2009; Leining et al., 2017b).
ETS linkage also affected the forestry sector as a buyer of offshore mitigation. Once NZUs outpriced offshore Kyoto units, large numbers of forestry participants chose to deregister from the NZ ETS, surrender low-cost Kyoto units (thereby clearing any unit liabilities for future harvests), and sell or bank the more valuable NZUs they originally earned. In 2013, 346 post-1989 forest participants claimed NZUs and then deregistered, surrendering 8,520,089 units (many from sequestration in the period 2008–2012). A further 28 participants then reregistered in 2014, making them eligible to receive a repeat allocation of 985,654 NZUs for removals in 2013 (EPA, 2014a). Some participants who benefited from the arbitrage opportunity may have surrendered NZUs for other reasons, such as harvesting; however, any harvesting would have been of trees no older than 23–24 years. As this is relatively young to harvest, it is unlikely that this was widespread. To close this loophole, the government amended the legislation in 2014, requiring post-1989 forestry participants to meet NZ ETS obligations using only NZUs.12
Other afforestation policies have operated alongside the NZ ETS with variable degrees of separation, including:
• Erosion Control Funding Program: Formerly known as the East Coast Forestry Project, this began in 1992 and provided grants for tree planting on erosion-prone land in the Gisborne district. To date, 40,342 hectares have been established. This was superseded in 2018 by the One Billion Trees Program (MfE, 2022a).
• Permanent Forest Sink Initiative (PFSI): Enacted in 2006, this enabled post-1989 forest owners to earn emissions units13 from 1 January 2008 for land registered under a permanent forest covenant. Limited harvesting was allowed and covenants could be terminated after 50 years. Participants were liable for net losses in credited carbon stocks. Units were eligible for trading in the NZ ETS. This will be replaced by the NZ ETS permanent forest activity in 2024. To date, 15,584 hectares have been registered, of which over 70% was natural forest (MPI, 2015a,2022b; MfE, 2022a).
• Hill Country Erosion Program: Starting in 2008, this provided funding to regional and local councils for projects supporting small-scale afforestation, reversion to indigenous forest, and other measures on erosion-prone hill country land. To date, 5,882 hectares of forest have been established out of 16,289 hectares of plantings (MPI, 2022b).
• Afforestation Grant Scheme (AGS): This provided grants of NZ$1,300 per hectare to establish new post-1989 forest. The government retained the associated emissions units for the first 10 years. This was implemented in two phases: 2008–2013 (with 9,343 hectares) and 2015–2020 (with 7,846 hectares). This was superseded in 2018 by the One Billion Trees Program (MfE, 2022a; MPI, 2022b).
• One Billion Trees Program: Enacted in 2018, this included a grant scheme and partnership fund intended to double the forest planting rate and establish one billion trees by 2028. Some of the funding was reallocated and the fund closed in 2021. By the end of 2020, about 258.7 million trees were planted. The base rates ranged from NZ$1,000/ha for indigenous regeneration to NZ$1,500/ha for exotic species, NZ$1,800/ha for indigenous mānuka/kānuka, and NZ$4,000/ha for an indigenous mix. Top-ups rewarded further benefits for erosion control or ecological restoration. Provided they were eligible, funded forests also could be registered in the NZ ETS immediately except for Pinus radiata, which could not be registered for the first 6 years from (and including) the year of planting (Te Uru Rākau, 2018b,2021a; MfE, 2022a; MPI, 2022b).
Beyond New Zealand, forestry-derived offsets are accepted in many emissions trading systems. Key examples include California, the Chinese national system and multiple Chinese pilot systems, Kazakhstan, Mexico, the Regional Greenhouse Gas Initiative in the northeast United States, and Saitama. Forestry offsetting regulations are in development in Québec. Unlike the NZ ETS, these systems do not cover forestry as a sector, nor do landowners face compliance obligations (ICAP, 2022). Other countries may wish to consider New Zealand’s innovative approach.
We reviewed relevant literature and used descriptive statistics to evaluate the response of the forestry sector to the NZ ETS. Specifically, we examined trends in NZ ETS participation and registration as well as deforestation and afforestation both inside and outside the system. Additionally, we examined forest growth cycles and the financial gains to landowners from earning NZUs, alongside temporal trends in timber and emissions prices. We included data up to 2020 where possible and have otherwise used the most recently available data.
New Zealand ETS participants include pre-1990 forest owners who deforest and post-1989 forest owners (or delegated entities) who opt in. Pre-1990 forest owners who received free allocation of NZUs are not considered NZ ETS participants in legislation but are still relevant to our analysis. We obtained the number of NZ ETS participants by forest-land classification (i.e., pre-1990 and post-1989) on a financial-year basis from EPA (2021). Information on the proportion of registered post-1989 participants by size class of forest as of 2016 was sourced from MPI (2016b). For comparison, we obtained data on the total number of forest owners and the total area of exotic forest at the national level by size class of forest from the 2016 National Exotic Forest Description (NEFD) survey (MPI, 2016c).14 We obtained data on the proportion of pre-1990 forest land receiving free allocation of NZUs and the proportion of eligible post-1989 forest land registered in the NZ ETS from EPA (2013, 2014b, 2015, 2016, 2017, 2018) and MPI (2018). We also obtained data on the area of post-1989 forest land added to or removed from the NZ ETS, alongside annual changes in participant registrations, on a calendar-year basis from MPI (2018). Note that some post-1989 forest, such as wilding pines, cannot be registered in the NZ ETS.
Under the NZ ETS, deforestation means the conversion of forest land to non-forest land and excludes conversion between types of forest. We obtained data on observed annual deforestation for pre-1990 and post-1989 forest land, by forest type (i.e., natural or planted), at the national level for 1990–2020 from MfE (2022a). This source also reported participation in pre-1990 offsetting (available from 2013). Data on notified annual deforestation for pre-1990 forest land in the NZ ETS for 2008–2018 were obtained from EPA (2017, 2018).
To further explore deforestation decisions by forest owners, we obtained data on the area-weighted average deforestation age on pre-1990 forest land for the period 2008–2014 (MPI, 2016b). We also reviewed surveys of forest owners’ deforestation intentions from 2007 to 2020 (Manley, 2006, 2008, 2009, 2010, 2011, 2012, 2013, 2014, 2015, 2016a, 2017, 2018a, 2021). While the surveys have acknowledged limitations, they provide valuable insights into drivers of behavior change by forest owners before and after the NZ ETS was introduced.
We obtained national data on annual post-1989 afforestation for 1990–2020 from MfE (2022a). To compare outcomes against expectations, we reviewed earlier studies that had modeled potential afforestation rates in response to the NZ ETS (Manley and Maclaren, 2009; Adams and Turner, 2012; Kerr et al., 2012; Manley, 2016b; MPI, 2016b).
We analyzed forest harvest and replanting cycles for owners of small and large forests using data from MPI (2015b). We assumed that small forest owners harvest all at once due to economies of scale in harvesting and large forest owners have an even distribution of planting age. These assumptions allow large owners only to meet the liabilities incurred at harvest in one area using NZUs earned by other areas of forest land they own.
We then analyzed the level of “low-risk” NZUs for owners of small and large forests, defined as the minimum level of carbon that occurs after harvesting, assuming replanting (Manley, 2016b). For large forest owners, we calculated the long-run “low-risk” level of NZUs by replacing NZUs from a hectare of forest planted after 2008 with those from a hectare of forest that is one rotation younger, using the example of a uniformly distributed forest in the Waikato/Taupō region using a 30-year harvest age. We chose this region because the sequestration rate in forests in Waikato/Taupō are reasonably representative of forests in the North Island. For small forest owners, the long-run “low-risk” level of NZUs was calculated with the per-hectare levels of carbon stock of established Pinus radiata and of above-ground residual wood and below-ground roots of cleared Pinus radiata (MPI, 2015b). We assumed the carbon stock of the latter linearly decreases over 10 years to zero. As sequestration before 2008 does not earn NZUs, when a forest planted before 2008 is cleared, the owner must repay the NZUs equivalent to the carbon stock of their cleared forest upon harvest up to the level of NZUs previously earned. The amount of NZUs earned from 10 years of growth less the NZUs earned as at 2008 was used as an estimate of the number of NZUs that were “low-risk” for sale since the underlying carbon stocks would not face future harvest liabilities.
We analyzed interactions between afforestation rates and the prices of NZUs and timber. We applied annual average NZU prices in the NZ ETS using data from Jarden (2022). We determined the price of timber for the period 1990–2018 using the “Logs and poles” category from MPI (2019b). We converted nominal prices to real prices (2006 $NZ) using the June Producer Price Index (PPI) specific to Forestry and Logging from StatsNZ (2022). Because a forestry-specific PPI was not available for the period 1990–1994, we used an aggregated PPI instead for these years (also from StatsNZ, 2022). We used the Land Use in Rural New Zealand (LURNZ) model (Kerr and Olssen, 2012) to determine the equivalent increase in timber price at harvest that would increase net present value (NPV) of revenue by the same amount as NZU revenue would.
We combined these prices to calculate the “effective” timber price per cubic meter for the period 2008–2014: the price of timber including the value of NZUs that could have been expected during the period if the owner sold only up to the “low-risk” level (which in this case equates to selling only the first 10 years’ worth of NZUs).
The value of NZUs was calculated as the net future value (NFV) at time of harvesting using average CO2 flows over all regions (MPI, 2015b). This calculation assumed a discount rate of 8%, a rate of growth in emission prices of 5%, and that forest owners only sell NZUs up to the “low-risk” level. We also calculated the net present value (NPV) from the sale of “low-risk” NZUs, assuming an NZU price of NZ$20. For this calculation we used the unweighted regional average carbon stock from MPI (2015b) and a real discount rate of 8%.
To assess expectations for the future contribution from forestry toward New Zealand’s net emissions, we reviewed assessments based on modeling of afforestation potential under different target and emissions pricing assumptions by New Zealand Productivity Commission (2017), Parliamentary Commissioner for the Environment (2019), MfE (2019), CCC (2021), and MPI and MfE (2022).
All pre-1990 forest that is deforested (subject to minor exemptions) is automatically included in the NZ ETS. We found that almost 90 percent of pre-1990 forest land had received free allocation of NZUs by 2018 (Table 2); free allocation is no longer provided.
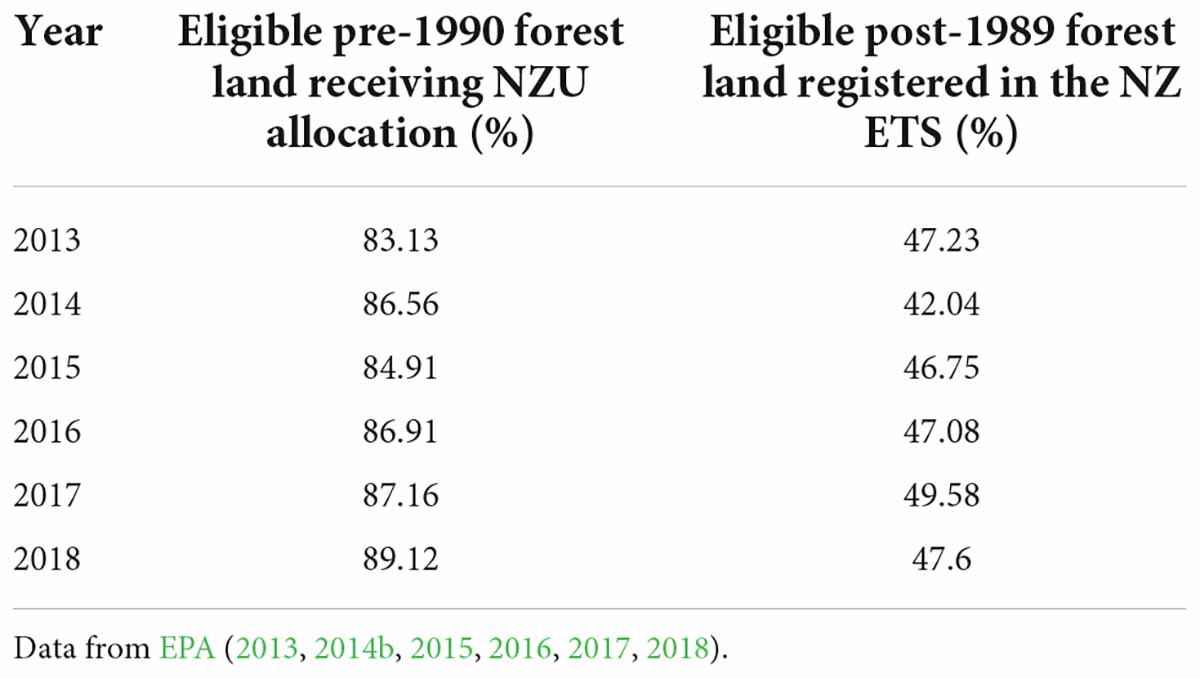
Table 2. Proportion of eligible pre-1990 forest land receiving NZU allocation and proportion of eligible post-1989 forest land registered in the NZ ETS.
The amount of post-1989 forest land registered in the NZ ETS has been significant but lower than anticipated. In 2016, a mid-range government scenario projected 56% of post-1989 forest would be registered by 2021 (MPI, 2016b). The percentage of post-1989 forest land voluntarily registered in the NZ ETS over 2013–2018 is shown in Table 2. As of December 2021, about 50% of post-1989 forest (349,076 hectares) was in the NZ ETS (Te Uru Rākau, 2021b). A further 5% (32,773 hectares) was in the PFSI or AGS, which offered similar incentives (MfE, 2022a). Notably, fewer than 20% of commercial plantations (operating across pre-1990 and post-1989 forest) were actively involved in the NZ ETS as of 2018 (Forestry Reference Group, 2018).
We also examined post-1989 forest registration by year of forest establishment over 1990–2014. Across all age classes, a significant portion of planted forest remained outside the NZ ETS (Figure 2). Because forests only earn “low-risk” NZUs for the first 10 years of growth under stock-change accounting, we would expect there to be a greater incentive to register younger forests (that are intended to be harvested).
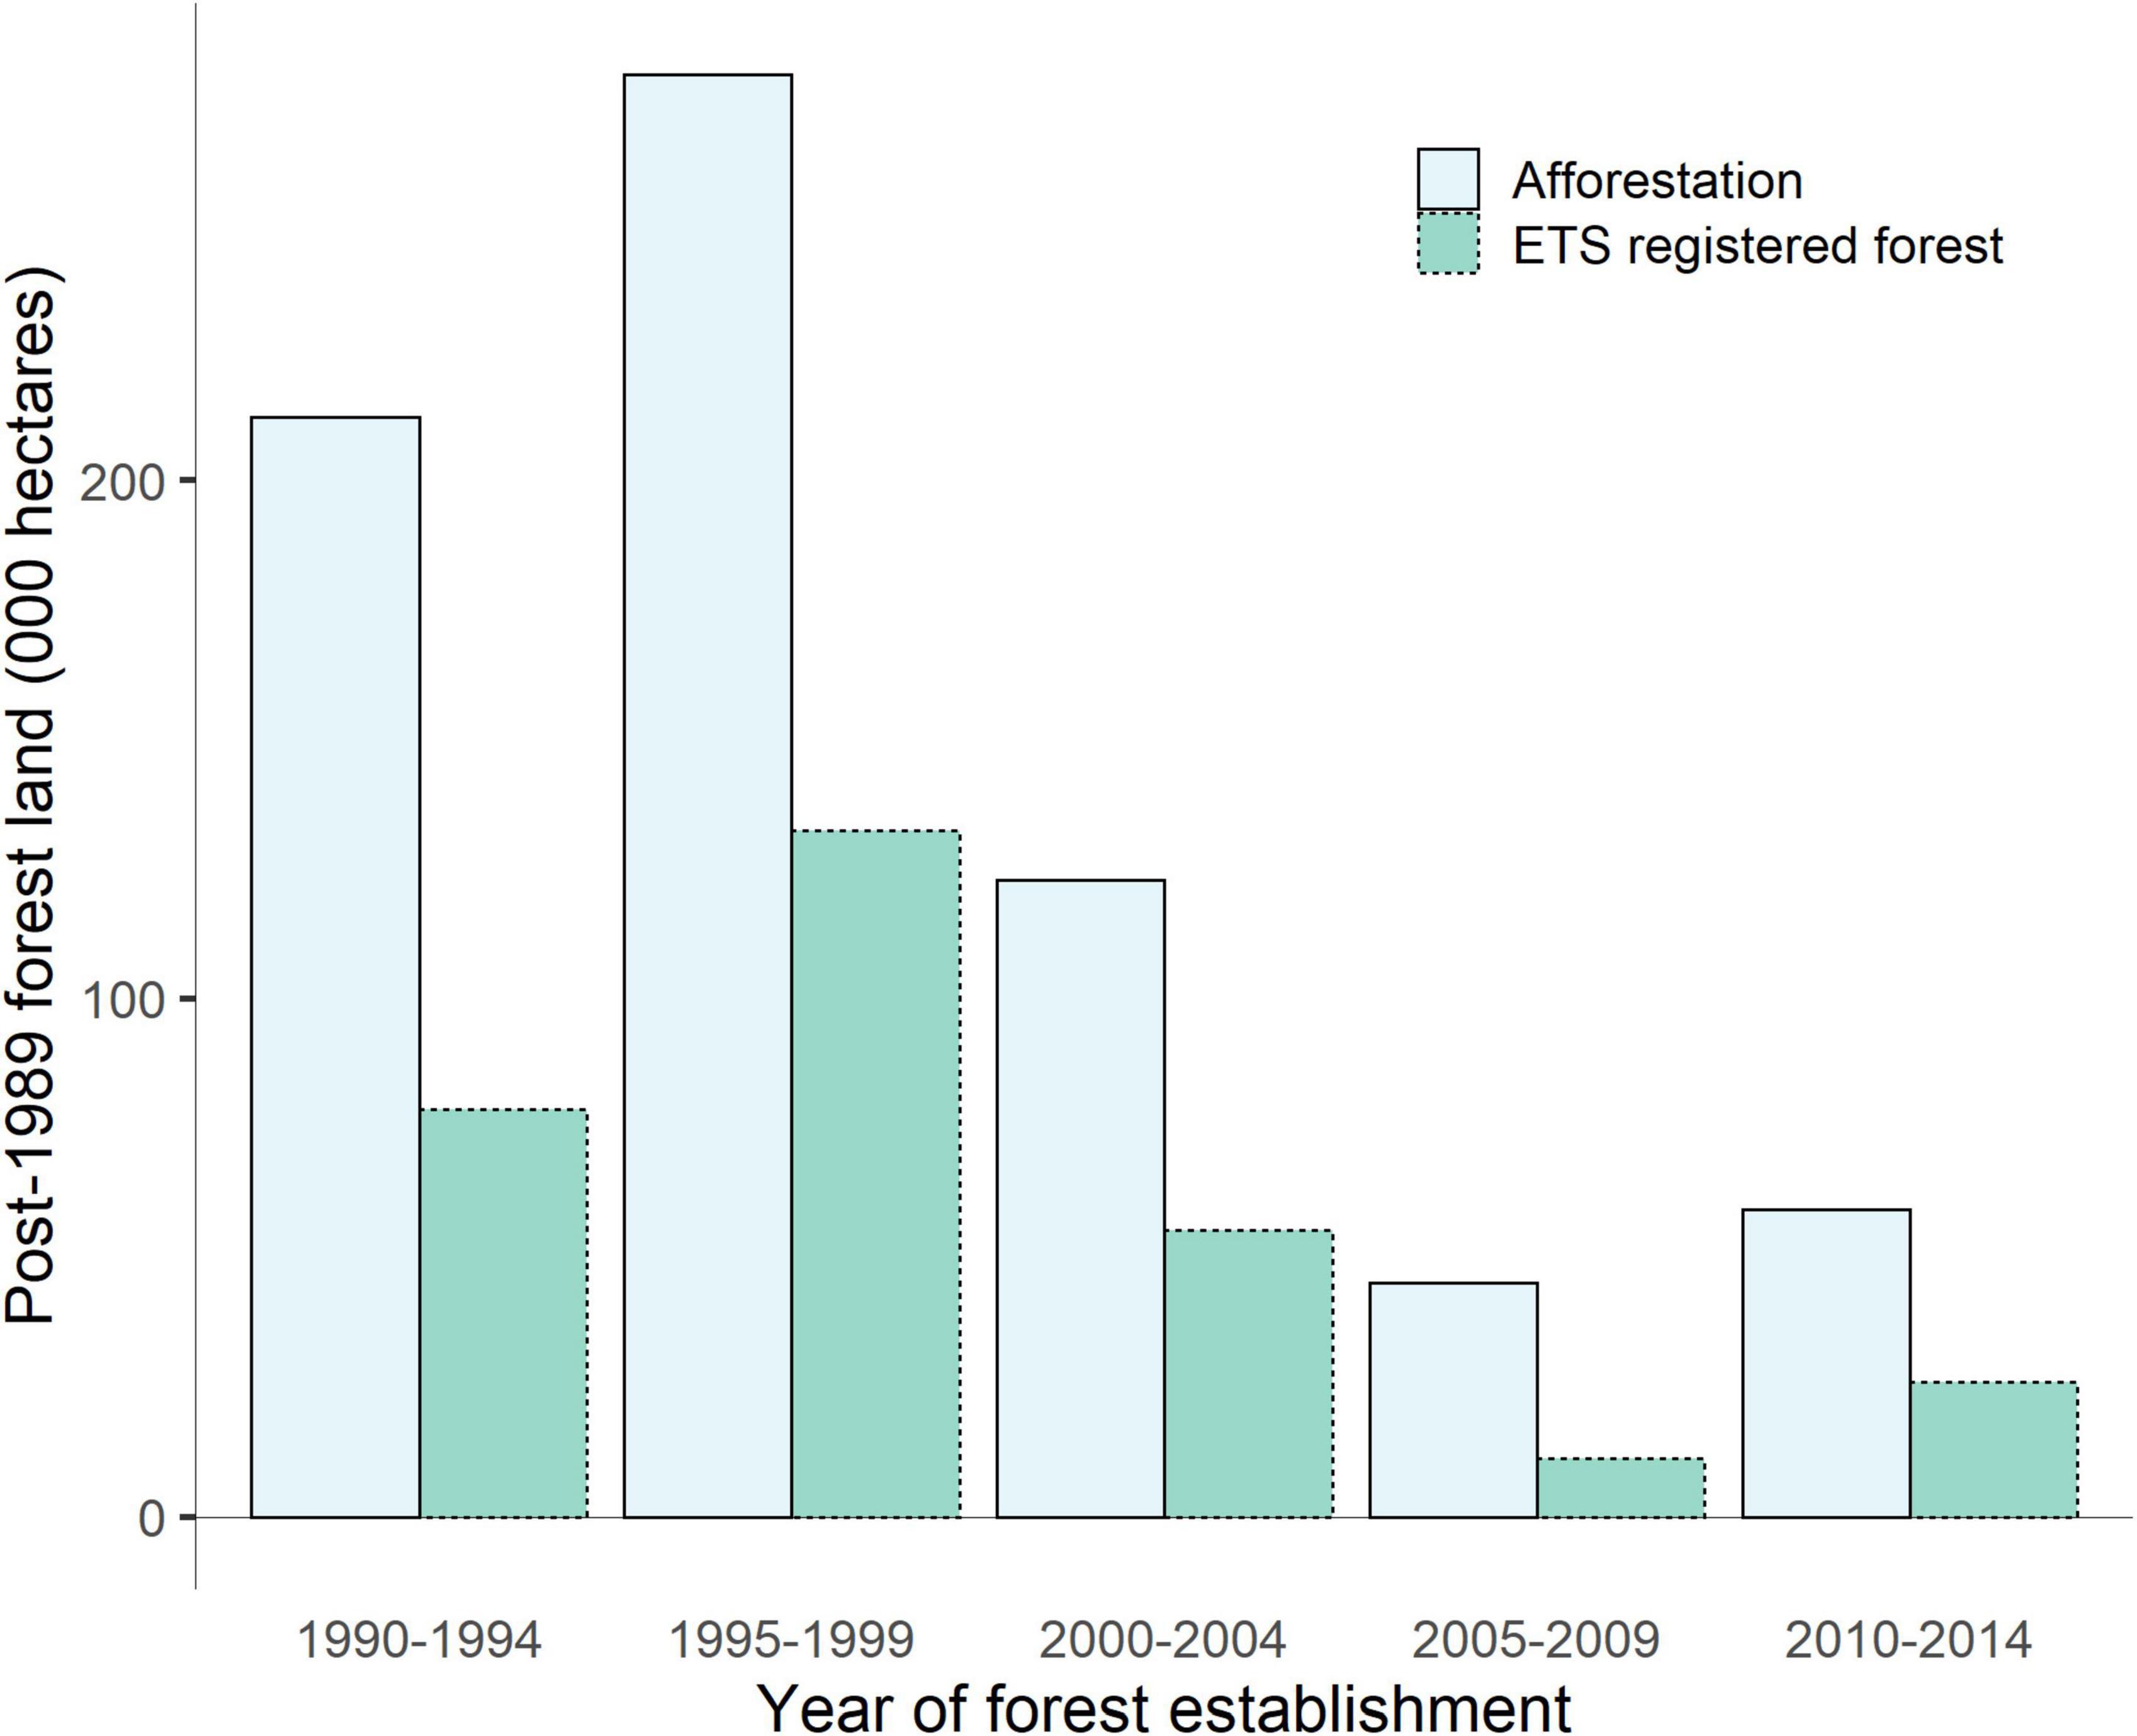
Figure 2. Estimated annual area of afforested and voluntarily registered post-1989 forest land in the NZ ETS by year of forest establishment. Data from MPI (2016b) and MfE (2022a).
We also examined landowner participation in the NZ ETS. Participation in the system was initially low, and the net number of participants added annually was highly variable with a notable peak in post-1989 participants in reporting year 2011/2012 (Figure 3). However, the number of new post-1989 participants registered per year was relatively low from that point through 2020/2021. On a calendar-year basis, we compared data on total post-1989 participants with data on the total area of post-1989 forest registered as well as the annual area added and removed over 2010–2017 (Figure 4). We found that the relatively low level of new post-1989 participants registered per year followed a similar pattern to the total area registered. The notable decline in registered post-1989 land area (and increase in post-1989 land area removed from the NZ ETS) in 2013 was the result of a wave of deregistration catalyzed by access to low-cost offshore mitigation, as discussed above.
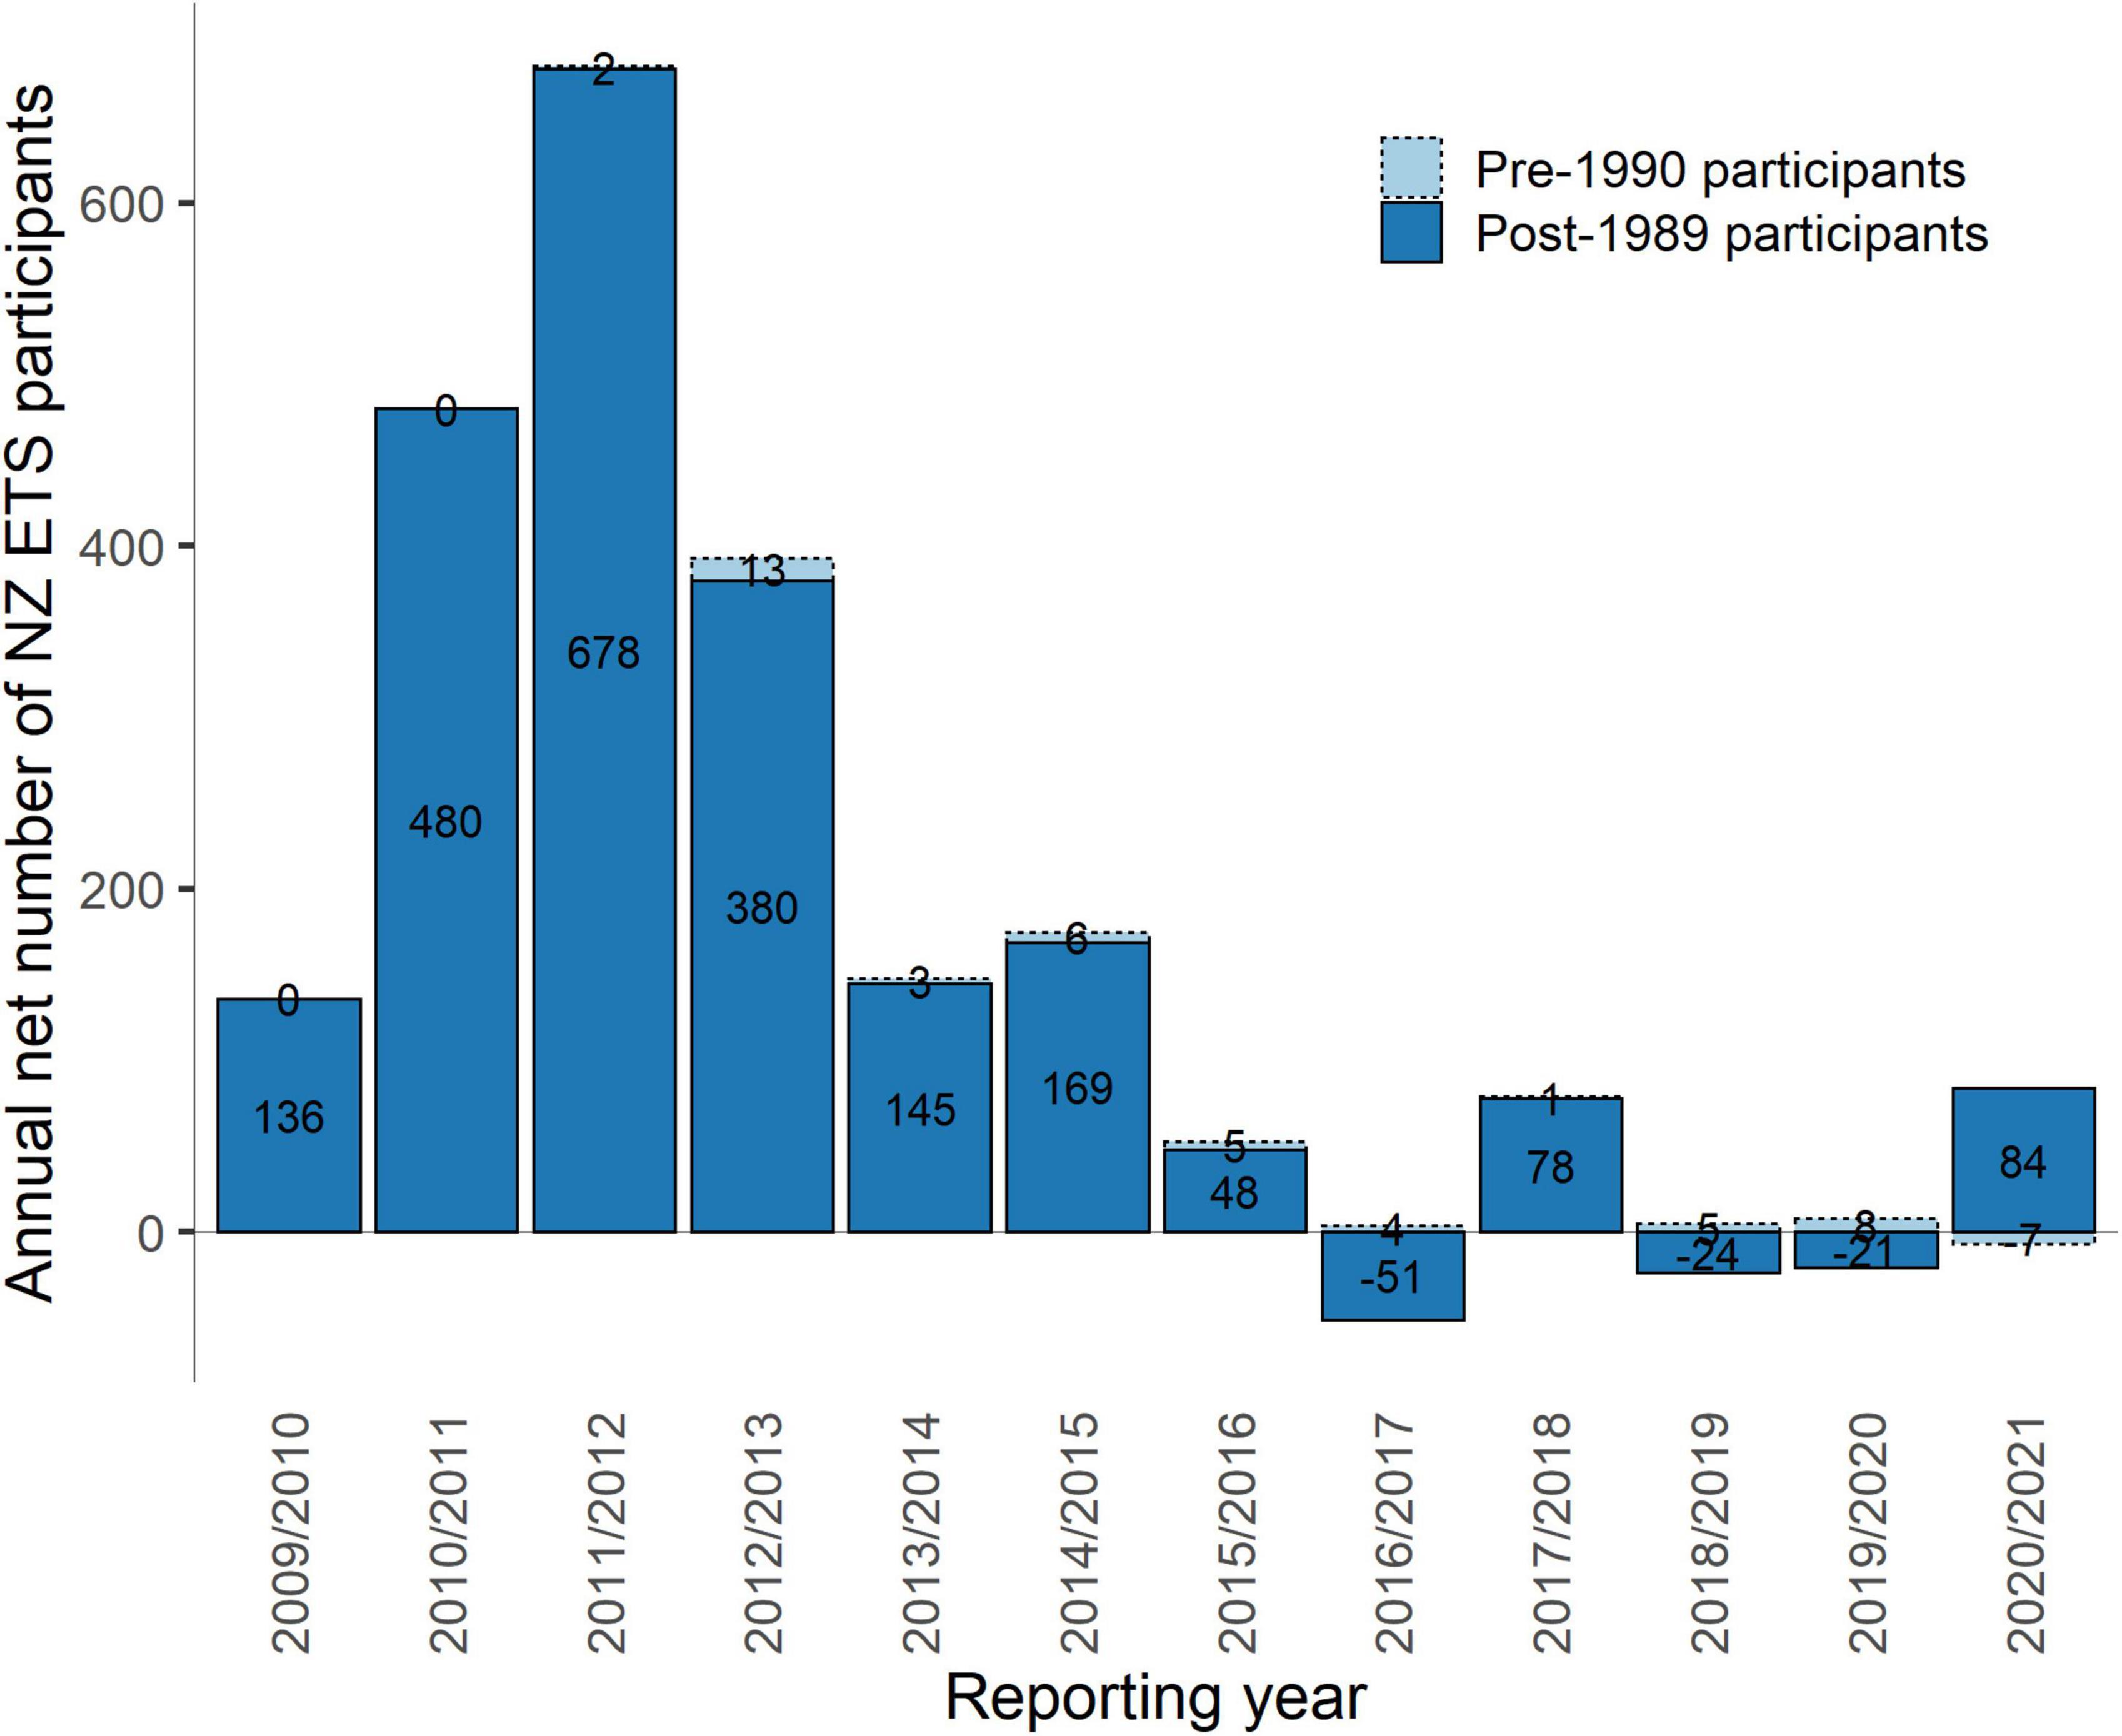
Figure 3. Annual net number of NZ ETS participants (i.e., the number of added participants minus any removed participants) for pre-1990 and post-1989 forest land by reporting year. Note the number of pre-1990 forestry participants reflect those who reported deforestation. The reporting year runs from 1 July to 30 June. Data from EPA (2021).
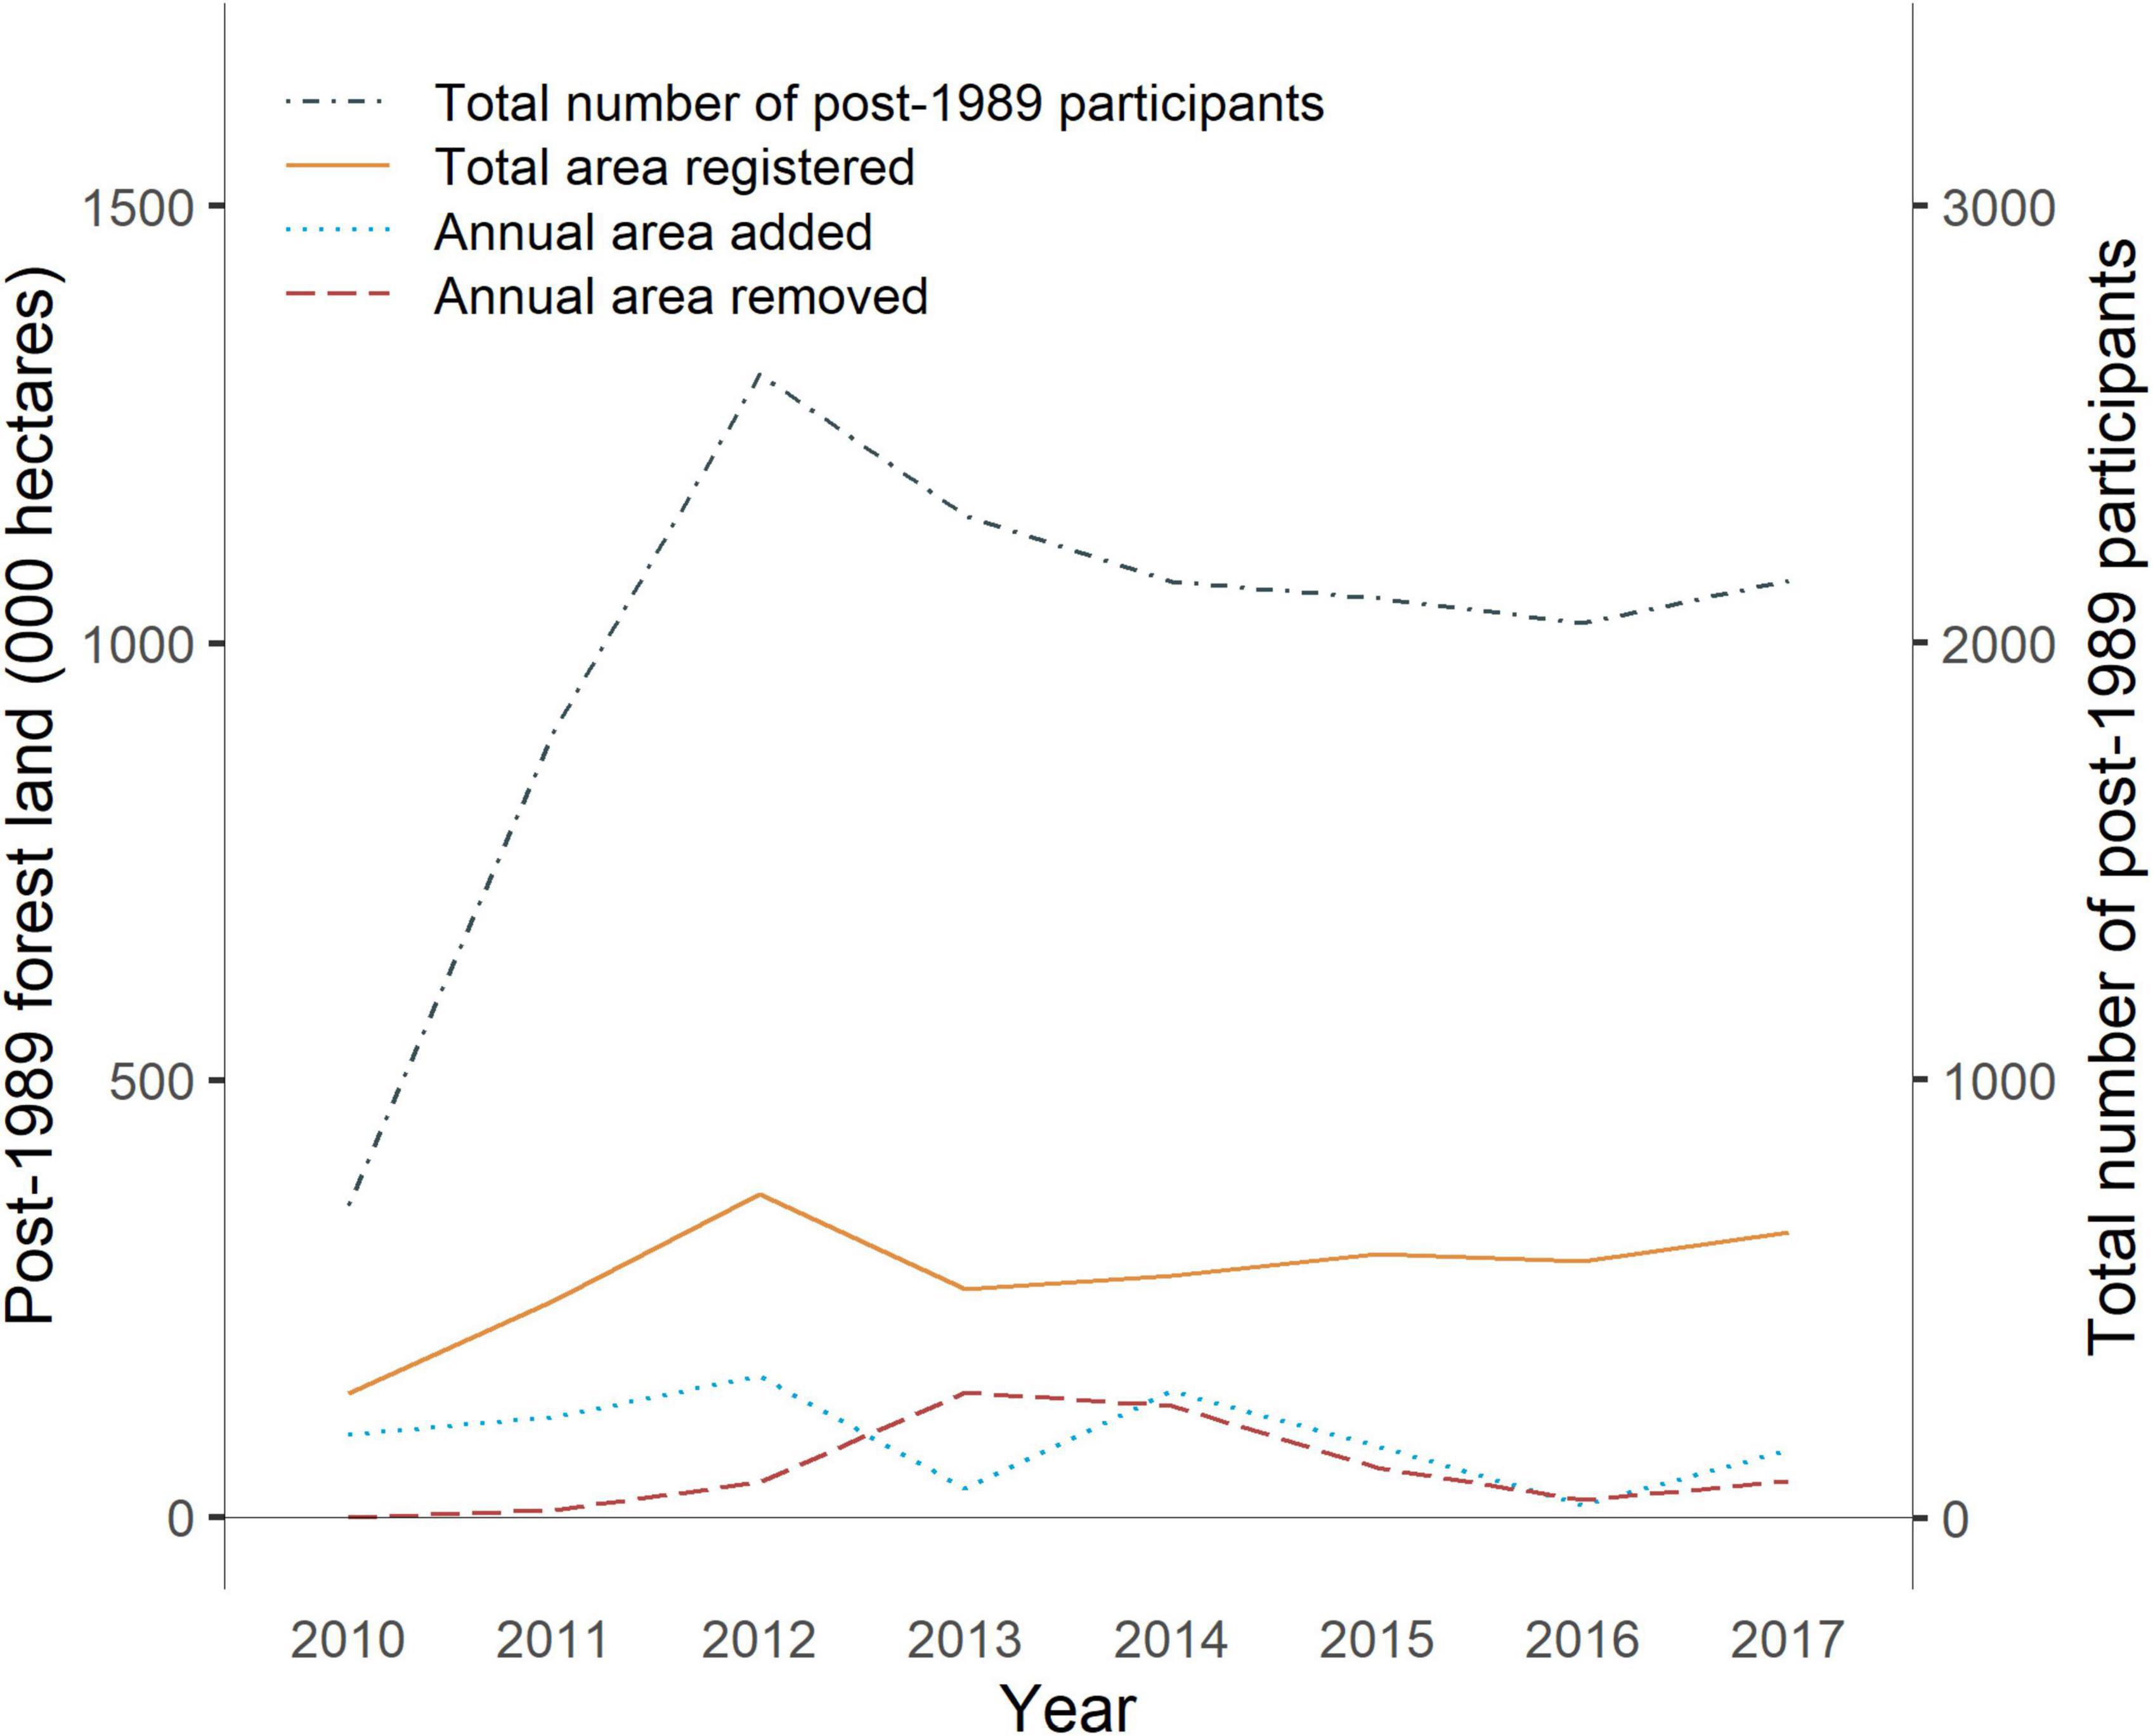
Figure 4. Area and participants for post-1989 forest land registered in the NZ ETS. Note that all values are based on a calendar year. Data from MPI (2018).
We found that landowner participation and registration of forest land differed by size class of forest (Table 3). The owners of forests in the smallest size class (less than 99 hectares) accounted for 82 percent of registered post-1989 participants (1,792 owners) whereas the owners of forests in the largest size class (more than 1,000 hectares) only accounted for 2 percent (45 owners). Forests in both these size classes accounted for a similar percentage (approximately 14 percent each), in terms of land area, of post-1989 forest land registered in the NZ ETS as of April 2016. We estimate large forest owners could generate twice as many long-term “low-risk” NZUs than small forest owners (approximately 400 compared with 200 NZUs; Table 4 and Figure 5).
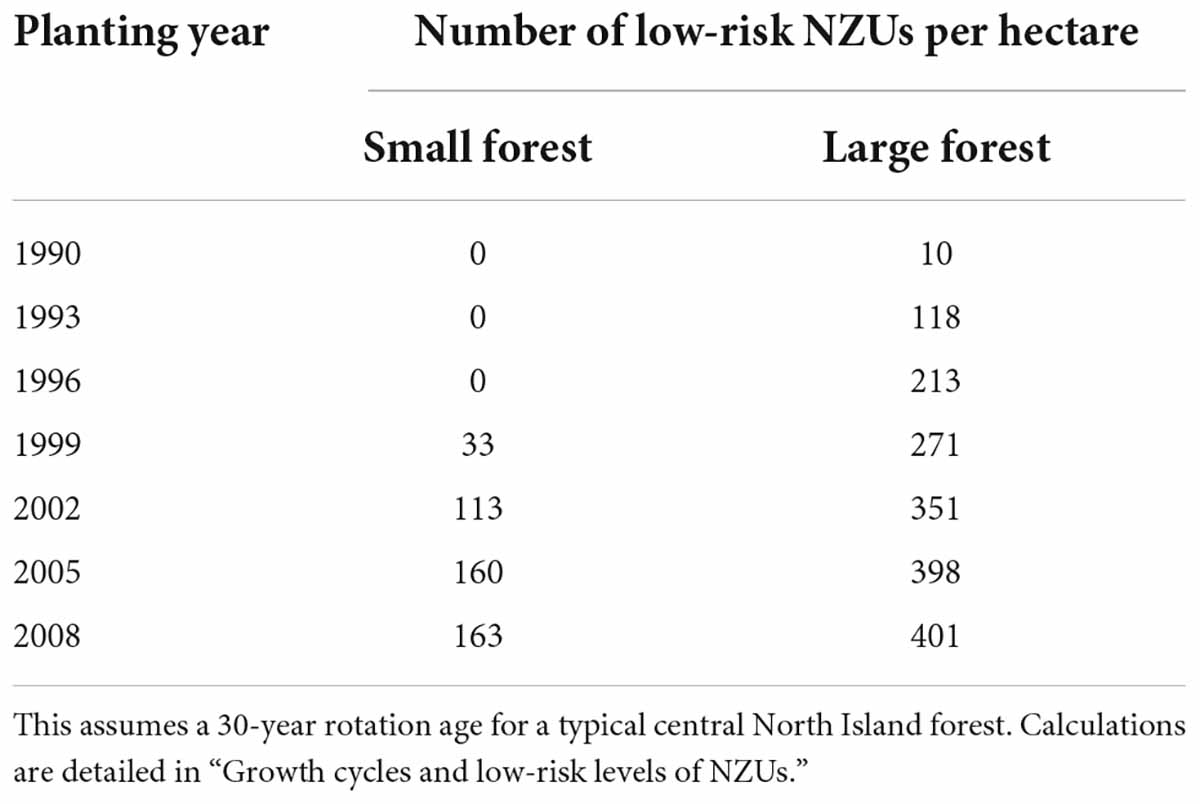
Table 3. Area and participants for post-1989 forest land registered in the NZ ETS by forest size class as of April 2016.

Table 4. Estimated long-term “low-risk” NZUs per hectare for owners of small and large forests, by year of planting.
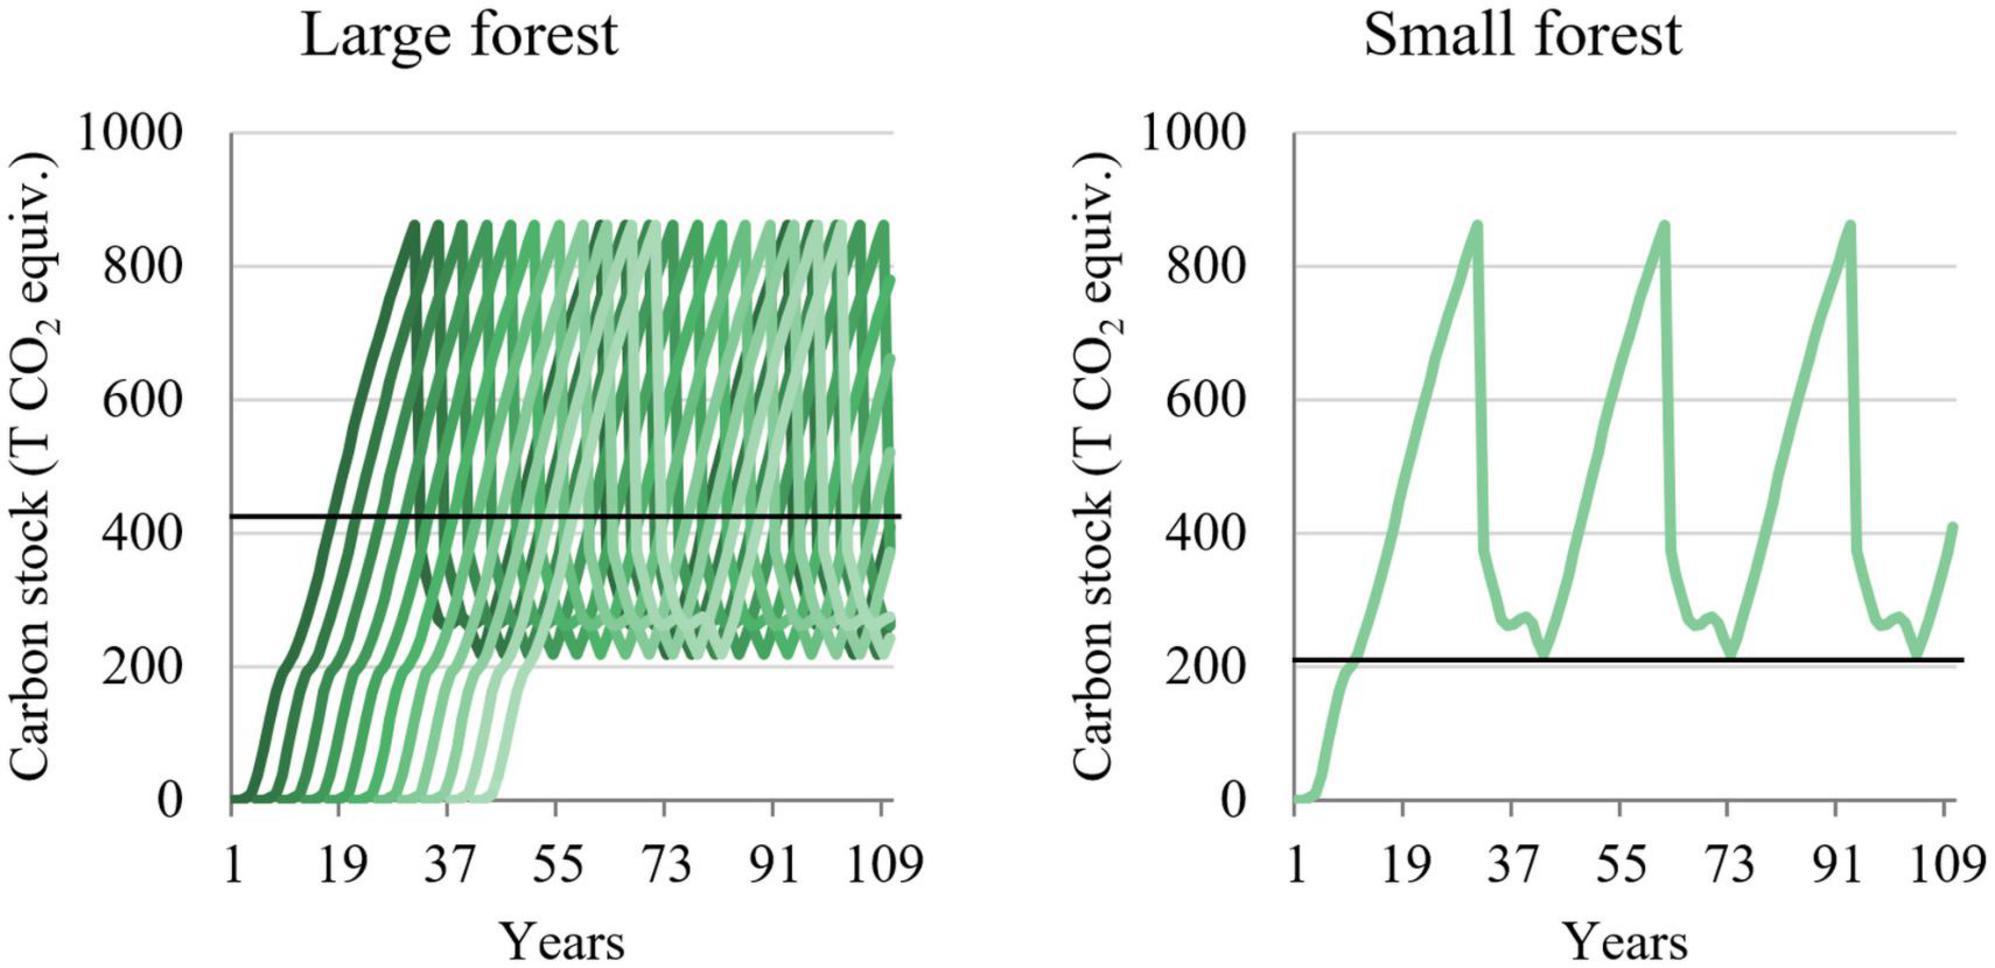
Figure 5. Forest growth cycles for small and large forest owners. This compares forest growth cycles for large and small forest owners for a “typical” hectare, represented as changes in carbon stock (tons of carbon dioxide) over time. The “low-risk” level of NZUs is indicated with a black horizontal line. This figure illustrates data from Pinus radiata forest in Gisborne. Data from MPI (2015b).
As of April 2016, we found that owners of small exotic forests (less than 99 hectares) were overrepresented in the NZ ETS (81 percent of post-1989 registered forest owners compared with 61 percent of forest owners nationwide), while exotic forest owners in the remaining size classes were underrepresented in the system. In contrast to landowner participation, we found that exotic forest land in the smallest and largest size classes (i.e., less than 99 hectares and more than 1000 hectares) was underrepresented in the NZ ETS, while the 100–499 hectare and 500–999 hectare size classes were overrepresented in the system.
However, we note two caveats when making these comparisons. First, the number of forest owners and the total area of exotic forest land were sourced from the NEFD (MPI, 2016c), and it is unclear how representative these data are of post-1989 forest land.15 Second, there may be double counting of forest owners in the national totals as these have been aggregated from regional numbers and some owners have forests in more than one region (this is more likely to be the case for owners of large forests). However, double counting of large forest owners would, if anything, underestimate the differences we observed between small and large forests in terms of participant numbers. Due to data limitations, our analysis did not extend to the 10% of post-1989 forest with indigenous species.
Te Uru Rākau (2021b) presents the distribution of post-1989 afforestation registered in the NZ ETS across Land Use Capability classes as of December 2021. This shows that 90% of post-1989 afforestation registered in the NZ ETS has been on Class 5, 6, or 7 land that is more suitable for production forestry than arable or pastoral production.
Our review of literature and policy documentation suggests that multiple factors have contributed to the observed registration rate in the NZ ETS. Owners of older post-1989 forests had little to gain by registering, since they were eligible for fewer “low-risk” NZUs. Government reviews and stakeholder submissions have pointed to the complexity of the rules, insufficiencies in expert advice, high administrative burdens and transaction costs to participate, and uncertainty about which land qualifies as post-1989 forest. Periods of low and unpredictable emissions prices during linkage to the Kyoto market, the potential cost of later land-use change once post-1989 forests are registered, and extended policy uncertainty about the future settings of the NZ ETS alongside evolving UNFCCC negotiations on forestry rules have also been identified as potential explanations (ETS Review Panel, 2011; MfE and Ministry for Primary Industries, 2012; MfE, 2016, 2020; Forestry Reference Group, 2018). Complex land ownership, management structures and development aspirations across Māori-owned land have also been barriers to registration in the NZ ETS (Pohatu et al., 2020).
As a significant new development, post-1989 forest registration requests from new participants and from those wishing to add land from existing registrations have increased dramatically since mid-2021. From the start of 2018 through mid-2021, when emissions prices ranged from approximately NZ$20-40 per ton, an average of 7,000 hectares per quarter were submitted for registration. In the second quarter of 2022, when emissions prices were over NZ$70 per ton, 80,000 hectares were submitted (MPI, 2022c).
Deforestation observed since 1990 for both pre-1990 and post-1989 planted forest was highest in the 2005–2007 period, ahead of NZ ETS implementation (Figure 6). This is consistent with research by (Dorner and Hyslop, 2014). The start of emissions pricing in 2008 brought a step-change reduction in deforestation, and it remained relatively stable until the prices of NZUs and offshore Kyoto units fell over 2011–2013. At that point, notified deforestation increased markedly (from 974 hectares in 2011 to 11,809 hectares in 2012) (Figure 7). Since 2013, as emissions prices have risen, both notified and observed deforestation have declined. In total, about 100,000 hectares of deforestation occurred over 2008–2020 (MfE, 2022a), and over 15,000 hectares of pre-1990 forest received exemptions from deforestation obligations in the NZ ETS.
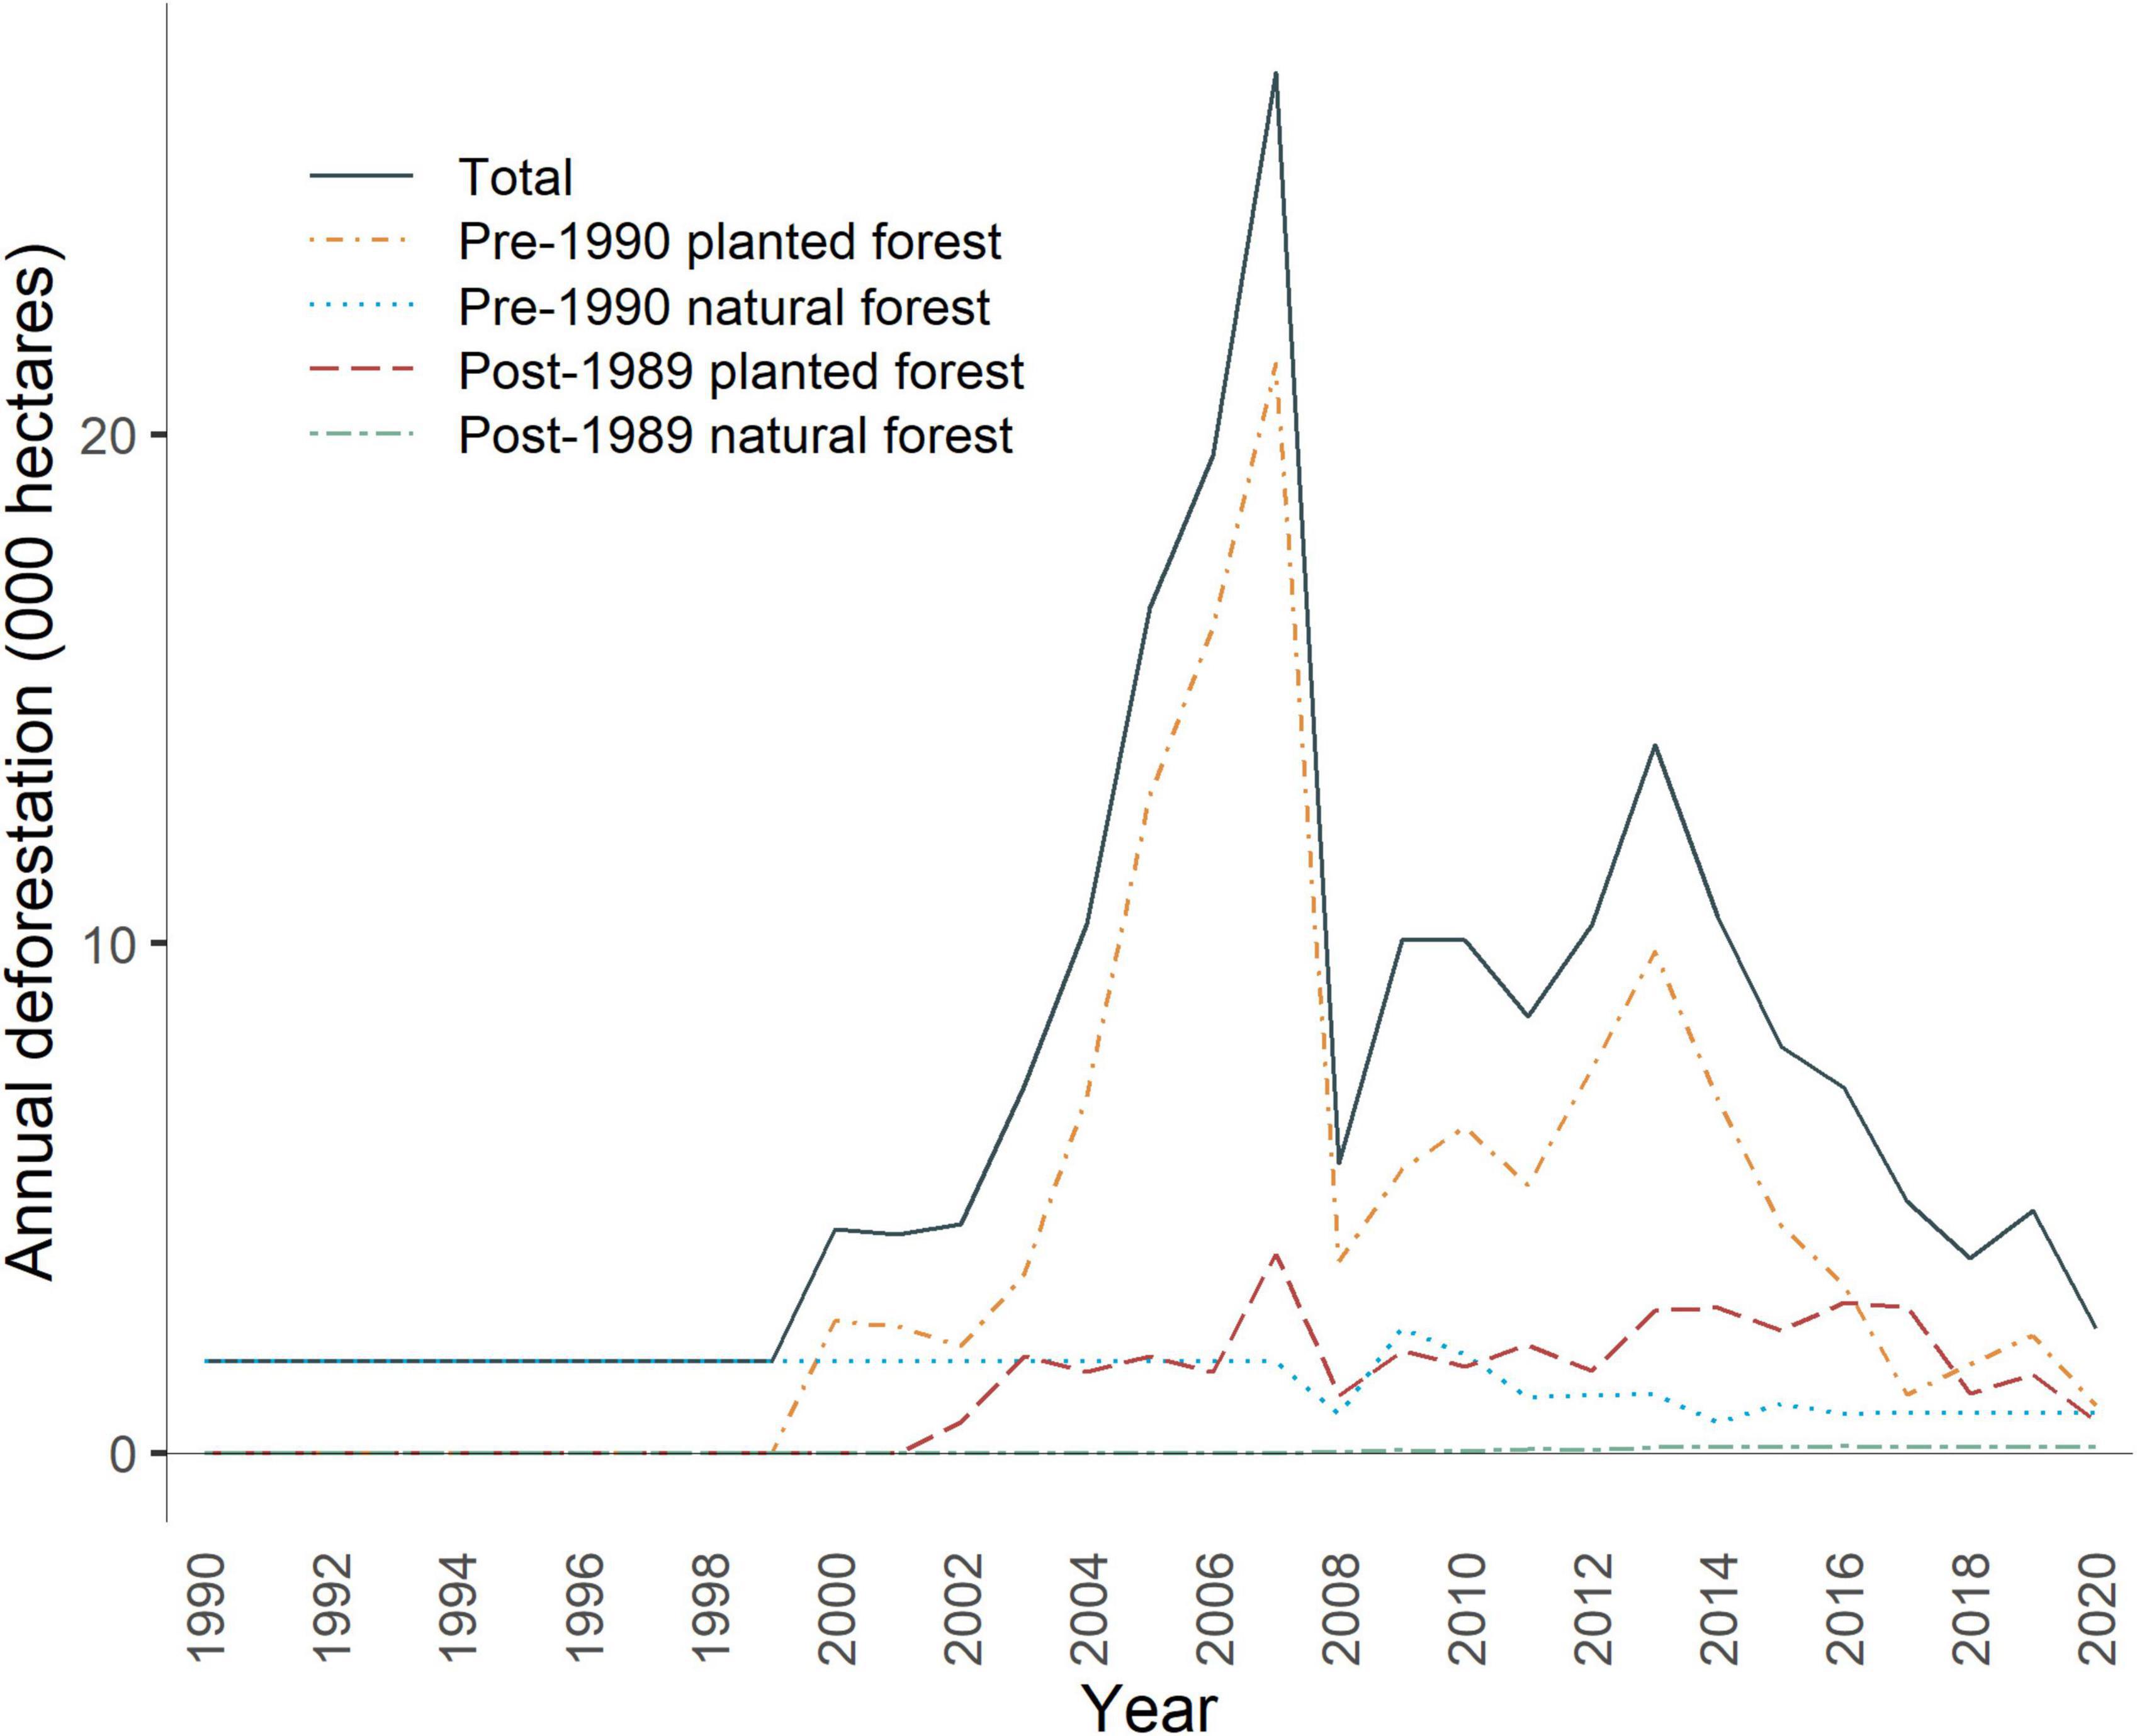
Figure 6. Estimated annual area of observed deforestation from 1990 to 2020 by forest-land classification (pre-1990, post-1989) and forest type (natural, planted). Data from MfE (2022a).
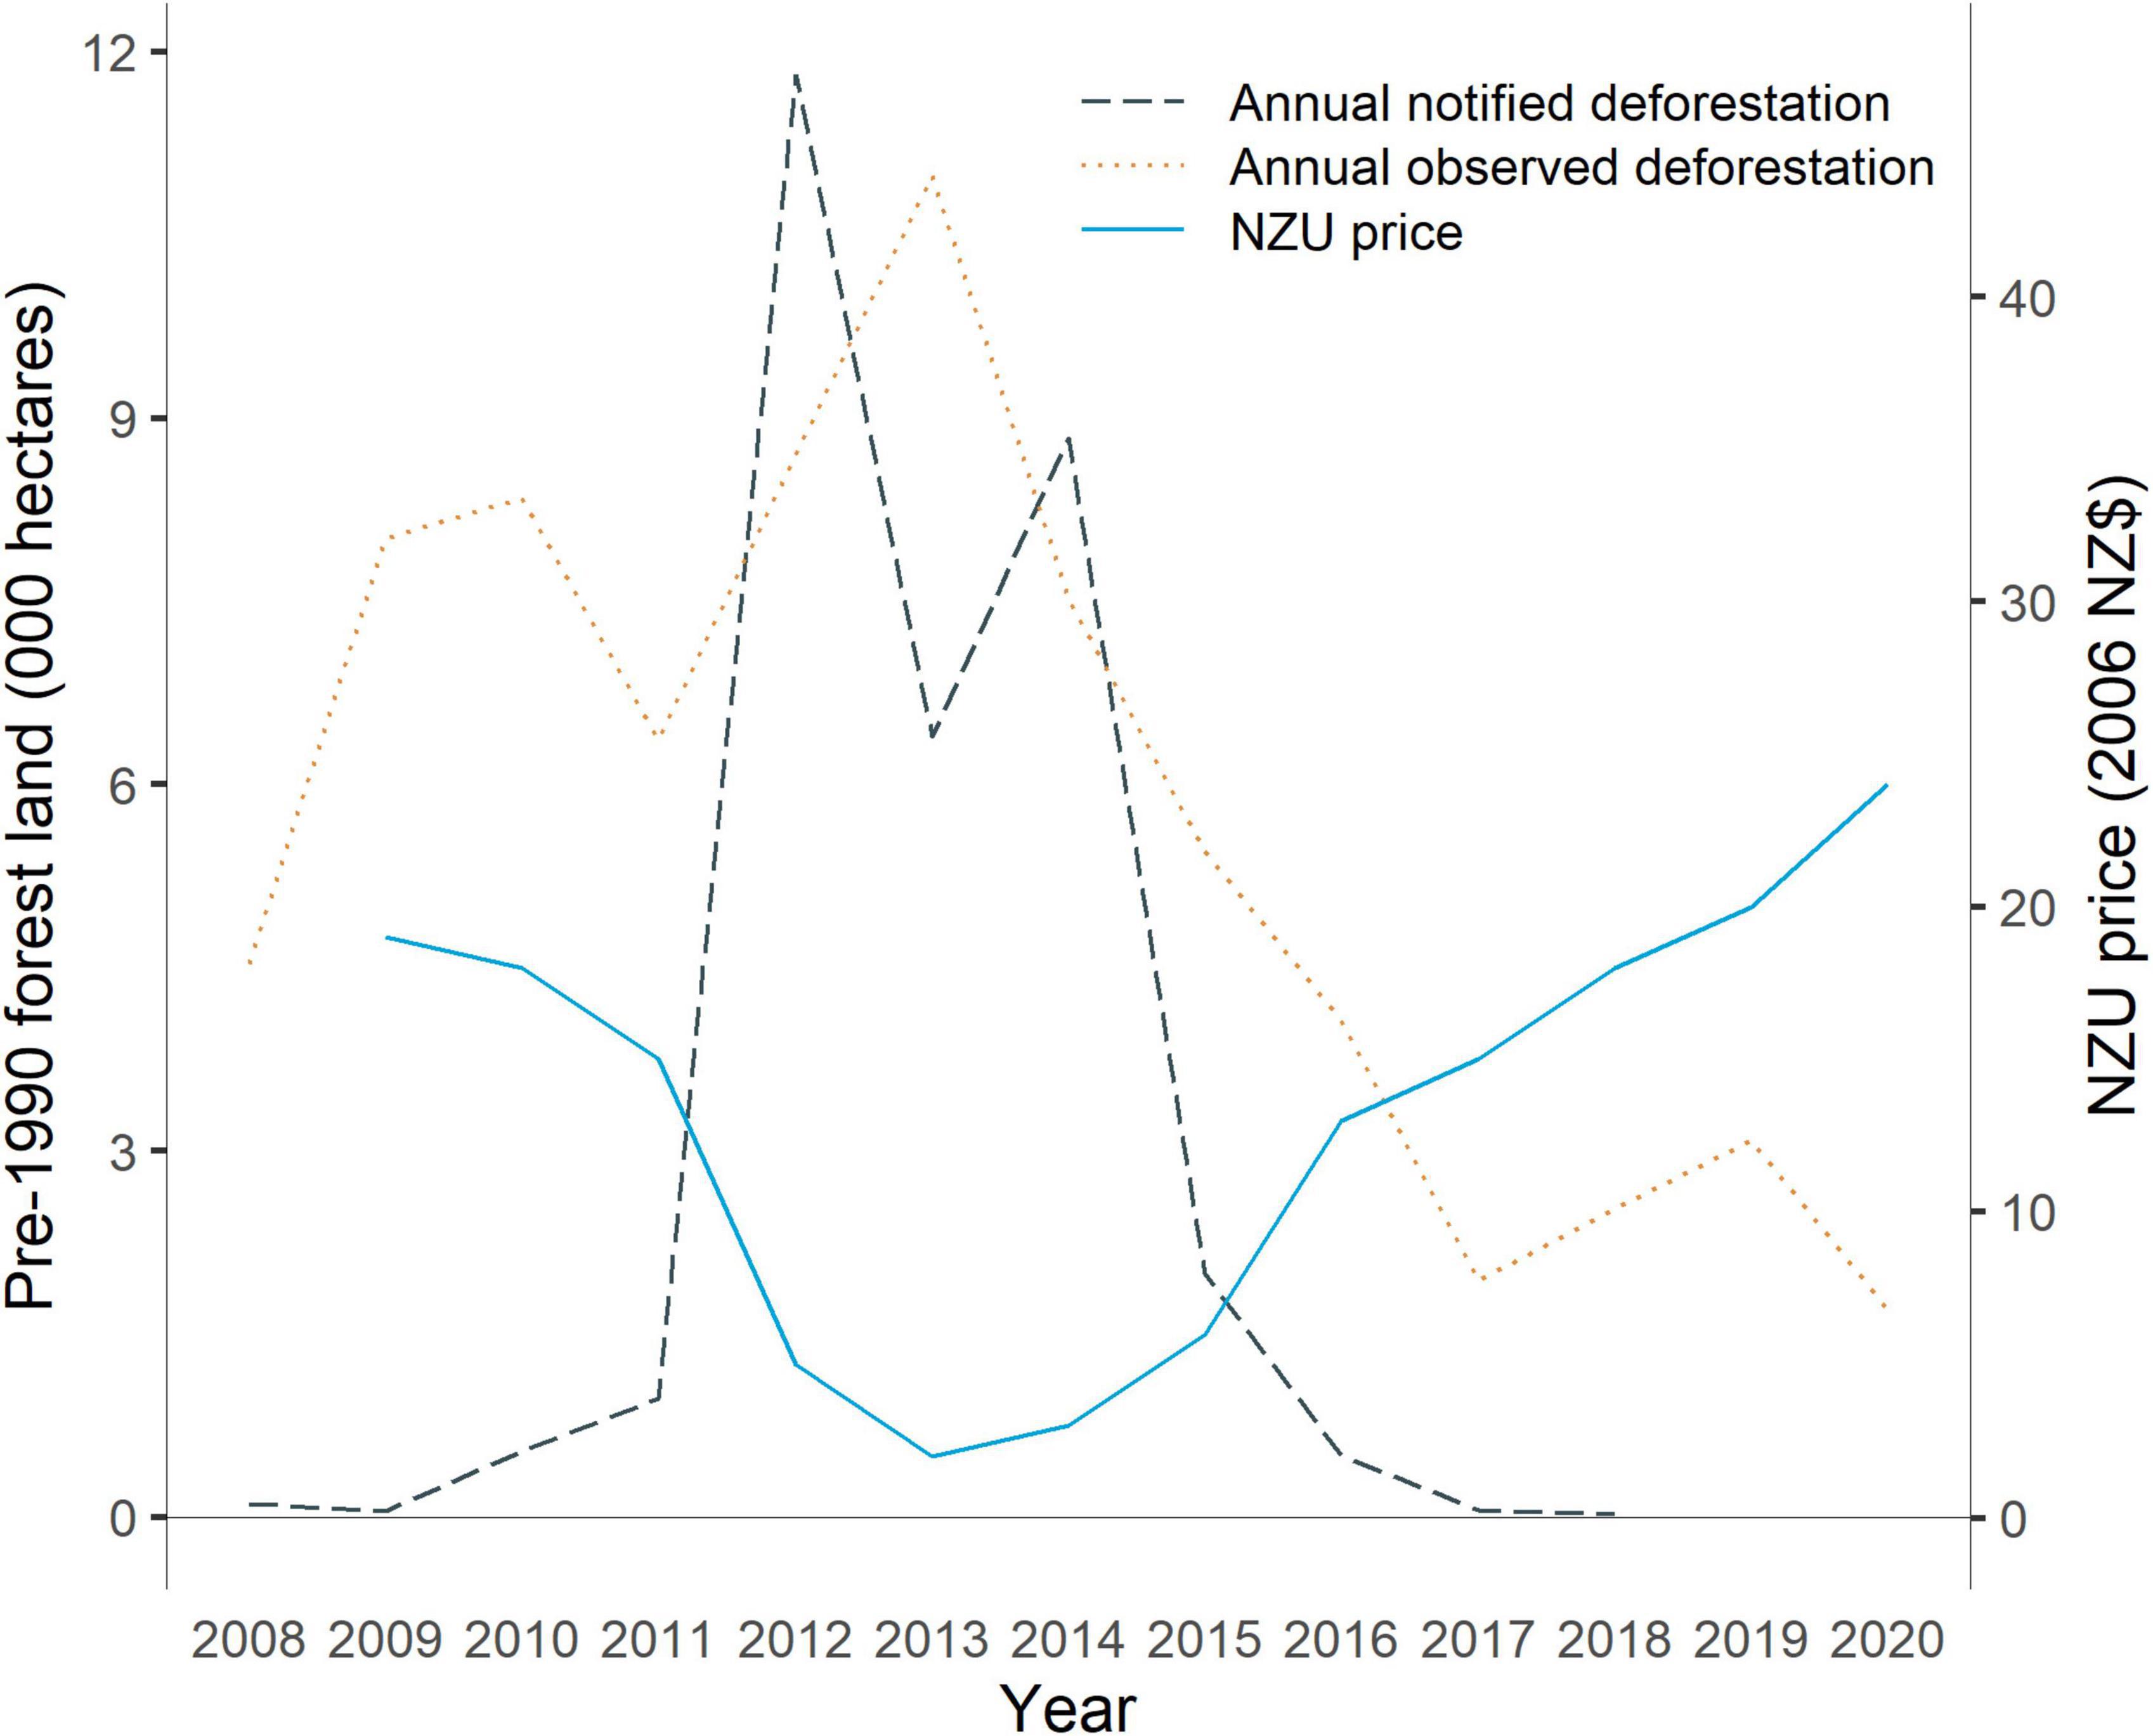
Figure 7. Notified and observed annual deforestation along with the average annual NZU price for 2008–2020. Note that notified deforestation data are not available for 2019 and 2020. Data from EPA (2017, 2018), Jarden (2022), and MfE (2022a).
Importantly, land is considered as deforested only if land-use change has occurred or it fails to reach specified stocking and growth thresholds by 4, 10, and 20 years after it was cleared. These thresholds accommodate both replanting and regeneration (MPI, 2021a). Therefore, it is possible that owners who cleared land in the 2008–2011 period delayed their decision to re-establish forest while the NZU price was high. This could explain the difference in trends between observed and notified deforestation (Figure 7).
Additionally, we found that the area-weighted average age of pre-1990 forest land at time of deforestation was lower in 2010 and 2011 (24 and 22.6 years, respectively) than in 2008 and 2009 (25.6 and 26.8 years, respectively; Figure 8). Owners who wanted to change land use but did not deforest prior to the implementation of the NZ ETS in 2008 instead may have cleared younger forest with a lower carbon stock to lower the liability they faced for deforesting pre-1990 land.16 In contrast, the harvesting age of pine forest remained within the expected age range over this period (26–32 years; MPI et al., 2014).
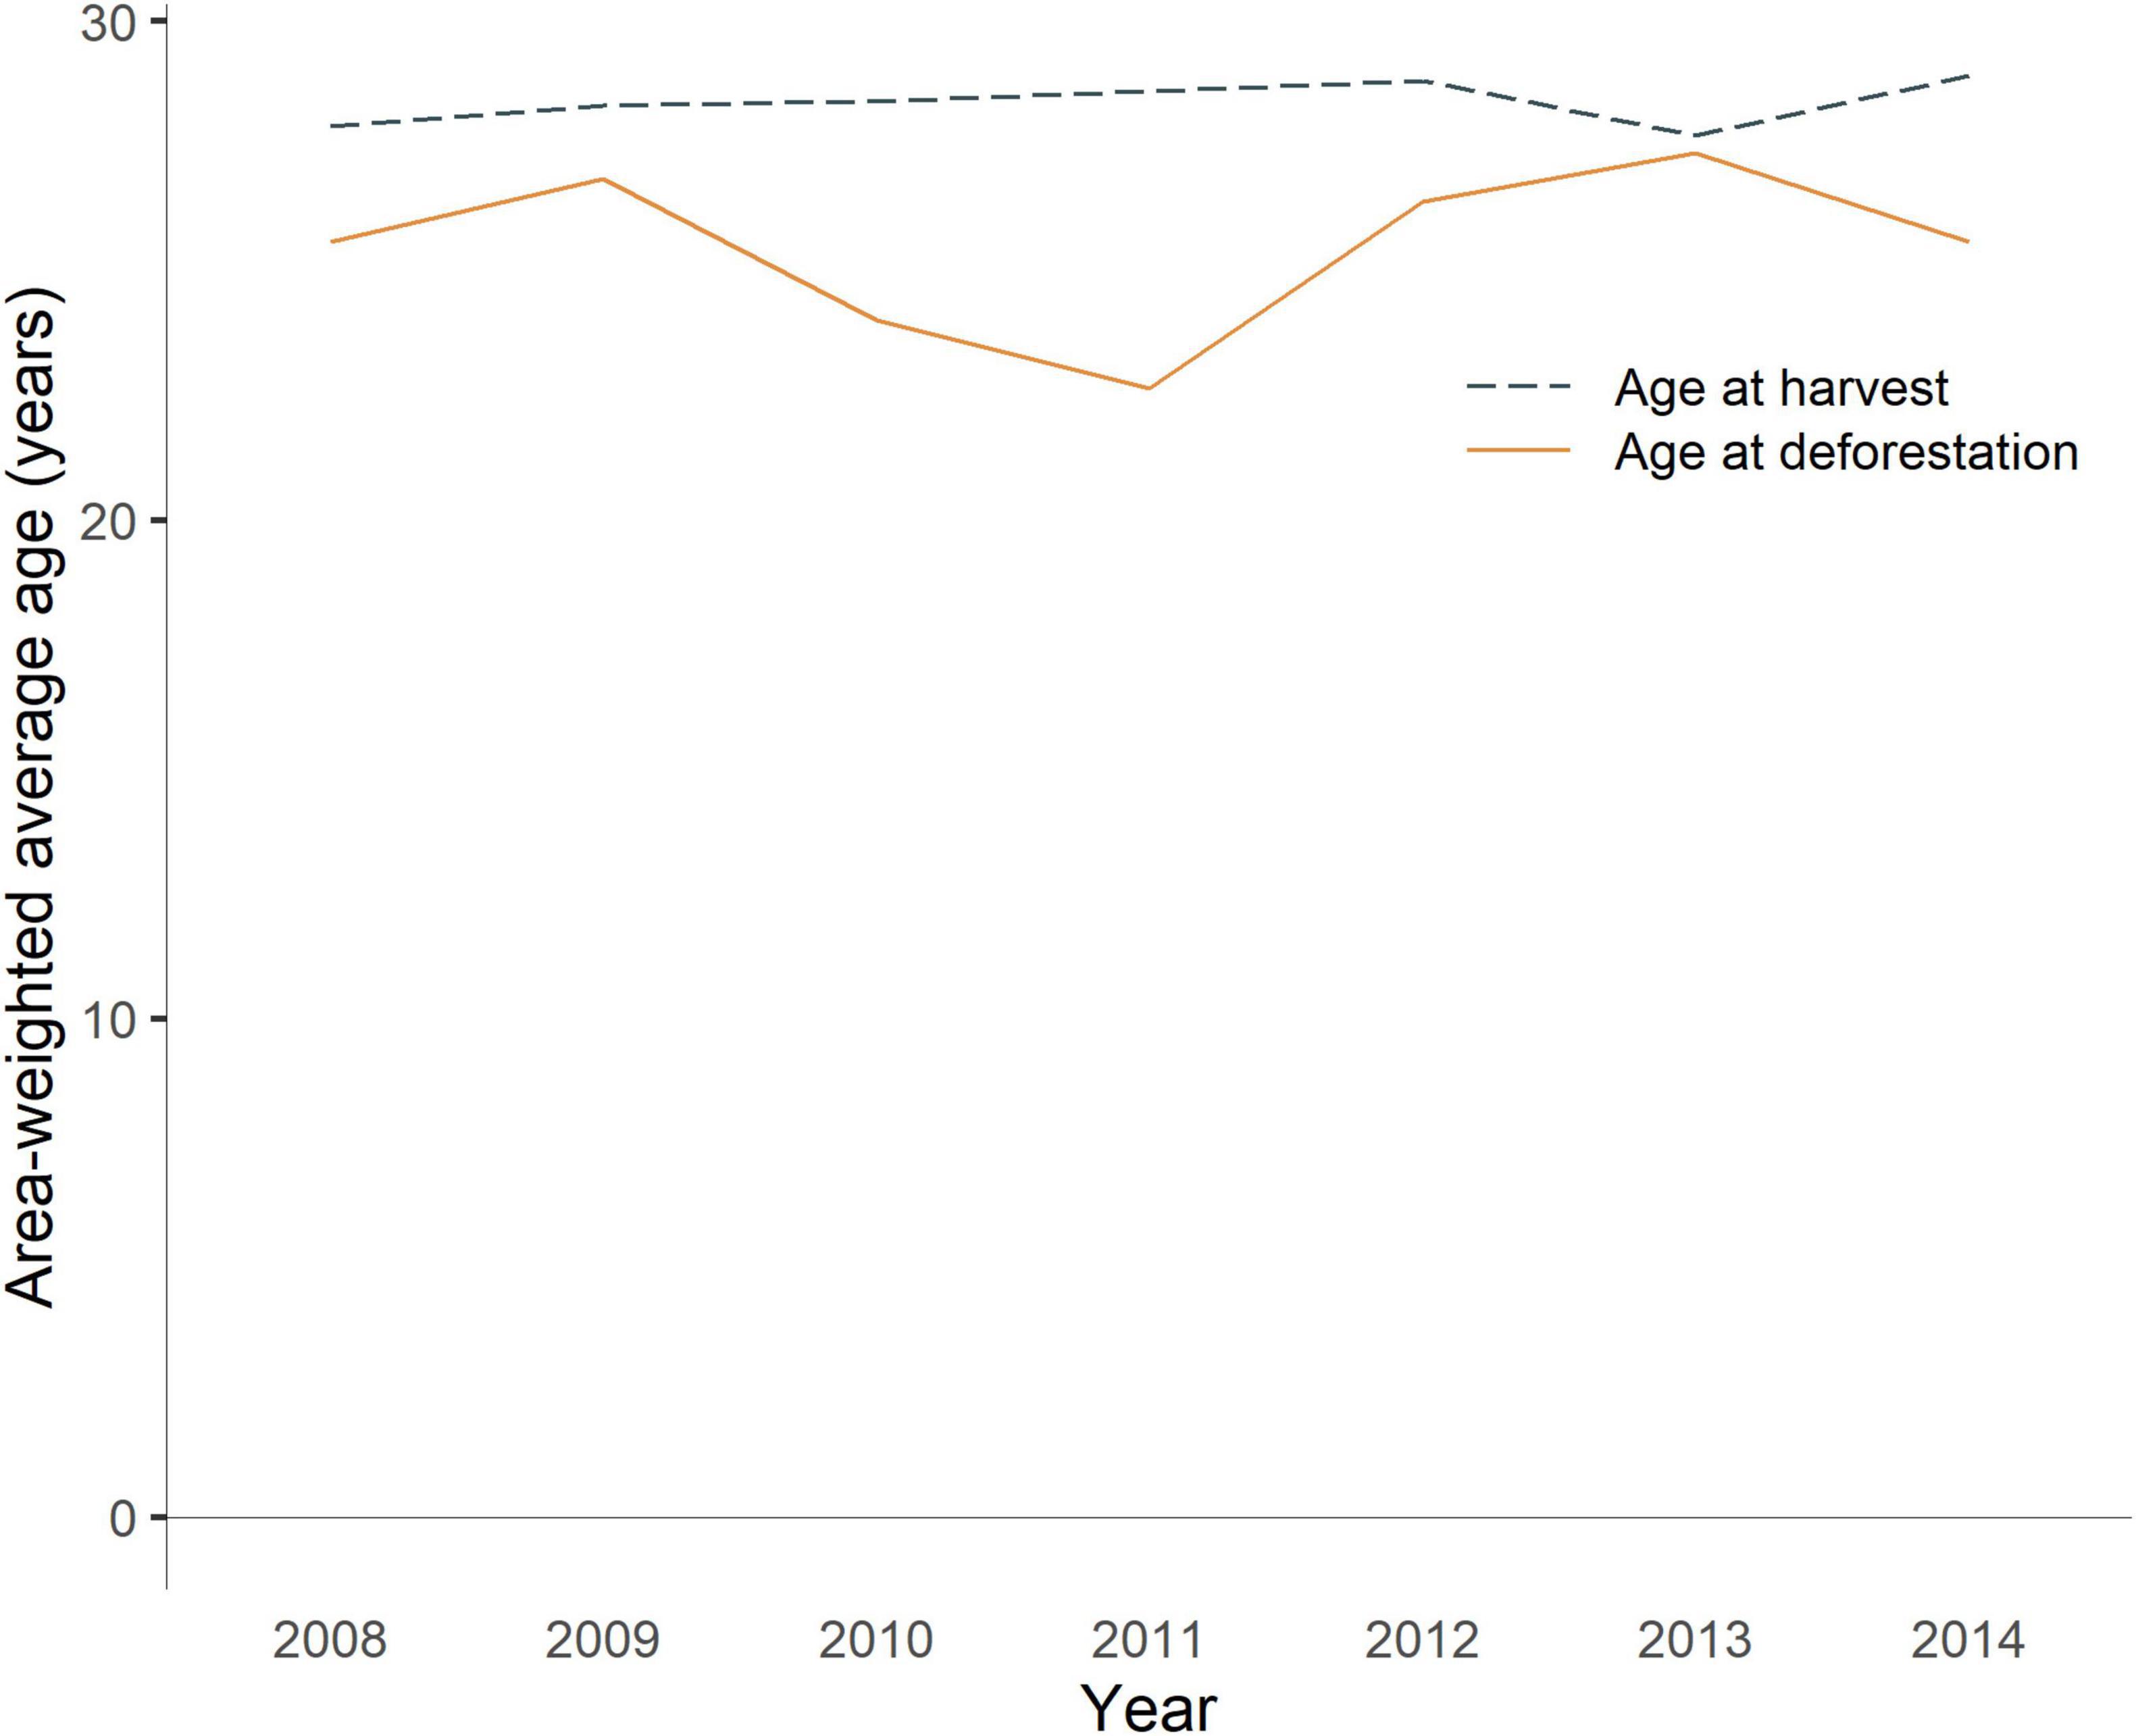
Figure 8. Area-weighted average age of forest at time of deforestation (for pre-1990 forest land) or harvest of Pinus radiata for all forest land, i.e., both pre-1990 and post-1989 forest land. Data from MAF et al. (2009, 2010, 2011), MPI et al. (2012; 2013; 2014; 2016; 2017; 2019; 2021), and MPI (2016b).
The option to offset deforestation in pre-1990 forest was introduced in the 2012 amendments. Offsetting began at a low level in 2014, increased more significantly over 2015–2017, and then declined. Overall uptake of pre-1990 offsetting has been low. Over the 2014–2020 period, 3,961 deforested hectares have been offset with 4,897 hectares of afforestation (a net increase of 936 hectares) (MfE, 2022a). The reported intentions of large forest owners to use offsetting over 2020–2030 has declined significantly since 2014 (Manley, 2021), potentially due to complex regulations and risk faced by owners wanting to use offsetting.
Our review of literature and policy documentation suggests a significant driver of deforestation has been the relative profitability of livestock production (particularly dairy), which has not faced an emissions liability to date. In annual surveys of large landowners, the percentage of intended forest conversion to dairy over the period 2008–2020 rose from 54% in 2008 to 86% in 2012, while intended forest conversion to sheep/beef dropped from 24 to 9%. The interest in dairy declined but remained dominant in landowner surveys from 2013 to 2017 (Manley, 2009, 2010, 2011, 2012, 2013, 2014, 2015, 2016a, 2017, 2018a, 2021). Between 2008/09 and 2020/21, the area of dairy production increased by 13% (about 194,000 hectares). Dairy is New Zealand’s leading source of export revenue (Livestock Improvement Corporation and DairyNZ, 2021). In 2019, New Zealand’s export revenue per hectare ranged from NZ$1,148 for meat/wool (8.9 million hectares) to NZ$3,697 for production forestry (1.6 million hectares), and NZ$8,522 for dairy (2.2 million hectares) (Forest Owners Association, 2021).
During operation of the NZ ETS, the chief land-use competition influenced by emissions pricing has been focused between forestry and sheep/beef production, with dairy maintaining a strong advantage over both. MPI and MfE (2022) analyzed the 50-year NPV of alternative land uses based on NZU prices of NZ$70-80, a discount rate of 8%, and one rotation of production forest. They reported an NPV of NZ$30,000 per hectare for permanent exotic forests, compared to NZ$4,500 per hectare for sheep/beef farming (with no emissions pricing), and NZ$20,000 for production forestry. No NPV estimate was provided for dairy. They reported an emissions price of NZ$110 would make permanent exotic forestry cost competitive with marginal dairy production (in the absence of emissions pricing on dairy). However, emergence of new freshwater (MfE, 2022c) and other regulations on livestock production has somewhat dampened landowner interest in forest conversion. In a 2020 survey of large landowners, deforestation intentions over 2020–2030 had shifted markedly; only 31% was for dairy, with 53% for infrastructure/mining and 6% for sheep/beef (Manley, 2021).
Actual afforestation observed in New Zealand since inception of the NZ ETS has differed to expectations based on modeling of emissions pricing scenarios. Manley and Maclaren (2009) projected an emissions price of NZ$25 per ton would deliver the government’s targeted increase of 250,000 hectares of forestry over 2008–2020. Afforestation of 10,000 to 18,000 hectares per year was projected over 2008–2020 with emissions prices around NZ$20 (Adams and Turner, 2012; Kerr et al., 2012; Manley, 2016b). In 2016, MPI predicted a “gradual increase to 15,000 hectares of new forest planting per year” over 2016–2020, with an emissions price between NZ$12.50 and NZ$25 (MPI, 2016b). Key modeling assumptions that varied across these studies were discount rates and management of price uncertainty. These forecasts all pointed to levels of afforestation equal to or greater than those seen in 2011–2012, but much lower than in the 1990s.
Over 2008–2020, actual afforestation in New Zealand totaled 170,000 hectares. It averaged 13,000 hectares per year over 2008–2020 [an average of 9,000 hectares per year over 2008–2018 when the NZU price averaged $13 (2006 NZD) and an average of 34,000 hectares per year over 2019–2020 when the price averaged $28 (2006 NZD)] (MfE, 2022a).
We determined the additional value that forestry participants could gain from selling “low-risk” NZUs as this is a fundamental way in which the NZ ETS could affect afforestation. Our results indicate that an NZU price of NZ$20 results in a net present value (NPV) from the sale of “low-risk” NZUs of approximately NZ$2,000 per hectare and that a NZ$1 increase in the NZU price increases the effective timber price (i.e., the actual timber price plus the additional value from selling “low-risk” NZUs) by NZ$0.86. For the period 2009–2011, we estimated that the additional sale of “low-risk” NZUs would have added, on average, approximately 14 percent to the actual timber price. These results are broadly consistent with a previous study which used a simple discounted cash flow analysis and found that, with an NZU price of NZ$30, a positive NPV of approximately $6,400 per ha would be generated by the NZ ETS (Evison, 2008).
We compared trends in afforestation with export prices for logs and poles, NZU prices, and export prices for Grade A logs only (Figures 9–11). Over 2008–2011, afforestation increased while the NZU price decreased and the timber price increased slightly before declining. Over 2012–2016, while NZU prices were below NZ$15, afforestation did not appear to follow volatile timber price trends. Over 2017–2018, NZU prices rose while both timber prices and afforestation stayed relatively flat. Over 2018–2020, NZU prices rose while timber prices declined and afforestation increased markedly.
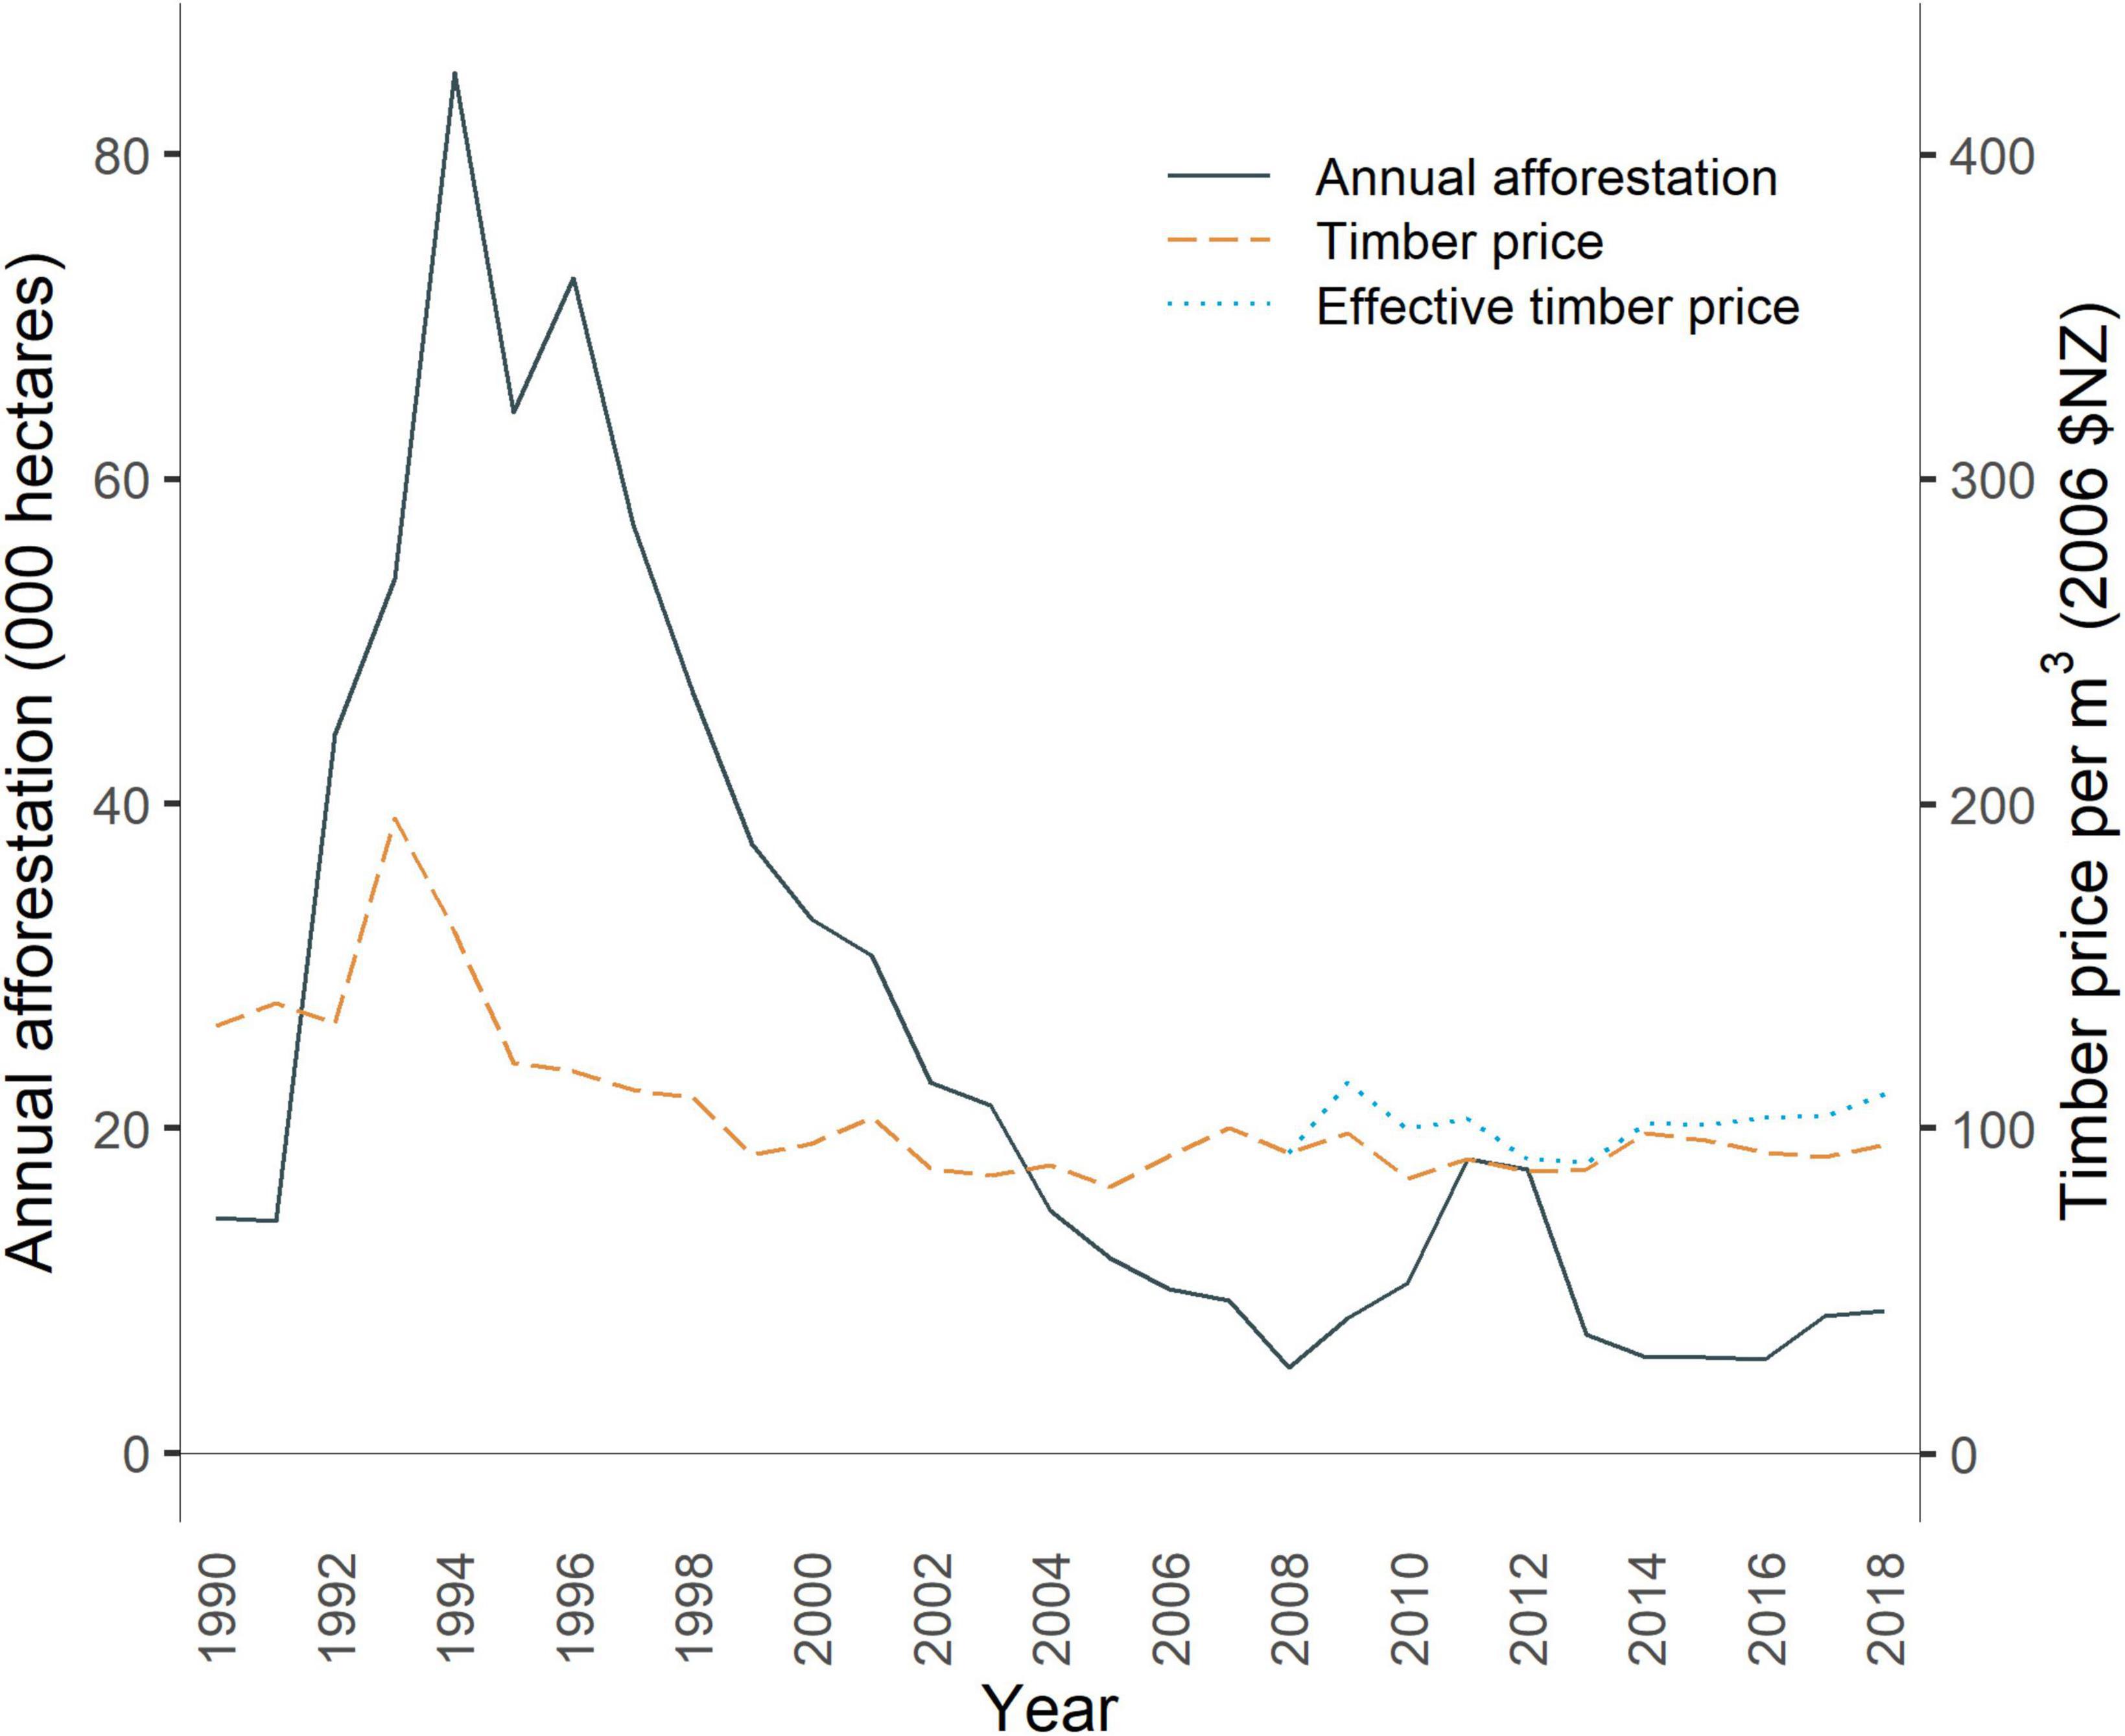
Figure 9. Annual afforestation and timber prices (with and without accounting for the effect of the NZU price). Data from MPI (2019b), Jarden (2022), and MfE (2022a).
Our analysis of afforestation appears consistent with the findings of Manley (2018b) that emissions pricing disrupted the historical correlation between afforestation rates and timber prices. This study found the strongest correlation between afforestation and timber prices using average timber prices over the previous 3 years (and a strong correlation for the previous 2 years). However, it is possible that afforestation rates could also have been influenced by the temporary nature of timber price shocks and factors other than timber prices. We observed a lag between changes in emissions and timber prices and landowner decisions to afforest but are unable to attribute the cause. Contributors could include price volatility, policy uncertainty, and the delay in preparing for afforestation (e.g., establishing seedlings). Further research would be useful to understand how landowner decisions to afforest are influenced by expectations and uncertainties regarding future timber prices in relation to future emissions prices.
Previous studies of forest and agricultural land values in New Zealand have demonstrated a consistent relationship between land-use profitability and land values (Stillman, 2005; Meade et al., 2008; Allan et al., 2020). Over the period when rising emissions prices have increased the profitability of forestry, increased forest land values have been observed (Emery, 2022). Given the complex drivers of land values, it is difficult to attribute the cause to the NZ ETS. Notably, from April 2018 to April 2019, the median value of forestry farms increased 45% nationally (from NZ$6,487 to NZ$9,394 per ha) and 97% in the North Island (from NZ$6,656 to NZ$13,128 per ha). A decrease of 4% was observed in the South Island (from NZ$6,450 to NZ$6,162). Over that period, sales of forestry farms decreased 29% nationally, 26% in the North Island, and 32% in the South Island (REINZ, 2019). Although NZU prices increased less than NZ$5 over that period (starting from an April 2018 price of NZ$21), multiple sector experts attributed the change to investor expectations for rising emissions prices alongside increased restrictions on plantation forestry on lower-cost marginal hill county and reduced restrictions on overseas investment in forestry (Chalmers, 2019; REINZ, 2019). National forest land values subsequently decreased in 2020 and then increased in 2021 (Emery, 2022). The COVID pandemic may have played a role in this. Changes in the valuation of forest land due to emissions pricing have also affected the provision of forestry insurance. Conventional forestry insurance targets the loss of timber due to natural disasters. As of 2022, only about 20% of standing timber lots and forests were insured in New Zealand, with the remainder uninsured or self-insured (ICNZ, 2022). New Zealand’s introduction of forestry in the NZ ETS led to the development of new forestry insurance cover for the unit surrender liability as well as loss of future earnings from NZUs. Interest in insurance cover for the unit surrender liability has decreased due to rule changes removing such liabilities for temporary adverse events and introducing averaging accounting. Due to the risk profile, in recent years the number of providers covering forest carbon in the NZ ETS has decreased (Manks, 2022).
Because exotic species grow faster than indigenous species, they have offered faster emissions pricing returns under the NZ ETS. As of 2021, 90% of the forest registered in the NZ ETS was exotic (MPI, 2021a). For example, Pinus radiata forest in Gisborne accumulates 219, 410 and 807 tons of CO2 per hectare by years 10, 16, and 28 respectively, whereas the government’s default values for indigenous forest are 40.2, 108.1, and 242.2 tons, respectively (MPI, 2015b). Other research suggests the differences may be less stark across a broader range of species: comparing mean annual increments over 50 years, tall indigenous forests could sequester 10.0–16.4 tons CO2 per hectare, Pinus radiata 21–27 tons, and regenerating kanuka/manuka shrubland 6.5 tons (corresponding to the default values used for indigenous forests in the NZ ETS) (Kimberley et al., 2021). Planted indigenous forests (as opposed to regenerating) are also significantly more expensive to establish than planted exotic species (Carver and Kerr, 2017; Forbes Ecology, 2021).
The future contribution from forestry to New Zealand’s net emissions will be shaped jointly by commercial market and government policy drivers. First, the age structure of New Zealand forests means that there will be significant commercial harvesting from around 2020 under business as usual (MPI, 2021b). Under current policy settings and carbon stock accounting, this wave of harvesting will decrease net forestry removals for a decade before the impacts of post-harvest replanting are observed. However, this effect on net forestry removals will not be apparent using target accounting due to averaging. Second, rising emissions prices under the NZ ETS can be expected to incentivize further afforestation and greater investment in permanent forests. Under current policy settings and target accounting17, net forestry removals are projected to increase significantly from the mid-2020s through 2050 (MfE, 2022c,2019).
Recent modeling undertaken by independent Crown entities has examined the potential contribution from afforestation toward New Zealand’s long-term emissions reduction targets. In New Zealand Productivity Commission (2017), scenarios with emissions prices ranging from NZ$30–80 in 2030 to NZ$75–250 in 2050 produced afforestation ranging from 1.3 to 2.8 million hectares over 2015–2050. Parliamentary Commissioner for the Environment (2019) examined an alternative approach to the current NZ ETS that would enable forest offsetting only for biological emissions from agriculture under different targets. This study found that an approach with forest offsetting available to all sectors would require 5.4 million hectares of new afforestation to sustain a net zero target through 2075, compared with 3.9 million hectares under an alternative land-based trading system.
CCC (2021) reported that 1.2–1.4 million hectares of marginal land was available for afforestation in New Zealand. Under current policy settings and holding the emissions price at NZ$35 per ton, 1.1 million hectares of new afforestation would eventuate by 2050. If the emissions price rose to NZ$50, this would increase to 1.5 million hectares. Under the Commission’s demonstration pathway for achieving domestic emissions budgets, about 1.3 million hectares of new afforestation would be needed by 2050, with establishment of 380,000 hectares of new exotic forest and 300,000 hectares of new native forest by 2035. These levels were identified as feasible outcomes consistent with maintaining gross emissions reductions in line with achieving net-zero emissions of long-lived GHGs by 2050 and sustaining performance. However, this assumed limiting the amount of afforestation driven by emissions pricing, which would likely require changes to both NZ ETS settings and land-use policies. MPI and MfE (2022) estimated that without further restrictions, exposure to the emissions price pathway used by the Commission could produce 645,000 hectares of new exotic forest in the next decade. Of this amount, about 350,000 hectares could be permanent exotic forest.
These studies show the significant role afforestation could play in offsetting New Zealand’s gross emissions from other sectors to achieve low-emission or net-zero targets in 2050 and beyond − with significant implications for land-use change and communities.
When New Zealand embarked on an economy-wide ETS in 2008, the stakes were high in the forestry sector. It held large potential to generate removals at relatively low emissions prices and produce deforestation emissions on privately held land subject to market drivers. The sector-wide approach was a marked departure from conventional project-based forest offsetting mechanisms used elsewhere. While policymakers at the time were confident of surplus net removals from the forestry sector for the 2008–2012 target period due to heavy planting from 1990, the outlook through 2020 and beyond was uncertain (MfE, 2005). Policymakers hoped the NZ ETS would discourage deforestation and incentivize net removals at significant scale, supporting climate change targets over the long term.
Evison (2017) concluded the NZ ETS had not encouraged investment in new forests over 2008–2012 and may have encouraged deforestation. That study was conducted following an extended period of policy uncertainty and low emissions prices. Our study had the benefit of a longer period of analysis featuring significant policy reforms and changes in emissions prices. We concluded that the NZ ETS has influenced both afforestation and deforestation across four stages of evolution:
(1) Policy anticipation: Over 2005–2007, while the government evaluated policy alternatives to its abandoned carbon tax, afforestation continued to decline while deforestation increased dramatically due to landowner anticipation of future regulation of forestry emissions through pricing or other means (Figures 6, 9).
(2) Initial implementation: Over 2008–2011, emissions prices starting at around NZ$20 abruptly reduced observed deforestation (Figure 7), while afforestation increased (Figure 9). Landowner surveys indicated that the deforestation response was impacted by extended policy uncertainty due to reviews of the NZ ETS in 2009 and 2011 and international negotiations on post-2012 forestry rules (Manley, 2009, 2010, 2011, 2012).
(3) Backsliding: Over 2012–2015, landowners took advantage of very low-cost offshore Kyoto units to: bring forward deforestation; deregister (and in some cases re-register) post-1989 forest, thereby clearing future harvest liabilities; and stockpile NZUs (Manley, 2013; Evison, 2017; Leining et al., 2019). A greater understanding of NZ ETS accounting and the scale of “low-risk” NZUs may have contributed to landowners deregistering (Lough, 2022). Departing from previous trends, declining afforestation accompanied rising timber prices (Figure 9). Millions of seedlings established while emissions prices were high were mulched in 2014 because it became uneconomic to plant them after emissions prices fell (Huffadine, 2014; Smith, 2014). Annual surveys of large landowners showed that future deforestation intentions were comparable across scenarios with NZ ETS policy or no policy, potentially because large forest owners did not expect emissions prices to recover. Even as NZU prices started to recover after 2013, ongoing access to low-cost offshore Kyoto units made deforestation more affordable (Manley, 2015, 2014, 2013).
(4) Accelerated afforestation: Over 2016–2022, as emissions prices rose due to de-linking of the NZ ETS from the Kyoto market, greater target ambition, and removal of the fixed-price option, afforestation increased and deforestation decreased once again (Figure 10). Significant increases in afforestation occurred after 2018 as emissions prices surpassed the NZ$20 level at which they had first started − notably at the same time as timber prices declined markedly (Figure 11). Annual surveys of large landowners showed rising interest in pre-1990 offsetting to enable deforestation as emissions prices increased above about NZ$10 (Manley, 2016a). However, overall use of offsetting has remained low and offsetting intentions have subsequently declined as rising emissions and land prices have rendered offsetting uneconomic (Manley, 2018a, 2021).
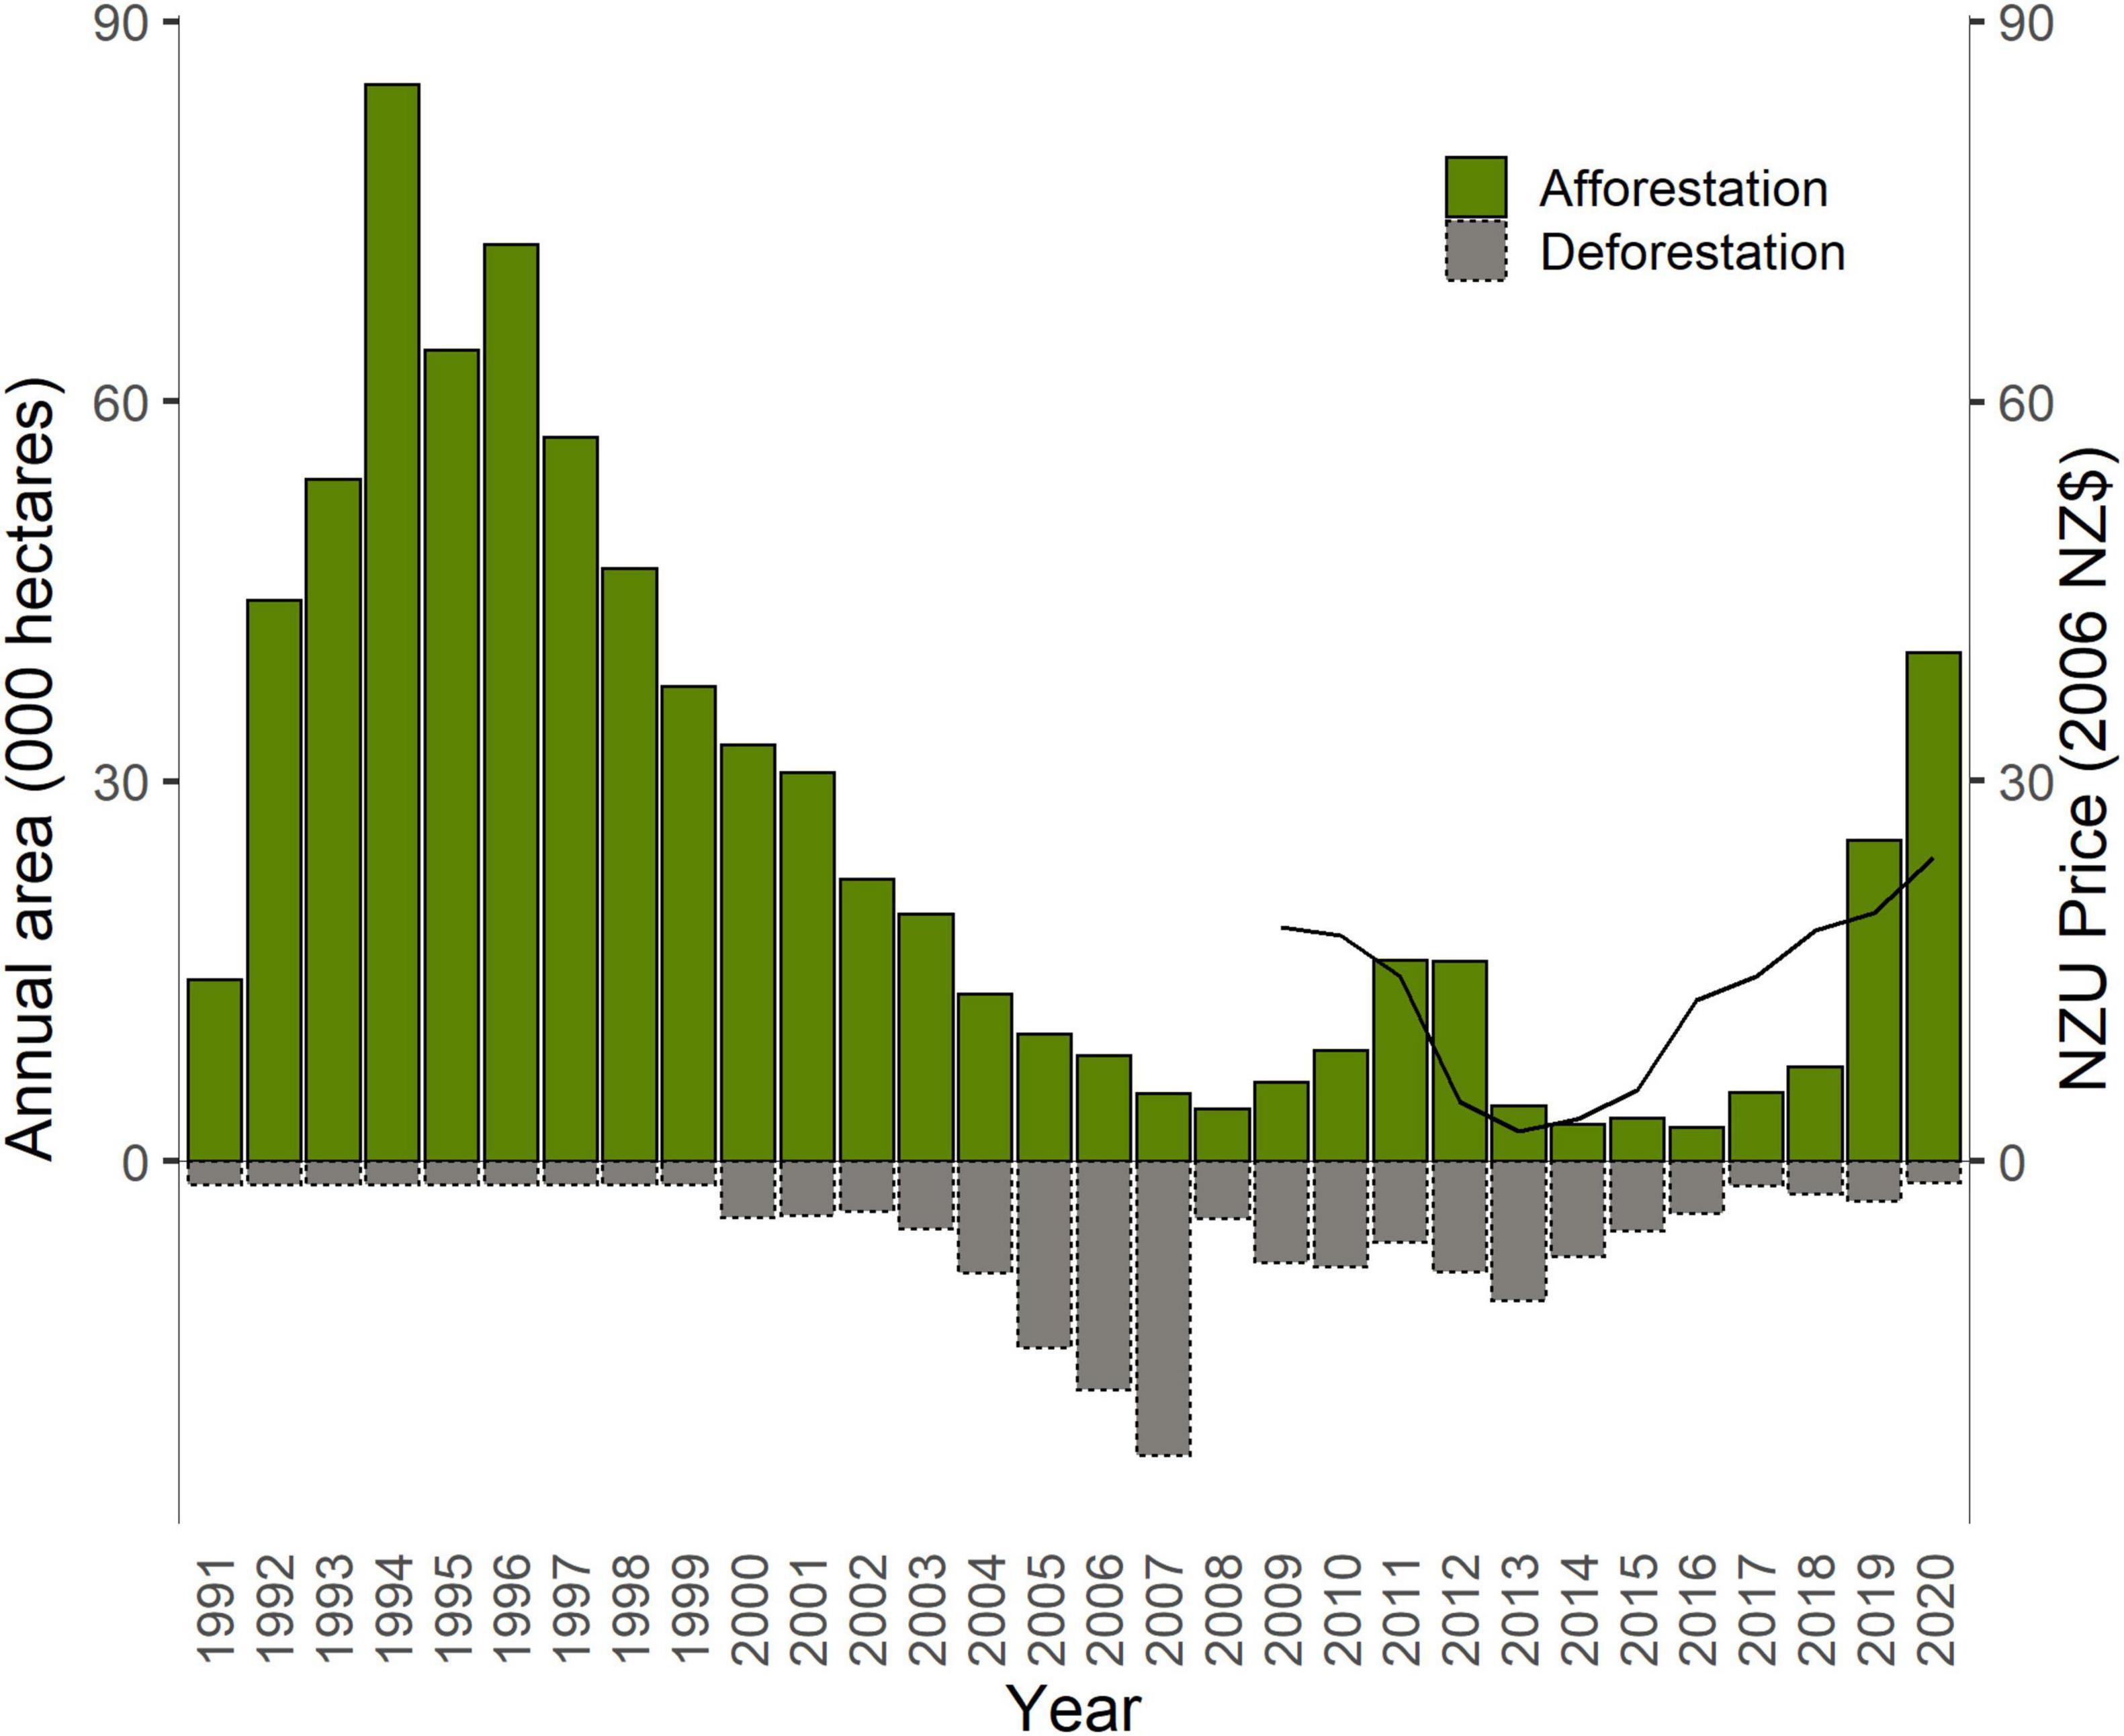
Figure 10. Annual area of net afforestation of post-1989 forest land and deforestation of pre-1990 forest land. The NZU price is shown by the black line, beginning once the NZ ETS was implemented. Data from Jarden (2022) and MfE (2022a).
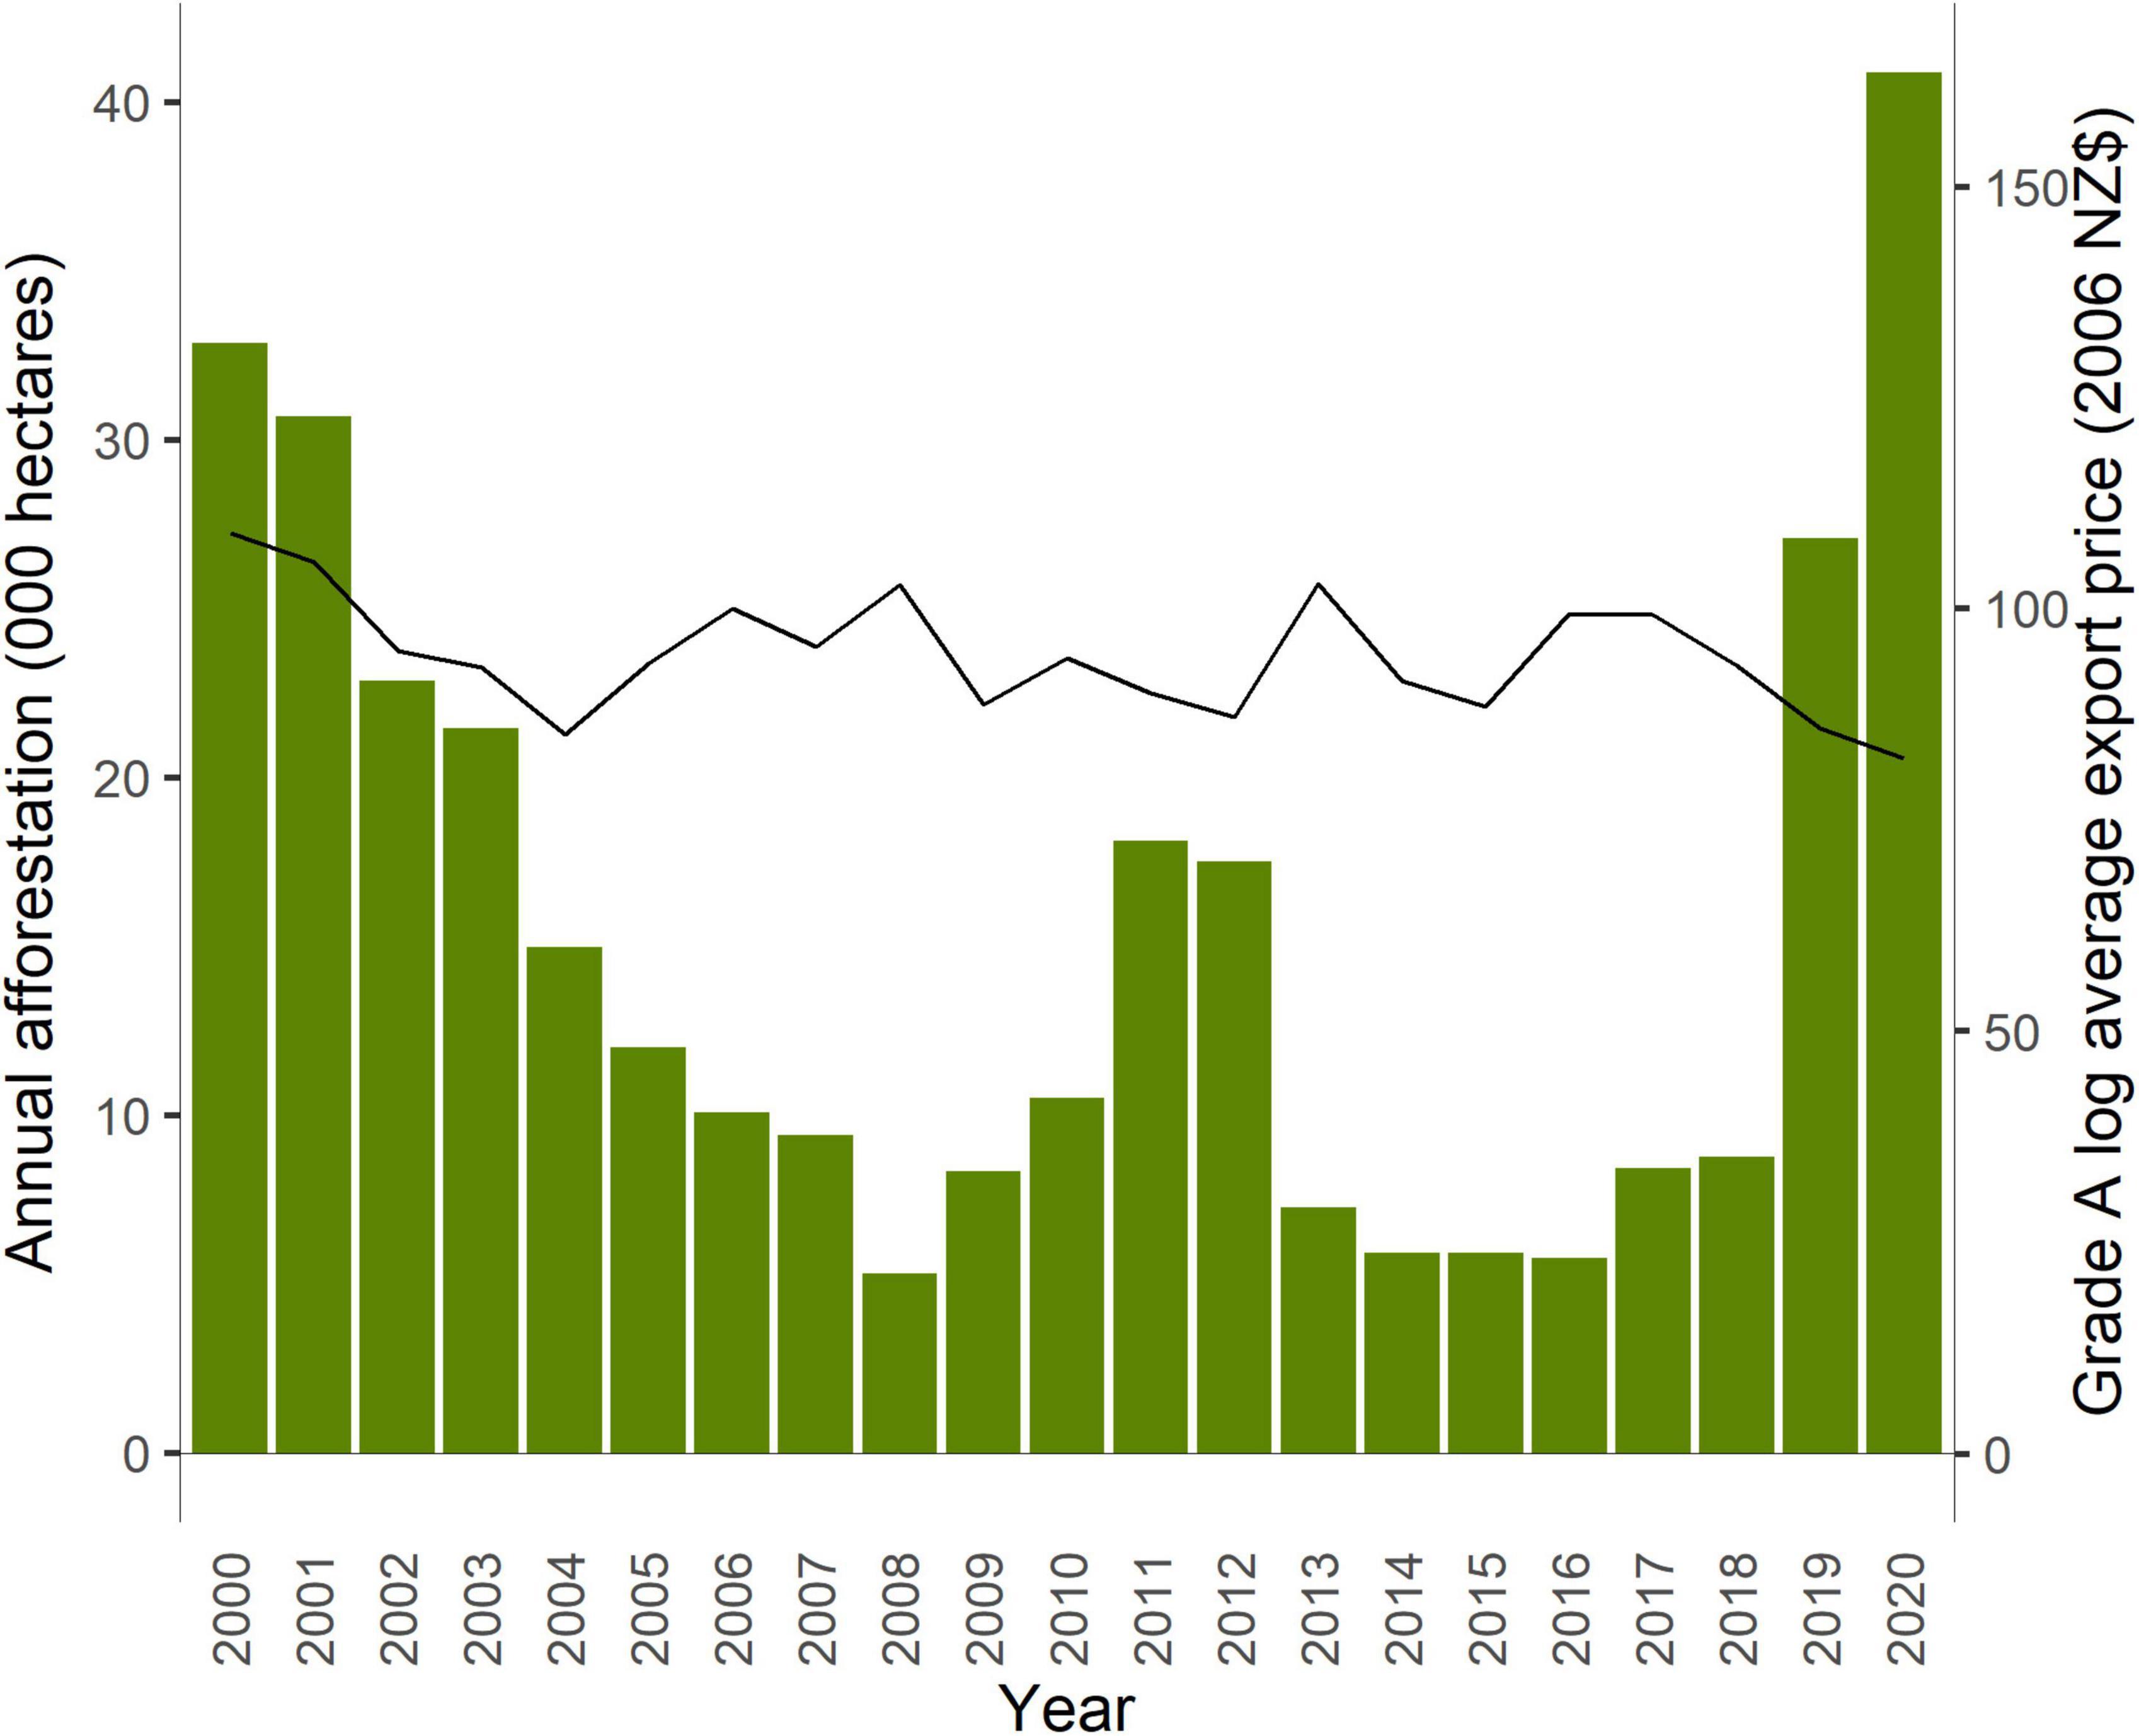
Figure 11. Afforestation and Grade A log price. Data from MPI (2022d).
As of 2021, slightly more than half of post-1989 afforestation has benefited from emissions pricing across the NZ ETS, PFSI, and AGS. Conversely slightly less than half faces no disincentive under the NZ ETS for deforestation or incentive for carbon stock enhancements (however, there are commercial incentives to maximize timber yield). As of 2022, no government emissions pricing incentives apply to carbon stock enhancements in pre-1990 forest.
Most participants in the NZ ETS own small forests. Although only a small proportion of NZ ETS participants own large forests, these large forests account for most of the forest land in the NZ ETS (Table 3). We would expect owners of larger forests to have a more even distribution of planting ages and a greater ability to smooth their carbon stock than owners of small forests (whom we expect to harvest their forest all at once, due to economies of scale).
Our analysis shows that emissions pricing incentives have operated in distinct contexts for afforestation and deforestation. Changes in afforestation activity have appeared to lag behind emissions price changes (Figures 10, 11). One contributor is the time needed for land acquisition and seedling production under land and labor supply constraints. A second is the time horizon for afforestation investment decisions. Landowners’ decision-making may be more affected by expectations for future emissions prices than current prices, making them particularly sensitive to policy uncertainty (Karpas and Kerr, 2011). In contrast, decisions to harvest or deforest have more closely followed emissions price changes. Some landowners (or forest owners, if they are different) may have the flexibility to harvest when emissions prices are low and then wait up to 4 years before deciding whether to re-establish forest or convert the land. Our review suggests different emissions price points for decisions on afforestation versus deforestation (with or without offsetting) alongside other factors such as land and commodity prices.
The system’s recent success in accelerating afforestation is also raising significant policy challenges for the future. The potential for large-scale exotic afforestation – and more permanent exotic forests – has raised significant concerns among a range of stakeholders. Some have criticized the environmental impacts (e.g., Salmond, 2021; Forest and Bird, 2022) and some the potential displacement of productive agricultural land uses (BDO Gisborne Limited, 2021; Orme and Orme, 2021). However, other stakeholders have emphasized exotic forests deliver faster sequestration to help with climate change targets and exotic plantation forests help supply the bioeconomy (e.g., NZFOA, 2022; WPMA, 2022). Some have expressed concerns that while landowners who register post-1989 afforestation have the option to exit the NZ ETS, pay back the units, and deforest, high emissions prices in the future could make such land-use change uneconomic and limit future land-use flexibility (Forestry Reference Group, 2018).
These issues are not clear cut. While all forests can help with erosion control, water quality, and wildlife habitat, indigenous and mixed-species forests can support higher levels of biodiversity and may offer improved resilience to pests, natural disasters, and climate change impacts. Indigenous forests have great cultural significance for New Zealanders, especially Māori with deep historical and spiritual connections to their whenua (land). However, many Māori landowners also own substantial exotic forest assets and concerns have been raised about the economic impacts for Māori from restricting exotic forestry in the NZ ETS (e.g., Northland Age, 2022; Perry, 2022). Slash, sedimentation, and habitat disruption from plantation forestry have had severe consequences in some regions (Boynton, 2020; Flaws, 2020). Extensive investment in new permanent forests raises the prospect of lower employment and reduced regional economic activity in some regions (MPI and MfE, 2022).
The government faces challenging questions about whether and how to manage the share of future mitigation from forestry. New Zealand’s new forestry potential will decline over time and the need to reduce cumulative gross emissions remains urgent. Early and heavy reliance on exotic forestry to meet emissions budgets and targets could delay or displace other mitigation investment and eventually exhaust New Zealand’s long-term offsetting potential (CCC, 2021). Forests are vulnerable to the effects of climate change and natural disasters and any future reversals will have to be compensated for (subject to natural disturbance provisions under target accounting rules). Furthermore, the rules under the 2015 Paris Agreement do not enable carry-over of surplus mitigation between NDC periods, meaning that New Zealand cannot use early afforestation removals to offset emissions in later periods. Forestry and other NZUs stockpiled in the NZ ETS could create fiscal and target compliance risks in future emissions budget and NDC periods.
Changes to NZ ETS forestry policy are underway alongside the introduction of the government’s first Emissions Reduction Plan for 2022–2025. In 2022, the government consulted on new policy proposals (MPI and MfE, 2022) and draft regulations (Te Uru Rākau, 2022) for managing forestry in the NZ ETS. The government is also advancing plans to price biogenic emissions from agriculture by 2025 – a milestone originally scheduled for 2013 in the NZ ETS and then deferred. This could affect the relative profitability of competing land uses. The outcomes from this policy process alongside further reforms to the NZ ETS could have far-reaching implications for future land-use decisions and climate change outcomes in Aotearoa New Zealand.
Unlike other emissions trading systems which link to project-based forestry offsetting mechanisms, the NZ ETS incorporates the whole forestry sector as a participant with both liabilities for deforestation emissions and credits for afforestation removals. New Zealand’s approach has demonstrated the feasibility of this concept at a national scale. Over the period from 2008 to mid-2022, the system has established a functional carbon market that creates emissions price incentives to increase afforestation and avoid deforestation, and enables emitters from other sectors to invest in afforestation for climate change mitigation.
Our research and analysis suggest that from a broad perspective, forest owners have responded to the evolving emission price incentives from the NZ ETS in a rational way over time. However, their rational response has not always supported policymakers’ intended emissions outcomes. In expectation of impending regulation, landowners brought forward deforestation in the period before the NZ ETS was introduced in 2008. After implementation, factors such as policy complexity, prolonged policy uncertainty, and weak emissions price signals likely limited the effectiveness of the NZ ETS in achieving the government’s forestry goals. When emissions prices fell after 2011, deforestation accelerated and afforestation declined. The sector responded strategically to arbitrage opportunities at taxpayer expense.
Since 2016, the combination of policy reforms with rapid rises in emissions prices has led to a marked increase in afforestation and decrease in deforestation, and this is projected to continue. From 2021 to mid-2022, as emissions prices doubled, applications to register post-1989 forest leaped from a 3-year average of 7,000 hectares per quarter to 80,000 hectares per quarter. The introduction of averaging accounting for newly registered post-1989 afforestation from 2023 will offer the benefits of higher levels of “low risk” units to all participants – benefits that previously were available to larger landowners with diversified forestry portfolios.
Policymakers currently are relying on the forestry sector to make a substantial contribution toward meeting New Zealand’s climate change targets through 2050 and beyond. Both the government and the Climate Change Commission (CCC) have concluded that enabling the NZ ETS to deliver net forestry removals with the “right trees in the right place at the right time” – particularly with a socially acceptable balance between plantation versus permanent forest and exotic versus indigenous species – will require further reforms to the NZ ETS as well as land use policy and regulation. Our findings highlight the need for refined modeling of land-sector responses to emissions pricing and more transparent reporting of forestry activities in the NZ ETS to help inform decisions by policymakers, landowners, and market participants. To channel future mitigation investment into forestry for positive outcomes, further policy reforms will need to maintain stakeholder and investor confidence in the system while safeguarding economic efficiency, environmental integrity, intergenerational equity, and the government’s obligations to iwi/Māori under the Treaty of Waitangi (Te Tiriti o Waitangi).
TC, PD, and SK contributed to initial design, data collection, analysis, policy review, and drafting of the manuscript for the study period through 2017. SO’B, HK, and CL updated the data collection, analysis, and policy review for the study period from 2018 through 2022 and revised the manuscript. All authors read and approved the submitted version.
This work was supported by funding from the Aotearoa Foundation (grants #9907754, 9908250, and 9909485) and New Forests. Neither funder was involved in preparing or reviewing this manuscript or the underlying analysis. TC was supported by the Motu Education and Research Foundation.
We further appreciate and thank those who contributed other input toward this project since its inception in 2017: Ollie Belton, Steven Cox, Blair Dickie, Peter Gorman, Arthur Grimes, Denis Hocking, Peter Lough, David Rhodes, Lynn Riggs, and Peter Weir. All views, errors, and omissions remain those of the authors.
Author TC was employed by the company AutoXpress Ltd. In addition to her role at Motu, CL holds the role of Commissioner at He Pou a Rangi New Zealand Climate Change Commission. This manuscript does not reflect the views of the Climate Change Commission. CL also does sole-proprietor consulting under Silver Lining Global Solutions and started a project in April 2022 to provide advice on climate and environmental solutions for Toha Foundry Ltd. That work has not influenced the development of this manuscript, which has been underway since 2017.
The remaining authors declare that the research was conducted in the absence of any commercial or financial relationships that could be construed as a potential conflict of interest.
The reviewer DE declared a shared affiliation with the author SO’B during review.
All claims expressed in this article are solely those of the authors and do not necessarily represent those of their affiliated organizations, or those of the publisher, the editors and the reviewers. Any product that may be evaluated in this article, or claim that may be made by its manufacturer, is not guaranteed or endorsed by the publisher.
Adams, T., and Turner, J. A. (2012). An investigation into the effects of an emissions trading scheme on forest management and land use in New Zealand. Forest Policy Econ. 15, 78–90. doi: 10.1016/j.forpol.2011.09.010
Allan, C., Kerr, S., and Owen, S. (2020). Over-valued or over-looked? A theoretical and empirical investigation of agricultural land values against profitability in Aotearoa New Zealand. Wellington: Victoria University of Wellington.
Amendment Act (2008). Climate change (forestry sector) regulations. Available online at: https://www.legislation.govt.nz/ (accessed May 1).
Amendment Act (2009). Climate change response (moderated emissions trading). Available online at: https://www.legislation.govt.nz/ (accessed May 1).
Amendment Act (2012). Climate change response (emissions trading and other matters). Available online at: https://www.legislation.govt.nz/ (accessed May 1).
Amendment Act (2014). Climate change response (unit restriction). Available online at: https://www.legislation.govt.nz/ (accessed May 1).
Amendment Act (2016). Climate change response (removal of transitional measure). Available online at: https://www.legislation.govt.nz/ (accessed May 1).
Amendment Act (2019). Climate change response (zero carbon). Available online at: https://www.legislation.govt.nz/ (accessed May 1).
Amendment Act (2020). Climate change response (emissions trading reform). Available online at: https://www.legislation.govt.nz/ (accessed May 1).
BDO Gisborne Limited (2021). Report on the impacts of permanent carbon farming in Te Tairawhiti Region. Gisborne: BDO Gisborne Limited.
Boynton, J. (2020). East coast’s forestry slash problem not going away. Available online at: https://www.newshub.co.nz/ (accessed May 20, 2022).
Bullock, D. (2012). Emissions trading in New Zealand: Development, challenges and design. Environ. Polit. 21, 657–675. doi: 10.1080/09644016.2012.688359
Cameron, A. (2011). “New Zealand emissions trading scheme,” in Climate change law and policy in New Zealand (Wellington: LexisNexis NZ Ltd), 239–304.
Carver, T., and Kerr, S. (2017). Facilitating carbon offsets from native forests. Wellington: Motu Economic and Public Policy Research. doi: 10.29310/wp.2017.01
CCC (2021). Ināia tonu nei: A low emissions future for Aotearoa. Wellington: Climate Change Commission (CCC).
Chalmers, H. (2019). North Island forest land doubles in price in a year. Available online at: Stuff.co.nz (accessed May 1)
Cortes-Acosta, S., Grimes, A., and Leining, C. (2020). Decision trees: Forestry in the New Zealand Emissions Trading Scheme post-2020. Wellington: Motu Economic and Public Policy Research. doi: 10.29310/WP.2020.11
Diaz-Rainey, I., and Tulloch, D. (2018). Carbon pricing and system linking: Lessons from the New Zealand Emissions Trading Scheme. Energy Econ. 73, 66–79. doi: 10.1016/j.eneco.2018.04.035
Dorner, Z., and Hyslop, D. (2014). Modelling Changing Rural Land Use in New Zealand 1997 to 2008 Using a Multinomial Logit Approach. Wellington: Motu Economic and Public Policy Research. doi: 10.29310/wp.2014.12
Emery, E. (2022). Personal communication by email to Catherine Leining from Eilish Emery. Auckland: Real Estate Institute of New Zealand (REINZ).
EPA (2014a). Frequently asked questions on the annual reports required by the Climate Change Response Act. Wellington: EPA.
EPA (2022). New Zealand Emissions Trading Register: NZU Conversions (Website content). Wellington: Environmental Protection Authority (EPA).
ETS Review Panel (2011). Doing New Zealand’s Fair Share. Emissions Trading Scheme Review 2011, Final Report. Wellington: Ministry for the Environment (MfE).
Evison, D. (2008). The impact of carbon credits on New Zealand Radiata pine forestry profitability. New Zealand J. Forestry 53, 42.
Evison, D. (2017). The New Zealand forestry sector’s experience in providing carbon sequestration services under the New Zealand Emissions Trading Scheme, 2008 to 2012. Forest Policy Econ. 75, 89–94. doi: 10.1016/j.forpol.2016.10.003
Flaws, B. (2020). Environmental devastation at Tolaga Bay may take a century to recover, says councillor. Available online at: Stuff.co.nz (accessed May 1).
Forest Owners Association (2021). Facts and Figures 2020/21: New Zealand Plantation Forest Industry. Wellington: Forest Owners Association and Ministry for Primary Industries (MPI).
Forest and Bird (2022). ETS must back permanent native forests, not pine monoculture. Available online at: https://www.forestandbird.org.nz/ (accessed May 20, 2022).
ICAP (2022). ETS Map Fact Sheets (Website content). Berlin: International Carbon Action Partnership (ICAP).
ICNZ (2022). Personal communication by email to Catherine Leining from Tim Grafton and John Lucas. Wellington: Insurance Council of New Zealand.
Jackson Inderberg, T. H., and Bailey, I. (2019). Changing the record: Narrative policy analysis and the politics of emissions trading in New Zealand. Environ. Policy Govern. 29, 409–421. doi: 10.1002/eet.1868
Jackson Inderberg, T. H., Bailey, I., and Harmer, N. (2017). Designing New Zealand’s Emissions Trading Scheme. Glob. Environ. Politics 17, 31–50. doi: 10.1162/GLEP_a_00414
Jiang, N., Sharp, B. M. H., and Sheng, M. (2009). Policy Watch: New Zealand’s Emissions Trading Scheme. New Zealand Econ. Papers 43, 69–79. doi: 10.1080/00779950902803993
Karpas, E., and Kerr, S. (2011). Preliminary evidence on responses to the new zealand forestry emissions trading scheme. Wellington: Motu Economic and Public Policy Research. doi: 10.29310/wp.2011.09
Kerr, S., Anastasiadis, S., Olssen, A., Power, W., Timar, L., and Zhang, W. (2012). Spatial and temporal responses to an emissions trading system covering agriculture and forestry: Simulation results from New Zealand. Wellington: Motu Economic and Public Policy Research. doi: 10.29310/wp.2012.10
Kerr, S., and Chapman, R. (2009). Emissions trading in new zealand: Transition and evolution. Wellington: Motu Economic and Public Policy Research.
Kerr, S., and Duscha, V. (2014). Going to the Source: Using an upstream point of regulation for energy in a National Chinese emissions trading system. Energy Environ. 25, 593–612. doi: 10.1260/0958-305X.25.3-4.593
Kerr, S., and Olssen, A. (2012). Gradual land-use change in New Zealand: Results from a dynamic econometric model. Wellington: Motu Economic and Public Policy Research. doi: 10.29310/wp.2012.06
Kerr, S., Ormsby, J., and White, D. (2021). Delinking the New Zealand Emissions Trading Scheme from the Kyoto Protocol: comparing theory with practice. Climate Policy 21, 792–803. doi: 10.1080/14693062.2021.1879722
Kimberley, M., Bergin, D., and Sylvester, W. (2021). Carbon sequestration by native forest: Setting the record straight. Hamilon and Auckland: Tane’s Tree Trust and Pure Advantage.
Leining, C. (2022). A Guide to the New Zealand Emissions Trading System: 2022 Update. Wellington: Motu Economic and Public Policy Research.
Leining, C., Allan, C., and Kerr, S. (2017a). Evolution of the New Zealand Emissions Trading Scheme: Sectoral Coverage and Point of Obligation. Wellington: Motu Economic and Public Policy Research. doi: 10.29310/wp.2017.05
Leining, C., Kerr, S., and Bruce-Brand, B. (2019). The New Zealand Emissions Trading Scheme: Critical review and future outlook for three design innovations. Climate Policy 20, 246–264. doi: 10.1080/14693062.2019.1699773
Leining, C., Ormsby, J., and Kerr, S. (2017b). Evolution of the New Zealand Emissions Trading Scheme: Linking. Wellington: Motu Economic and Public Policy Research. doi: 10.29310/wp.2017.06
Livestock Improvement Corporation, and DairyNZ (2021). New Zealand Dairy Statistics 2020-21. Hamilton: Livestock Improvement Corporation and DairyNZ.
Lough, P. (2022). Personal communication by email to Catherine Leining and Hannah Kotula by Peter Lough. MPI.
MAF, NZFOA, and NZFFA (2009). National exotic forest description as at 1 April 2009. Wellington: MAF.
MAF, NZFOA, and NZFFA (2010). National exotic forest description as at 1 April 2010. Wellington: MAF.
MAF, NZFOA, and NZFFA (2011). National exotic forest description as at 1 April 2011. Wellington: MAF.
Manks. (2022). Personal communication to Catherine Leining by Geoff Manks. Auckland: Sage Partners Ltd.
Manley, B. (2012). Deforestation Survey 2011. Wellington: Ministry of Agriculture and Forestry (MAF).
Manley, B. (2016b). Afforestation responses to carbon price changes and market certainties. Wellington: MPI.
Manley, B. (2018b). Forecasting the effect of carbon price and log price on the afforestation rate in New Zealand. J. Forest Econ. 33, 112–120. doi: 10.1016/j.jfe.2017.11.002
Manley, B. (2021). Afforestation and Deforestation Intentions Survey 2020: Final Report. Wellington: MPI.
Manley, B., and Maclaren, P. (2009). Modelling the impact of carbon trading legislation on New Zealand’s plantation estate. New Zealand J. Forestry 54, 39–44.
Meade, R., Fiuza, G., and Lu, A. (2008). Forest and forest land valuation: How to value forests and forest land to include carbon costs and benefits (Report for MAF). Wellington: New Zealand Institute for the Study of Competition and Regulation Inc.
MfE (2015). Report upon expiration of the additional period for fulfilling commitments by New Zealand. Wellington: MfE.
MfE (2019). New Zealand’s fourth biennial report under the United Nations framework convention on climate change. Wellington: MfE.
MfE (2020). Departmental report of the ministry for the environment and the ministry for primary industries − Version. Wellington: MfE, 1.
MfE (2022b). Latest update on New Zealand’s 2020 net position: April 2022 update (Website content). Wellington: MfE.
MfE (2022c). New Zealand’s projected greenhouse gas emissions to 2050 (Website content). Wellington: MfE.
MfE, and Ministry for Primary Industries (2012). Departmental report on the climate change response (Emissions Trading and Other Matters) Amendment Bill. Wellington: MfE.
MfE, and The Treasury (2007). The Framework for a New Zealand Emissions Trading Scheme. Wellington: MfE.
MPI (2015b). Look-Up Tables for Post-1989 Forest Land in the Emissions Trading Scheme. Wellington: MPI.
MPI (2016a). Offsetting deforestation of pre-1990 forest land under the Emissions Trading Scheme. Wellington: MPI.
MPI (2016b). OIA16-0176: Forestry ETS data (Response to an OIA request made by Motu). Wellington: MPI.
MPI (2018). Historical information on hectares added, registered and removed in the ETS. Wellington: MPI.
MPI (2019a). Emissions trading scheme forestry accounting proposals: Regulatory impact assessment. Wellington: MPI.
MPI (2019b). Exports of Forestry Products from New Zealand years ended 30 June 1981 to 2018. Wellington: MPI.
MPI (2022a). Managing exotic afforestation incentives: Interim regulatory impact statement. Wellington: MPI.
MPI and MfE (2022). Managing exotic afforestation incentives: Proposals to change forestry settings in the NZ Emissions Trading Scheme. Wellington: MPI.
MPI, New Zealand Forest Owners Association (NZFOA) New Zealand Farm Forestry Association (NZFFA) (2021). National Exotic Forest Description as at 1 April 2021. Wellington: MPI.
MPI, NZFOA, and NZFFA (2012). National exotic forest description as at 1 April 2012. Wellington: MPI.
MPI, NZFOA, and NZFFA (2013). National exotic forest description as at 1 April 2013. Wellington: MPI.
MPI, NZFOA, and NZFFA (2014). National exotic forest description as at 1 April 2014. Wellington: MPI.
MPI, NZFOA, and NZFFA (2016). National exotic forest description as at 1 April 2016. Wellington: MPI.
MPI, NZFOA, and NZFFA (2017). National exotic forest description as at 1 April 2017. Wellington: MPI.
MPI, NZFOA, and NZFFA (2019). National exotic forest description as at 1 April 2019. Wellington: MPI.
Mundaca, L., and Richter, J. L. (2013). Challenges for New Zealand’s carbon market. Nature Clim. Change 3, 1006–1008. doi: 10.1038/nclimate2052
Nabuurs, G.-J., Mrabet, R., Hatab, A. A., Bustamenta, M., Clark, H., Havlik, P., et al. (in press). Agriculture, Forestry and Other Land Uses (AFOLU), in: Climate Change 2022: Mitigation of climate change. Cambridge: Cambridge University Press.
New Zealand Government (2008). Climate Change Response (Emissions Trading) Amendment Act. Wellington: New Zealand Government.
New Zealand Productivity Commission (2017). Low-emissions economy (Issues Paper). Wellington: New Zealand Productivity Commission.
Northland Age (2022). Government’s plan to remove pine from ETS “disastrous” for Māori. Kaitaia: Northland Age.
NZFOA (2022). Pines vital to reach climate change targets (Media Release 26 January 2022). Wellington: NZFOA.
Orme, S., and Orme, P. (2021). Independent validation of land-use change from pastoral farming to large-scale forestry. Masterton: BakerAg.
Parliamentary Commissioner for the Environment (2019). Farms, forests and fossil fuels: The next great landscape transformation?. Wellington: Parliamentary Commissioner for the Environment.
Pohatu, P., O’Brien, S., and Mercer, L. (2020). Challenges and opportunities with native forestry on Māori land. Wellington: Motu Economic and Public Policy Research. doi: 10.29310/WP.2020.13
REINZ (2019). Government forestry incentives see forestry farm prices increase by 45%, says REINZ. Auckland: REINZ.
Richter, J. L., and Mundaca, L. (2013). Market behavior under the New Zealand ETS. Carbon Manag. 4, 423–438. doi: 10.4155/cmt.13.33
Rontard, B., and Leining, C. (2021). Future Options for Industrial Free Allocation in the NZ ETS. Wellington: Motu Economic and Public Policy Research. doi: 10.29310/WP.2021.13
Salmond, A. (2021). The case for nature-based forests. Available online at: https://www.newsroom.co.nz/ (accessed May 20, 2022).
Smith, J. (2014). Emissions Trading Scheme appears to be dying along with hundreds of thousands of pine tree seedlings. Available online at: interest.co.nz (accessed May 1)
Stillman, S. (2005). Examining changes in the value of rural land in New Zealand between 1989 and 2003. Wellington: Motu Economic and Public Policy Research. doi: 10.29310/wp.2005.07
Te Uru Rākau (2018a). A Better ETS for Forestry: Proposed amendments to the Climate Change Response Act 2002. Te Uru Rākau.
Te Uru Rākau (2021a). One Billion Trees Fund: 30 Month Monitoring and Evaluation Report. Te Uru Rākau.
Te Uru Rākau (2021b). Emissions trading scheme for forestry as at 31 December 2021. Ministry for Primary Industries.
Te Uru Rākau (2022). Explanatory Note: Climate Change (Forestry Sector) Regulations 2022 − Summary Note for Exposure Draft. Te Uru Rākau.
WPMA (2022). WPMA’s Submission on managing exotic afforestation incentives proposals to change the forestry settings in the NZ Emissions Trading Scheme. Wood Processors and Manufacturers Association (WPMA).
Keywords: New Zealand Emissions Trading Scheme, climate change, forestry, deforestation, afforestation
Citation: Carver T, Dawson P, O’Brien S, Kotula H, Kerr S and Leining C (2022) Including forestry in an emissions trading scheme: Lessons from New Zealand. Front. For. Glob. Change 5:956196. doi: 10.3389/ffgc.2022.956196
Received: 30 May 2022; Accepted: 05 September 2022;
Published: 23 September 2022.
Edited by:
Yashwant Singh Rawat, Federal Technical and Vocational Education and Training Institute (FTVETI), EthiopiaReviewed by:
Abayneh Derero, Ethiopian Environment and Forest Research Institute, EthiopiaCopyright © 2022 Carver, Dawson, O’Brien, Kotula, Kerr and Leining. This is an open-access article distributed under the terms of the Creative Commons Attribution License (CC BY). The use, distribution or reproduction in other forums is permitted, provided the original author(s) and the copyright owner(s) are credited and that the original publication in this journal is cited, in accordance with accepted academic practice. No use, distribution or reproduction is permitted which does not comply with these terms.
*Correspondence: Catherine Leining, Y2F0aGVyaW5lLmxlaW5pbmdAbW90dS5vcmcubno=; aW5mb0Btb3R1Lm9yZy5ueg==
†These authors share last authorship
Disclaimer: All claims expressed in this article are solely those of the authors and do not necessarily represent those of their affiliated organizations, or those of the publisher, the editors and the reviewers. Any product that may be evaluated in this article or claim that may be made by its manufacturer is not guaranteed or endorsed by the publisher.
Research integrity at Frontiers

Learn more about the work of our research integrity team to safeguard the quality of each article we publish.