 Pankaj Awasthi
 Kiran Bargali
 Surendra Singh Bargali
 Kavita Khatri
 Manoj Kumar Jhariya
95% of researchers rate our articles as excellent or good
Learn more about the work of our research integrity team to safeguard the quality of each article we publish.
Find out more
ORIGINAL RESEARCH article
Front. For. Glob. Change , 31 May 2022
Sec. Forest Disturbance
Volume 5 - 2022 | https://doi.org/10.3389/ffgc.2022.913127
This article is part of the Research Topic Variation in Plant Strategies with Levels of Forest Disturbance View all 8 articles
Coriaria nepalensis is one of the shrubs which have the ability to mitigate the frequency of perilous natural events or natural calamities. This paper elucidates the nutrient dynamics of C. nepalensis shrublands in degraded hills of Kumaun Himalaya. The average nutrient concentration (N, P, and K) in aboveground components of C. nepalensis was in the following order: Foliage > Twigs > Branches > Bole wood, whereas in belowground components the order was: Fine roots > Lateral roots > Stump root. The order of contribution to total nutrient storage in vegetation was: Tree > Herbs > Shrubs. The proportion of nutrients stored in the shrub layer was in the order: N > K > P. The soil stored a maximum proportion of nutrients at each site (79.48–87.54% N, 70.47–87.88% P, 74.33–88.27% K). Maximum nutrient storage in soil and vegetation was recorded for site 3 (Barapatthar) and minimum for site 1 (Pines). The uptake of N, P, and K by vegetation ranged from 428 to 1,353 kg ha–1 yr–1, 32–102 kg ha–1 yr–1, and 109–479 kg ha–1 yr–1, respectively. In the present study, the turnover time was 1.06–1.33 years for N, 1.03–1.15 years for P, and 1.02–1.13 years for K. Compartment models reflect the distribution of nutrients and net annual flux that will help to develop the management plan to maintain the fertility and productiveness of the degraded sites.
The forest ecosystem production depends on the site condition and concentration of nutrients in the vegetation (trees, shrubs, and herbs) and soil pool, which are available in different amounts and play a major role in every plant’s physiological activity. The functional and natural balance in the intra-system cycling of the given ecosystem determines the net flux and budget of the nutrients and affects the sustainability of the ecosystem (Bargali and Singh, 1997; Gautam and Mandal, 2018; Pang et al., 2020).
The status of the nutrients in the plant and soil pools are the key indicator of site quality in terms of potential productiveness and offers the best growing environment to the regenerative crops in the forest ecosystem (Raha et al., 2020; Ray et al., 2020). The nutrient budgeting and flux in the forest ecosystem study helps toward soil health restoration and management plans, as well understanding the ecological paradigm of nutrient partitioning and resource utilization. In this perspective, the accumulation and transfer and nutrients among vegetation, litter, and soil have been explored by various researchers in various forests and plantations or shrublands across the world (Bargali et al., 1992; Lodhiyal et al., 1995; Mfilinge et al., 2002; Gautam and Mandal, 2018; Pang et al., 2020).
Deforestation and disturbances of various forms alter the nutrient availability and cycling in vegetation and soil compartments (Singh, 2021; Manral et al., 2022). Besides this, the presence of vegetation and species admixture in addition to biophysical characteristics of site and disturbance regimes also determine the stock and dynamics of the nutrient (Gautam and Mandal, 2018; Singh et al., 2022). Thus, the balance among the inputs and outputs i.e., fixation, deposition, weathering, leaching, and volatilization, etc. are the prime concern and management aspect for a better nutrient status of the forest ecosystem (Vitousek and Sanford, 1986; Bargali et al., 2018; Manral et al., 2020; Karki et al., 2021). Furthermore, the uptake of nutrient, its retention, and its release are the integral components of nutrient dynamics of the forest ecosystem. The imbalance among these components leads to degradation of soil health and fertility (Bargali et al., 2019).
Examining these dynamic aspects of nutrient and mineral cycling in the forest ecosystem, the present work was carried out to cover the aspects of nutrient cycling in C. nepalensis dominated shrublands with regards to biomass accumulation and net primary production (described in the first part of this paper—Awasthi et al., 2022). Moreover, the present work highlighted the information on concentration of nutrients, content, uptake, return, turnover, use efficiency, and cycling of nutrients in C. nepalensis dominated shrubland in Kumaun Himalaya in India.
The present investigation was done in the Kumaun Himalayan region (Uttarakhand state) comprising five sites i.e., Pines (Site-1), Rusi (Site-2), Barapatthar (Site-3), Hanumangarhi (Site-4), and Takula (Site-5). The study area is placed between 29°21′57′′ N latitude and 79°27′23′′ E longitude. The species C. nepalensis occurred in patches, each surrounded by relatively large open areas with small woody plant cover. After the selection of study sites, the most prominent patches of C. nepalensis were selected for investigation and observations and the phyotosociological attributes of the sites were given in Awasthi et al. (2022).
The study area has a warm monsoon climate. The mean monthly temperature ranged from 12 to 32°C during summer and 1 to 7°C during winter. The highest annual rainfall in the region was recorded as 944.7 mm (August) whereas the lowest rainfall was observed to be 0 mm (November). The soils of the sites are sandy loam or sandy clayey loam.
The component of trees (bole wood, bark, branches, twigs, foliage, and reproductive parts), shrubs (bole wood, branches, twigs, and foliage), and herbs (aboveground and belowground parts) were collected from each site from 10 to 20 trees and shrubs of all the available species and brought to the laboratory in September 2019. The samples for the components of roots (stump, lateral, and fine) for both trees and shrubs were collected by digging out roots to approximately 1 m depth. Composite samples (3) of each component of the trees, shrubs, and herbs were oven dried at 60°C to constant weight. The samples were then millground to estimate the nutrient concentration. For each replicate a composite sample of 1.0 g of soil and plant material was analyzed for total nitrogen after digestion in 10 ml concentrated sulfuric acid using 5 g catalyst mixture (Potassium Sulfate and Cupric Sulfate in ratio of 9:1) with a quick digestion unit. The total nitrogen was determined by micro-Kjeldahl digestion and titration method (Kjeldahl, 1883; Peach and Tracey, 1956; Misra, 1968). Phosphorus and potassium were extracted by wet ashing of 0.5 g plant material, in an acid mixture, consisting of 10 ml H2SO4 + 3 ml HNO3 + 1 ml HClO4 following the method of Jackson (1958). Phosphorus was determined by spectrophotometry and potassium by flame photometry (Jackson, 1958). The total amount of nutrients in the vegetation was obtained by summing the amounts in the different components.
At each site, soil samples were collected from two depths i.e., 0–15 cm (surface layer) and 15–30 cm (sub-surface layer) in triplicate with the help of a soil corer. There was a total of 90 samples (5 sites × 3 seasons × 3 replicates × 2 depth layer). Air dried soil samples were passed through the 2 mm sieve to remove large soil particle and other waste material and then stored in plastic zipper bags for further chemical analysis. The chemical characteristics of the soil, i.e., total nitrogen (Kjeldahl, 1883), phosphorus (Olsen et al., 1954), and exchangeable potassium (Black, 1965) was analyzed following standard ecological methods. The amount of nutrients in both strata (10–15 and 15–30 cm) of soil was obtained by multiplying bulk density, soil volume, and nutrient concentration values (N, P, and K). The amounts of nutrients estimated in both strata were summed to obtain total nutrient content up to 30 cm depth.
Nutrient uptake was computed by multiplying the value of net primary productivity of different components by their respective nutrient concentration. Litter samples were collected from the litter traps at monthly intervals in different sites. The samples of foliage, twigs, bark, reproductive parts, and miscellaneous were separated and analyzed for nutrients. The nutrient concentration was multiplied by the weight of litter fall to compute the amount of nutrients transferred to the shrubland floor. The turnover rate (K) was calculated as Chaturvedi and Singh (1987).
Where, A is amount of nutrients added to the shrubland floor by litter fall, F is the nutrient content of the lowest value of the standing crop of litter in the annual cycle. Turnover time (t) is the reciprocal of the turnover rate (K).
Percentage retranslocation of nutrients from senescing components i.e., foliage, twigs, bark, and reproductive parts to the perennial tissues was calculated following Vitousek and Sanford (1986) and Ralhan and Singh (1987).
Where, R is nutrient retranslocation (%), X is the nutrient mass in mature green foliage, and Y is the nutrient mass in senesced components. X and Y were calculated on the basis of nutrient per unit weight of mature green and senesced components, respectively, multiplied by total amount of fall of respective litter component.
To estimate nutrient retranslocation, 20 g mature attached and freshly fallen senesced components were collected in August (peak month of leaf maturity) and November (component senescing period) 2018, respectively. Since rainfall is negligible in the region during leaves senescence (November), leaching is likely to have only a minimal effect on nutrient loss from the leaves (Ralhan and Singh, 1987). Percent nutrient retranslocation efficiency (PNRE) was calculated according to Finzi et al. (2001).
Where, A is the nutrient in the live component, and B is the nutrient in the litter component.
Nutrient use efficiency (NUE) was calculated according to Vitousek (1984):
The compartment models of nutrients (N, P, K) dynamics were developed for site-1 to site-5. These compartment models represent the overall structure and functioning including nutrient stock and annual fluxes of nutrients in the ecosystem studied. The average values of nutrient content (kg ha–1) are placed in the compartments. Net annual fluxes (of N, P, and K) between compartments are depicted by arrows (kg ha–1 yr–1). The amount present in the soil to the depth of 30 cm is considered source and that associated with the decomposition is released into the soil for reuse.
In the present study, the average nutrient concentration (N, P, and K) in the vegetation i.e., trees, shrubs and herbs varied from site to site because of the variation in species composition (Table 1). The concentration of nutrients in the aboveground components of trees was in the order: Reproductive parts > Foliage > Twigs > Branches > Bole wood > Bark. In the belowground components, the order was: Stump root < Lateral roots < Fine roots. In shrubs, the order of nutrient concentration in aboveground components was: Foliage > Twigs > Branches > Bole wood while the order of the belowground components was the same as in trees. In the case of herbs, the nutrient concentrations in aboveground parts were always higher than in belowground parts. In the case of soil surface, the concentration of nutrients is generally higher in the surface layer (0–15 cm) than in the sub-surface layer (15–30 cm) due to presence of excessive organic matter on the surface layer (Table 1).
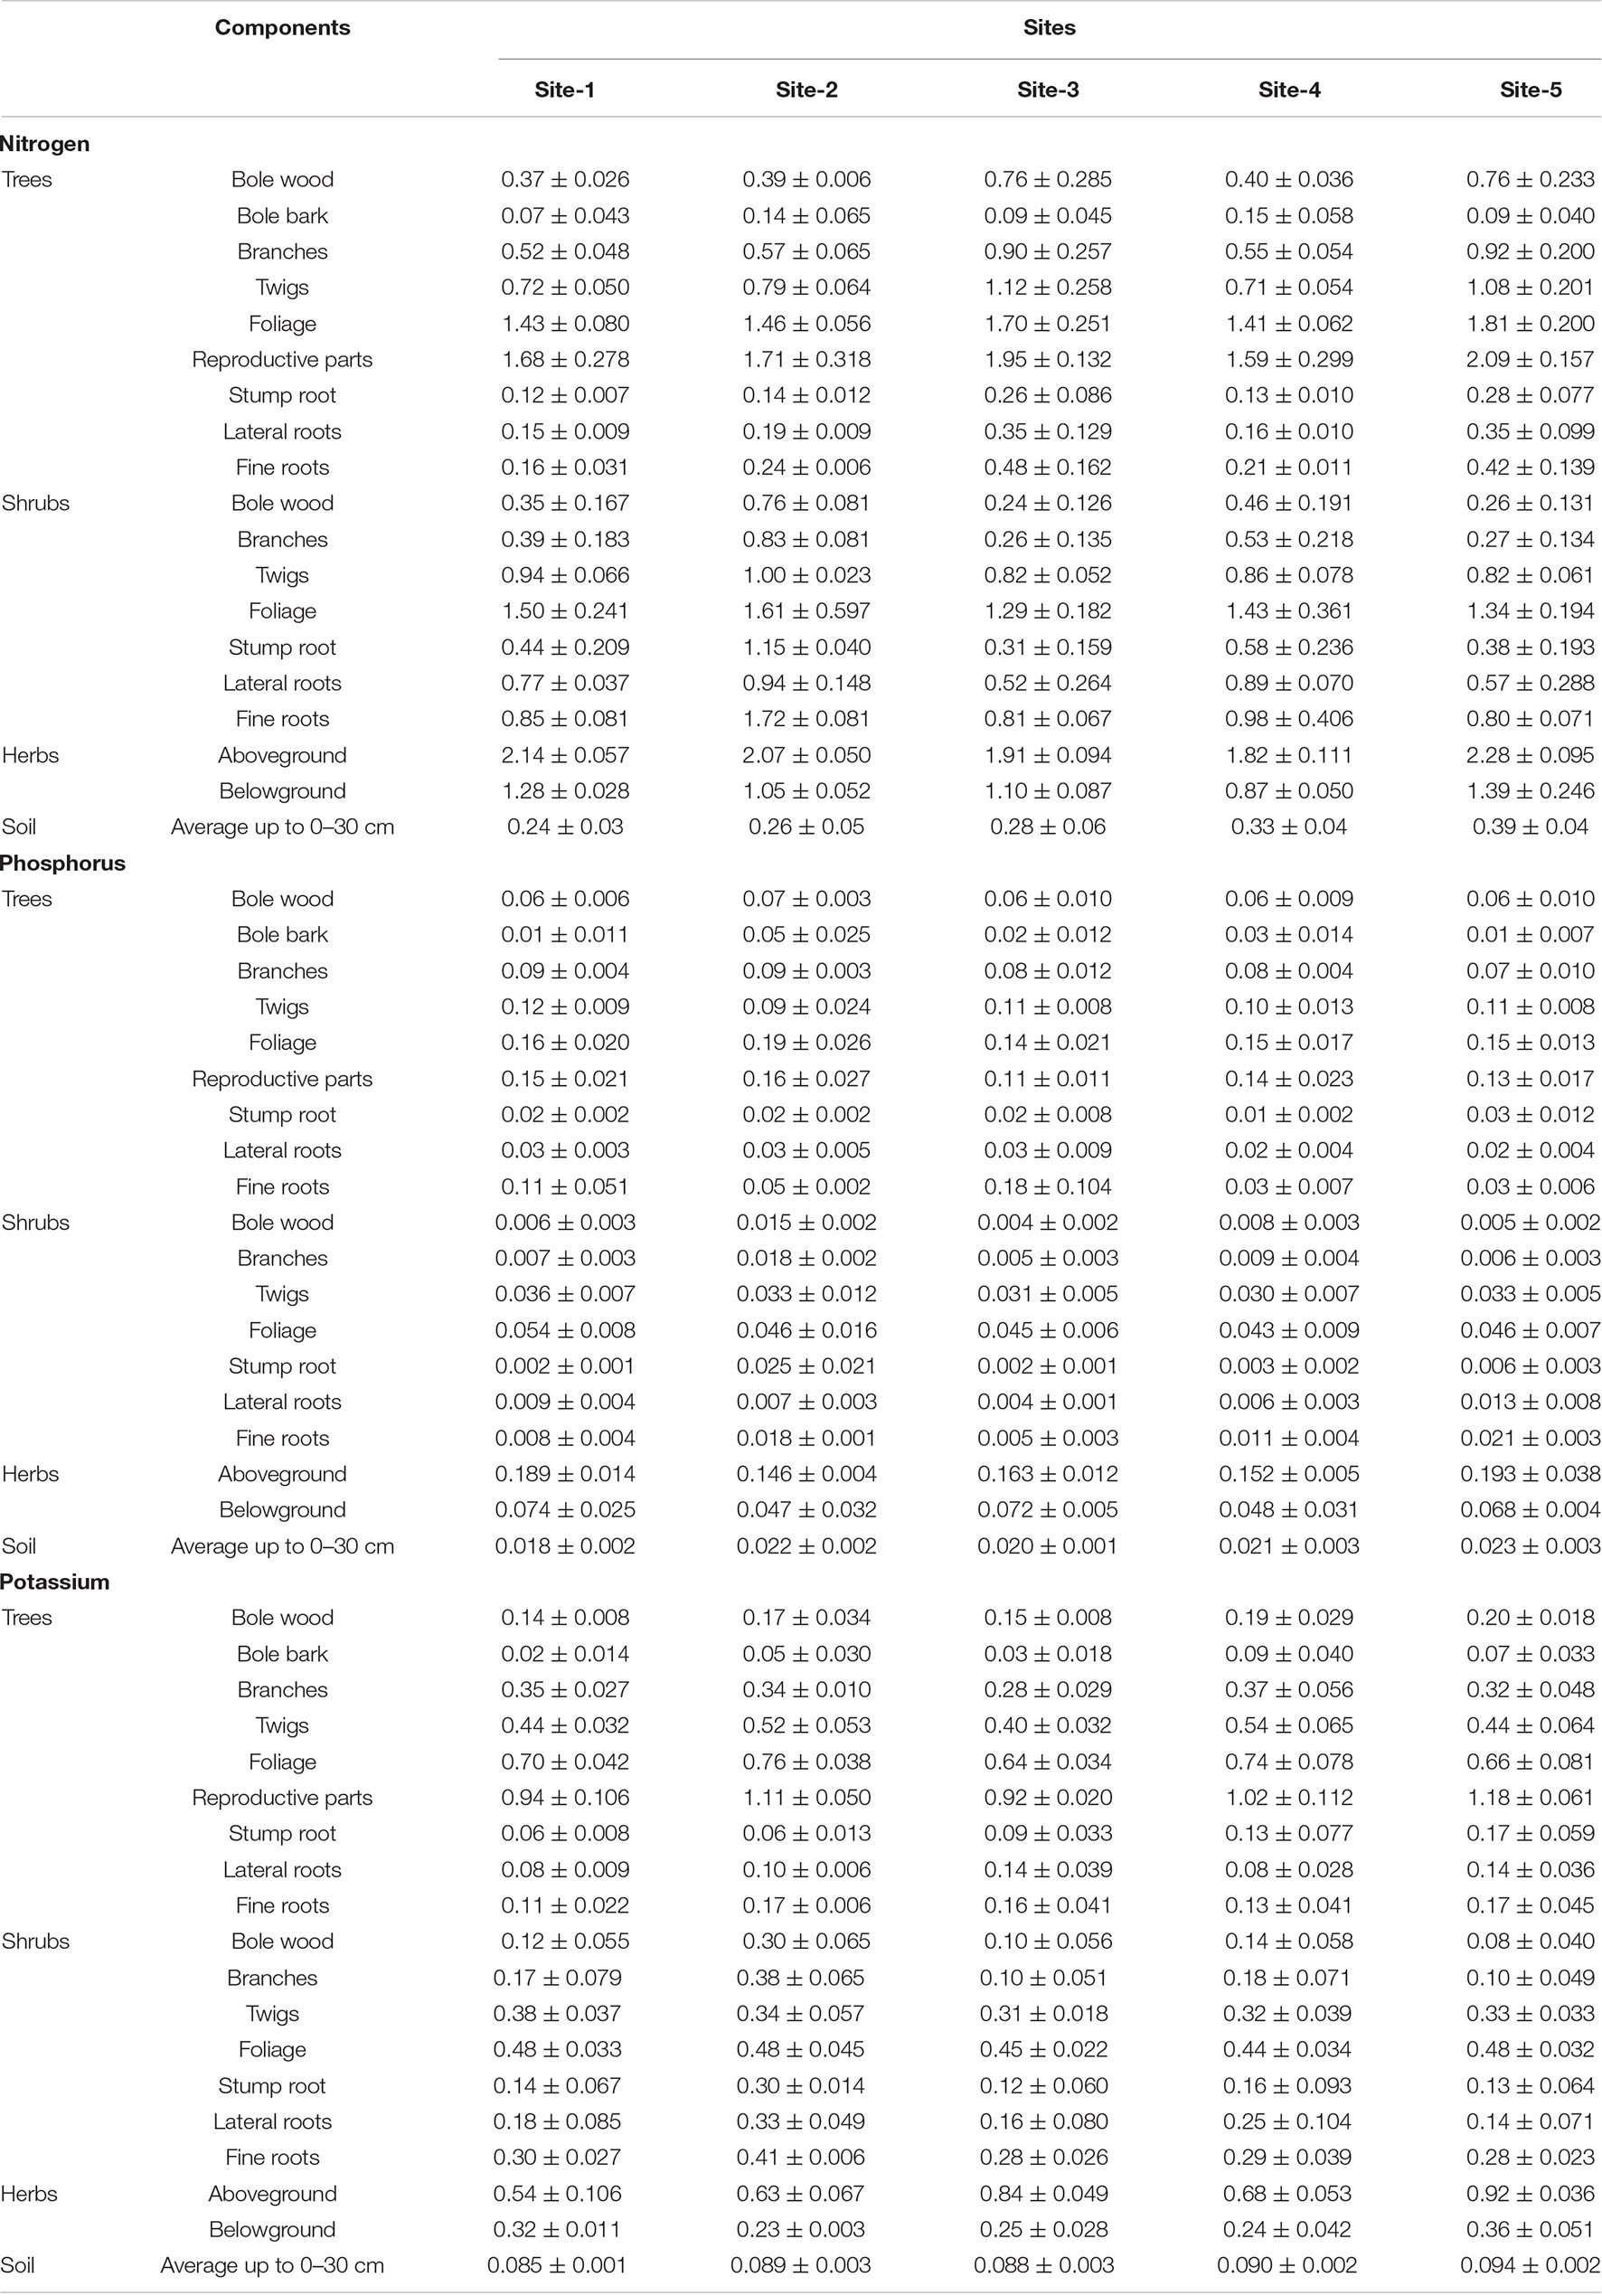
Table 1. Mean (± SE) concentration (%) of nitrogen, phosphorus, and potassium in different components of tree layer, shrub layer, herb layer, and soil across the selected sites.
The mean concentration of N in every component across the sites was high in C. nepalensis as compared to the average concentration of shrub components. The high concentration N can be attributed to the high nitrogen fixing ability of C. nepalensis. Concentration of N in the foliage and fine roots of C. nepalensis was 226 and 165% higher than the average concentration in the foliage and fine roots of other shrubs, respectively, across the sites (Table 2). Concentration of phosphorus and potassium was more or less in a similar range in comparison to the other shrub species. Concentration of nutrients decreased in the order: N > K > P.
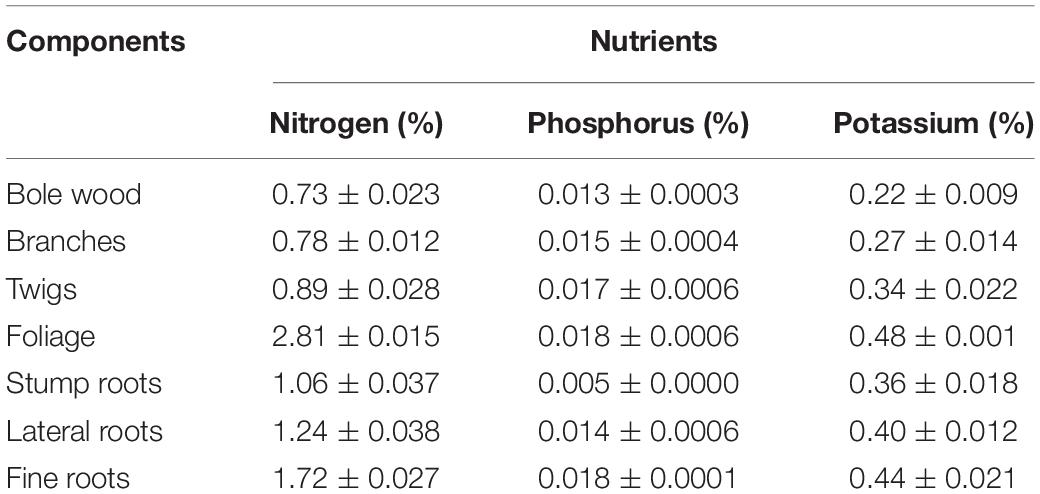
Table 2. Mean nutrient concentration (Mean ± SE) (N, P, and K) in different components of C. nepalensis of 3 CBH classes (0–20, 20–40, and above 40 cm) of harvested sample (n = 3) across the sites.
Across the sites maximum nutrient (N, P, K) stock was recorded at site 3 (3,171 kg ha–1 N, 277 kg ha–1 P, and 1,037 kg ha–1 K) while the minimum nutrient stock (1,295 kg ha–1 N, 93 kg ha–1 P, and 433 kg ha–1 K) was recorded at site-1 (Table 3). In the tree layer, the relative contribution of aboveground components to the standing state of nutrients was generally in the order: Bole wood > Foliage > Branches > Twigs > Bole bark > Reproductive parts and contribution of belowground components was in the order: Stump root > Lateral roots > Fine roots. The order reported in shrubs was: Bole wood > Foliage > Branches > Twigs in aboveground components and Stump root > Lateral roots > Fine roots in belowground components. Herb aboveground parts recorded higher nutrient stock than belowground parts. Among vegetation types, trees contributed 21–51% N, 44–70% P, and 29–50% K; shrubs contributed 20–41% N, 7–9% P, and 22–31% K while herbs contributed 29–46% N, 32–49% P, and 23–44% K to the total vegetation nutrient stock (Table 3). The total nitrogen, phosphorus, and potassium content in the soil to a depth of 30 cm ranged from 7150.77 kg ha–1 (Site-2) to 12316.17 kg ha–1 (Site-3), 640.50 kg ha–1 (Site-1) to 812.24 kg ha–1 (Site-2), 3043.05 kg ha–1 (Site-4) to 3341.56 kg ha–1 (Site-2), respectively (Table 3). Generally, soil nutrient stock was greater than vegetation nutrient stock.
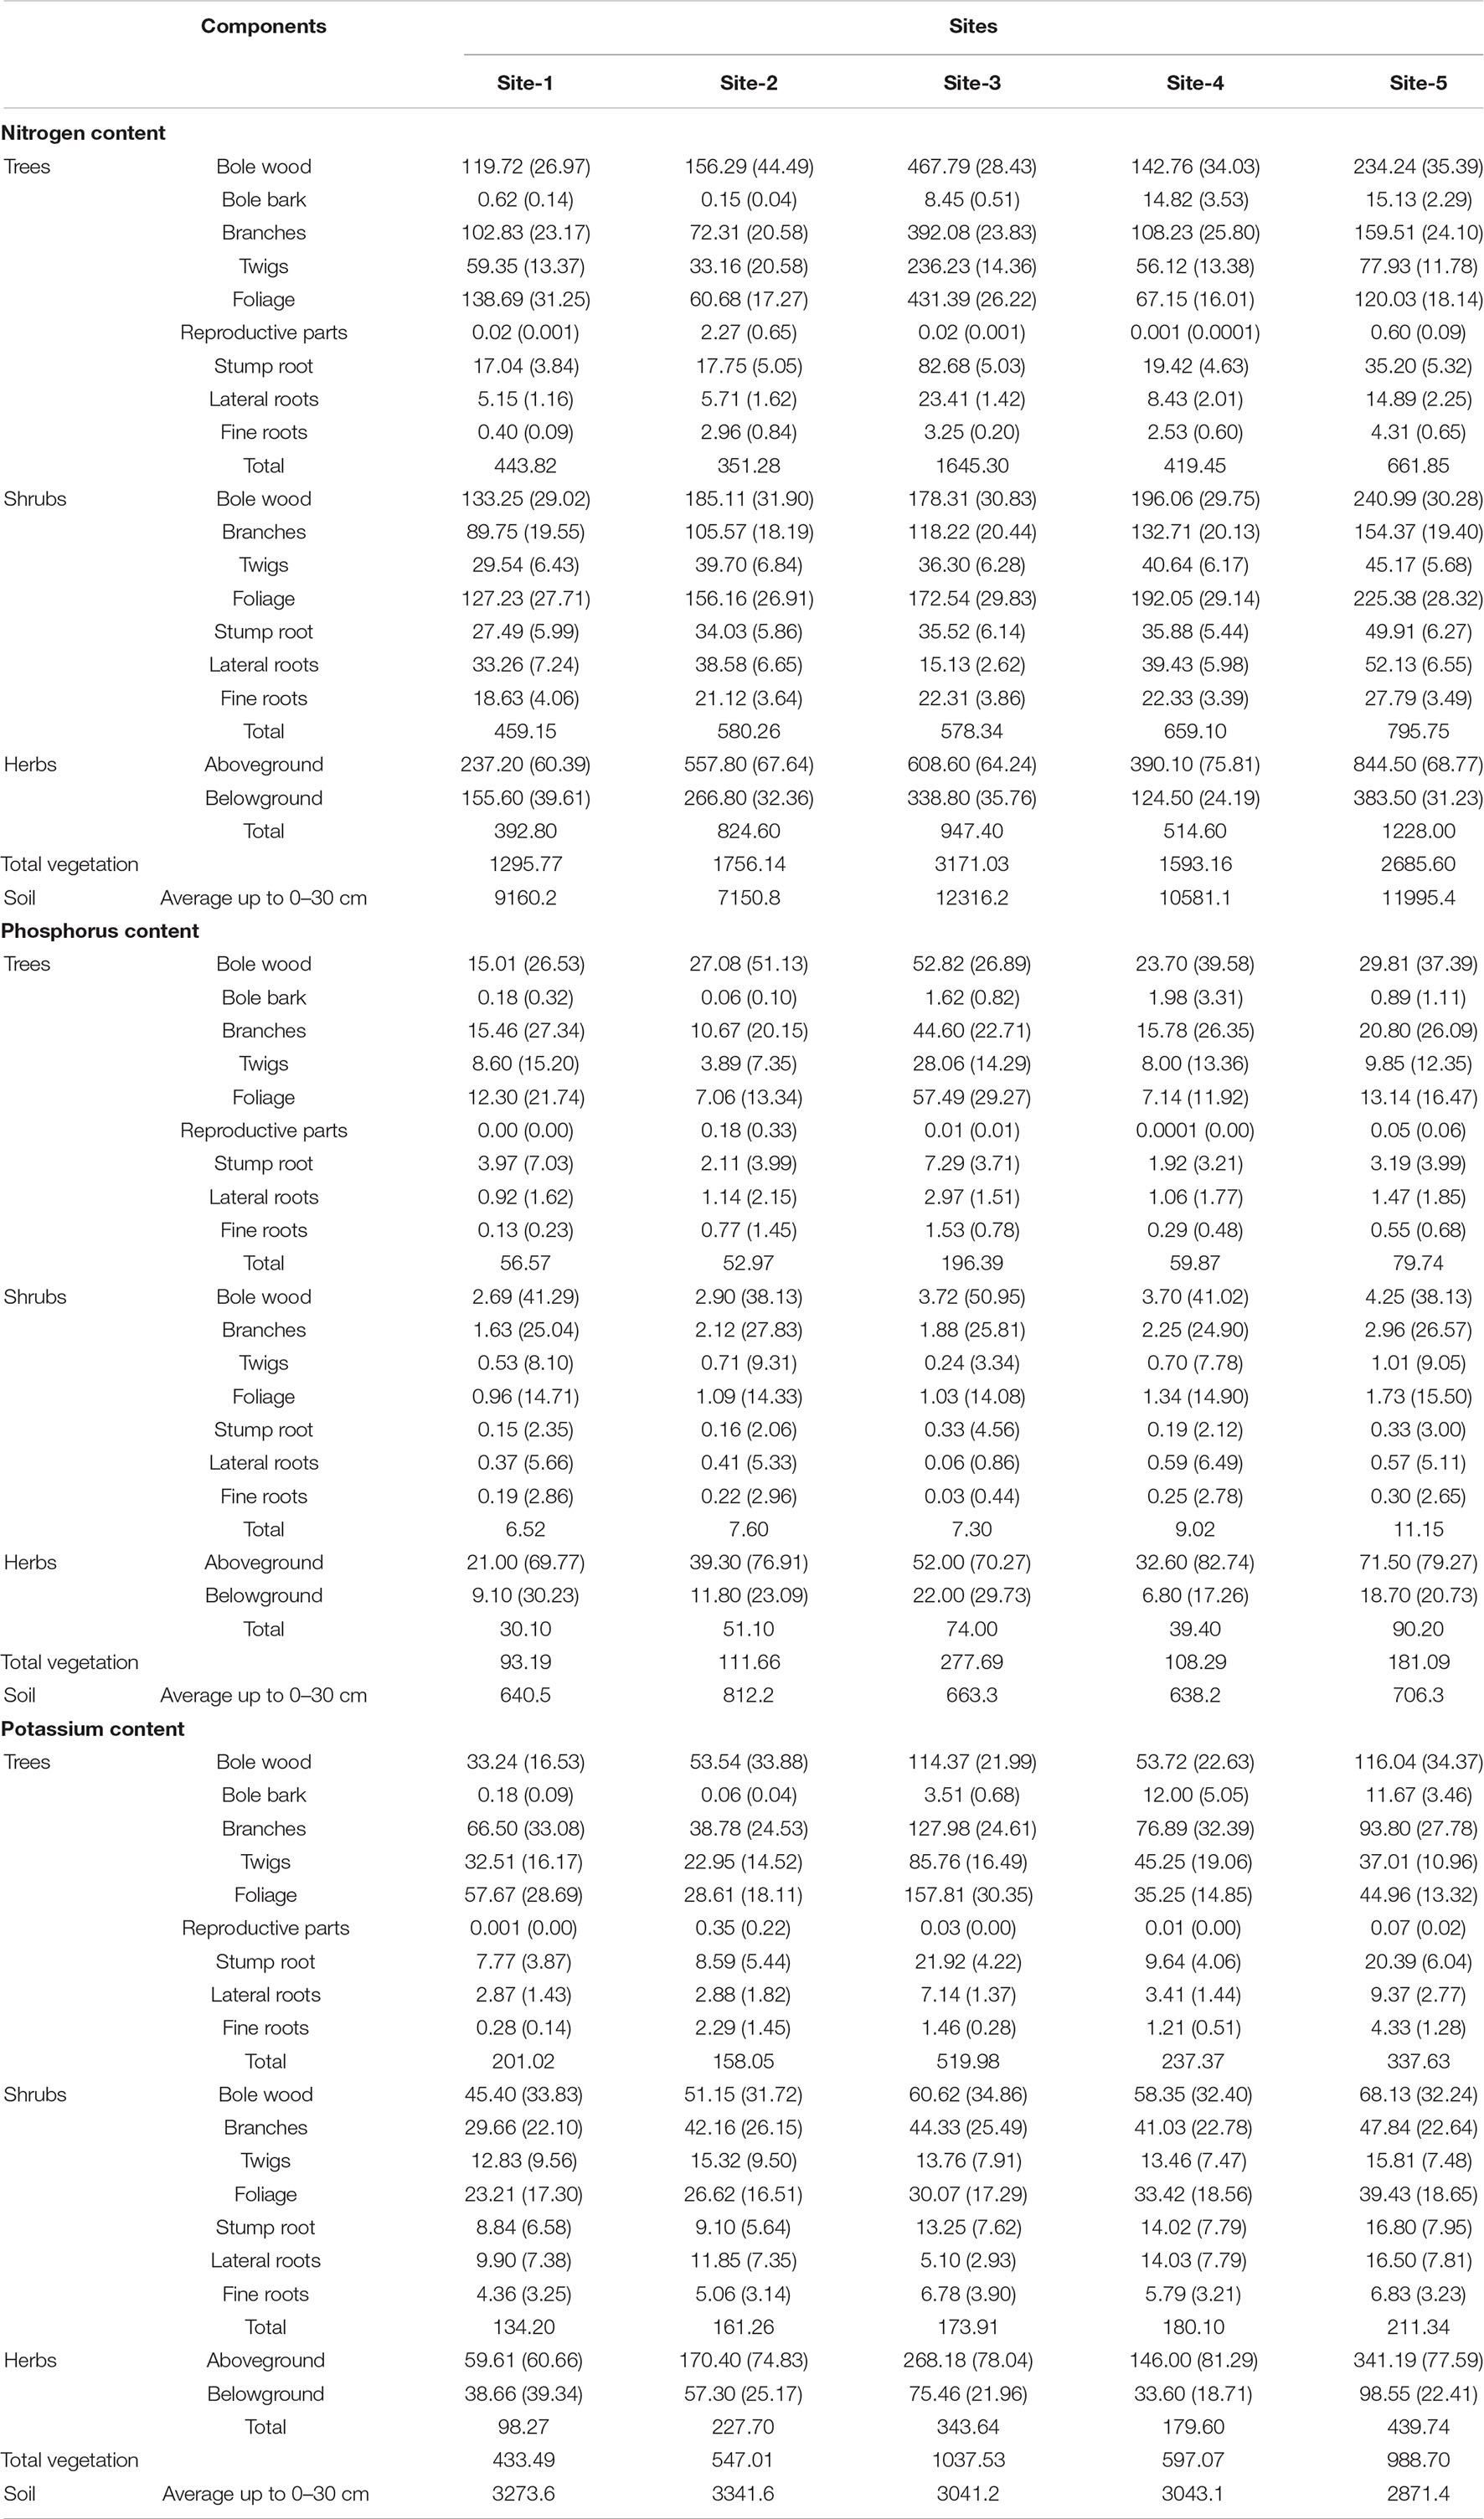
Table 3. Nutrient content (kg ha–1) in different layers of vegetation across the selected study sites (values in parenthesis are percentage of the total).
The retranslocation of nutrients from senescing foliage, reproductive parts, twigs, and bark is given in Table 4. Across the sites, maximum nitrogen, phosphorus, and potassium were retranslocated by leaves (33–35% N, 61–97% P, and 79–81% K) and reproductive parts (30–42% N, 43–87% P, and 78–79% K) whereas minimum retranslocation was reported for bark. The general order of nutrients retranslocated from litter to soil was K > P > N whereas the order for nutrient retranslocation by litter components was: Reproductive parts > Foliage > Twigs > Bark for nitrogen.
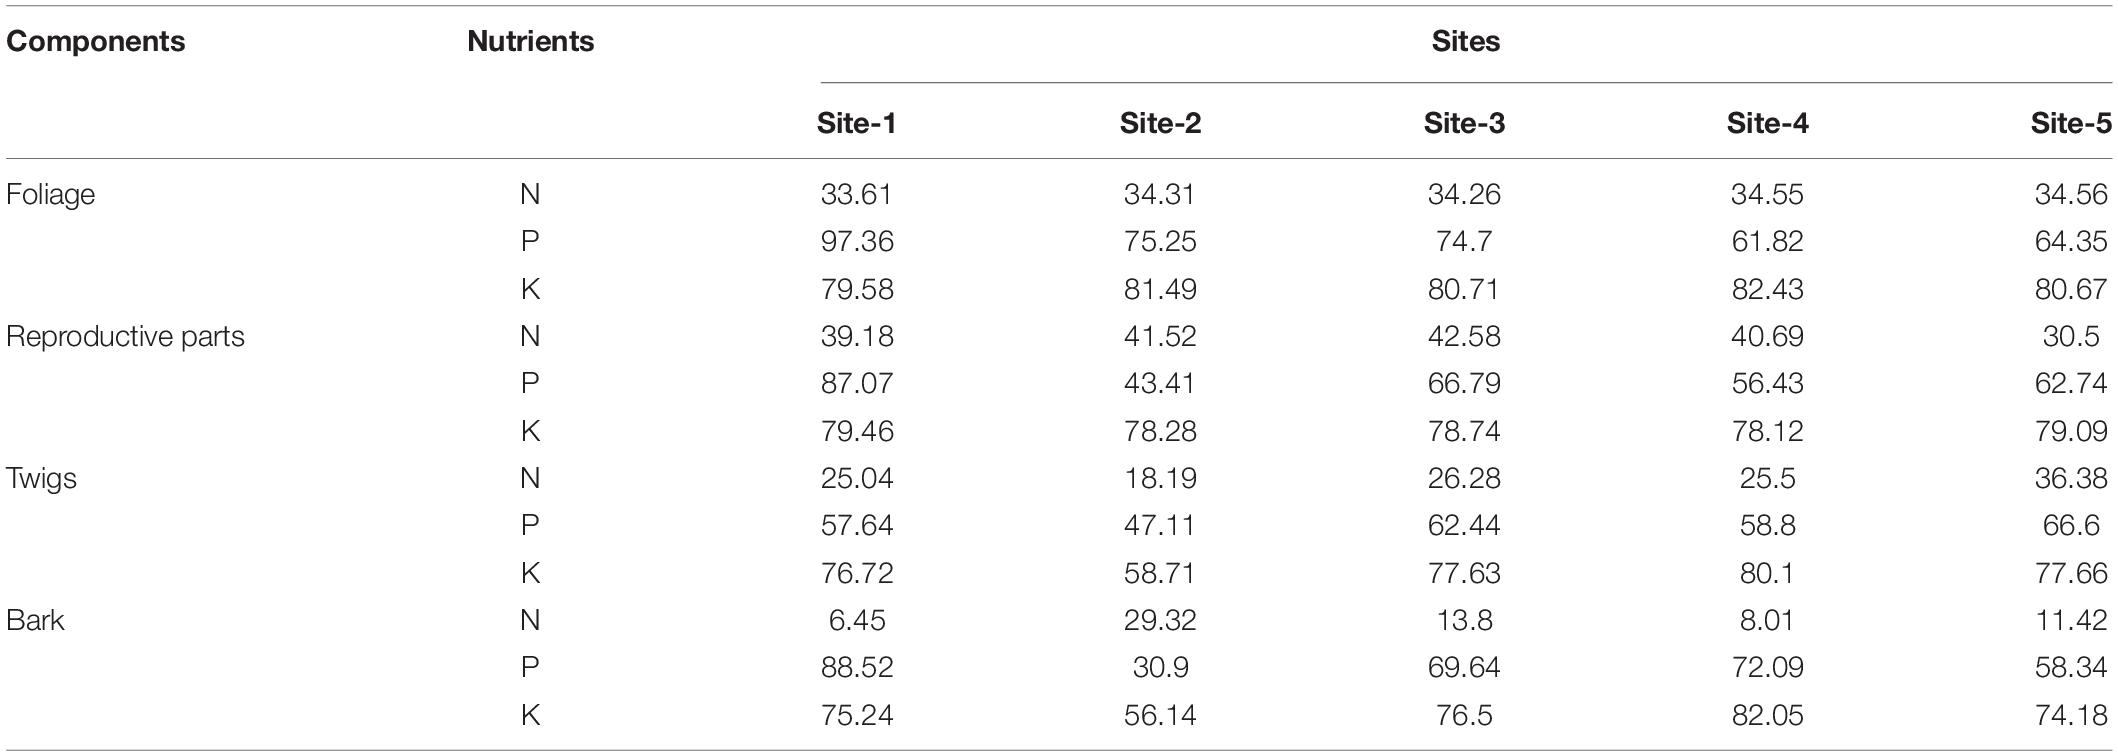
Table 4. Percentage retranslocation of nutrient from different plant parts during senescence.
The uptake of nitrogen, phosphorus, and potassium by total vegetation ranged from 428.22 to 1352.95 kg ha–1 yr–1, 31.66 to 102.27 kg ha–1 yr–1, and 109.26 to 479.60 kg ha–1 yr–1, respectively (Table 5). After the adjustment for internal cycling, the uptake of nitrogen, phosphorus, and potassium ranged from 427.00 to 1334.14 kg ha–1yr–1, 31.296 to 99.383 kg ha–1 yr–1, and 107.87 to 872.81 kg ha–1 yr–1, respectively to the total vegetation (Table 5). Among the aboveground parts of the trees, the order of uptake was: Bole wood > Foliage > Branches > Twigs > Reproductive parts > Bole bark while among the belowground parts of the trees, the maximum uptake of N was reported for stump root followed by lateral roots and fine roots (Table 5). In shrubs, the uptake by aboveground components was generally in the order: Foliage > Bole wood > Twigs > Branches whereas in belowground components the order was: Fine roots < Lateral roots < Stump root (Table 5).
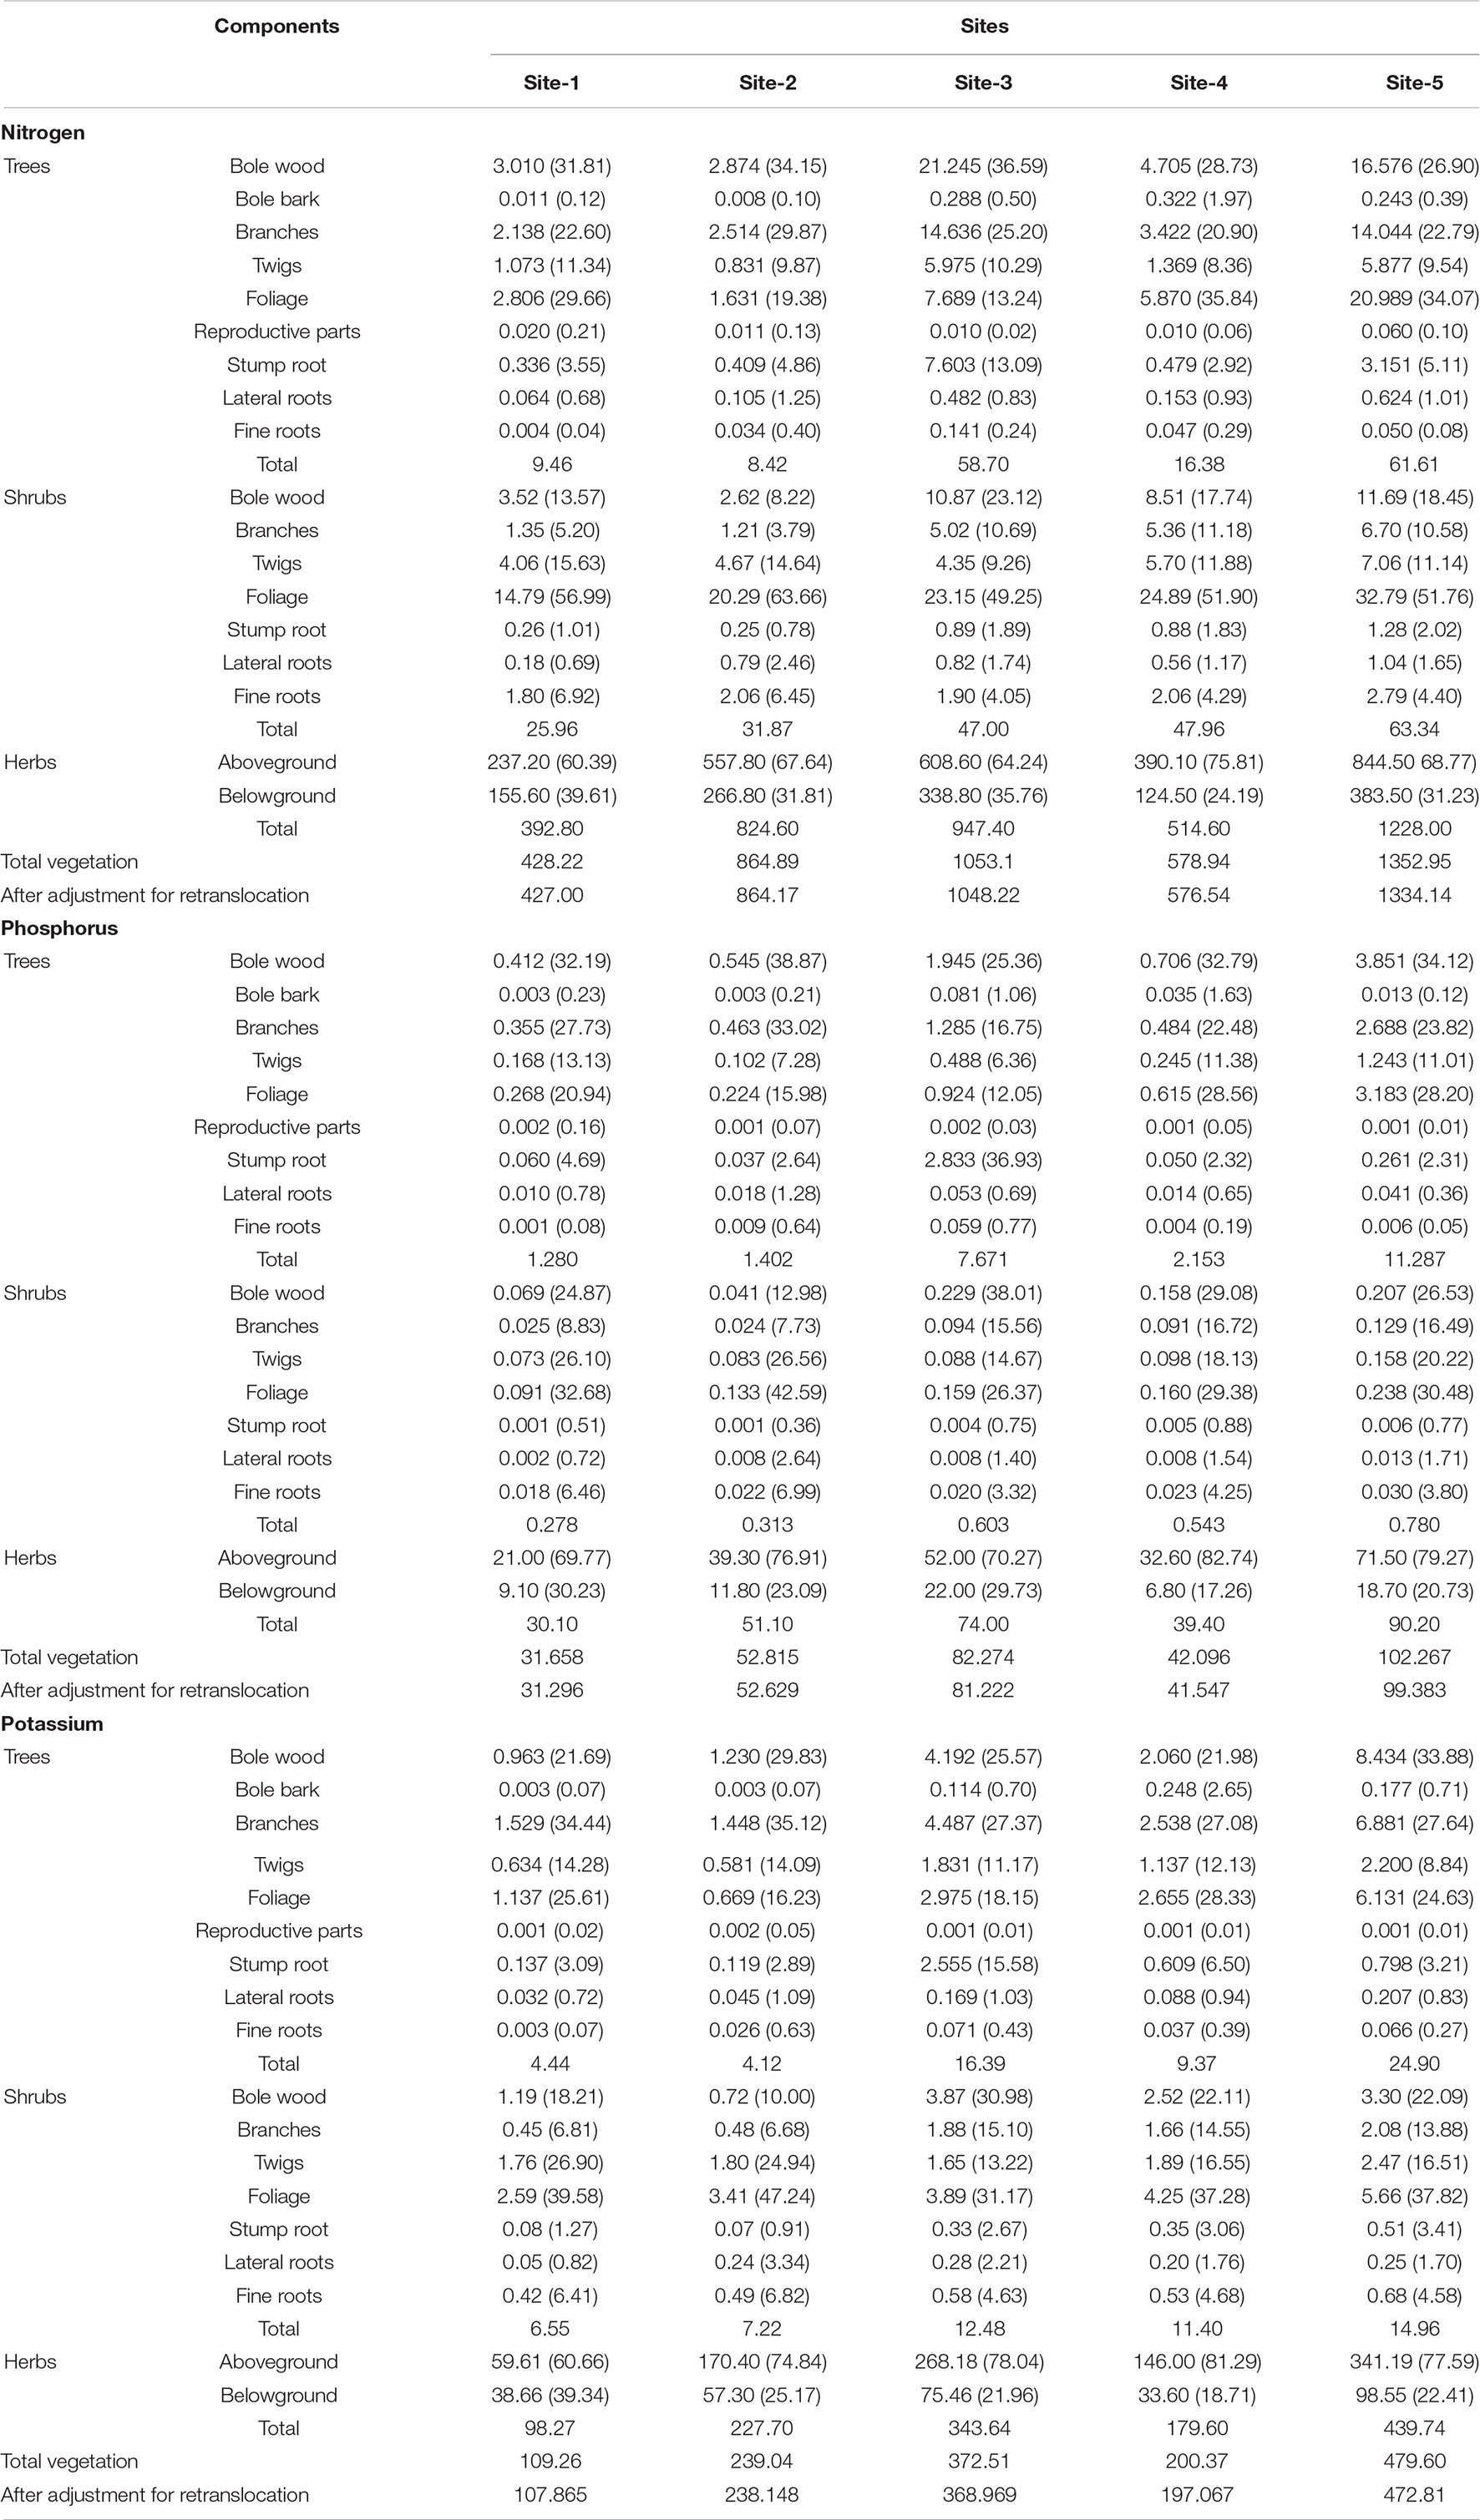
Table 5. The uptake of nutrient (kg ha–1 yr–1) by different layers of vegetation across the selected sites (values in parenthesis are the percentage contribution).
Average nutrient concentration across seasons in various litter components is given in Table 6. Concentration of nutrients in different litter components in diminishing order was: N > K > P, so the return of nitrogen to the floor was more in comparison to phosphorus and potassium. Maximum nutrient concentration was in foliage followed by miscellaneous litter, reproductive parts, twigs, and bark. Contribution of foliage to the nutrient return on soil was the maximum as compare to other components (Table 7). The amount of nitrogen, phosphorus and potassium returned by the total vegetation ranged from 395.90 (Site-1) to 1236.57 kg ha–1 yr–1 (Site-5), 30.12 (Site-1 and 2) to 91.37 kg ha–1 yr–1 (Site-5), and 98.61(Site-1) to 441.17 kg ha–1 yr–1 (Site-5), respectively. In comparison to the shrubs and trees, the return through herbs was maximum (Table 7).
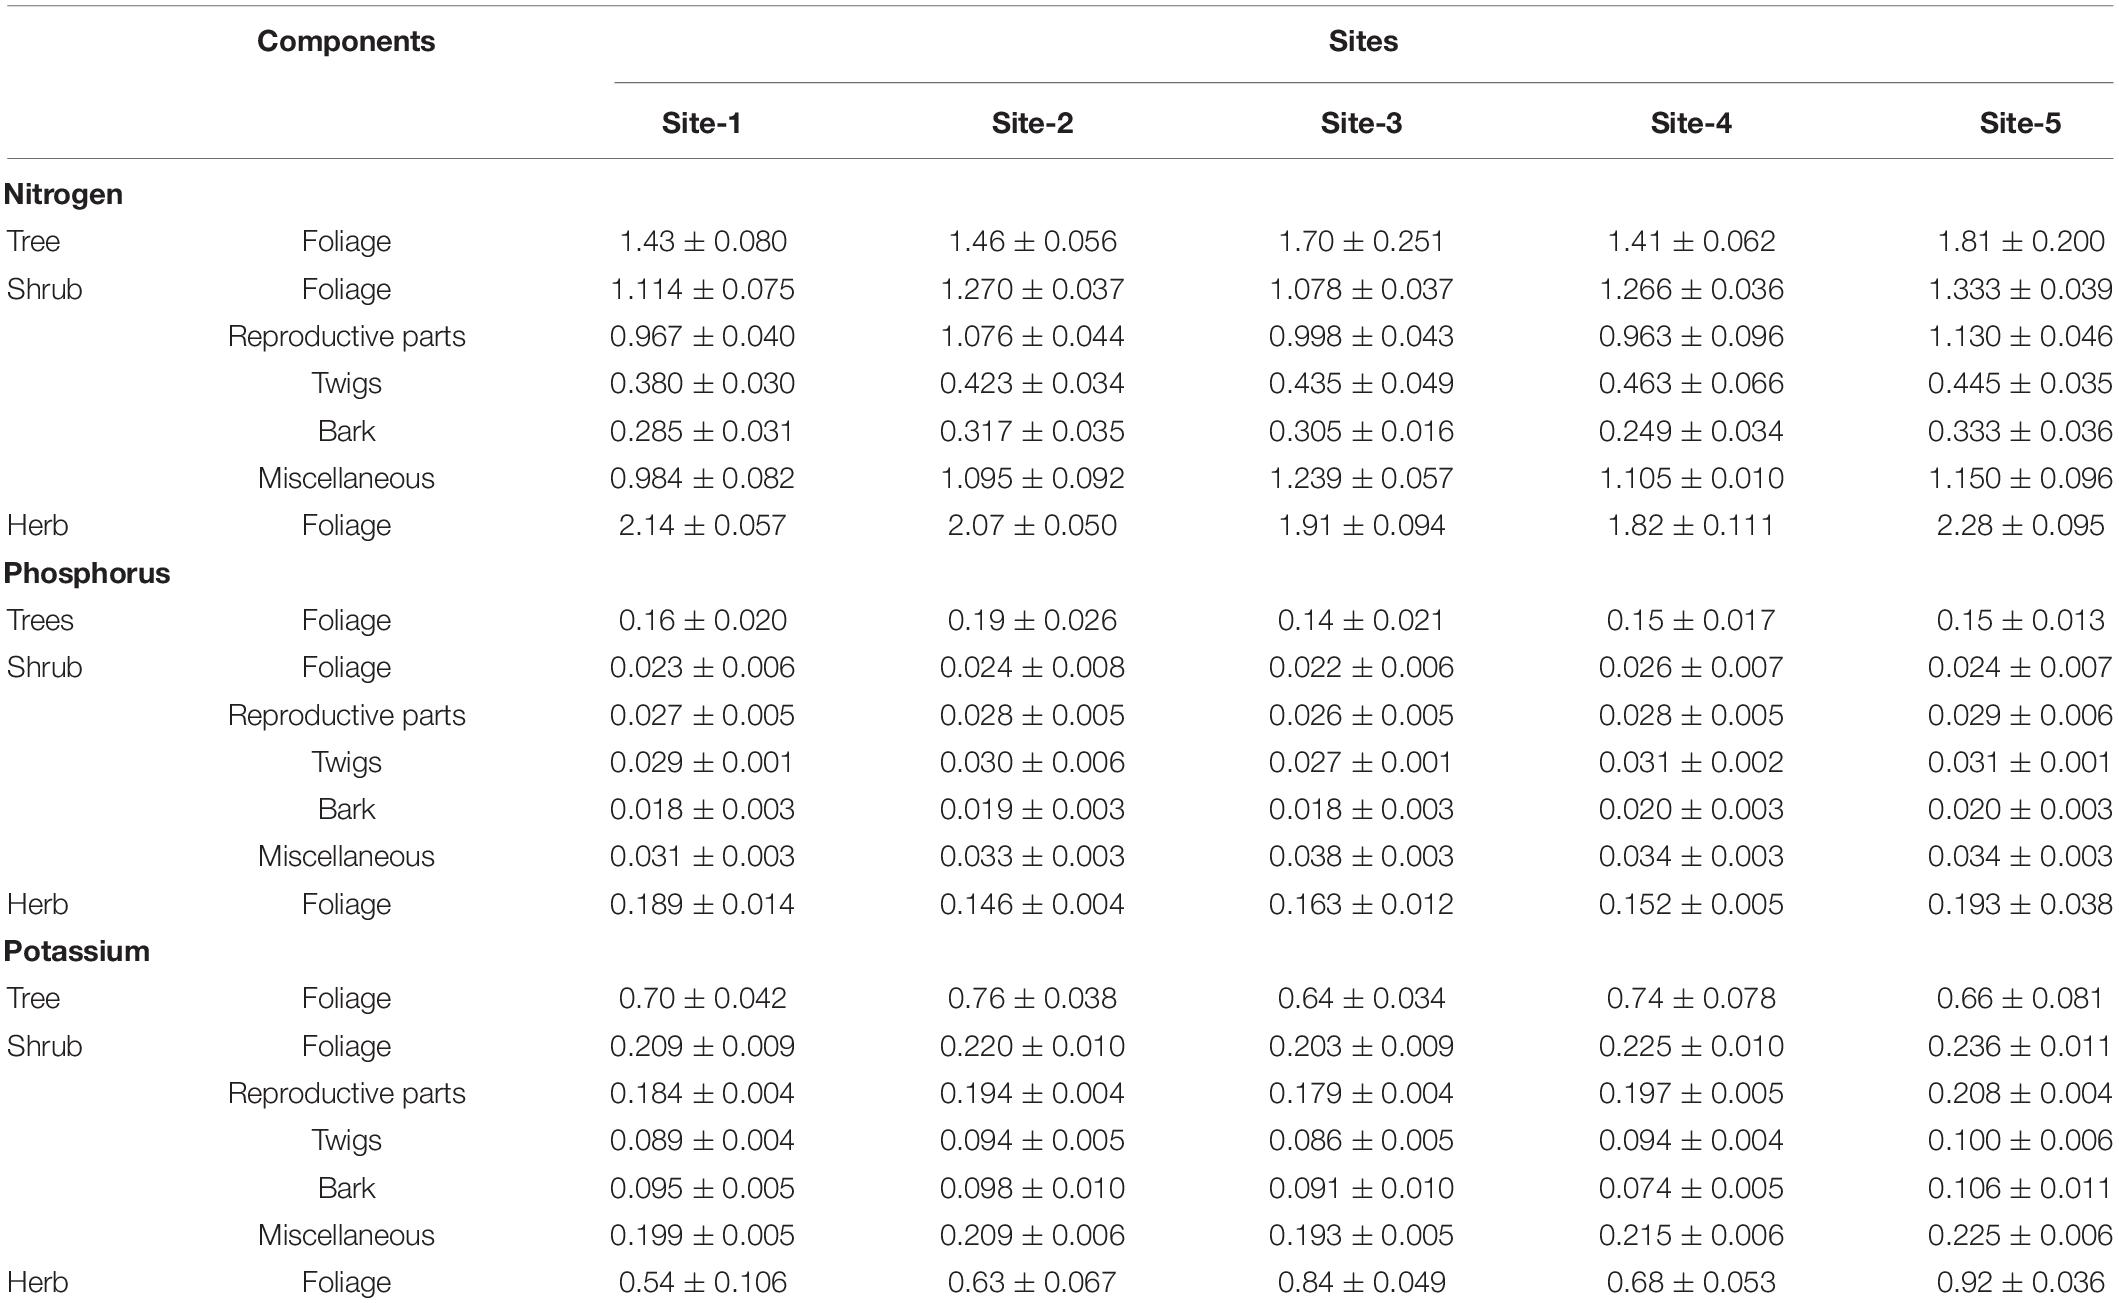
Table 6. Average concentration of nutrients (%) in different components in litter across seasons for the selected sites.
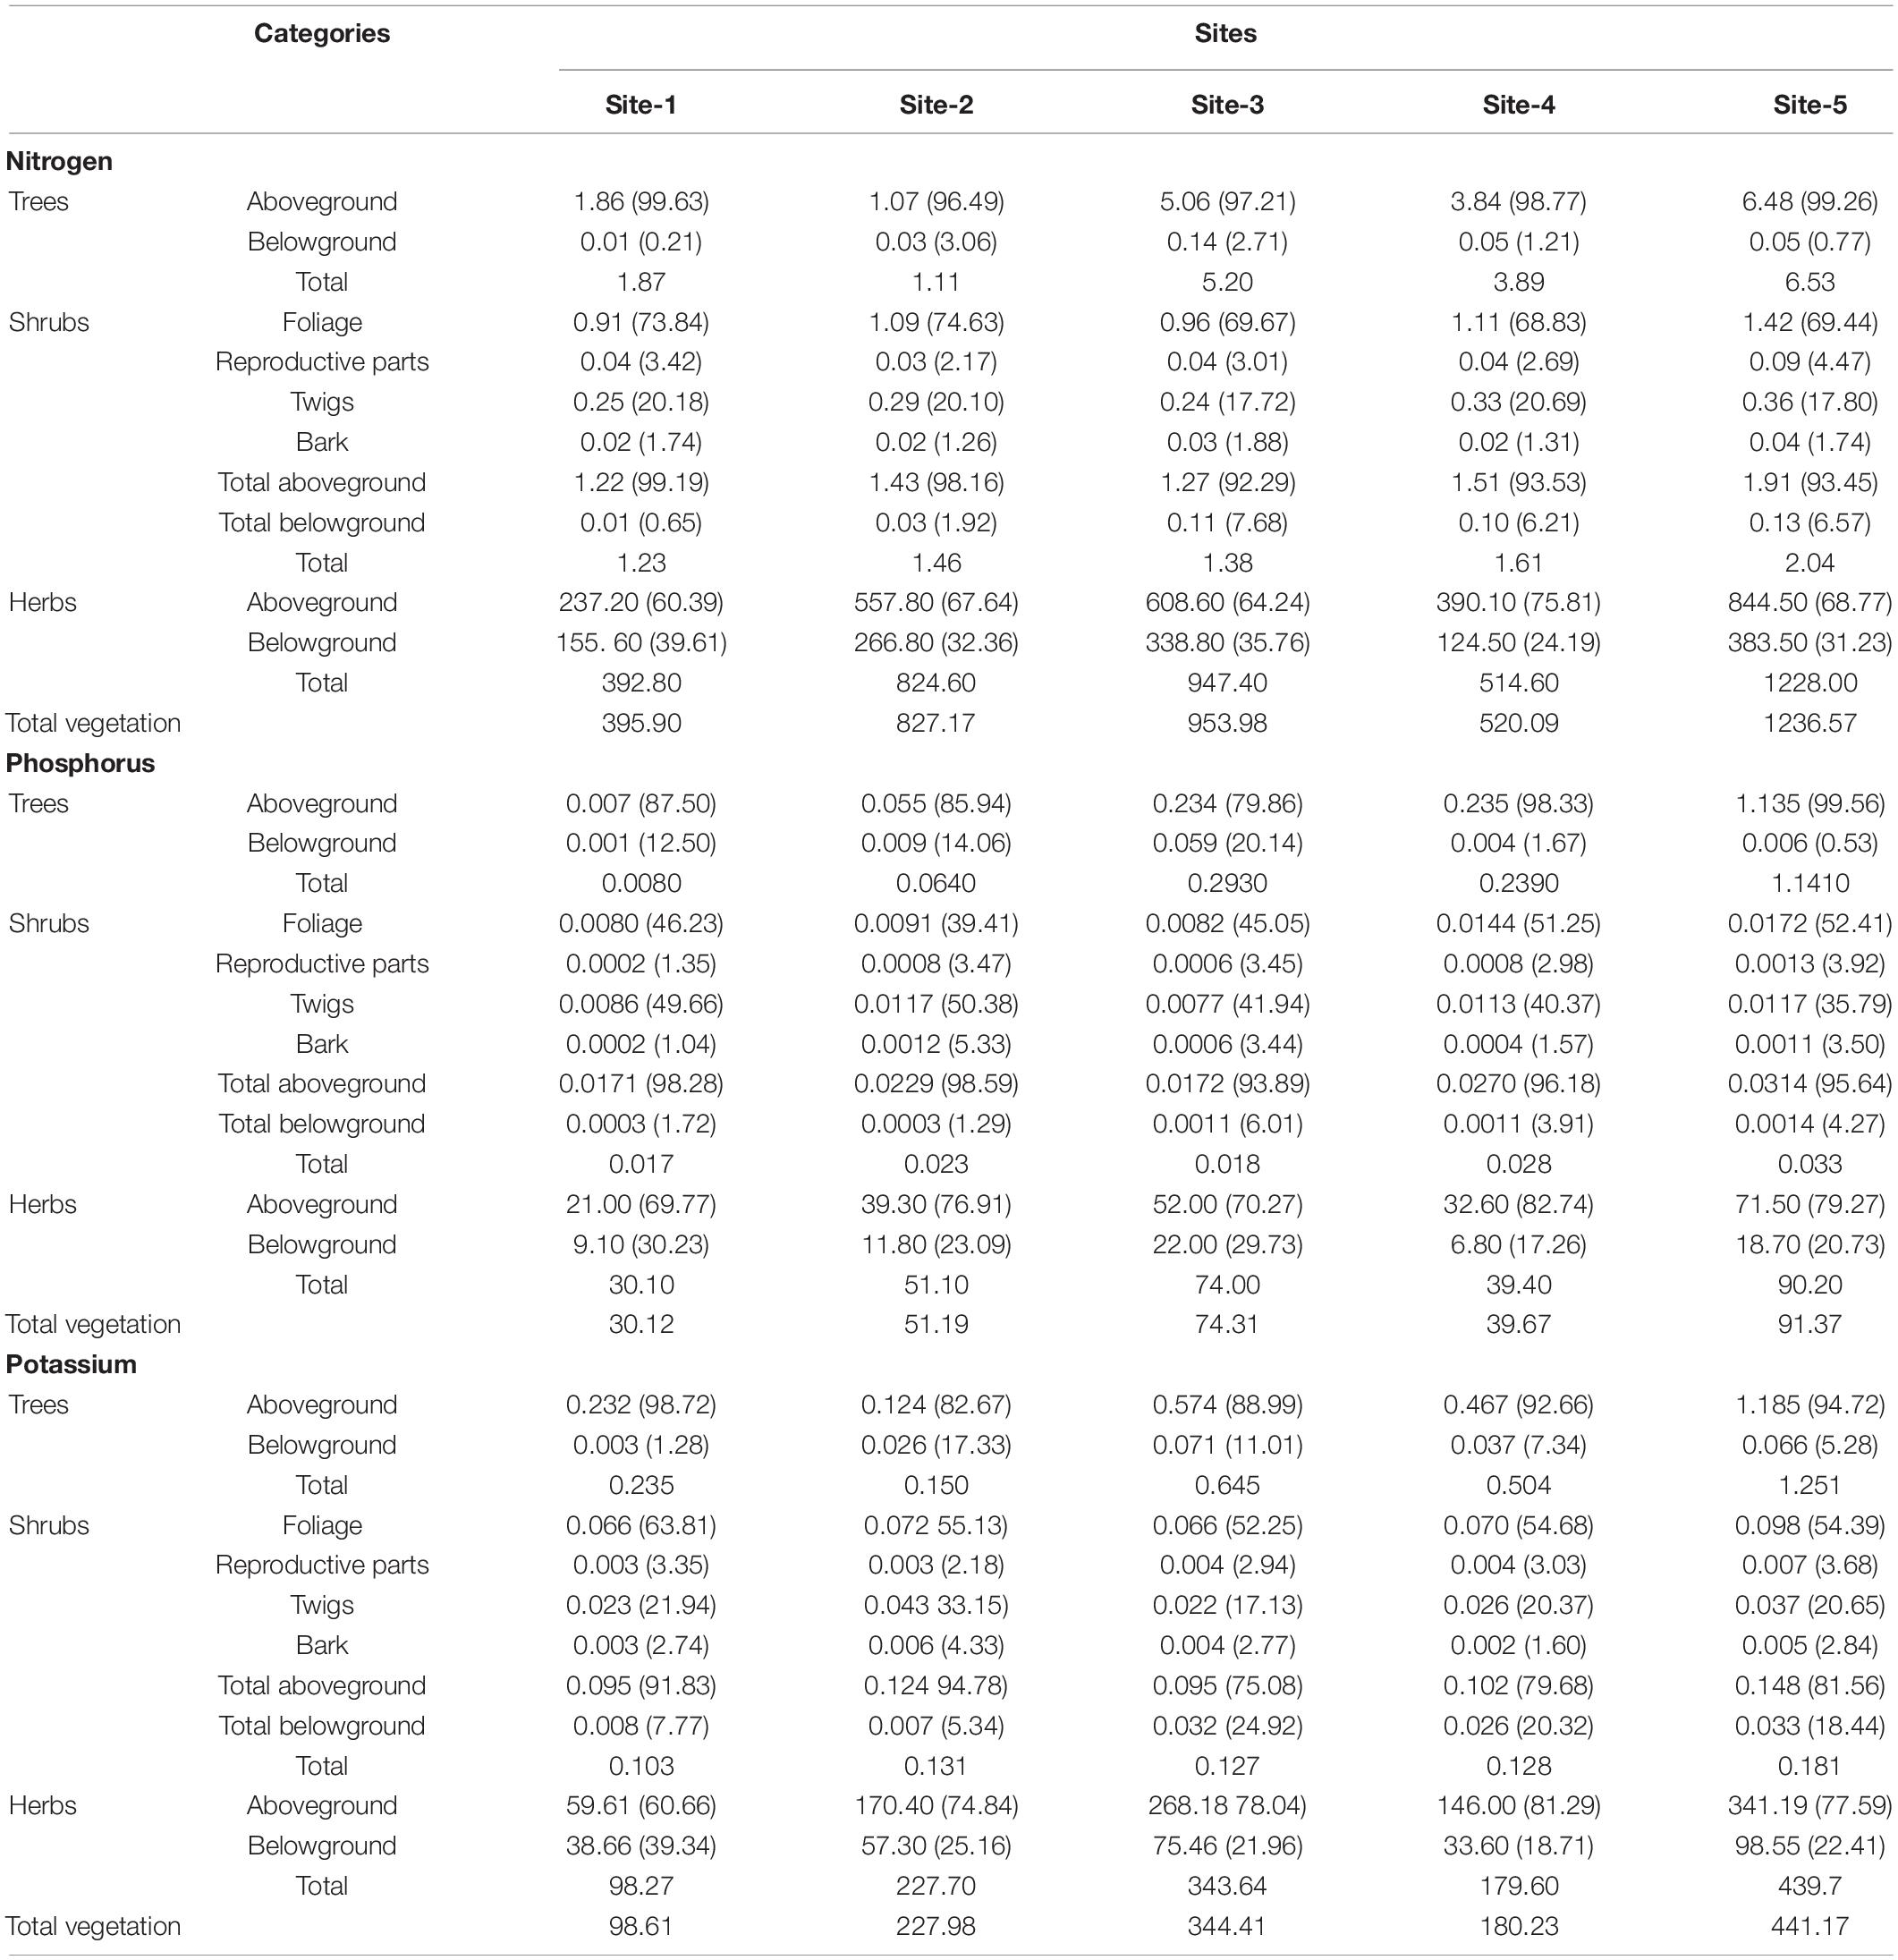
Table 7. Amount of nutrient return (kg ha–1 yr–1) by tree, shrub, and herb layer litter fall (values in the parenthesis are the percentage contribution).
The values for the turnover rate (k, year–1) and time (t, years) for nitrogen (N), phosphorus (P), and potassium (K) for different litter components across the selected sites are given in Table 6. In comparison to nitrogen and phosphorus, turnover rate for potassium was higher (N < P < K) (Table 8).
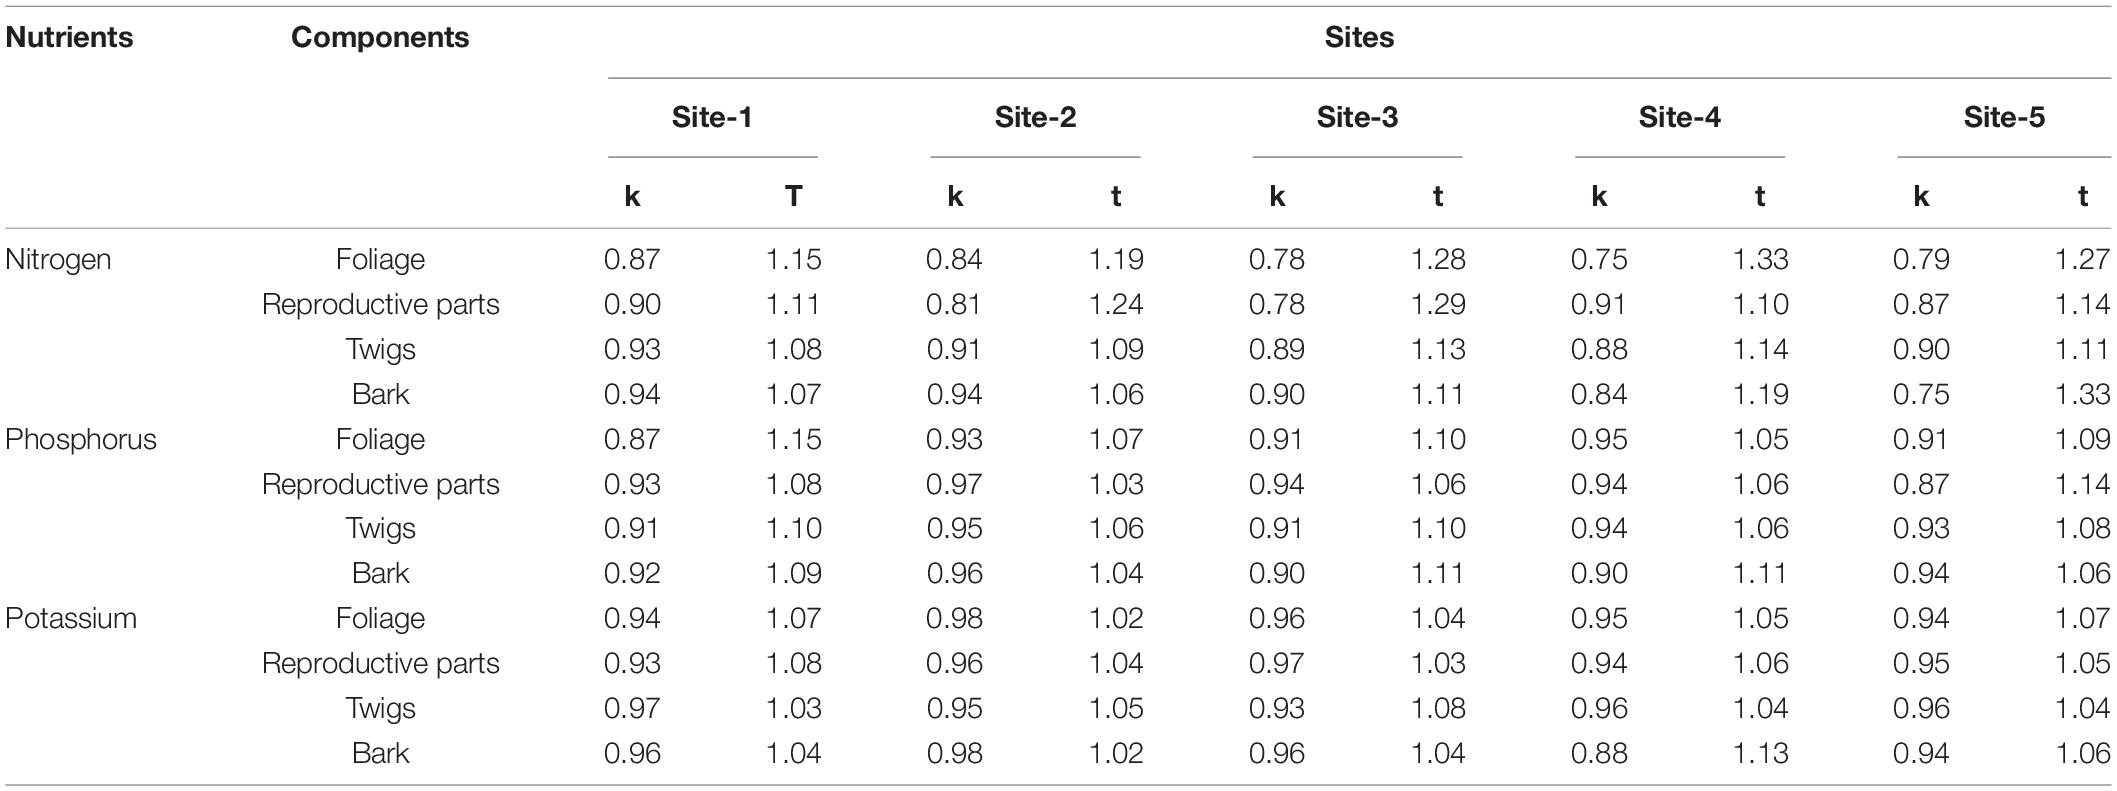
Table 8. Turnover rate (k, yr–1) and turnover time (t, year) of the nutrients on the shrub floor across selected sites.
Percentage nutrient retranslocation efficiency for different litter components showed that, if the values were positive then it was capable of retranslocation of its nutrients before litter fall and if negative values were reported for PNRE then it could be interpreted that its nutrients were retained in the respective senescing components before falling on the soil. Potassium showed the highest PNRE among N, P, and K for all the components of litter fall (Table 9). The order of components on the basis of their PNRE was: Foliage > Reproductive parts > Twigs > Bark.
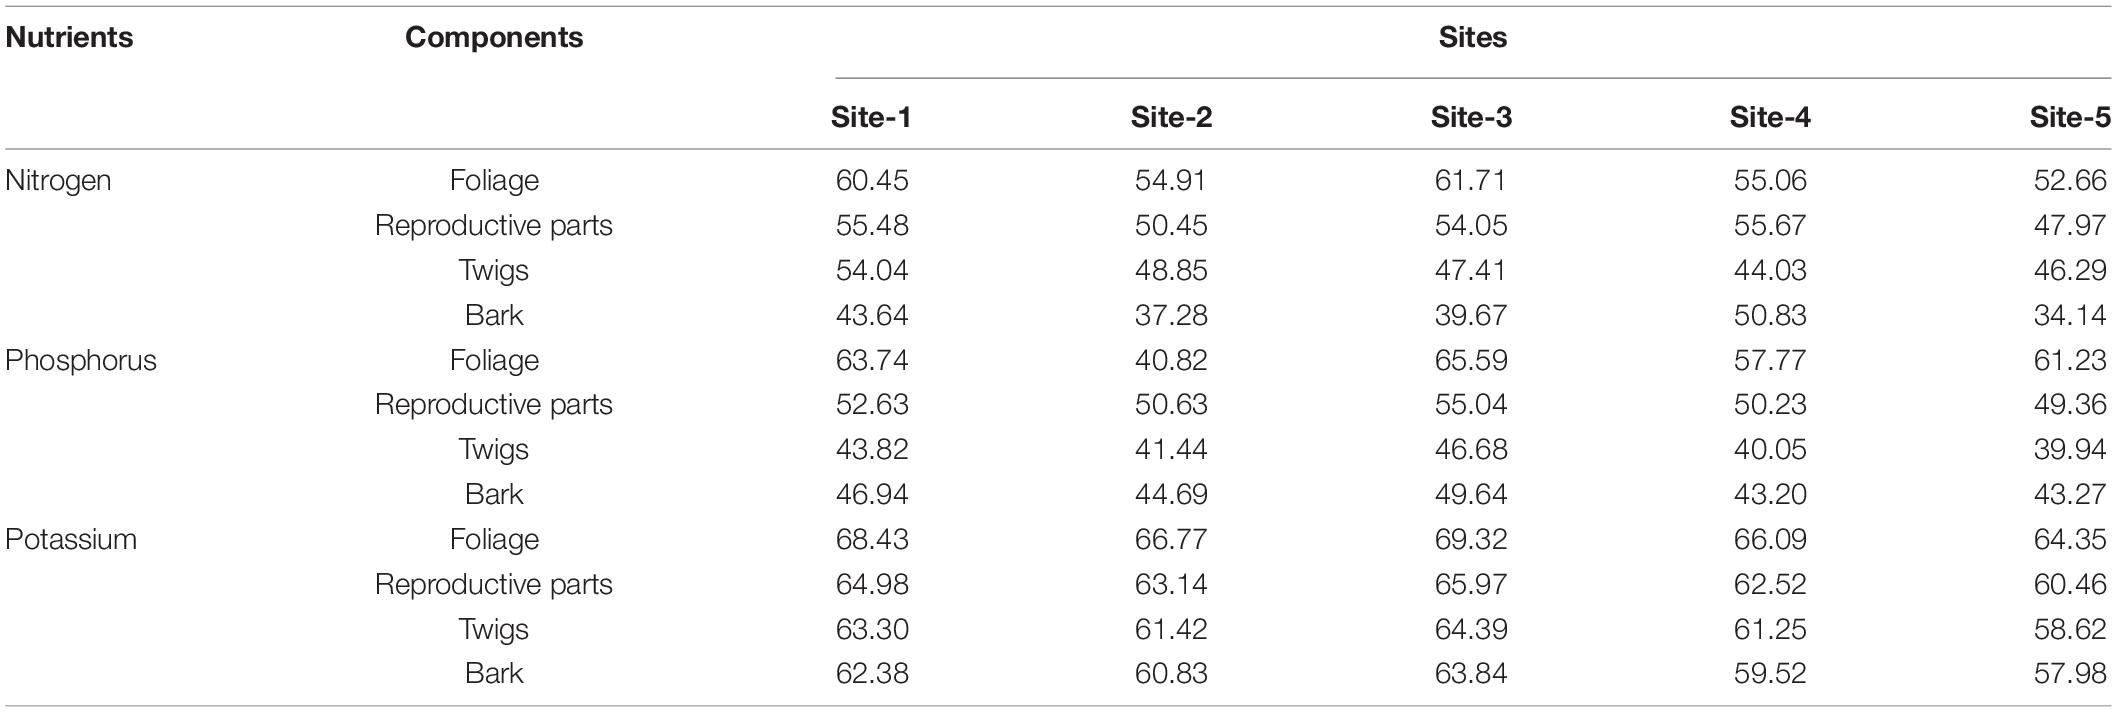
Table 9. Percent nutrient retranslocation efficiency (%) at different selected sites for different litter components.
Nutrient use efficiency (NUE) depends on the ability of efficient uptake of nutrients from soil by different components and also on their ability to store and use the nutrients. It also depends on transport, storage, mobilization, and usage within the plant, and even on the environment. The order of nutrients was: P > K > N and order of the components was: Twigs > Foliage > Bark > Miscellaneous < Reproductive parts (Table 10).
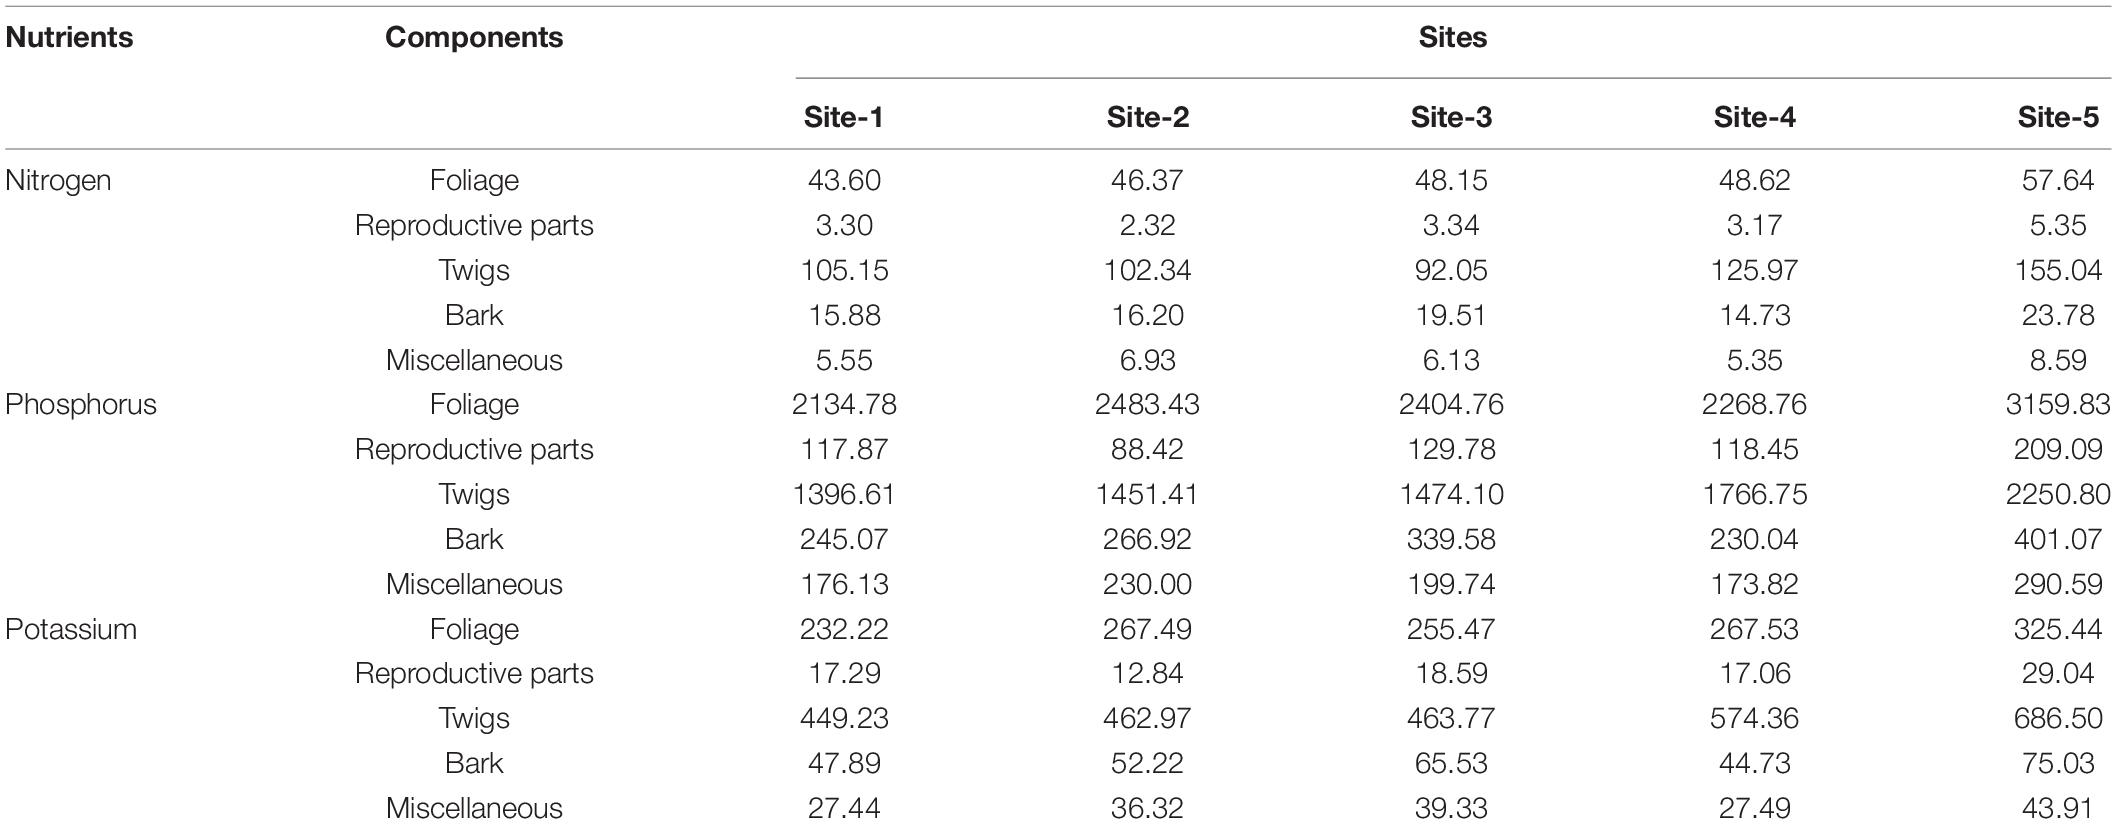
Table 10. Nutrient use efficiency of different components of litter across the selected sites.
The direction of nutrient flux from soil to foliage or reproductive parts indicates a one-way movement, although it is well realized that the nutrients are utilized by the foliage in organic matter synthesis and that they are redistributing among different components at varying rates giving rise to internal recycling. The comparison of compartmental models (Figures 1–5) of different sites is described as follows;
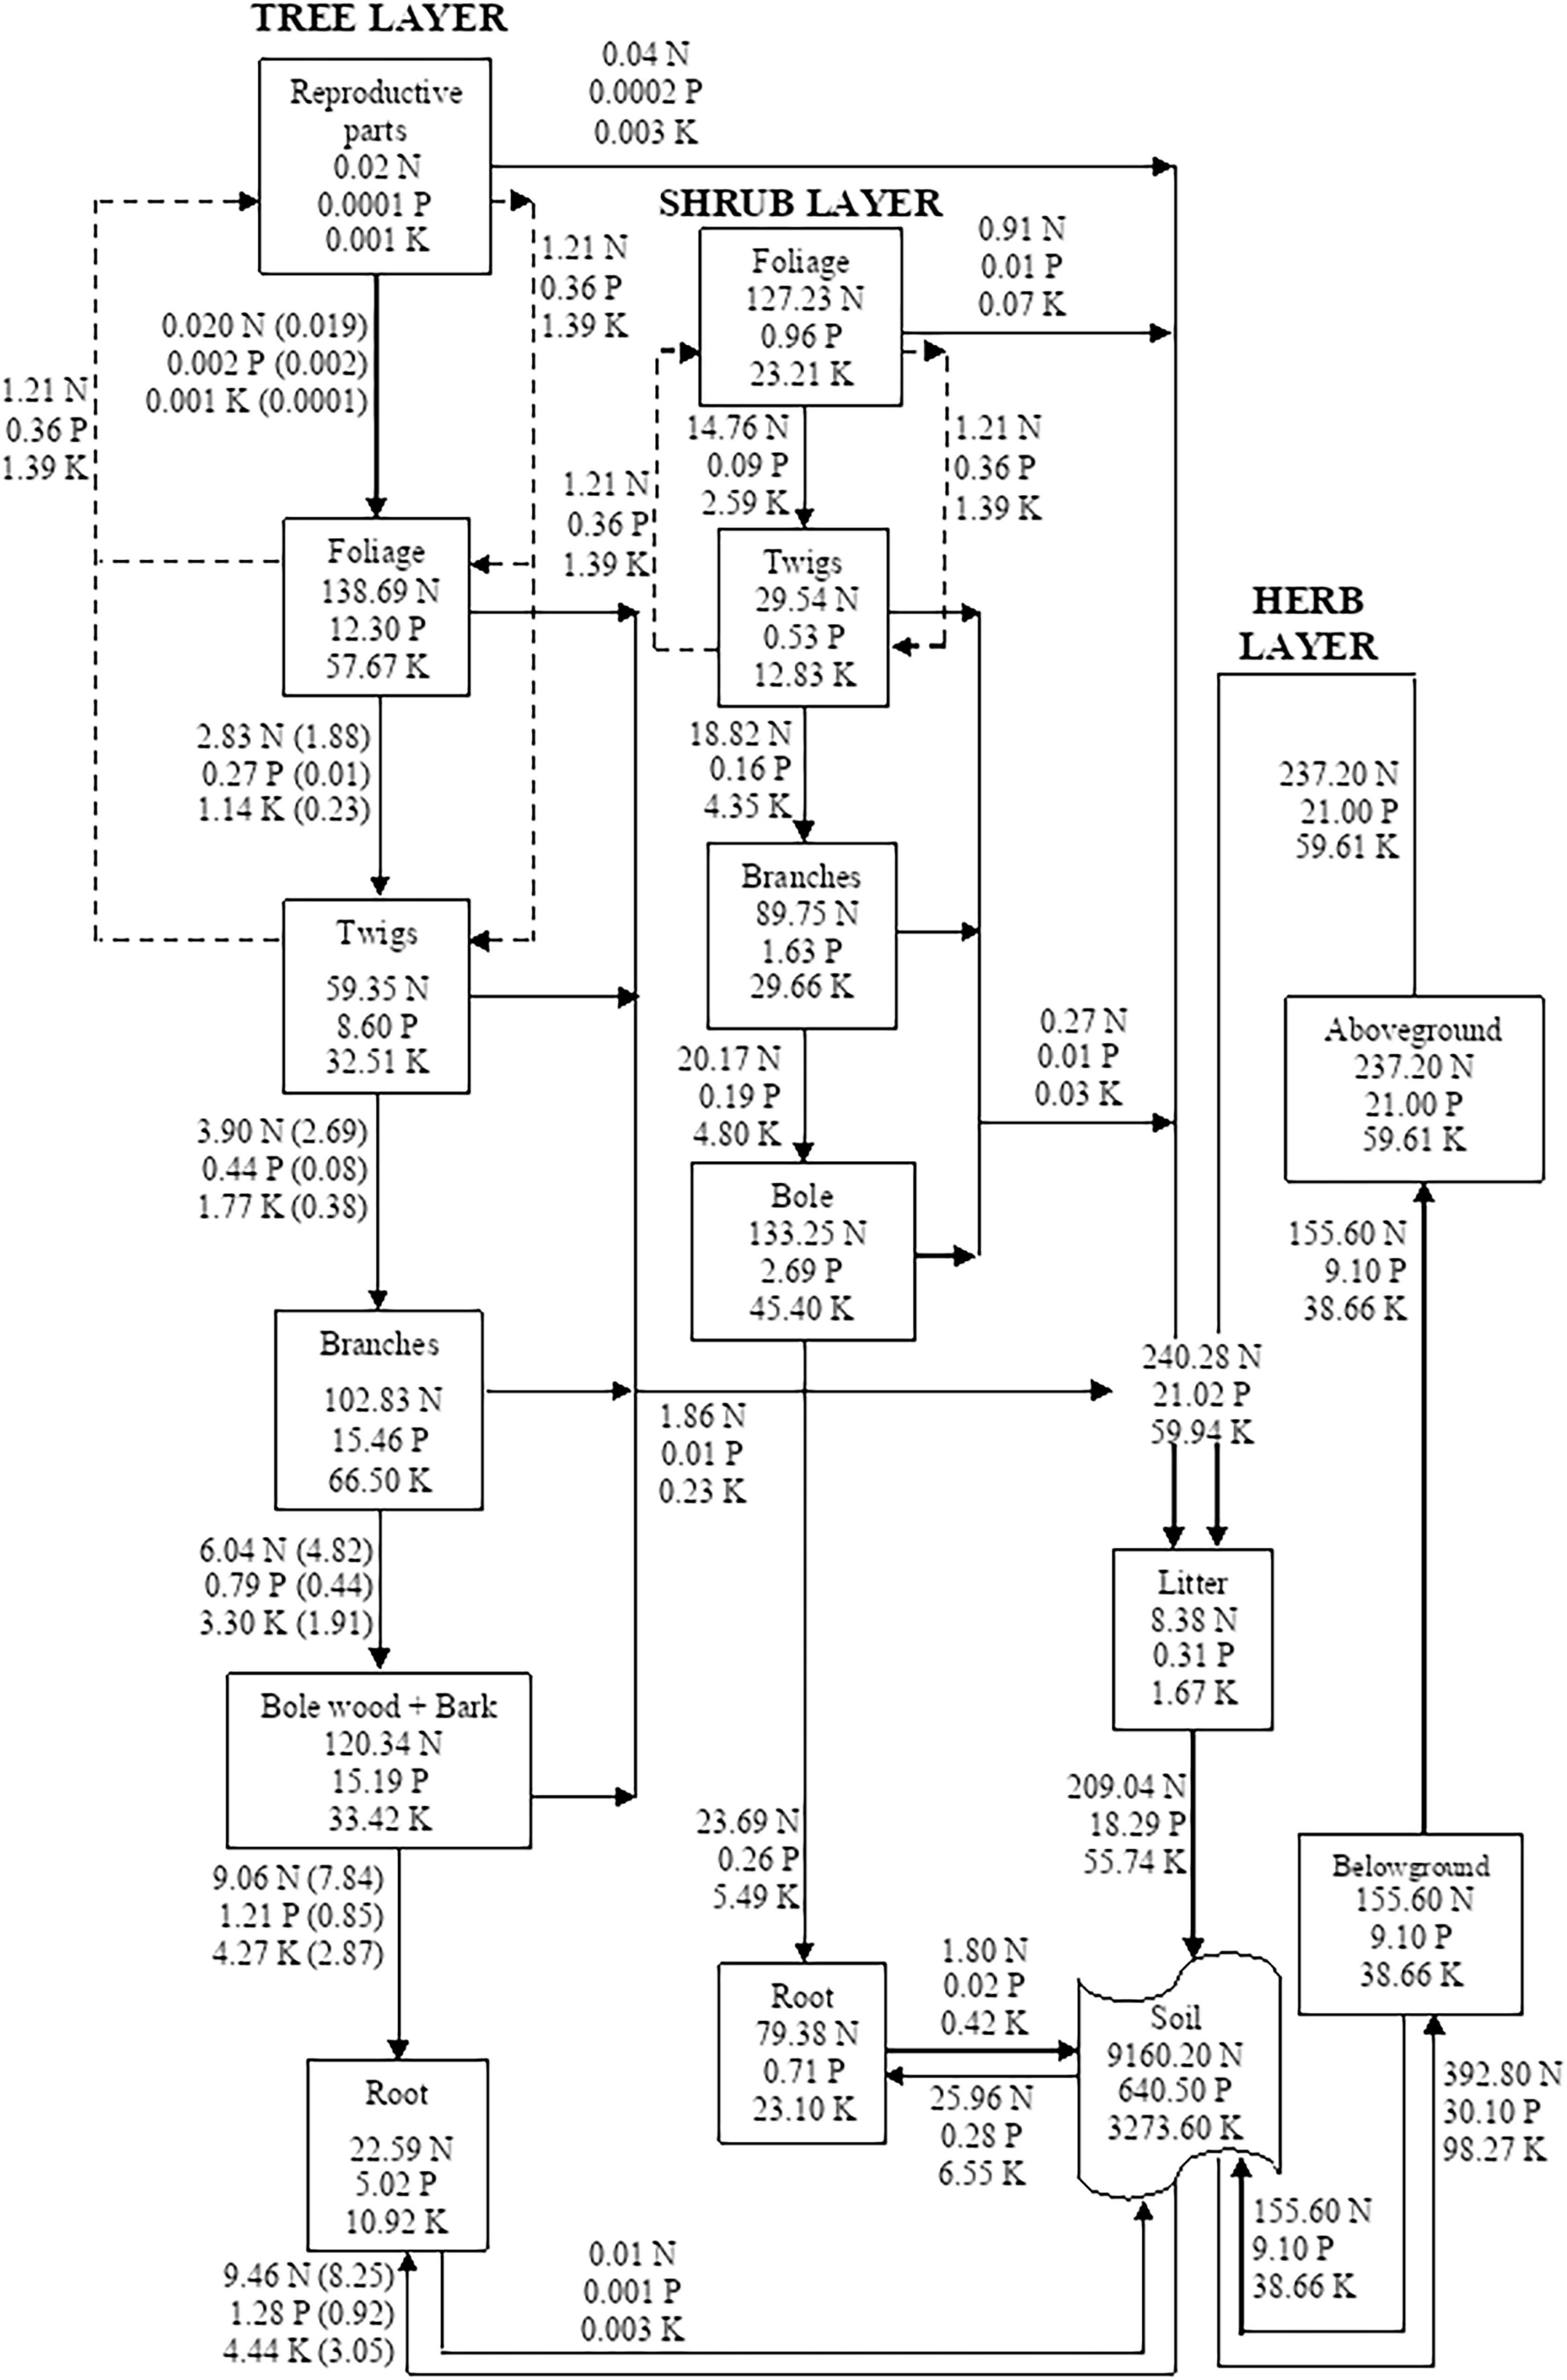
Figure 1. Compartment models showing the distribution and cycling of nitrogen (N), phosphorus (P), and potassium (K) in tree, shrub, and herb at site-1. Rectangle represents a compartment for standing state of nutrients from one compartment to the next compartment. Units are kg ha–1 yr–1 for flows between compartments. Values in parenthesis are after adjustment for internal cycling. Recycling between reproductive parts, foliage, twigs, and bole is shown by dotted lines.
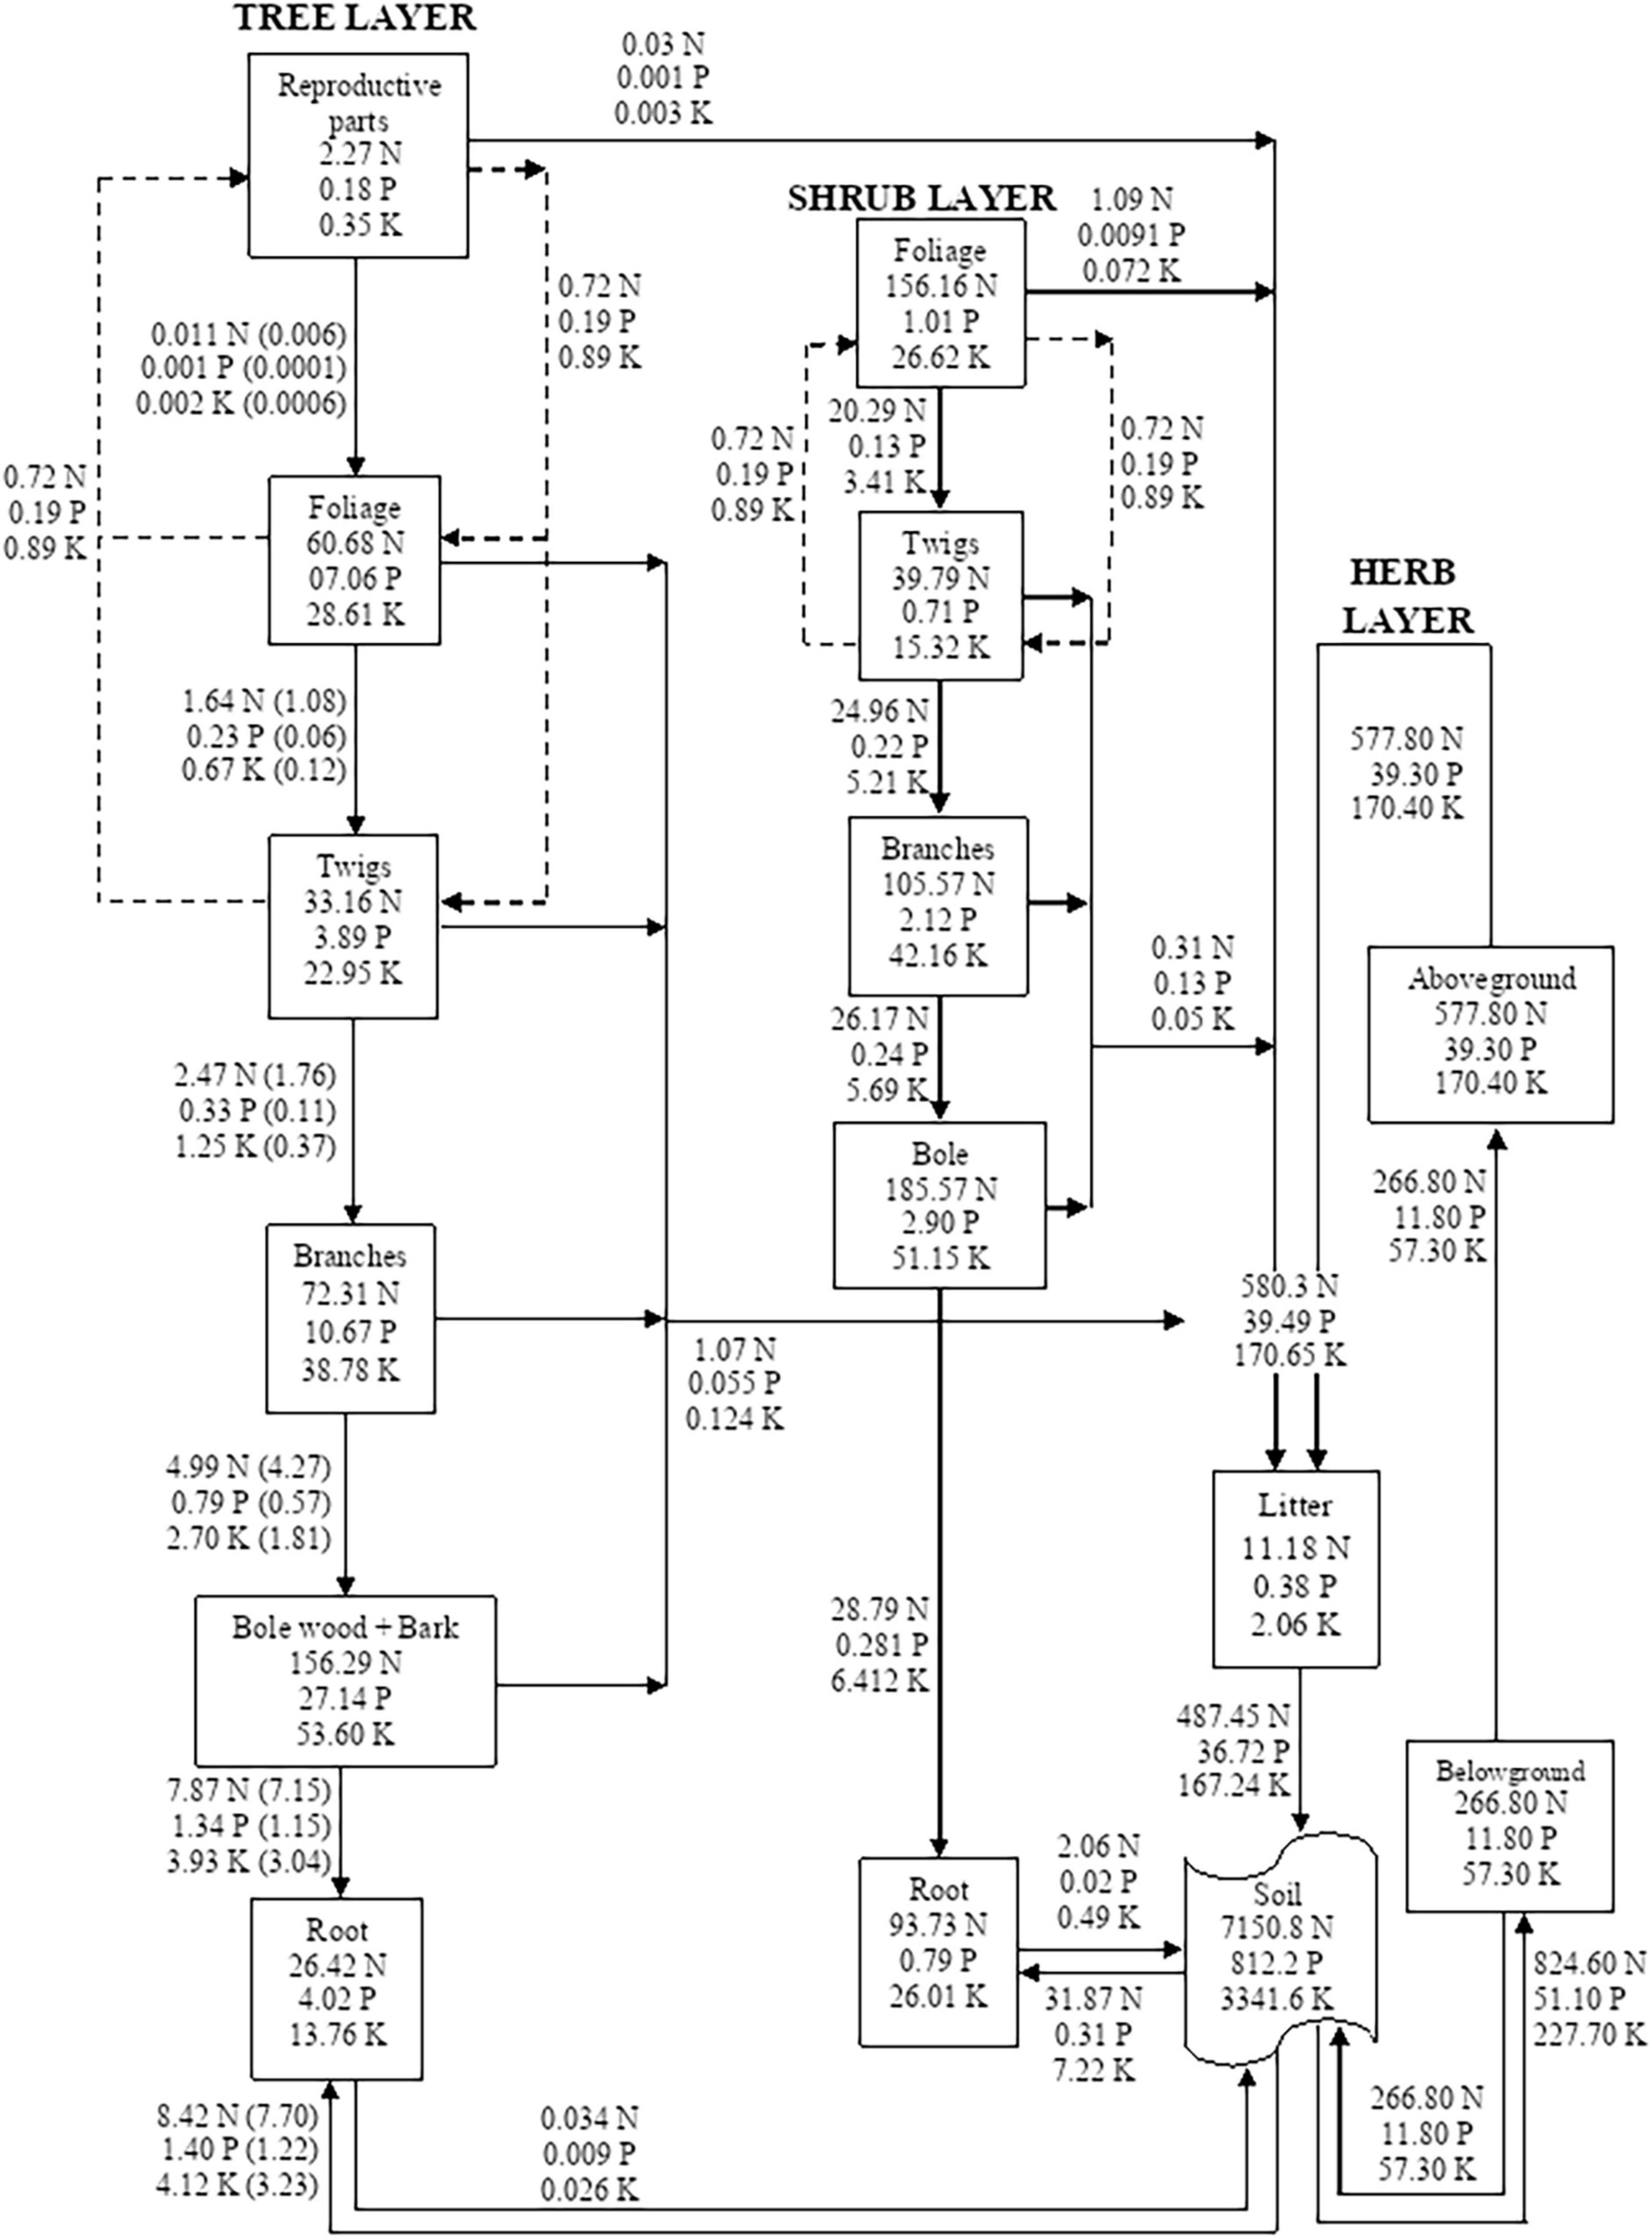
Figure 2. Compartment models showing the distribution and cycling of nitrogen (N), phosphorus (P), and potassium (K) in tree, shrub, and herb at site-2. Rectangle represents a compartment for standing state of nutrients from one compartment to the next compartment. Units are kg ha–1 yr–1 for flows between compartments. Values in parenthesis are after adjustment for internal cycling. Recycling between reproductive parts, foliage, twigs, and bole is shown by dotted lines.
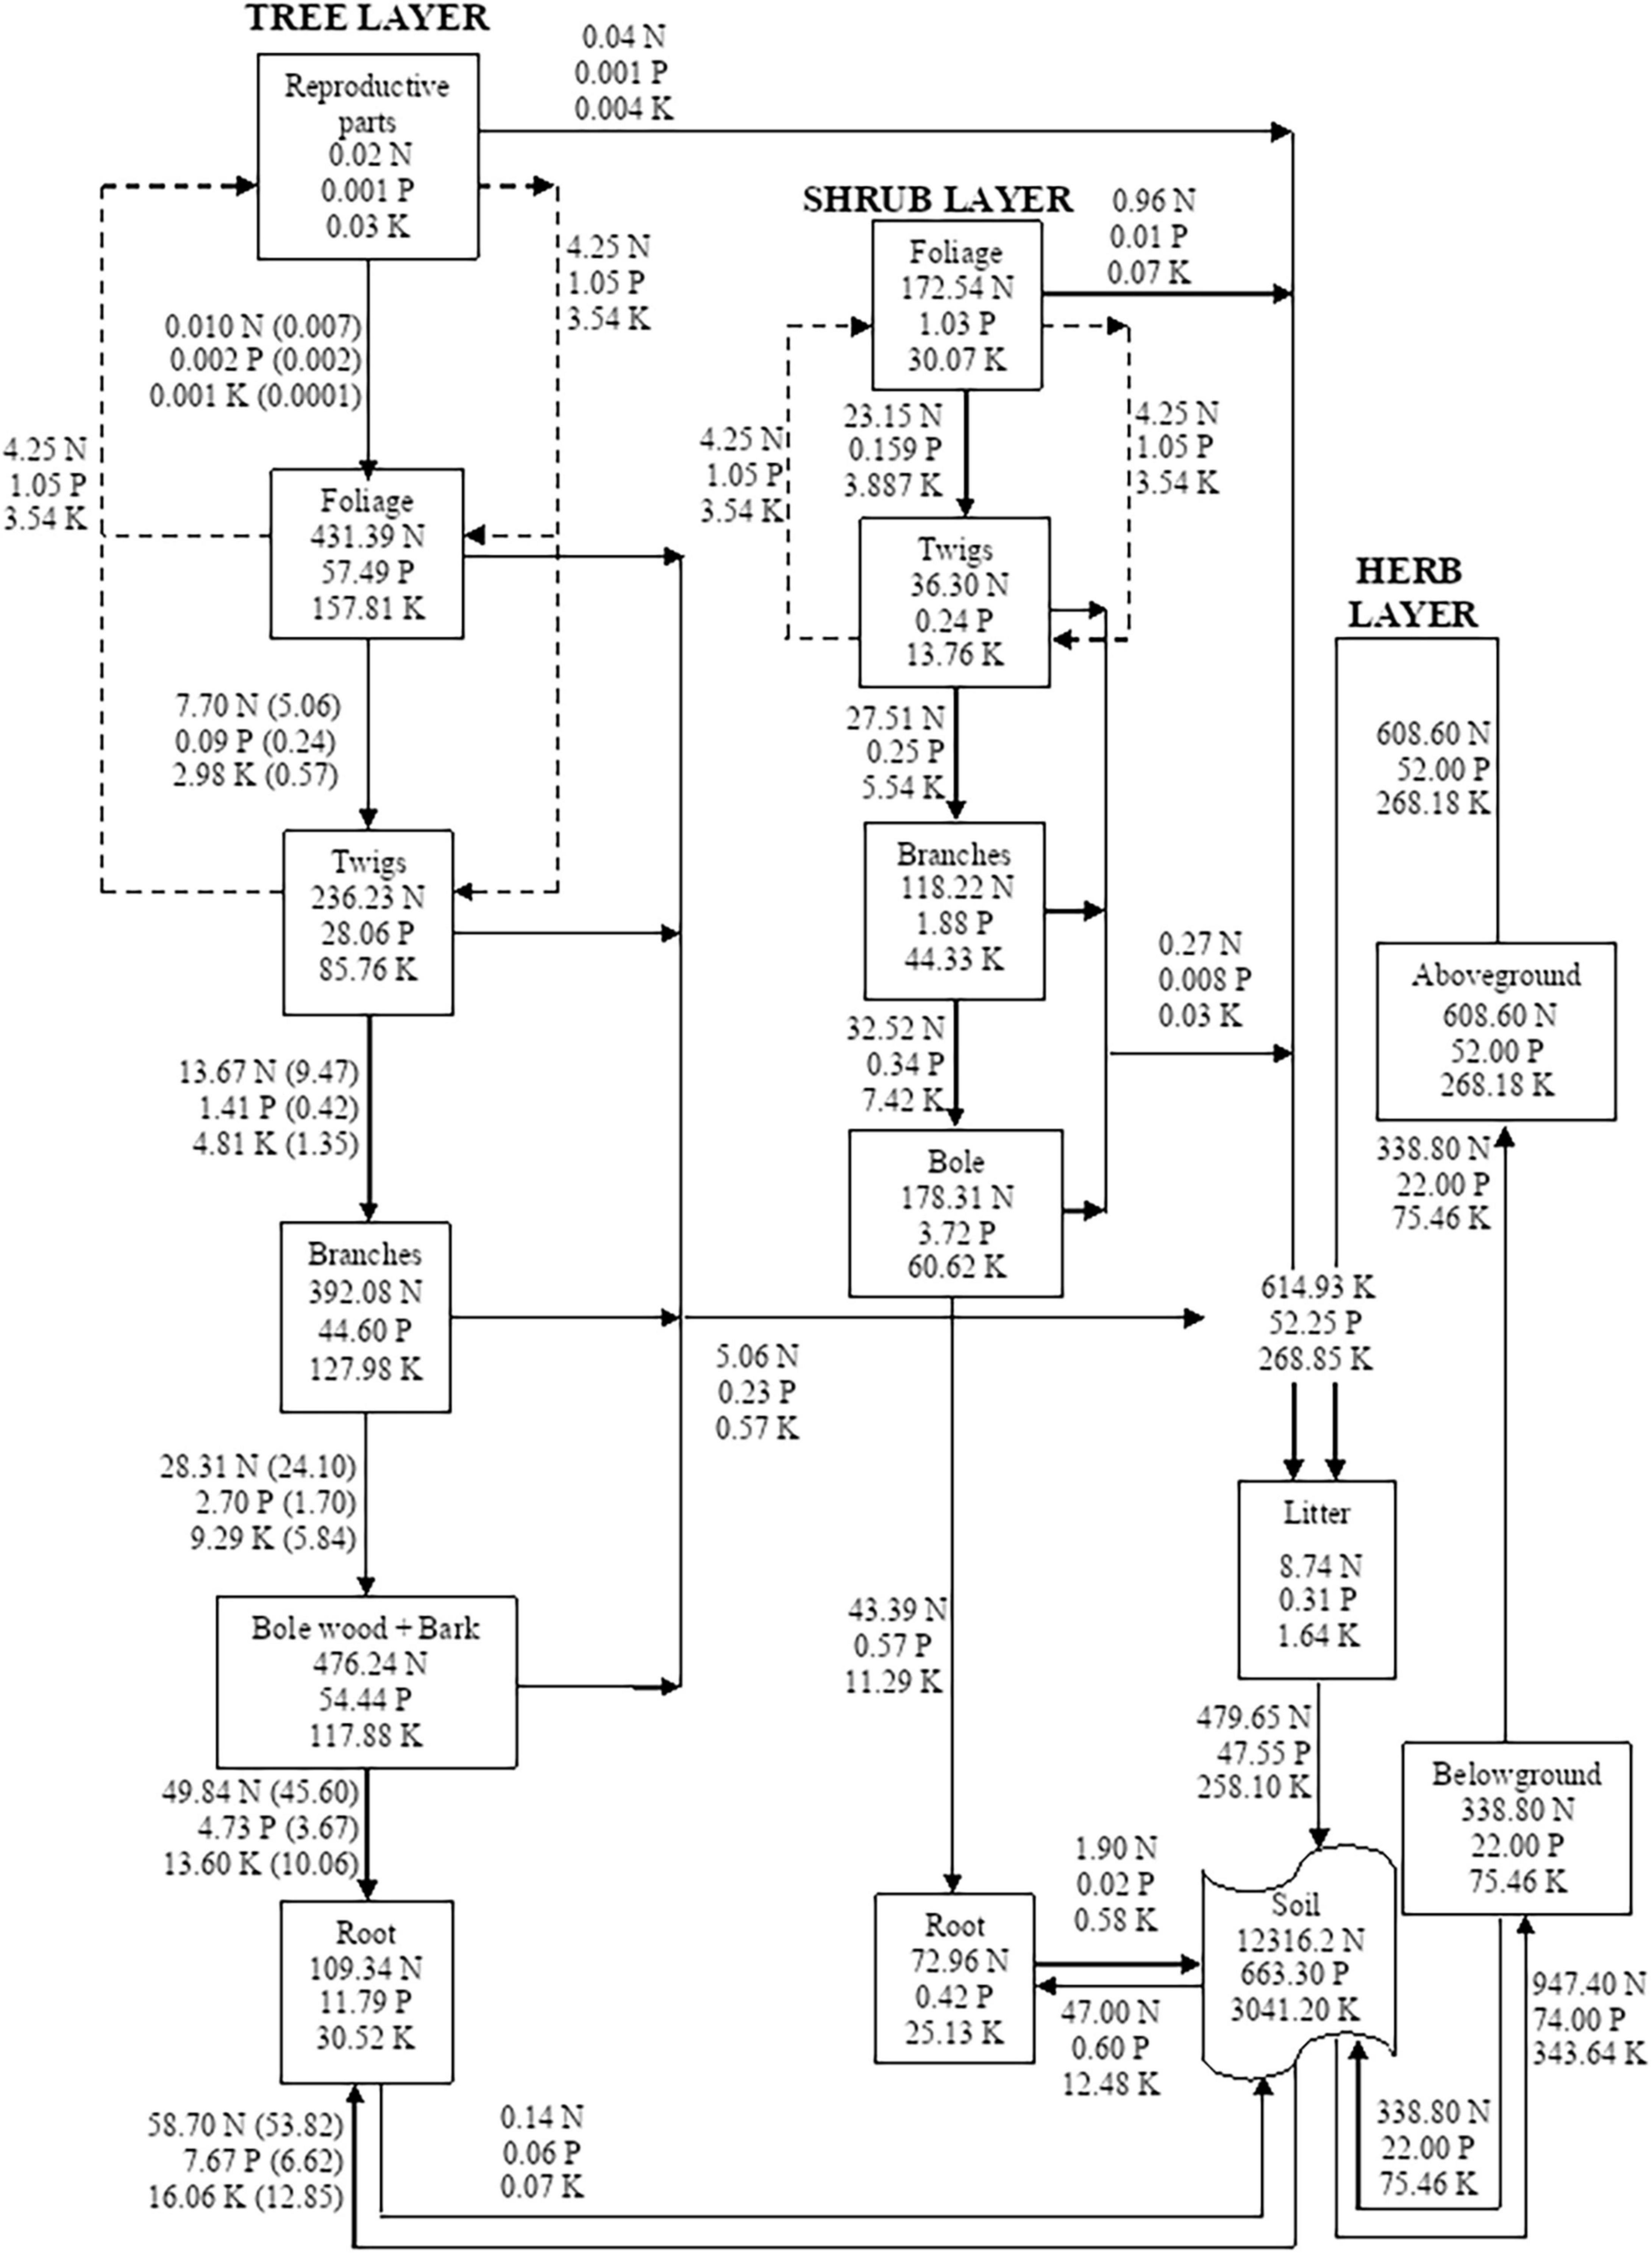
Figure 3. Compartment models showing the distribution and cycling of nitrogen (N), phosphorus (P), and potassium (K) in tree, shrub, and herb at site-3. Rectangle represents a compartment for the standing state of nutrients from one compartment to the next compartment. Units are kg ha–1 yr–1 for flows between compartments. Values in parenthesis are after adjustment for internal cycling. Recycling between reproductive parts, foliage, twigs, and bole is shown by dotted lines.
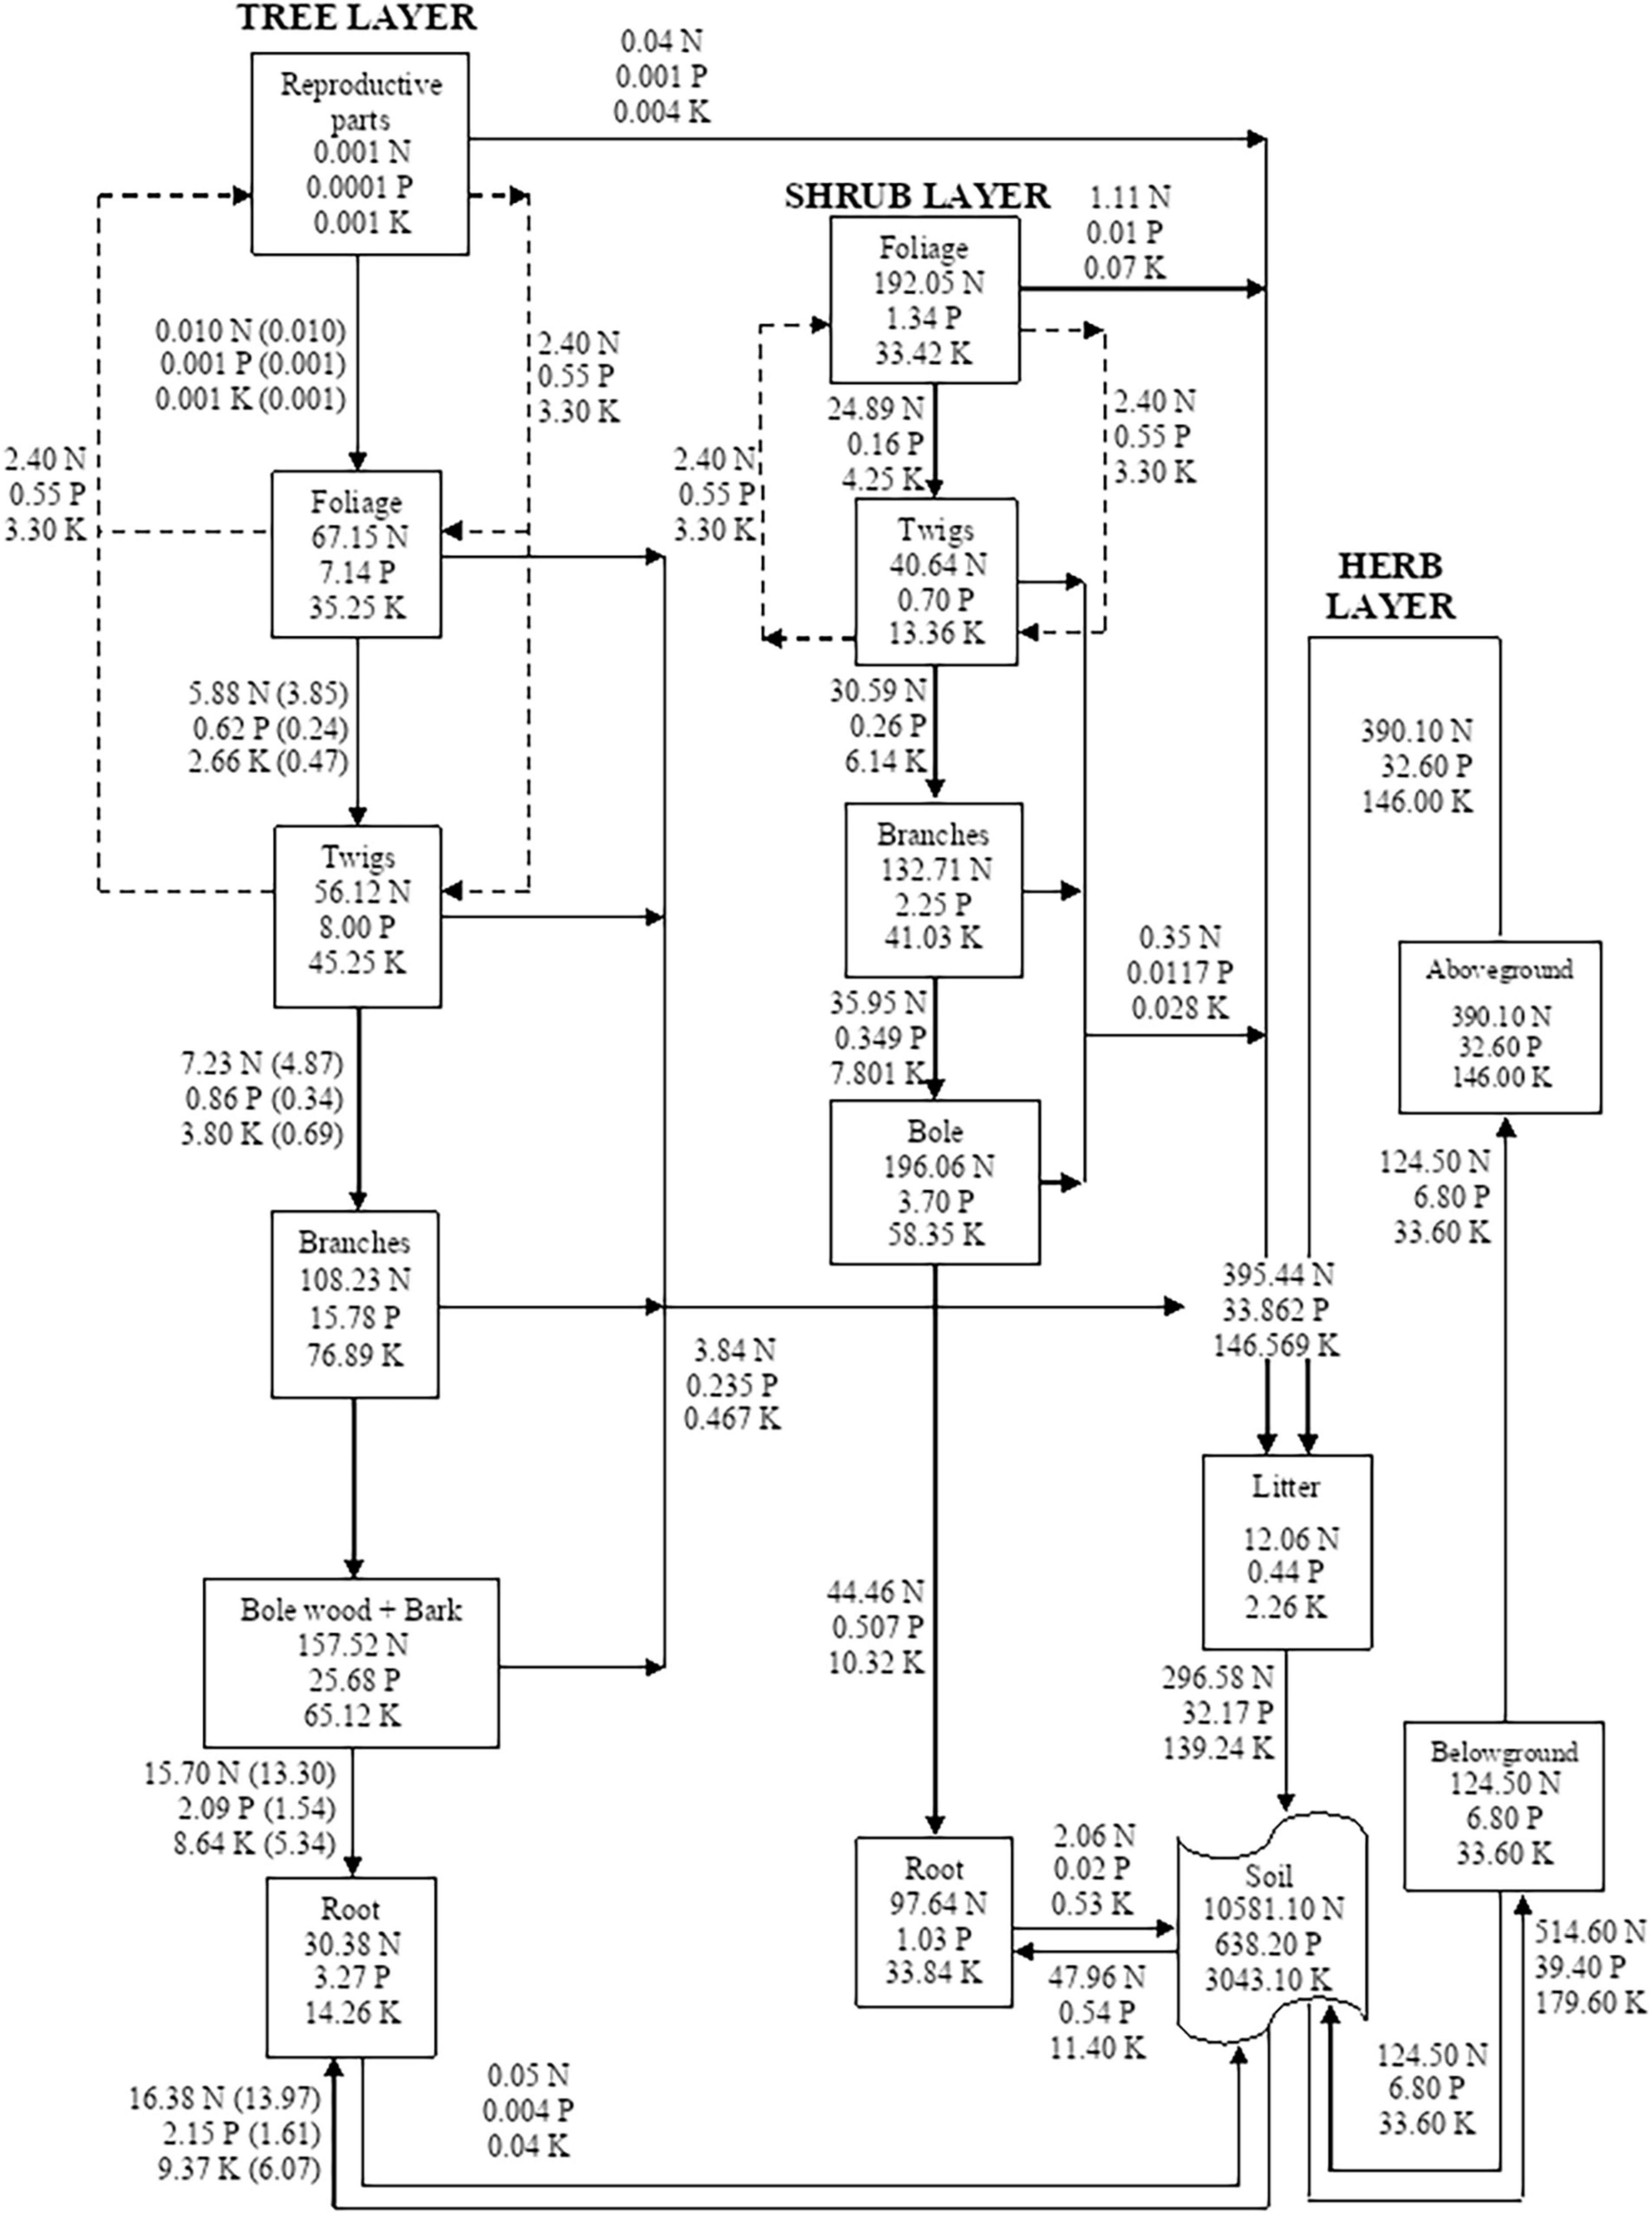
Figure 4. Compartment models showing the distribution and cycling of nitrogen (N), phosphorus (P), and potassium (K) in tree, shrub, and herb at site-4. Rectangle represents a compartment for standing state of nutrients from one compartment to the next compartment. Units are kg ha–1 yr–1 for flows between compartments. Values in parenthesis are after adjustment for internal cycling. Recycling between reproductive parts, foliage, twigs, and bole is shown by dotted lines.
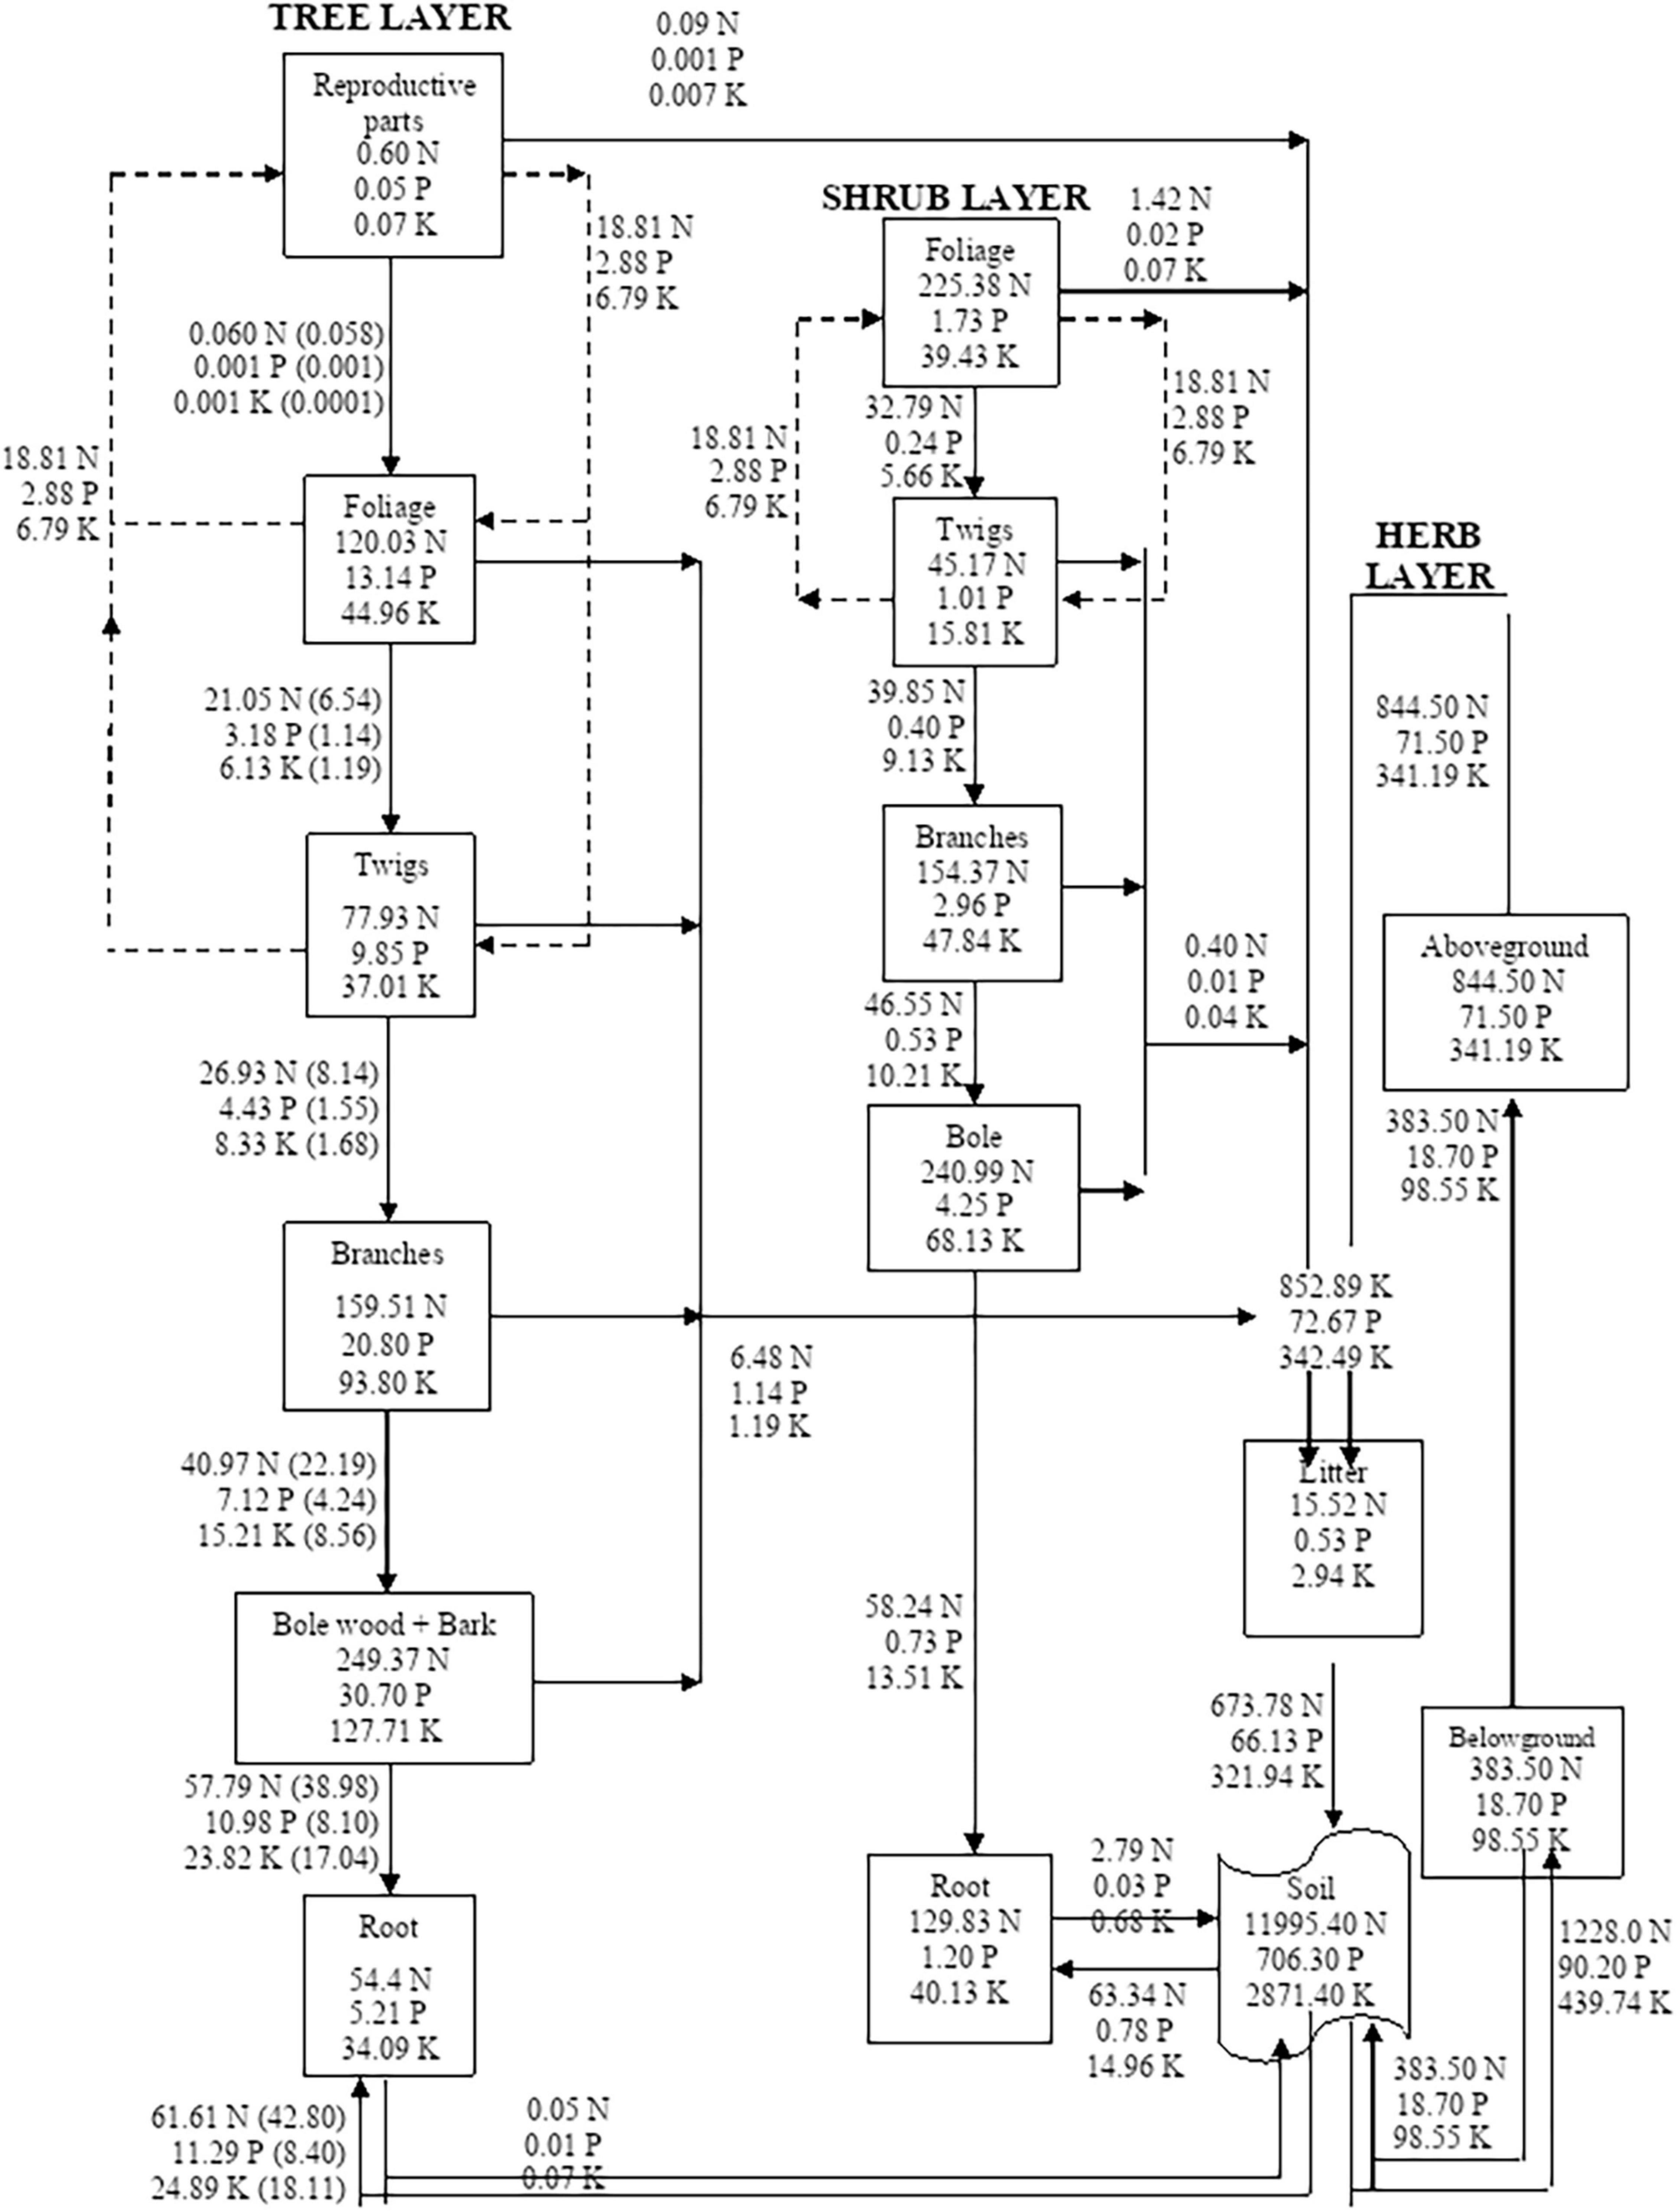
Figure 5. Compartment models showing the distribution and cycling of nitrogen (N), phosphorus (P), and potassium (K) in tree, shrub, and herb at site-5. Rectangles represent compartment for standing state of nutrients from one compartment to the next compartment. Units are kg ha–1 yr–1 for flows between compartments. Values in parenthesis are after adjustment for internal cycling. Recycling between reproductive parts, foliage, twigs, and bole is shown by dotted lines.
The total quantity of nutrient stored in vegetation varied from site to site. Of the total nutrient 20.00–51.89% N, 44.03–60.70 P, and 28.89–50.12% K is distributed in the tree layer, 18.24–41.37% N, 2.63–8.33% P, and 16.76–30.96% K is distributed in the shrub layer and 29.88–46.96% N, 26.65–49.81% P, and 22.67–44.48% K is distributed in the herb layer. The allocation of uptake of N, P, and K in trees varied from 0.97 to 5.57%, 2.65 to 11.07%, and 1.72 to 5.19%, respectively. In shrubs, the uptake of N, P, and K varied from 3.69 to 8.28%, 0.59 to 1.29%, and 3.02 to 5.99%, respectively. In herbs the uptake of N, P, and K varied from 88.89 to 95.34%, 88.43 to 96.75%, and 89.63 to 95.26%, respectively.
The concentration of the nutrient in the plant parts depends upon the nutrient stock in the soil and their available form to the plant. Further, the concentration may vary among different plant components and age of the plants and their growth phase. The order of concentration of nutrients in the various components varied significantly and was highest for N followed by K and P. The foliage to root nutrient concentration ratio ranged between 1.20 and 2.09 (Table 2) which is within the range reported for high altitude shrubs of central Himalaya (Garkoti, 1996). The low leaf:root nutrient concentration and accumulation of nutrients in perennial parts suggested the nutrient conservation strategy of C. nepalensis. Highest concentration in foliage and fine roots are due to their higher metabolic activity. The present study showed that either foliage or bole wood contributed the maximum nutrient storage which depends upon the species composition, vegetation structure, and nutrient percentage in species (Sharma and Sharma, 2013; Gong et al., 2017; Gautam and Mandal, 2018) but Negi et al. (1983), Frederic et al. (2010), and Pang et al. (2020) have suggested that the contribution of foliage and bole wood in various forests of the world is intermediate with regard to nutrient storage. The present finding was similar to values reported by Ovington and Madgwick (1959) for scots pine plantations and post oak-black jack forest, Perala and Alban (1982) for Populus, Picea, and pines stands, Adhikari et al. (1995) for Q. semecarpifolia and Abies pindrow forests, Sharma and Sharma (2013) for Acacia senegal, A. tortilis, and E. camaldulensis forests and Gautam and Mandal (2018) for tropical moist forests. In the soil more nutrients are concentrated in the upper layer because most of the microbial communities and their activities are confined in this layer (Pant et al., 2017; Padalia et al., 2018; Manral et al., 2022) along with the nutrient leaching from the vegetation layer.
The standing state of nutrients depends upon the intake potential and inherent characteristics of the species. In this study, the nutrient accumulated in soil and vegetation showed a positive correlation. Similar findings were also reported by Singh and Singh (1991) and Pang et al. (2020). In shrubs the maximum storage of nutrients was generally reported from bole wood and it tended to be lower than storage in trees because of differences in biomass. Due to the high biomass accumulation in bole (Awasthi et al., 2022) nutrient storage becomes high in this component. Herb aboveground parts stored higher nutrients than in belowground parts and its contribution ranged from 29.88 to 46.96% N, 26.6 to 49.81% P, and 22.67 to 41.63% K to the total vegetation (Rawat and Singh, 1988; Bargali et al., 1992; Lodhiyal et al., 1995). The range of nutrient stock on the basis of percent contribution to total storage in different vegetation layers was: Trees > Herbs > Shrubs which was also reported by Lodhiyal and Lodhiyal (2003).
Contribution of litter fall to the total storage was the minimum through vegetation, litter, and soil. Nutrient storage in litter ranged from 8.38 to 15.52 kg N ha–1, 0.31 to 0.55 kg P ha–1, and 1.64 to 2.94 kg K ha–1. The annual N and P return through litter fall reported for certain temperate forests was 14.1–125.0 kg N ha–1 and 1.7–10.0 kg P ha–1, respectively (Ovington and Madgwick, 1959; Van Cleve and Noonan, 1975) which was higher than the values recorded in the present study. Adhikari et al. (1995) and Pang et al. (2020) also reported higher nutrient contribution by litter in comparison to the present study.
The retranslocation of nutrients from the senescing tissues is one of the factors affecting the concentration of nutrients in the litter (Liu et al., 2001). It allows the plants to utilize the nutrients in the various growth cycle that are added in to the soil through the leaves or foliage and fine roots. In foliage, the N and P concentrations are important because it determines the cyclic phase of nutrients and C as well as the food web and chain in the forest ecosystem (Chapin et al., 2011). The values of the P retranslocated by twigs (47.11–66.60%) in this study were in a similar bracket as reported by Attiwill et al. (1978) for Eucalyptus oblique (61.1%), and Rawat and Singh (1988) for oak forest (47.8%), whereas the K retranslocated by twigs (58.71–80.10%) was higher than reported by Gautam and Mandal (2018) in mixed forests (41%) and Lodhiyal and Lodhiyal (2003) in Shisham plantation (34.8–37.3%) in Kumaun Himalaya. Bargali et al. (1992) reported 87.9–93.3% K retranslocation in Eucalyptus plantations, which was much higher than reported in the present study. This may be due to the higher K concentration of foliage litter in C. nepalensis shrublands than Eucalyptus plantations. The highest retranslocation rate (30–97%) was recorded for P than K (56–82%) and N (6–34%) which showed a reverse trend as maximum concentration of nutrients in foliage was in the order: N > P > K (Table 1). The retranslocation rate showed insignificant correlation with soil as well as foliage nutrient stock.
The nutrient uptake depends upon the nutrient stock, its available forms, root system, and rhizosphere biology as well as ecology. Beside this, the species and its age and site condition also affect and determine the update of nutrients. The range of nutrient uptake (kg ha–1 yr–1) by different vegetation layers across the sites revealed that the order of uptake by different vegetation layers was inversely proportional to the size of the plants: Herbs > Shrubs > Trees for N and Herbs > Trees > Shrubs for P and K. Earlier studies also reported the variations in the order of contribution by different vegetation layers e.g., Singh and Singh (1991) reported the order: Shrubs > Trees > Herbs whereas Rawat and Singh (1988), Garkoti and Singh (1994), Lodhiyal and Lodhiyal (2003), and Gautam and Mandal (2018) reported the order: Trees > Herbs > Shrubs. These findings suggested that the required nutrient is extracted by plants from the soil in proportions that vary from species to species. The magnitude of annual uptake in the present study was higher than the values reported by Rawat and Singh (1988) in an oak forest, Garkoti and Singh (1994) in Maple, Birch and Rhododendron forests, and Gautam and Mandal (2018) in a tropical moist forest.
The nutrient return from litter takes place through decomposition processes followed by nutrient release. The nutrient release and cycling process alters as well as being dependent upon the turnover of litter and turnover time. Further, the concentration of nutrient in litter and amount of litter also affects the level of nutrient returns in the soil compartment. The values of nutrient return through litter fall in the present study were higher than reported by Rawat and Singh (1988), Bargali et al. (1992), Rana et al. (2007), Paudel et al. (2015), Novak et al. (2020), and Pang et al. (2020). The contribution of foliage in total ranged from 68.83 to 74.63% N, 39.41 to 52.41 P, and 52.25 to 63.81% K which is lower than reported by Klinge (1968), Rawat and Singh (1988), and Rana et al. (2007) whereas Paudel et al. (2015), and Novak et al. (2020) reported a similar range of 55.23–70.51% of nutrient return through foliage in various forests. Nutrient return by leaves was followed by twigs, reproductive parts, and bark. High nutrient content in the litter enhanced the decomposition processes and nutrient return to the soil as compared to other vegetation types.
The litter deposition and its decomposition are the key ecological processes of nutrient cycling. The rate and time of decomposition affects the nutrient release and stock in the forest soils. The turnover time for N in this study was a little longer than those for other nutrients (P and K) and these results are consistent with the observations of Lang and Formann (1978) because K is soluble and is more readily leached from the organic matter and therefore, recycles faster than structurally bound elements like N and P. Slower turnover of N and P in the litter layer also appears to be due to re-translocation in the plant before senescence, thereby reducing the relative amounts of these nutrients in litter fall (Rawat and Singh, 1988). Bargali et al. (1992) in a Eucalyptus plantation and Nonghuloo et al. (2020) in a coniferous forest reported a turnover ranging between 0.3 and 1.35 years which was in a similar range to that reported in this study whereas Gosz et al. (1973) in northern deciduous hardwood forests, Singh and Singh (1991) in a dry tropical forest, Rawat and Singh (1988) in an oak forest, Foster and Morrison (1976) in a pine forest, Garkoti and Singh (1994) in a temperate forest of Western Himalaya and Gautam and Mandal (2018) in a tropical moist forest reported the turnover time for nutrients to be between 1.47 and 15.4 years which is higher than the turnover time reported in this study.
Plants that recycle a large proportion of their nutrients internally are less dependent on uptake from the soil to meet subsequent nutrient requirements. Nutrient use efficiency of a species is also an important consideration in managed systems but in natural systems it is regulated by the structure and functioning of the ecosystems. The nutrient retranslocation prior to senescence and litter fall increased the nutrient use efficiency in the forests (Chapin et al., 2011). High nutrient use efficiency under low nutrient availability drives infertile ecosystems toward greater nutrient deficiency (Shaver and Melillo, 1984). The nutrient use efficiency in the present study was in a similar range as in the Shorea robusta forest (128 N, 1525 P, and 258 K; Singh and Singh, 1987); Populus deltoides plantation (160 N; 1379 P; Lodhiyal et al., 1995), Puetro Rico forest (128–357 N, 833–1,428 P; Wang et al., 1991), P. roxburghii forest (129 N, 1,130 P, and 219 K; Chaturvedi and Singh, 1987), and Costa-rica forest (95–150 N, 433–962 P; Hiremath et al., 2002). However, the present values of nutrient use efficiency were lower than reported for eucalypt plantations (198 N, 3,180 P, and 362 K; Bargali et al., 1992), Pinus thunbergii forest (66–263 N; 1,552–3,771 P; Enoki et al., 1997), five plantation-grown trees (135–480 N, 750–3,750 P; Son and Gower, 1991) and mangrove forests (167–322 N, 2,905–5,053 P; Alongi et al., 2005).
The total amount of nutrient uptake (N, P, K) by vegetation after adjusting for internal cycling ranged from 427.00 to 1334.14 kg N ha–1 yr–1, 31.30 to 99.38 kg P ha–1 yr–1, and 107.87 to 472.82 kg K ha–1 yr–1, respectively. The decrease in the calculated uptake was due to adjustment of internal retranslocation. The recycling supports a portion of the production of new foliage and other components and that will decrease the demands of nutrients from the soil.
The soil compartment received nutrients consequent to release by decomposition of litter and roots. Annually, 240.28–852.89 kg N ha–1, 21.02–72.67 kg P ha–1, and 59.94–342.50 kg K ha–1 were released into the soil through total litter fall (C. nepalensis foliage + twigs + reproductive parts + bark + tree aboveground + herb leaf litter). The release of nutrients by fine roots (trees + shrubs + herbs) ranged between 124.65 and 383.68 kg N ha–1, 6.81 and 18.71 kg P ha–1, and 33.66 and 98.65 kg K ha–1 across the selected sites.
Himalayan mountains are sub-surface flow systems and are hence prone to landslides and landslips. Nutrient and water limitations are two limiting factors to plant growth and stand productivity in these degraded lands and needs to reduce their insidious effects with selection of suitable plant species. This study reported that in nutrient concentration and stock (1,295–12,316 kg ha–1 N, 93–277 kg ha–1 P, and 433–1,037 kg ha–1 K) in C. nepalensis dominated shrublands was more than other shrub species of the region like Lantana camara and Arundinaria falcata. Through annual litter fall the C. nepalensis released 240.28–852.89 kg ha–1 N, 21.02–72.67 kg ha–1 P, and 59.94–342.50 kg ha–1 K to the soil. In addition, the C. nepalensis shrubland showed efficient nutrient retranslocation (34–62% N, 41–65% P, and 57–69% K) and conservation (use) mechanism. Gautam and Mandal (2018) reported that the plants with high nutrient concentration have a higher percentage of N and P in soluble inorganic form and retranslocate a larger proportion of N and P than plants with low nutrient status. The higher nutrient retranslocation efficiency support the production of new foliage and branches in a successful growing season and minimize the demand from the soil. Therefore, in landslide affected degraded hills of Kumaun Himalaya, conserving and establishing C. nepalensis shrubland is a better management strategy to improve soil conditions by utilizing its biological nitrogen-fixation ability and nutrient-cycling through nutrient-rich litter.
The original contributions presented in the study are included in the article/supplementary material, further inquiries can be directed to the corresponding author/s.
PA collected the data and prepared the first draft. KB and SB guided the research, reviewed, and modified the manuscript. KK helped in manuscript preparation and analysis. MJ helped in editing the manuscript. All authors contributed to the article and approved the submitted version.
The authors declare that the research was conducted in the absence of any commercial or financial relationships that could be construed as a potential conflict of interest.
All claims expressed in this article are solely those of the authors and do not necessarily represent those of their affiliated organizations, or those of the publisher, the editors and the reviewers. Any product that may be evaluated in this article, or claim that may be made by its manufacturer, is not guaranteed or endorsed by the publisher.
We are very grateful to the Head, Department of Botany, D.S.B. Campus, Kumaun University, Nainital, for providing all the necessary facilities to conduct the research. We are highly grateful for the constructive comments of the editor and all the three reviewers that improved our manuscript.
Adhikari, B. S., Rawat, Y. S., and Singh, S. P. (1995). Structure and function of high altitude forests of central Himalaya II. Nutrient Dynamics. Ann. Bot. 75, 249–258. doi: 10.1006/anbo.1995.1018
Alongi, D. M., Clough, B. F., and Robertson, A. I. (2005). Nutrient-use efficiency in arid-zone forests of the mangroves Rhizophora stylosa and Avicennia marina. Aquat. Bot. 82, 121–131. doi: 10.1016/j.aquabot.2005.04.005
Attiwill, P. M., Guthrie, H. B., and Leuning, R. (1978). Nutrient cycling in a Eucalyptus obliqua (L’ Herit) forest. I. Litter production and nutrient return. Aust. J. Bot. 26, 76–91. doi: 10.1071/BT9780079
Awasthi, P., Bargali, K., Bargali, S. S., and Jhariya, M. K. (2022). Structure and Functioning of Coriaria nepalensis Wall dominated Shrublands in degraded hills of Kumaun Himalaya. I. Dry Matter Dynamics. Land Degrad. Dev. 33, 1474–1494. doi: 10.1002/ldr.4235
Bargali, K., Manral, V., Padalia, K., Bargali, S. S., and Upadhyay, V. P. (2018). Effect of vegetation type and season on microbial biomass carbon in Central Himalayan forest soils, India. Catena 171, 125–135. doi: 10.1016/j.catena.2018.07.001
Bargali, S. S., Padalia, K., and Bargali, K. (2019). Effects of tree fostering on soil health and microbial biomass under different land use systems in central Himalaya. Land Degrad. Dev. 30, 1984–1998. doi: 10.1002/ldr.3394
Bargali, S. S., and Singh, R. P. (1997). Pinus patula plantations in Kumaun Himalaya. II. Nutrient dynamics. J. Trop. For. Sci. 10, 101–104.
Bargali, S. S., Singh, R. P., and Singh, S. P. (1992). Structure and function of an age series of eucalypt plantations in Central Himalaya. II. Nutrient dynamics. Ann. Bot. 69, 413–421. doi: 10.1093/oxfordjournals.aob.a088362
Chapin, F. S., Power, M. E., Pickett, S. T. A., Freitag, A., Reynolds, J. A., Jackson, R. B., et al. (2011). Earth stewardship: science for action to sustain the human earth system. Ecosphere 2, 1–20. doi: 10.1890/ES11-00166.1
Chaturvedi, O. P., and Singh, J. S. (1987). The structure and function of Pine forest in Central Himalaya. II. Nutrient dynamics. Ann. Bot. 60, 253–267. doi: 10.1093/oxfordjournals.aob.a087443
Enoki, T., Kawaguchi, H., and Iwatsubo, G. (1997). Nutrient-uptake and nutrient-use efficiency of Pinus thunbergii Parl. along a topographical gradient of soil nutrient availability. Ecol. Res. 12, 191–199. doi: 10.1007/bf02523784
Finzi, A. C., Allen, A. S., DeLucia, E. H., Ellsworth, D. S., and Schlesinger, W. H. (2001). Forest litter production, chemistry, and decomposition following two years of free-air CO2 enrichment. Ecology 82, 470–484. doi: 10.1890/0012-96582001082[0470:FLPCAD]2.0.CO;2
Foster, N. W., and Morrison, I. K. (1976). Distribution and cycling of nutrients in a natural Pinus banksiana ecosystem. Ecology 57, 110–120. doi: 10.2307/1936402
Frederic, A., Mathieu, J., and Quentin, P. (2010). Biomass and nutrient content of sessile oak (Quercus petraea Matt.) and beech (Fagus sylvatica L.) stem and branches in a mixed stand in southern Belgium. Sci. Total Environ. 408, 2285–2294. doi: 10.1016/j.scitotenv.2010.02.040
Garkoti, S. C. (1996). Nutrient dynamics in high altitude shrubs of central Himalaya. Proc. Indian Natl. Sci. Acad. B. 62, 281–286.
Garkoti, S. C., and Singh, S. P. (1994). Nutrient cycling in the three Central Himalayan forests ranging from close canopied to open canopied treeline forests India. Arct. Alp. Res. 26, 339–348. doi: 10.1080/00040851.1994.12003078
Gautam, T. P., and Mandal, T. N. (2018). Storage and flux of nutrients in disturbed and undisturbed tropical moist forest of Eastern Nepal. Int. J. For. Res. 2018, 1–12. doi: 10.1155/2018/8516321
Gong, Y., Lv, G., Guo, Z., Chen, Y., and Cao, J. (2017). Influence of aridity and salinity on plant nutrients scales up from species to community level in a desert ecosystem. Sci. Rep. 7:6811. doi: 10.1038/s41598-017-07240-6
Gosz, J. R., Likens, G. E., and Bormann, F. H. (1973). Nutrient release from decomposing leaf and branch litter in the Hubbard Brook Forest, New Hampshire. Ecol. Monogr. 43, 173–191. doi: 10.2307/1942193
Hiremath, A. J., Ewel, J. J., and Cole, T. G. (2002). Nutrient use efficiency in three fast-growing tropical trees. For. Sci. 48, 662–672. doi: 10.1093/forestscience/48.4.662
Jackson, M. L. (1958). Soil chemical analysis. New Jersey: Prentice Hall, Inc, doi: 10.1002/jpln.19590850311
Karki, H., Bargali, K., and Bargali, S. S. (2021). Spatial and Temporal Trends in Soil N-Mineralization Rates under the Agroforestry Systems in Bhabhar belt of Kumaun Himalaya, India. Agrofor. Syst. 95, 1603–1617. doi: 10.1007/s10457-021-00669-9
Kjeldahl, J. (1883). Neue Methode zur Bestimmung des Stickstoffs in organischen Korpern. Z. Anal. Chem. 22, 366–382. doi: 10.1007/BF01338151
Klinge, H. (1968). Litter Production in an area of Amazonian terra firme forest. Part I. Litter fall, organic carbon and total nitrogen contents of litter’). Amazoniana: Limnologia et Oecologia Regionalis Systematis Fluminis Amazonas 1, 287–302.
Lang, G. E., and Formann, R. T. T. (1978). Detrital dynamics in a mature oak forest: Hutcheson memorial forest, New Jersey. Ecology 59, 580–595. doi: 10.2307/1936587
Liu, C. J., Westman, C. J., and Ilvesniemi, H. (2001). Matter and nutrient dynamics of pine (Pinus tabulaeformis) and oak (Quercus variabilis) litter in North China. Silva. Fenn. 35, 3–13. doi: 10.14214/sf.599
Lodhiyal, L. S., Singh, R. P., and Singh, S. P. (1995). Structure and Function of an Age series of Poplar Plantations in Central Himalaya: II. Nutrient Dynamics. Ann. Bot. 76, 201–210. doi: 10.1006/anbo.1995.1088
Lodhiyal, N., and Lodhiyal, L. S. (2003). Aspects of nutrient cycling and nutrient use pattern of Bhabar Shisham forests in central Himalaya, India. For. Ecol. Manag. 176, 237–252. doi: 10.1016/S0378-1127(02)00268-2
Manral, V., Bargali, K., Bargali, S. S., Jhariya, M. K., and Padalia, K. (2022). Relationships between soil and microbial biomass properties and annual flux of nutrients in Central Himalayan forests, India. Land Degrad. Dev. 2022:4283. doi: 10.1002/ldr.4283
Manral, V., Bargali, K., Bargali, S. S., and Shahi, C. (2020). Changes in soil biochemical properties following replacement of Banj oak forest with Chir pine in Central Himalaya, India. Ecol. Process 9:30. doi: 10.1186/s13717-020-00235-8
Mfilinge, P., Atta, N., and Tsuchiya, M. (2002). Nutrient dynamics and leaf litter decomposition in a subtropical mangrove forest at Oura Bay, Okinawa, Japan. Trees 16, 172–180. doi: 10.1007/s00468-001-0156-0
Negi, K. S., Rawat, Y. S., and Singh, J. S. (1983). Estimation of biomass and nutrient storage in a Himalayan moist temperate forest. Can. J. For. Res. 13, 1185–1196. doi: 10.1139/x83-157
Nonghuloo, I. M., Kharbhih, S., Suchiang, B. R., Adhikari, D., Upadhaya, K., and Barik, S. K. (2020). Production, decomposition and nutrient contents of litter in subtropical broadleaved forest surpass those in coniferous forest, Meghalaya. Trop. Ecol. 61, 5–12. doi: 10.1007/s42965-020-00065-x
Novak, J., Kacalek, D., and Dusek, D. (2020). Litterfall nutrient return in thinned young stands with Douglas fir. Cent. Eur. For. J. 66, 78–84. doi: 10.2478/forj-2020-0006
Olsen, S. R., Cole, C. V., Watanabe, F. S., and Dean, L. A. (1954). Estimation of available phosphorus in soils by extraction with Sodium bicarbonate. Depart. Agricult. Circular 1954:939.
Ovington, J. D., and Madgwick, H. A. I. (1959). Distribution of organic matter and plant nutrients in plantations of Scots pine. For. Sci. 5, 344–355. doi: 10.1093/forestscience/5.4.344
Padalia, K., Bargali, S. S., Bargali, K., and Khulbe, K. (2018). Assessment of the microbial biomass carbon and nitrogen in relation to cropping systems in Central Himalaya, India. Curr. Sci. 115, 1741–1750.
Pang, Y., Tian, J., Zhao, X., Chao, Z., Wang, Y., Zhang, X., et al. (2020). The linkages of plant, litter and soil C:N:P stoichiometry and nutrient stock in different secondary mixed forest types in the Qinling Mountains, China. Peer J. 8:e9274. doi: 10.7717/peerj.9274
Pant, M., Negi, G. C. S., and Kumar, P. (2017). Macrofauna contributes to organic matter decomposition and soil quality in Himalayan agroecosystems, India. Appl. Soil Ecol. 120, 20–29.
Paudel, E., Dossa, G. G. O., Xu, J., and Harrison, R. D. (2015). Litterfall and nutrient return along a disturbance gradient in a tropical montane forest. For. Ecol. Manag. 353, 97–106. doi: 10.1016/j.foreco.2015.05.028
Peach, K., and Tracey, M. V. (1956). Modern Methods of Plant Analysis, Vol. I., Berlin: Springer, 542. doi: 10.1007/978-3-662-25300-7
Perala, D. A., and Alban, D. H. (1982). Biomass, nutrient distribution and litter fall in Populus, Pinus and Picea stands on two different soils in Minnesota. Plant Soil 64, 177–192. doi: 10.1007/BF02184249
Raha, D., Dar, J. A., Pandey, P. K., Lone, P. A., Verma, S., Khare, P. K., et al. (2020). Variation in tree biomass and carbon stocks in three tropical dry deciduous forest types of Madhya Pradesh, India. Carbon Manag. 2020, 1–12. doi: 10.1080/17583004.2020.1712181
Ralhan, P. K., and Singh, S. P. (1987). Dynamics of nutrients and leaf mass in Central Himalayan forest trees and shrubs. Ecology 68, 1974–1983. doi: 10.2307/1939888
Rana, B. S., Saxena, A. K., Rao, O. P., and Singh, B. P. (2007). Nutrient return to the soil through litterfall under certain tree plantations on sodic wastelands in northern India. J. Trop. For. Sci. 19, 141–149.
Rawat, Y. S., and Singh, J. S. (1988). Structure and function of oak forests in central Himalaya. II. Nutrient dynamics. Ann. Bot. 62, 413–427. doi: 10.1093/oxfordjournals.aob.a087674
Ray, T., Malasiva, D., Rajpoot, R., Verma, S., Dar, J. A., Dayanandan, A., et al. (2020). Impact of Forest Fire Frequency on Tree Diversity and Species Regeneration in Tropical Dry Deciduous Forest of Panna Tiger Reserve, Madhya Pradesh, India. J. Sustain. For. 2020, 1–15. doi: 10.1080/10549811.2020.1823853
Sharma, B., and Sharma, K. (2013). Nutrient accumulation in various plant parts of dominant tree species of three different localities. Pak. J. Biol. Sci. 16, 965–968. doi: 10.3923/pjbs.2013.965.968
Shaver, G. R., and Melillo, J. M. (1984). Nutrient budgets of marsh plants: Efficiency concepts and relation to availability. Ecology 65, 1491–1510. doi: 10.2307/1939129
Singh, J. S., and Singh, S. P. (1987). Forest vegetation of the Himalaya. Bot. Rev. 53, 80–192. doi: 10.1007/BF02858183
Singh, L., and Singh, J. S. (1991). Species structure, dry matter dynamics and carbon flux of a dry tropical forest in India. Ann. Bot. 68, 263–273. doi: 10.1093/oxfordjournals.aob.a088252
Singh, P. S., Prajapati, S. K., Sunita, K., and Chaturvedi, R. K. (2022). Disturbance Induced Changes in Diversity of Medicinal Plants in a Dry Tropical Forest of India. Front. For. Glob. Change 2022:718930. doi: 10.3389/ffgc.2021.718930
Singh, S. (2021). Low- to Moderate-Level Forest Disturbance Effects on Plant Functional Traits and Associated Soil Microbial Diversity in Western Himalaya. Front. For. Glob. Change 2021:710658. doi: 10.3389/ffgc.2021.710658
Son, Y., and Gower, S. T. (1991). Aboveground nitrogen and phosphorus use by five plantation-grown trees with different leaf longevities. Biogeochemistry 14, 167–191.
Van Cleve, K., and Noonan, L. L. (1975). Litter fall and nutrient cycling in forest floor of birch and aspen stands in interior Alaska. Can. J. For. Res. 5, 626–639. doi: 10.1139/x75-089
Vitousek, P. M. (1984). Litter fall, nutrient cycling and nutrient limitation in tropical forests. Ecology 65, 285–298. doi: 10.1086/283931
Vitousek, P. M., and Sanford, R. L. Jr. (1986). Nutrient cycling in moist tropical forests. Annu. Rev. Ecol. Evol. Syst. 17, 137–167. doi: 10.1146/annurev.es.17.110186.001033
Keywords: compartment model, nutrient dynamics, nutrient content, retranslocation, turnover of nutrients
Citation: Awasthi P, Bargali K, Bargali SS, Khatri K and Jhariya MK (2022) Nutrient Partitioning and Dynamics in Coriaria nepalensis Wall Dominated Shrublands of Degraded Hills of Kumaun Himalaya. Front. For. Glob. Change 5:913127. doi: 10.3389/ffgc.2022.913127
Received: 05 April 2022; Accepted: 19 April 2022;
Published: 31 May 2022.
Edited by:
Ravi Kant Chaturvedi, Xishuangbanna Tropical Botanical Garden (CAS), ChinaReviewed by:
Prasant Kumar Singh, Government Vijay Bhushan Singh Deo Girls College, IndiaCopyright © 2022 Awasthi, Bargali, Bargali, Khatri and Jhariya. This is an open-access article distributed under the terms of the Creative Commons Attribution License (CC BY). The use, distribution or reproduction in other forums is permitted, provided the original author(s) and the copyright owner(s) are credited and that the original publication in this journal is cited, in accordance with accepted academic practice. No use, distribution or reproduction is permitted which does not comply with these terms.
*Correspondence: Surendra Singh Bargali, c3VyZW5kcmFraXJhbkByZWRpZmZtYWlsLmNvbQ==; orcid.org/0000-0001-6341-0945
Disclaimer: All claims expressed in this article are solely those of the authors and do not necessarily represent those of their affiliated organizations, or those of the publisher, the editors and the reviewers. Any product that may be evaluated in this article or claim that may be made by its manufacturer is not guaranteed or endorsed by the publisher.
Research integrity at Frontiers
Learn more about the work of our research integrity team to safeguard the quality of each article we publish.