 Liana Hilda Golin Mengarda
 Guilherme Bravim Canal
 Marina Santos CarvalhoAdésio Ferreira
 Marcia Flores da Silva Ferreira*
- Laboratório de Genética e Melhoramento Vegetal, Departamento de Agronomia, Centro de Ciências Agrárias e Engenharias, Universidade Federal do Espírito Santo, Alegre, ES, Brazil
The diversity of juçara palm (Euterpe edulis) must be investigated at the molecular level to enable the adoption of appropriate management strategies that may associate breeding studies with conservation. With the aim of describing the genetic diversity and structure of a population of E. edulis in a commercial plantation area, the genotyping of 199 individuals was performed using nine nuclear microsatellite markers. We detected inbreeding in the population and the diversity within the plots was high showing diversity among the individuals. The individuals from matrices germplasm of the locality Santa Marta, were divergent. The diversity indices observed in the studied population were close to those reported in the literature for natural populations; thus, the ex situ conservation of the population in this managed is feasible, as is their potential use in breeding studies.
Introduction
The juçara palm (Euterpe edulis Mart., Arecaceae) is a species from the Brazilian Atlantic Forest that plays an important ecological role, but this palm is threatened with extinction. Biome fragmentation, with a consequent reduction of gene flow, and the illegal cutting of the species to obtain heart of palm have been reducing the genetic variability of this species in the forest remnants (Seoane et al., 2005; Vieira et al., 2010; Santos et al., 2015). The fragmentation and the exploitation can significantly impact the loss of diversity, in the other hand the maintenance to the gene flow and allelic exchanges are crucial to define conservation efforts of the E. edulis (Montagna et al., 2018).
The use of Juçara palm for the production of fruit pulp represents a sustainable alternative to the illegal extraction of heart of palm (Silva et al., 2013), providing continuous and permanent income generation. The incentive provided by fruit pulp production increases interest in the commercial planting of the species, the planting of agro-ecological crops (Danelli et al., 2016), and reforestation. When evaluating the population biology of E. edulis in managed landscape, De Souza et al. (2021) checked it was found the sites assessed outside protected areas also contribute to the conservation of this palm. Such actions, if strategically performed, can increase the genetic variability of the species, aiding conservation. In addition, the establishment of sustainable commercial crops can advance the genetic improvement of the species by allowing the selection of divergent and productive matrices.
The fruit of the juçara palm have a high nutraceutical value and great potential as a functional food. In addition, the pulp, has nutritional characteristics similar to or better than those of açaí pulp (E. oleracea; Borges et al., 2011; Silva et al., 2013; Schulz et al., 2016). The market for juçaí pulp is expanding. Thus, the economic advantage of preserving the species via sustainable management, including planting, is apparent.
In the south of Espírito Santo State, Brazil, a heterogeneous area of E. edulis cultivation was established over approximately 30 years through natural regeneration and the planting of seedlings originating from seeds. Currently, this area consists of approximately 30,000 plants, which are managed with the objective of fruit pulp production. This managed area may represent a conservation site and a potential source of genetic variability available for breeding studies. However, the genetic diversity of this managed area requires characterization to evaluate this potential.
Genetic diversity studies allow the quantification of genetic variability among and within populations and of genetic divergence among individuals within a population. This knowledge makes it possible to define actions for the characterization and improvement of native species, facilitating the selection of breeding matrices with a high probability of success in crosses as well as the selection of productive cultivars and those adapted to different environments (Barbieri and Maia, 2012). These analyses also allow us to not only respond to ecological issues that are important for the adoption of conservation measures (De Souza et al., 2021; Cerqueira et al., 2022), such as the existence of population structure and the genetic relationship between individuals (Park et al., 2009), but also select divergent individuals for breeding studies, which is important in managed areas.
Microsatellite molecular markers have been used in studies regarding the diversity of natural populations of juçara palm (Gaiotto et al., 2003; Conte et al., 2006, 2008; Novello et al, 2018; Cerqueira et al., 2022; Pereira et al., 2022). These studies have revealed that the occurrence of non-random crosses is relatively common in natural populations of this species, with the possible occurrence of complete siblings within open-pollinated families (Gaiotto et al., 2003). Additionally, a reduction in the number of reproductive individuals increases inbreeding, favouring changes in the genetic structure of the populations (Conte et al., 2006). Still, the origin of the mother plant affects some genetic parameters. In E. edulis, Cerqueira et al. (2022) report that progenies from mother plants of forest fragment inserted in the more forested landscape had a greater number of private and effective alleles, which, in turn, contributes to the diversity maintenance and the conservation.
Anthropic impacts on E. edulis, an allogamous species, have also been reported to provide changes in its allelic frequencies, especially because of the reduction of seed dispersers (Carvalho et al., 2017). Furthermore, even though fragmentation and exploitation can significantly impact the loss of diversity, the limitations to the gene flow and maintenance of allelic exchanges are crucial to define conservation efforts of the E. edulis (Montagna et al., 2018).
For these reasons, a characterization of the potential for conservation and selection within the area to be evaluated by the present study is important. From the point of view of the ecological viability of the managed area, the management of fruit collection in this population allows for the action of pollinators and dispersers. In addition, the managed area was established from natural regeneration, theoretically presenting great genetic variability, which can be exploited for breeding. These facts suggest that the population of the managed area is highly diverse (Novello et al, 2018; De Souza et al., 2021).
The sustainable management for fruit production in a cultivation area with genetic variability can favors conservation actions for E. edulis and selection of divergent matrices for genetic improvement. Toward these ends, the present study used microsatellite markers to characterize the genetic diversity and structure of the E. edulis population in the managed area, with the aim of contributing to the sustainable management, improvement, and maintenance of this species diversity.
Materials and methods
Study area and sampling
The study was conducted in an area of approximately 20 hectares with predominance of Euterpe edulis, totaling around 20,000 plants (1,500 plants ha–1). This area belong to two companies that process juçaizeiro fruit pulp, Açaí juçara ® and Bonalotti ®) and located in the municipality of Rio Novo do Sul, Espírito Santo State, Brazil (at longitude 20°48′29.7″, latitude 40°56′3.5″, and a mean elevation of 467 m). The climate is classified according Köppen and Geiger (1928) as tipe “Aw.” The municipality has an average annual temperature of 24.08°C and an average temperature of the coldest month above 20°C, the daily averages can reach values below 18°C. The plantation is conducted for the purpose of producing fruit and processing juçara pulp (juçaí), without a pre-defined spacing, no productive management treatment and no controls of diseases and pests, only mowing at harvest time. In the plantation there are a mixture of individuals from of spontaneous development and enrichment by the owners by the sowing of seeds in the area.
The study area was sampled by twenty plots distributed over the entire area. Only ten plants were collected per plot (as a subsample), totaling 200 plants (Figure 1). Only adult plants with bunches were sampled in each plot. The plots definition followed the history of regeneration in the planted area. Fragments of stipe collected from each plant were lyophilized and stored in a freezer at –30°C for the further extraction of DNA, according Carvalho et al. (2019).
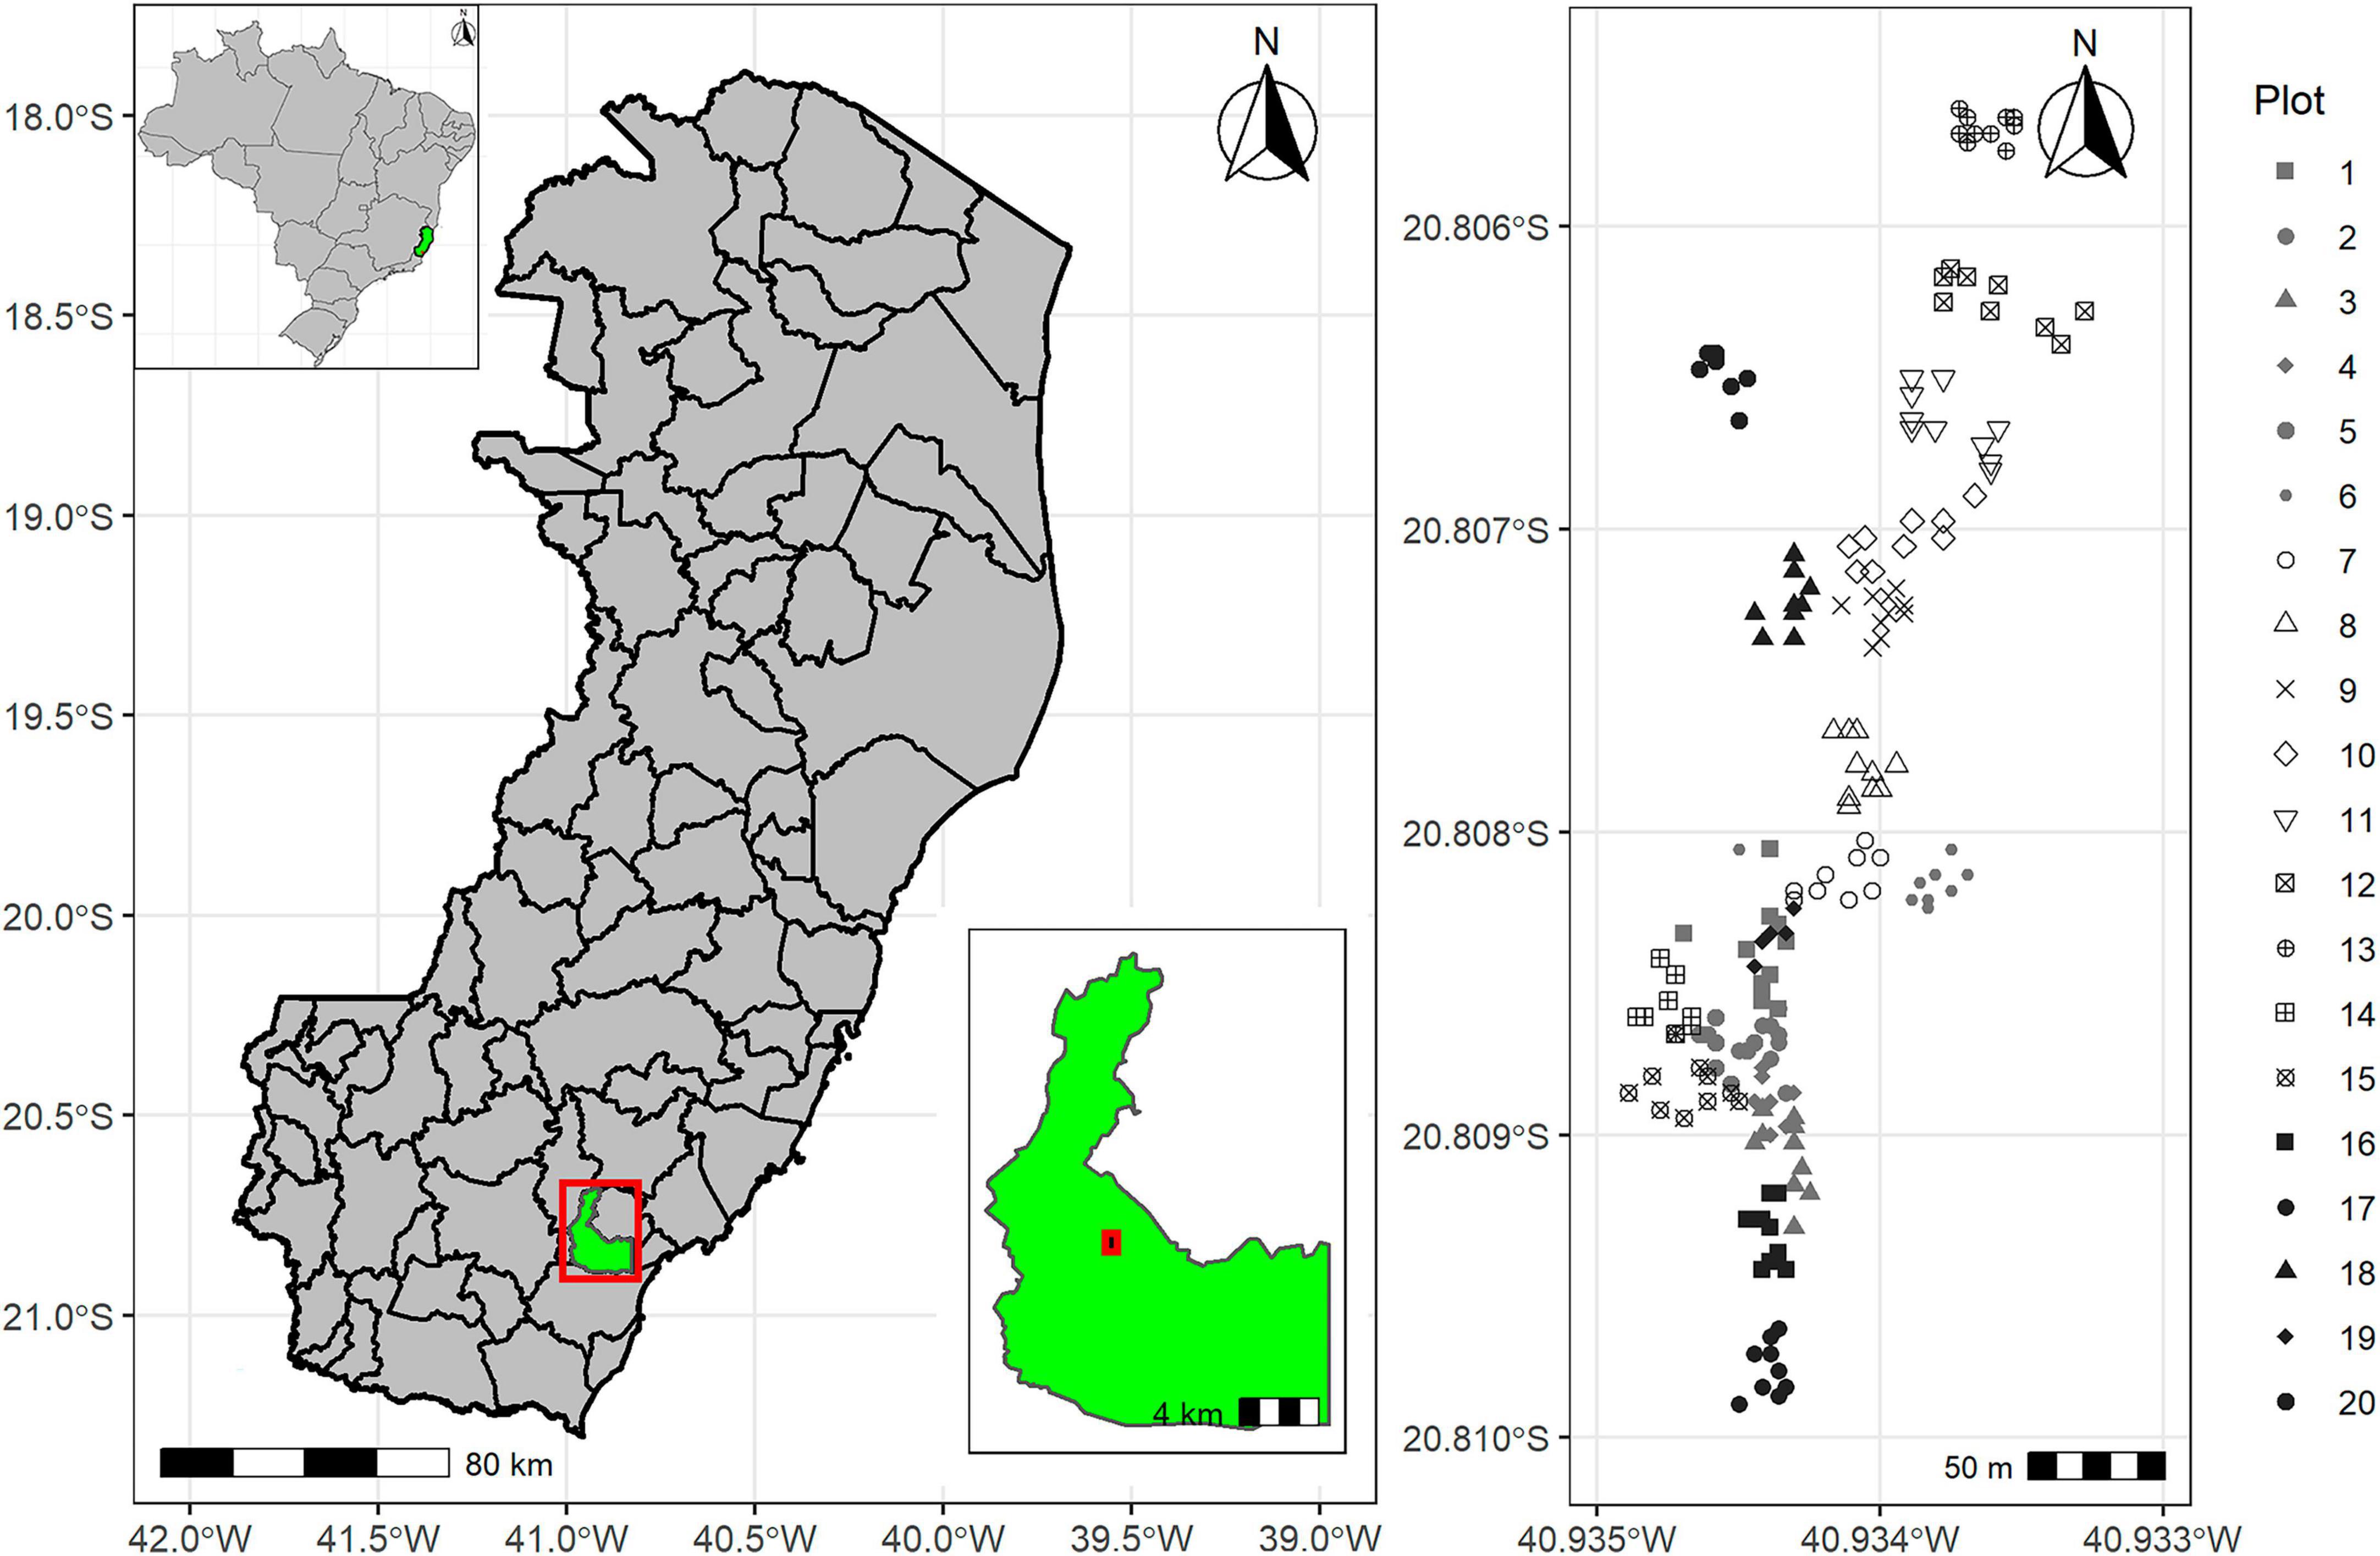
Figure 1. Geographic location of the Euterpe edulis individuals sampled. Each dot represents an individual, and the individuals are shown in groups representing the ten individuals from each plots in the managed area, with the groups delineated by markers of different forms and colors (in greyscale; R Program).
Some older plants – identified as 182, 183, 184, 185, and 186 – were also collected, regardless of the presence of bunches. Plots 1–19 consisted of plants from mostly natural regeneration, with the plants from plots 1, 2, 3, 7, and 19 being the oldest (over more than 30 years), according to the landowner. Plot 20 represented the most recent area (12–15 years), established with the planting of seedlings propagated from seeds collected from plants in the district of Santa Marta, in the municipality of Vargem Alta, Espírito Santo State, Brazil (about 50 Km far from sampling area).
Molecular analyses
The genomic DNA of the 200 individuals was extracted according to the CTAB (cetyltrimethylammonium bromide) method (Doyle and Doyle, 1990), with modifications. After extraction, the DNA quality and concentration were estimated using a spectrophotometer (NanoDrop 2000/2000c, Thermo Fisher Scientific, Waltham Massachusetts, EUA), and the DNA integrity was verified by 0.8% agarose gel electrophoresis.
The samples were genotyped with nine microsatellite loci (Gaiotto et al., 2001; Table 1 and Supplementary Table 1). Polymerase chain reactions (PCRs) were performed in a volume of 15 μL containing 30 ng of genomic DNA, 1x Buffer I0 (Synapse), 0.15 μM of each primer, 1.5 mM MgCl2, 0.25 mM dNTPs, and 1/2 U of Taq DNA polymerase. The following thermocycling programme was used: 94°C for four min, 30 cycles composed of 94°C for one and a half minutes, the annealing temperature of the primer (according Table 1) for 1 min, and 72°C for 1 min, and a final extension of 72°C for 7 min.
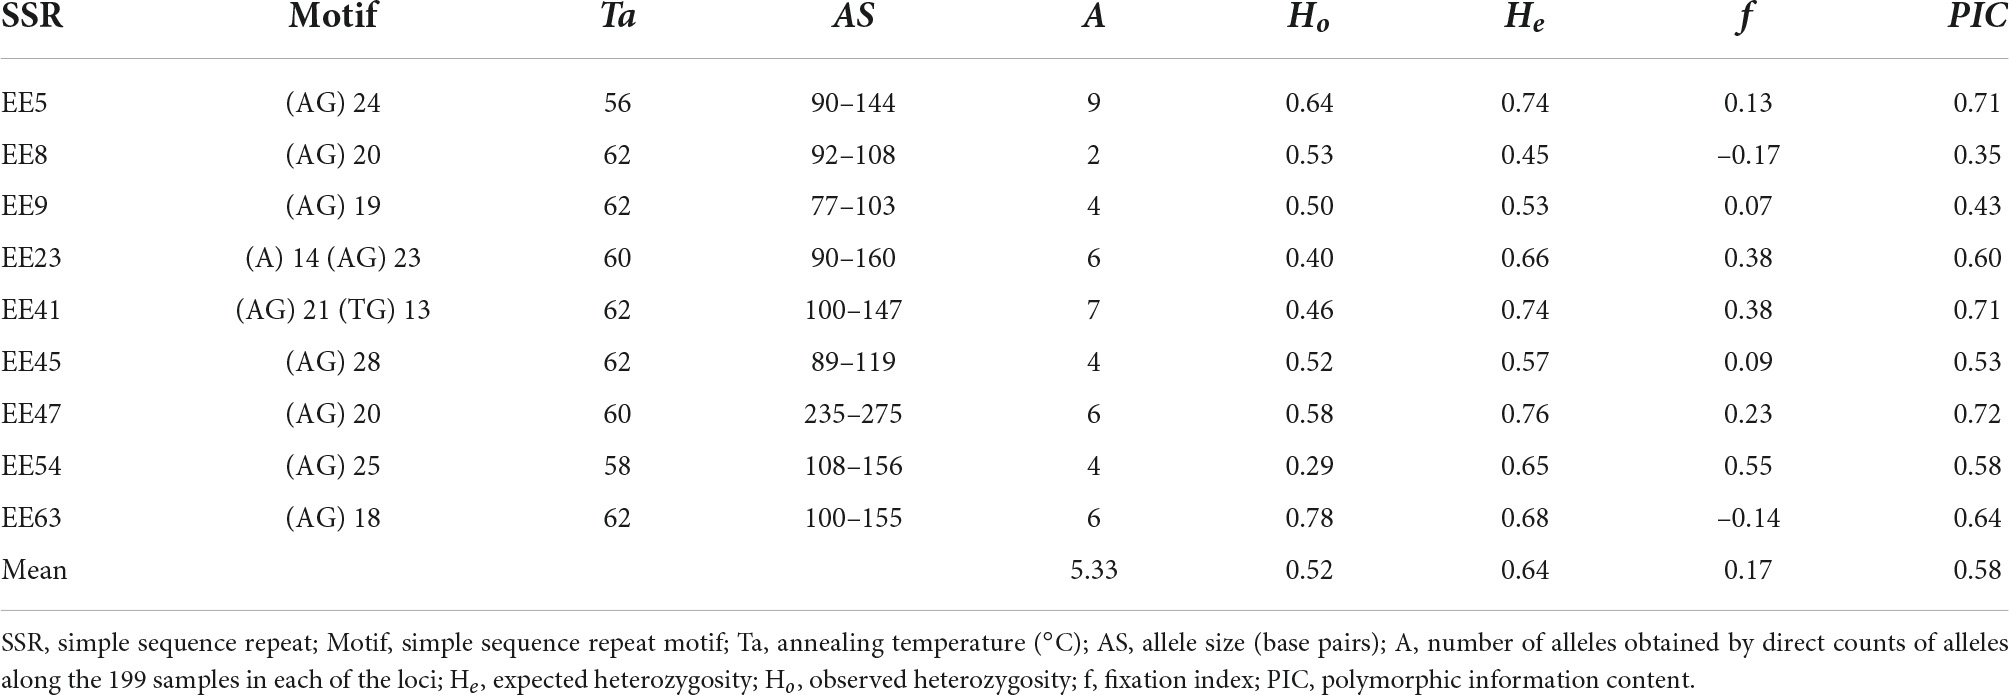
Table 1. Genetic diversity indices for Euterpe edulis microsatellite loci in 199 plants.
For the genotyping of individuals, the amplification products were subjected to capillary electrophoresis with the 35–500 bp dsDNA kit (Fragment Analyzer™) and analysed by PROSize 2.0 software (Advanced Analytical Technologies, Inc.).
Diversity and genetic structure
Descriptive analyses of the nine microsatellite loci were performed for the 20 plots. For each locus, the boundary disequilibrium and the Hardy-Weinberg equilibrium, assessed by allelic permutations within the plots, were estimated by Fisher’s exact test (Weir, 1996), using FSTAT v. 2.9.3.2 (Goudet, 2002). The following parameters were estimated: number of alleles (A) per locus (mean), expected heterozygosity (He), observed heterozygosity (Ho), fixation index (f) and number alleles in polymorphic locus in the plot (PA) obtained by the GDA software (Lewis and Zaykin, 2002). Also were estimated the allele number of the plot/total number of alleles (A/ToA), and the polymorphic information content (PIC; Botstein et al., 1980).
The estimates of genetic differentiation among and within the plots were obtained by analysis of molecular variance (AMOVA) by the Arlequin 3.5.2.2 program with two hierarchical levels, using the mean for the nine loci and the 199 individuals in the 20 plots (Excoffier et al., 2005).
The population subdivision was estimated by Wright’s (1951) statistic according to the Weir and Cockerham (1984) methods, and the diversity indices were obtained among (FST and GST) and within (FIS) the 20 plots, as was the correlation between alleles within an individual relative to the whole population (FIT). Estimates of the genetic divergence among plots (DST), the proportion of total diversity among plots (GST), and the f values within plots (GIS) were also obtained by FSTAT for Windows, v. 3, 2, 2002 (Goudet, 2002).
Additionally, pairwise FST values were obtained for plot pairs using Arlequin software 3.5.2.2. FST values up to 0.05 are considered indicative of low differentiation, those between 0.05 and 0.15 indicate moderate differentiation, and those above 0.15 indicate high genetic differentiation (Goudet, 2002). Subsequently, Nei’s (1978) distance matrix was estimated for the plots, and a grouping was performed according to the unweighted pair group method with arithmetic mean (UPGMA) clustering by and neighbor join techniques using the Genes software.
An analysis of population STRUCTURE among the 20 plots was performed using the inference of genetic groups by the Bayesian [Monte Carlo Markov chain (MCMC)] approach implemented in the software STRUCTURE v. 2.2 (Pritchard et al., 2000). The number of subpopulations was predefined as K = 20 (which would represent the maximum number of clusters, equivalent to the number of plots sampled), with the same number of runs (20) and a burn in of 500,000 replications, followed by one million MCMC steps. The models of allele Correlated allele frequencies) and Admixture were used in the analysis. The most probable K value was determined according to Evanno et al. (2005) by the application Structure Harvester (Earl and Vonholdt, 2012). The CLUMP software was used to align the 20 independent runs of STRUCTURE obtained for the best K value and to generate graphical outputs. Based on the genetic distance matrix between individuals, a principal coordinate analysis (PCoA) was performed using DARwin 6.0.14 software (Perrier and Jacquemoud-Collet, 2006). Also, the UPGMA clustering of individuals was done using Genes software.
Results
One sample was excluded from the analysis because the sample did not amplify with any of the nine primers; therefore, the sample size was 199 individuals. In nine microsatellite loci with no linkage and with not Hardy-Weinberg equilibrium we detected 48 alleles, with two to nine alleles per locus (mean of 5.3; Table 1). Most of the loci had a high PIC (≥ 0.50). The Ho ranged from 0.29 to 0.78, and the He from 0.45 to 0.76. The f (fixation index) value ranged from –0.17 (EE08) to 0.55 (EE54).
The average allele number ranged from 3.0 to 4.2 per plot (Table 2). The value of Ho varied from 0.40 (plots 5 and 18) to 0.65 (plot 8; mean = 0.52); the value for He varied from 0.51 (plot 3) to 0.66 (plot 20; mean = 0.58). The He value exceeded the Ho value only in plots 8 and 16. Even in the plots with the most positive f values (plots 4, 5, 18, and 20, Table 2).
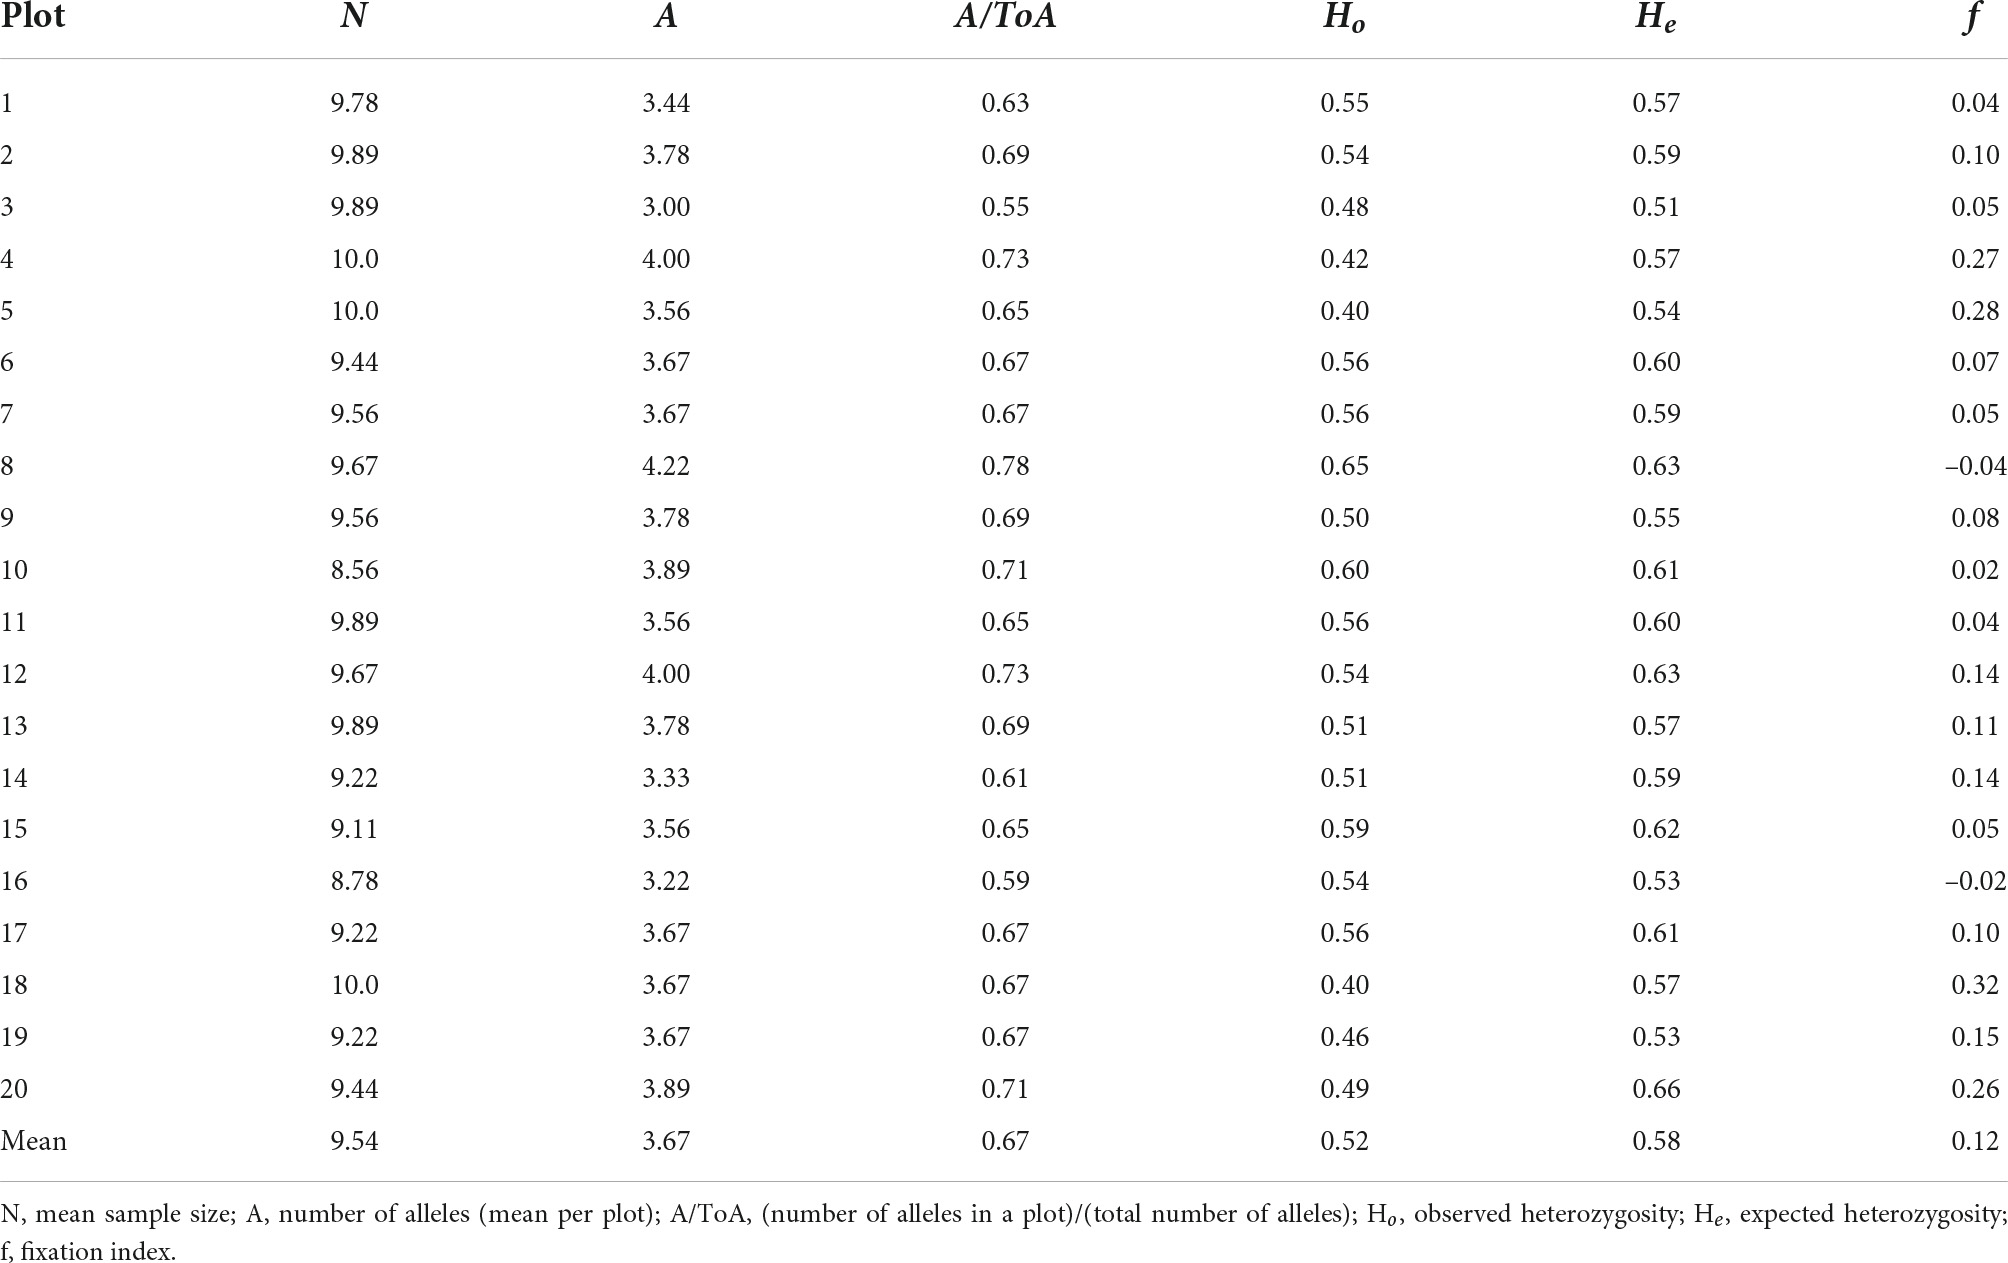
Table 2. Indices of genetic diversity for plots in an Euterpe edulis managed area.
According to AMOVA results (Supplementary Table 2) most of the genetic variation between individuals was observed within the plots (91.64%), with little variation among the plots (9.36%). The estimate of FST was 0.08, significant at the 1% probability level.
According to the degree of population subdivision estimated by the F statistics, little differentiation among plots (GST = 0.08) and moderate differentiation within the plots (FIS = 0.12) were observed. The value of FIT was 0.19.
In the pairwise analysis, the plot 20 presented the highest FST values (from 0.16 to 0.23) with the plots 1, 3, 4, 5, 6, 7, 9, and 19 and moderate genetic differentiation from the other plots (FST ranging from 0.07 to 0.14; Table 3). Genetic differentiation (between 0.15 and 0.21) was obtained between the plots: 4 with 13 and 17; plot 5 with 12, 13, and 17; plot 9 with 12, 13, 14, 17, and 18 plots. Among plots 1–8 and among plots 11–15, low genetic differentiation occurred. Plot 19 showed moderate variation with plots except to 1, 2, 3, 6, 14, 16, and 18 but (Table 3). The greatest variation occurred between plots 20 and 3. Lesser differentiation occurred among plots 1–8 and among plots 11–15.
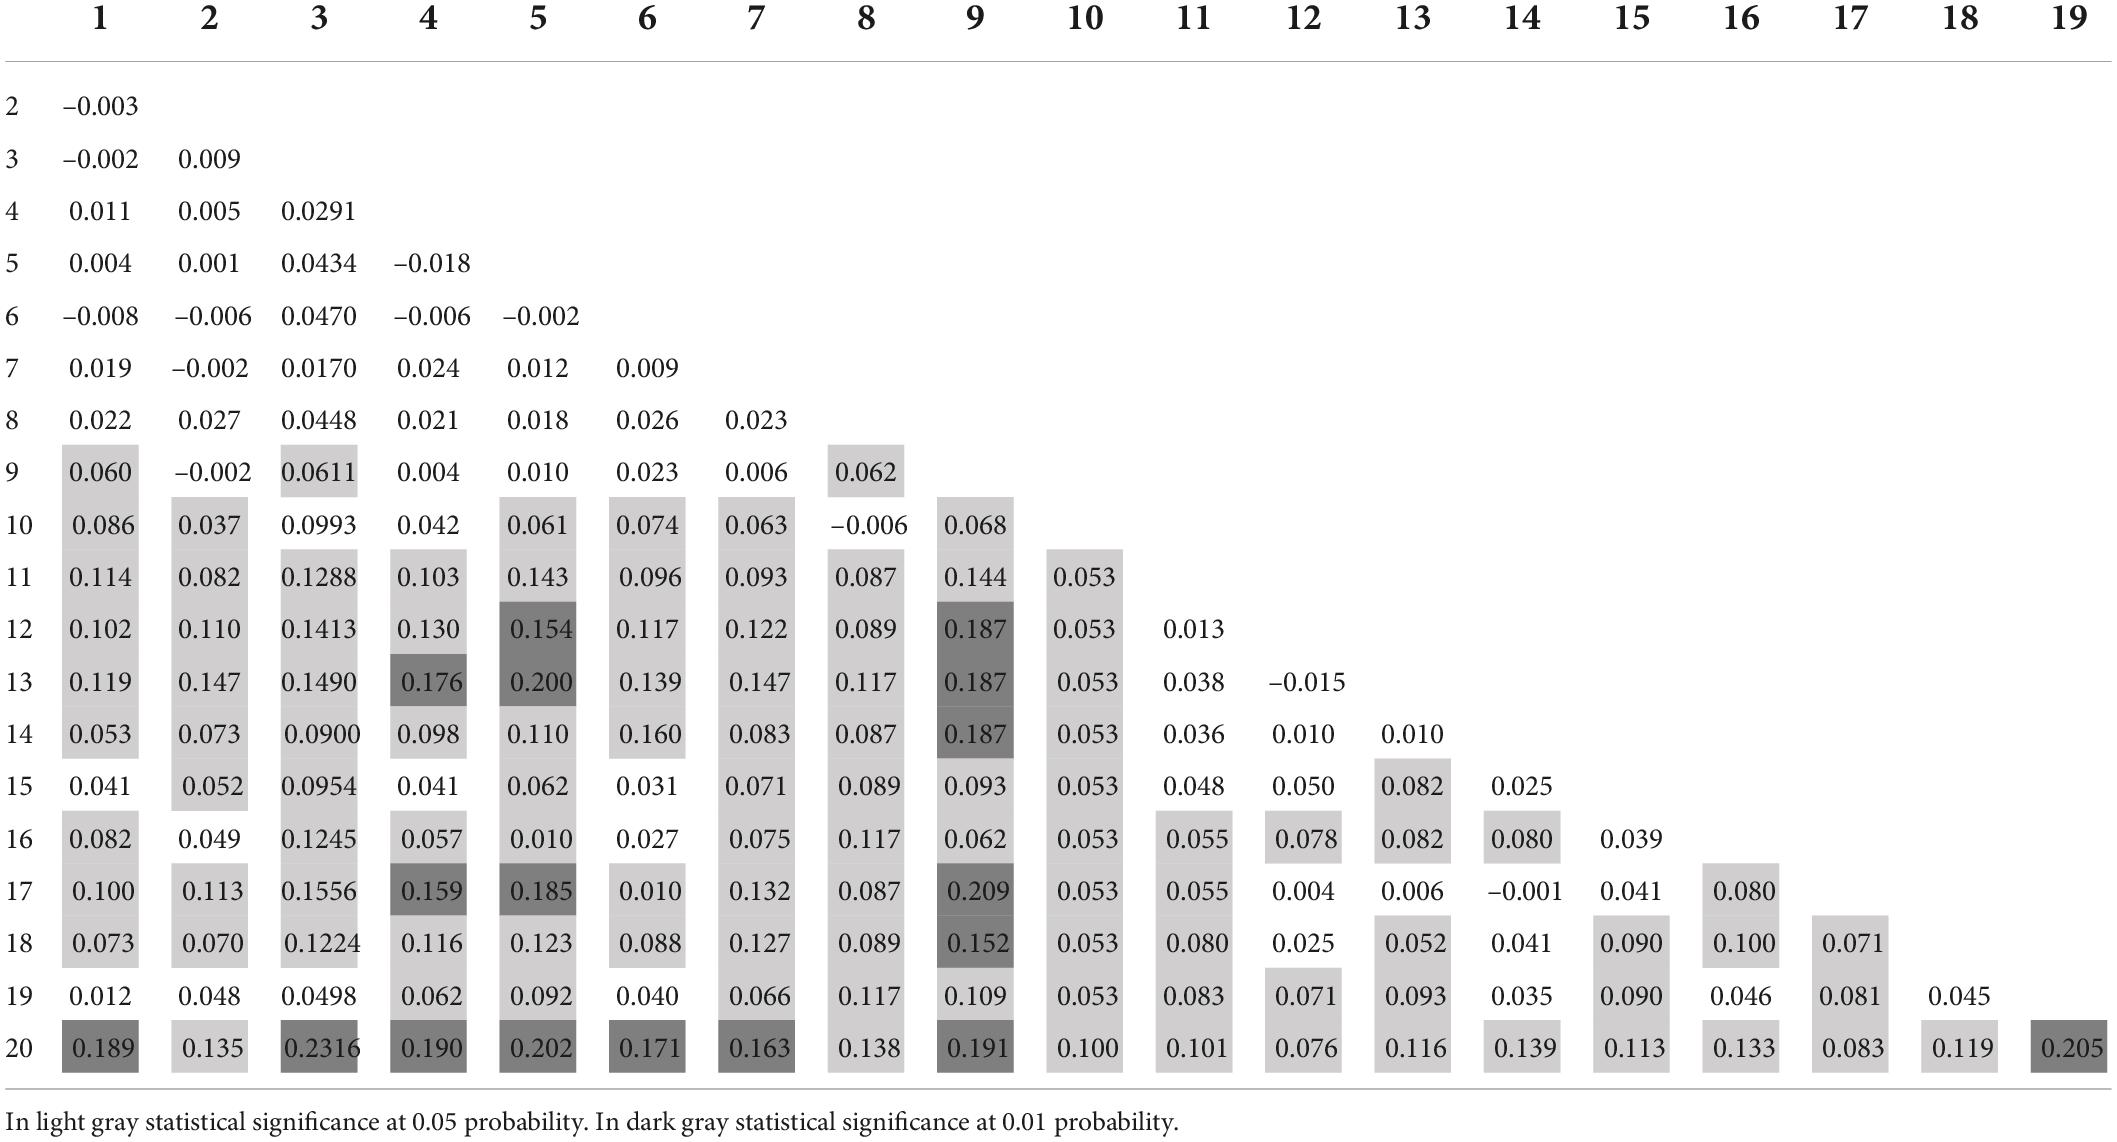
Table 3. Pairwise analysis of FST in 20 plots of the managed area of Euterpe edulis.
By the cluster analysis one group was formed by plots 1–10, and another formed by plots 11–19. Plot 20 was not grouped (Figure 2). In the population structure analysis, K = 2 was the most probable configuration (Figure 3). For the plots no obvious clusters were identifiable. For K = 5 among plots 1, 5, and 6, and the individuals in plot 20 were considered homogeneous. The UPGMA based on the dissimilarity among the 199 individuals showed a broad genetic variation between the individuals in the study area (Figure 4). The same results were shown by the PCoA analysis, in which the percent of the variation do the two PC explain in the PCoA for the axis 1 was 35.95% and for the axis 2 16.82% (Supplementary Figure 2).
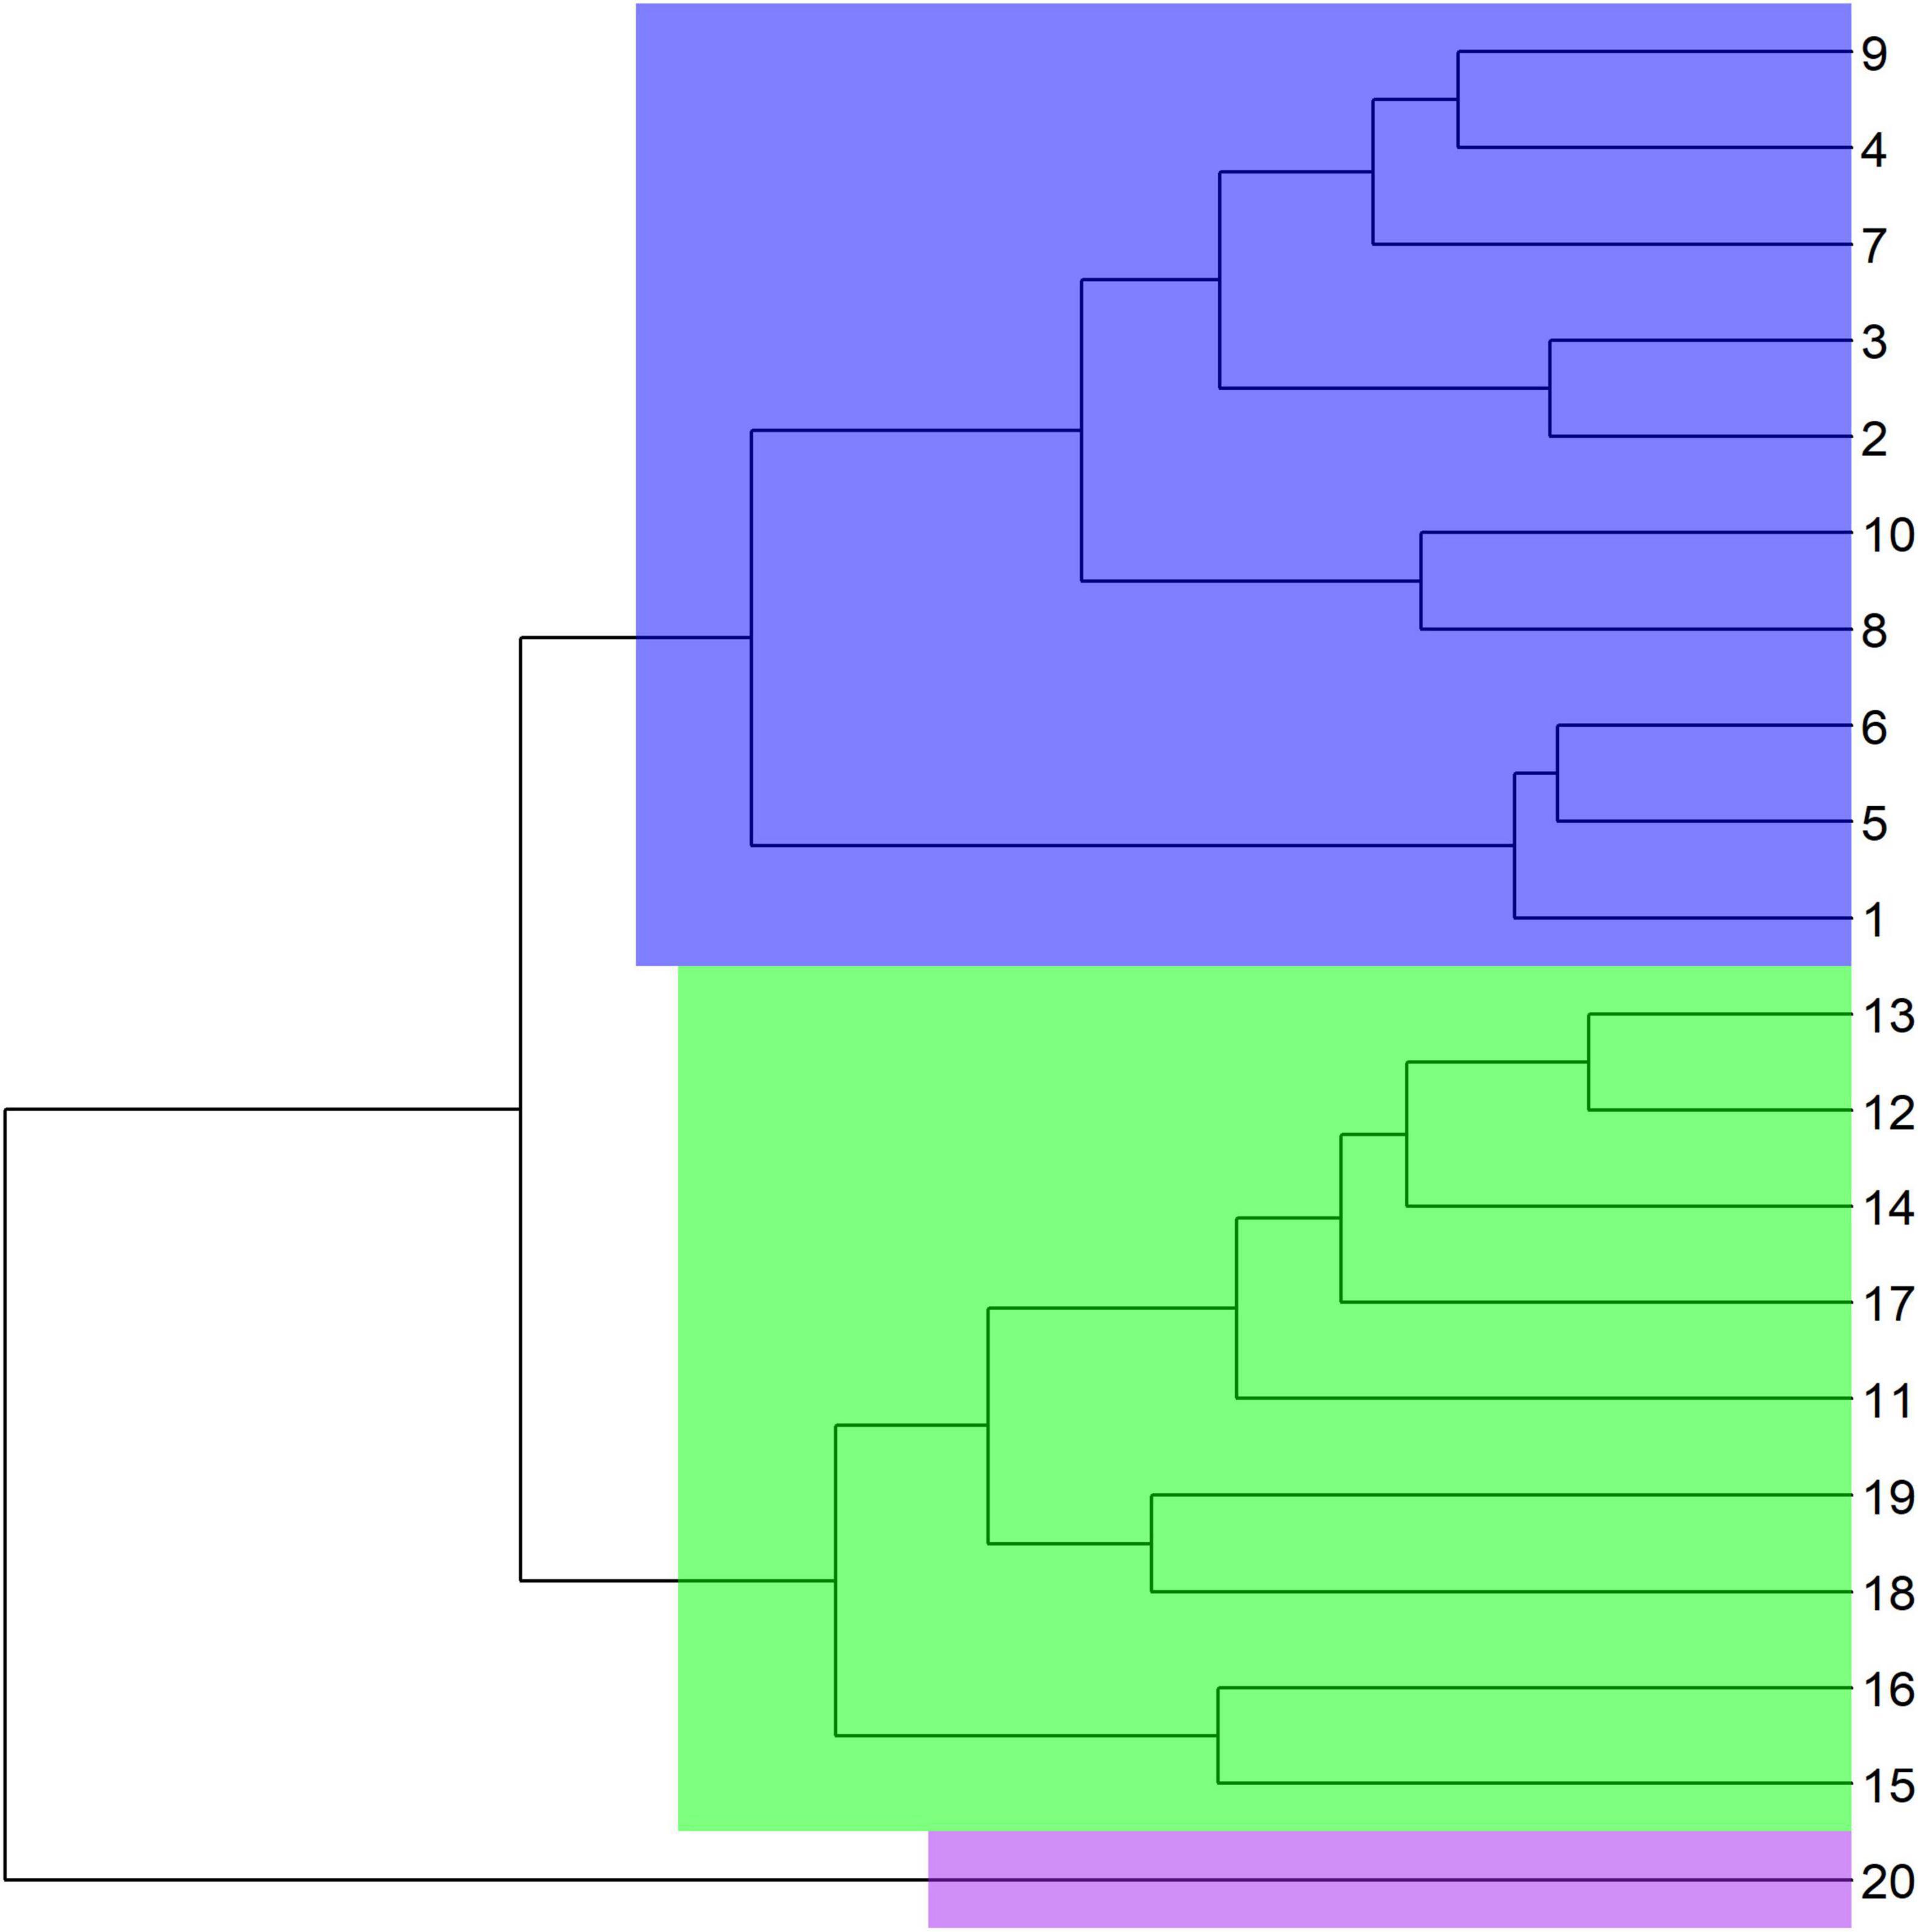
Figure 2. UPGMA grouping of Euterpe edulis plots (numbering 1–20) in the managed area based on Nei’s genetic distance. A significant mean genetic dissimilarity of 71.67% (p ≥ 0.05) occurred; group 1 = plot 20, group 2 = plots 1–10, and group 3 = plots 11–19.
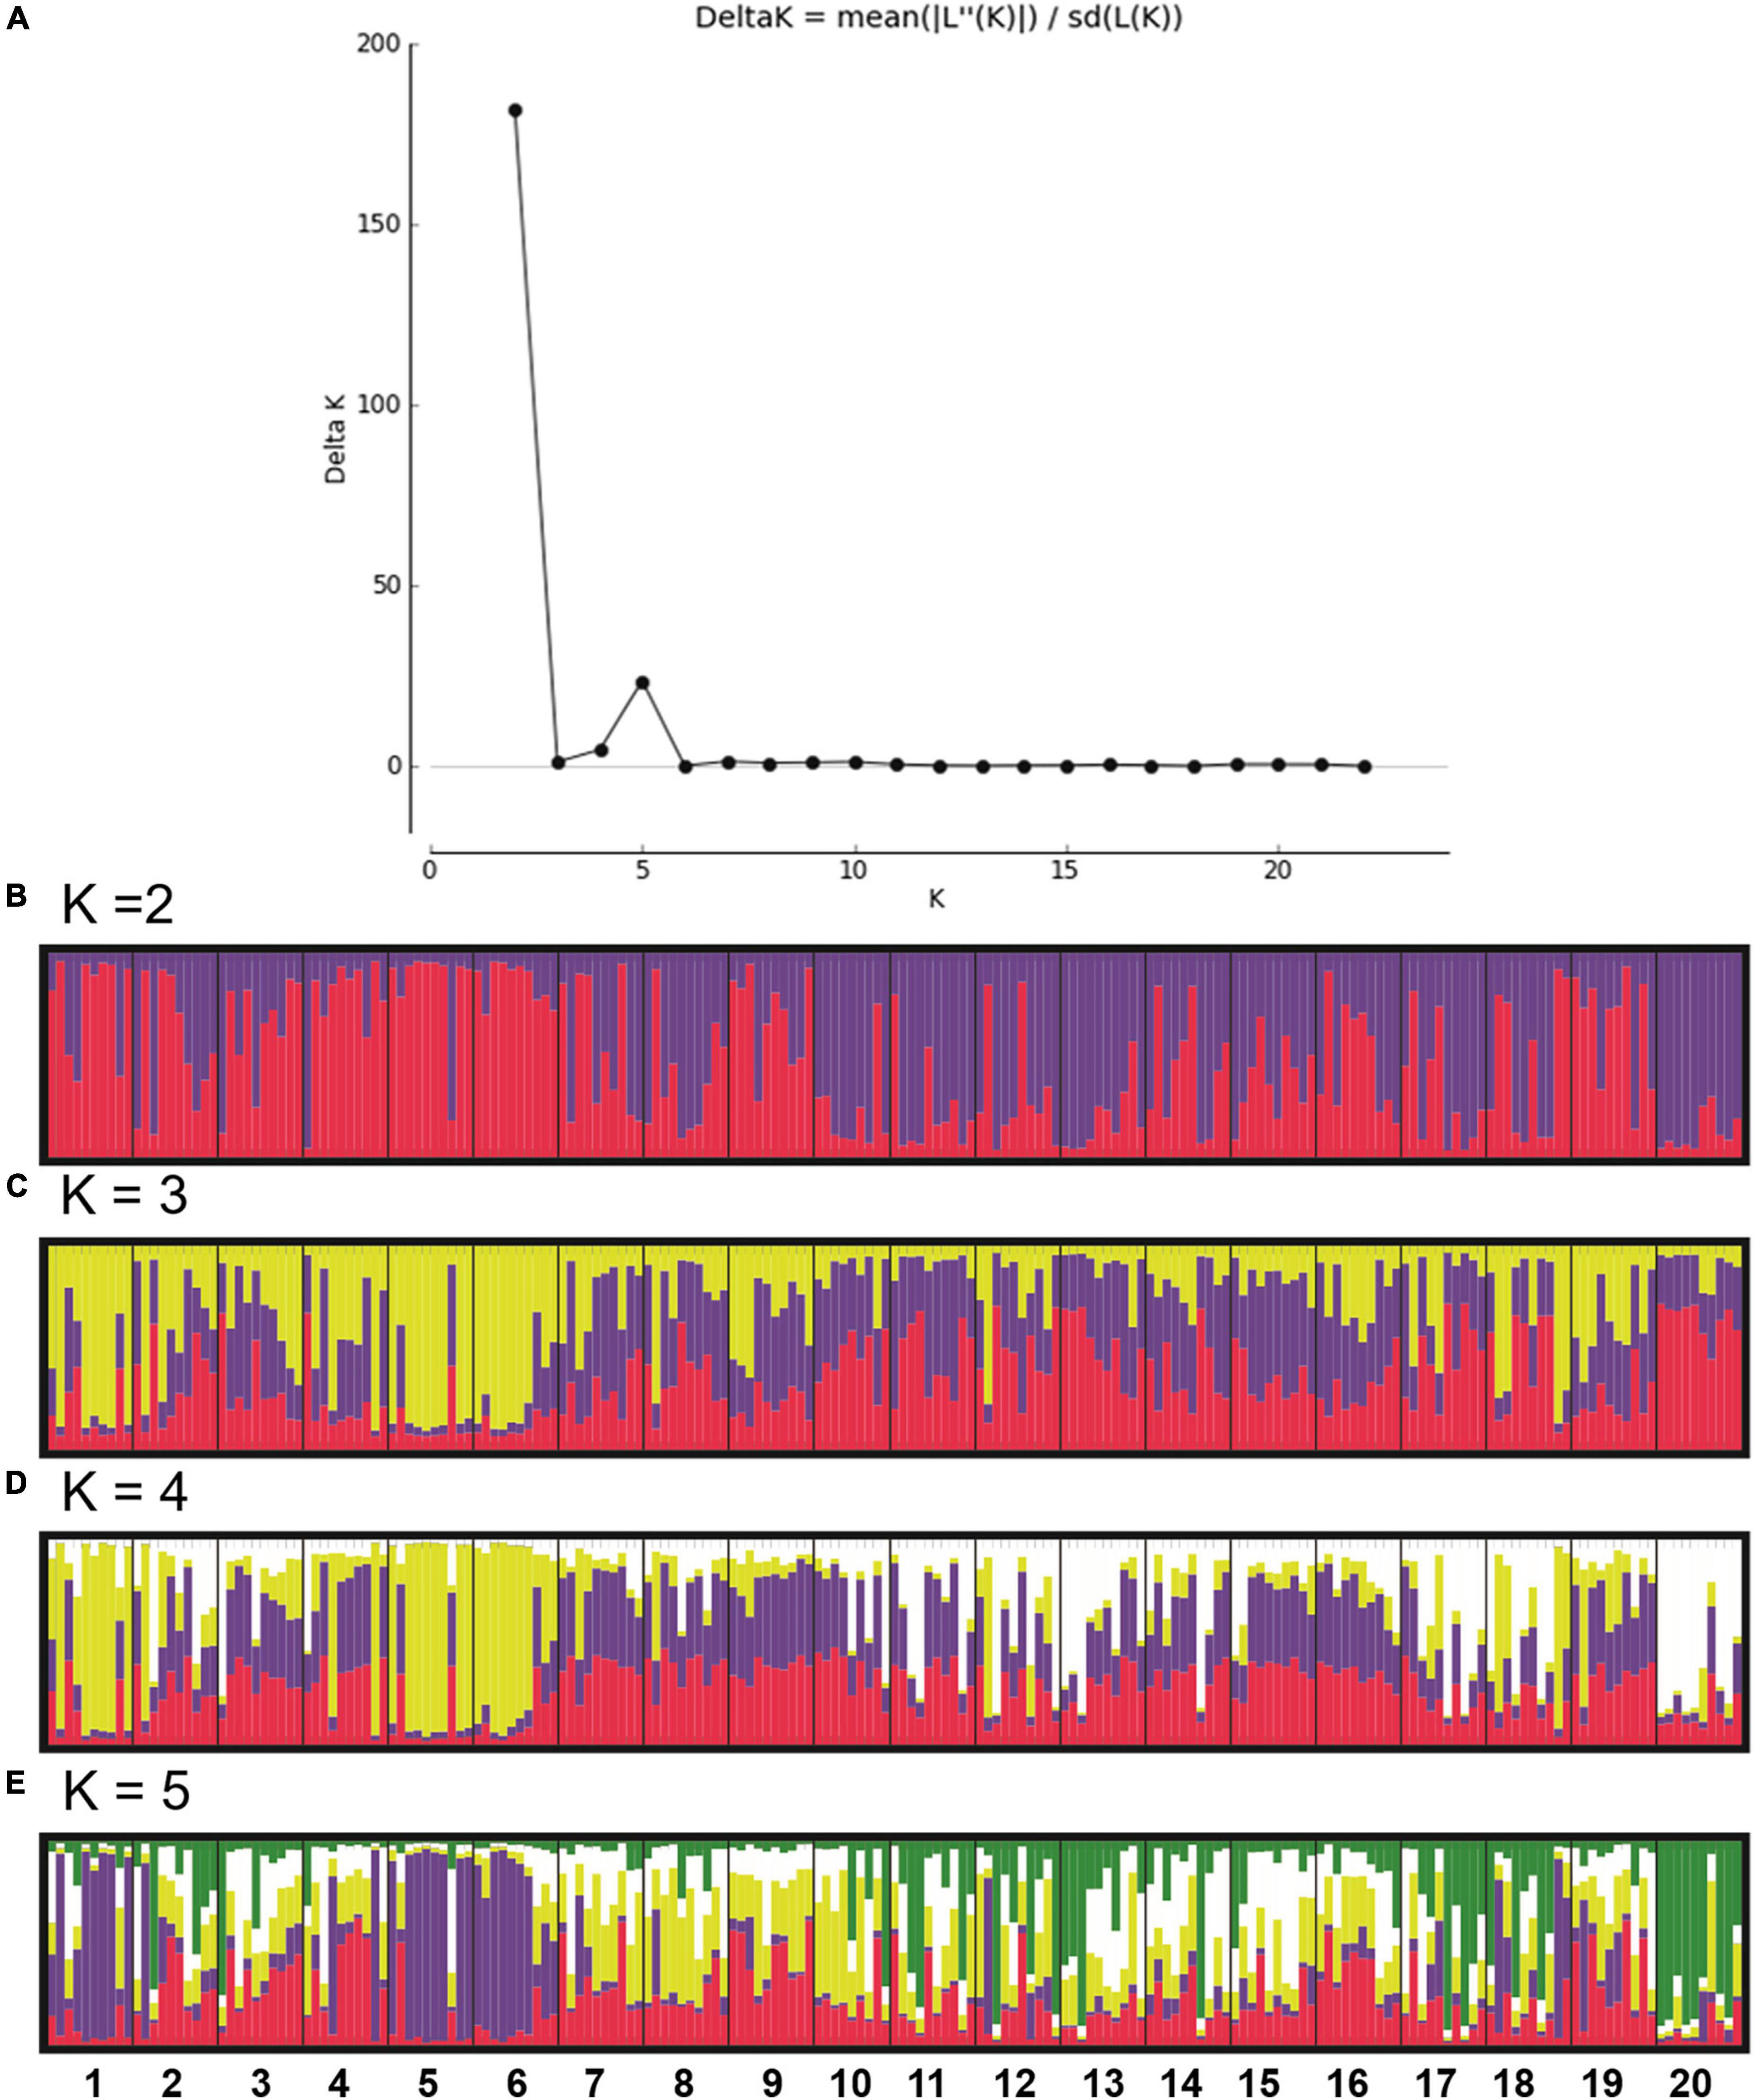
Figure 3. Delta K (A; Structure Harvester Application). Plot of the clustering analysis in Structure for K = 2, 3, 4, and 5 (B–E, respectively). 20 plots in the Euterpe edulis managed area (numbered from 1 to 20 and delimited by the black vertical line). Each individual is represented by a vertical line, each color is associated with a different cluster, and the length of the colored bars refers to the probability of each individual being assigned to each cluster (Structure v. 2.2 Program).
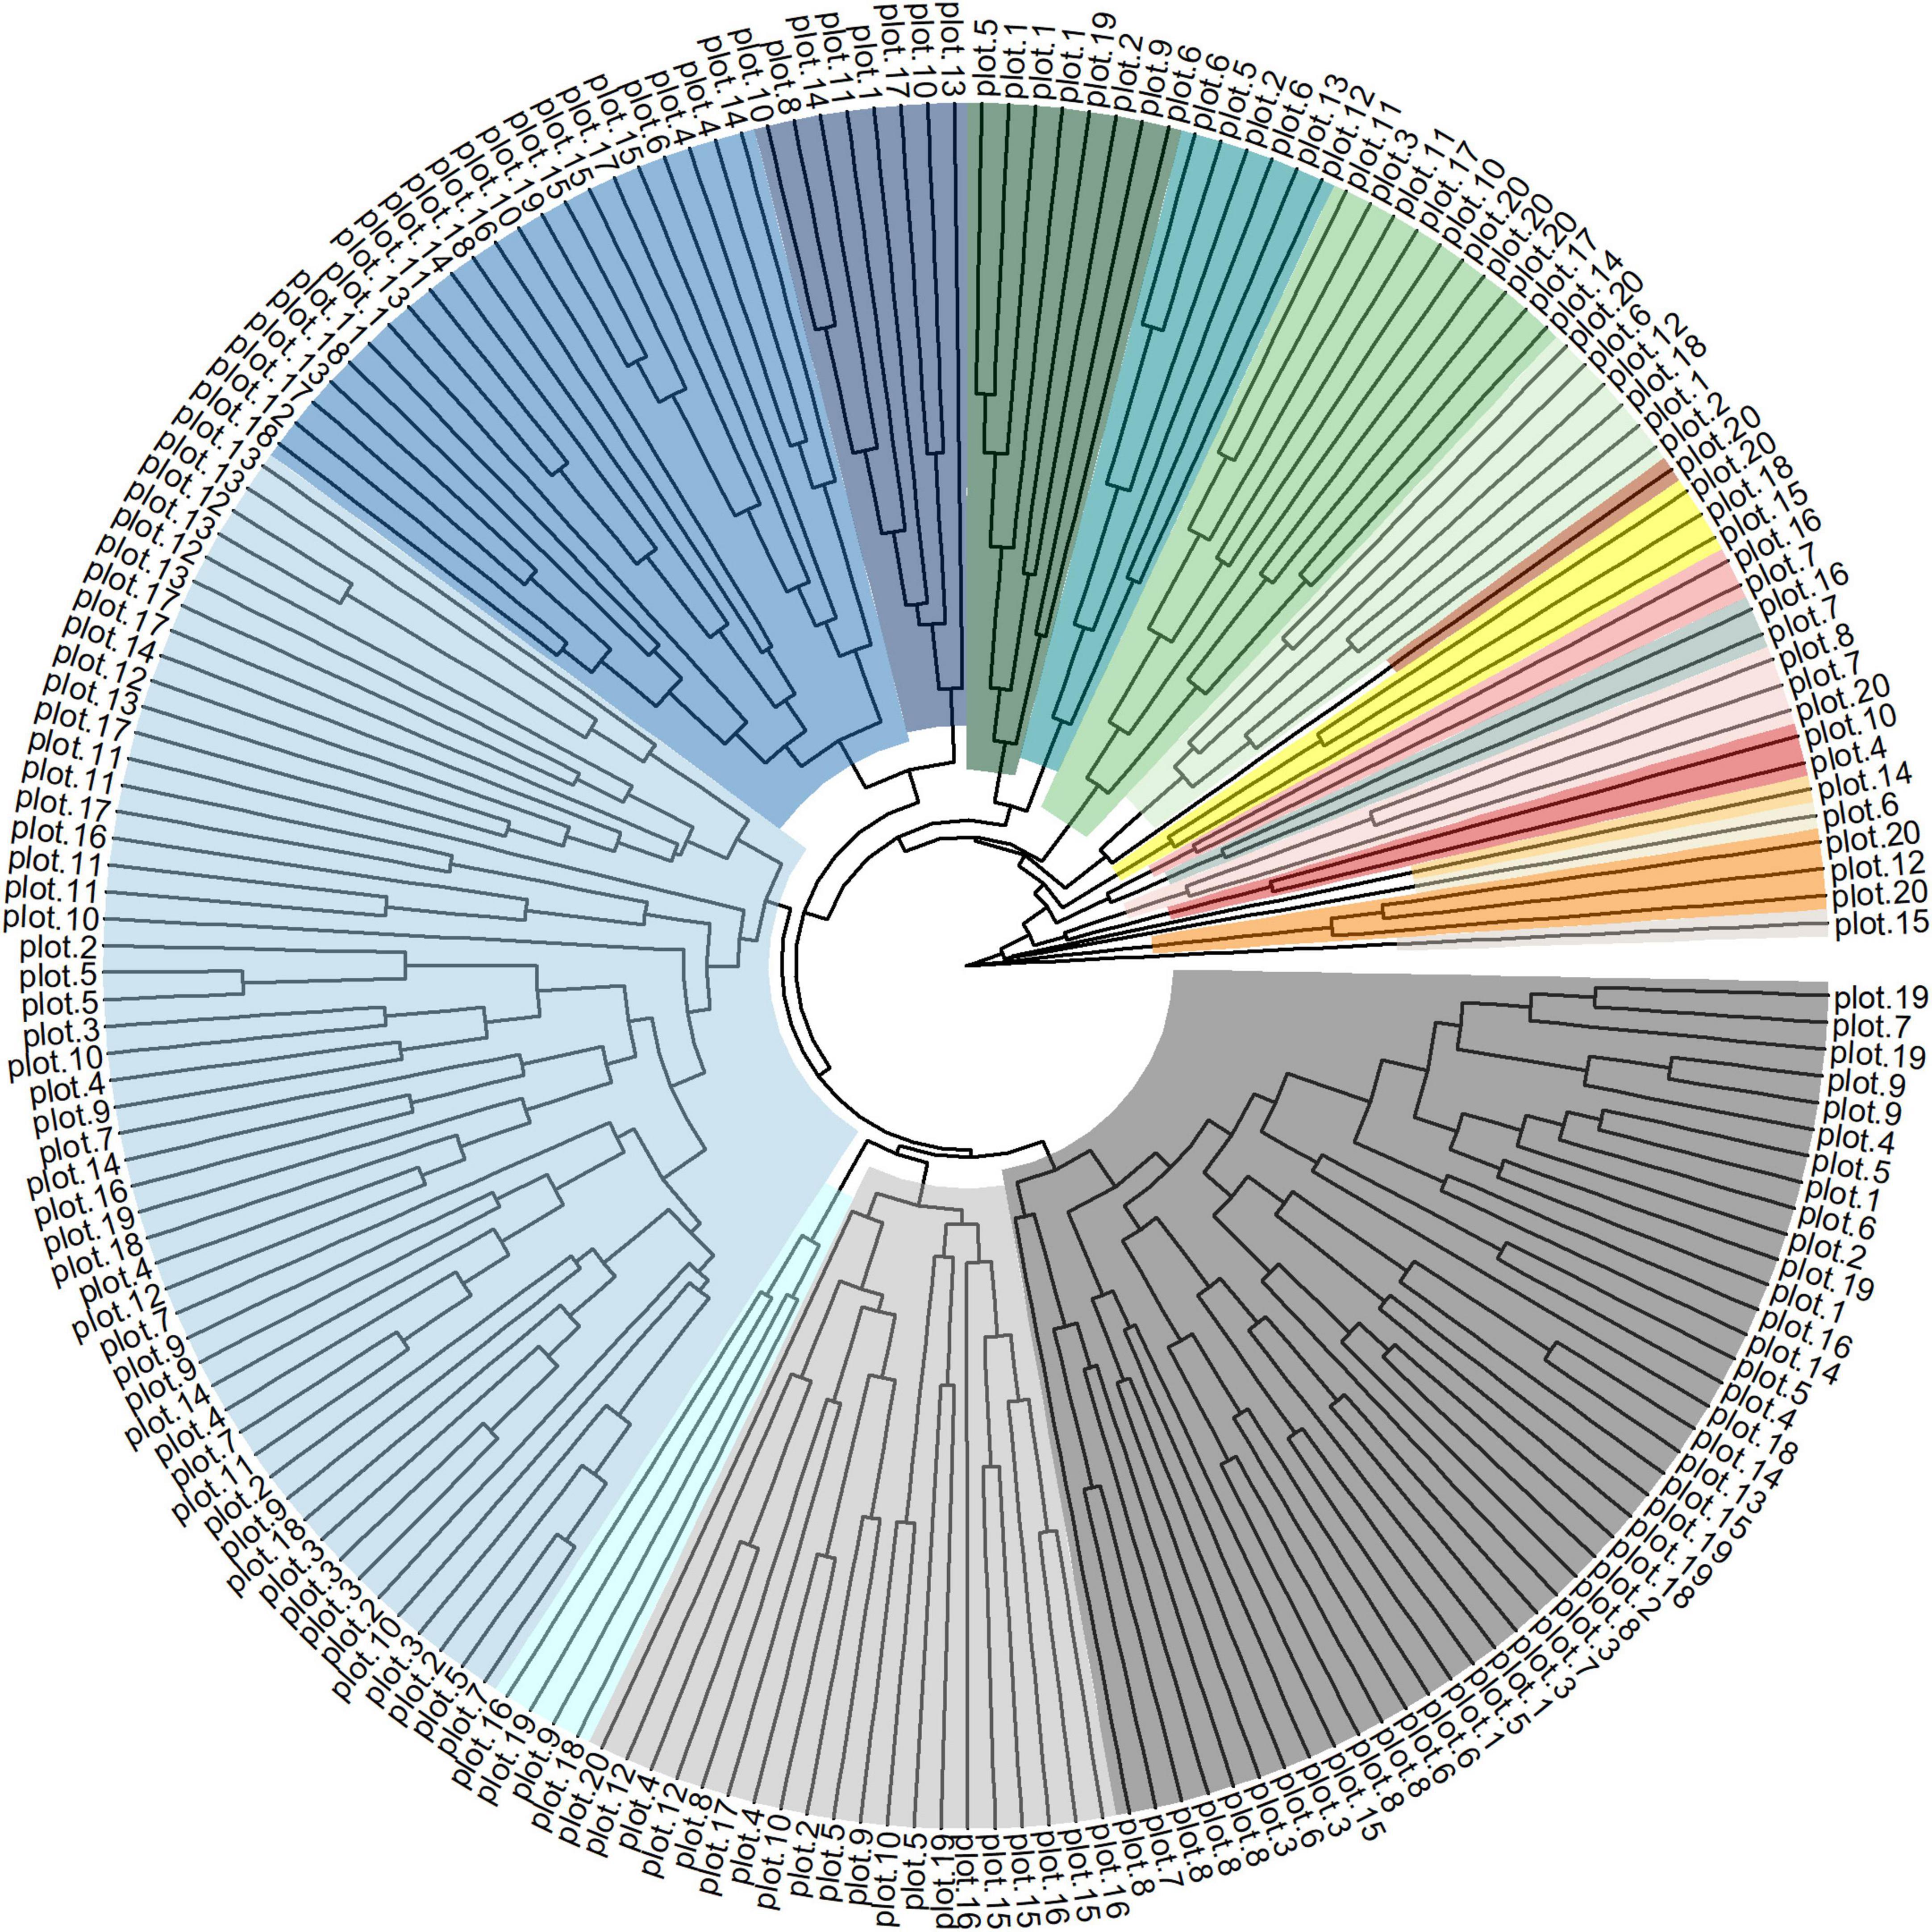
Figure 4. Clustering based on the dissimilarity and UPGMA method, among the 199 individuals in the Euterpe edulis managed area. The plot numbers were 1–20. Each individual sampled in the plot varied of 1–10.
Discussion
The genetic diversity observed in the population of E. edulis had greater genetic variation within than between plots. The high content of polymorphic information and the independence of the studied microsatellites indicate a good estimate of the genetic relationships in the population. The values of f indicated inbreeding, an outcome similar to that observed for natural populations of the species (Gaiotto et al., 2003; Conte et al., 2006).
A higher frequency of heterozygotes is a positive aspect for conservation (Conte et al., 2006). The He mean value (0.58) detected in the studied population was smaller than of natural E. edulis populations of adult individuals. He values ranging from 0.74 to 0.83 were reported for two populations of 111 and 33 individuals (Gaiotto et al., 2003); four populations of 50 individuals each (Conte et al., 2006); and for two populations of 34 and 46 individuals (Seoane et al., 2005). However, Vieira et al. (2010) reported He value of 0.47 for 29 individuals in a forest fragment and recommended introduction of individuals from other populations to increase the effective size of the population and help conserve the species. Additionaly, the Ho value observed in our study was 0.52 lower than the reported in the literature reports as 0.68 and 0.63 (Seoane et al., 2005), 0.70 (Conte et al., 2006), between 0.70 and 0.66 (Gaiotto et al., 2003), and 0.59 (Vieira et al., 2010).
An explanation for these results is the even though the microsatellites markers in this study are the same as Gaiotto et al. (2001; 2003), the number of microsatellites markers used was half. And Gaiotto et al. had two population separated by a distance of 27 km as opposed to current study which was conducted along one population, studied by subsampling plots.
The variation in f values among the plots of the area ranged from –0.04 to 0.32. Positive values of fixation index indicate inbreeding among individuals, a condition observed especially in plots 4, 5, 18, and 20 (f ≥ 0.26). However, the mean f value of the population (0.12) was the same as or close to that reported for natural populations of E. edulis (Gaiotto et al., 2003; Conte et al., 2006).
In a study on the effects of heart of palm exploitation on the genetic structure of natural populations of E. edulis that compared undisturbed with exploited populations, Conte et al. (2006) reported that the exploitation process did not alter the diversity levels or the genetic structure of the exploited populations. However, higher inbreeding levels were observed in the young plants of these populations, and this inbreeding could affect later generations. Seoane et al. (2005) observed increased inbreeding in seedlings and genetic differences in allelic frequencies, probably due to genetic drift. Other studies indicate that in natural populations of E. edulis, although the diversity among the individuals of the effective population (at the reproductive stage) is high, genetic drift in the progeny may exist due to anthropic actions affecting the populations of dispersers (Santos et al., 2015; Carvalho et al., 2017).
In assessing the population structure of the E. edulis in the secondary forests, rural homegardens, and sites inside a protected area, De Souza et al. (2021) observed that the highest variation in genetic diversity indexes was recorded in rural homegardens, with the presence of alleles that were not found in the protected area. Genetic diversity indexes varied less in the protected area, while the average values were higher in secondary forests.
In general, the above mentioned studies showed f values close to that observed for the population in the present study; in certain plots (as in plots 8 and 16) the studied population shows greater diversity than that of natural populations. The present findings suggest that no detriment to maintaining diversity exists for this population in its managed setting: this population presents individuals with wide genetic diversity and these individuals are in a large area with a high density of individuals. In the addition, the sustainable exploitation of these individuals (for fruit production) also could allow the action of dispersers and pollinators. Therefore, sufficient genetic variability was observed in the managed area to promote ex situ conservation and the selection of promising genotypes for breeding.
Regarding the analysis of genetic structure in the managed E. edulis population, most of the genetic diversity was observed within the plots (among the individuals of each plot), as shown by the low FST (0.088) and GST (0.083) values, which indicate moderate differentiation among the plots. These analyses reveal a sharing of alleles among individuals from various plots. However, plot 20 presented individuals divergent from the others. Other studies of E. edulis diversity also note that most of the genetic variability occurs within populations, confirming the tendency for allogamous species (Cardoso et al., 2000; Seoane et al., 2005; Santos et al., 2015).
The greatest genetic differentiation detected for the plot 20 (pairwise FST and clustering analysis) and lesser differentiation among plots 1–8 and among plots 11–15 may be explained by the implementation history of the area. The plots 1–19 mainly contain plants derived from natural regeneration (over more than 30 years). In contrast, plot 20, corresponds to a more recent area (12–15 years), with the planting of seedlings propagated by seeds collected from plants in the district of Santa Marta, in the municipality of Vargem Alta, Espírito Santo about (50 km far from the studied area). In addition, the results of the STRUCTURE, with delta K = 5, also shows that the plots 1, 5, and 6 as quite different from the others.
The UPGMA clustering showed the genetic dissimilarity between individuals, which may be due to the flow of genes and alleles that are shared among the E. edulis plants in the study area. Thus, the analyses performed in the present study confirmed that the managed area presents a genetic divergence between individuals and that the reported inbreeding pattern resembles that described in natural populations. Thus, the study area can be assumed to present not only a conservation site but also a potential population for studying genetic improvement to maintain the incentives for the sustainable exploitation of E. edulis.
These satisfactory results may derive from the cultivation system used in the study area: growth over a 20-hectare area and a high density of individuals providing a large population totalling approximately 20,000 plants. For the reforestation of areas smaller than 100 hectares in populations with signs of inbreeding, the collection of seeds from 30 source plants is recommended, using plants located in one or more fragments near the planting site (Sebbenn, 2002). However, studies of the breeding system and population structure of E. edulis show that the creation and management of in situ genetic reserves or the ex situ conservation and breeding of this species should include the collection of several hundred maternal pollination families from a few distant populations to maximize the genetic sampling of a larger number of pollen donors (Gaiotto et al., 2003). Still, Cerqueira et al. (2022) know that the conservation actions for E. edulis including selecting and replanting progenies from the forest fragments inserted in more forested landscapes, for could be a way for alternative genotypes to raise the levels of alleles and thus avoid the collapse of these populations in fragments inserted in deforested landscapes. Thus, a managed area for production of fruit and pulp, once established according to the cultivation system of the studied area, can effectively assist in the conservation of E. edulis and in the sustainable generation of income. Additionally, the diversification of crops with E. edulis seedlings obtained from genetically divergent source plants and selected for morphological characters of interest in relation to the fruit can establish productive and profitable managed areas that help expand the genetic diversity of the species. The present research results emphasize that the studied area shows great potential for conservation and for genetic material sufficiently divergent to be used for the improvement of the species.
Data availability statement
The original contributions presented in this study are included in the article/Supplementary material, further inquiries can be directed to the corresponding author.
Author contributions
LM designed research, data analysis, and wrote the manuscript. GC coordinated sampling. MC and MF helped with the performance of molecular assays and assisted with microsatellite genotyping. MF and AF assisted with the conception and design of the project, designed research, wrote the manuscript, and secured funding. All authors contributed to the article and approved the submitted version.
Funding
This study was supported by CNPq, FAPES.
Acknowledgments
We would like to thank Conselho Nacional de Pesquisa (CNPq, Brazil), Coordenação de Aperfeiçoamento de Pessoal de Nível Superior (CAPES, Brazil) – Finance Code 001, Fundação de Amparo à Pesquisa do Espírito Santo FAPES, Vitória – ES, Brazil) and VALE for financial support for providing financial support to this study. We are also grateful to Pedro Bortolotti Menegardo and Vicente de Paulo Menegardo Bortolotti, the owners of the managed area.
Conflict of interest
The authors declare that the research was conducted in the absence of any commercial or financial relationships that could be construed as a potential conflict of interest.
Publisher’s note
All claims expressed in this article are solely those of the authors and do not necessarily represent those of their affiliated organizations, or those of the publisher, the editors and the reviewers. Any product that may be evaluated in this article, or claim that may be made by its manufacturer, is not guaranteed or endorsed by the publisher.
Supplementary material
The Supplementary Material for this article can be found online at: https://www.frontiersin.org/articles/10.3389/ffgc.2022.859081/full#supplementary-material
Supplementary Figure 1 | Neighbor join clustering for twenty sampling plots of Euterpe edulis in the commercial studied population.
Supplementary Figure 2 | Principal coordinate analysis based on the genetic distances among the 199 individuals in the Euterpe edulis managed area. The numbers correspond to each individual sampled. Groups of individuals represented with the same colors correspond to each of the 20 plots: plot 1 = individuals 1–10, 2 = 11–20, 3 = 21–30, 4 = 31–40, 5 = 41–50, 6 = 51–60, 7 = 61–70, 8 = 71–80, 9 = 81–90, 10 = 91–99, 11 = 100–109, 12 = 110–119, 13 = 120–129, 14 = 130–139, 15 = 140–149, 16 = 150–159, 17 = 160–169, 18 = 170–179, 19 = 180–189, and 20 = 190–199. Axis eigenvalue 1 = 7.35%, and axis 2 = 5.87 (DarWin v. 6 Program).
Footnotes
References
Barbieri, R. L., and Maia, L. C. (2012). Plant breeding and in situ utilization of palm trees. Cien. Rural 42, 261–269. doi: 10.1590/S0103-84782012000200013
Borges, G., Vieira, F., Copetti, C., Gonzaga, L. V., Zambiazi, R., Filho, J. M., et al. (2011). Chemical characterization, bioactive compounds, and antioxidant capacity of jussara (Euterpe edulis) fruit from the Atlantic Forest in southern Brazil. Food Res. Int. 44, 2128–2133. doi: 10.1016/j.foodres.2010.12.006
Botstein, D., White, R. L., Skolnick, M., and Davis, R. W. (1980). Construction of a genetic linkage map in man using restriction fragment length polymorphisms. Am. J. Hum. Gene 32, 314–331.
Cardoso, S. R., Eloy, N. B., Provan, J., Cardoso, M. A., and Ferreira, P. C. (2000). Genetic differentiation of Euterpe edulis Mart. populations estimated by Aflp analysis. Mol. Ecol. 9, 1753–1760. doi: 10.1046/j.1365-294x.2000.01056.x
Carvalho, C. S., Ballesteros-Mejia, L., Ribeiro, M. C., Côrtes, M. C., Santos, A. S., and Collevatti, R. G. (2017). Climatic stability and contemporary human impacts affect the genetic diversity and conservation status of a tropical palm in the Atlantic Forest of Brazil. Conserv. Genet. 18, 467–478. doi: 10.1007/s10592-016-0921-7
Carvalho, M. S., Noia, L. R., Ferreira, M. F. S., and Ferreira, A. (2019). Dna de alta qualidade isolado a partir do córtex de Euterpe edulis Mart. (Arecaceae). Ciência Florestal 29, 396–402. doi: 10.5902/1980509824130
Cerqueira, A. F., Santos, A. S., Alencar, C. O., Oliveira, G. S., Santos, C. S., and Schilling, A. C. (2022). Landscape conservation and maternal environment affect genetic diversity and the physiological responses of Euterpe edulis (Arecaceae) progenies to light availability. Environ. Exp. Bot. 194. doi: 10.1016/j.envexpbot.2021.104722
Conte, R., dos Reis, M. S., and Vencovsky, R. (2006). Effects of management on the genetic structure of Euterpe edulis Mart. populations based on microsatellites. Sci. For. 72, 81–88.
Conte, R., dos Reis, M. S., Mantovani, A., and Vencovsky, R. (2008). Genetic structure and mating system of Euterpe edulis Mart. populations: A comparative analysis using microsatellite and allozyme markers. J. Hered 99, 476–482. doi: 10.1093/jhered/esn055
Danelli, M. F., Fisch, M. T. V., and Vieira, A. S. (2016). Análise da estrutura e biomassa florestal de áreas de colheita de frutos de juçara (Euterpe edulis Mart.) no Litoral Norte e Serra do Mar – Sp. Ci Fl 26, 773–786. doi: 10.5902/1980509824206
De Souza, M. L., Montagna, T., and dos Reis, M. S. (2021). Population biology of palm heart (Euterpe edulis Martius–Arecaceae) in managed landscape units in Southern Brazil. Econ. Bot. 75, 144–157. doi: 10.1007/s12231-021-09519-2
Earl, D. A., and Vonholdt, B. M. (2012). Structure Harvester: A website and program for visualizing Structure output and implementing the Evanno method. Conserv. Genet. Resour. 4, 359–361. doi: 10.1007/s12686-011-9548-7
Evanno, G., Regnaut, S., and Goudet, J. (2005). Detecting the number of clusters of individuals using the software Structure: A simulation study. Mol. Ecol. 14, 2611–2620. doi: 10.1111/j.1365-294X.2005.02553.x
Excoffier, L., Laval, G., and Schneider, S. (2005). Arlequin: An integrated soft – ware package for population genetics data analysis, version 3.0. Evol. Bioinform. Online 1, 47–50. doi: 10.1177/117693430500100003
Gaiotto, F. A., Brondani, R. P. V., and Grattapaglia, D. (2001). Microsatellite markers for heart of palm – Euterpe edulis and E. oleracea Mart. (Arecaceae). Mol. Ecol. Resour. 1, 86–88. doi: 10.1046/j.1471-8278.2001.00036.x
Gaiotto, F. A., Grattapaglia, D., and Vencovsky, R. (2003). Genetic structure, mating system, and long-distance gene flow in heart of palm (Euterpe edulis Mart.). J. Hered 94, 399–406. doi: 10.1093/jhered/esg087
Goudet, J. (2002). Fstat version 2.9.3.2, a program to estimate and test gene diversities and fixation indices. Institute of Ecology, Lausanne, Switzerland. Available online at: https://www2.unil.ch/popgen/softwares/fstat.htm (accessed May 15, 2017).
Lewis, P. O., and Zaykin, D. (2002). Gda, version 1.1. Genetic Data Analysis (Gda): Computer program for the analysis of allelic data. Available online at: Bio-Soft Net. http://en.bio-soft.net/dna/gda.html (accessed February 16, 2015).
Montagna, T., Silva, J. Z., Bernardi, A. P., Steiner, F., Buzzi, V. H., Lauterjung, M. B., et al. (2018). Landscape genetics and genetic conservation of two keystone species from Ombrophilous Dense Forest: Euterpe edulis and Ocotea catharinensis. For. Sci. 64, 618–630. doi: 10.1093/forsci/fxy026
Nei, M. (1978). Estimation of average heterozygosity and genetic distance from a small number of individuals. Genetics 89, 583–590. doi: 10.1093/genetics/89.3.583
Novello, M., Viana, J. P. G., Alves-Pereira, A., Silvestre, E. A., Nunes, H. F., Pinheiro, J. B., et al. (2018). Genetic conservation of a threatened Neotropical palm through community-management of fruits in agroforests and second-growth forests. For. Ecology Manag. 407, 200–209. doi: 10.1016/j.foreco.2017.06.059
Park, Y. J., Lee, J. K., and Kim, N. S. (2009). Simple sequence repeat polymorphisms (Ssrps) for evaluation of molecular diversity and germplasm classification of minor crops. Molecules 14, 4546–4569. doi: 10.3390/molecules14114546
Pereira, A. G., Ferreira, M. F. S., Silveira, T. C., Guilhen, J. H. S., Canal, G. B., Alves, L. B., et al. (2022). Patterns of genetic diversity and structure of a threatened palm species (Euterpe edulis Arecaceae) from the Brazilian Atlantic Forest. Heredity 129, 161–168. doi: 10.1038/s41437-022-00549-7
Perrier, X., and Jacquemoud-Collet, J. P. (2006). Darwin software. Available online at: https://darwin.cirad.fr/ (accessed on May 25, 2017).
Pritchard, J. K., Stephens, M., and Donnelly, P. (2000). Inference of population structure using multilocus genotype data, version 2.3.4. Genetics 155, 945–959. doi: 10.1093/genetics/155.2.945
Santos, A. S., Cazetta, E., Filho, J. C. M., Baumgarten, J., Faria, D., and Gaiotto, F. M. (2015). Lessons from a palm: Genetic diversity and structure in anthropogenic landscapes from Atlantic Forest, Brazil. Conserv. Genet. 16, 1295–1302. doi: 10.1007/s10592-015-0740-2
Schulz, M., Borges, G. S. C., Gonzaga, L. V., Costa, A. C. O., and Fett, R. (2016). Juçara fruit (Euterpe edulis Mart.): Sustainable exploitation of a source of bioactive compounds. Food Res. Int. 89, 14–26. doi: 10.1016/j.foodres.2016.07.027
Sebbenn, A. M. (2002). Tamanho amostral para conservação ex situ de espécies arbóreas com sistema misto de reprodução. Rev. lnst. Flor. 14, 115–132.
Seoane, C. E. S., Kageyama, P. Y., Ribeiro, A., Matias, R., Dos Reis, M. S., Bawa, K., et al. (2005). Efeitos da fragmentação florestal sobre a imigração de sementes e a estrutura genética temporal de populações de Euterpe edulis Mart. Ver. Lnst. Flor. 17, 25–43.
Silva, P. P. M. D., Carmo, L. F. D., Silva, G. M., Silveira-Diniz, M. F., Casemiro, R. C., and Spoto, M. H. F. (2013). Physical, chemical, and lipid composition of juçara (Euterpe edulis mart.) pulp. Braz. J. Food Nutr. 24, 7–13.
Vieira, F. A., Carvalho, D., Higuchi, P., Mendonça, E. L., Machado, A., and Santos, R. M. (2010). Spatial pattern and fine-scale genetic structure indicating recent colonization of the palm Euterpe edulis in a Brazilian Atlantic Forest fragment. Biochem. Genet. 48, 96–103. doi: 10.1007/s10528-009-9298-3
Weir, B. S. (1996). Genetic data analysis Ii: Methods for discrete population genetic data. Sunderland: Sinauer Assoc. Inc.
Weir, B. S., and Cockerham, C. C. (1984). Estimating F-statistics for the analysis of population structure. Evolution 38, 1358–1370. doi: 10.1111/j.1558-5646.1984.tb05657.x
Keywords: diversity, plant breeding, SSR, Euterpe edulis Mart., threatened species
Citation: Mengarda LHG, Canal GB, Carvalho MS, Ferreira A and Ferreira MFdS (2022) Genetic diversity of juçara palm: An alternative for selection and conservation in cash crop for fruit production. Front. For. Glob. Change 5:859081. doi: 10.3389/ffgc.2022.859081
Received: 20 January 2022; Accepted: 05 September 2022;
Published: 06 October 2022.
Edited by:
Alessandro Alves-Pereira, State University of Campinas, BrazilReviewed by:
Mara Fernandes Moura, Instituto Agronômico de Campinas (IAC), BrazilIgor Hamoy, Federal Rural University of the Amazon, Brazil
Copyright © 2022 Mengarda, Canal, Carvalho, Ferreira and Ferreira. This is an open-access article distributed under the terms of the Creative Commons Attribution License (CC BY). The use, distribution or reproduction in other forums is permitted, provided the original author(s) and the copyright owner(s) are credited and that the original publication in this journal is cited, in accordance with accepted academic practice. No use, distribution or reproduction is permitted which does not comply with these terms.
*Correspondence: Marcia Flores da Silva Ferreira, bWFyY2lhLmZlcnJlaXJhQHVmZXMuYnI=