 Kasper Coppieters1,2,3*
 Hans Verbeeck1
 Simon Dequeker1,2,3
 Jennifer S. Powers3,4
 German Vargas G.4,5
 Chris M. Smith-Martin6
 Kathy Steppe2
 Félicien Meunier1,7
- 1CAVElab—Computational and Applied Vegetation Ecology, Department of Environment, Faculty of Bioscience Engineering, Ghent University, Ghent, Belgium
- 2Laboratory of Plant Ecology, Department of Plants and Crops, Faculty of Bioscience Engineering, Ghent University, Ghent, Belgium
- 3Department of Ecology, Evolution, and Behavior, University of Minnesota, St. Paul, MN, United States
- 4Department of Plant and Microbial Biology, University of Minnesota, St. Paul, MN, United States
- 5School of Biological Sciences, The University of Utah, Salt Lake City, UT, United States
- 6Department of Ecology, Evolution, and Evolutionary Biology, Columbia University, New York, NY, United States
- 7Department of Earth and Environment, Boston University, Boston, MA, United States
Lianas are a key growth form in tropical forests. They are believed to be strong competitors for water, thanks to their presumed efficient vascular systems. However, despite being a large polyphyletic group, they are currently often considered as a functionally homogeneous entity. In this study, we challenged this assumption by estimating the variability in hydraulic traits of two common, co-occurring liana species in a water-limited environment, namely, a seasonally dry tropical forest in Costa Rica. We measured vulnerability to embolism at the leaf and branch levels using two different methods (optical and acoustic vulnerability) and found that both species had very different hydraulic properties. Compared to reported P50 values in literature, we found two extreme P50 values: a low value for Bignonia diversifolia (−4.30 ± 0.54 MPa at the leaf level; −7.42 ± 0.54 MPa at the branch level) and a high value for Cissus microcarpa (−1.07 ± 0.14 at the leaf level; −1.20 ± 0.05 MPa at the branch level). Furthermore, B. diversifolia had a higher apparent modulus of elasticity in the radial direction (556.6 ± 401.0 MPa) and a variable midday water potential. On the other hand, C. microcarpa had a low apparent modulus of elasticity in the radial direction (37.8 ± 26.3 MPa) and a high branch water content, which enabled the species to keep its water potential stable during the dehydration experiments and during a drought period in the field. This mechanism may enable this species to coexist with species that are more resistant to drought-induced embolisms such as B. diversifolia. Although only two species were studied, considerable overlap was found between the range of hydraulic properties of trees growing in the same location and trees and lianas growing in two forests in Panama. These findings demonstrate that lianas cannot be considered as a homogeneous group and call for further research into the intra-growth form diversity of liana properties.
Introduction
Tropical forests are one of the most important ecosystems on Earth. They are responsible for almost one third of the carbon uptake by terrestrial plants (Beer et al., 2010), they store more than half of the terrestrial biomass (Pan et al., 2011) and support approximately 50% of the described species (Dirzo and Raven, 2003). Dry forests make up a significant part of tropical forests as they encompass 42% of the tropical forest region (Miles et al., 2006). By definition, they are characterized by at least 3 months with less than 100 mm precipitation and 50% drought-deciduous species (Sánchez-Azofeifa et al., 2005).
A key growth form in tropical forests is lianas (woody vines). Here, lianas represent on average 24% of the woody stems (Putz and Mooney, 1991) and substantially contribute to forest leaf area (Schnitzer, 2015). Unlike most other growth forms, liana density increases with increasing seasonality and with decreasing mean annual precipitation, which makes them more abundant in tropical dry forests (Schnitzer, 2005). Through intense competition for resources with self-standing plants, lianas reduce tree growth, increase tree mortality (Ingwell et al., 2010), and reduce forest-level carbon accumulation and storage (van der Heijden et al., 2015). In addition, abundance and basal area of large lianas were shown to be increasing in the Neotropics (Phillips et al., 2002). While the mechanistic understanding of this proliferation remains unclear, it could be related to the water competition between growth forms (Schnitzer, 2005, 2018; Smith-Martin et al., 2019).
Lianas were indeed found to have a strong competitive advantage over trees during the dry season, when light is abundant and water is limiting: during that period, they were shown to have larger growth rates and water use efficiency than their host trees (Schnitzer, 2015; Schnitzer and van der Heijden, 2019; Smith-Martin et al., 2019) as well as higher predawn water potentials and higher transpiration rates (Chen et al., 2015; Ichihashi et al., 2017). Under dry conditions, lianas also explore the forest canopy more effectively than trees, showing stronger apical dominance, higher stem slenderness, and fewer leaf layers (Medina-Vega et al., 2021). Among the trait growth-form differences, one of the discrepancies between lianas and trees is their respective hydraulic architecture, which could explain such contrasting behavior between lianas and trees during the dry season. Lianas are typically associated with longer and wider vessels than co-occurring trees (Ewers et al., 1990), resulting in a higher maximum sapwood-specific hydraulic conductivity (Zhu and Cao, 2009; De Guzman et al., 2017), but also a higher vulnerability to drought (Chen et al., 2017; De Guzman et al., 2017). In contrast, van der Sande et al. (2019) found that hydraulic efficiency was decoupled from hydraulic safety in lianas, indicating that they potentially have high water conductivity while limiting their vulnerability to drought.
Despite their abundance and their overall impact on tropical ecosystems, studies on lianas are scarce. Lianas are often overlooked in inventory and modeling studies, and when they are taken into account, they are often considered as a functionally homogeneous entity (di Porcia e Brugnera et al., 2019). However, lianas form a large polyphyletic group (Gentry, 1992; Schnitzer and Bongers, 2002), and some pioneer studies indicate that they can exhibit heterogeneous traits, even within a single site (Meunier et al., 2020). One of the reasons for the scarcity of hydraulic trait data is the difficulty related to measuring these variables in the field. Several methods commonly used to quantify the vulnerability to embolism (often expressed as P50), including the bench dehydration method, which is considered as the gold standard, are time-consuming or require a large input of plant material (Venturas et al., 2017). However, understanding water competition in tropical forests is key, as hydraulic failure during droughts may be one of the most critical processes in water-limited environments (Choat et al., 2018; Brodribb et al., 2020; Powers et al., 2020), especially in a climate change context where future droughts may be longer and more intense (Trenberth et al., 2014). In this respect, the optical (Brodribb et al., 2016b) and acoustic (Vergeynst et al., 2015) methods are real advances, as they can be easily applied in the field.
To contribute to this knowledge gap, we estimated the variability in liana hydraulic properties in a water-limited, seasonally dry tropical forest located in Costa Rica. More specifically, we determined the drought susceptibility of two contrasting liana species by measuring their vulnerability curves using two different methods, covering the leaf and branch organs. Vulnerability curves are at the heart of much of plant hydraulic studies and characterize plant losses in conductivity as xylem pressure decreases (Venturas et al., 2017, 2019). Next, we measured predawn and midday leaf water potentials. The regulation of the water potential on short time scales is determined by the water-use strategy of the plant. Two main water-use strategies exist: isohydric species keep their water potential almost constant throughout the day through a strong stomatal regulation, while anisohydric species maintain their stomata open, with the consequence of low and variable water potential throughout the day (Tardieu and Simonneau, 1998; McDowell et al., 2008). We further measured key hydraulic variables including maximum vessel length, wood specific gravity, fresh wood water content, and apparent modulus of elasticity. These hydraulic traits are important for the characterization of the functioning of species regarding plant water use (Sterck et al., 2011; Cosme et al., 2017) and indicate the response of species to drought (Anderegg et al., 2016; Powers et al., 2020). As water is the most limiting resource during at least part of the year, we hypothesized that an evolutionary convergence could be expected within a functional group at a single site, and thus that liana species from a single site would exhibit similar hydraulic traits.
Materials and Methods
Site Description
All samples were collected in Estación Experimental Forestal Horizontes (Horizontes), which is part of Área de Conservación Guanacaste in Northwestern Costa Rica (10.714 N, 85.596 W) in 2019. Horizontes contains a mosaic of secondary forest in various stages of succession and tree plantations (Werden et al., 2018). According to the historical observations of the nearby weather station in Liberia between 1957 and 2017,1 the mean annual temperature and mean annual precipitation of this site are 27.2°C and 1,585 mm, respectively. There is a 5–6 months long dry season with little to no precipitation (< 100 mm). The wet season, during which there is usually a short but distinctive dry period, typically starts in May and ends in December (Allen et al., 2017). In this study, all experiments were conducted in Horizontes, except for the acoustic vulnerability curves (see below) and the wood specific gravity, which were measured in Ghent, Belgium (Ghent University, Faculty of Bioscience Engineering, Laboratory of Plant Ecology).
In 2019, the wet season started in May, with a total monthly rainfall of 268 mm. The next 4 months (June–September) were relatively dry compared to the long-term averages, with a total monthly rainfall of 47, 71, 59, and 141 mm, respectively. From 22/08/2019 to 13/09/2019, no precipitation was registered. From 14/09/2019 onward, 141 mm precipitation was registered. Therefore we divided the field campaign into three periods: a relatively dry (07/08-21/08), dry (22/08-13/09), and wet (14/09-30/09) period, hereafter referred to as the “early dry,” “dry,” and “wet” periods (Figure 1A).
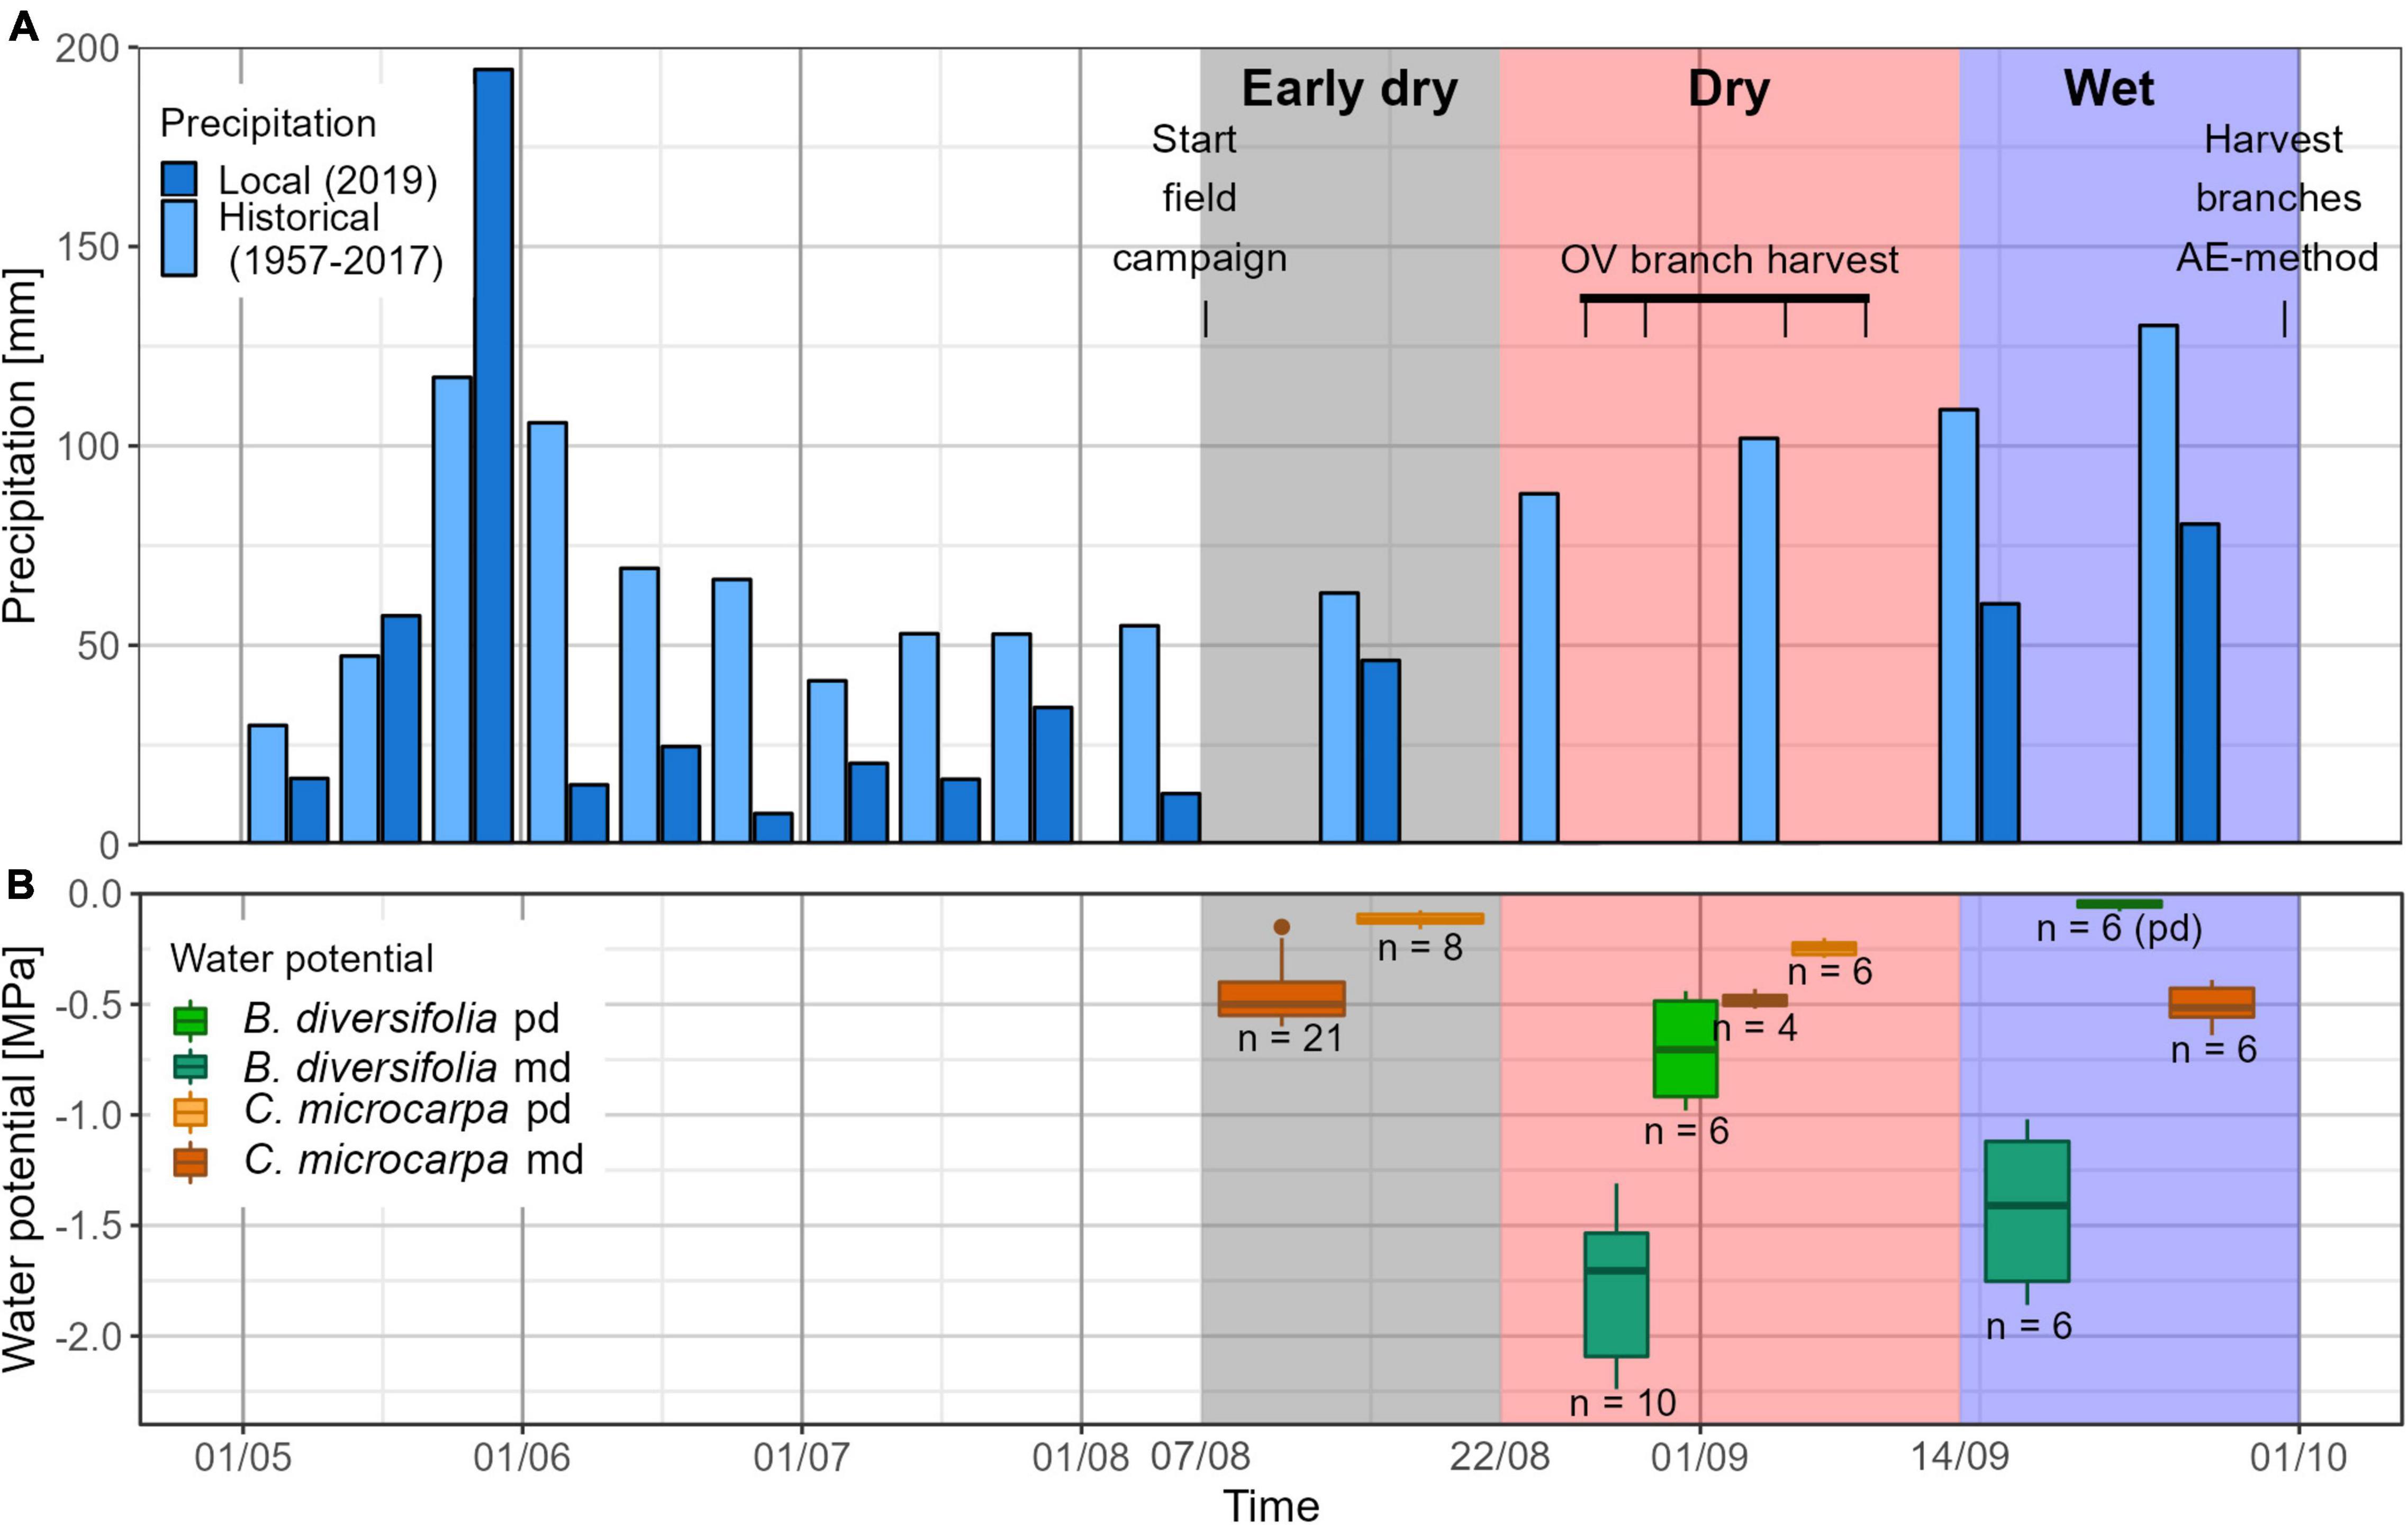
Figure 1. Overview of the field campaign. In (A), precipitation is plotted on 10 day intervals (11 days for the last period of the month if the month has 31 days). Light blue bars represent the average precipitation between 1957 and 2017 as measured by a nearby weather station in Liberia. Dark blue bars indicate the precipitation measured in 2019 in Horizontes. The precipitation was used to divide the field campaign (07/08–30/09) into three periods: the first period was relatively dry, with some precipitation (Early dry); in the second period, no precipitation occurred (Dry) and during the last period, large quantities of precipitation were observed (Wet). (B) Shows the measured predawn and midday water potentials for the two species. Measurements took place throughout the field campaign and are here grouped per period.
Species Selection and Harvest
We selected the two liana species based on the accessibility of target individuals along roads and their local abundance in the forest and on a preliminary analysis of water potentials in the field. The latter showed that liana species could be divided into two different groups: one with constant and high water potentials and the other one with variable and low water potentials. From these two groups, the most abundant species were retained for the study, namely, Cissus microcarpa Vahl (Vitaceae) and Bignonia diversifolia Kunth (Bignoniaceae), two drought-deciduous species. Smith-Martin (2018) identified 57 liana species during an inventory in 18 permanent plots established in the same region as the experimental forest in Horizontes. Based on the relative stem number, B. diversifolia was the second most common liana species (12.07%) across all plots whereas C. microcarpa was the 9th (4.27%). Based on the relative basal area, B. diversifolia was also the second most abundant liana species (10.31%), while C. microcarpa was the 13th most abundant species (2.10%). In another study conducted in the 40-year-old tree plantations in Horizontes, 1084 lianas were found in 385 out of 748 surveyed trees. 25% of the lianas stems belonged to the genus Cissus, 2% of the stems belonged to B. diversifolia (Powers et al., 2020).
Collected leaves and branches were in direct sunlight most of the day and the collected specimen could be considered mature, as they were climbing and growing across the tops of their host trees, an approach similar to Smith-Martin et al. (2020). To minimize embolism induction, all branches were harvested predawn, between 4:00 and 5:30 a.m. Whenever possible, the branches were cut at a length of at least 2 times their maximum vessel length (see below), after which a second piece was cut under water to remove embolisms induced by the cutting. As in Gorel et al. (2019), the cut end of the branches was immediately put in a vial filled with water, and the branches were enclosed in a humidified black plastic bag for transport to the lab.
Maximum Vessel Length
The maximum vessel length (MVL, cm) was determined using the air injection method (Ewers and Fisher, 1989) on 5 and 6 individual branches of C. microcarpa and B. diversifolia, respectively, whereby a syringe was used to create pressure. No measurements of hydraulic conductivity were performed in this study.
Water Potential Measurements
Water potential measurements were conducted with gas pressure chambers (Model 600, 1,000, and 1505D, PMS Instrument Company, Corvallis, OR, United States), which can measure leaf water potential down to −4, −7, and −14 MPa, respectively. Both in the field and in the lab, leaves were cut using a razor blade and directly put in the pressure chamber.
Predawn and midday water potentials were frequently measured in situ on three leaves of the same three specimens per species, using the Model 600 gas pressure chamber. Sampling height ranged between 1 and 3 m. Predawn measurements (Ψpd) were conducted between 4:30 and 5:30 a.m. As full darkness was assured, it was assumed that the leaf water potential (Ψleaf) was in balance with the stem water potential (Ψstem). Midday water potential measurements (Ψmd) were conducted between 11:15 a.m. and 1:15 p.m., close to the local solar noon which varied from 11:32 a.m. to 11:48 a.m. throughout the field campaign. To equilibrate Ψleaf with Ψstem, all leaves to be measured were wrapped in a plastic bag surrounded by aluminum foil, at least 1 h before measurement (Trifilò et al., 2014). The bag was placed in such a way that there was still enough exchange of air to avoid condensation.
Optical Vulnerability Curves
Optical Vulnerability (OV) measurements were conducted on 6 leaves of each species starting from 26/08 to 09/09 (Figure 1A; Brodribb et al., 2016b). Per measurement cycle, three branches were harvested predawn and one leaf of each of the three branches was placed onto a scanner (Epson Perfection V800 Photo Color Scanner, Epson America, Inc.) while still connected to its parent branch. Leaves were carefully placed between two microscope slides, allowing to have the same focal point on the whole scan and to reduce vertical movement due to shrinking. Every leaf was captured in a ten-minute interval until no new embolism event occurred in a 4-h time interval and the leaf appeared crispy dry. In total, the experiments lasted between 1.26 and 2.32 days. During the desiccation process, Ψstem measurements were carried out on the other leaves of the same branches every 0.5–2 h, except from 8:00 p.m. to 7:00 a.m., using the Model 1505D gas pressure chamber. Additionally, low stem water potentials were also measured using the WP4C dewpoint potentiameter (Decagon Devices, Inc., Pullman, Washington, United States) following the METER group protocol.2 In brief, a selected leaf was gently abraded with a 600 grit sandpaper with a drop of distilled water in between to remove the cuticle and allow faster moisture exchange. After this, moisture was removed with a lint-free tissue, a circle was cut out of the leaf and inserted into the device after which the measurement was started. The device was calibrated daily before use.
This measurement process was repeated twice for each species. Data processing was executed as described by OpenSourceOV3 using the Fiji-ImageJ processing software (Schindelin et al., 2012). To obtain a continuous water potential curve, water potential measurements were plotted against time, and a linear regression was derived for each species. In all cases, we also tested a piecewise linear model (i.e., two linear models with a single inflection point), and only the best model according to the model adjusted r-square was retained. By converting the time of the scan to its respective water potential, we could derive the optical vulnerability curve for each leaf. P50,OV (MPa) was defined as the water potential at which 50% of the embolized vessel area (EVA) was reached.
Acoustic Vulnerability Curves
For the acoustic vulnerability (AV) method, six branches of each species were harvested the night prior to transport to Belgium, between 1:00 and 4:00 a.m. Wet clothes were added to the transport bags to prevent desiccation of the branches and the cut end was put in a vial with water to ensure that the plants would survive the 26 h journey. Upon arrival in Belgium and until the start of the experiment, the plants were kept out of direct sunlight in a cool environment with an average temperature of 10°C for approximately 10 h. During the experiment, four branches of each species were used. Branch selection for the AV method was based on visual inspection.
Sensor installation and data registration were carried out as in De Baerdemaeker et al. (2019a). In short, all leaves were wrapped in aluminum foil, after which a dendrometer (DD-S, Ecomatik, Dachau, Germany) and a broadband point-contact acoustic emission (AE) sensor (KRNBB-PC, KRN Services, Richland, United States) were attached to the branches at least one time the MVL from the cut end. During dehydration, water potential measurements were conducted every 0.5–2 h using the Model 1,000 gas pressure chamber, until the water potential dropped below −7 MPa. After that, the sensors continued to measure diameter shrinkage and AE signals, respectively, to ensure that the activity peak had been reached before ending the experiment. In total, the experiment lasted for 4 days.
The P50 values for the AV method (defined as AE50 in Steppe et al., 2022) were determined by using two different procedures. First, the endpoint of embolism formation (AE100) was determined as in Vergeynst et al. (2016). In short, AE100 was determined as the point at which the decrease in AE activity, following the AE activity peak, decreases most strongly, which corresponds to the local maximum of the third derivative after the peak in the AE activity (Vergeynst et al., 2016; Steppe et al., 2022). The time interval used to calculate the third derivative was dependent on the timespan at which the AE-activity peaks (Steppe et al., 2022), and varied between 6.1 and 10.1 h. An estimation of the continuous water potential series was obtained by establishing a pooled linear relationship between the relative radial shrinkage of the branch (μm mm–1, strain) and the water potential measurements (MPa, stress) (De Baerdemaeker et al., 2019a). Again, a linear regression and a piecewise linear model were constructed, after which the model with the highest adjusted r-squared was retained. To plot the acoustic vulnerability curves, the cumulative AE signals between the start of the experiment and AE100 were re-scaled between 0 and 100. AE50 was then determined as the water potential at 50% of the cumulative AEs (Steppe et al., 2022), and will henceforth be referred to as P50,AV in this study. Second, P50,AV was determined as the water potential at the peak of the activity curve, which is the first derivative of the cumulative AE-curve (Nolf et al., 2015a). The apparent modulus of elasticity in the radial direction (Er, MPa) was calculated as the slope of the stress-strain relationship (Nobel, 2012; Vergeynst et al., 2015). Hydraulic safety margin at the branch level (HSMAV, MPa) was defined as the difference between the lowest stem water potential measured in the field on 1 day (Ψmin) and P50,AV (Meinzer et al., 2009).
Wood Specific Gravity and Branch Water Fraction
Wood specific gravity (WSG, g cm–3) was determined for branch segments collected before the start of the acoustic experiment and calculated as the ratio of dry weight to green volume. The wet volume was calculated from two diameters measured perpendicularly to each other at both ends, and the length of the sample, assuming a cylindrical shape for both species. The dry weight of the samples was determined after the samples were oven-dried at 80°C for 48 h (ML104T/00, Mettler-Toledo GmbH, Switzerland, with 0.1 mg accuracy). The water fraction of the branches (unitless) was calculated as fresh weight minus dry weight divided by the fresh weight.
Data Analysis
For the construction of the vulnerability curves, four fitting models (Weibull, Lopez et al. (2005), sigmoidal, Pammenter and Van der Willigen (1998), and two polynomial models Scoffoni et al. (2012); Manzoni et al. (2013); Supplementary Table 1) were fitted to the data for all branches. The model with the best fit was selected based on the minimal RMSE criterion. Next, the process was repeated using a bootstrapping method (n = 10,000), and VC-related variables, such as P12, P50, P88, and ax50 [respectively the water potential at 12, 50, and 88% embolism (MPa) and the slope at P50 (%)] were determined. After bootstrapping, averages per branch were calculated for all variables and the species average was calculated as the average of all branches. To plot the vulnerability curves, the mean was plotted as the mean of all bootstrapped values, the 95% confidence interval was generated by disregarding the 2.5% highest and lowest values for each water potential value.
The normality of the data was checked using the Shapiro–Wilk test. Differences between two groups were tested with a two-sample t-test and a Mann–Whitney U-test for parametric and non-parametric data, respectively. To calculate differences between species for the HSMAV, the average Ψmin was subtracted from all P50,AV values, and these values were then used to perform the statistical analysis. A linear mixed model (nlme package in R, Pinheiro et al., 2013) was used to analyze the potential difference in water potential of the species between the different periods (early dry, dry, and wet). The period was used as a fixed effect, and the timing of the measurement (pd or md) was used as a random effect. Statistical analyses were executed in RStudio (version 1.3.959) (RStudio Team, 2020) with R version 4.0.2.
Results
Maximum Vessel Length and Water Potential Measurements
The MVL of C. microcarpa (233.2 ± 49.6 cm) was more than twice as large as that of B. diversifolia (113.4 ± 49.3 cm, p-value = 0.004, Table 1). There was a significant difference between the water potentials of both species in all periods where measurements were available for both species (Table 1). C. microcarpa had systematically higher water potentials throughout the field campaign (Figure 1B). The most significant differences between the two species occurred during the dry period when Ψpd and Ψmd of C. microcarpa were, respectively, −0.45 MPa and −1.3 MPa lower than that of B. diversifolia (Table 1 and Figure 1B). Moreover, the water potential of C. microcarpa was not significantly different between periods (p = 0.06), whereas that of B. diversifolia was (p-value < 0.001).
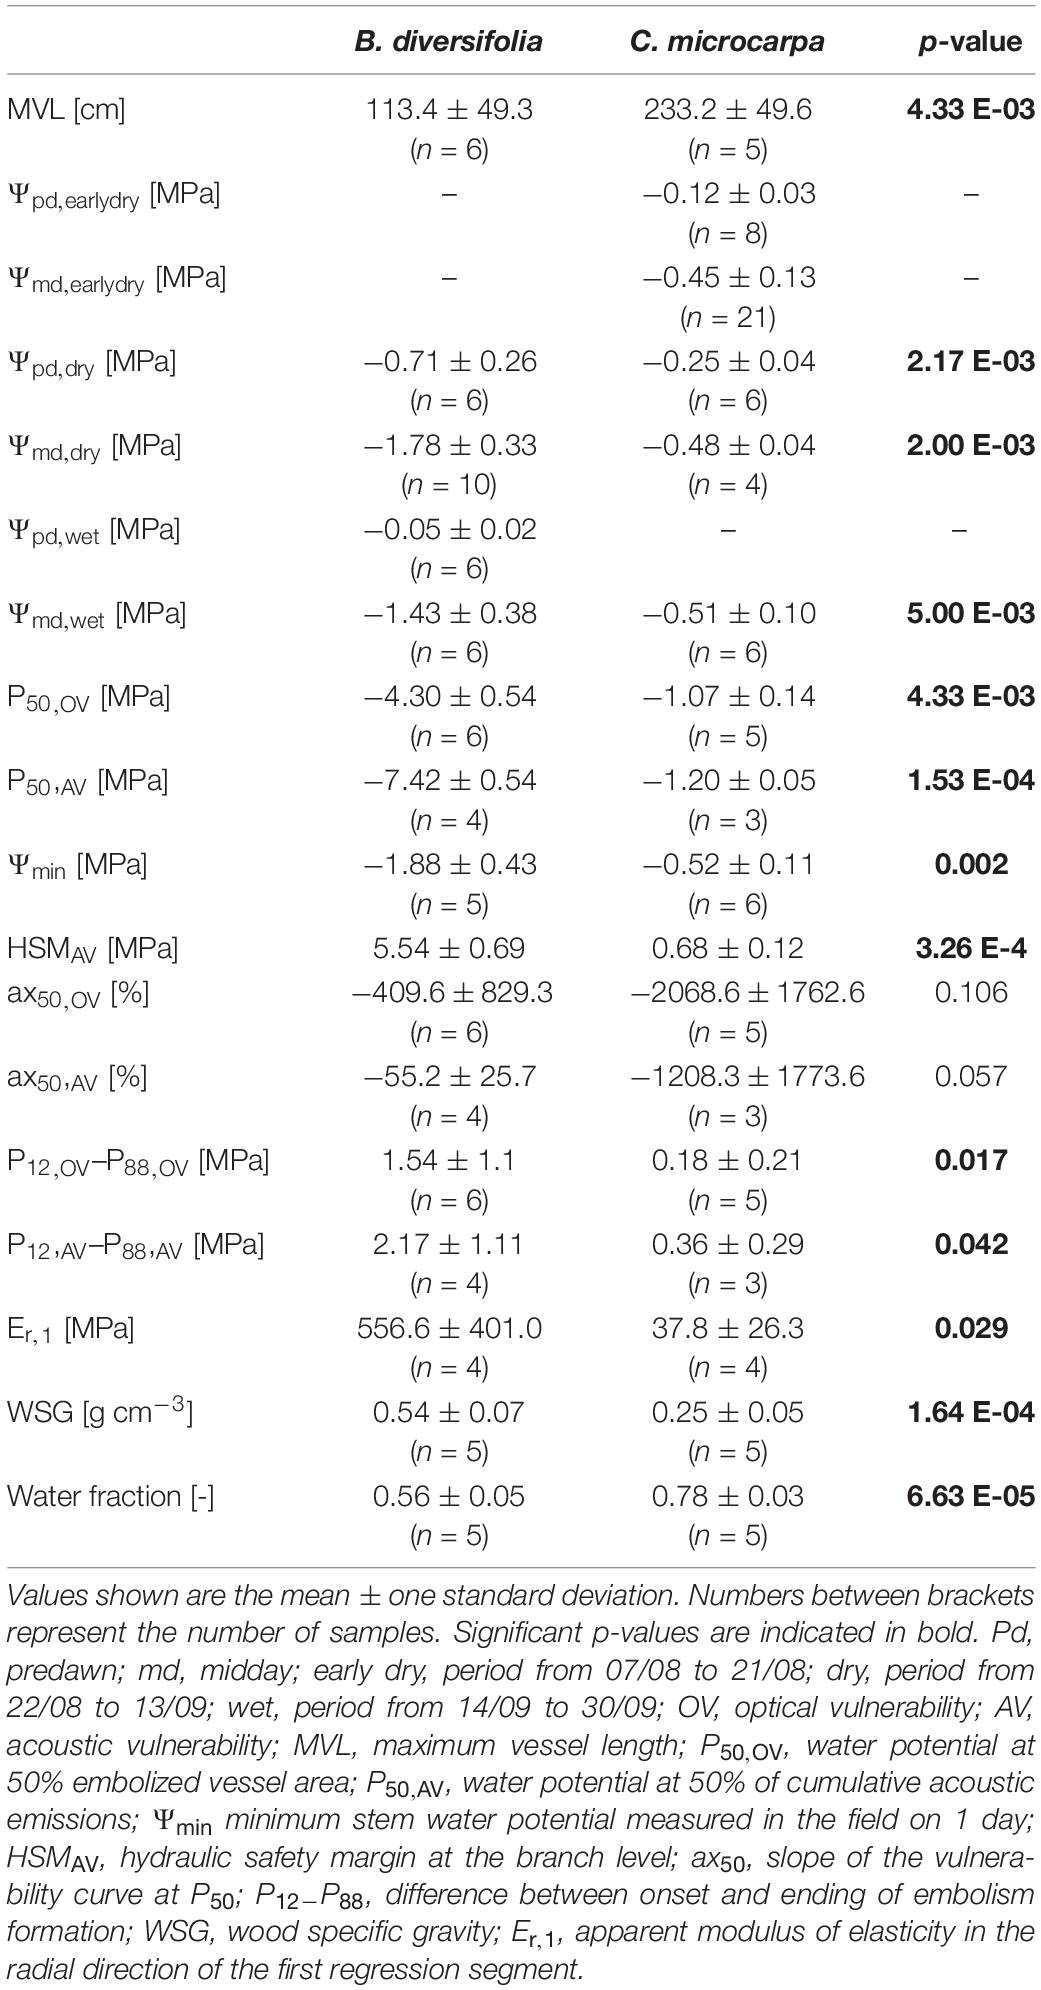
Table 1. Summary of the hydraulic properties of B. diversifolia and C. microcarpa measured in this study.
Vulnerability Curves
The two different procedures for determining P50,AV did not show significant differences (paired wilcoxon test, p-value = 0.12 and 0.25 for B. diversifolia and C. microcarpa, respectively, Supplementary Figure 1). For this reason in the following, we systematically use the method of Vergeynst et al. (2015) to plot the acoustic vulnerability curves and calculate the P50,AV value.
While the course of the species-specific vulnerability curves was similar between methods, the comparison between the two species showed a clear difference (Figure 2). C. microcarpa had a steeper curve at the P50 value (ax50) for both methods (Table 1). This steeper curve was not significant (p-value = 0.11) for the OV method because one branch of B. diversifolia had fewer data points and consequently a steeper curve (Figure 2). For the AV method, the effect was also not significant (p-value = 0.057), however, no outliers were found here. The onset of embolism was significantly different between species for both methods: P12 = −0.97 ± 0.08 and −1.02 ± 0.12 MPa for C. microcarpa and −3.58 ± 0.98 and −6.32 ± 0.83 MPa for B. diversifolia for the OV and AV method, respectively (p-value < 0.001 and 0.004, respectively). The difference between the onset (P12) and the ending (P88) of embolism was significantly different, with the smallest difference found for C. microcarpa (Table 1). These differences translated into distinctly different P50 for the two species: for C. microcarpa: P50,OV = −1.07 ± 0.14 MPa and P50,AV = −1.20 ± 0.05 MPa, and for B. diversifolia: P50,OV = −4.30 ± 0.54 MPa and P50,AV = −7.42 ± 0.54 MPa for the OV and AV methods, respectively (Table 1). These values are significantly different between species for each method (p-value = 0.004 and < 0.001) and between the two methods for B. diversifolia (p-value < 0.001). Both species have a significantly higher (less negative) P50 value at leaf level than at branch level (Figure 2). Ψmin for C. microcarpa and B. diversifolia were −0.52 ± 0.11 MPa and −1.88 ± 0.43 MPa, respectively. Combined with the P50,AV, Ψmin resulted in a positive hydraulic safety margin at the branch level for both species: 0.68 ± 0.12 MPa and 5.54 ± 0.69 MPa, for C. microcarpa and B. diversifolia, respectively (p-value < 0.001).
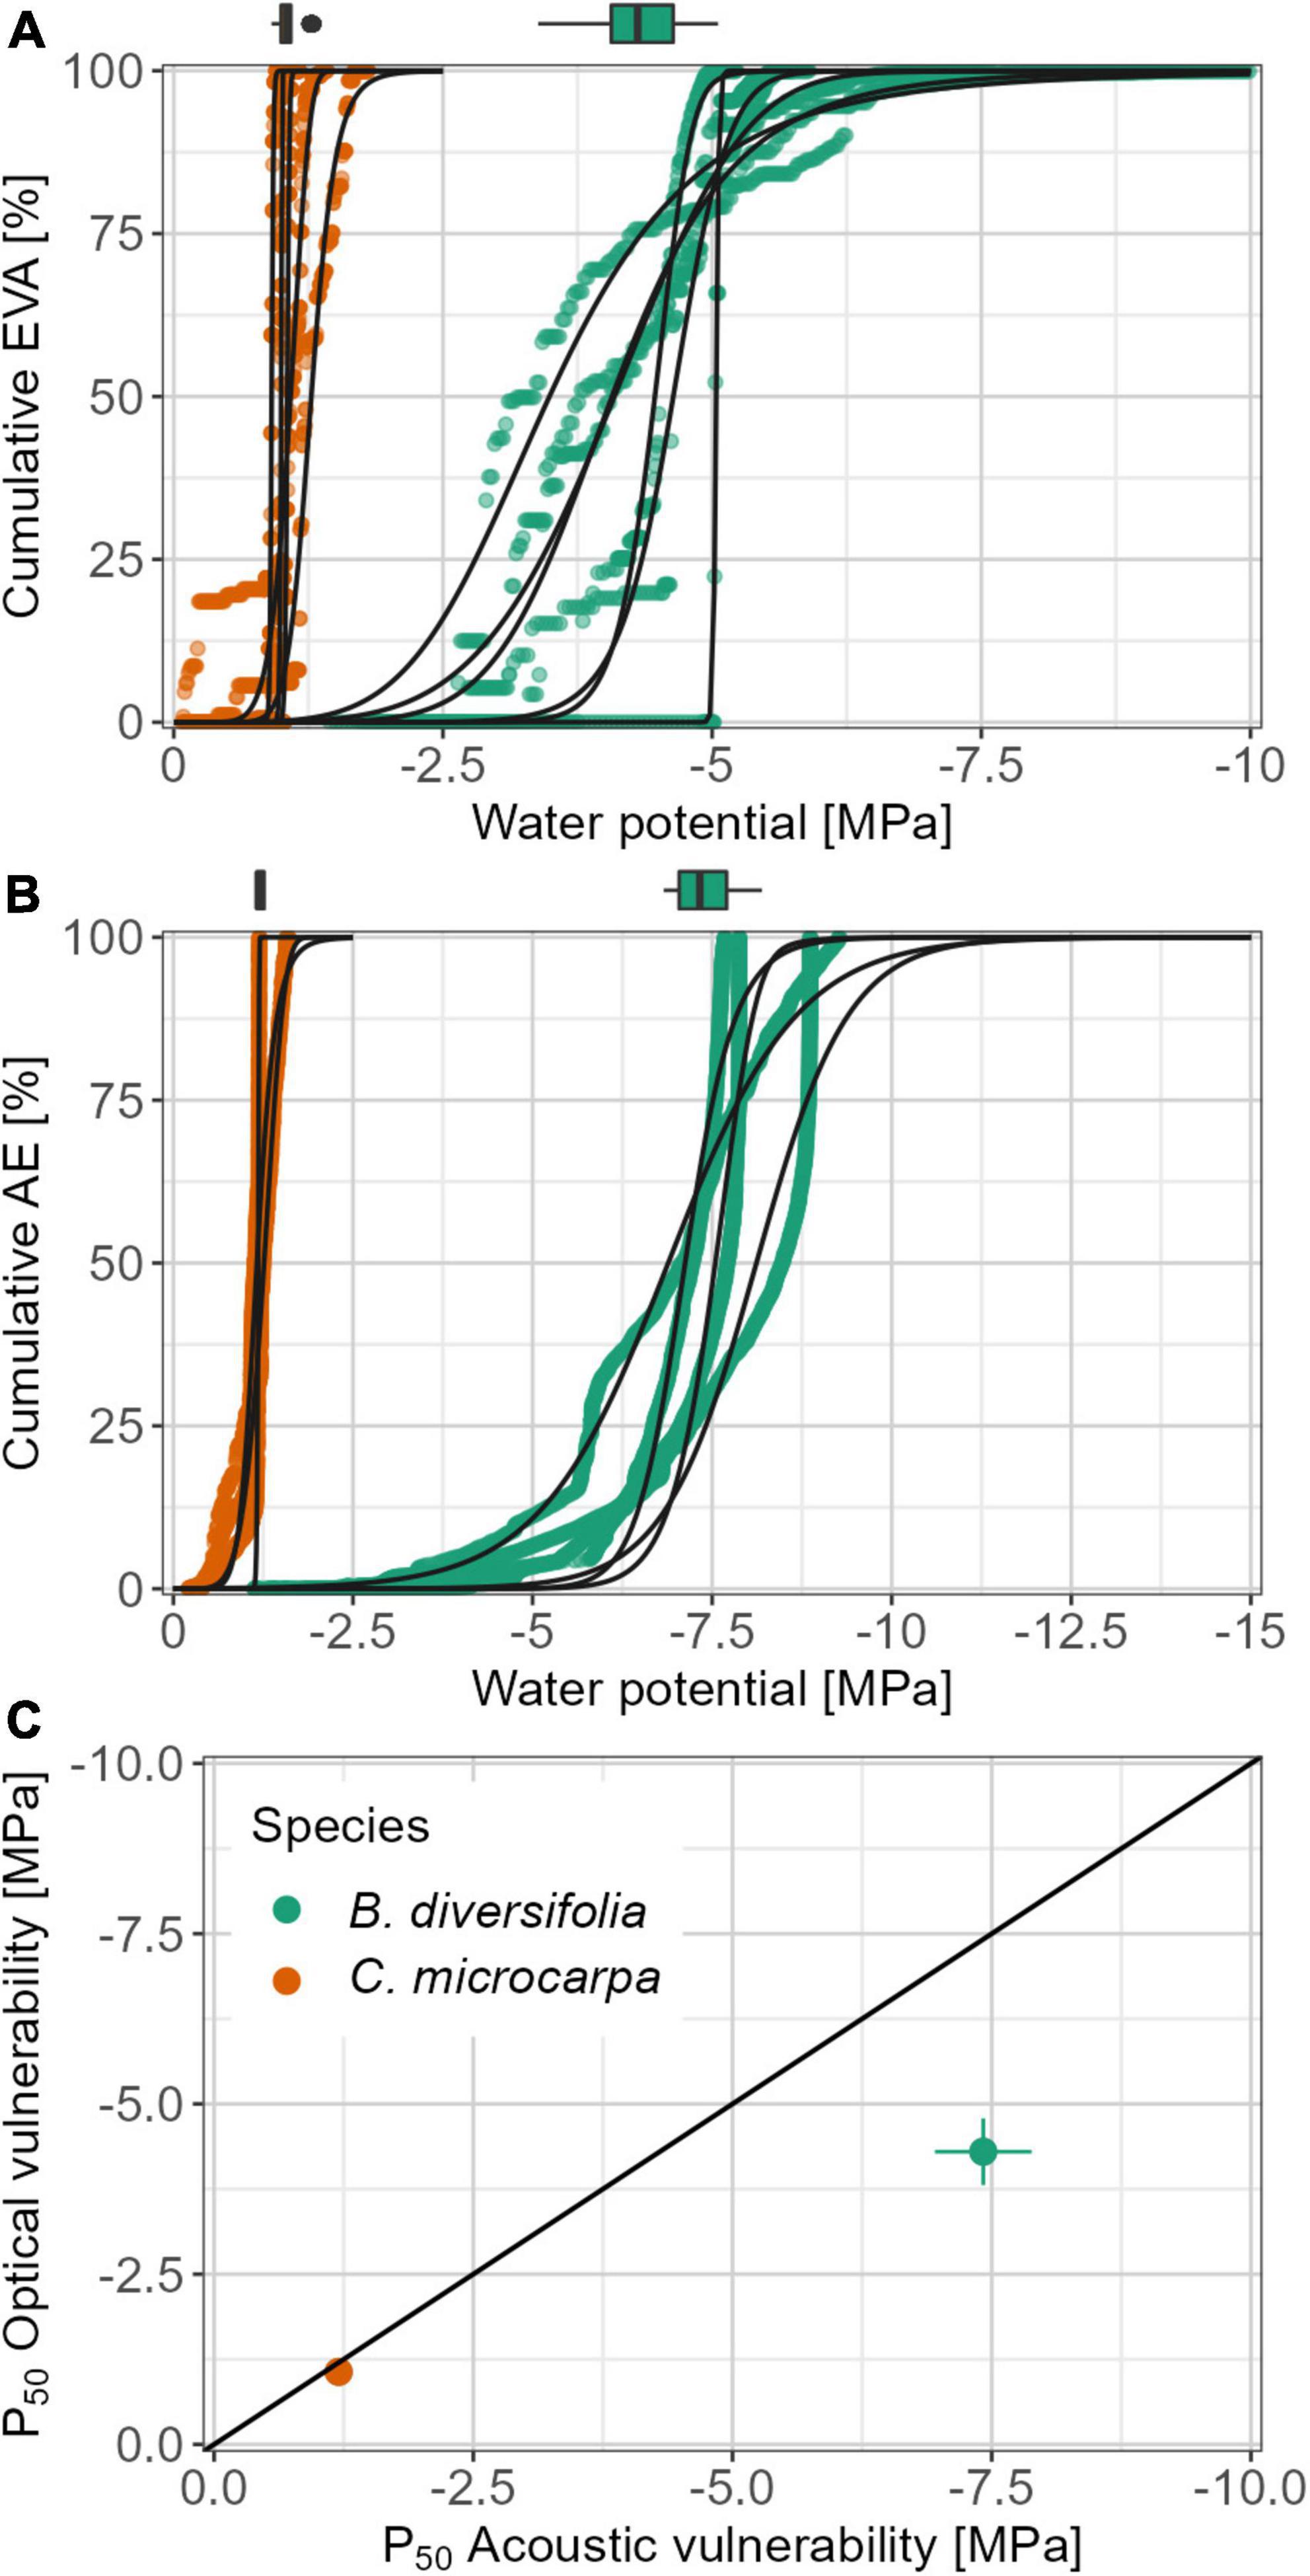
Figure 2. Vulnerability curves for B. diversifolia and C. microcarpa, obtained by the OV method (A) and the AV method (B). Vulnerability curves for the AV method are plotted using the results of the Vergeynst et al. (2015) procedure only. Dots represent the data points collected during the experiment, the black curves represent the vulnerability curves fitted to the data points with their 95% confidence interval, as derived from bootstrapping. The boxplots on top of each subplot show the respective P50 values, obtained from the bootstrapping. Subplot (C) compares the P50,AV and P50,OV values for the studied species. Horizontal and vertical error bars indicate the species standard deviation. EVA, embolized vessel area; AE, acoustic emission.
The Er value differed between species, but intra-species variability was also important (Figure 3). Both linear and segmented relationships emerged for the data, the slope of the first segment is shown in Table 1, inflection points and slopes of the second segment can be found in Supplementary Table 2. C. microcarpa had a significantly lower Er,1-value (p-value = 0.029) and mostly had a linear course. On the other hand, B. diversifolia had a higher Er-value and had more segmented curves. For both species, the Er-value after the inflection point was systematically lower than the Er-value before the inflection point (Figure 3).
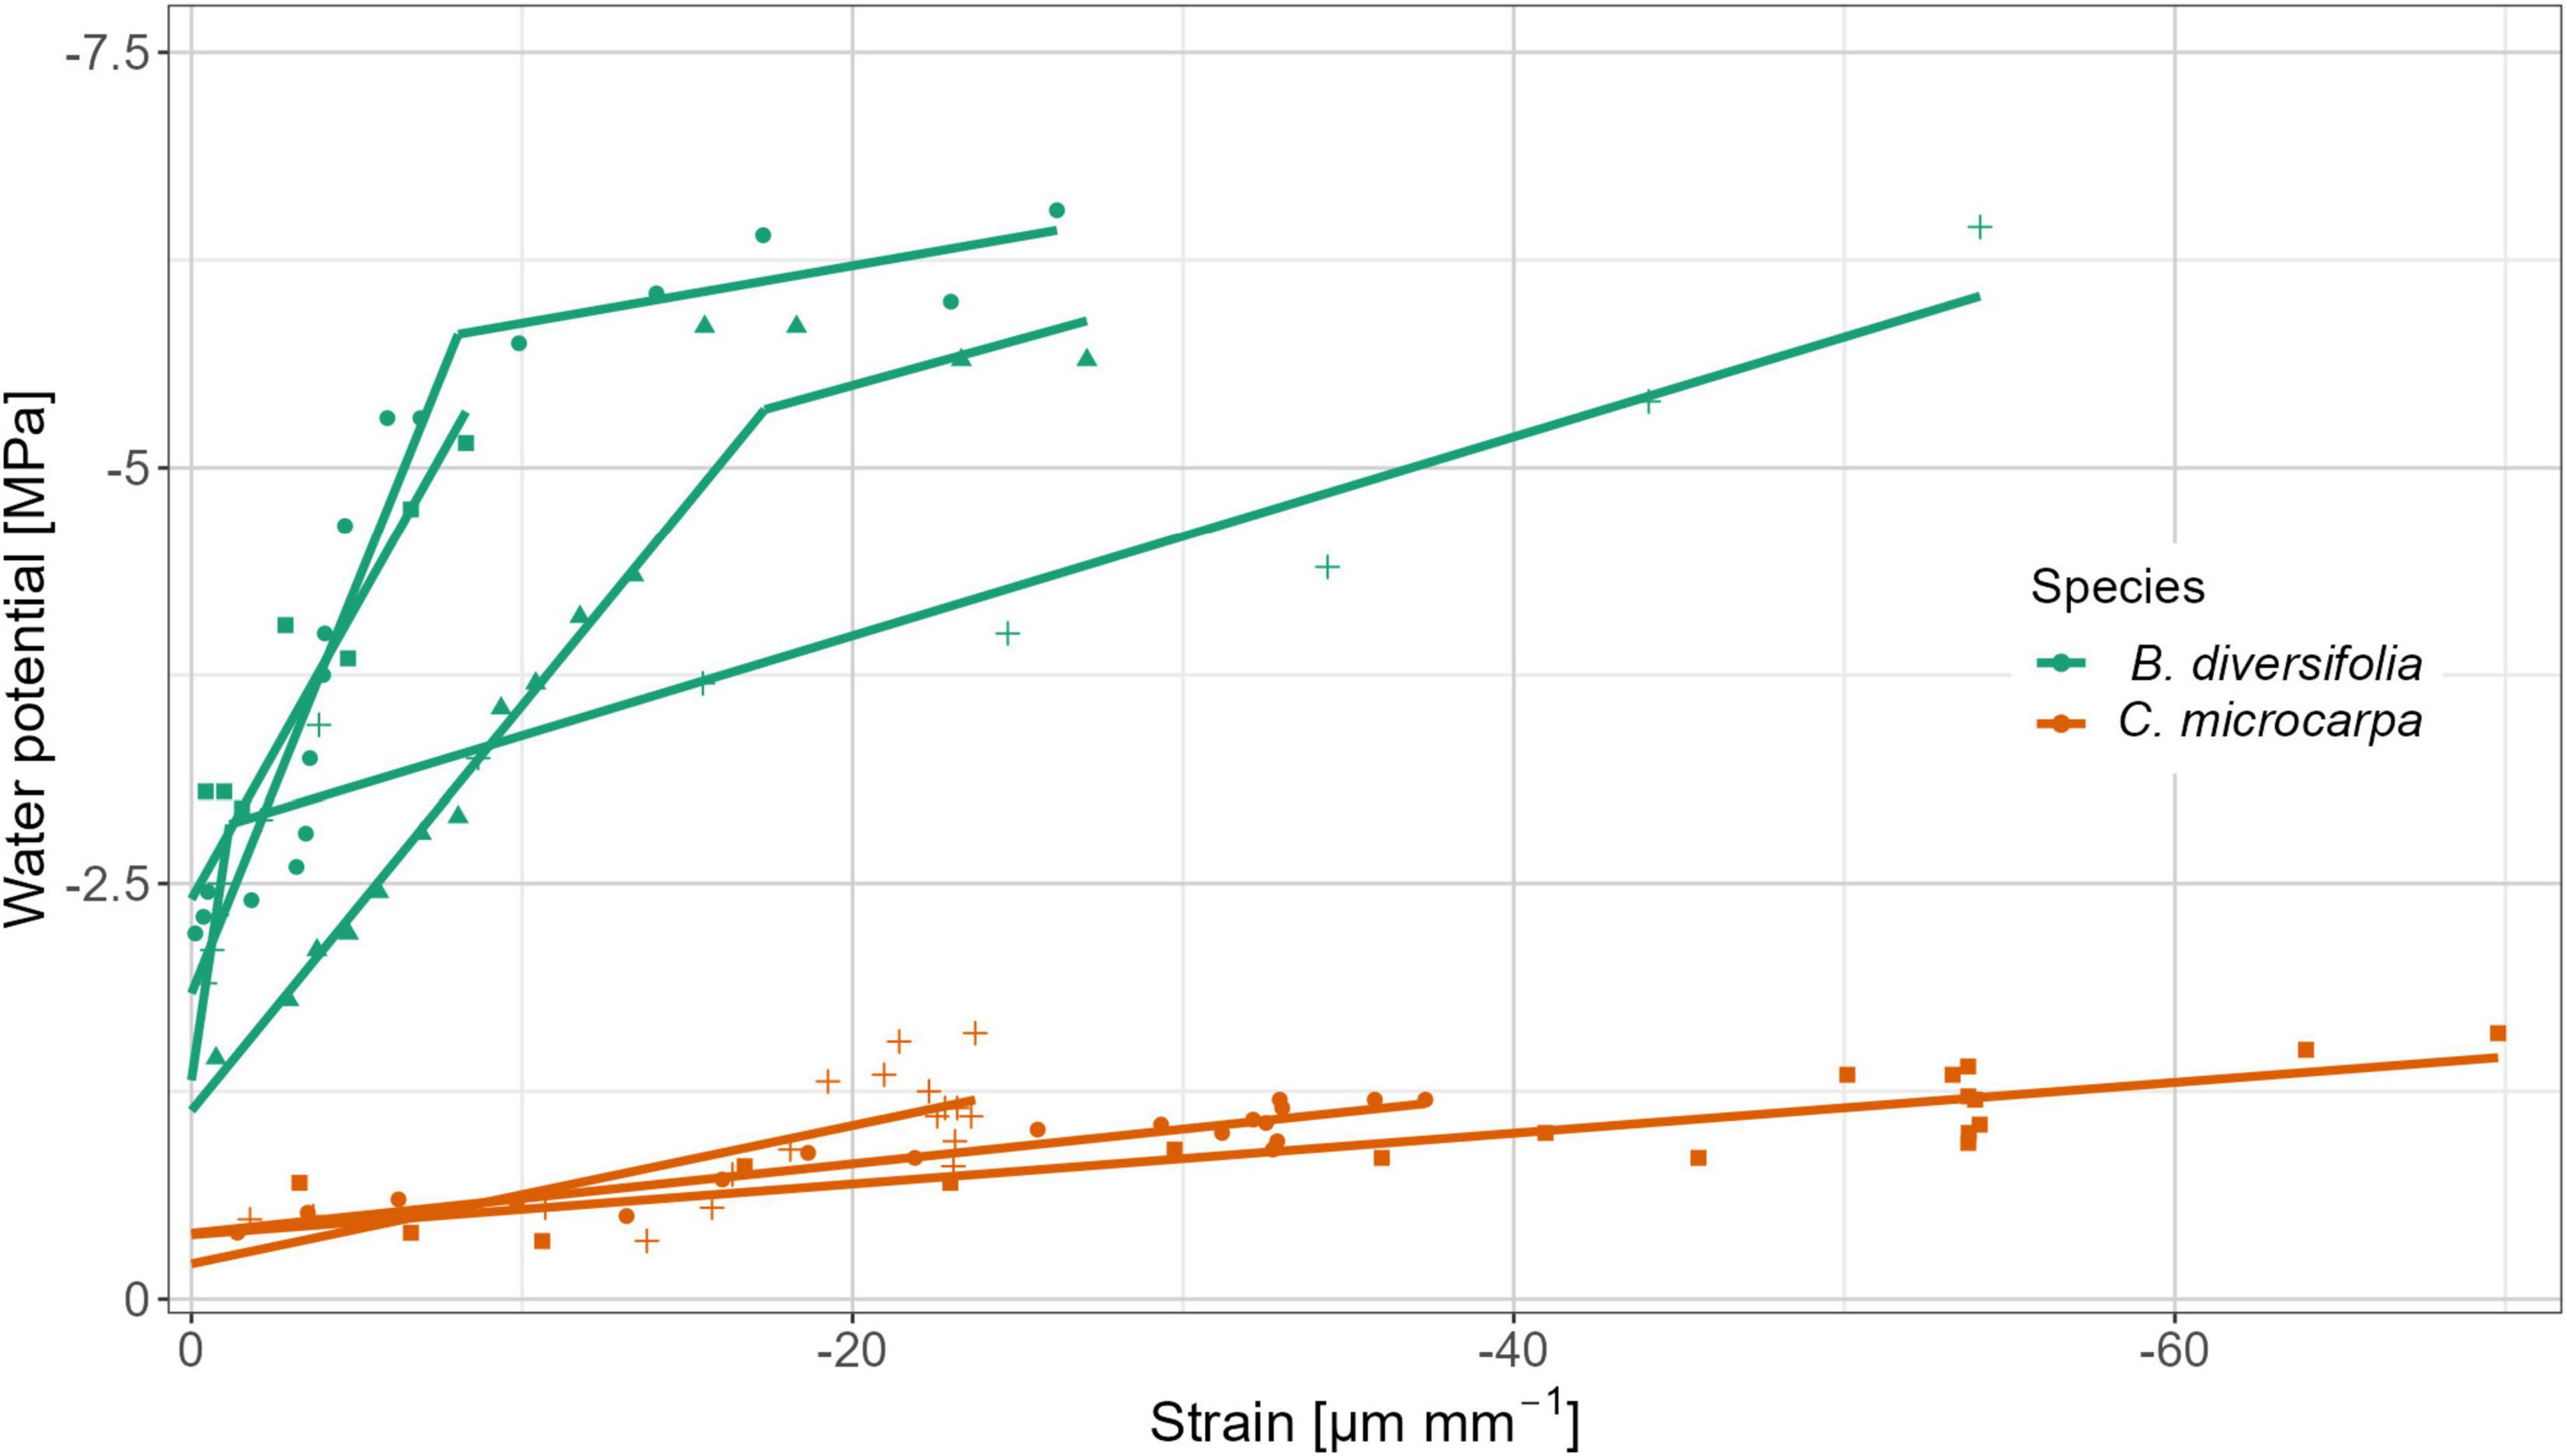
Figure 3. Pooled linear stress-strain relations between the point measurements of stem water potential and the strain for the measured branches of B. diversifolia and C. microcarpa. For some branches, a linear relationship was established, while others had a segmented course. Different symbols indicate different branches. The slope of the curves represents Er.
Wood Specific Gravity and Water Fraction
The wood specific gravity of C. microcarpa (0.25 ± 0.05 g/cm3) was less than half that of B. diversifolia (0.54 ± 0.07 g/cm3, p-value < 0.001) and its water fraction was significantly larger (0.78 ± 0.03 vs. 0.56 ± 0.05, respectively, p-value < 0.001) (Table 1).
Discussion
Hydraulic Traits
In this study, we showed that liana species found in the same environment can have contrasting hydraulic traits, which refutes our hypothesis that lianas from a single site would exhibit similar hydraulic traits due to evolutionary convergence. Both investigated liana species are abundant in the studied forest as compared to other liana species, which points at the potential ecological importance/impact of the two studied species in the ecosystem.
The two species we studied differed substantially in hydraulic traits. The vulnerability curves resulted in a similar course for both methods, albeit with a difference between the species. C. microcarpa had the highest P50 values of the two species and had a very steep increase in vulnerability for both methods once a certain water potential “threshold” was reached. However, these embolisms did not happen at one moment in time. After reaching the water potential “threshold,” C. microcarpa kept its water potential more or less stable, causing the embolisms to occur at the same water potential, but spread over time. It is possible that this species could keep its water potential constant due to a combination of a large initial water content (78% of its fresh weight), a high elasticity (small Er values), i.e., only a limited drop in water potential when water is released during branch shrinkage, and a high shrinkage of the branch during desiccation. The ability to keep its water potential constant was also found in the field, where the Ψmd showed little variation throughout the field campaign (Figure 1B). On the other hand, this species could also have deep roots and thus have access to deeper water. As no plants were excavated in this study, no conclusion can be drawn about the rooting depth of this species. However, in a study in the same forest, Smith-Martin et al. (2020) found that studied lianas had the shallowest root systems when compared to deciduous and evergreen trees. Because the species was also able to keep its water potential constant during the desiccation experiments, i.e., without roots and access to water, it can be assumed that deep roots are not the primary cause of this mechanism. The ability to keep its water potential constant may enable this species to coexist with species that are more resistant to drought-induced embolism, such as B. diversifolia (De Guzman et al., 2021). Indeed, B. diversifolia was more drought tolerant, with a smaller slope at P50, later onset of embolism, lower water content, and a more variable Ψmd in the field. However, both species had in common that they never reached water potential levels that lead to significant embolism during the field campaign.
In a study conducted at the same site, Werden et al. (2018) found that lianas and trees have overlapping water-use strategies. They measured predawn and midday water potentials of 12 tree species and seven liana species, including B. diversifolia and C. microcarpa. They found that both lianas and trees fell along a continuum of water-use strategies, from isohydric (drought-avoider) to anisohydric (drought-tolerator). In this study, we found similar results, with C. microcarpa leaning toward the isohydric strategy, and B. diversifolia toward the anisohydric strategy. However, our results for B. diversifolia differed from theirs, in the sense of a higher Ψpd and a lower Ψmd, as considered over the whole field campaign (data not shown). Additionally, our Ψmin values corresponded to what was expected for both water-use strategies: a high value for the drought-avoiding C. microcarpa (−0.52 ± 0.11 MPa) and a low value for B. diversifolia (−1.88 ± 0.43 MPa), which is characteristic for drought-tolerant species. This is also in line with the findings of Meinzer et al. (2009), who showed that Ψmin measured when soil water deficits are non-extreme are positively correlated with P50 and P12 values.
Two indirect techniques were used to construct the vulnerability curves at branch and leaf level, namely, the AV method and OV method. Both of them have been validated several times using other methods (see e.g., Nolf et al., 2015b; De Baerdemaeker et al., 2019b; Steppe et al., 2022 for the AV method and Skelton and Diaz, 2020 for the OV method), so it was decided not to repeat this validation in this study. The AV method was, for example, validated by Vergeynst et al. (2015) comparing the AV results with simultaneously acquired X-ray micro-computed tomography (μCT) images. Both methods showed a similar pattern, and no significant trend in the diameters of the embolized vessels was found over time, indicating that AEs are valid as an indirect estimation of the percent loss of conductivity of the branch. As this validation was performed on the vine Vitis vinifera L. “Johanniter,” it is assumed that it will also be valid for other long-vesseled species. Brodribb et al. (2016b) applied the OV technique on four angiosperm species and found strong agreement between the dynamics of the recorded embolism by the OV method and the decline of whole leaf hydraulic conductance.
The P50 values differed markedly between species and methods. The vulnerability at leaf level, measured by the OV method, always resulted in higher values than the vulnerability at branch level, measured by the AV method, suggesting a vulnerability segmentation between the two organs. With increasing drought at the start of the dry season, this segmentation could ensure that the stem and branches are spared from embolism until leaves have dropped, and keep them functional throughout the dry season (Zimmermann, 1983). Because the area studied has a distinctly dry period, this observation is also consistent with that of Zhu et al. (2016), who showed that vulnerability segmentation occurs more often in species that occur in drier areas.
To our knowledge, this paper is, together with Smith-Martin et al. (unpublished)4, the first to report leaf-level P50 values for lianas using the optical method. Two studies that determined P50 at leaf level using other methods reported rather divergent values: Tan et al. (2020) used the rehydration kinetics method described by Brodribb and Holbrook (2003) and reported a mean value of −2.21 ± 0.21 MPa for four liana species in a tropical karst forest during the dry season, whereas Medina-Vega et al. (2021) used the evaporative flux method as described in Sack and Scoffoni (2012) and reported a mean value of −0.19 ± 0.1 MPa for 16 liana species in two tropical forests in Panama, where most samples were collected during the wet season. Compared to these values, the result of B. diversifolia was low, however, recently, Smith-Martin et al. (unpublished) measured P50,OV values down to −4.62 MPa on lianas in two forests in Panama which confirmed that our value is not an isolated value. P50 values at branch level, on the other hand, have been reported more frequently for lianas. Here, however, the value of B. diversifolia deviated considerably from reported values, while that of C. microcarpa was in line with other studies. For example, Chen et al. (2021) recently found P50 values at branch level of −3.86 and −3.93 MPa using the bench dehydration method for two liana species, representing one of the most negative P50 values for lianas in literature. Most other studies reported P50 values at branch level between −1 and −2 MPa. Even compared to trees, which generally have a higher resistance to embolism (e.g., De Guzman et al., 2017), our value for B. diversifolia remained low. Despite the large difference with values from the literature, we argue that the results can still be used as an indicative value, as the acoustic vulnerability curve showed a similar course as the optical vulnerability curve for both species, and the two procedures to determine P50,AV did not give a significant difference.
The timing of the OV measurements, i.e., during a dry year, most likely had no impact on the results of the method. Brodribb et al. (2016a) found that embolisms in leaf veins follow a size-dependent embolism pattern, with embolisms starting in the largest veins, which we also observed. If the leaves were already partially embolized, this would no longer be detectable using the OV method, as this method can only detect embolisms as the difference in light transmission between two successive scans (Brodribb et al., 2016b). Since multiple embolism events can take place in the same vessel, we cannot exclude that no embolisms occurred before the start of the scanning. However, if this were the case, it would only have a small effect on the P50 value, which would become slightly higher. Furthermore, no signs of extreme drought stress were found in either species during the field campaign: Ψmin never reached or came close to the P12 value of the two species, suggesting that no or only very limited embolisms occurred during the measurement period. As it was drier than average during this period (Figure 1A), it could be assumed that these species will continue to thrive in this forest in a context of climate change, where future droughts may be longer and more intense (Trenberth et al., 2014). However, since these measurements were only made during a dry period in the wet season, lower water potentials could potentially occur during other parts of the growing season, which could still lead to embolisms. Because both species are drought-deciduous, it is not expected that they would have an advantage over trees in the dry season.
We found positive safety margins for both species, ranging from a relatively small value for C. microcarpa (0.68 ± 0.12 MPa), to a large value for B. diversifolia (5.54 ± 0.69 MPa). Few studies had examined hydraulic safety margins (HSM) for lianas, and when they were, different definitions were used, which made comparison with our results difficult (Tan et al., 2020). Nevertheless, the HSM value found for B. diversifolia was very large compared to values in the literature. A possible explanation for this is that Ψmin measured during this field campaign does not correspond to the lowest water potential that the species could reach in the field. For example, in a tropical dry Karst forest, Ψmin of Lasiococca comberi was independently measured in multiple studies in multiple years, resulting in very diverse values, ranging from −2.92 MPa in Chen et al. (2021) over −3.77 MPa in Fu et al. (2012) to −6.58 MPa in Chen et al. (2015). Tan et al. (2020) also found strong differences between minimum water potentials measured in a normal dry season and in an extreme dry season. The difference between the HSM values that we found and those of other previous studies could also be due to the different methods used, as our results align with those found by Smith-Martin et al. (unpublished), who also found a range of mostly positive HSMs for lianas (−0.88 to 3.00 MPa) using the OV method.
Yet, it is not only the safety margin that determines the vulnerability of a species, but also the rate of drying during drought periods (Brodribb et al., 2020). As C. microcarpa was able to maintain its high Ψmd during the whole field campaign, it is likely that despite its smaller safety margin, it is able to withstand drought periods. This shows that two species with contrasting hydraulic traits can both survive in a water-limited environment, demonstrating that lianas are a heterogeneous group, contrasting to our initial expectations.
Comparison With Local Tree Data
In a study conducted in the same region, Powers et al. (2020) determined P50 of 23 tree species using the OV method at leaf level, as well as other hydraulic traits such as the wood specific gravity. The mean P50,OV of the tree species was close to what we measured on lianas in this study (mean ± standard deviation for trees and lianas are −3.69 ± 1.19 MPa (n = 23) and −2.69 ± 2.28 MPa (n = 2), respectively). The range we measured for lianas overlapped for 62.5% with the range of tree P50,OV values, and had a higher maximum (minimum, maximum for trees and lianas are −6.72, −1.55, and −4.30, −1.07, respectively). For wood specific gravity, our values overlapped for 41.8% with the specific wood specific gravity values for trees (n = 60). It is clear that despite the low number of liana species samples, they overlapped to a considerable extent with the values measured for the most abundant tree species in the same location. Additionally, the P50,OV values from both liana species are located at both extremes of P50,OV values found by Smith-Martin et al. (unpublished) for trees in two tropical forests with different rainfall patterns in Panama (Supplementary Figure 2), and the difference between the P50,OV values of the lianas is greater than the difference between the most extreme trees. This shows that it is important to consider lianas not as a homogenous group, as is often done to this day, but as a heterogeneous group, just like trees.
Conclusion
In this study, we showed that two common, co-occurring liana species exhibit very different hydraulic properties in a water-limited environment. The two species studied showed a similar course of embolism at leaf and branch level, albeit with different susceptibility to embolism for both organs. Other hydraulic characteristics, such as branch water content, Ψmin, MVL, and the course of the water potential in the field were also significantly different between the two species. Although only two species were studied, considerable overlap was found between the range of hydraulic properties of trees and lianas growing in the same location. These findings show that lianas are not a homogeneous group, at least for some hydraulic properties. These results call for further research into the differences in properties between liana species, as this data could substantially contribute to the understanding of liana ecology and their interactions with trees in tropical ecosystems.
Data Availability Statement
The raw data supporting the conclusions of this article will be made available by the authors, without undue reservation.
Author Contributions
HV, KS, FM, JP, KC, SD, and CS-M designed the research. KC and SD collected data in the field with contributions from GV. KC and SD analyzed the data. KC wrote the manuscript with substantial input from FM. All authors complemented the article writing and read and agreed to the published version of the manuscript.
Funding
This research was funded by the European Research Council Starting Grant 637643 (TREECLIMBERS), FWO grant V401018N (“krediet aan navorsers”), FWO senior research project G002321N. Funding was provided by the Research Foundation Flanders (FWO) under research program G094115N granted to KS. JP thanks the US Department of Energy Grant DE-SC0020344. During the preparation of this manuscript, FM was first funded by the BAEF and the WBI as a research fellow and then by the FWO as a junior postdoc (fellowship 1214720N) and is thankful to these organizations for their financial support.
Conflict of Interest
The authors declare that the research was conducted in the absence of any commercial or financial relationships that could be construed as a potential conflict of interest.
Publisher’s Note
All claims expressed in this article are solely those of the authors and do not necessarily represent those of their affiliated organizations, or those of the publisher, the editors and the reviewers. Any product that may be evaluated in this article, or claim that may be made by its manufacturer, is not guaranteed or endorsed by the publisher.
Acknowledgments
We are very thankful to D. Perez-Aviles for assistance with species identification and F. Lauriks for assistance with the AV data collection.
Supplementary Material
The Supplementary Material for this article can be found online at: https://www.frontiersin.org/articles/10.3389/ffgc.2022.836711/full#supplementary-material
Footnotes
- ^ www.imn.ac.cr/inicio
- ^ www.metergroup.com/environment/articles/measurement-leaf-water-potential-using-wp4c/
- ^ http://www.opensourceov.org for more details
- ^ Smith-Martin, C. M., Jansen, S., Brodribb, T. J., Medina-Vega, J. A., Lucani, C. J., Huppenberger, A., et al. (2022). Tropical lianas and trees differ in their xylem anatomical traits in a seasonally dry forest but not in a wet forest. Front. For. Glob. Change*.
References
Allen, K., Dupuy, J. M., Gei, M. G., Hulshof, C., Medvigy, D., Pizano, C., et al. (2017). Will seasonally dry tropical forests be sensitive or resistant to future changes in rainfall regimes? Environ. Res. Lett. 12:023001.
Anderegg, W. R. L., Klein, T., Bartlett, M., Sack, L., Pellegrini, A. F. A., Choat, B., et al. (2016). Meta-analysis reveals that hydraulic traits explain cross-species patterns of drought-induced tree mortality across the globe. Proc. Natl. Acad. Sci. 113, 5024–5029. doi: 10.1073/pnas.1525678113
Beer, C., Reichstein, M., Tomelleri, E., Ciais, P., Jung, M., Carvalhais, N., et al. (2010). Terrestrial Gross Carbon Dioxide Uptake: Global Distribution and Covariation with Climate. Science 329, 834–838. doi: 10.1126/science.1184984
Brodribb, T. J., Bienaimé, D., and Marmottant, P. (2016a). Revealing catastrophic failure of leaf networks under stress. Proc. Natl. Acad. Sci. 113, 4865–4869. doi: 10.1073/pnas.1522569113
Brodribb, T. J., Skelton, R. P., McAdam, S. A. M., Bienaimé, D., Lucani, C. J., and Marmottant, P. (2016b). Visual quantification of embolism reveals leaf vulnerability to hydraulic failure. New Phytol. 209, 1403–1409. doi: 10.1111/nph.13846
Brodribb, T. J., and Holbrook, N. M. (2003). Stomatal Closure during Leaf Dehydration. Correlation with Other Leaf Physiological Traits. Plant. Physiol. 132, 2166–2173. doi: 10.1104/pp.103.023879
Brodribb, T. J., Powers, J., Cochard, H., and Choat, B. (2020). Hanging by a thread? Forests and drought. Science 368, 261–266.
Chen, Y.-J., Cao, K.-F., Schnitzer, S. A., Fan, Z.-X., Zhang, J.-L., and Bongers, F. (2015). Water-use advantage for lianas over trees in tropical seasonal forests. New Phytol. 205, 128–136. doi: 10.1111/nph.13036
Chen, Y.-J., Maenpuen, P., Zhang, Y.-J., Barai, K., Katabuchi, M., Gao, H., et al. (2021). Quantifying vulnerability to embolism in tropical trees and lianas using five methods: can discrepancies be explained by xylem structural traits? New Phytol. 229, 805–819. doi: 10.1111/nph.16927
Chen, Y.-J., Schnitzer, S. A., Zhang, Y.-J., Fan, Z.-X., Goldstein, G., Tomlinson, K. W., et al. (2017). Physiological regulation and efficient xylem water transport regulate diurnal water and carbon balances of tropical lianas. Funct. Ecol. 31, 306–317.
Choat, B., Brodribb, T. J., Brodersen, C. R., Duursma, R. A., López, R., and Medlyn, B. E. (2018). Triggers of tree mortality under drought. Nature 558, 531–539. doi: 10.1038/s41586-018-0240-x
Cosme, L. H. M., Schietti, J., Costa, F. R. C., and Oliveira, R. S. (2017). The importance of hydraulic architecture to the distribution patterns of trees in a central Amazonian forest. New Phytol. 215, 113–125. doi: 10.1111/nph.14508
De Baerdemaeker, N. J. F., Stock, M., Van den Bulcke, J., De Baets, B., Van Hoorebeke, L., and Steppe, K. (2019a). X-ray microtomography and linear discriminant analysis enable detection of embolism-related acoustic emissions. Plant. Methods 15:153. doi: 10.1186/s13007-019-0543-4
De Baerdemaeker, Niels, J. F., Arachchige, K. N. R., Zinkernagel, J., Van den Bulcke, J., Van Acker, J., et al. (2019b). The stability enigma of hydraulic vulnerability curves: addressing the link between hydraulic conductivity and drought-induced embolism. Tree Physiol. 39, 1646–1664. doi: 10.1093/treephys/tpz078
De Guzman, M. E., Acosta-Rangel, A., Winter, K., Meinzer, F. C., Bonal, D., and Santiago, L. S. (2021). Hydraulic traits of Neotropical canopy liana and tree species across a broad range of wood density: implications for predicting drought mortality with models. Tree Physiol. 41, 24–34. doi: 10.1093/treephys/tpaa106
De Guzman, M. E., Santiago, L. S., Schnitzer, S. A., and Álvarez-Cansino, L. (2017). Trade-offs between water transport capacity and drought resistance in neotropical canopy liana and tree species. Tree Physiol. 37, 1404–1414. doi: 10.1093/treephys/tpw086
di Porcia e Brugnera, M., Meunier, F., Longo, M., Moorthy, S. M. K., Deurwaerder, H. D., Schnitzer, S. A., et al. (2019). Modeling the impact of liana infestation on the demography and carbon cycle of tropical forests. Glob. Change Biol. 25, 3767–3780. doi: 10.1111/gcb.14769
Dirzo, R., and Raven, P. H. (2003). Global State of Biodiversity and Loss. Annu. Rev. Environ. Resour. 28, 137–167.
Ewers, F. W., and Fisher, J. B. (1989). Techniques for Measuring Vessel Lengths and Diameters in Stems of Woody Plants. Am. J. Bot. 76, 645–656.
Ewers, F. W., Fisher, J. B., and Chiu, S.-T. (1990). A survey of vessel dimensions in stems of tropical lianas and other growth forms. Oecologia 84, 544–552. doi: 10.1007/BF00328172
Fu, P.-L., Jiang, Y.-J., Wang, A.-Y., Brodribb, T. J., Zhang, J.-L., Zhu, S.-D., et al. (2012). Stem hydraulic traits and leaf water-stress tolerance are co-ordinated with the leaf phenology of angiosperm trees in an Asian tropical dry karst forest. Ann. Bot. 110, 189–199. doi: 10.1093/aob/mcs092
Gentry, A. H. (1992). “The distribution and evolution of climbing plants,” in The Biology of Vines, eds F. E. Putz and H. A. Mooney (Cambridge: Cambridge University Press), 3–50. doi: 10.1017/CBO9780511897658.003
Gorel, A.-P., Steppe, K., Beeckman, H., De Baerdemaeker, N. J. F., Doucet, J.-L., Ligot, G., et al. (2019). Testing the divergent adaptation of two congeneric tree species on a rainfall gradient using eco-physio-morphological traits. Biotropica 51, 364–377.
Ichihashi, R., Chiu, C.-W., Komatsu, H., Kume, T., Shinohara, Y., Tateishi, M., et al. (2017). Contribution of lianas to community-level canopy transpiration in a warm-temperate forest. Funct. Ecol. 31, 1690–1699. doi: 10.1111/1365-2435.12881
Ingwell, L. L., Wright, S. J., Becklund, K. K., Hubbell, S. P., and Schnitzer, S. A. (2010). The impact of lianas on 10 years of tree growth and mortality on Barro Colorado Island. Panama. J. Ecol. 98, 879–887. doi: 10.1111/j.1365-2745.2010.01676.x
Lopez, O. R., Kursar, T. A., Cochard, H., and Tyree, M. T. (2005). Interspecific variation in xylem vulnerability to cavitation among tropical tree and shrub species. Tree Physiol. 25, 1553–1562. doi: 10.1093/treephys/25.12.1553
Manzoni, S., Vico, G., Katul, G., Palmroth, S., Jackson, R. B., and Porporato, A. (2013). Hydraulic limits on maximum plant transpiration and the emergence of the safety–efficiency trade-off. New Phytol. 198, 169–178. doi: 10.1111/nph.12126
McDowell, N., Pockman, W. T., Allen, C. D., Breshears, D. D., Cobb, N., Kolb, T., et al. (2008). Mechanisms of plant survival and mortality during drought: why do some plants survive while others succumb to drought? New Phytol. 178, 719–739. doi: 10.1111/j.1469-8137.2008.02436.x
Medina-Vega, J. A., Bongers, F., Schnitzer, S. A., and Sterck, F. J. (2021). Lianas explore the forest canopy more effectively than trees under drier conditions. Funct. Ecol. 35, 318–329.
Meinzer, F. C., Johnson, D. M., Lachenbruch, B., McCulloh, K. A., and Woodruff, D. R. (2009). Xylem hydraulic safety margins in woody plants: coordination of stomatal control of xylem tension with hydraulic capacitance. Funct. Ecol. 23, 922–930.
Meunier, F., Krishna Moorthy, S. M., De Deurwaerder, H. P. T., Kreus, R., Van den Bulcke, J., Lehnebach, R., et al. (2020). Within-Site Variability of Liana Wood Anatomical Traits: A Case Study in Laussat. French Guiana. Forests 11:523.
Miles, L., Newton, A. C., DeFries, R. S., Ravilious, C., May, I., Blyth, S., et al. (2006). A global overview of the conservation status of tropical dry forests. J. Biogeogr. 33, 491–505.
Nolf, M., Beikircher, B., Rosner, S., Nolf, A., and Mayr, S. (2015a). Xylem cavitation resistance can be estimated based on time-dependent rate of acoustic emissions. New Phytol. 208, 625–632. doi: 10.1111/nph.13476
Nolf, M., Creek, D., Duursma, R., Holtum, J., Mayr, S., and Choat, B. (2015b). Stem and leaf hydraulic properties are finely coordinated in three tropical rain forest tree species. Plant Cell Environ. 38, 2652–2661. doi: 10.1111/pce.12581
Pammenter, N. W., and Van der Willigen, C. (1998). A mathematical and statistical analysis of the curves illustrating vulnerability of xylem to cavitation. Tree Physiol. 18, 589–593. doi: 10.1093/treephys/18.8-9.589
Pan, Y., Birdsey, R. A., Fang, J., Houghton, R., Kauppi, P. E., Kurz, W. A., et al. (2011). A Large and Persistent Carbon Sink in the World’s Forests. Science 333, 988–993. doi: 10.1126/science.1201609
Phillips, O. L., Vásquez Martínez, R., Arroyo, L., Baker, T. R., Killeen, T., Lewis, S. L., et al. (2002). Increasing dominance of large lianas in Amazonian forests. Nature 418, 770–774. doi: 10.1038/nature00926
Pinheiro, J., Bates, D., DebRoy, S., Sarkar, D., and R CoreTeam. (2013). nlme: Linear and Nonlinear Mixed Effects Models.Vienna, Aus;R Foundation for Statistical Computing
Powers, J. S., Vargas, G. G., Brodribb, T. J., Schwartz, N. B., Pérez-Aviles, D., Smith-Martin, C. M., et al. (2020). A catastrophic tropical drought kills hydraulically vulnerable tree species. Glob. Change Biol. 26, 3122–3133. doi: 10.1111/gcb.15037
Sack, L., and Scoffoni, C. (2012). Measurement of leaf hydraulic conductance and stomatal conductance and their responses to irradiance and dehydration using the Evaporative Flux Method (EFM). J. Vis. Exp.70, 4179. doi: 10.3791/4179
Sánchez-Azofeifa, G. A., Quesada, M., Rodríguez, J. P., Nassar, J. M., Stoner, K. E., Castillo, A., et al. (2005). Research Priorities for Neotropical Dry Forests1. Biotropica 37, 477–485.
Schindelin, J., Arganda-Carreras, I., Frise, E., Kaynig, V., Longair, M., Pietzsch, T., et al. (2012). Fiji: an open-source platform for biological-image analysis. Nat. Methods 9, 676–682. doi: 10.1038/nmeth.2019
Schnitzer, S., and Bongers, F. (2002). The Ecology of Lianas and Their Role in Forests. Trends Ecol. Evol. 17, 223–230.
Schnitzer, S. A. (2005). A Mechanistic Explanation for Global Patterns of Liana Abundance and Distribution. Am. Nat. 166, 262–276. doi: 10.1086/431250
Schnitzer, S. A. (2015). “Increasing liana abundance in neotropical forests: causes and consequences,” in Ecology of Lianas, eds A. S. Stefan, F. Bongers, J. B. Robyn, and E. P. Francis (Hoboken, NJ: John Wiley & Sons, Ltd), 451–464. doi: 10.1002/9781118392409.ch30
Schnitzer, S. A. (2018). Testing ecological theory with lianas. New Phytol. 220, 366–380. doi: 10.1111/nph.15431
Schnitzer, S. A., and van der Heijden, G. M. F. (2019). Lianas have a seasonal growth advantage over co-occurring trees. Ecology 100:e02655. doi: 10.1002/ecy.2655
Scoffoni, C., McKown, A. D., Rawls, M., and Sack, L. (2012). Dynamics of leaf hydraulic conductance with water status: quantification and analysis of species differences under steady state. J. Exp. Bot. 63, 643–658. doi: 10.1093/jxb/err270
Skelton, R., and Diaz, J. (2020). Quantifying losses of plant hydraulic function: seeing the forest, the trees and the xylem. Tree Physiol. 40, 285–289. doi: 10.1093/treephys/tpz141
Smith-Martin, C. M., Bastos, C. L., Lopez, O. R., Powers, J. S., and Schnitzer, S. A. (2019). Effects of dry-season irrigation on leaf physiology and biomass allocation in tropical lianas and trees. Ecology 100:e02827. doi: 10.1002/ecy.2827
Smith-Martin, C. M., Xu, X., Medvigy, D., Schnitzer, S. A., and Powers, J. S. (2020). Allometric scaling laws linking biomass and rooting depth vary across ontogeny and functional groups in tropical dry forest lianas and trees. New Phytol. 226, 714–726. doi: 10.1111/nph.16275
Steppe, K., Aggelis, D. G., and Grosse, C. U. (2022). “AE in Biological Materials,” in Acoustic Emission Testing: Basics for Research – Applications in Engineering, eds C. U. Grosse, M. Ohtsu, D. G. Aggelis, and T. Shiotani (Cham: Springer Tracts in Civil Engineering. Springer International Publishing), 583–619. doi: 10.1007/978-3-030-67936-1_20
Sterck, F., Markesteijn, L., Schieving, F., and Poorter, L. (2011). Functional traits determine trade-offs and niches in a tropical forest community. Proc. Natl. Acad. Sci. 108, 20627–20632. doi: 10.1073/pnas.1106950108
Tan, F.-S., Song, H.-Q., Fu, P.-L., Chen, Y.-J., Siddiq, Z., Cao, K.-F., et al. (2020). Hydraulic safety margins of co-occurring woody plants in a tropical karst forest experiencing frequent extreme droughts. Agric. For. Meteorol. 292-293:108107.
Tardieu, F., and Simonneau, T. (1998). Variability among species of stomatal control under fluctuating soil water status and evaporative demand: modelling isohydric and anisohydric behaviours. J. Exp. Bot. 49, 419–432.
Trenberth, K. E., Dai, A., van der Schrier, G., Jones, P. D., Barichivich, J., Briffa, K. R., et al. (2014). Global warming and changes in drought. Nat. Clim. Change 4, 17–22.
Trifilò, P., Raimondo, F., Lo Gullo, M. A., Barbera, P. M., Salleo, S., and Nardini, A. (2014). Relax and refill: xylem rehydration prior to hydraulic measurements favours embolism repair in stems and generates artificially low PLC values. Plant Cell Environ. 37, 2491–2499. doi: 10.1111/pce.12313
van der Heijden, G. M. F., Powers, J. S., and Schnitzer, S. A. (2015). Lianas reduce carbon accumulation and storage in tropical forests. Proc. Natl. Acad. Sci. 112, 13267–13271. doi: 10.1073/pnas.1504869112
van der Sande, M. T., Poorter, L., Schnitzer, S. A., Engelbrecht, B. M. J., and Markesteijn, L. (2019). The hydraulic efficiency–safety trade-off differs between lianas and trees. Ecology 100:e02666. doi: 10.1002/ecy.2666
Venturas, M. D., Pratt, R. B., Jacobsen, A. L., Castro, V., Fickle, J. C., and Hacke, U. G. (2019). Direct comparison of four methods to construct xylem vulnerability curves: Differences among techniques are linked to vessel network characteristics. Plant Cell Environ. 42, 2422–2436. doi: 10.1111/pce.13565
Venturas, M. D., Sperry, J. S., and Hacke, U. G. (2017). Plant xylem hydraulics: What we understand, current research, and future challenges. J. Integr. Plant Biol. 59, 356–389. doi: 10.1111/jipb.12534
Vergeynst, L. L., Dierick, M., Bogaerts, J. A. N., Cnudde, V., and Steppe, K. (2015). Cavitation: a blessing in disguise? New method to establish vulnerability curves and assess hydraulic capacitance of woody tissues. Tree Physiol. 35, 400–409. doi: 10.1093/treephys/tpu056
Vergeynst, L. L., Sause, M. G. R., De Baerdemaeker, N. J. F., De Roo, L., and Steppe, K. (2016). Clustering reveals cavitation-related acoustic emission signals from dehydrating branches. Tree Physiol. 36, 786–796. doi: 10.1093/treephys/tpw023
Werden, L. K., Waring, B. G., Smith-Martin, C. M., and Powers, J. S. (2018). Tropical dry forest trees and lianas differ in leaf economic spectrum traits but have overlapping water-use strategies. Tree Physiol. 38, 517–530. doi: 10.1093/treephys/tpx135
Zhu, S.-D., and Cao, K.-F. (2009). Hydraulic properties and photosynthetic rates in co-occurring lianas and trees in a seasonal tropical rainforest in southwestern China. Plant Ecol. 204, 295–304.
Zhu, S.-D., Liu, H., Xu, Q.-Y., Cao, K.-F., and Ye, Q. (2016). Are leaves more vulnerable to cavitation than branches? Funct. Ecol. 30, 1740–1744.
Keywords: drought tolerance, lianas, tropical dry forest, vulnerability to embolism, optical vulnerability, acoustic vulnerability
Citation: Coppieters K, Verbeeck H, Dequeker S, Powers JS, Vargas G. G, Smith-Martin CM, Steppe K and Meunier F (2022) Two Co-occurring Liana Species Strongly Differ in Their Hydraulic Traits in a Water-Limited Neotropical Forest. Front. For. Glob. Change 5:836711. doi: 10.3389/ffgc.2022.836711
Received: 15 December 2021; Accepted: 31 January 2022;
Published: 25 February 2022.
Edited by:
Nobuo Imai, Tokyo University of Agriculture, JapanReviewed by:
Zafar Siddiq, Government College University, Lahore, PakistanShidan Zhu, Guangxi University, China
Copyright © 2022 Coppieters, Verbeeck, Dequeker, Powers, Vargas G., Smith-Martin, Steppe and Meunier. This is an open-access article distributed under the terms of the Creative Commons Attribution License (CC BY). The use, distribution or reproduction in other forums is permitted, provided the original author(s) and the copyright owner(s) are credited and that the original publication in this journal is cited, in accordance with accepted academic practice. No use, distribution or reproduction is permitted which does not comply with these terms.
*Correspondence: Kasper Coppieters, a2FzcGVyLmNvcHBpZXRlcnNAVUdlbnQuYmU=