 Mariana Murakami
 Flavio Nunes Ramos2
 Maxime Durand
 Sven P. Batke
95% of researchers rate our articles as excellent or good
Learn more about the work of our research integrity team to safeguard the quality of each article we publish.
Find out more
ORIGINAL RESEARCH article
Front. For. Glob. Change , 31 March 2022
Sec. Forest Ecophysiology
Volume 5 - 2022 | https://doi.org/10.3389/ffgc.2022.828725
This article is part of the Research Topic Living Far From the Ground: Strategies of Forest Epiphytes View all 10 articles
Forest canopies are incredibly complex self-maintaining biological structures. Conditions above and within the canopy can differ vastly, often resulting in a vertical gradient of microclimate conditions. Canopy epiphytic plants have to deal with climatic variability on much more variable scales compared to many other plant groups. The difficulty of sensor installation and their high cost can explain why it has been ignored in many studies on canopy epiphytes. Direct measurements of microenvironmental conditions are the only accurate way to assess specific intra-canopy environmental conditions, as there is also still a lack of methodologically and financially viable alternatives to allow the collection of this type of data. This study aims to make recommendations for the direct use of microclimate measurements in epiphyte research and to summarize key discussion points concerning the number and placement of sensors required for different types of epiphyte studies. In addition, we presented high-resolution field data from the United Kingdom, where we employed over 56 microclimate sensors, to demonstrate the spatial and temporal variability of radiation, temperature, and relative humidity (RH) in a tree canopy. Our data demonstrated that sensor height in the tree and leaf-set were the most important factors determining microclimate variability in the canopy. For the first time, we have made recommendations regarding the placement and number of sensors required in studies that specifically require the use of microclimate sensors in epiphyte studies in forest canopies.
Forest canopies are the assemblage of all branches, foliage, the interconnecting space between them and their flora and fauna (Parker, 1995; Moffett, 2000; Nadkarni et al., 2004). The stratification of forest canopies and their inherent variability and complexity often results in a vertical stratification of microclimate conditions (e.g., radiation, temperature, and relative air humidity) and the associated differences in the distribution of canopy organisms (Foggo et al., 2001; Ozanne et al., 2003). It has been shown that canopies are incredible biodiversity hotspots (Nakamura et al., 2017). Forest canopies support about 40% of all living species, of which 10% are thought to be canopy specialists (Ozanne et al., 2003). For example, 10% of all known vascular plants have been estimated to be epiphytes (Zotz et al., 2021).
High variation in canopy conditions and its structural complexity have been shown to drive high species richness in forest canopies (Ozanne et al., 2003). The distribution of epiphytes within the canopy is believed to be to some extent driven by microclimate differences. For example, the lower canopy in many tropical forests is often dominated by large-leaved species that allows plants to capture radiation more efficiently. Similarly, the outer canopy is often dominated by more drought tolerant and atmospheric species. For some species (e.g., many filmy ferns), their high levels of specialization, can make them very susceptible to change in the environment, whereas other species are well adapted to withstand large changes (e.g., many bromeliads). Microclimatic conditions in vertically layered vegetation are directly regulated by radiation (Leuchner et al., 2012; Zellweger, 2019; Brüllhardt et al., 2020) intensifying or attenuating temperature and water availability including relative humidity (Baldocchi et al., 2000). Concerning spatial variation, radiation within a tree crown can be modified by structural crown features (Ventre-Lespiaucq et al., 2016) such as branch distribution patterns and orientation, as well as the presence, shape, or absence of leaves.
In forest ecosystems, the changes in the energy balance as a consequence of canopy architecture (e.g., canopy height, density, etc.), plant transpiration, and climate conditions (Song et al., 2017; Pau et al., 2018; de Andrade et al., 2021) results in within canopy temperatures and relative humidity levels to be markedly different from conditions outside the canopy (Jones, 1992; Pau et al., 2018). This buffering effect of the upper canopy on lower branches has prominent importance both over short and long-time scales. Over a shorter period, the buffering can drive temperatures to increase less during the day and decrease less during the night, while relative humidity often shows the reverse pattern (Aussenac, 2000; Von Arx et al., 2012; Prévosto et al., 2020). Over longer periods the buffering of the canopy produces lower annual and seasonal maximum temperatures, with higher recorded minimum temperatures and relative air humidity (Renaud et al., 2011; Gaudio et al., 2017; Prévosto et al., 2020). As incident solar radiation is selectively absorbed by leaves (Endler, 1993; Hartikainen et al., 2020), light properties (e.g., quantity and the spectrum) are modified as light reaches the lower layers of the tree crown. When light is intercepted by the canopy, the proportion of diffuse radiation increases, and, on the other hand, the proportion of direct radiation received decreases (Ventre-Lespiaucq et al., 2016). In several forest types, less than 2% of the photosynthetically active radiation (PAR) incident above the canopy may actually reach the forest floor (Chazdon and Pearcy, 1991).
It is important to highlight that radiation patterns change spatially and temporally, according to time of day, season, latitude, cardinal orientation, the position of the tree within the stand, and the architectural features of the canopy. In addition, gaps in the tree crown can increase the crown’s heterogeneity as they allow direct sunlight to penetrate it, causing sunflecks that can move along the canopy depending on the sun’s position (Chazdon and Pearcy, 1991). Within sunflecks, the radiation intensity can be 10 to 100 times higher than in the shade (Wagner and McGraw, 2013) and may account for 10-90% of the daily amount of radiation in forest canopies (Chazdon et al., 1988; Pfitsch and Pearcy, 1989) and up to 50% of the daily amount of radiation in the understory (Chazdon and Pearcy, 1991). Thus, canopy organisms deal with climatic variability on much sharper scales than it is generally measured by local meteorological stations that only measure above canopy conditions (Geiger et al., 1995; Potter et al., 2013; Kovács et al., 2020).
Frequently in canopy studies, below-canopy radiation is estimated by quantifying canopy traits, in terms of cover and canopy openness (Jennings et al., 1999; Lieffers et al., 1999; Zellweger et al., 2019). Although canopy openness, compared to cover, is a more accurate representation for below canopy radiation conditions (Alexander et al., 2013), both approaches can be used to estimate functional variables commonly used such as Leaf Area Index (LAI) (Binkley et al., 2013; Schleppi and Paquette, 2017; Zellweger, 2019). These approaches, however, can be unreliable, as they can be time-consuming and ineffective for mapping radiation regimes at high resolution across the canopy (Zellweger, 2019). This last point specifically might not represent a major issue for studies seeking to answer questions related to broad within-canopy conditions (e.g., open vs. closed canopy). However, for studies that require a more detailed account of the conditions within the canopy (e.g., physiological studies on epiphytes), more precise methods are needed (Gendron et al., 1998). Similarly, canopy temperature and relative humidity have been measured using approaches that rarely cover all canopy sections (e.g., along the vertical profile). Currently, the experimental designs used in studies to measure microenvironmental conditions have been diverse and range from sensors placed vertically along towers (e.g., Feigenwinter et al., 2010) to sensors placed vertically on the trunks of trees (e.g., Rambo and North, 2009), to sensors placed both above the canopy and in the understory (e.g., Phillips et al., 1999; Gotsch et al., 2015; Tymen et al., 2017; Parker et al., 2019). Alternative approaches to sensors include the use of RATP (radiation absorption, transpiration and photosynthesis) models, which simulate the spatial distribution of radiation and leaf-gas exchange within canopies as a function of canopy structure, canopy microclimate and physical and physiological leaf properties (Sinoquet et al., 2001). These models can provide high resolution of the microclimate data from within the tree canopy. However, the difficulty of parameterizing them has made the use of these difficult and costly.
Few field studies on epiphytes have used sensors to obtain direct measurements of the intra-canopy microclimatic parameters. For example, Sillett and Van Pelt (2007) used radiation and temperature sensors to study vascular epiphyte on Sequoia sempervirens Endl. in California. In particular, they were interested in assessing how epiphytes and their substrates can modify intra-canopy microclimates. Another example is the study by Rascher et al. (2012), who used temperature and radiation sensors to investigate differences in physiological responses of epiphytes. Our study, therefore, prompted by the understanding that direct measurements of microenvironmental conditions are the only uncontroversial way to assess the specific intra-canopy environment and that it is essential to build not only financially, but also methodologically viable alternatives to encourage this type of measurement in canopy research. In order to improve our understanding of the variability of microclimate conditions within forest canopies, we deployed an array of radiation, temperature, and relative humidity sensors in a forest canopy in the United Kingdom. Our research questions were: (1) How do microclimate conditions change within a tree canopy?; (2) Does the microclimate variability differ in the same tree before and after leaf-set?; (3) How many microclimate sensors are needed to capture variability of microclimate conditions in one forest tree? Answering these questions will allow us to provide recommendations for vascular epiphyte studies that aim to assess direct microclimate measurements and we will bring together key discussion points concerning the number and placement of sensors required for different types of epiphyte studies.
This study was carried out at Scutcher Acres (53.5617306, −2.8679865), a 13-hectare Local Nature Reserve in West Lancashire, United Kingdom. Elevation of the site was 25 m a.s.l. The site has a history of rural land use and is currently under forest restoration. In 1997 the land was bought by its current owner to enhance its value for wildlife. Many of the trees were planted over the last few years and the forest is currently a mosaic of well-established oak (Quercus sp.) and European beech (Fagus sylvatica L.) trees and smaller stands of oak, Pinus spp., and mixed native and non-native trees. The understory is thin and composed of some shrubs and young trees, with a well-established herbaceous layer mostly formed by bluebells (Hyacinthoides hispanica (Mill.) Rothm.) and brambles (Rubus fruticosus Pollich). The canopy trees in our study area were between 20 and 25 m tall, forming a predominantly continuous canopy. For this study, due to the number of sensors needed for a detailed canopy study, and their prices (very expensive), we selected only one European beech tree (F. sylvatica). The tree was selected based on a) its dominant size in the area, and b) being a representative species of the canopy in the study site, and a species commonly found in United Kingdom woodlands. In addition, being a deciduous species, F. sylvatica allowed us to sample microclimatic conditions over a period from leaf-out to full leaf development, an important element accounting for spatial and temporal variation of canopy conditions (Jones, 2013; Wen et al., 2020). The array of sensors was installed in the selected tree on April 26th 2020, and kept in the canopy for 45 days. The leaves on the tree were fully developed by May 11th and data collection extended until June 10th. Thus, in this study, we considered 27th April to May 10th as the leaf-out phase and May 11th to June 10th as the foliaged phase.
In order to measure canopy microclimate conditions for the first time at a very high spatial resolution, we equipped the selected tree with 40 temperature/relative humidity sensors (EA EL-USB-2 Temperature & Relative Humidity USB Data Logger – Lascar Electronics Ltd., United Kingdom, typically < ± 3% of accuracy), 15 pyranometers (SKS 1110/I Pyranometer sensors - Skye Instruments Ltd., United Kingdom typically < ± 3% of accuracy, wavelength 400-1100 nm), and one PAR (photosynthetically active radiation) sensor (SKE 510/I – Skye Instruments Ltd., United Kingdom typical calibration error < 3%). The PAR sensor was calibrated against a reference lamp of known output and pyranometers were calibrated under open-sky conditions, against reference pyranometers. Pyranometers and PAR sensors were connected to two data loggers (SDL 5400 – 8 channel DataHog2 Skye Instruments Ltd., United Kingdom) to store all readings. Radiation measurements were logged for 10 s, every 6 h, while temperature and relative humidity sensors logged at 30-min intervals. The intervals were selected because smaller intervals would have filled up the memory too quickly when employed for longer under field conditions (see discussion for further detail).
The canopy was accessed using rope climbing techniques that allowed direct access to the upper canopy without the use of ‘high-tech’ and financially more costly methods (Picart et al., 2014). The installation of the sensors took two full days. We placed the sensors in positions that were believed to represent the variability in microclimate conditions within the tree. In some cases, sensor positioning was limited by accessibility issues. For example, the maximum branch diameter that could safely be accessed was 35 cm. We measured horizontally the distance between each sensor to the center of the tree and vertically to the floor (see Supplementary Table 1) using a tape measure to test the microenvironmental spatial variation within the canopy (Figure 1).
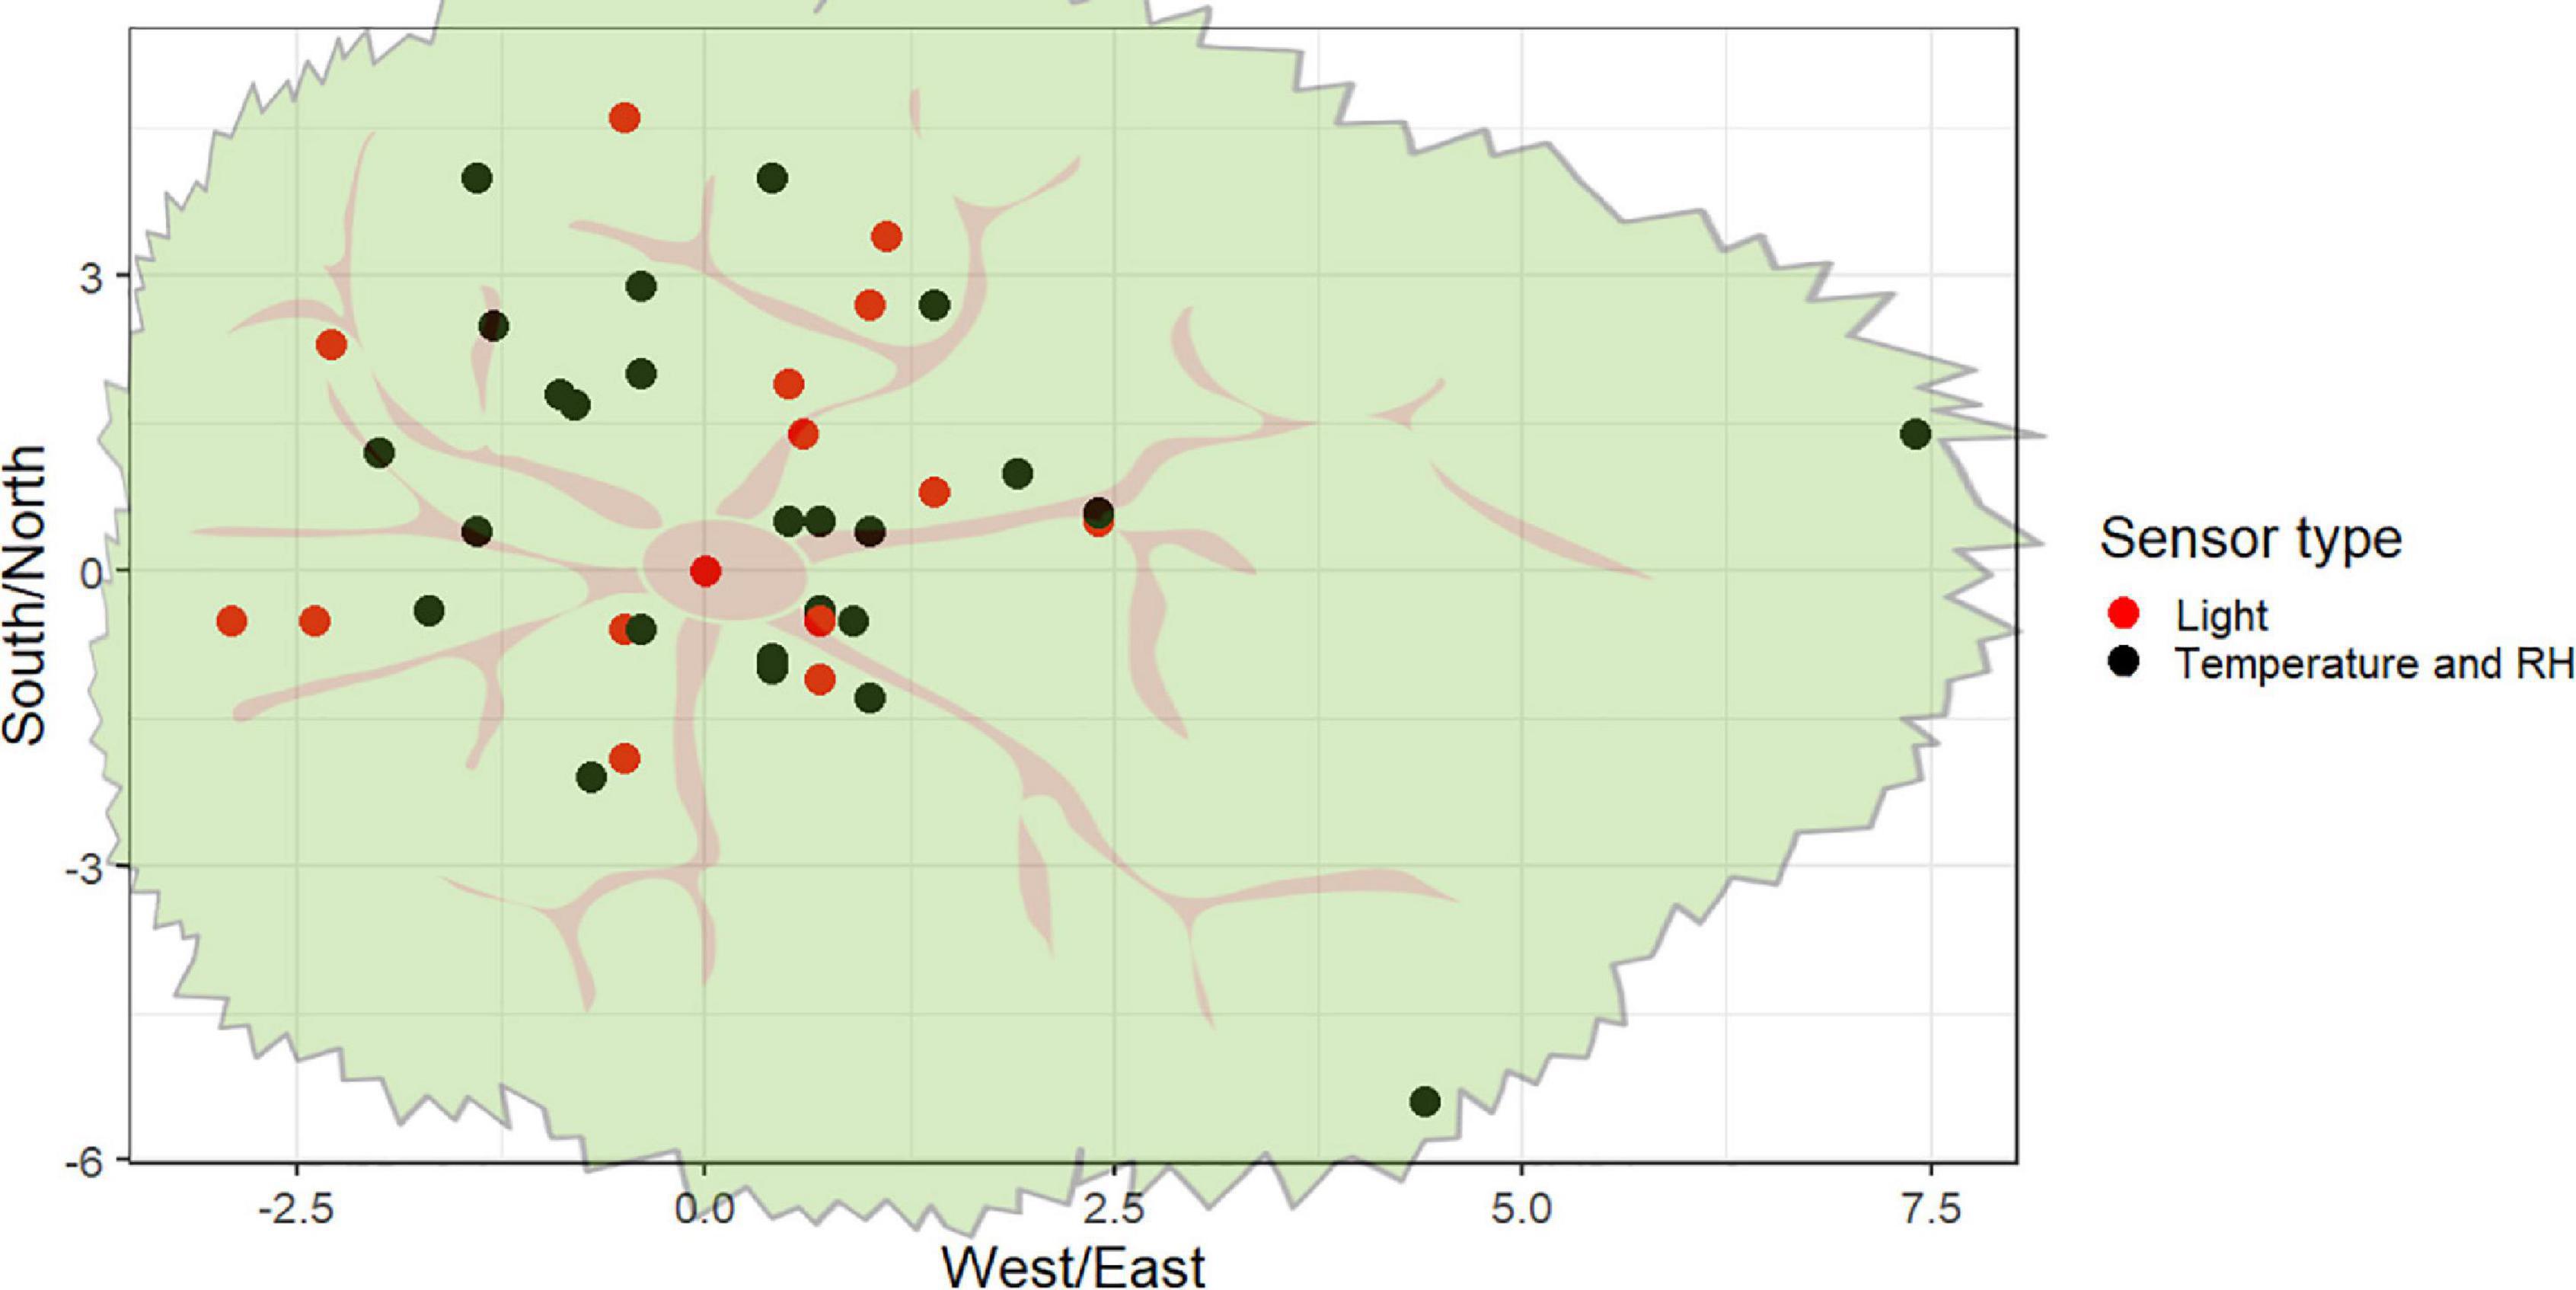
Figure 1. Horizontal distribution of radiation (red dots) and temperature/RH sensors (black dots) within the tree canopy. All radiation sensors had paired temperature sensors coupled to the platforms.
Each individual pyranometer was installed on a 15 × 15 cm wooden platform. The platforms were custom-built and included a spirit level and a plastic bracket that held the sensors in place using silicon screws (Figure 2). Each platform was securely attached to each branch using cable ties and wood screws (Figure 2). It was ensured that each sensor platform was horizontally leveled during installation. Temperature/RH sensors were attached directly to branches with cable ties. Sixteen temperature/RH sensors were directly attached to the pyranometer platforms. The sensor platform’s attachment was visually assessed from the ground every week from its installation until the end of the recording interval. By the end of the collection phase, one of the platforms was slightly unlevelled. After assessing the readings of the sensor and discussing the data with the manufacturer of the sensors, the data was included in all further analyses.
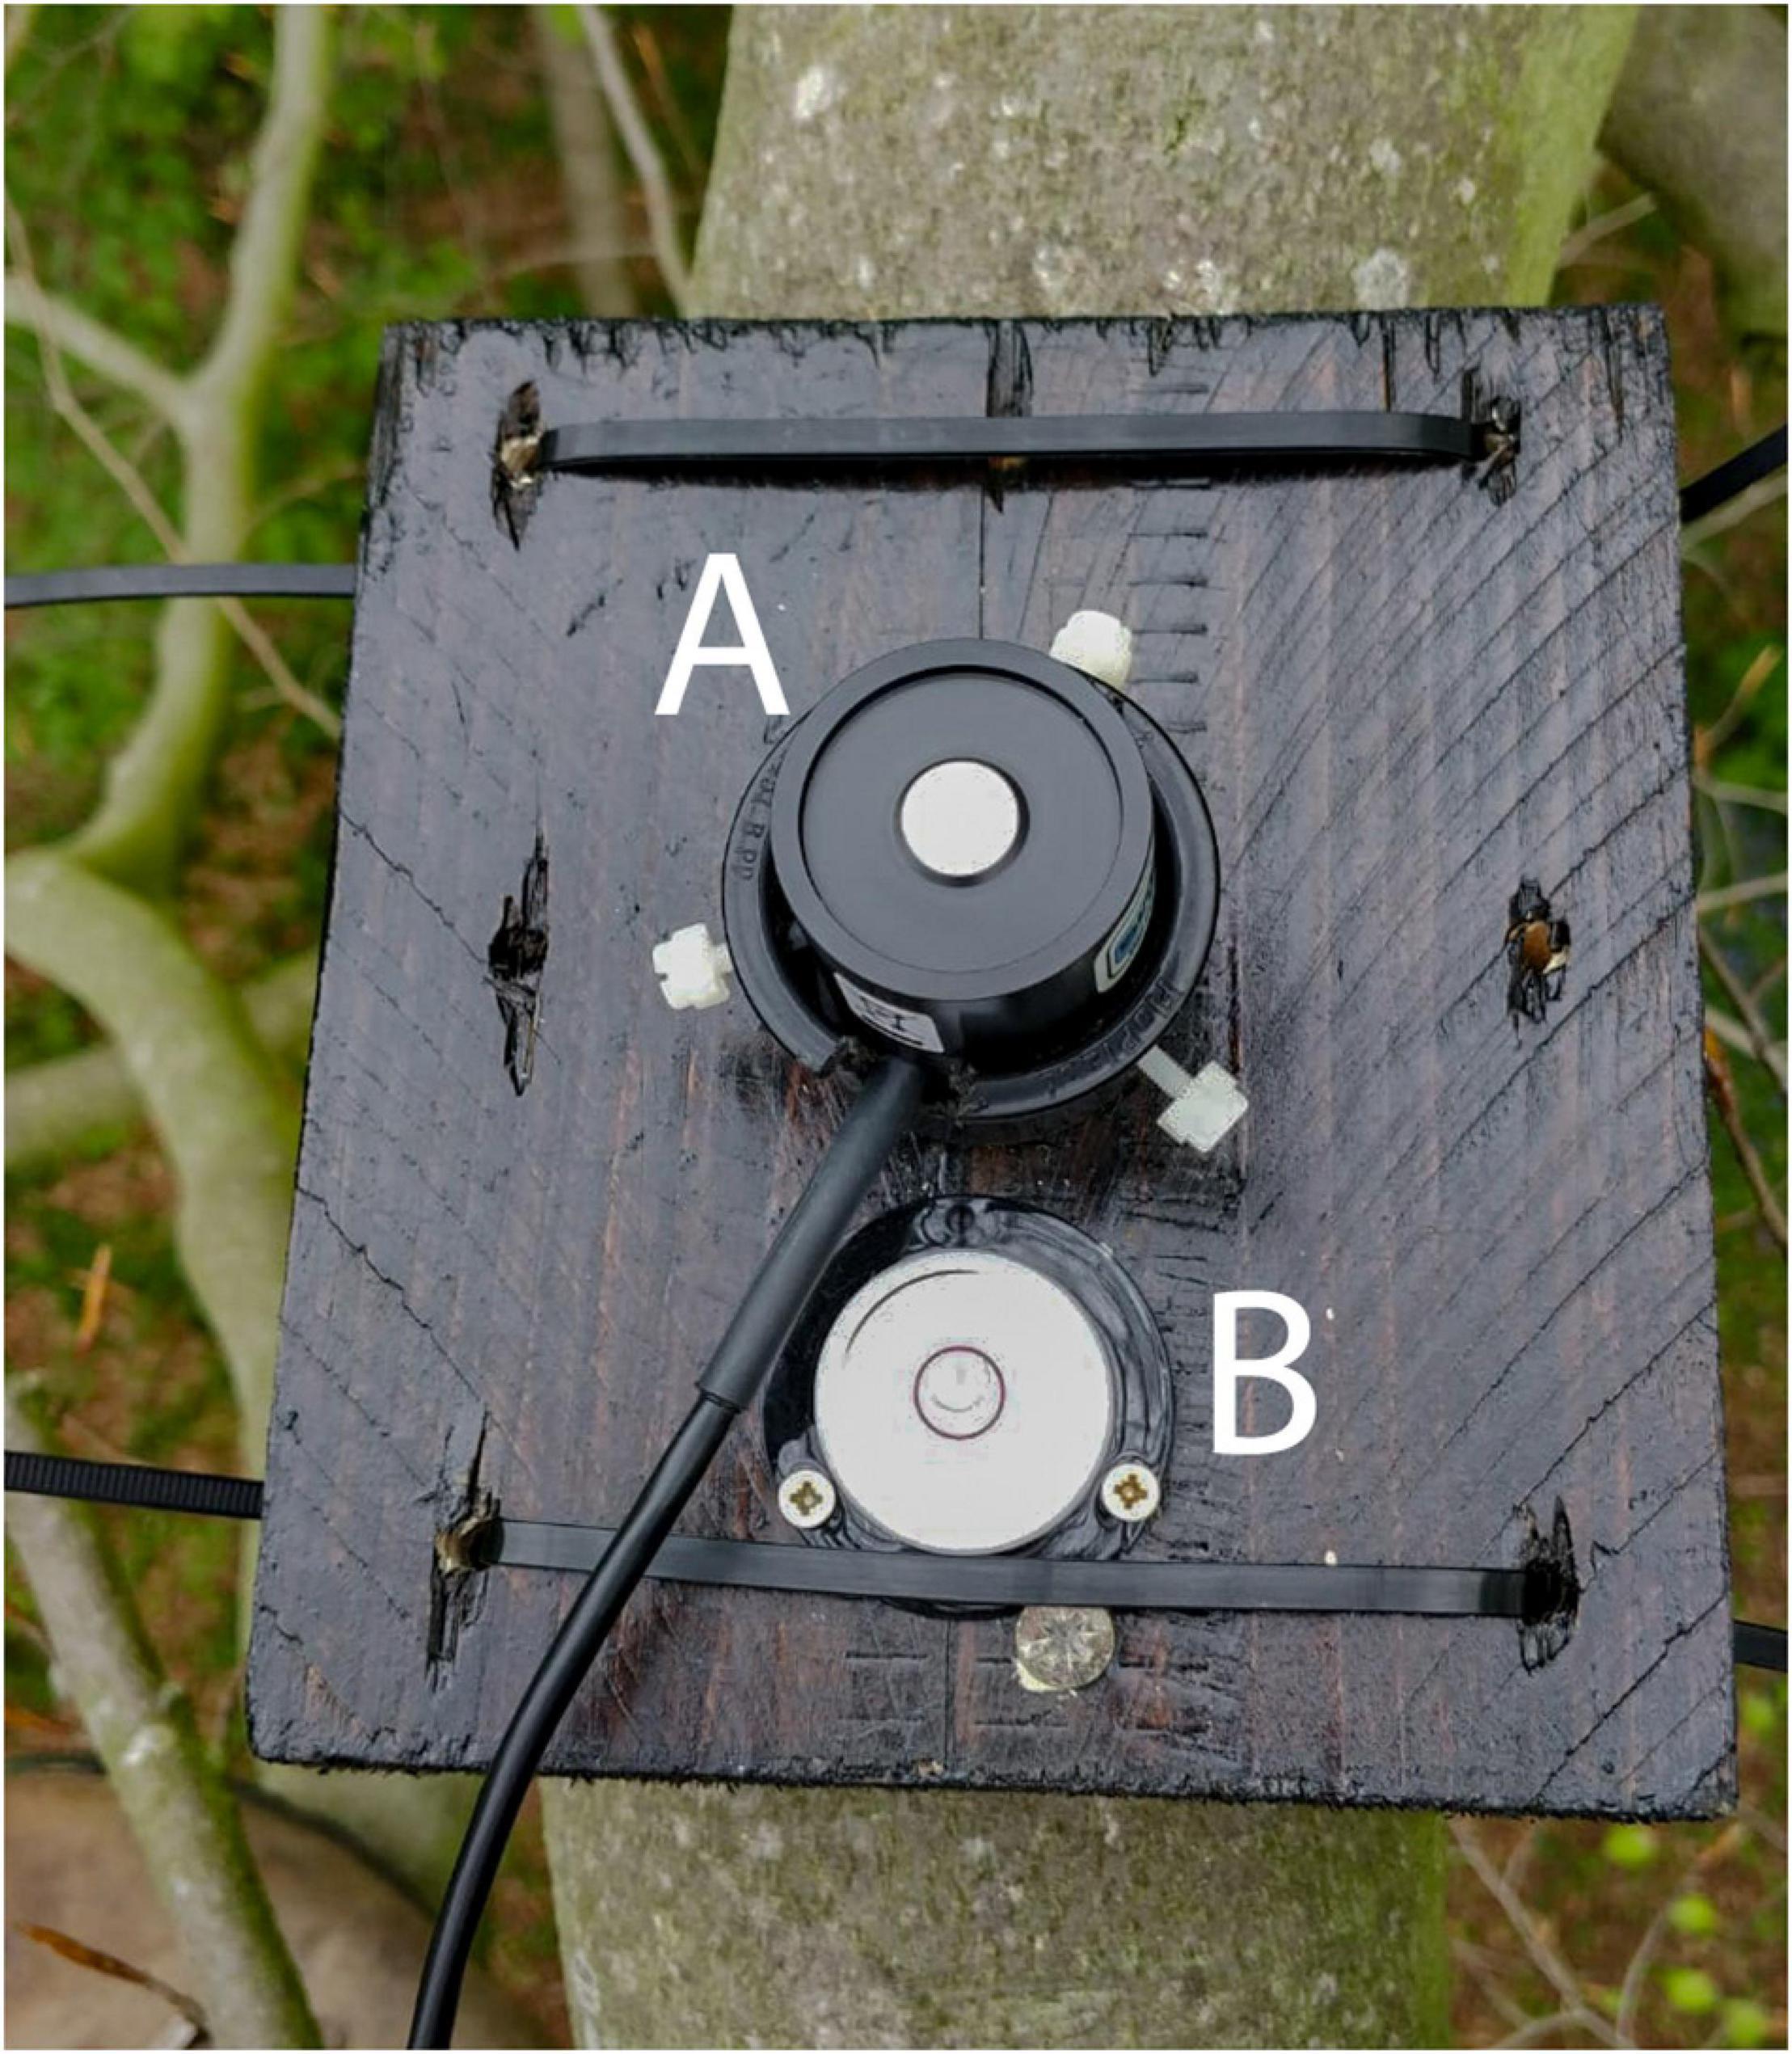
Figure 2. Example of costume-build radiation sensor platform used, showing the pyranometer (A) and a spirit level (B).
Because our temperature sensors were not shielded from direct sunlight, we calculated the relationship between temperature and radiation. We analyzed only the temperature sensors that were paired with radiation sensors during day time and during times when both the light and temperature sensors synchronized their measurements. We tested the correlation separately for the above and within canopy sensors. A moderate correlation was found between radiation and temperature when assessing the above sensors (r = 0.46; p = 5.5-06). However, only a weak correlation was found when assessing the within canopy sensors (r = 0.21, p = 6.4-14). Due to the moderate heat-effect of radiation on the above canopy temperature sensor, we only used within canopy temperature and RH measurements for the remaining analysis (see below for a more detailed discussion).
To identify the most important explanatory variables that affected microclimate conditions within the tree, a random/mixed-effects meta-regression model was used. We used the ‘glmulti’ package in R Core Team, 2020 for this analysis following Anderson (2007). Three meta-models were run, one for radiation, one for temperature, and one for RH. Tree characteristics that were included in the meta-model included leaf-set, sensor height, sensor distance to the tree center, orientation and day- and night-time. Akaike information criterion (AICc) was used to compare models and select the best-fit models. We used multimodal inference to help us to make inferences about our predictors using the “metafor” package. This method takes into consideration the relative weights of each model combination.
To compare in more detail how much each microclimate variable (e.g., radiation, temperature, and RH) was affected by tree height and by the leaf-set, we divided our tree canopy into three equal parts (e.g., 1st third = Lower canopy; 2nd third = Middle canopy; 3rd third = Upper canopy), similar to the zonation model proposed by Johansson (1974) (e.g., Johansson’s zones III, IV, and V). However, unlike the large and emergent trees sampled by Johansson, our tree is located inside a forest stand, surrounded by other trees of similar dimensions. Under such conditions, the radiation that penetrates the crown comes mainly from the top and not from its sides. Moreover, as our mixed effect model suggested that height was the most consistent and important explanatory variable for radiation, temperature, and RH, only vertical height was used to classify the different canopy zones. The sensors positioned within the range of each zone (e.g., 11 m to 14.5 m = Lower canopy; 14.6 m to 18.4 m = Middle canopy; 18.5 m to 22 m = Upper canopy) were used to calculate the mean values of each response variable, for each day, from April 27th to June 10th. The canopy zone classifications were then used to plot density plots of radiation, temperature, and RH, for the leaf-out and foliaged phases.
We also calculated the variance of each response variable captured by each one of the sensors for the leaf-out and the foliaged phases to visualize whether different portions of the canopy experience more variable conditions. We calculated the percent of variance that each sensor captured and plotted the sensors according to their position in the tree canopy (e.g., sensor’s vertical height and horizontal distance to the tree center).
Finally, a Monte Carlo analysis was undertaken to test the change of standard error when reducing or increasing the number of sensors. Firstly we averaged the data by day and secondly by sensor. The analysis was run using 10,000 permutations without replacements. We analyzed the increase of the error when reducing sensors from 15 to five in the model for radiation and 39 to 15 in the models for temperature and RH.
The most important explanatory variable affecting the within-canopy microclimate for all variables was sensor height (Table 1 and Figure 3). In addition, day time and leaf-set were explanatory variables that showed also high importance in the models. For temperature, the cardinal orientation of the sensor on the tree was important, whereas this was not the case for RH or radiation. In general, increased sensor height resulted in higher observed radiation and temperature and lower RH values.
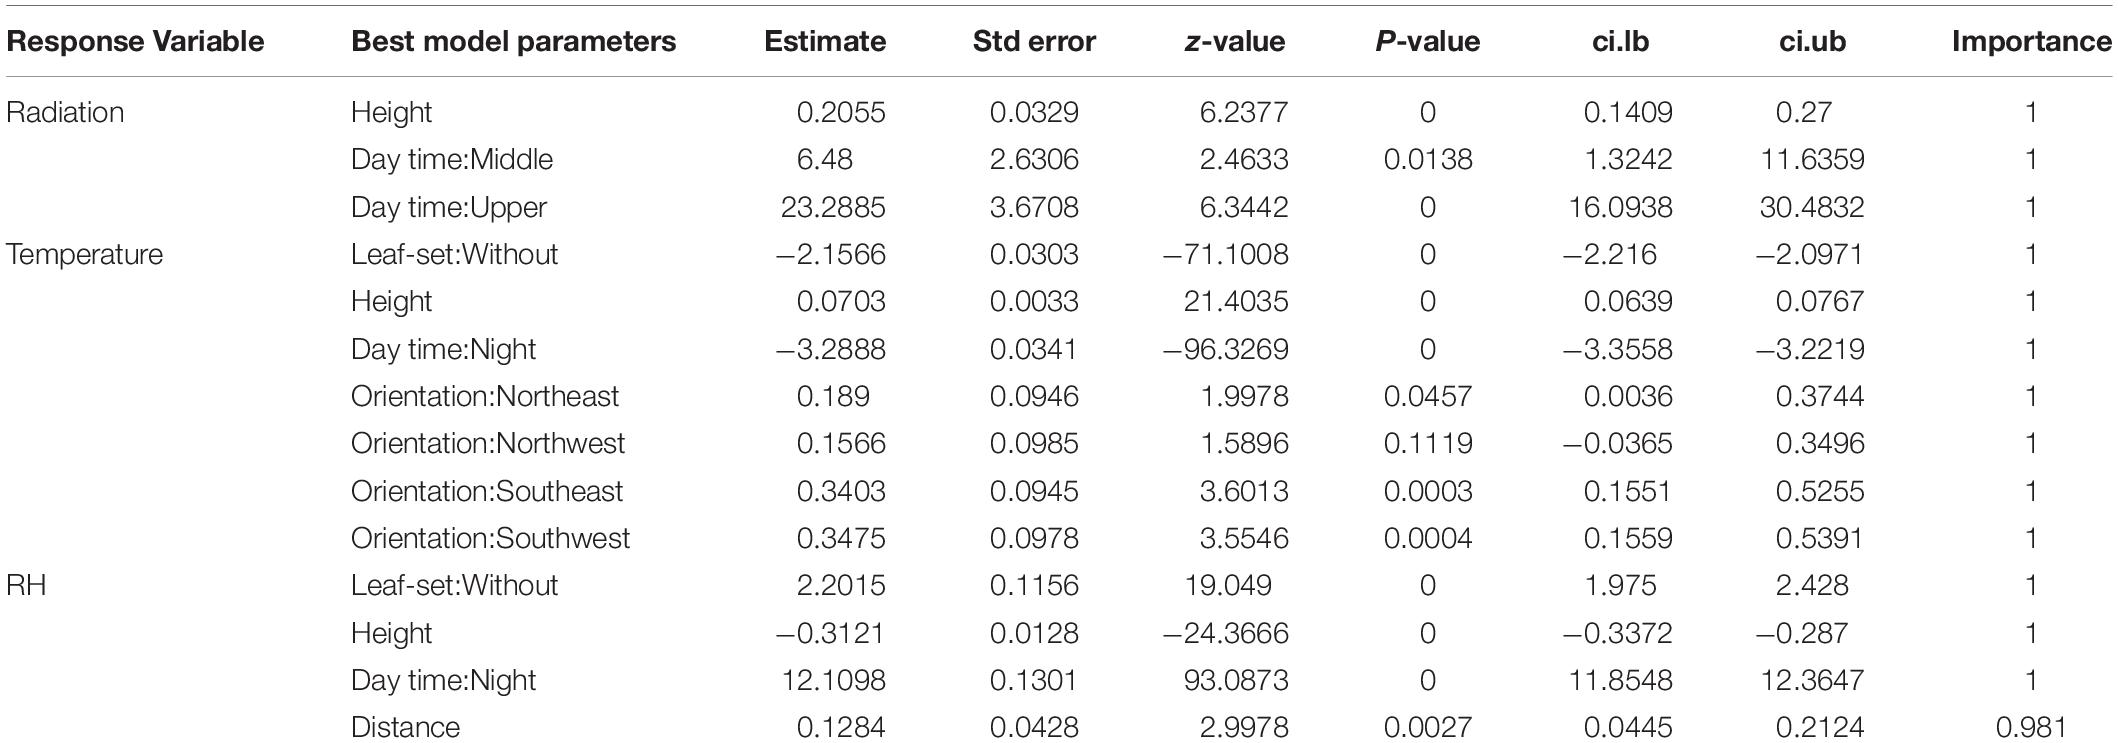
Table 1. Summary of multi-model inference results, testing the effect of tree height, horizontal distance to the tree center, cardinal orientation, day- and night-time, and leaf-set on radiation, temperature, and RH.
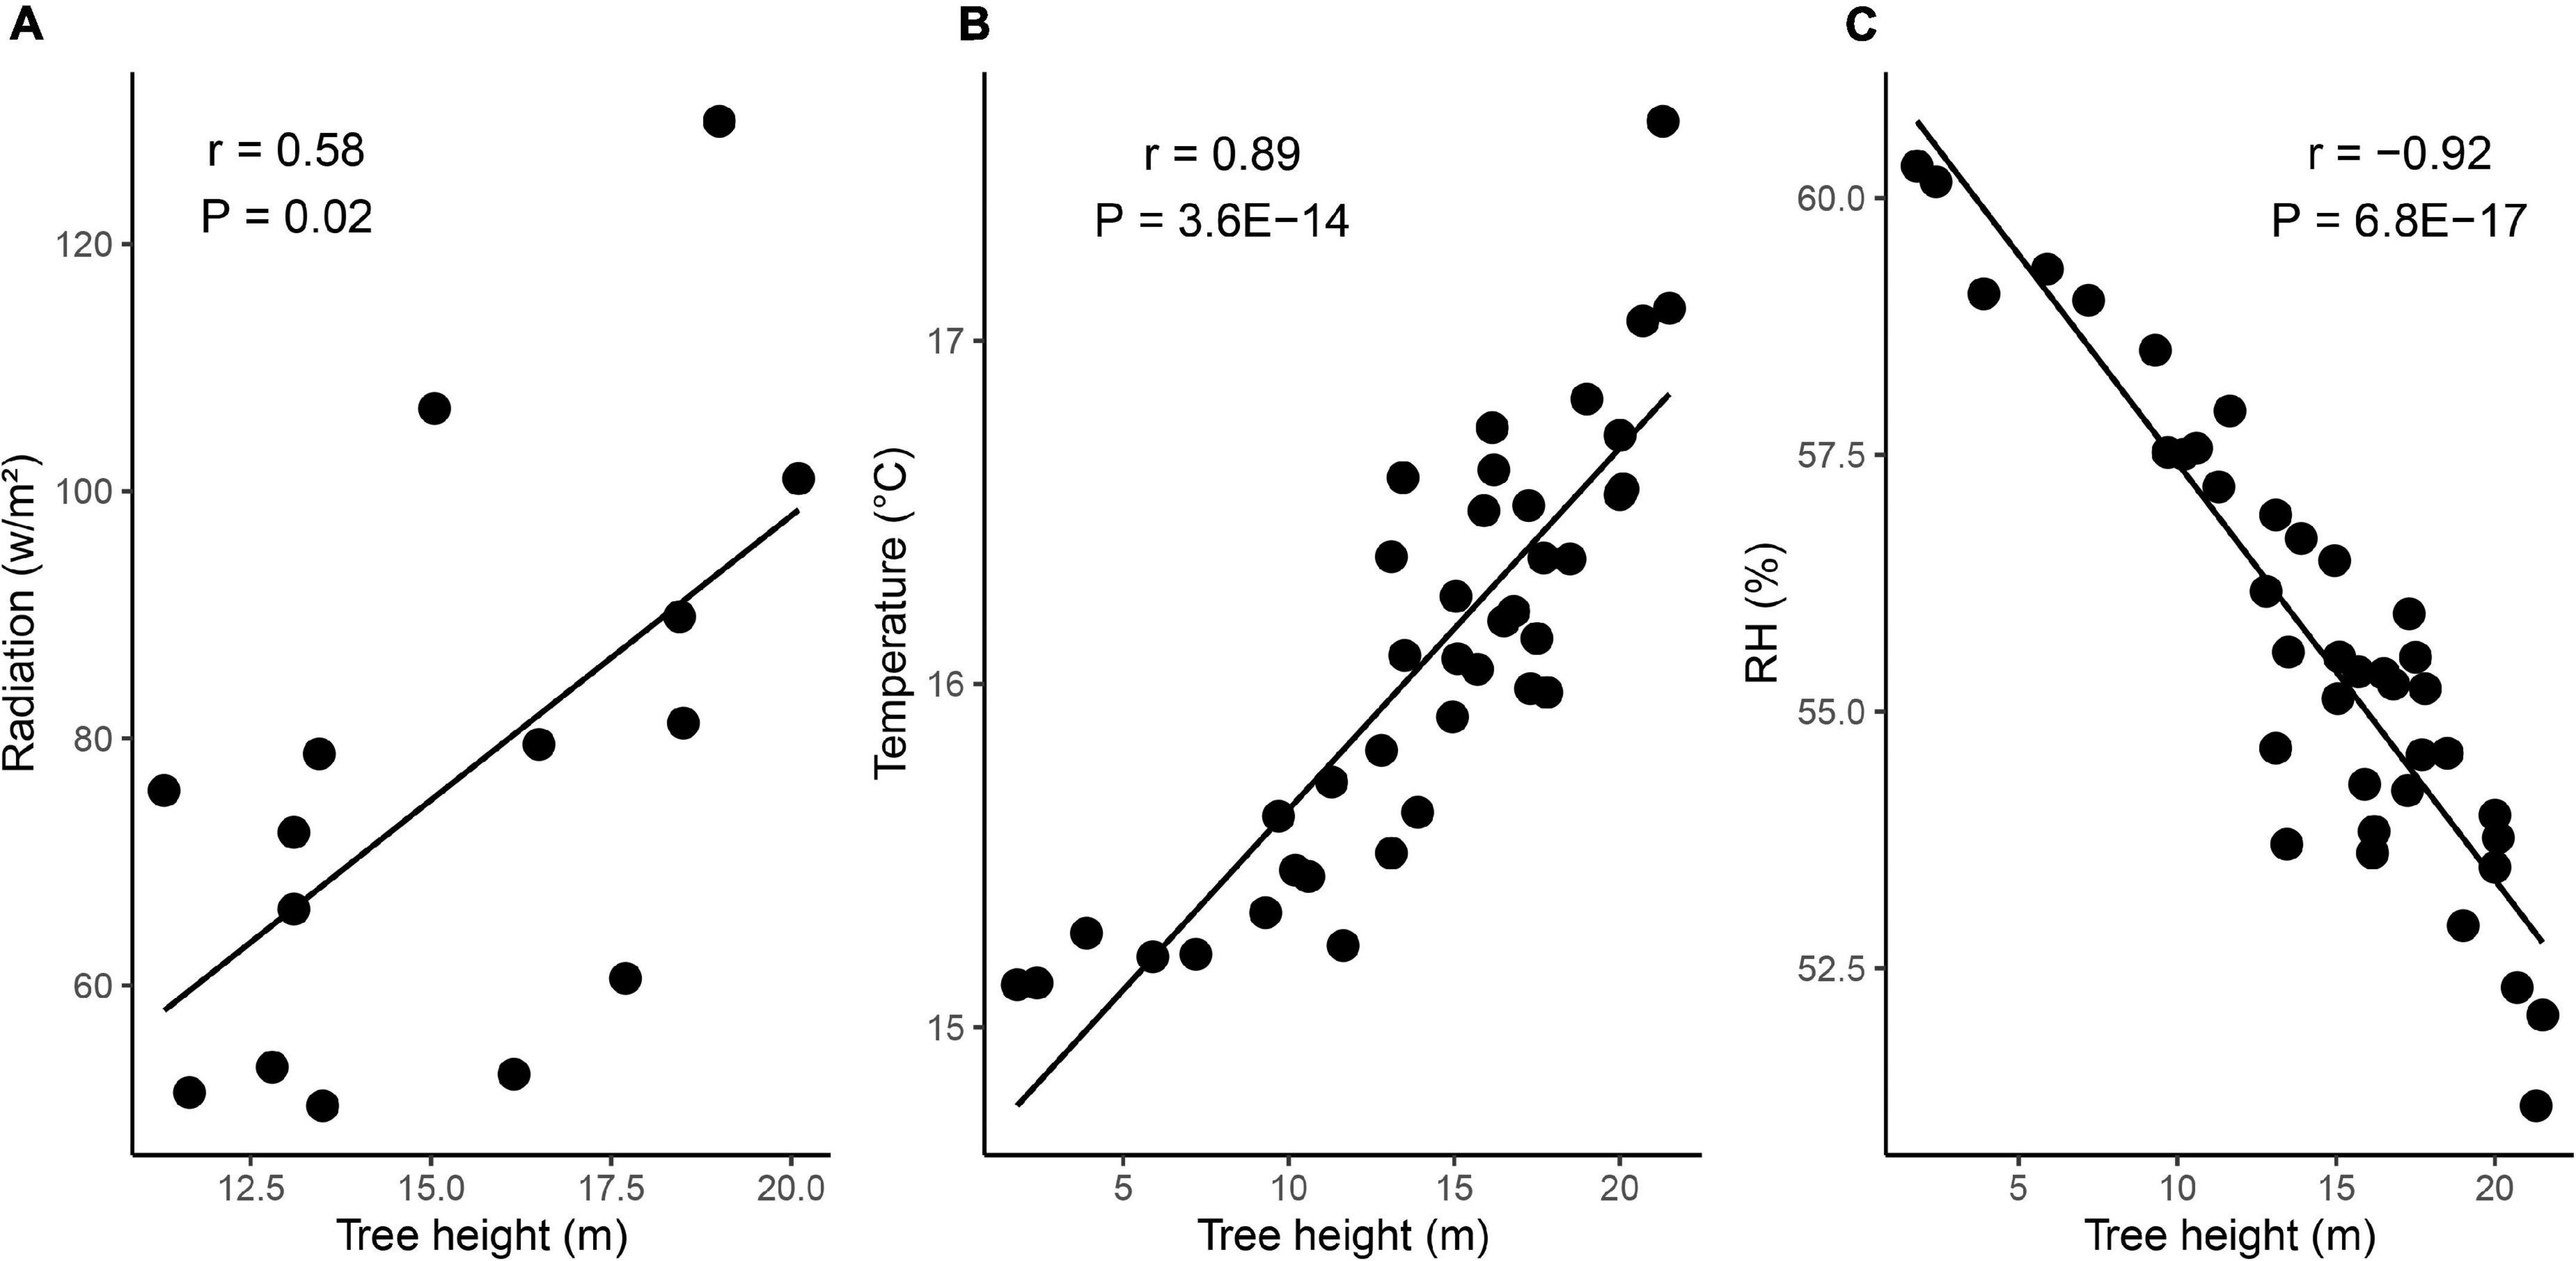
Figure 3. Regression plots showing how radiation (A), temperature (B) and RH (C) changes with height in the tree.
When assessing the temporal changes of microclimate conditions, radiation, temperature and RH showed the same patterns of variability over time, with synchronized shifts and higher values for the above canopy readings, followed by smaller difference between the upper, middle and lower canopy (Figures 4, 5). Although the above temperature sensor was not included in the inference model analysis, we included the data here for illustrative purposes. RH, on the other hand, was higher in the lower, compared to the middle and upper canopy. Temperature was higher and RH lower during leaf-out when compared to the foliaged phase (Table 1 and Figure 5).
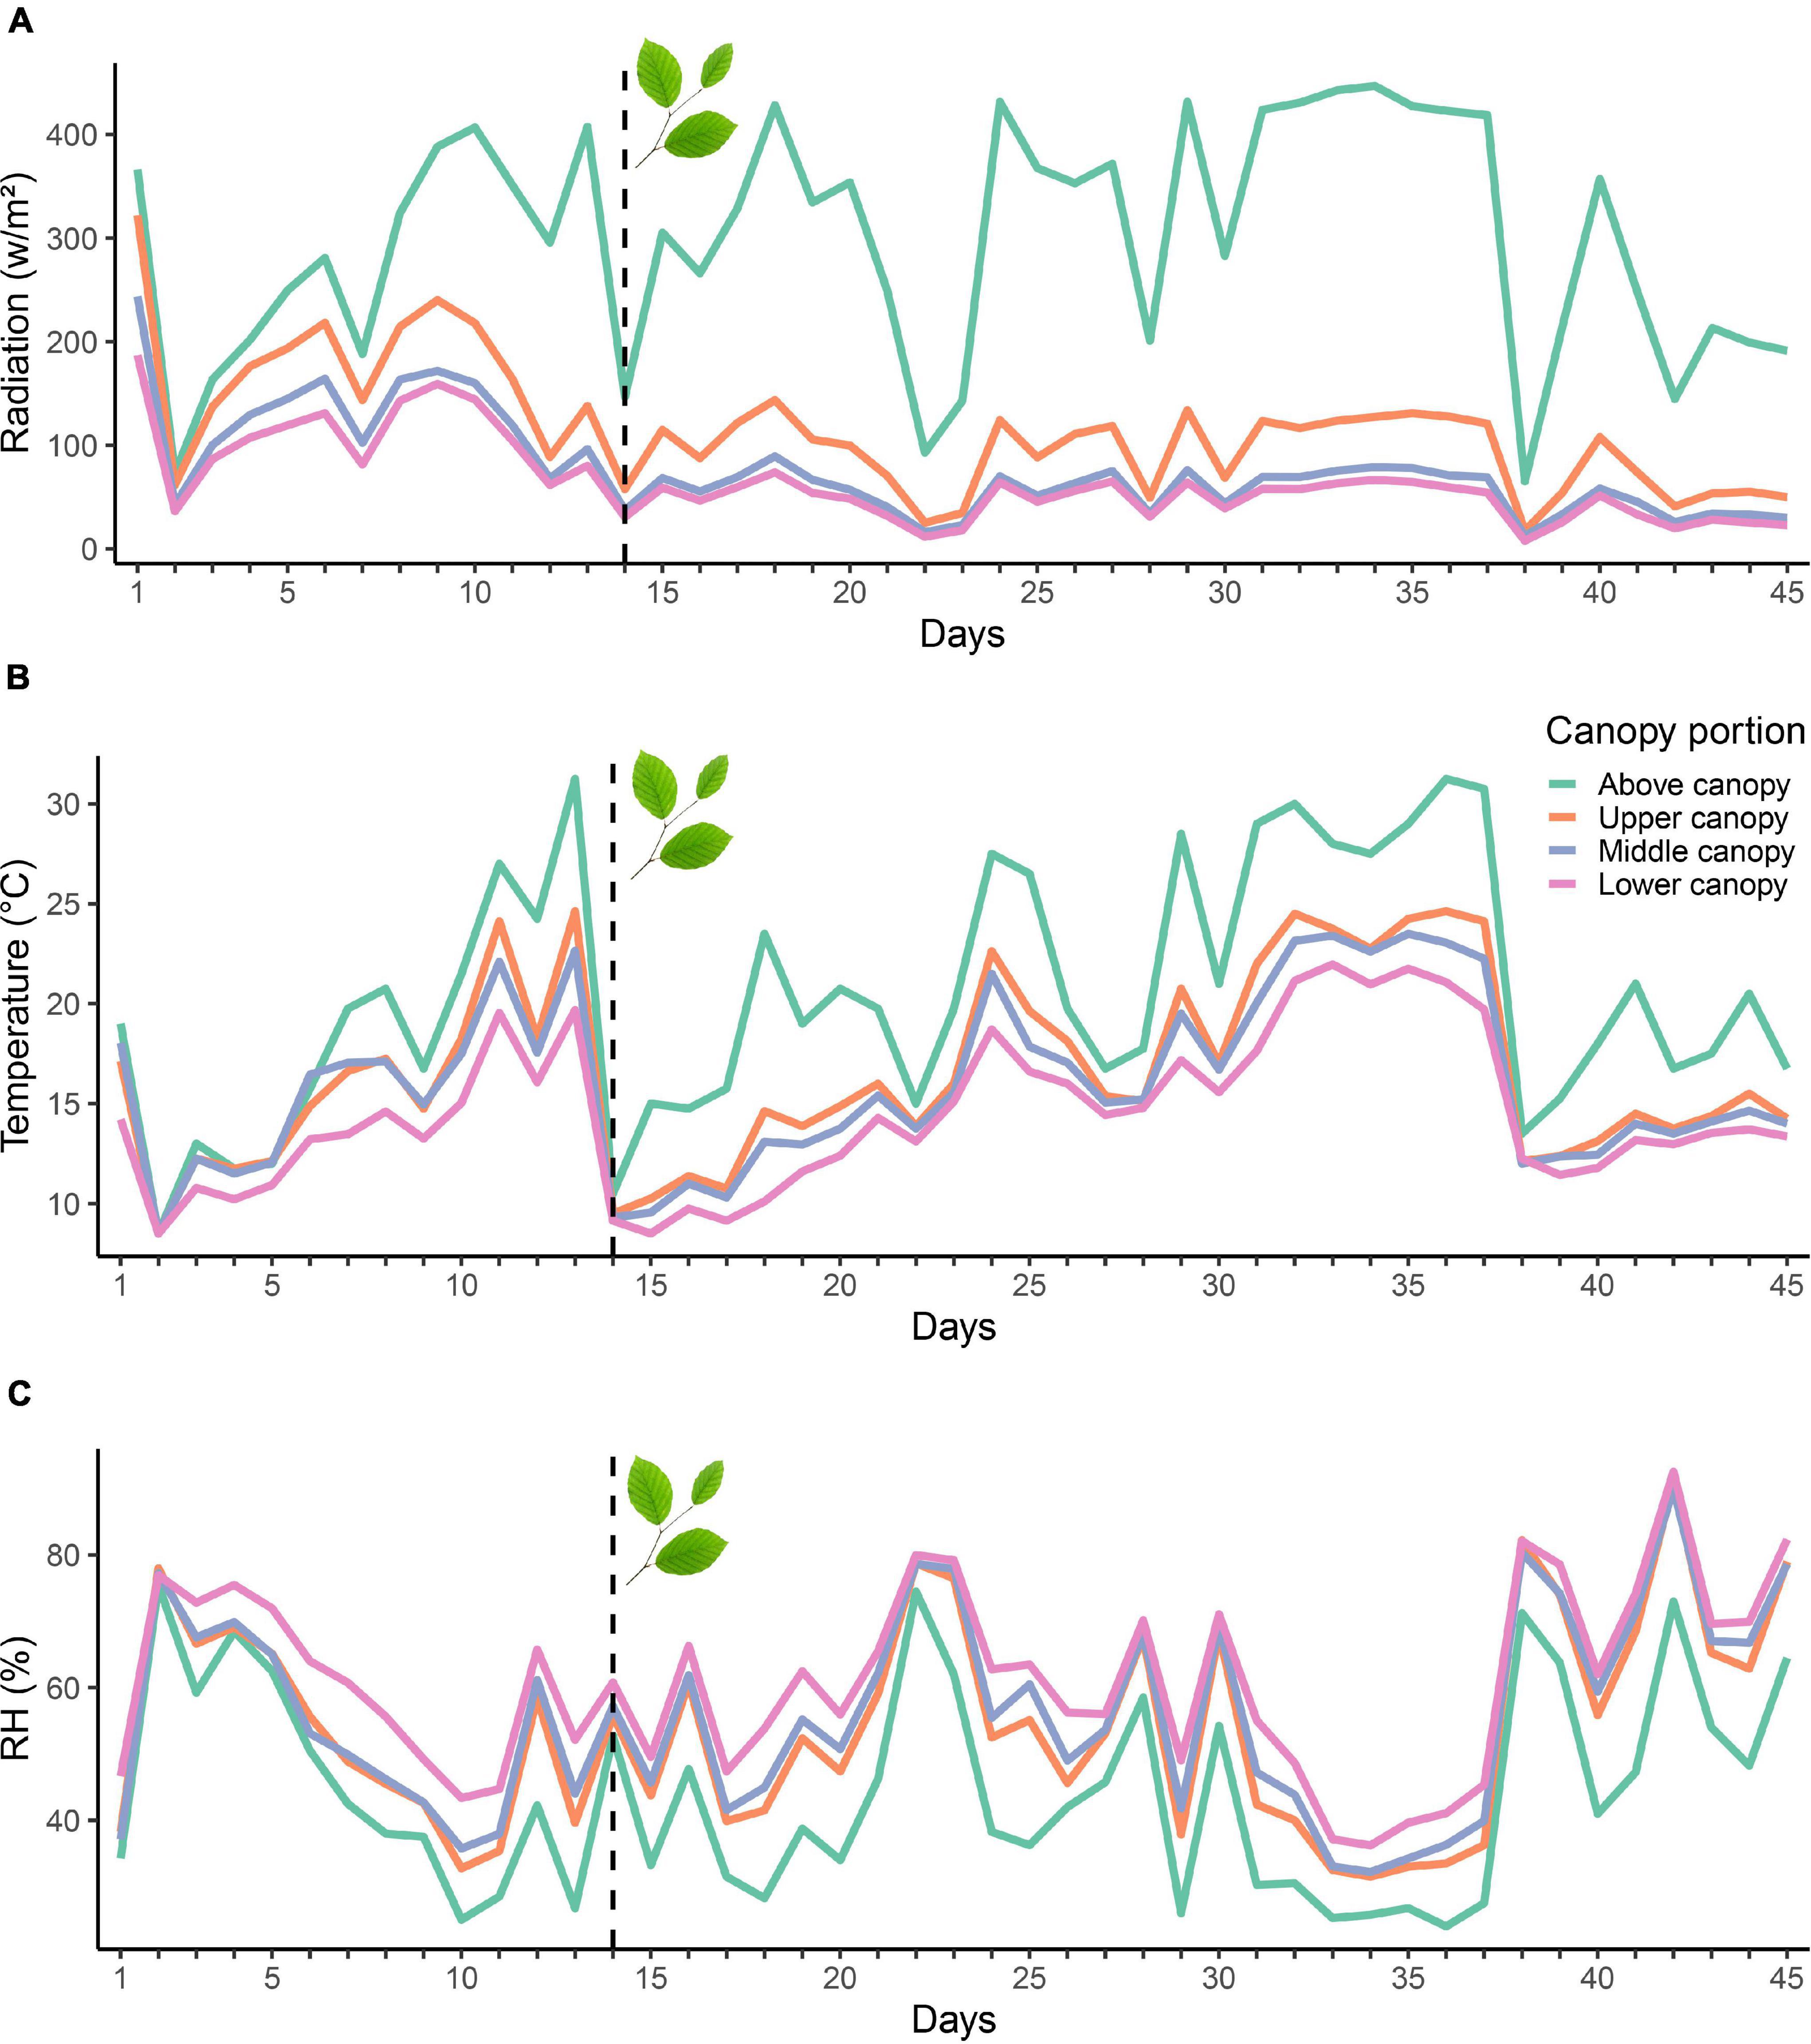
Figure 4. Mean radiation (A), temperature (B) and RH (C) variability measured above and within the tree at different canopy positions (lower, middle, and upper) during the study period (May-June). The dashed line represents the transition from the leaf-out to the foliaged phase.
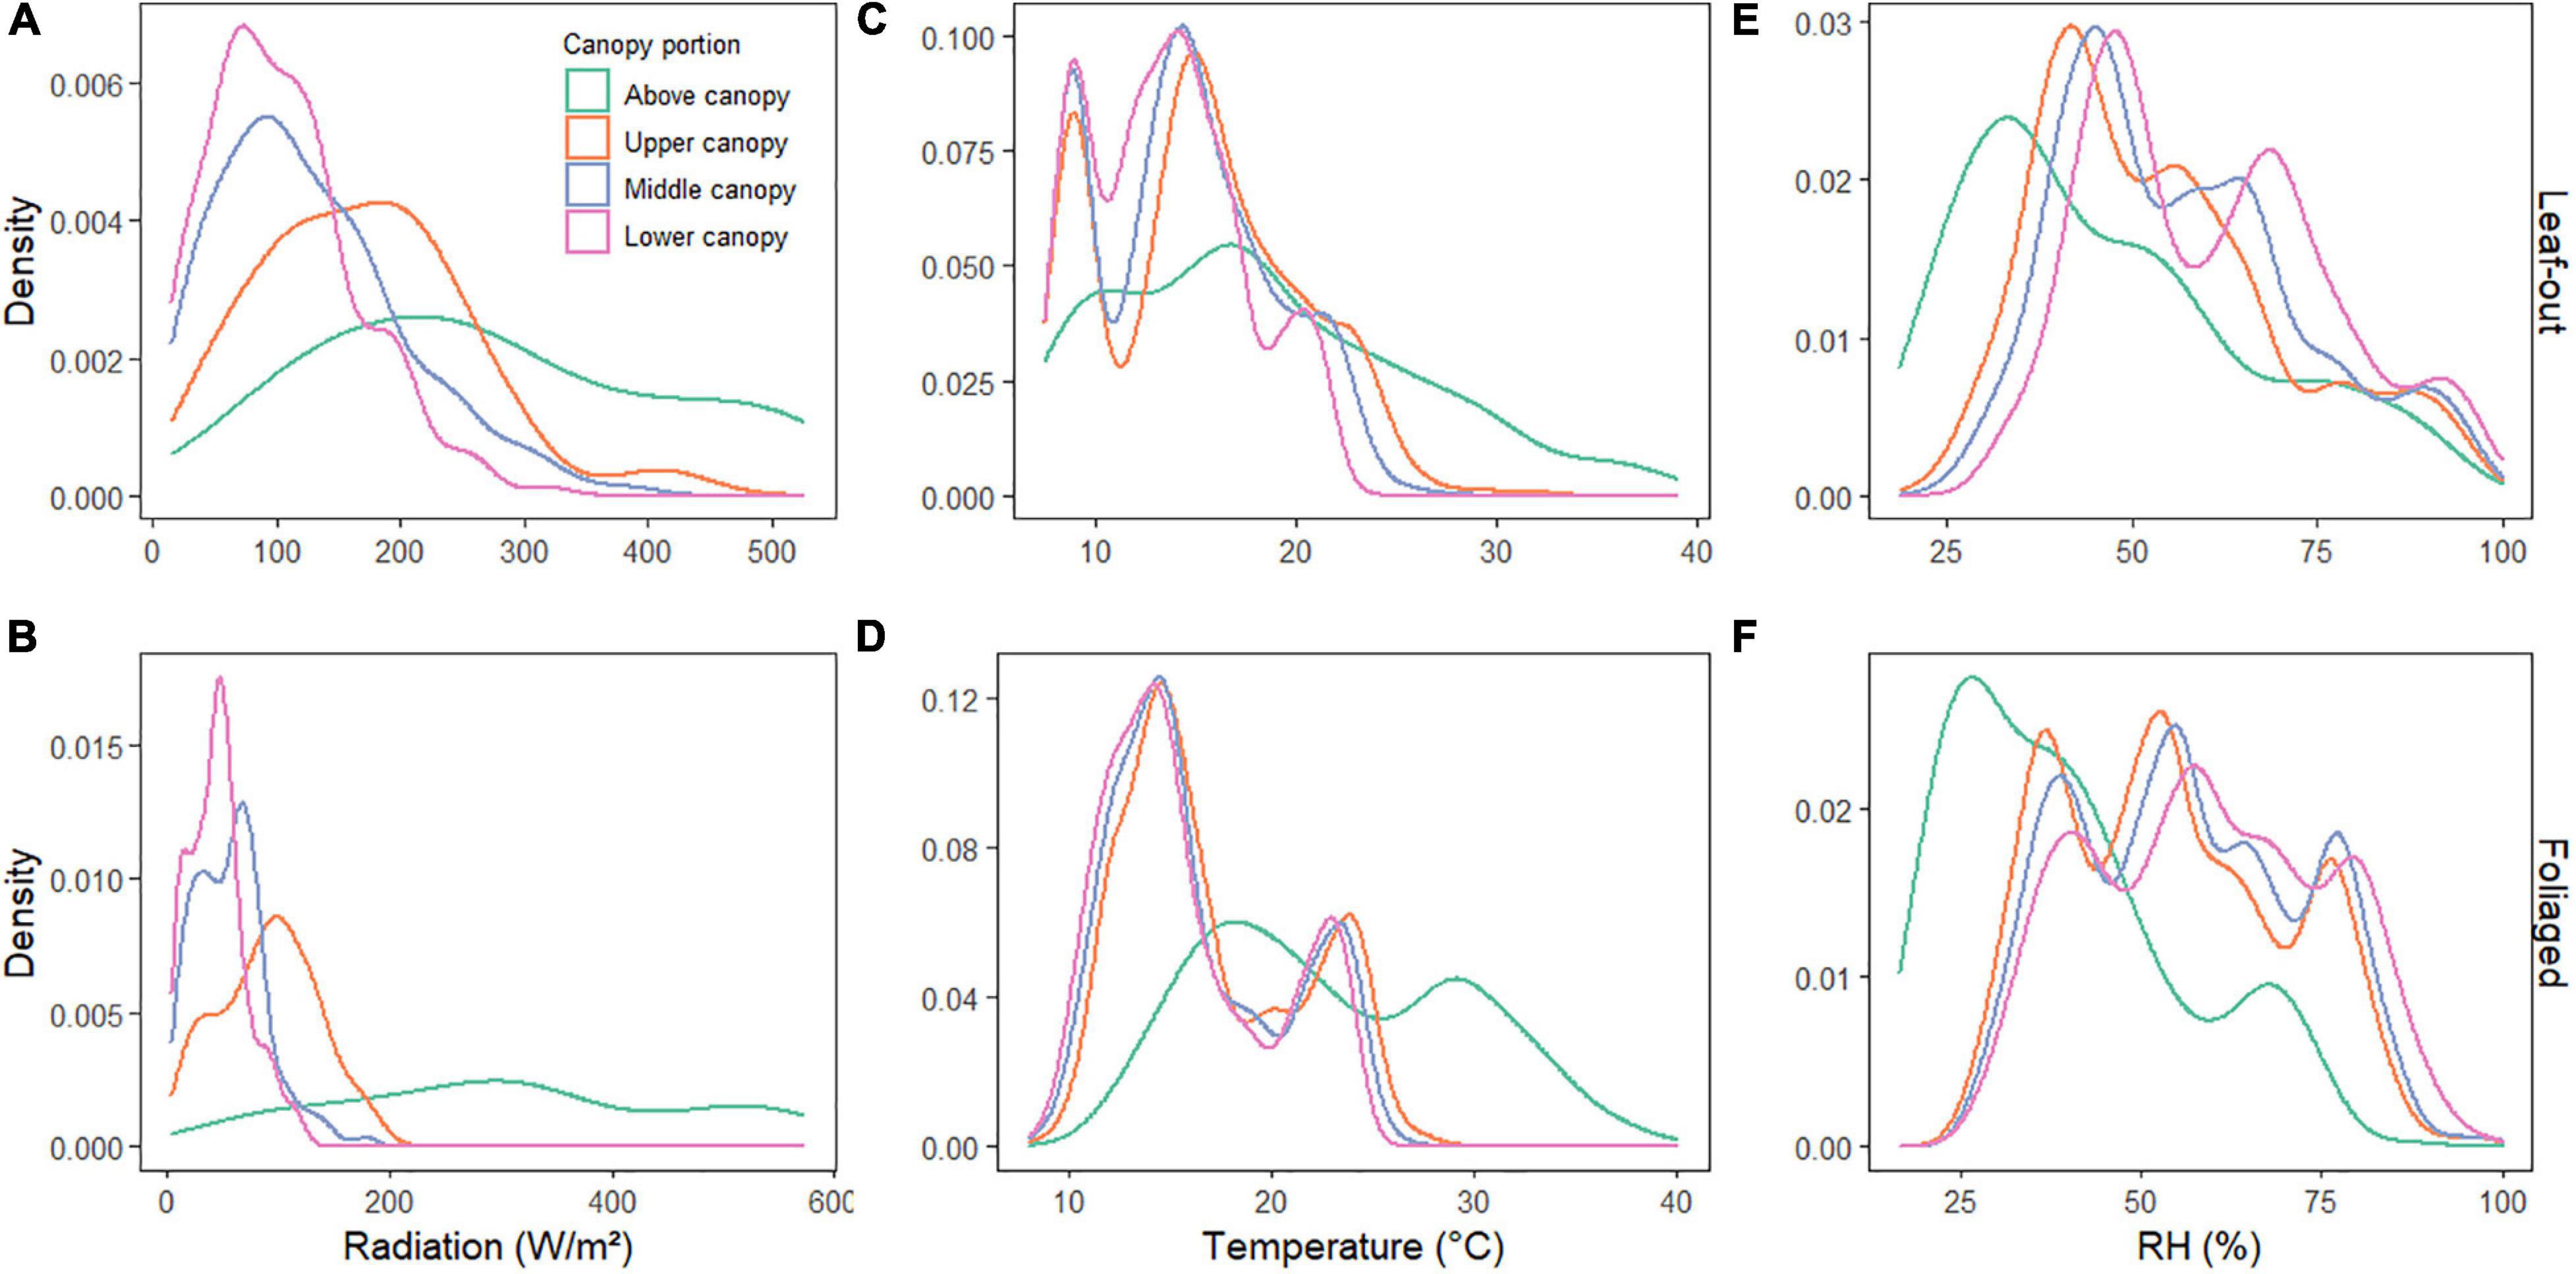
Figure 5. Density plots of daytime records of radiation (A,B), temperature (C,D), and RH (E,F) for each canopy zone and for the leaf-out (A,C,E) and foliaged phases (B,D,F).
In order to test how the standard error changed with the number of sensors used, a Monte Carlo analysis was performed and showed that a significantly smaller number of sensors could have been employed in our study tree (Figure 6). For example, by removing four radiation sensors within the canopy would have kept the error below 25% of the total error (Figure 6A). For temperature and RH on the other hand, a total of 13 sensors could have been removed, to still capture 75% of the total error (Figures 6B,C). No difference was found when comparing the leaf-set and folliaged phases (data not shown).
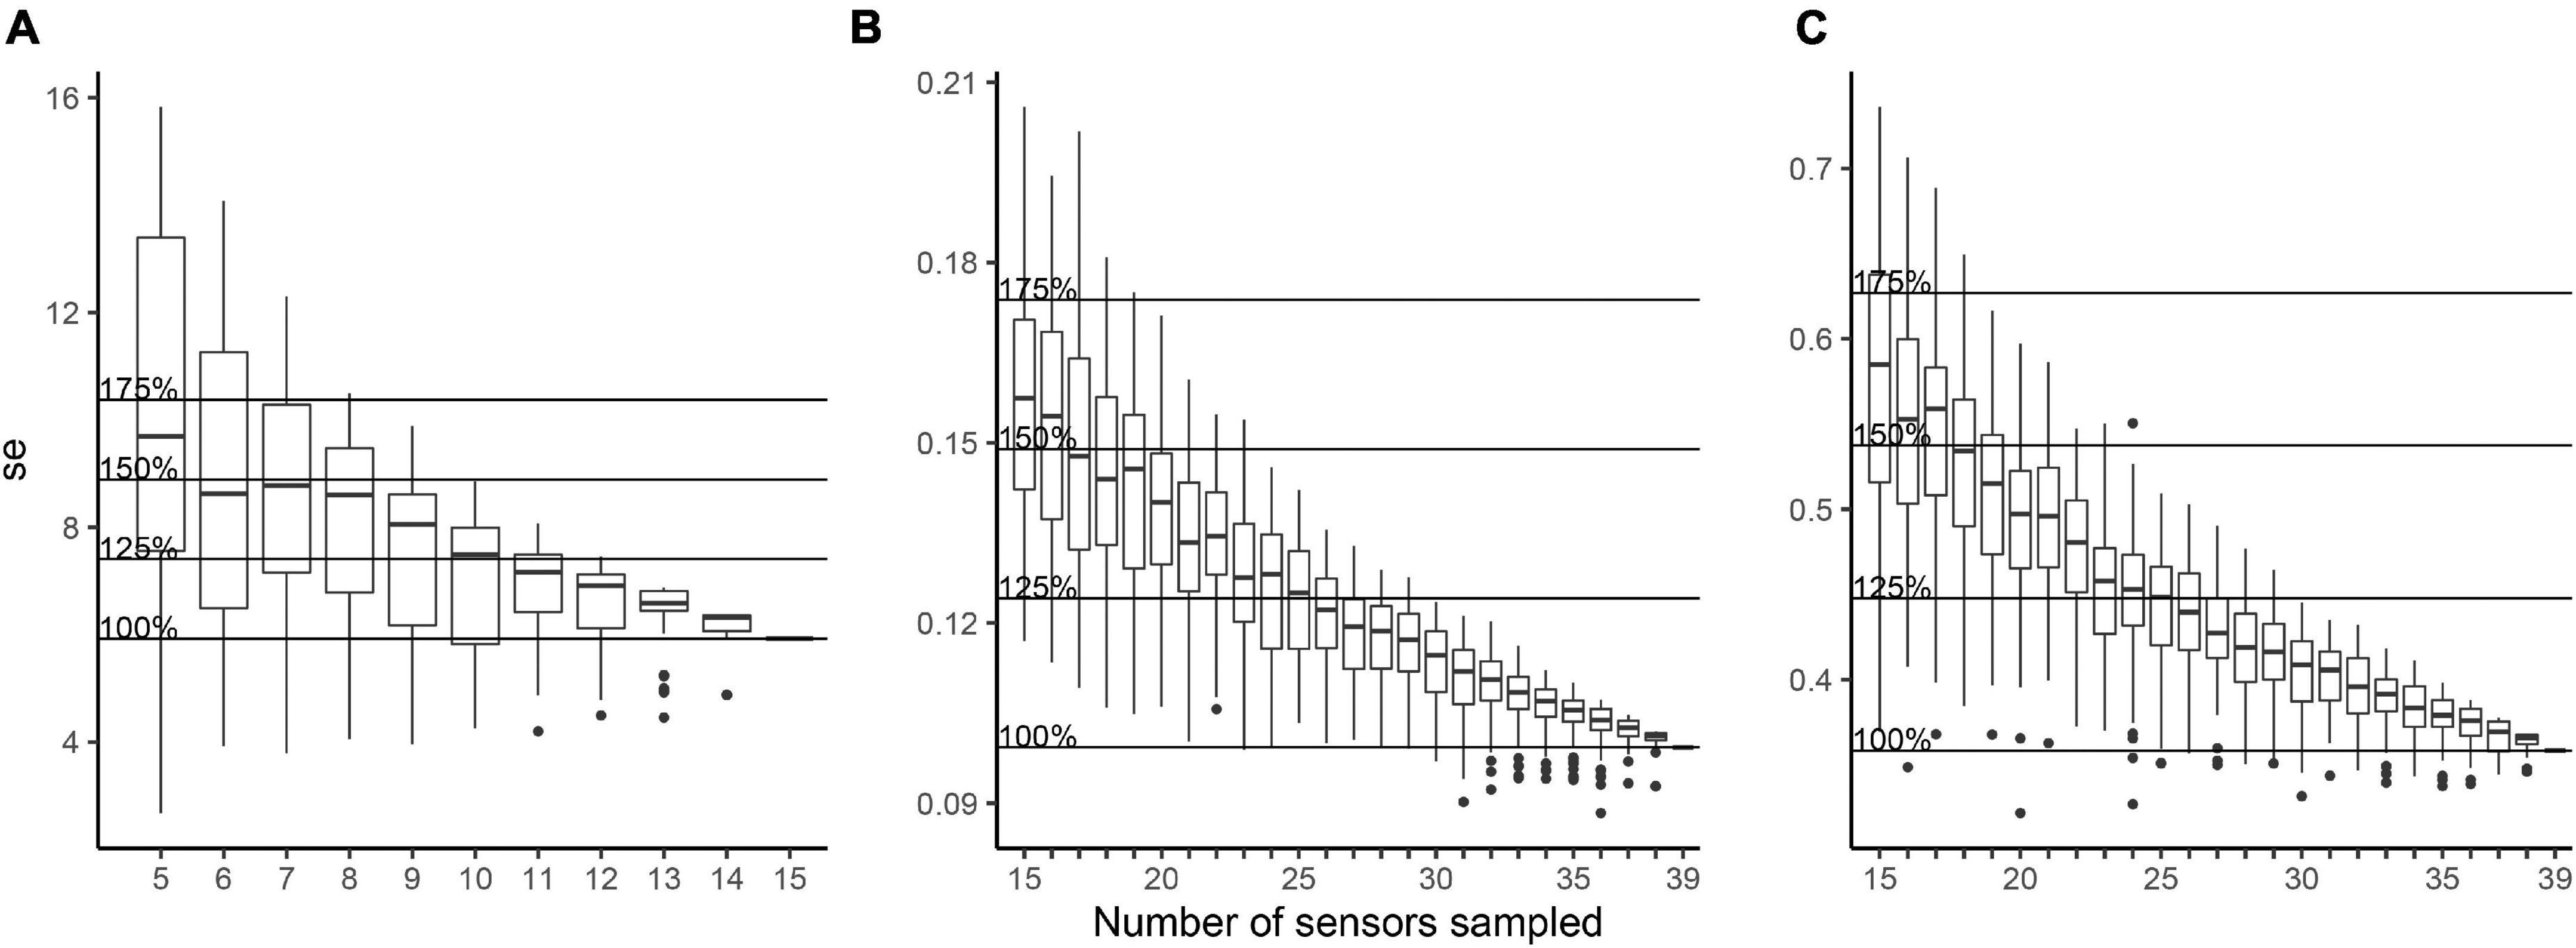
Figure 6. Monte Carlo analysis of the standard error for radiation (A), temperature (B), and RH (C), according to the number of sampled sensors. The horizontal lines show the total standard error of the data (e.g., 100%) and the consequential increase of the error (e.g., 1.25, 1.5, and 1.75 * the standard error) as the number of sensors is decreased.
In addition, an analysis of the percentage of the variance showed that four out of five radiation sensors that captured less than 5% of the radiation variance for leaf-out phase were located below 15 m in the tree (Figure 7A). It was also found that during the leaf-out phase 23 of the temperature sensors (Figure 7C) and 22 of the RH sensors (Figure 7E) captured less than 2.5% of the total temperature and RH variance respectively. For the foliaged phase, nine of the radiation sensors captured less than 5% of the radiation variance (Figure 7B), while 19 temperature sensors (Figure 7D) and 16 RH sensors (Figure 7F) accounted for less than 2.5% of the total variance of temperature and RH, respectively.
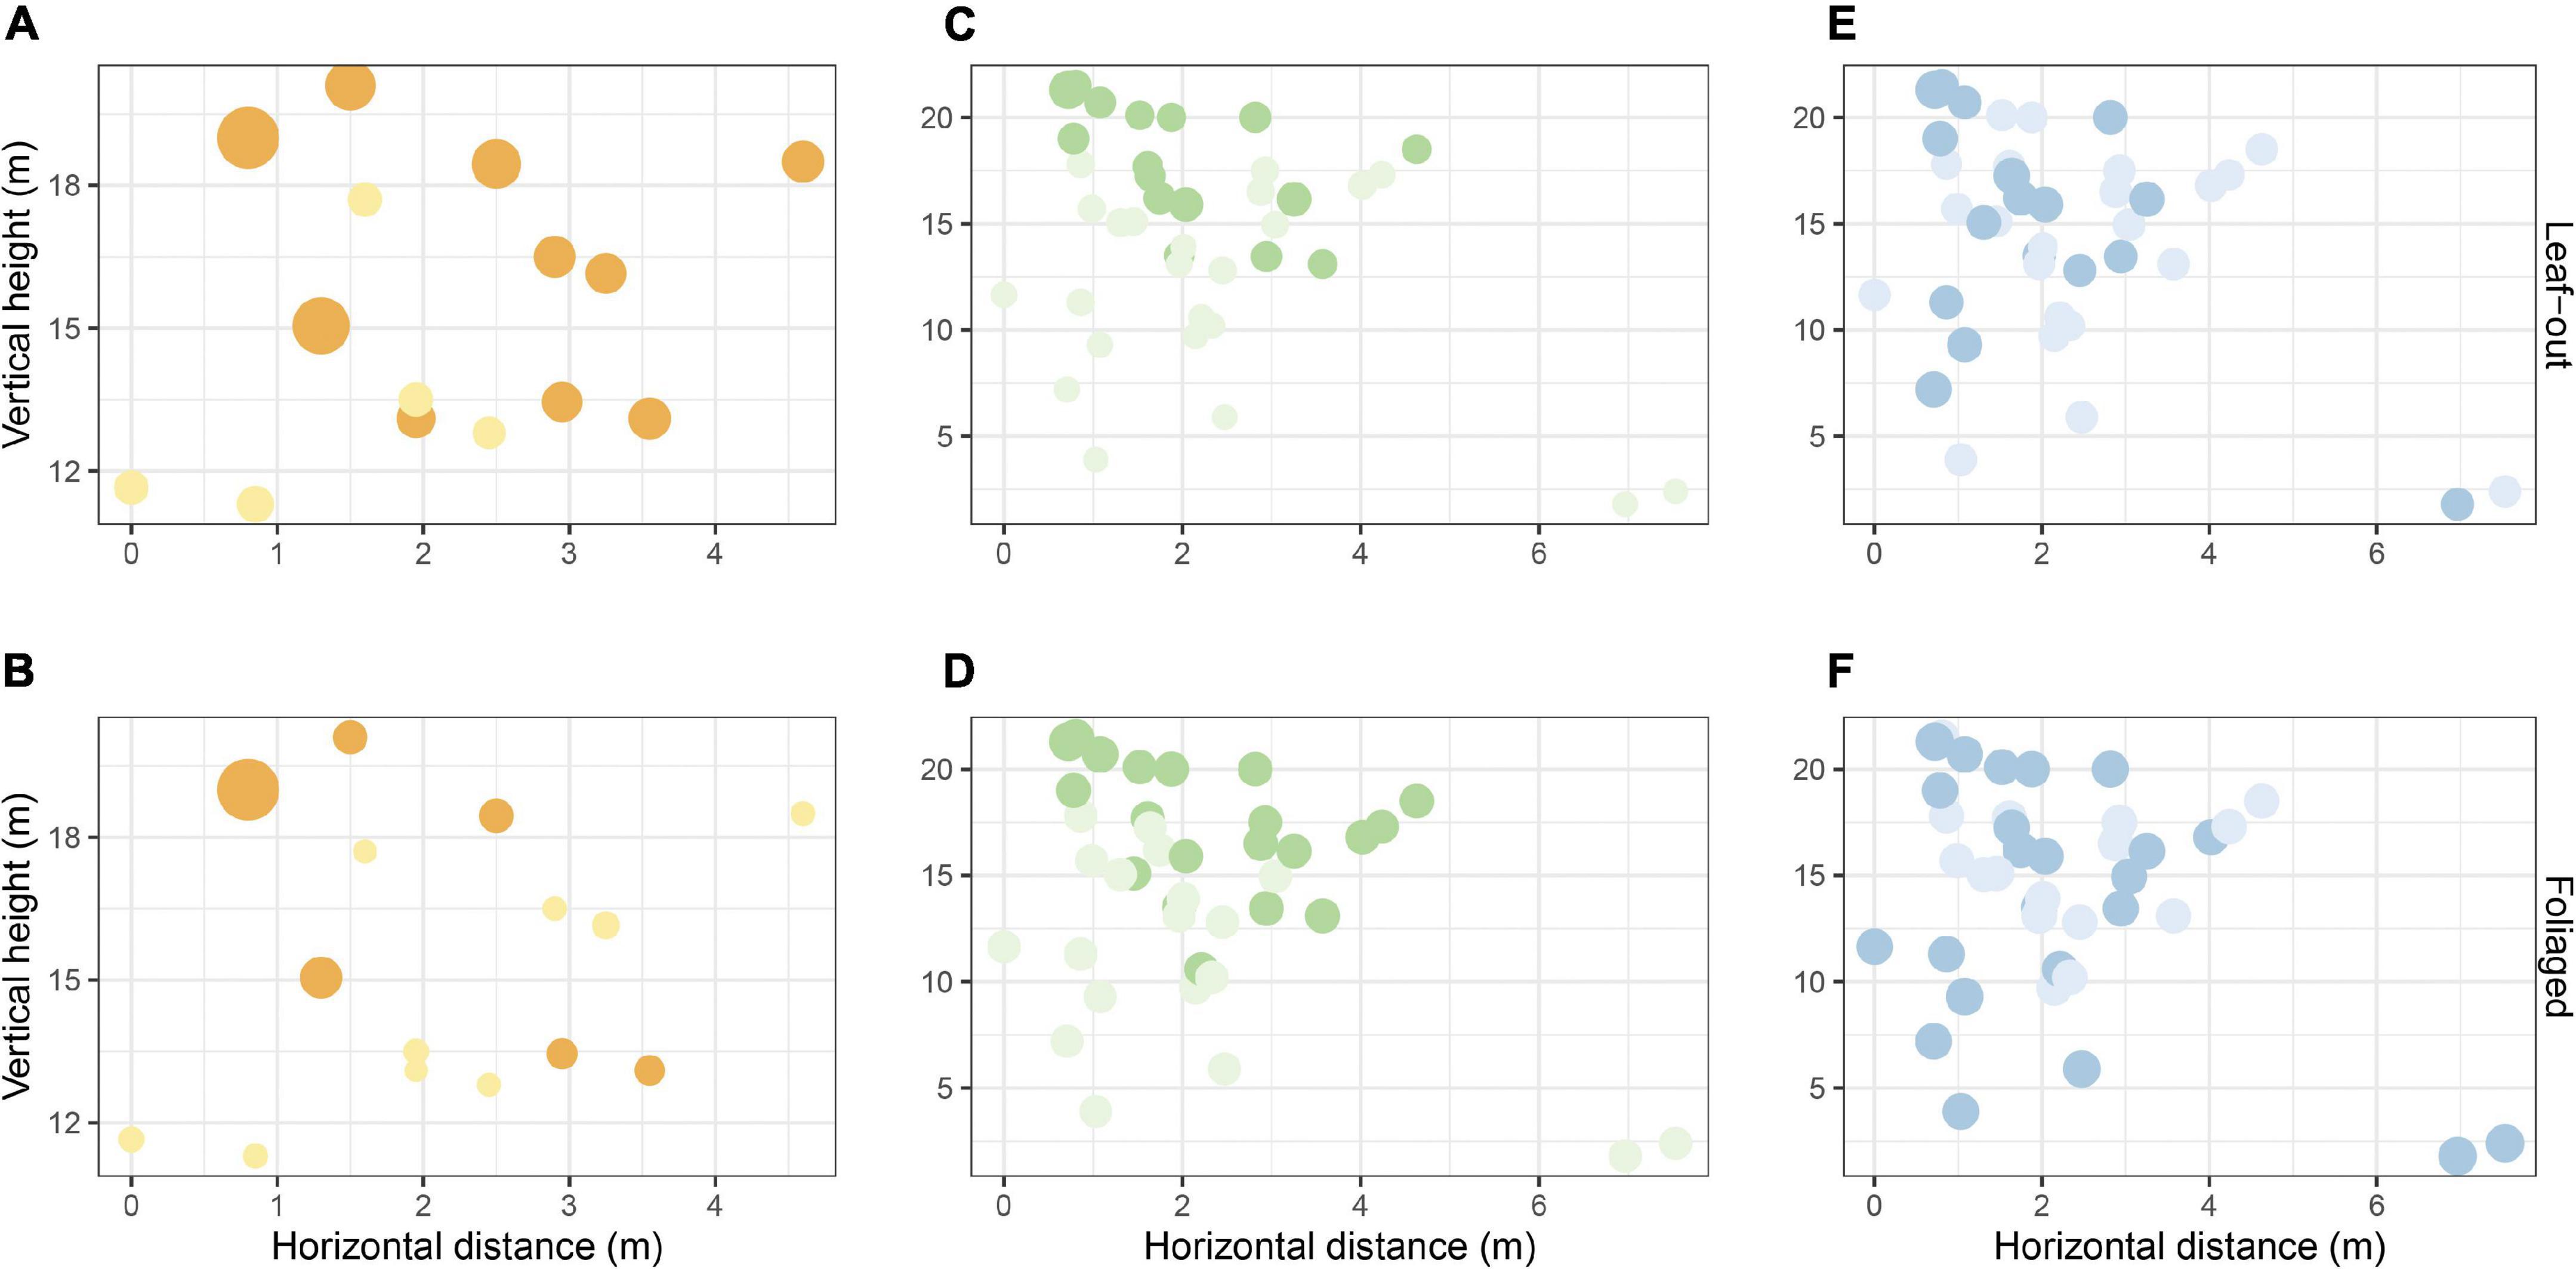
Figure 7. Percentage of total variance captured by each sensor when plotted against tree height and horizontal distance to the tree center; Light yellow dots represent radiation sensors that captured less than 5% of total radiation variance and orange dots represent radiation sensors that captured more than 5% of total radiation variance (A,B); Light green dots represent temperature sensors that captured less than 2.5% of total temperature variance and dark green dots represent temperature sensors that captured more than 2.5% of total temperature variance (C,D); Light blue dots represent RH sensors that captured less than 2.5% of total RH variance and dark blue dots represent RH sensors that captured more than 2.5% of total RH variance (E,F). All dots were size-mapped for percentage variance values.
We found that sensor height was a better predictor of microclimate variables than the distance of sensors to the tree center for all three variables measured. This could be explained by the location of the tree within the forest stand, as the surrounding trees would have increased the buffering potential and thus decreased the horizontal microclimate variation. For example, incident radiation levels are likely to be higher in the upper compared to the lower canopy, but can differ depending on the surrounding forest stand (e.g., trees growing close to gaps or even emergent trees can experience greater amounts of radiation incident laterally in the lower portions of their crowns). The upper canopy is often more heterogeneous and has more sudden changes in conditions during the day, compared to the middle and lower canopy or canopy positions that are more sheltered by other surrounding trees. This stabilized microclimate configuration in the middle of the canopy could facilitate vascular epiphyte species establishment (Hietz and Briones, 1998). It is important to highlight that the relative stability of the microclimate in the middle of the canopy is also accompanied by different characteristics of the substrate when compared to other canopy positions. For example, the middle canopy is one of the oldest parts of the canopy, providing longer colonization potential (Benzing, 1990), and often has the highest surface area, which provides more space for colonization (Bonnet and De Queiroz, 2006). In addition, these areas of the canopy are also characterized by a higher abundance of moss cover and organic material that can supply and retain water and nutrients better, thus facilitating vascular epiphyte establishment (Nadkarni, 1984; Freiberg and Freiberg, 2000). Direct measurements of microclimate are therefore valuable in explaining stratification along structurally different portions of the canopy, as shown for bryophytes by Man et al. (2022). To our knowledge, no study has rigorously tested whether it is canopy age, surface area and/or microclimate stability that primarily drives epiphyte species richness and abundance in the middle of the canopy.
Measuring radiation across a forest canopy is much more difficult compared to measuring temperature and RH, due to the radiation’s high temporal and spatial variability. Sunflecks can particularly increase the heterogeneity of radiation in the canopy (Chazdon and Pearcy, 1991). For example, we recorded radiation changes between 0.22 and 427.33w/m2 for the same sensor on different days. These extreme fluctuations in the radiation environment occurred regardless of the vertical or horizontal position of the sensors. Thus, it becomes important to position several radiation sensors across the canopy, but also have a high recording frequency. In the case of our study, although we used a large number of sensors in a single tree, the frequency of logging intervals per radiation sensor was quite low. Ideally, to account for temporal variability, radiation measurements should be taken at a higher frequency compared to our study. However, the frequency of records will need to be balanced against the storage and battery capacity of the sensors used. Especially studies in remote locations and where access to the data loggers is difficult, it might become important to carefully consider data storage. Network systems are now available that allow almost instantaneous remote download of data, these networks are often very expensive and require the use of a mobile phone network. This makes the use of these systems more challenging in remote locations and more inclusive to well funded canopy studies.
In terms of temperature and RH, leaf-set markedly changed the temperature and RH in our surveyed tree. The buffering effect of the crown to atmospheric conditions (De Frenne et al., 2019) was particularly noticeable by a decrease in the incident radiation after leaf-set, which was followed by a decrease in overall canopy temperature, and an increase in RH during the foliaged phase. However, leaf-set was an important factor in our inference model only for temperature and RH (Table 1). In terms of canopy epiphytes, high species richness has often been observed in biomes that are often characterized by high temperatures and higher water availability, but fewer seasonal changes (Zotz and Winter, 1994; Cardelús, 2007; Zotz, 2016). Most of these biomes are dominated by broadleaved evergreen tree species (Zotz, 2005; Einzmann et al., 2015), indicating that the deciduous nature of most northern hemisphere trees makes the forest canopy a more challenging environment to grow in (but see Zotz, 2005). For example, Einzmann et al. (2015) has shown that differences in luminance between evergreen and deciduous broad leaved trees is 3-4 times higher in deciduous species, but that broadleaved evergreens trees support up to nine times more vascular epiphytes compared to deciduous ones.
The height of the sensors explained more microclimate variability then any of the other variables included in the analysis. We found a strong positive correlation of temperature (R2 = 0.89) and strong negative correlation of RH with sensor height (R2 = −0.92). Radiation was weak, positively correlated to sensor height (R2 = 0.58). This gradient of microclimate conditions has been reported previously (Freiberg, 1996; Wagner and McGraw, 2013; Fauset et al., 2017; Meeussen et al., 2021) and has been shown to be more distinct in taller tree species (Richards et al., 2020). Our data showed that the presence of the canopy (e.g., when comparing leaf out and foliaged phase) acted as a buffer for microclimate conditions, especially in the lower canopy. However, it needs to be noted that our temperature sensors were not shielded from direct radiation and placed under well ventilated shields, which makes a comparison with above canopy temperature conditions more difficult. Ideally, studies that employ temperature sensors should be using radiation shields to ensure that temperature measurements are not affected by changes in radiative force. For the epiphytes, tree height has been one of the key predictive variables of epiphyte richness in a local context (Flores-Palacios and García-Franco, 2006; Krömer et al., 2007). Taller trees often harbor a higher richness, biomass and abundance of epiphytes, compared to smaller trees (Flores-Palacios and García-Franco, 2006; Elias et al., 2021; Mitchell et al., 2021). The stratification of epiphytes along the vertical profile of trees has thus been the focus of several scientific studies in the past (see Johansson, 1974 and Zotz, 2007). Distinct patterns of occupation can often be observed, where many drought resistant species occupy drier and more exposed sections of the canopy (e.g., the upper and outer branches) and less tolerant species the lower branches and trunk of the tree. For example, many filmy fern species (Hymenophyllaceae) are most frequently found in canopy positions, where RH and water availability are high, as well as temperature and light are low (Proctor, 2003). Even though these vertical distribution patterns of epiphytes are generally well documented, there is still a scarcity of studies that have quantified epiphyte distributions in terms of microclimate gradients across canopies.
A review of the literature highlighted the scarcity of studies investigating intra-canopy microclimatic conditions, especially in relation to epiphytes. Only four studies discussed the use of climate sensors in forest canopy epiphyte research and only two (Sillett and Van Pelt, 2007; Rascher et al., 2012) used sensors to measure the canopy microclimate in relation to vascular epiphytes. In addition, we found 30 studies that systematically quantified forest canopy microclimate conditions of radiation, temperature, and/or relative humidity. However, all of them used only a few sensors. These studies are summarized in Supplementary Table 2, in addition to Sillett and Van Pelt (2007) and Rascher et al. (2012) studies. Sixty nine percent of the reviewed studies only used one type of sensor (e.g., only temperature sensors) and/or only sampled part of the canopy. In addition, 56% of the studies only used one single sensor to quantify microclimate canopy conditions, and only 9% of the studies have employed several sensors along the full vertical profile. Thus, our single tree experiment is an important contribution to the field highlighting some key issues regarding the number of sensors that were employed in a single tree.
Currently, most studies that have employed microclimate sensors in forest canopies have often used (a) a very small number of sensors per tree (minimum = 1 and maximum = 12 sensors/tree), (b) limited their measurements to only certain parts of the vertical canopy (e.g., lower canopy only), (c) neglected the horizontal canopy profile and/or d) only sampled one microclimate variable (e.g., radiation, RH or temperature) (Supplementary Table 2). For example, only nineteen of the studies (63%), we found in our literature search, used sensors in the forest understory, positioning them at most two meters above the ground (e.g., Pecot et al., 2005; Lindner, 2011; Putzenlechner et al., 2019). Studies by Feldhake (2002),Wieser et al. (2002) and Awada et al. (2013) used fixed sensor positions along the height of the canopy. However, their studies did not account for vertical differences, as we did in the present study, and their very targeted sensor installation limits their ability to capture microclimate variability within the whole canopy. On the other hand, Fauset et al. (2017) employed one PAR sensor in the open sky and 18 sensors, connected at one-meter intervals along the tree trunk, to characterize the vertical radiation environments of forests along a disturbance gradient. In general, the use of many sensors in canopy studies, particularly in epiphyte studies, is rare.
It is not always required to install a large number of sensors, especially in studies that are more broadly interested in quantifying canopy conditions for epiphytes. However, for physiological studies or studies that aim to investigate habitat preferences at fine scale, a more comprehensive employment of sensors would be more recommended. In our single tree, we installed 56 microclimate sensors and demonstrated that 36 would have still been required in order to account for 75% of the variation. This demonstrates that a large number of sensors are necessary to quantify microclimate conditions in a single tree well. However, sensor cost most likely has been an important obstacle when considering the low number of sensors used in past studies. For example, the 15 pyranometers and 39 temperature and RH sensors, used in this study, have a unit price of £215 and £40, respectively. The total costs of all sensors used was £4,785. Based on our Monte Carlo analysis, we could have reduced the overall number of sensors by 15 and still captured 75% of their measurement variation, therefore saving £1,420 in costs.
The main caveat of our study is that our analysis is based on a single tree. However, it still highlights the importance of the number and placements of sensors that are required to quantify microclimate conditions in a tree canopy well. Key aspects that need to be considered include the height of the tree, the density of the canopy (e.g., during different times of the year) and the position of the study tree within the forest. In cases where a tree is located in an open pasture, the canopy is very large or less sheltered by the surrounding trees, the horizontal gradient would also need to be considered during sensory installation. Based on our results and when reviewing the literature, making recommendations on the absolute number of sensors needed is difficult. However, our data suggests that a much larger number of sensors is required to capture microclimate variability within each tree than previously recognized. Radiation in particular was more variable across the canopy compared to temperature and RH. We are suggesting under limited resources, researchers should focus on the sensor installation along the vertical profile. In addition, we found that microclimate variability was much higher in the upper canopy (top 10 m) compared to the rest of the canopy, thus suggesting more sensors should be placed in this section. Methodologically, we are also recommending that radiation shields are used when measuring microclimate variables such as temperature. When measuring radiation, it is important that sensors are installed on stable platforms before they are attached directly to the tree. In the case of our study, we made customized platforms that included a spirit level and we only attached platforms to branches greater than 35 cm diameter to avoid excessive movement and also ensure safe access. Finally, the logging frequency chosen should be as high as possible, to capture temporal variability at a high resolution. However, this needs to be carefully weighed against the data storage and battery requirements of the equipment used, as a high logging frequency can lower the longevity of the sensors under fieldwork conditions, especially in remote or difficult to access locations.
In conclusion, we found that tree height is the most important factor determining microclimate conditions in our sampled tree. We further observed differences in microclimate conditions between phenological phases during leaf set and demonstrated that a large number of sensors is required to accurately determine microclimate conditions within a canopy. Despite the limitation imposed by the fact that we only sampled one tree, our study makes a genuine contribution to the development of field approaches for the direct measurement of three important microclimatic variables (radiation, temperature, and RH). We believe that our recommendations can highlight important issues when researching canopy dwellers, by informing researchers on how to overcome methodological challenges. This will contribute to future research on forest strata and its biodiversity.
The raw data supporting the conclusions of this article will be made available by the authors, without undue reservation.
FNR, MM, and SB conceived and designed the research. MM and SB conducted the experiments. MM conducted the analysis, analyzed the data, and wrote the manuscript. RA conducted Monte Carlo analysis. FNR, MD, and SB revised the manuscript. All authors read and approved the final manuscript.
This research was fully funded by Edge Hill University, as part of MM Ph.D. project. FNR was supported by productivity fellowships (306796/2020-1) from the Conselho Nacional de Desenvolvimento Científico e Tecnológico (CNPq)—Brazil.
The authors declare that the research was conducted in the absence of any commercial or financial relationships that could be construed as a potential conflict of interest.
All claims expressed in this article are solely those of the authors and do not necessarily represent those of their affiliated organizations, or those of the publisher, the editors and the reviewers. Any product that may be evaluated in this article, or claim that may be made by its manufacturer, is not guaranteed or endorsed by the publisher.
Permission to work in the Scutcher Acres Reserve was given by John Watt. We also thank Paul Ashton. RA acknowledges funding from the MRC Centre for Global Infectious Disease Analysis (reference MR/R015600/1), jointly funded by the UK Medical Research Council (MRC) and the UK Foreign, Commonwealth & Development Office (FCDO), under the MRC/FCDO Concordat agreement and also part of the EDCTP2 programme supported by the European Union.
The Supplementary Material for this article can be found online at: https://www.frontiersin.org/articles/10.3389/ffgc.2022.828725/full#supplementary-material
Alexander, C., Moeslund, J. E., Bøcher, P. K., Arge, L., and Svenning, J.-C. (2013). Airborne laser scanner (LiDAR) proxies for understory light conditions. Remote Sens. Environ. 134, 152–161. doi: 10.1016/j.rse.2013.02.028
Anderson, D. R. (2007). Model Based Inference in the Life Sciences: A Primer on Evidence. New York: Springer.
Aussenac, G. (2000). Interactions between forest stands and microclimate: ecophysiological aspects and consequences for silviculture. Ann. For. Sci. 57, 287–301. doi: 10.1051/forest:2000119
Awada, T., El-Hage, R., Geha, M., Wedin, D. A., Huddle, J. A., Zhou, X., et al. (2013). Intra-annual variability and environmental controls over transpiration in a 58-year-old even-aged stand of invasive woody Juniperus virginiana L. in the Nebraska Sandhills, USA. Ecohydrology 6, 731–740. doi: 10.1002/eco.1294
Baldocchi, D. D., Law, B. E., and Anthoni, P. M. (2000). On measuring and modeling energy fluxes above the floor of a homogeneous and heterogeneous conifer forest. Agric. For. Meteorol. 102:187–206. doi: 10.1016/S0168-1923(00)00098-8
Benzing, D. H. (1990). Vascular Epiphytes: General Biology and Related Biota. Cambridge: Cambridge University Press.
Binkley, D., Campoe, O. C., Gspaltl, M., and Forrester, D. I. (2013). Light absorption and use efficiency in forests: why patterns differ for trees and stands. For. Ecol. Manag. 288, 5–13. doi: 10.1016/j.foreco.2011.11.002
Bonnet, A., and De Queiroz, M. H. (2006). Estratificação vertical de bromélias epifíticas em diferentes estádios sucessionais da Floresta Ombrófila Densa, Ilha de Santa Catarina, Santa Catarina, Brasil. Rev. Bras. Bot. 29, 217–228. doi: 10.1590/S0100-84042006000200003
Brüllhardt, M., Rotach, P., Schleppi, P., and Bugmann, H. (2020). Vertical light transmission profiles in structured mixed deciduous forest canopies assessed by UAV-based hemispherical photography and photogrammetric vegetation height models. Agric. For. Meteorol. 281:107843. doi: 10.1016/j.agrformet.2019.107843
Cardelús, C. L. (2007). Vascular epiphyte communities in the inner-crown of Hyeronima alchorneoides and Lecythis ampla at La Selva Biological Station, Costa Rica. Biotropica 39, 171–176. doi: 10.1111/j.1744-7429.2006.00253.x
Chazdon, R. L., and Pearcy, R. W. (1991). The Importance of Sunflecks for Forest Understory Plants. BioScience 41, 760–766. doi: 10.2307/1311725
Chazdon, R. L., Williams, K., and Field, C. B. (1988). Interactions Between Crown Structure and Light Environment in Five Rain Forest Piper Species. Am. J. Bot. 75, 1459–1471. doi: 10.1002/j.1537-2197.1988.tb11220.x
de Andrade, M. D., Delgado, R. C., da Costa de Menezes, S. J. M., de Ávila Rodrigues, R., Teodoro, P. E., da Silva Junior, C. A., et al. (2021). Evaluation of the MOD11A2 product for canopy temperature monitoring in the Brazilian Atlantic Forest. Environ. Monit. Assess. 193:45. doi: 10.1007/s10661-020-08788-z
De Frenne, P., Zellweger, F., Rodríguez-Sánchez, F., Scheffers, B. R., Hylander, K., Luoto, M., et al. (2019). Global buffering of temperatures under forest canopies. Nat. Ecol. Evol. 3, 744–749. doi: 10.1038/s41559-019-0842-1
Einzmann, H. J. R., Beyschlag, J., Hofhansl, F., Wanek, W., and Zotz, G. (2015). Host tree phenology affects vascular epiphytes at the physiological, demographic and community level. AoB Plants 7:plu073. doi: 10.1093/aobpla/plu073
Elias, J. P. C., Mortara, S. R., Nunes-Freitas, A. F., van den Berg, E., and Ramos, F. N. (2021). Host tree traits in pasture areas affect forest and pasture specialist epiphyte species differently. Am. J. Bot. 108, 598–606. doi: 10.1002/ajb2.1634
Endler, J. A. (1993). The Color of Light in Forests and Its Implications. Ecol. Monogr. 63, 2–27. doi: 10.2307/2937121
Fauset, S., Gloor, M. U., Aidar, M., Freitas, H. C., Fyllas, N. M., Marabesi, M. A., et al. (2017). Tropical forest light regimes in a human-modified landscape. Ecosphere 8:e02002. doi: 10.1002/ecs2.2002
Feigenwinter, C., Mölder, M., Lindroth, A., and Aubinet, M. (2010). Spatiotemporal evolution of CO2 concentration, temperature, and wind field during stable nights at the Norunda forest site. Agric. For. Meteorol. 150, 692–701. doi: 10.1016/j.agrformet.2009.08.005
Feldhake, C. M. (2002). Forage frost protection potential of conifer silvopastures. Agric. For. Meteorol. 112, 123–130. doi: 10.1016/S0168-1923(02)00058-8
Flores-Palacios, A., and García-Franco, J. G. (2006). The relationship between tree size and epiphyte species richness: testing four different hypotheses. J. Biogeogr. 33, 323–330. doi: 10.1111/j.1365-2699.2005.01382.x
Foggo, A., Ozanne, C. M. P., Speight, M. R., and Hambler, C. (2001). Edge effects and tropical forest canopy invertebrates. Plant Ecol. 153, 347–359. doi: 10.1023/A:1017594108769
Freiberg, M. (1996). Spatial Distribution of Vascular Epiphytes on Three Emergent Canopy Trees in French Guiana. Biotropica 28:345. doi: 10.2307/2389198
Freiberg, M., and Freiberg, E. (2000). Epiphyte diversity and biomass in the canopy of lowland and montane forests in Ecuador. J. Trop. Ecol. 16, 673–688. doi: 10.1017/S0266467400001644
Gaudio, N., Gendre, X., Saudreau, M., Seigner, V., and Balandier, P. (2017). Impact of tree canopy on thermal and radiative microclimates in a mixed temperate forest: a new statistical method to analyse hourly temporal dynamics. Agric. For. Meteorol. 23, 71–79. doi: 10.1016/j.agrformet.2017.02.010
Geiger, R., Aron, R. H., and Todhunter, P. (1995). The Climate Near the Ground. Wiesbaden: Vieweg Teubner Verlag.
Gendron, F., Messier, C., and Comeau, P. G. (1998). Comparison of various methods for estimating the mean growing season percent photosynthetic photon flux density in forests. Agric. For. Meteorol. 92, 55–70. doi: 10.1016/S0168-1923(98)00082-3
Gotsch, S. G., Nadkarni, N., Darby, A., Glunk, A., Dix, M., Davidson, K., et al. (2015). Life in the treetops: ecophysiological strategies of canopy epiphytes in a tropical montane cloud forest. Ecol. Monogr. 85, 393–412. doi: 10.1890/14-1076.1
Hartikainen, S. M., Pieristè, M., Lassila, J., and Robson, T. M. (2020). Seasonal Patterns in Spectral Irradiance and Leaf UV-A Absorbance Under Forest Canopies. Front. Plant Sci. 10:1762. doi: 10.3389/fpls.2019.01762
Hietz, P., and Briones, O. (1998). Correlation between water relations and within-canopy distribution of epiphytic ferns in a Mexican cloud forest. Oecologia 114, 305–316. doi: 10.1007/s004420050452
Jennings, S. B., Brown, N. D., and Sheil, D. (1999). Assessing forest canopies and understorey illumination: canopy closure, canopy cover and other measures. Forestry 72, 59–73. doi: 10.1093/forestry/72.1.59
Johansson, D. (1974). Ecology of vascular epiphytes in West African rain forest. Acta Phytogeogr. Suec. 59, 1–136.
Jones, H. G. (2013). Plants and Microclimate: A Quantitative Approach to Environmental Plant Physiology. Cambridge: Cambridge University Press, doi: 10.1017/CBO9780511845727
Kovács, B., Tinya, F., Németh, C., and Ódor, P. (2020). Unfolding the effects of different forestry treatments on microclimate in oak forests: results of a 4-yr experiment. Ecol. Appl. 30:e02043. doi: 10.1002/eap.2043
Krömer, T., Kessler, M., and Gradstein, S. R. (2007). Vertical stratification of vascular epiphytes in submontane and montane forest of the Bolivian Andes: the importance of the understory. Plant Ecol. 189, 261–278. doi: 10.1007/s11258-006-9182-8
Leuchner, M., Hertel, C., Rötzer, T., Seifert, T., Weigt, R., Werner, H., et al. (2012). “Solar Radiation as a Driver for Growth and Competition,” in Forest Stands BT-Growth and Defence in Plants: Resource Allocation at Multiple Scales, eds R. Matyssek, H. Schnyder, W. Oßwald, D. Ernst, J. C. Munch, and H. Pretzsch (Berlin, Heidelberg: Springer), 175–191. doi: 10.1007/978-3-642-30645-7_8
Lieffers, V. J., Messier, C., Stadt, K. J., Gendron, F., and Comeau, P. G. (1999). Predicting and managing light in the understory of boreal forests. Can. J. For. Res. 29, 796–811. doi: 10.1139/x98-165
Lindner, A. (2011). Small scale structure and dynamics in the Atlantic Forest - Notes on understory light fluctuation. Tropic. Ecol. 52, 139–150.
Man, M., Wild, J., Macek, M., and Kopecký, M. (2022). Can high-resolution topography and forest canopy structure substitute microclimate measurements? Bryophytes say no. Sci. Total Environ. 821:153377. doi: 10.1016/j.scitotenv.2022.153377
Meeussen, C., Govaert, S., Vanneste, T., Bollmann, K., Brunet, J., Calders, K., et al. (2021). Microclimatic edge-to-interior gradients of European deciduous forests. Agric. For. Meteorol. 311:108699. doi: 10.1016/j.agrformet.2021.108699
Mitchell, R. J., Hewison, R. L., Beaton, J., and Douglass, J. R. (2021). Identifying substitute host tree species for epiphytes: the relative importance of tree size and species, bark and site characteristics. Appl. Veg. Sci. 24:e12569. doi: 10.1111/avsc.12569
Moffett, M. W. (2000). What’s “up”? A critical look at the basic terms of canopy biology. Biotropica 32, 569–596. doi: 10.1111/j.1744-7429.2000.tb00506.x
Nadkarni, N. M. (1984). Epiphyte Biomass and Nutrient Capital of a Neotropical Elfin Forest. Biotropica 16:249. doi: 10.2307/2387932
Nadkarni, N. M., Parker, G. G., Rinker, H. B., and Jarzen, D. M. (2004). “The Nature of Forest Canopies,” in Forest Canopies, 2nd Edn, eds M. D. Lowman and H. B. Rinker (Amsterdam: Elsevier academic press), 3–23. doi: 10.1016/b978-012457553-0/50005-8
Nakamura, A., Kitching, R. L., Cao, M., Creedy, T. J., Fayle, T. M., Freiberg, M., et al. (2017). Forests and Their Canopies: Achievements and Horizons in Canopy Science. Trends Ecol. Evol. 32, 438–451. doi: 10.1016/j.tree.2017.02.020
Ozanne, C. H. P., Anhuf, D., Boulter, S. L., Keller, H., Kitching, R. L., Körner, C., et al. (2003). Biodiversity meets the atmosphere: a global view of forest canopies. Science 301, 183–186. doi: 10.1126/science.1084507
Parker, G. G. (1995). “Structure and microclimate of forest canopies,” in Forest Canopies, eds M. D. Lowman and N. M. Nadkarni (San Diego: Academic Press), 73–106.
Parker, G. G., Fitzjarrald, D. R., and Gonçalves Sampaio, I. C. (2019). Consequences of environmental heterogeneity for the photosynthetic light environment of a tropical forest. Agric. For. Meteorol. 278:107661. doi: 10.1016/j.agrformet.2019.107661
Pau, S., Detto, M., Kim, Y., and Still, C. J. (2018). Tropical forest temperature thresholds for gross primary productivity. Ecosphere 9:e02311. doi: 10.1002/ecs2.2311
Pecot, S. D., Horsley, S. B., Battaglia, M. A., and Mitchell, R. J. (2005). The influence of canopy, sky condition, and solar angle on light quality in a longleaf pine woodland. Can. J. For. Res. 35, 1356–1366. doi: 10.1139/x05-069
Pfitsch, W. A., and Pearcy, R. W. (1989). Daily carbon gain by Adenocaulon bicolor (Asteraceae), a redwood forest understory herb, in relation to its light environment. Oecologia 80, 465–470. doi: 10.1007/BF00380067
Phillips, N., Oren, R., Zimmermann, R., and Wright, S. J. (1999). Temporal patterns of water flux in trees and lianas in a Panamanian moist forest. Trees Struct. Funct. 14, 116–123. doi: 10.1007/s004680050216
Picart, L., Forget, P. M., D’Haese, C. A., Daugeron, C., Beni, S., Bounzel, R., et al. (2014). The Cafotrop method: an improved rope-climbing method for access and movement in the canopy to study biodiversity. Ecotropica 20, 45–52.
Potter, K. A., Arthur Woods, H., and Pincebourde, S. (2013). Microclimatic challenges in global change biology. Glob. Chang. Biol. 19, 2932–2939. doi: 10.1111/gcb.12257
Prévosto, B., Helluy, M., Gavinet, J., Fernandez, C., and Balandier, P. (2020). Microclimate in Mediterranean pine forests: what is the influence of the shrub layer? Agric. For. Meteorol. 282–283:107856. doi: 10.1016/j.agrformet.2019.107856
Proctor, M. C. F. (2003). Comparative ecophysiological measurements on the light responses, water relations and desiccation tolerance of the filmy ferns Hymenophyllum wilsonii Hook. and H. tunbrigense (L.) Smith. Ann. Bot. 91, 717–727. doi: 10.1093/aob/mcg077
Putzenlechner, B., Marzahn, P., Kiese, R., Ludwig, R., and Sanchez-Azofeifa, A. (2019). Assessing the variability and uncertainty of two-flux FAPAR measurements in a conifer-dominated forest. Agric. For. Meteorol. 264, 149–163. doi: 10.1016/j.agrformet.2018.10.007
R Core Team (2020). R: A Language and Environment for Statistical Computing. Vienna: R Foundation for Statistical Computing.
Rambo, T. R., and North, M. P. (2009). Canopy microclimate response to pattern and density of thinning in a Sierra Nevada forest. For. Ecol. Manag. 257, 435–442. doi: 10.1016/j.foreco.2008.09.029
Rascher, U., Freiberg, M., and Lüttge, U. (2012). Functional diversity of photosynthetic light use of 16 vascular epiphyte species under fluctuating irradiance in the canopy of a giant Virola michelii (Myristicaceae) tree in the tropical lowland forest of French Guyana. Front. Plant Sci. 2:117. doi: 10.3389/fpls.2011.00117
Renaud, V., Innes, J. L., Dobbertin, M., and Rebetez, M. (2011). Comparison between open-site and below-canopy climatic conditions in Switzerland for different types of forests over 10 years (1998-2007). Theor. Appl. Climatol. 105, 119–127. doi: 10.1007/s00704-010-0361-0
Richards, J. H., Torrez Luna, I. M., and Waller, D. M. (2020). Tree longevity drives conservation value of shade coffee farms for vascular epiphytes. Agric. Ecosyst. Environ. 301:107025. doi: 10.1016/j.agee.2020.107025
Schleppi, P., and Paquette, A. (2017). “Solar radiation in forests: theory for hemispherical photography,” in Managing Forest Ecosystems Hemispherical Photography in Forest Science: Theory, Methods, Applications, eds R. A. Fournier and R. J. Hall (Dordrecht: Springer). 15–52. doi: 10.1007/978-94-024-1098-3_2
Sillett, S. C., and Van Pelt, R. (2007). Structure of an old-growth redwood forest: trunk reiteration and limb formation promote epiphytes, soil development, and water storage in the canopy. Ecol. Monogr. 77, 335–359. doi: 10.1890/06-0994.1
Sinoquet, H., Le Roux, X., Adam, B., Ameglio, T., and Daudet, F. A. (2001). RATP: a model for simulating the spatial distribution of radiation absorption, transpiration and photosynthesis within canopies: application to an isolated tree crown. Plant Cell Environ. 24, 395–406. doi: 10.1046/j.1365-3040.2001.00694.x
Song, Q. H., Deng, Y., Zhang, Y. P., Deng, X. B., Lin, Y. X., Zhou, L. G., et al. (2017). Comparison of infrared canopy temperature in a rubber plantation and tropical rain forest. Int. J. Biometeorol. 61, 1885–1892. doi: 10.1007/s00484-017-1375-4
Tymen, B., Vincent, G., Courtois, E. A., Heurtebize, J., Dauzat, J., Marechaux, I., et al. (2017). Quantifying micro-environmental variation in tropical rainforest understory at landscape scale by combining airborne LiDAR scanning and a sensor network. Ann. For. Sci. 74:32. doi: 10.1007/s13595-017-0628-z
Ventre-Lespiaucq, A. B., Escribano-Rocafort, A. G., Delgado, J. A., Jiménez, M. D., de Casas, R. R., Granado-Yela, C., et al. (2016). Field patterns of temporal variations in the light environment within the crowns of a Mediterranean evergreen tree (Olea europaea). Trees Struct. Funct. 30, 995–1009. doi: 10.1007/s00468-015-1328-7
Von Arx, G., Dobbertin, M., and Rebetez, M. (2012). Spatio-temporal effects of forest canopy on understory microclimate in a long-term experiment in Switzerland. Agric. For. Meteorol. 16, 144–155. doi: 10.1016/j.agrformet.2012.07.018
Wagner, A., and McGraw, J. B. (2013). Sunfleck effects on physiology, growth, and local demography of American ginseng (Panax quinquefolius L.). For. Ecol. Manag. 291, 220–227. doi: 10.1016/j.foreco.2012.11.038
Wen, Y., Su, S., and Zhang, H. (2020). Effects of Canopy Microclimate on Chinese Chestnut (Castanea mollissima Blume) Nut Yield and Quality. Forests 11:97. doi: 10.3390/f11010097
Wieser, G., Peters, J., Luis, V. C., Morales, D., and Jimenez, M. S. (2002). Ecophysiological studies on the water relations in a Pinus canariensis stand, Tenerife, Canary Islands. Phyt. Ann. Rei Bot. 42, 291–304.
Zellweger, F. (2019). Estimating below-canopy light regimes using airborne laser scanning: an application to plant community analysis. Ecol. Evol. 9, 9149–9159. doi: 10.1002/ece3.5462
Zellweger, F., De Frenne, P., Lenoir, J., Rocchini, D., and Coomes, D. (2019). Advances in Microclimate Ecology Arising from Remote Sensing. Trends Ecol. Evol. 34, 327–341. doi: 10.1016/j.tree.2018.12.012
Zotz, G. (2005). Vascular epiphytes in the temperate zones - A review. Plant Ecol. 176, 173–183. doi: 10.1007/s11258-004-0066-5
Zotz, G. (2007). Johansson revisited : the spatial structure of epiphyte assemblages. J. Veg. Sci. 18, 123–130. doi: 10.1111/j.1654-1103.2007.tb02522.x
Zotz, G., Weigelt, P., Kessler, M., Kreft, H., and Taylor, A. (2021). EpiList 1.0: a global checklist of vascular epiphytes. Ecology 102:3326. doi: 10.1002/ecy.3326
Keywords: light, temperature, relative humidity, forestry, sensors, climate, microclimate, canopy
Citation: Murakami M, Nunes Ramos F, Durand M, Ashton R and Batke SP (2022) Quantification and Variation of Microclimatic Variables Within Tree Canopies - Considerations for Epiphyte Research. Front. For. Glob. Change 5:828725. doi: 10.3389/ffgc.2022.828725
Received: 03 December 2021; Accepted: 09 March 2022;
Published: 31 March 2022.
Edited by:
Paolo Giordani, University of Genoa, ItalyReviewed by:
Leonardo Montagnani, Free University of Bozen-Bolzano, ItalyCopyright © 2022 Murakami, Nunes Ramos, Durand, Ashton and Batke. This is an open-access article distributed under the terms of the Creative Commons Attribution License (CC BY). The use, distribution or reproduction in other forums is permitted, provided the original author(s) and the copyright owner(s) are credited and that the original publication in this journal is cited, in accordance with accepted academic practice. No use, distribution or reproduction is permitted which does not comply with these terms.
*Correspondence: Mariana Murakami, bWFyaWFuYW11cmFrYW1pQGdtYWlsLmNvbQ==
Disclaimer: All claims expressed in this article are solely those of the authors and do not necessarily represent those of their affiliated organizations, or those of the publisher, the editors and the reviewers. Any product that may be evaluated in this article or claim that may be made by its manufacturer is not guaranteed or endorsed by the publisher.
Research integrity at Frontiers
Learn more about the work of our research integrity team to safeguard the quality of each article we publish.