
95% of researchers rate our articles as excellent or good
Learn more about the work of our research integrity team to safeguard the quality of each article we publish.
Find out more
ORIGINAL RESEARCH article
Front. For. Glob. Change , 24 February 2022
Sec. Fire and Forests
Volume 5 - 2022 | https://doi.org/10.3389/ffgc.2022.758689
This article is part of the Research Topic Fire Behavior and Effects: From Observation to Model Development, Refinement, and Evaluation View all 4 articles
 Jeffrey F. Glusman*
 Caelan B. Lapointe
 Amanda S. Makowiecki
 Sam Simons-Wellin
 Gregory B. RiekerJohn W. Daily
 Peter E. Hamlington
Computational simulations have the potential to provide low-cost, low-risk insights into wildland fire structure and dynamics. Simulation accuracy is limited, however, by the difficulty of modeling physical processes that span a wide range of spatial scales. These processes include heat transfer via radiation and turbulent advection, as well as both solid- and gas-phase chemistry. In the present study, we perform large eddy simulation (LES) with adaptive mesh refinement to model the multi-phase pyrolysis and combustion of dry Douglas fir, where temperature-based lookup tables corresponding to a multi-step pyrolysis mechanism are used to represent the composition of gas-phase pyrolysis products. Gas-phase and surface temperatures, mass loss, and water vapor mole fraction from the LES are shown to compare favorably with experimental measurements of a radiatively heated Douglas fir fuel sample undergoing pyrolysis and combustion beneath a cone calorimeter. Using frequency comb laser diagnostics, optical and infrared cameras, and a load cell, the experiments provide simultaneous in situ, time-resolved measurements of chemical composition, temperature, and mass loss. The present study thus combines cutting edge computational and experimental techniques with multi-step chemical pyrolysis modeling to provide a validated computational tool for the prediction of solid fuel pyrolysis and combustion relevant to wildland fires.
It is anticipated that, over the coming decades, climate change will contribute to increased wildland fire activity, particularly in the Western U.S. (Westerling et al., 2006; Barbero et al., 2015; Westerling, 2016). This increase was evident, for example, in the 2020 fires in California, where the growing wildland urban interface (WUI) and dry conditions led to the deadliest fire season to date, including six of the top twenty largest wildfires ever recorded in the state (Insurance Information Institute, 2021).
The growing impact of such fires, particularly at the WUI, has motivated the continued development of scale-resolving computational simulations that can be used for more accurate predictions of ongoing and future fires, as well as to analyze mitigation and suppression strategies. Computational predictions of pollutants produced by controlled burns can also inform burn planning near highly populated areas to reduce societal impacts (Barber and Schweithelm, 2000; Keywood et al., 2013).
Despite the potential for simulations to provide low-cost, low-risk predictions of wildland fire, however, simulation accuracy is constrained by the challenge of representing physical processes spanning widely disparate scales (Hanson et al., 2000; Brown et al., 2018), from millimeter-scale chemical processes to atmospheric boundary layer processes at scales of tens to hundreds of kilometers. Moreover, multi-phase flow, solid fuel pyrolysis, chemical heat release, and heat transfer via both radiation and convection all occur simultaneously. Each of these processes depends on fuel type (i.e., specie of tree, grass or plant), fuel geometry (i.e., the shape of the entire tree, broken branch or leaves), and topography, among many other factors.
Although there is a growing trend in wildland fire research toward the use of physics-based models for wildland fire prediction (Linn et al., 2002, 2010; Sullivan, 2009; Mell et al., 2010; Morvan, 2011), these models must capture, either directly or using subgrid-scale parameterizations, the physics of wildland fuel combustion in the context of landscape scale numerical simulations that are coupled to atmospheric dynamics and weather (Coen et al., 2013). Even the prediction of solid fuel pyrolysis, ignition, and combustion at small scales poses challenges for many physics-based simulations, and the present study is focused on predicting these processes in a computationally efficient manner that can ultimately be scaled up to larger scales.
Prior studies of small-scale physical processes include pyrolysis simulations performed using Gpyro (Lautenberger, 2009). Gpyro originally utilized simple pyrolysis kinetics (specifically, single-component, multi-step kinetics) for an isolated volume of biomass, not coupled to any gaseous domain. Recently, the 3D extension of Gpyro, Gpyro3D (Lautenberger, 2014), was coupled with the Wildland-Urban Interface Fire Dynamics Simulator (WFDS) (Mell et al., 2009; McGrattan et al., 2013), but simplified the pyrolysate in the gas-phase to a lumped fuel molecule, namely, C3.4H6.2O2.5. A study by Gentile et al. (2017) used the bioSMOKE framework (Cuoci et al., 2013) to model isolated, arbitrarily shaped particles of biomass and accounted for anisotropy that is natural in biomass materials. Studies of pyrolysis coupled to gas-phase combustion include those by Gómez et al. (2016) and Farokhi et al. (2017), where Reynolds averaged Navier-Stokes simulations were used to model a grate-firing furnace and pellet-drop-feed boiler, respectively.
In the present study, we use large eddy simulations (LES) with adaptive mesh refinement (AMR) in OpenFOAM to simulate the solid wood combustion experiment performed by Makowiecki et al. (2020a). In this experiment, simultaneous in situ measurements of mass loss, heat flux, optical imaging, surface temperature, gas-phase temperature, and water vapor concentration were made for a fuel sample under a cone calorimeter. The measurements specifically focused on the pyrolysis of dry Douglas fir and the gas-phase ignition and combustion of pyrolysis products. The experiment had carefully controlled boundary conditions, enabling the use of the resulting measurements for simulation validation, and the diagnostic suite was non-intrusive. The surface temperature of the fuel sample was measured with a calibrated infrared imaging camera and simultaneous gas-phase temperature and water vapor concentration were measured with near-infrared frequency comb laser absorption spectroscopy (Coddington et al., 2016; Schroeder et al., 2017). This experiment thus combined both traditional and state-of-the-art quantitative diagnostics to provide rich time-resolved data for simulation validation.
The simulations presented here use fireDyMFoam (Lapointe et al., 2021), a new OpenFOAM solver based on fireFoam (Wang et al., 2011) that allows the use of load-balanced AMR for computationally efficient simulations of various types of fire spread problems. Here we add a custom boundary condition based on a multi-step pyrolysis kinetic model to capture the composition of gas-phase pyrolysis products, and compare the simulation and experimental results both pre- and post-ignition. The use of AMR has the potential to enable computationally tractable simulations that capture large- and small-scale terrain, as well as detailed fuel features. Simulations that include such physically relevant details while incorporating physics-based modeling could serve as the basis for new subgrid-scale models for existing landscape-scale fire spread modeling efforts. However, before implementing these tools, small-scale tests in a more controlled scenario must be understood.
In the following, we first briefly describe the experimental setup and measurements. The computational solver is then outlined in detail, including a description of the custom boundary condition for the pyrolysis products. Results from the simulations are then described and compared with the experimental measurements. Conclusions and directions for future research are provided at the end.
The experimental data used for simulation validation in this study were previously presented and described by Makowiecki et al. (2020a). The experimental configuration is shown in Figure 1 and consists of a [120 × 40 × 20] mm oven-dried (85°C) Douglas fir fuel sample placed on a load cell (for mass measurements) and positioned beneath a cone calorimeter. The cone calorimeter generated a 21.9 kW/m2 heat flux at the center of the sample, with uniformity over the full sample within 16% of the heat flux measured at the center. A calibrated infrared camera (FLIR A655SC) was used to measure the surface temperature of the sample, while gas-phase temperature and species mole fractions were measured with near-infrared frequency comb laser absorption spectroscopy (Coddington et al., 2016; Schroeder et al., 2017; Makowiecki et al., 2020a).
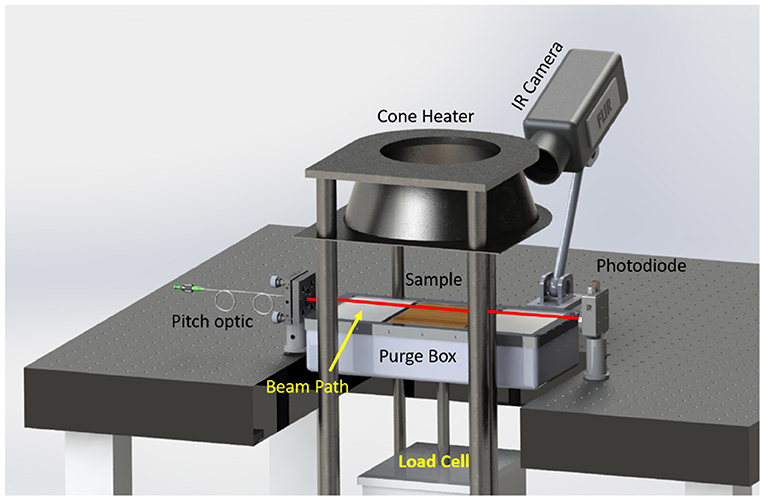
Figure 1. Experimental setup showing the configuration of the cone calorimeter, infrared (IR) camera, frequency comb laser beam path, and load cell.
This diverse suite of diagnostics provides simultaneous time-resolved measurements of surface temperature, mass loss, and line-of-sight absorption-weighted average gas-phase temperature and water mole fraction, nominally 4 mm above the surface. Additional details of the experimental setup and results can be found in the study of fuel moisture effects by Makowiecki et al. (2020a). These experiments contained a spark igniter operating at several Hz near the outer-surface of the wood, which ignited the pyrolysate, on average, 89 s after the experiment began.
The experiment was repeated seven times and the variability from each experiment is indicated in the results figures shown later in this paper. Because the physical properties of the samples have a large influence on the gas-phase simulation results, great care was taken while carrying out the experiments to completely dry the wood samples, accurately calculate the starting mass, and characterize the heat flux to the wood surface.
Although these small-scale experiments do not represent the full complexity found in real-world wildland fires, they do allow careful control of boundary conditions, as well as the ability to isolate variables of interest (e.g., heat flux and fuel moisture content). For the sake of having quantifiable boundary conditions for velocity and pressure, experiments were performed in a quiescent environment. Thus, these experiments are ideal for studying the detailed physical and chemical processes that must be modeled in simulations of wildland fuel pyrolysis and combustion. Experiments with additional fuel types were performed but the data has not yet been published; simulations of these other experiments are left as an important direction for future research.
The numerical simulations are performed in OpenFOAM (The OpenFOAM Foundation, 2019) using an extension of the fireFoam solver (Wang et al., 2011) called fireDyMFoam (Lapointe et al., 2020, 2021). Initially developed for simulations of pool fires (Wang et al., 2011), fireFoam has been used to model industrial fire problems in a number of different contexts and configurations (Meredith et al., 2013; Ding et al., 2015; Vilfayeau et al., 2015; Ren et al., 2016; Fukumoto et al., 2018). The fireDyMFoam solver retains the physical modeling present in fireFoam, but additionally incorporates AMR and dynamic re-balancing of computational processors to enable computationally efficient, yet high-resolution, simulations of fire spread and suppression. This solver has been described in more detail by Lapointe et al. (2020, 2021), where the number of cpu-hours required for AMR simulations was reduced by roughly a factor of five compared to equivalently resolved static mesh simulations, and is used here to perform three-dimensional LES of solid fuel pyrolysis and combustion in coupled gas- and solid-phase regions.
Within the gaseous domain, the Favre-filtered compressible Navier-Stokes equations are solved along with conservation equations for mass, total enthalpy, and reacting species. These equations are given as (Lapointe et al., 2021)
where ρ is density, U is velocity, prgh is dynamic pressure, p is total pressure, g is gravitational acceleration, h is specific sensible enthalpy, K is specific kinetic energy, and Yi is the mass fraction of the ith specie. Unity Lewis and Prandtl numbers are assumed and a one equation eddy-viscosity turbulence model is used to represent the turbulent contributions to the effective viscosity and thermal diffusivity, denoted μeff and αeff, respectively. The heat transfer terms Qrxn and Qrad represent effects due to reactions and radiations, respectively, and ωi is the reaction rate of the ith specie.
Within the solid, one-dimensional conservation equations for mass, reacting species, and enthalpy are solved to model heat transfer and pyrolysis (Chaos et al., 2011; Vinayak, 2017; Fukumoto et al., 2018). These equations are given as (Lapointe et al., 2021)
where ρs is the solid density, Ṙgas is pyrolysis gas production rate, Yk,s is the mass fraction of the kth solid chemical specie, Ṙk is the corresponding reaction rate, hs is the solid-phase specific enthalpy, and κs is the thermal conductivity. Source terms are included in the solid-phase enthalpy equations to account for radiation (Srad), reactions (Srxn), gas production (Sgas), and gas motion within the solid (Sflux).
Gas-phase combustion is modeled using infinitely-fast chemistry. Prior work with fireDyMFoam has shown that infinitely-fast chemistry can be used to accurately reproduce experimental measurements of diffusion flames in pool fires (Lapointe et al., 2020) and during solid-phase pyrolysis (Lapointe et al., 2021), supporting the use of this computational simplification in the present study.
The solid- and gas-phase regions are coupled using mixed, mapped boundary conditions for temperature, fuel mass fraction, and velocity. Temperature and velocity boundary conditions follow those described by Vinayak (2017). Fuel mass fractions are modeled using a look-up table approach to assign temperature-dependent compositions to the gas-phase pyrolysis products, as described in the next section.
From a physical standpoint, the pyrolysis process consists of thousands to millions of elementary reactions (Demirbaş, 2000). Reduced-order models are thus required to render the pyrolysis process computationally tractable. Attempts to capture the complexity of the pyrolysis mechanism with significantly simpler kinetics have included single-component/single-step, single-component/multi-step, multi-component/single-step, and multi-component/multi-step kinetics (Di Blasi, 2008). Ranzi et al. (2008) published a gas-phase chemical mechanism that relied on species that are produced in their multi-component/multi-step pyrolysis kinetic model. These models have been updated over the years with the assistance of pyrolysis experiments, notably by Corbetta et al. (2014), Debiagi et al. (2015), and Gentile et al. (2017). One common factor of these works is the lack of gaseous ignition or combustion modeling. The present study aims to combine the existing fireFoam (and by extension fireDyMFoam) framework for modeling solid-phase pyrolysis and gas-phase combustion with the multi-component/multi-step pyrolysis model published by Debiagi et al. (2015).
For simplicity and computational speed, we predict the rate of formation of char and gas-phase pyrolysis products using a single-component, single-step approach with an irreversible Arrhenius reaction, as given by
with the pyrolysis reaction rate, kpyro, given by
Here, n is the order of the reaction, A is the pre-exponential factor, β is the temperature dependent constant, T is the local solid-phase temperature, Ta is the activation temperature, where Ta ≡ Ea/Ru (namely, the activation energy divided by the universal gas constant). Temperature-varying specific heats are applied for wood and char in the form of a power-law fit given by
where c0, n0 and Tref are reference values of the specific heat, exponent, and temperature that must be defined for each fuel sample.
As defined in Eq. (9), the solid-phase reaction only proceeds after the critical temperature Tcrit is reached. Once produced, the pyrolysis gases are immediately transferred out of the solid; this approximation was recently validated by Agarwal et al. (2021). In the present study, we assign a temperature-dependent composition of these gases using a custom boundary coupling approach to convert the generic “gas” produced by pyrolysis of the solid-phase to multi-species products predicted by Debiagi et al. (2015). This study uses multi-step, multi-species kinetics to convert the main constituents of wood (i.e., cellulose, hemicellulose, lignin, and extractives) to combustible materials, intermediates, and char in a zero-dimensional process.
To incorporate this model within the OpenFOAM-7 pyrolysis framework, the equilibrium species mass fractions are tabulated as a function of temperature from 300 to 1,500 K in 5 K increments. Calculations were performed zero-dimensionally (i.e., as functions of time only) using ordinary differential equation integration (ode23s) in MATLAB, and the composition corresponding to each temperature was determined from the steady-state, or equilibrium, mass fractions. These are applied as look-up table functions at the solid-gas boundary in a custom version of the totalFlowRateAdvectiveDiffusive boundary condition. Here, the average temperature across the solid-gas interface is used to evaluate the pyrolysate composition by relative mass fractions of species entering the gaseous domain. Examples of these boundary conditions are included in the sample case found in the public github repository where fireDyMFoam can also be found (github.com/clapointe2011/public). While these new boundary conditions rely on the average surface temperature of the solid, they could also be extended to a cell-by-cell basis depending on the cell-valued temperature.
In the gas domain, first-order temporal integration and second-order spatial discretization are used. Total variation diminishing variants of the central differencing scheme are used for scalar divergence terms, stabilized central differencing is used for velocity divergence, and enthalpy gradients are limited to bound temperature. The solid region is numerically configured following cases provided with OpenFOAM (The OpenFOAM Foundation, 2019), resulting in first-order in time and second-order in space accuracy. Maximum advective Courant and solid diffusion numbers of 0.4 and 1, respectively, are used to set a global time step. Time integration is performed using the pressure-implicit with splitting of operators (PISO) algorithm, and a fixed number of 3 PISO loops are used. We use a finite-volume implementation of the discrete ordinate method to model radiative heat transfer, with the grey mean absorption emission radiation model, prescribed coefficients based on fireFoam tutorials, and 100 discrete angles.
Load-balanced AMR is used in the gas-phase region, where refinement is based on multiple fields simultaneously. Further details on the specific configuration of the AMR used here is provided in the next section, and additional description of the development, verification, and validation of AMR in the fireDyMFoam solver is provided in Lapointe et al. (2020, 2021).
In the following, we apply the fireDyMFoam solver described in Section 3 to simulate the experiments outlined in Section 2. We first outline the physical configuration of the simulations, followed by a description of the AMR approach used here, and then end with a comparison of the simulation and experimental results.
The simulations use a 1 m3 total domain size and a [0.12 × 0.04 × 0.02] m Douglas fir solid fuel sample to represent the experiments. Although this simulation configuration, shown in Figure 2, is an idealization of the experimental configuration provided schematically in Figure 1, the available experimental measurements were all taken at or near the surface of the Douglas fir sample, away from the cone-calorimeter, structural supports, and other diagnostic equipment. Thus, the influence of the surroundings is minimal and it is not necessary to model the full experimental geometry to obtain good agreement with the measurements, as will be shown in Section 4.4.
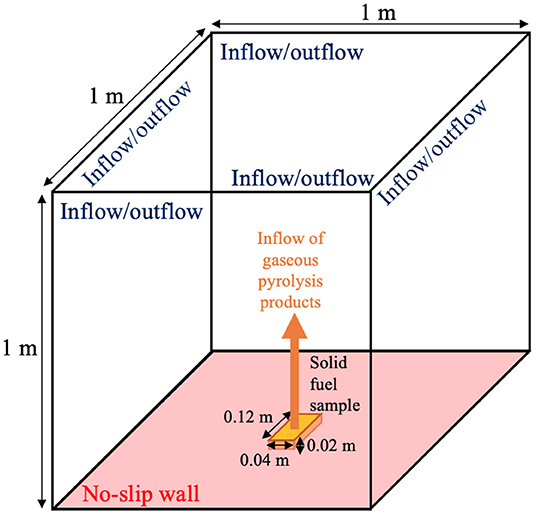
Figure 2. Schematic of the computational domain indicating boundary conditions, dimensions, and the location of the solid fuel sample on the bottom boundary.
The gaseous domain is initially filled with a quiescent mixture of air and water vapor to match the ambient experimental humidity. All sides of the gaseous region are open and allow for entrainment, with the exception of the base, which is modeled as a mild air co-flow (5 mm/s), and the solid-gas interface. This coupling takes the form of boundary conditions for velocity (to conserve the mass flux of gas from the solid region to pyrolysate species in the gaseous region), temperature (to conserve energy across the gas-solid interface), and species (converting generic “gas” product in the solid region to known species in the gaseous region). At 89 s, combustion is initiated via infinitely-fast chemistry, matching the time when the experiment was ignited via a spark.
In the solid region, physical properties are set to match those of the Douglas fir sample used in the experiment. Properties of the wood are assumed to be homogeneous, with wood density ρwood = 524 kg/m3 based on experimental measurements, char density ρchar = 73 kg/m3, thermal conductivities κwood = 0.11 W/(m·K) and κchar = 0.065 W/(m·K), emissivities of 0.759 and 0.957 for raw and charred wood, respectively. where c0, n0 and Tref are given in Table 1, and the specific heat of formation is set as kJ/kg (Parker, 1989; Ragland et al., 1991). To model the radiative heat source used in the experiment, a heat flux of 21.9 kW/m2 is applied uniformly to the interface following the implementation in Vinayak (2017). The variable specific heat of Douglas fir wood and char are prescribed by parameters in Table 1. The pyrolysis reaction parameters are those in Table 2.
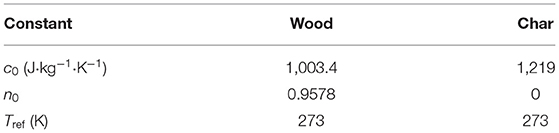
Table 1. Constants pertaining to the specific heat of wood and char as a function of temperature.
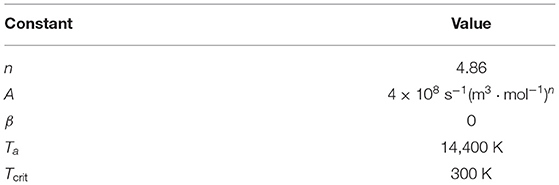
Table 2. Constants pertaining to the solid-phase reaction and associated reaction rate.
Initial mole fractions of cellulose, hemicellulose, LIG-C, LIG-H, LIG-O, TANN, and TGL for Douglas Fir from Debiagi et al. (2015), Faravelli et al. (2010), and Schwetz and Lipp (1985); Table 3 lists these in terms of weight percentages. Previous work (Glusman et al., 2019) used the experimental surface temperature measurements of Makowiecki et al. (2020a) to calculate the pyrolysate composition and compare to measured water mole fraction.
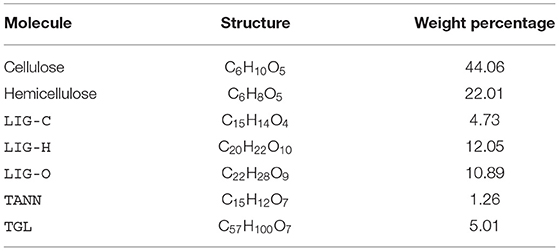
Table 3. Weight percentages of the main components of Douglas fir, including molecular structures.
The composition of the gas-phase pyrolysis products corresponding to the Douglas fir sample are obtained by running out isothermal pyrolysis to steady state at various temperatures, as described in Section 3.2. The resulting concentrations of the eighteen pyrolysate species are shown as functions of temperature in Figure 3, and are constrained such that the sum over all species mass fractions is unity.
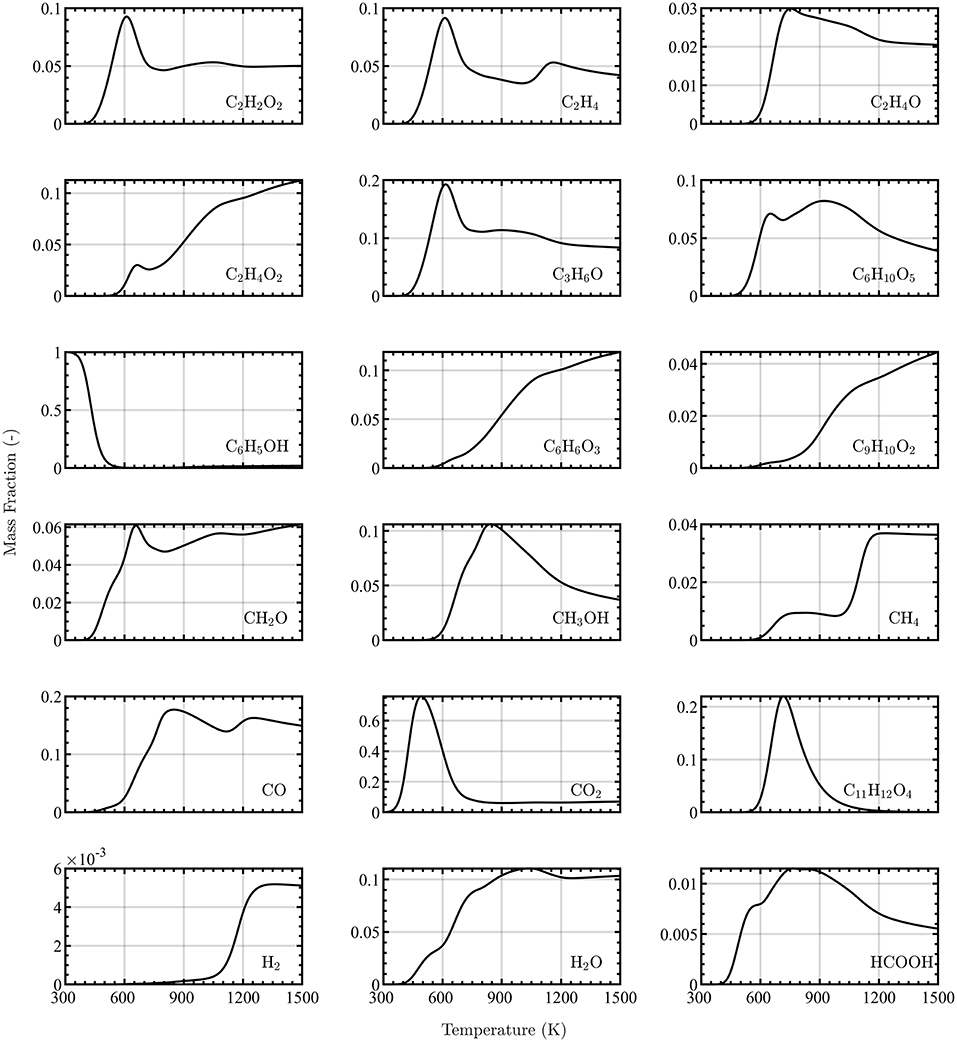
Figure 3. Equilibrium concentrations of 18 pyrolysate species as a function of temperature obtained from zero-dimensional integration of the multi-step pyrolysis kinetic model outlined by Debiagi et al. (2015).
The computational domain is discretized at the coarsest level with a 4-cm uniform mesh. The cells within a [0.20 × 0.25 × 0.10] m region centered on the bottom boundary are refined by three levels (i.e., eight times finer in each coordinate direction), corresponding to the region of interest. The solid-gas interface containing cells within a [0.12 × 0.04] m rectangle, centered at the bottom of the domain, are refined with an additional level of AMR and are extruded downwards by 0.02 m to create the computational mesh for the solid. The resulting gas region mesh is composed of roughly 40,000 cells. The solid-phase domain has 192 one-dimensional (vertically oriented) regions, each with 45 cells, for 8,640 total cells.
Within the gaseous region, three levels of AMR are used to attain 5 mm resolution in areas of active mixing of air and pyrolysate. Refinement is performed in areas of high methane concentration and high gradients of methane concentration. Heat release is also included in the AMR criteria for refining areas of active combustion. Each parameter is scaled between values of zero and one; using methane concentration as an example, the normalized concentration is given by
where is the normalized methane concentration, and the absolute methane concentration is [CH4]. The criteria for refinement is based on the top 97.5% of normalized methane concentration, the top 99% of normalized methane concentration gradient, and the top 99.9% of normalized heat release.
An example AMR mesh at one time step, including the corresponding temperature field, is shown in Figure 4. Although the mesh does not change substantially during the later stages of the simulation, the AMR effectively provides a minimal mesh required to maintain the target resolution, resulting in an efficient numerical approach that does not require a priori knowledge of the flow. The majority of the simulation is run with roughly 65,000 cells. Comparable results were achieved with static mesh refinement (SMR) with nearly 385,000 cells.
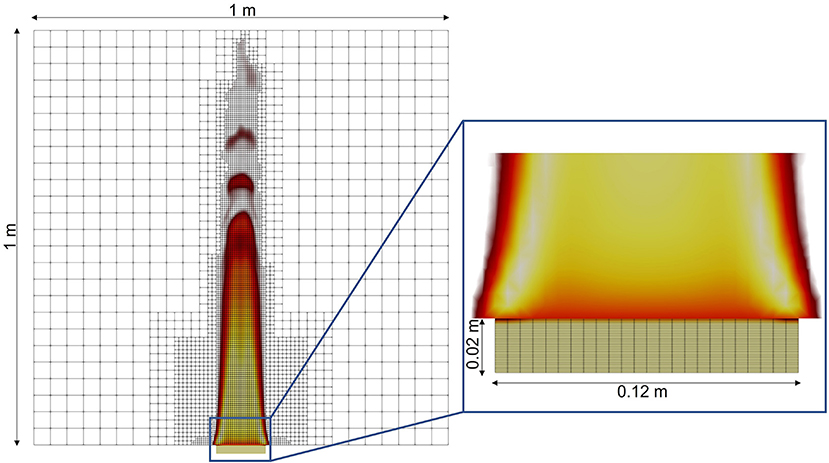
Figure 4. Gas- and solid-phase meshes, showing the temperature field from low (red, 750 K) to high (white, 1,650 K) and the char in the solid (inset) from low (tan, 0) to high (brown, 0.25) using infinitely-fast chemistry with three levels of AMR in the gas-phase.
Because data collected from the frequency combs is line-of-sight averaged, simulated values for gas-phase temperature and species must be similarly processed. Values are linearly interpolated onto horizontal profiles across the center of the block at 2, 4, and 6 mm above the surface due to uncertainty in laser location attributable to swelling of the wood surface and beam steering (due to changes in the index of refraction) during the course of the experiment. Profile averages are then compared to experimental data.
Good agreement is observed between experimental and computational results for the solid surface temperature, as shown in Figure 5 for the simulated cases. The experimental surface temperatures were determined from the infrared camera using a constant surface emissivity, a time-varying mixture-dependent (wood and char) value is used computationally. The experimental mean was calculated from the beginning of each run until one experiment ignited, after that a dotted line is used to indicate an extrapolated experimental mean. Post-ignition surface temperature measurements are not shown for the experiment as the flame interferes with the measurement accuracy. Future experiments will utilize embedded thermocouples to capture the surface temperature post-ignition at near-surface locations and subsequent depths to further verify the solid model.
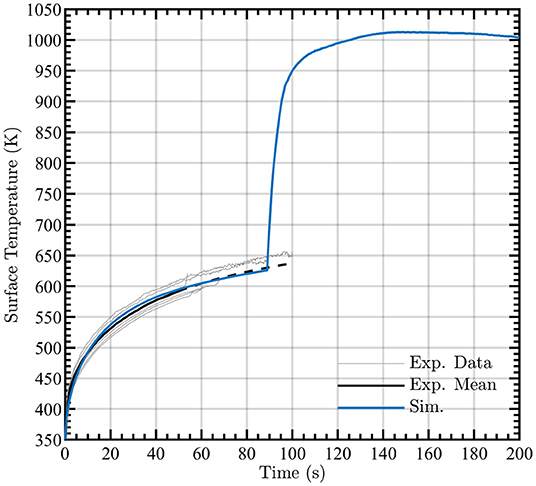
Figure 5. Simulated surface temperature during pyrolysis (blue line) compared to average experimental FLIR measurements prior to ignition (black solid and dotted lines, dotted lines are extrapolated from experimental mean once some experiments had ignited). Observed surface temperatures for each experiment are shown by gray lines.
Figure 6 indicates that the simulated cumulative mass loss is accurate in capturing the mass loss during most of the combustion process. The experimental and simulated data are centered with respect to one another by setting the time of ignition to t = 0 s. Potential sources of discrepancy are that char oxidation and the physics of smoldering combustion are not explicitly solved in this model. Furthermore, the one-dimensional nature of the solid region inhibits heat transfer transversely and thus diminishes the mass loss at later times where high surface temperatures are prevalent. Of particular interest, even in the absence of finite-rate chemistry in the gas-phase combustion, it is possible to obtain agreement with the solid-surface temperature and cumulative mass loss with the time-resolved experiments. The mass loss rates from the simulations and experiments are shown in Figure 7, revealing reasonable agreement during the pyrolysis phase and qualitative agreement of the mass loss trends post-ignition. These data are also ignition-centered in time.
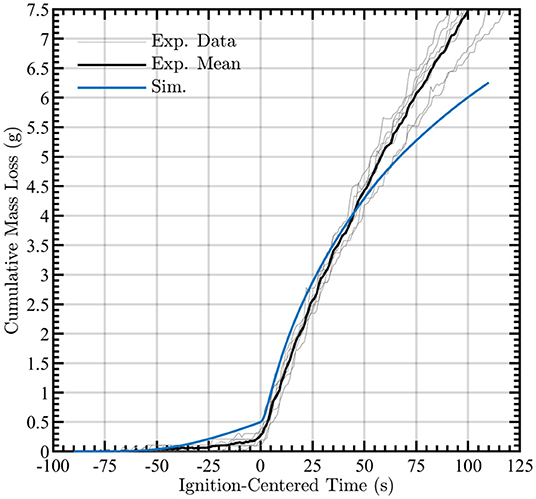
Figure 6. Simulated cumulative mass loss during pyrolysis and post-ignition (blue line) compared to the mean experimental measurements (black line). Observed mass loss time-series for each experiment are shown by gray lines.
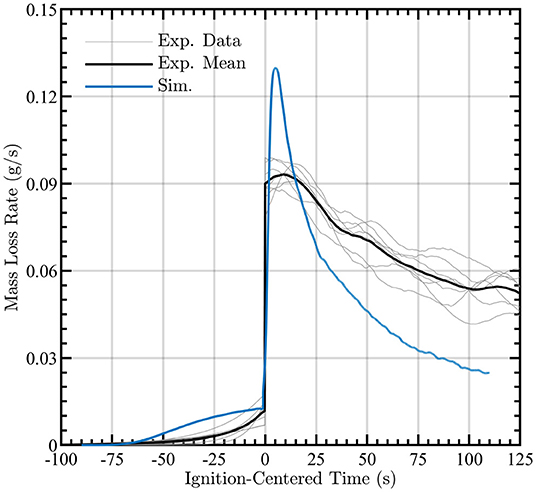
Figure 7. Simulated cumulative mass loss rate during pyrolysis and post-ignition (blue line) compared to the mean experimental measurements (black line). Observed mass loss rate profiles for each experiment are shown by gray lines.
The simulated time-series of gas-phase temperature is shown in Figure 8. Included in the figure are “clouds” of simulated temperatures at the nominal height of 4 ± 2 mm to capture uncertainty in the measurement height. Two factors cause the height uncertainty: as pyrolysis occurs, it is expected that the wood sample surface would swell and deform in-homogeneously and laser beam steering due to the index of refraction changing in the gas above the sample. The gray lines in Figure 8 show results from seven independent experiments of the same configuration. These results are centered at the time of ignition, enabling easier identification of temporal variations pre- and post-ignition. Simulations and averaging were carried out with the average ignition time of 89 s. Figure 8 shows that the simulation produces good agreement of gas-phase temperature after ignition although the gas-phase temperature is over-predicted during pyrolysis. This indicates that more sophisticated modeling of the solid-phase may be necessary, which is an important direction for future research.
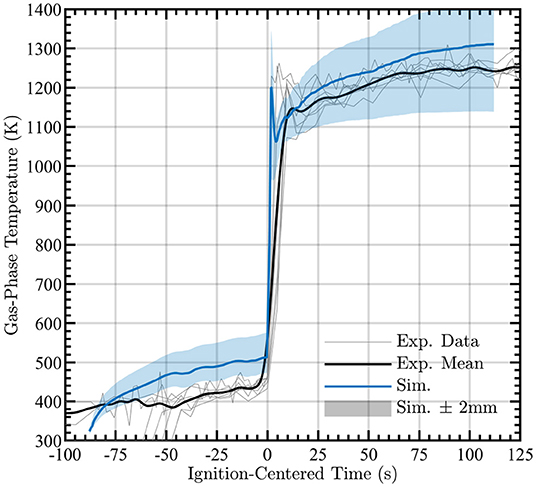
Figure 8. Simulated gas-phase temperature during pyrolysis and combustion (blue line) compared to experimental measurements nominally taken at 4 mm (black line). Clouds surrounding data provide measurements at ±2 mm from nominal measurement height. Observed gas-phase temperature measurements for each experiment are shown as gray lines.
The water vapor mole fraction, normalized by ignition time, is shown in Figure 9 along with “clouds” of simulated temperatures at the nominal height of 4 ± 2 mm to capture uncertainty in the measurement height. A deficit of water vapor during pyrolysis and the deficit persists after ignition. This discrepancy points to the need for additional improvements to the pyrolysis boundary conditions post-ignition and to the composition of the pyrolysate. However, given the simplicity (i.e., infinitely-fast chemistry and use of only methane and water as the pyrolysate) of the computational model used here, the present results are promising for future simulations.
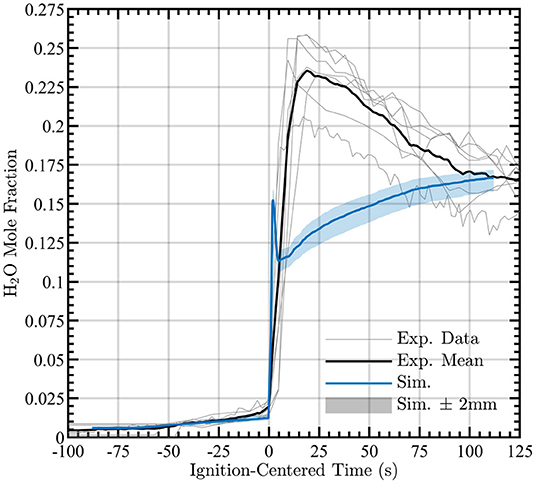
Figure 9. Simulated H2O mole fraction during pyrolysis and combustion (blue line) compared to experimental measurements nominally taken at 4 mm (black line). Clouds surrounding data provide measurements at ±2 mm from nominal measurement height. Observed gas-phase water mole fraction measurements for each experiment are shown by gray lines.
It has been shown that physics-based simulations in OpenFOAM can be performed to obtain agreement with experimental measurements of Douglas fir pyrolysis and combustion. These simulations leveraged AMR to achieve high computational efficiency for a resolution sufficient to model pyrolysis and combustion with infinite-rate chemistry. In particular, good agreement is shown with experimental time-series of gas and surface temperatures, and cumulative mass loss. The deficit in water vapor mole fraction in the gas-phase requires additional improvements to the custom boundary conditions to allow for additional pyrolysate fuel.
Future work will focus on extensions to include additional pyrolysate species, finite-rate chemistry, char oxidation, and smoldering combustion. With more pyrolysis and combustion relevant species, comparisons to the mid-infrared frequency comb measurements of Makowiecki et al. (2020b) will be possible with the inclusion of the reduced biomass combustion model published by Glusman et al. (2019). Moreover, coupling these computationally efficient simulations with parameter estimation methods such as approximate Bayesian computation (Christopher et al., 2018), could allow for automated estimation of simulation parameters (i.e., heat of reaction and Arrhenius reaction coefficients) as well as initial conditions (i.e., temperature and water mole fraction) and/or boundary conditions (i.e., unmeasured parameters during experimental procedure).
The case files and associated custom solvers and boundary conditions can be found at https://zenodo.org/record/5899181#.Ye8JTv7MKUk and the solver can be found in the github repository https://github.com/clapointe2011/public.
JG, CL, SSW, and PH were jointly responsible for the simulation and algorithm development. AM and GR provided the experimental data. Frequent discussions with JD guided integration of chemical models into simulation framework. All authors contributed to the article and approved the submitted version.
This research was supported by the Strategic Environmental Research and Development Program (SERDP) under grant W912HQ-16-C-0026 as project number RC-2642. CL was supported by the National Science Foundation Graduate Research Fellowship Program under Grant No. NSF GRFP, DGE 1144083. This work utilized the Texas Advanced Computing Center (TACC) at the University of Texas at Austin for providing HPC resources that have contributed to the research results reported. This work utilized the Summit supercomputer, which is supported by the National Science Foundation (awards ACI-1532235 and ACI-1532236), the University of Colorado Boulder, and Colorado State University.
The authors declare that the research was conducted in the absence of any commercial or financial relationships that could be construed as a potential conflict of interest.
All claims expressed in this article are solely those of the authors and do not necessarily represent those of their affiliated organizations, or those of the publisher, the editors and the reviewers. Any product that may be evaluated in this article, or claim that may be made by its manufacturer, is not guaranteed or endorsed by the publisher.
Agarwal, G., Chaos, M., and Wang, Y. (2021). Validation of pyrolysis model in transient heating scenarios and diverse spectral boundary conditions. Fire Saf. J. 120:103064. doi: 10.1016/j.firesaf.2020.103064
Barber, C. V., and Schweithelm, J. (2000). Trial by Fire. Washington, DC: World Resources Institute.
Barbero, R., Abatzoglou, J., Larkin, N., Kolden, C., and Stocks, B. (2015). Climate change presents increased potential for very large fires in the contiguous United States. Int. J. Wildl. Fire 24, 892–899. doi: 10.1071/WF15083
Brown, A., Bruns, M., Gollner, M., Hewson, J., Maragkos, G., Marshall, A., et al. (2018). Proceedings of the first workshop organized by the IAFSS working group on measurement and computation of fire phenomena (MaCFP). Fire Saf. J. 101, 1–17. doi: 10.1016/j.firesaf.2018.08.009
Chaos, M., Khan, M. M., Krishnamoorthy, N., de Ris, J. L., and Dorofeev, S. B. (2011). Evaluation of optimization schemes and determination of solid fuel properties for CFD fire models using bench-scale pyrolysis tests. Proc. Combust. Inst. 33, 2599–2606. doi: 10.1016/j.proci.2010.07.018
Christopher, J. D., Wimer, N. T., Lapointe, C., Hayden, T. R., Grooms, I., Rieker, G. B., et al. (2018). Parameter estimation for complex thermal-fluid flows using approximate Bayesian computation. Phys. Rev. Fluids 3:104602. doi: 10.1103/PhysRevFluids.3.104602
Coddington, I., Newbury, N., and Swann, W. (2016). Dual-comb spectroscopy. Optica 3, 414–426. doi: 10.1364/OPTICA.3.000414
Coen, J. L., Cameron, M., Michalakes, J., Patton, E. G., Riggan, P. J., and Yedinak, K. M. (2013). WRF-fire coupled weather-wildland fire modeling with the weather research and forecasting model. J. Appl. Meteorol. Climatol. 52, 16–38. doi: 10.1175/JAMC-D-12-023.1
Corbetta, M., Frassoldati, A., Bennadji, H., Smith, K., Serapiglia, M. J., Gauthier, G., et al. (2014). Pyrolysis of centimeter-scale woody biomass particles kinetic modeling and experimental validation. Energy Fuels 28, 3884–3898. doi: 10.1021/ef500525v
Cuoci, A., Frassoldati, A., Faravelli, T., and Ranzi, E. (2013). A computational tool for the detailed kinetic modeling of laminar flames: application to C2H4/CH4 coflow flames. Combust. Flame 160, 870–886. doi: 10.1016/j.combustflame.2013.01.011
Debiagi, P. E. A., Pecchi, C., Gentile, G., Frassoldati, A., Cuoci, A., Faravelli, T., et al. (2015). Extractives extend the applicability of multistep kinetic scheme of biomass pyrolysis. Energy Fuels 29, 6544–6555. doi: 10.1021/acs.energyfuels.5b01753
Demirbaş, A. (2000). Mechanisms of liquefaction and pyrolysis reactions of biomass. Energy Convers. Manage. 41, 633–646. doi: 10.1016/S0196-8904(99)00130-2
Di Blasi, C. (2008). Modeling chemical and physical processes of wood and biomass pyrolysis. Prog. Energy Combust. Sci. 34, 47–90. doi: 10.1016/j.pecs.2006.12.001
Ding, Y., Wang, C., and Lu, S. (2015). Modeling the pyrolysis of wet wood using FireFOAM. Energy Convers. Manage. 98, 500–506. doi: 10.1016/j.enconman.2015.03.106
Faravelli, T., Frassoldati, A., Migliavacca, G., and Ranzi, E. (2010). Detailed kinetic modeling of the thermal degradation of lignins. Biomass Bioener. 34, 290–301. doi: 10.1016/j.biombioe.2009.10.018
Farokhi, M., Birouk, M., and Tabet, F. (2017). A computational study of a small-scale biomass burner: the influence of chemistry, turbulence and combustion sub-models. Energy Convers. Manage. 143, 203–217. doi: 10.1016/j.enconman.2017.03.086
Fukumoto, K., Wang, C., and Wen, J. (2018). Large eddy simulation of upward flame spread on PMMA walls with a fully coupled fluid-solid approach. Combust. Flame 190, 365–387. doi: 10.1016/j.combustflame.2017.11.012
Gentile, G., Debiagi, P. E. A., Cuoci, A., Frassoldati, A., Ranzi, E., and Faravelli, T. (2017). A computational framework for the pyrolysis of anisotropic biomass particles. Chem. Eng. J. 321, 458–473. doi: 10.1016/j.cej.2017.03.113
Glusman, J. F., Niemeyer, K. E., Makowiecki, A. S., Wimer, N. T., Lapointe, C. B., Rieker, G. B., et al. (2019). Reduced gas-phase kinetic models for burning of Douglas fir. Front. Mech. Eng. 5:40. doi: 10.3389/fmech.2019.00040
Gómez, M., Porteiro, J., De la Cuesta, D., Pati no, D., and Mìguez, J. (2016). Numerical simulation of the combustion process of a pellet-drop-feed boiler. Fuel 184, 987–999. doi: 10.1016/j.fuel.2015.11.082
Hanson, H., Bradley, M., Bossert, J., Linn, R., and Younker, L. (2000). The potential and promise of physics-based wildfire simulation. Environ. Sci. Policy 3, 161–172. doi: 10.1016/S1462-9011(00)00083-6
Insurance Information Institute (2021). Facts + Statistics: Wildfires. Available online at: https://www.iii.org/fact-statistic/facts-statistics-wildfires
Keywood, M., Kanakidou, M., Stohl, A., Dentener, F., Grassi, G., Meyer, C., et al. (2013). Fire in the air: biomass burning impacts in a changing climate. Crit. Rev. Environ. Sci. Technol. 43, 40–83. doi: 10.1080/10643389.2011.604248
Lapointe, C., Wimer, N. T., Glusman, J. F., Makowiecki, A. S., Daily, J. W., Rieker, G. B., et al. (2020). Efficient simulation of turbulent diffusion flames in openfoam using adaptive mesh refinement. Fire Safety J. 111:102934. doi: 10.1016/j.firesaf.2019.102934
Lapointe, C., Wimer, N. T., Simons-Wellin, S., Glusman, J. F., Rieker, G. B., and Hamlington, P. E. (2021). Efficient simulations of propagating flames and fire suppression optimization using adaptive mesh refinement. Fluids 6:323. doi: 10.3390/fluids6090323
Lautenberger, C. (2009). GPYRO-A Generalized Pyrolysis Model for Combustible Solids-Users' Guide. Version 0.700 Berkeley, CA.
Lautenberger, C. (2014). Gpyro3D: a three dimensional generalized pyrolysis model. Fire Saf. Sci. 11, 193–207. doi: 10.3801/IAFSS.FSS.11-193
Linn, R., Reisner, J., Colman, J., and Winterkamp, J. (2002). Studying wildfire behavior using FIRETEC. Int. J. Wild. Fire 11, 233–246. doi: 10.1071/WF02007
Linn, R., Winterkamp, J., Weise, D., and Edminster, C. (2010). A numerical study of slope and fuel structure effects on coupled wildlfire behavior. Int. J. Wild. Fire 19, 179–201. doi: 10.1071/WF07120
Makowiecki, A., Steinbrenner, J., Wimer, N., Glusman, J., Lapointe, C., Daily, J., et al. (2020a). Dual frequency comb spectroscopy of solid fuel pyrolysis and combustion: quantifying the influence of moisture content in douglas fir. Fire Saf. J. 116:103185. doi: 10.1016/j.firesaf.2020.103185
Makowiecki, A. S., Herman, D. I., Hoghooghi, N., Strong, E. F., Cole, R. K., Ycas, G., et al. (2020b). Mid-infrared dual frequency comb spectroscopy for combustion analysis from 2.8 to 5 μm. Proc. Combust. Instit. 38, 1627–1635. doi: 10.1016/j.proci.2020.06.195
McGrattan, K., Hostikka, S., McDermott, R., Floyd, J., Weinschenk, C., and Overholt, K. (2013). Fire dynamics simulator user's guide. NIST Spec. Publ. 1–339. doi: 10.6028/NIST.sp.1019
Mell, W., Maranghides, A., McDermott, R., and Manzello, S. L. (2009). Numerical simulation and experiments of burning Douglas fir trees. Combust. Flame 156, 2023–2041. doi: 10.1016/j.combustflame.2009.06.015
Mell, W. E., McDermott, R. J., and Forney, G. P. (2010). “Wildland fire behavior modeling perspectives, new approaches and applications,” in Proceedings of 3rd Fire Behavior and Fuels Conference (Spokane, WA), 45–62.
Meredith, K., de Vries, J., Wang, Y., and Xin, Y. (2013). A comprehensive model for simulating the interaction of water with solid surfaces in fire suppression environments. Proc. Combust. Instit. 34, 2719–2726. doi: 10.1016/j.proci.2012.06.094
Morvan, D. (2011). Physical phenomena and length scales governing the behaviour of wildfires a case for physical modelling. Fire Technol. 47, 437–460. doi: 10.1007/s10694-010-0160-2
Parker, W. (1989). Prediction of the heat release rate of Douglas fir. Fire Saf. Sci. 2, 337–346. doi: 10.3801/IAFSS.FSS.2-337
Ragland, K., Aerts, D., and Baker, A. (1991). Properties of wood for combustion analysis. Bioresour. Technol. 37, 161–168. doi: 10.1016/0960-8524(91)90205-X
Ranzi, E., Cuoci, A., Faravelli, T., Frassoldati, A., Migliavacca, G., Pierucci, S., et al. (2008). Chemical kinetics of biomass pyrolysis. Energy Fuels 22, 4292–4300. doi: 10.1021/ef800551t
Ren, N., Wang, Y., Vilfayeau, S., and Trouvé, A. (2016). Large eddy simulation of turbulent vertical wall fires supplied with gaseous fuel through porous burners. Combust. Flame 169, 194–208. doi: 10.1016/j.combustflame.2015.12.008
Schroeder, P. J., Wright, R. J., Coburn, S., Sodergren, B., Cossel, K. C., Droste, S., et al. (2017). Dual frequency comb laser absorption spectroscopy in a 16 mw gas turbine exhaust. Proc. Combust. Inst. 36, 4565–4573. doi: 10.1016/j.proci.2016.06.032
Schwetz, K., and Lipp, A. (1985). Ullmann's encyclopedia of industrial chemistry. VCH Deerfield Beach 28:315.
Sullivan, A. L. (2009). Wildland surface fire spread modelling, 1990-2007. 1 physical and quasi-physical models. Int. J. Wildl. Fire 18, 349–368. doi: 10.1071/WF06143
Vilfayeau, S., Ren, N., Wang, Y., and Trouvé, A. (2015). Numerical simulation of under-ventilated liquid-fueled compartment fires with flame extinction and thermally-driven fuel evaporation. Proc. Combust. Inst. 35, 2563–2571. doi: 10.1016/j.proci.2014.05.072
Vinayak, A. (2017). Mathematical modeling and simulation of pyrolysis and flame spread in OpenFOAM (Master's thesis). University of Wuppertal, Wuppertal, Germany.
Wang, Y., Chatterjee, P., and de Ris, J. (2011). Large eddy simulation of fire plumes. Proc. Combust. Inst. 33, 2473–2480. doi: 10.1016/j.proci.2010.07.031
Westerling, A. L. (2016). Increasing western us forest wildfire activity sensitivity to changes in the timing of spring. Philos. Trans. R. Soc. B 371:20150178. doi: 10.1098/rstb.2015.0178
Keywords: combustion, Douglas fir, adaptive mesh refinement, chemical kinetics, pyrolysis, OpenFOAM
Citation: Glusman JF, Lapointe CB, Makowiecki AS, Simons-Wellin S, Rieker GB, Daily JW and Hamlington PE (2022) Validation of Computationally Efficient Simulations of Douglas Fir Pyrolysis and Combustion Using Time-Resolved Frequency Comb Laser Measurements. Front. For. Glob. Change 5:758689. doi: 10.3389/ffgc.2022.758689
Received: 14 August 2021; Accepted: 13 January 2022;
Published: 24 February 2022.
Edited by:
Kara Yedinak, United States Forest Service (USDA), United StatesReviewed by:
Mariam Fawaz, University of Illinois at Urbana-Champaign, United StatesCopyright © 2022 Glusman, Lapointe, Makowiecki, Simons-Wellin, Rieker, Daily and Hamlington. This is an open-access article distributed under the terms of the Creative Commons Attribution License (CC BY). The use, distribution or reproduction in other forums is permitted, provided the original author(s) and the copyright owner(s) are credited and that the original publication in this journal is cited, in accordance with accepted academic practice. No use, distribution or reproduction is permitted which does not comply with these terms.
*Correspondence: Jeffrey F. Glusman, amVmZi5nbHVzbWFuQGNvbG9yYWRvLmVkdQ==
Disclaimer: All claims expressed in this article are solely those of the authors and do not necessarily represent those of their affiliated organizations, or those of the publisher, the editors and the reviewers. Any product that may be evaluated in this article or claim that may be made by its manufacturer is not guaranteed or endorsed by the publisher.
Research integrity at Frontiers
Learn more about the work of our research integrity team to safeguard the quality of each article we publish.