 Byron Maza
 Marina Rodes-Blanco
 Edison Rojas
- 1Facultad de Ciencias de la Tierra y Agua, Universidad Regional Amazónica Ikiam, Tena, Ecuador
- 2Environmental Remote Sensing Research Group, Department of Geology, Geography and the Environment, University of Alcalá, Alcalá de Henares, Spain
- 3Independent Consultant, Loja, Ecuador
The aim of this research was to assess how aboveground biomass (AGB) changes along an altitudinal gradient in evergreen Andean–Amazonian forests [Evergreen Lower Montane Forest, northeastern Cordillera of the Andes; Evergreen Piedmont Forest (EPF), northeastern Cordillera of the Andes; and Evergreen Lowland Forest (ELF), Napo–Curaray] from 373 to 1,826 m above sea level (m.a.s.l.). All trees measured in nine permanent 0.36-ha plots (60 × 60 m) were ≥ 10-cm (diameter at breast height) in the aforementioned ecosystems. We assessed tree density, basal area, species richness, and AGB. In the tree inventory, we measured 2,132 trees (Lower Montane Forest 687, Piedmont Forest 773, and Lowland Forest 672). AGB (Mg ha–1) increases with decreasing elevations: 310.26 ± 81.59 (SD) for the Evergreen Lower Montane Forest, 347.73 ± 90.38 (SD) for the EPF, and 377.39 ± 42.73 (SD) for the ELF. Otoba glycycarpa and Alchornea latifolia were the species with the highest biomass importance value (BIV) in the Evergreen Lower Montane Forest (1,421–1,826 m.a.s.l.), Spirotheca rosea and Pouteria glomerata in the EPF (892–1,195 m.a.s.l.), and Otoba glycycarpa and Iriartea deltoidea in ELF (373–394 m.a.s.l.). Biomass contribution along the altitudinal gradient in the evergreen Andean–Amazonian forests is concentrated in few species. This has implications in forest management and reforestation programs where the main focus is on carbon sequestration.
Introduction
Tropical forests act as a large carbon sink (Lal, 2005; Pan et al., 2011). Although these forests provide the ecosystem service of carbon sequestration, they suffer degradation as a result of selective logging (Eguiguren et al., 2020) or total removal due to changes in land uses for agriculture and livestock. Deforestation is responsible for much of the greenhouse gas emissions in South America (Sy et al., 2015; Erb et al., 2018). In tropical forests, carbon stored in aboveground biomass (AGB) depends on multiple factors and scales. At large scales, the main drivers of AGB in South American subtropical forests are climate (temperature annual range) and large-sized trees but not diversity (Bordin et al., 2021). In African Tropical forests, AGB is mediated by climate (precipitation and temperature) and soils (Lewis et al., 2013). In Amazonian lowland forest, AGB correlates with forest structure, soil, and climate variables (Baraloto et al., 2011), and Poorter et al. (2015) found that AGB is driven by rainfall, forest attributes (tree density, tree size), and rarefied species richness.
Regarding variation in AGB stocks in the Andes, studies report that there is no relationship between temperature/altitude and biomass stocks (Peña et al., 2018); in contrast, several studies report that the basal area increases with elevation, whereas the species richness decreases (González-Caro et al., 2020; Malizia et al., 2020); the maximum of the basal area is between 1,800 and 2,000 m above sea level (m.a.s.l). This could be due to the contribution of temperate-affiliated species (González-Caro et al., 2020) or the effect of climate change that forces tree species to migrate to higher areas, a phenomenon known as “thermophilization” (Fadrique et al., 2018; Peña et al., 2018). At small spatial scales, the drivers of AGB are taxonomic forest attributes, such as species richness, rarefied richness, and Shannon diversity (Chisholm et al., 2013), and forest attributes, such as tree density, tree size, and soil properties (Unger et al., 2012; Poorter et al., 2015). Concerning the AGB productivity, it is influenced by mortality patterns due to natural disturbance in the forest (Peña et al., 2018; Duque et al., 2021) and mycorrhizal associations (Duque et al., 2021). AGB productivity and phylogenetic diversity are negatively correlated in Andean forests (Duque et al., 2021), and woody growth declined with elevation at this latitudinal zone, but the basal area increased in Lower Montane Moist Forests (Báez et al., 2015).
Most of the studies related to the floristic diversity and structure of the forests of the Ecuadorian Amazon Region (EAR) have been developed in the lowland forests of the Amazon (Valencia et al., 1994, 2004); therefore, areas of the Amazon closer to the Andes have not been studied with the same intensity. Moreover, only few studies have been carried out along an altitudinal gradient in the Ecuadorian Evergreen Andean–Amazonian forests (e.g., Homeier et al., 2010; Torres et al., 2020), in contrast to a greater number of studies conducted in the South American tropical forests region (e.g., Malhi et al., 2017; Fadrique et al., 2018; Peña et al., 2018; González-Caro et al., 2020; Malizia et al., 2020; Blundo et al., 2021). Studies of forest structure, diversity, biomass, and carbon stocks along an altitudinal gradient are important because the record and distribution of tree species in the tropics are poorly represented in studies that seek to predict the impact of disturbances on forest dynamics, including the effects of climate change (Feeley et al., 2015). The forests of the EAR have a high diversity of tree species per hectare (Valencia et al., 1994, 2004). This diversity implies a heterogeneity of wood densities (Chave et al., 2005, 2009, 2014; Poorter, 2007) that influence the variability of carbon stocks per hectare in the different types of forest.
Our study aims to study the floristic diversity and to elucidate which species contributes the most to AGB in forests at different altitudes and could therefore provide a framework for forest restoration projects aimed at maximum carbon sequestration in Ecuador, along an altitudinal gradient (350–1,850 m.a.s.l.) in an Evergreen Andean–Amazonian Forest. Based on previous experiences, we hypothesize that Evergreen Andean–Amazonian Forest has, in general, a high diversity of species, but only few species concentrate the majority of biomass. We expect a decline in AGB as well as tree height and diameter with elevation.
Materials and Methods
Study Area
The study was conducted in three ecosystems of the EAR: (a) Evergreen Lower Montane Forest (ELMF), northeastern Cordillera of the Andes; (b) Evergreen Piedmont Forest (EPF), northeastern Cordillera of the Andes; and (c) Evergreen Lowland Forest (ELF), Napo–Curaray, according to the Ecosystem Classification of Continental Ecuador (Ministerio de Ambiente del Ecuador (MAE), 2013). The study sites were located within and in the buffer zone of the Colonso–Chalupas Biological Reserve and the Lowland Forest in the Protective Forest of the Runashito Community, respectively (Figure 1). Mean annual temperatures and mean annual rainfall range from 17.9 to 24.2°C and from 3,229 to 3,986 mm, respectively, and elevation varies between 373 and 1,826 m.a.s.l. (Table 1). The ELF plots are classified as megathermal and hyperhumid with no water deficit, whereas the EPF and ELMF sites are classified as mesothermal and humid with little water deficit (Thornthwaite, 1948; Table 1).
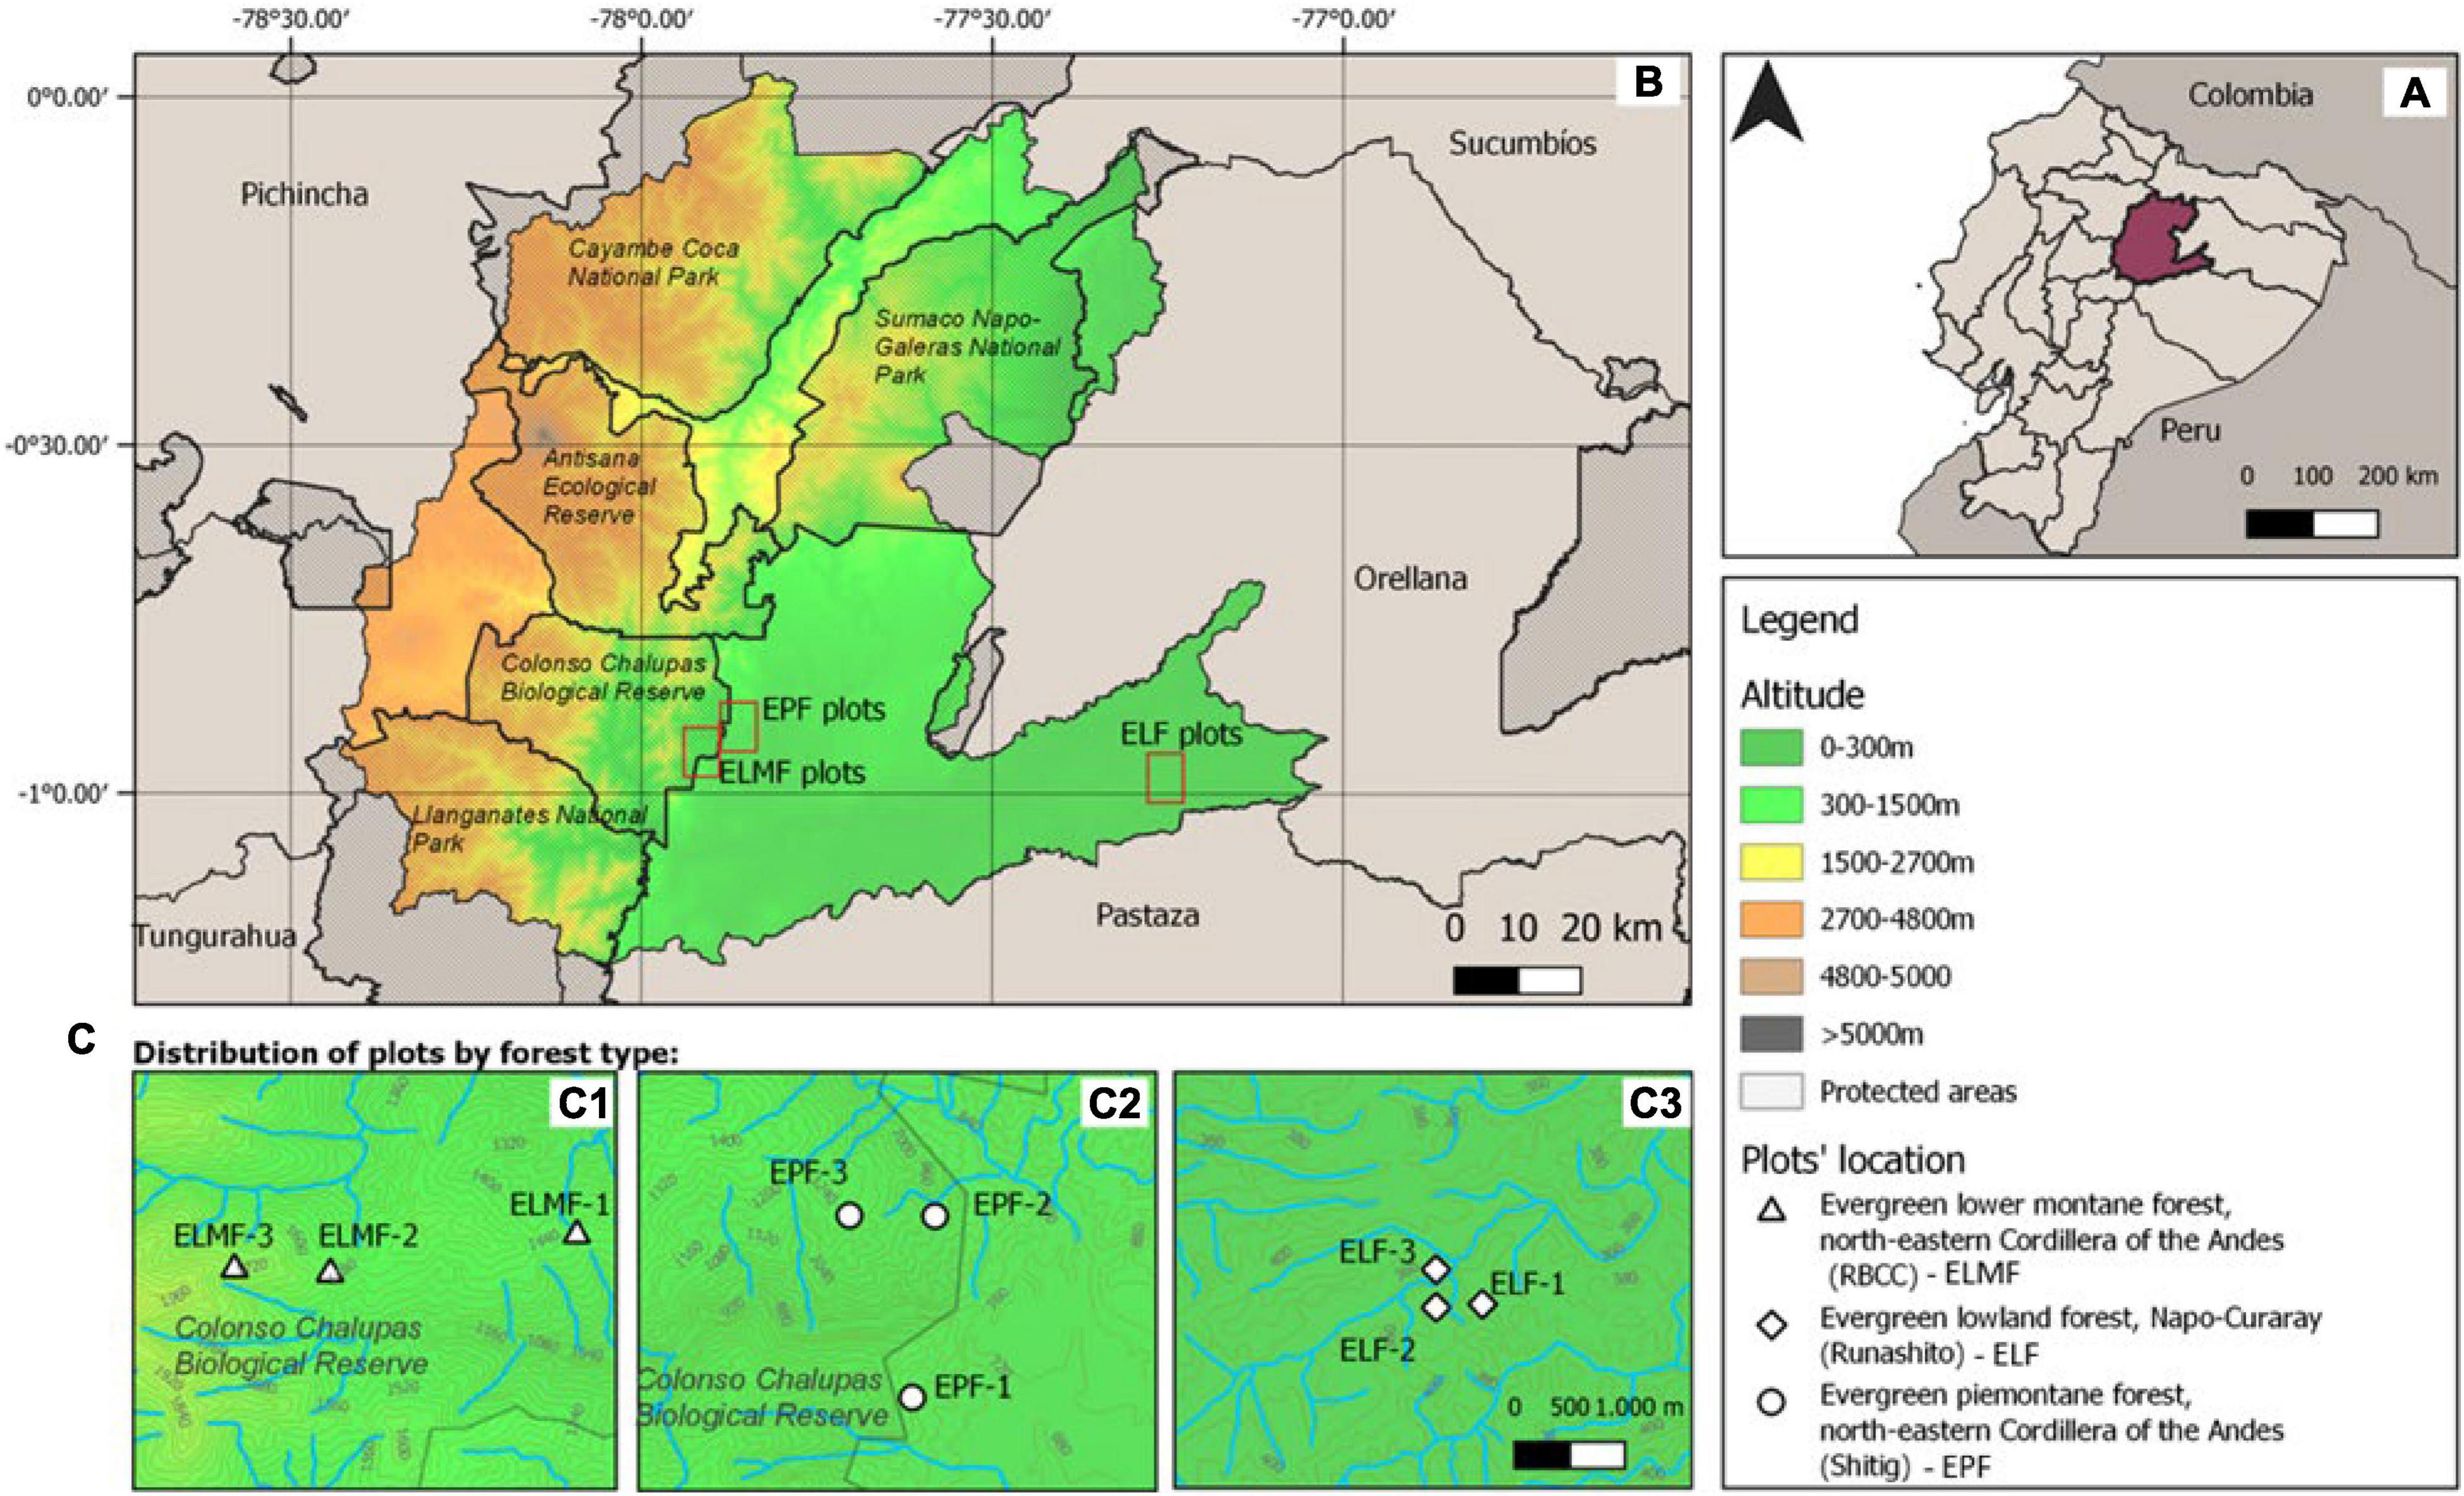
Figure 1. Study area and plot location. (A) Location of Napo province in Ecuador. (B) location of plot areas in Napo province; and (C) location of plots per forest types: (C1) ELMF—Evergreen Lower Montane Forest; (C2) EPF—Evergreen Piedmont Forest; and (C3) ELF—Evergreen Lowland Forest.
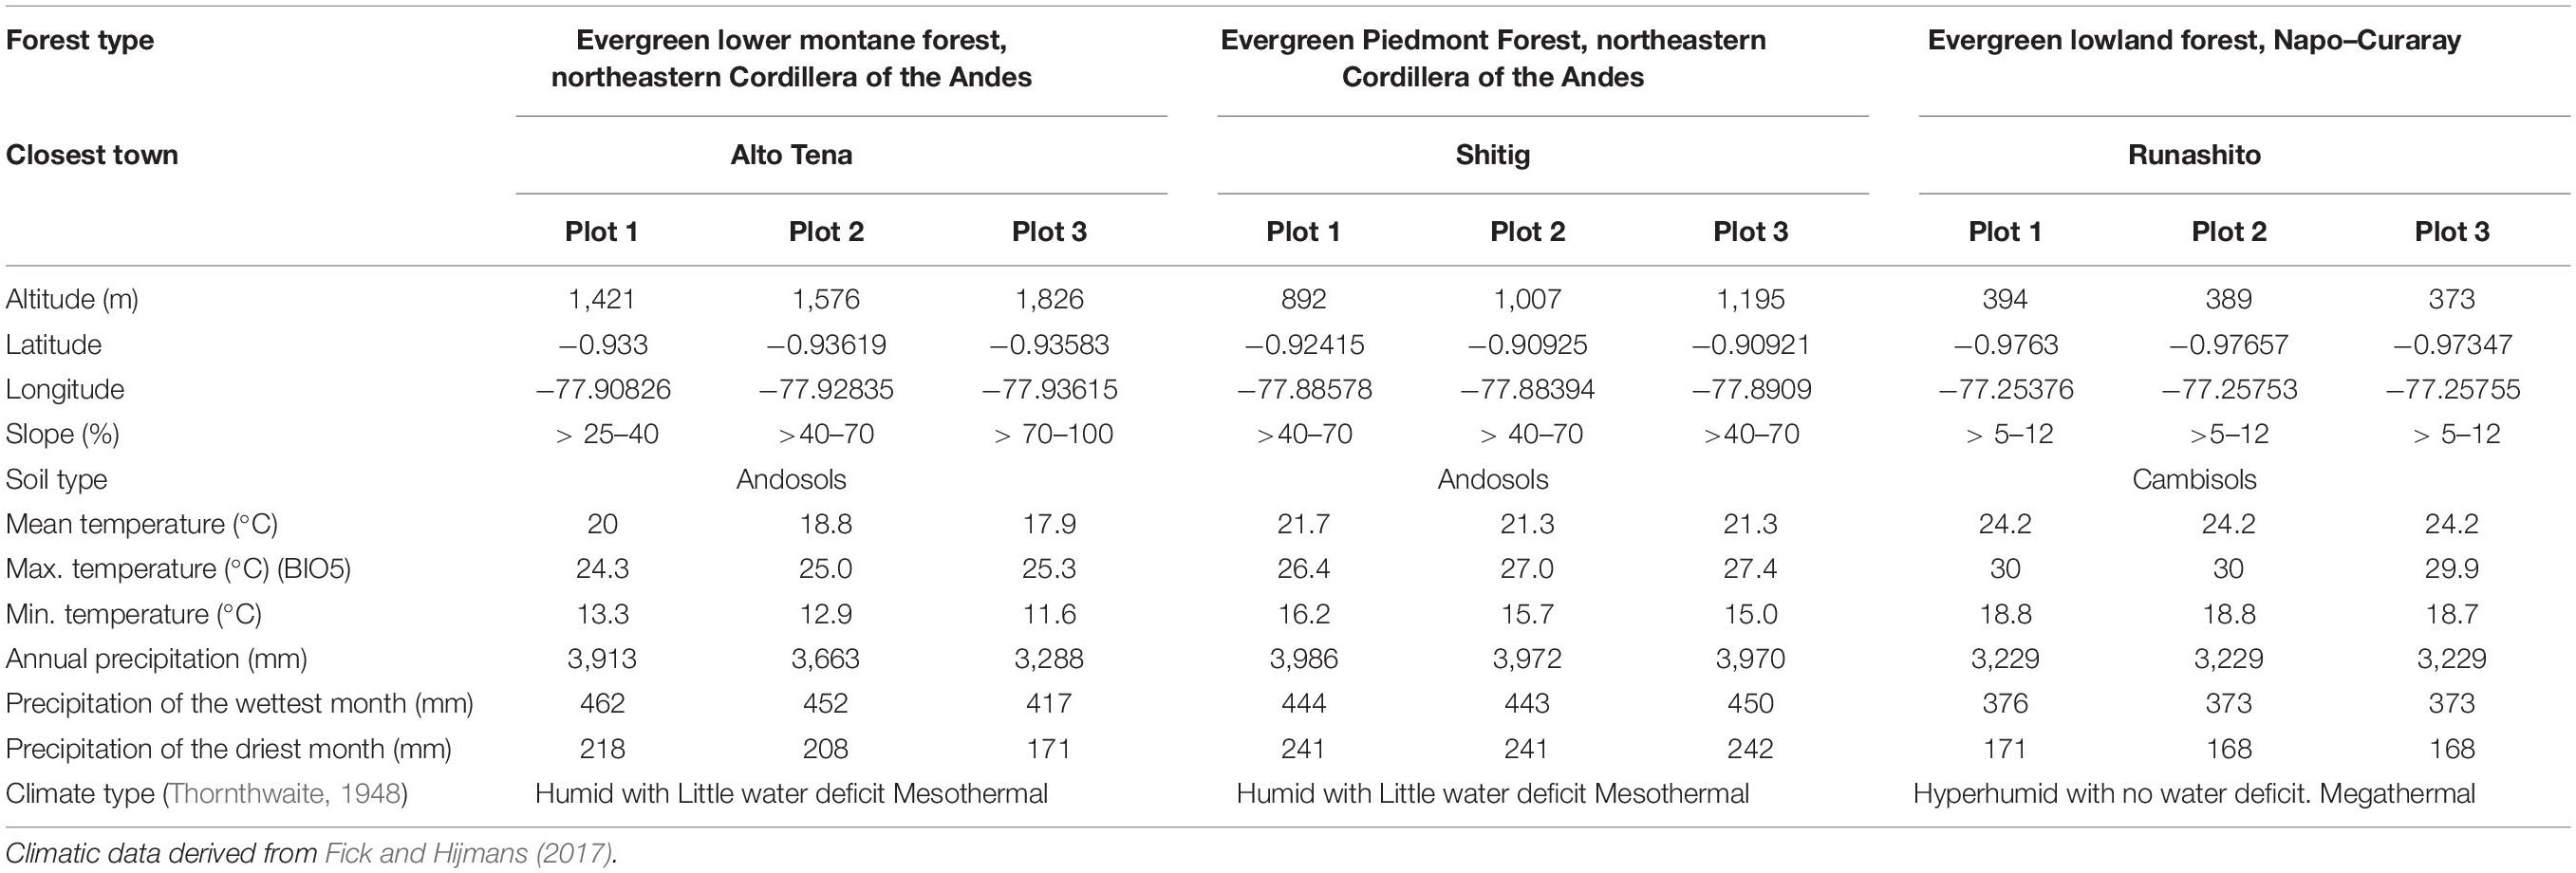
Table 1. Geographical and climatic data.
Forest Inventory
A cluster of three 60 × 60-m permanent plots was installed in each type of forest according to the National Forest Inventory methodology (MAE and FAO, 2015). The three plots in the ELF were installed in an “L” shape. EPF and the Evergreen Lower Montane Forest plots were installed equidistant along the altitudinal gradient because in mountainous areas, with steep slopes, it is not achievable to install plots in an “L” shape (Casanoves et al., 2014). Each plot was divided into a “grid” of 20 × 60 m delimited by plastic tubes and nylon rope. All trees ≥ 10-cm diameter at breast height (DBH) were labeled (numbered and barcoded). The variables DBH and spatial location of each individual were recorded. Tree species were identified by a dendrologist either in the field or by comparing collected samples in Ecuador’s National Herbarium (QCNE). The project data will eventually be part of the “Red de Bosques Andinos” network.1
Aboveground Biomass Estimation and Floristic Diversity
A scientific name verification process was carried out using the fdiversity software (Casanoves et al., 2011) and the Plant List database version 1.1 (The Plant List, 2013). In addition, with the generation of a Python Script, the scientific names of the project database were verified with the trees registered in the Ecuadorian Amazon (Andino et al., 2019). The number of stems, basal area, and AGB (Eq. 1, 2 in Table 2) were then calculated per species and forest type.
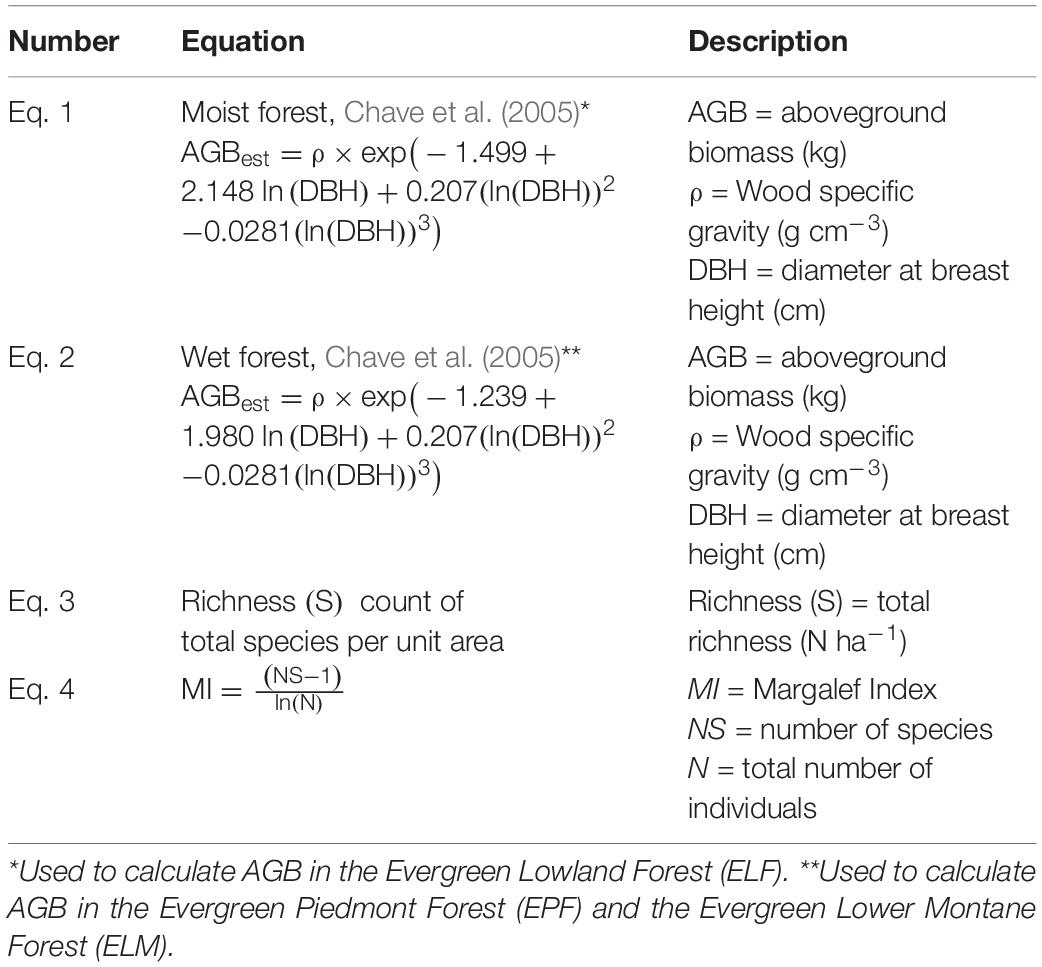
Table 2. Equations.
We used allometric equations of Chave et al. (2005) to calculate AGB (Table 2). Equations were used for the Moist Forest (Eq. 1 in Table 2) and Wet Forest (Eq. 2 in Table 2); these equations require DBH and wood specific gravity (ρ) values for each tree.
Specific gravity values (ρ in g cm–3), required for allometric equations, were obtained from Baker et al. (2004). When ρ was not available, the mean of 0.623 g cm–3 (SD = 0.178) for tropical South America was used (Chave et al., 2009); this value is obtained from the Global Wood Density database (Zanne et al., 2009). A biomass importance value (BIV) was calculated as the average of the relative density, relative basal area, and relative AGB values (Torres et al., 2020).
As indicators of biodiversity, the total richness, species richness per unit area, Fisher α, Shannon, and Simpson indices were calculated. Total richness (S) was taken as the count of total species per unit area. Species richness was calculated through the Margalef Index, MI = (NS - 1)/ln (N), where MI = Margalef Index, NS = number of species, and N = total number of individuals (Margalef, 1957).
All measurements by ecosystem were calculated as the average of the data obtained by the three established plots. Standard deviations are also provided to understand variations among plots of the same forest type (Table 3).
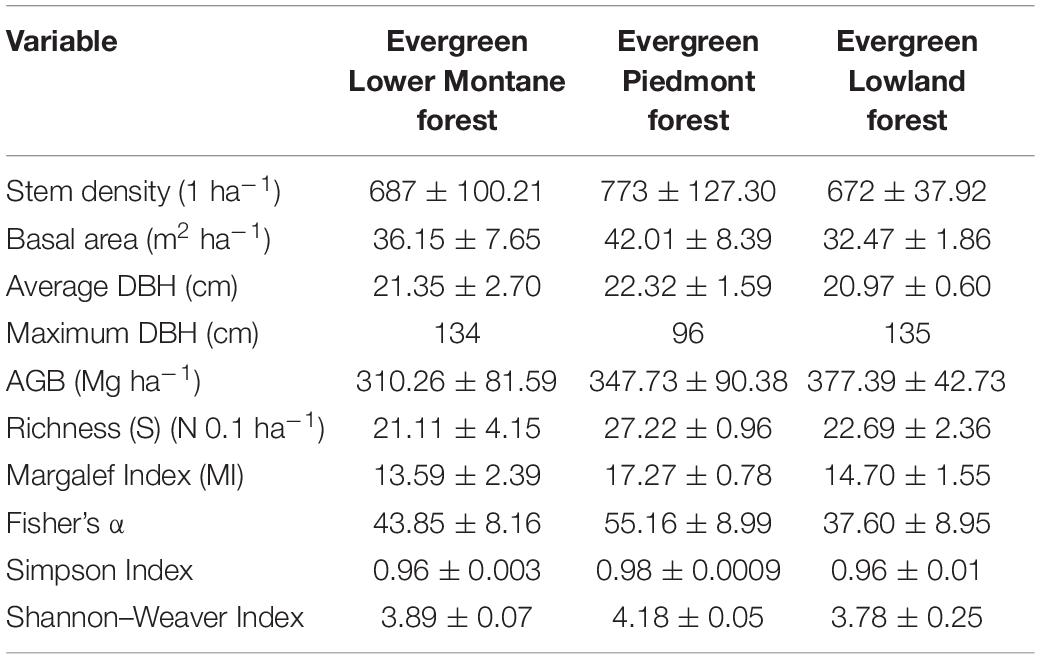
Table 3. Means and standard deviations of forest structure characteristics, total live aboveground biomass (AGB), richness, and biodiversity indices by forests type along an altitudinal gradient.
Statistical Analyses
To analyze the differences in height, DBH, and AGB between forest types and plots, we used non-parametric test Kruskal–Wallis as our data were not normal. In order to observe differences between forest types we applied Mann–Whitney post-hoc test. To assess differences in species composition, we calculated Bray–Curtis dissimilarity Index between all studied plots. A Pearson correlation matrix between environmental variables was developed to remove statistically redundant variables. All correlation values > 0.8 were considered strongly related (e.g., r > ± 0.8). Based on the selected variables, we tested mixed models [AGB = scale (var1) +. + scale (varn) + random effect (site)] and simple linear regressions to assess the relationship between AGB and abiotic factors, such as altitude, temperature, and precipitation. All statistical analyses were performed using R 4.0.5 (R Core Team, 2021).
Results
Structure and Diversity
In this study, the total species richness per 0.1 hectare was recorded in the Evergreen Lower Montane Forest (21.11 ± 4.15), in the EPF (27.22 ± 0.96), and in the ELF (22.69 ± 2.36). In relation to the biodiversity indices calculated, the highest values for all of them were found in EPF (892–1,195 m.a.s.l). The lowest values were found in ELMF (1,421–1,826 m.a.s.l.) for total richness (21.11) and Margalef Index (13.59) and in ELF for Fisher α (37.60) and Shannon–Wiener Index (3.78).
Trees are concentrated in the first diameter class (10–20 cm), with few trees with large diameters. The density of trees per hectare in the Evergreen Lower Montane Forest was 687, 773 in the EPF, and 672 in ELF (Table 3 and Figure 2).
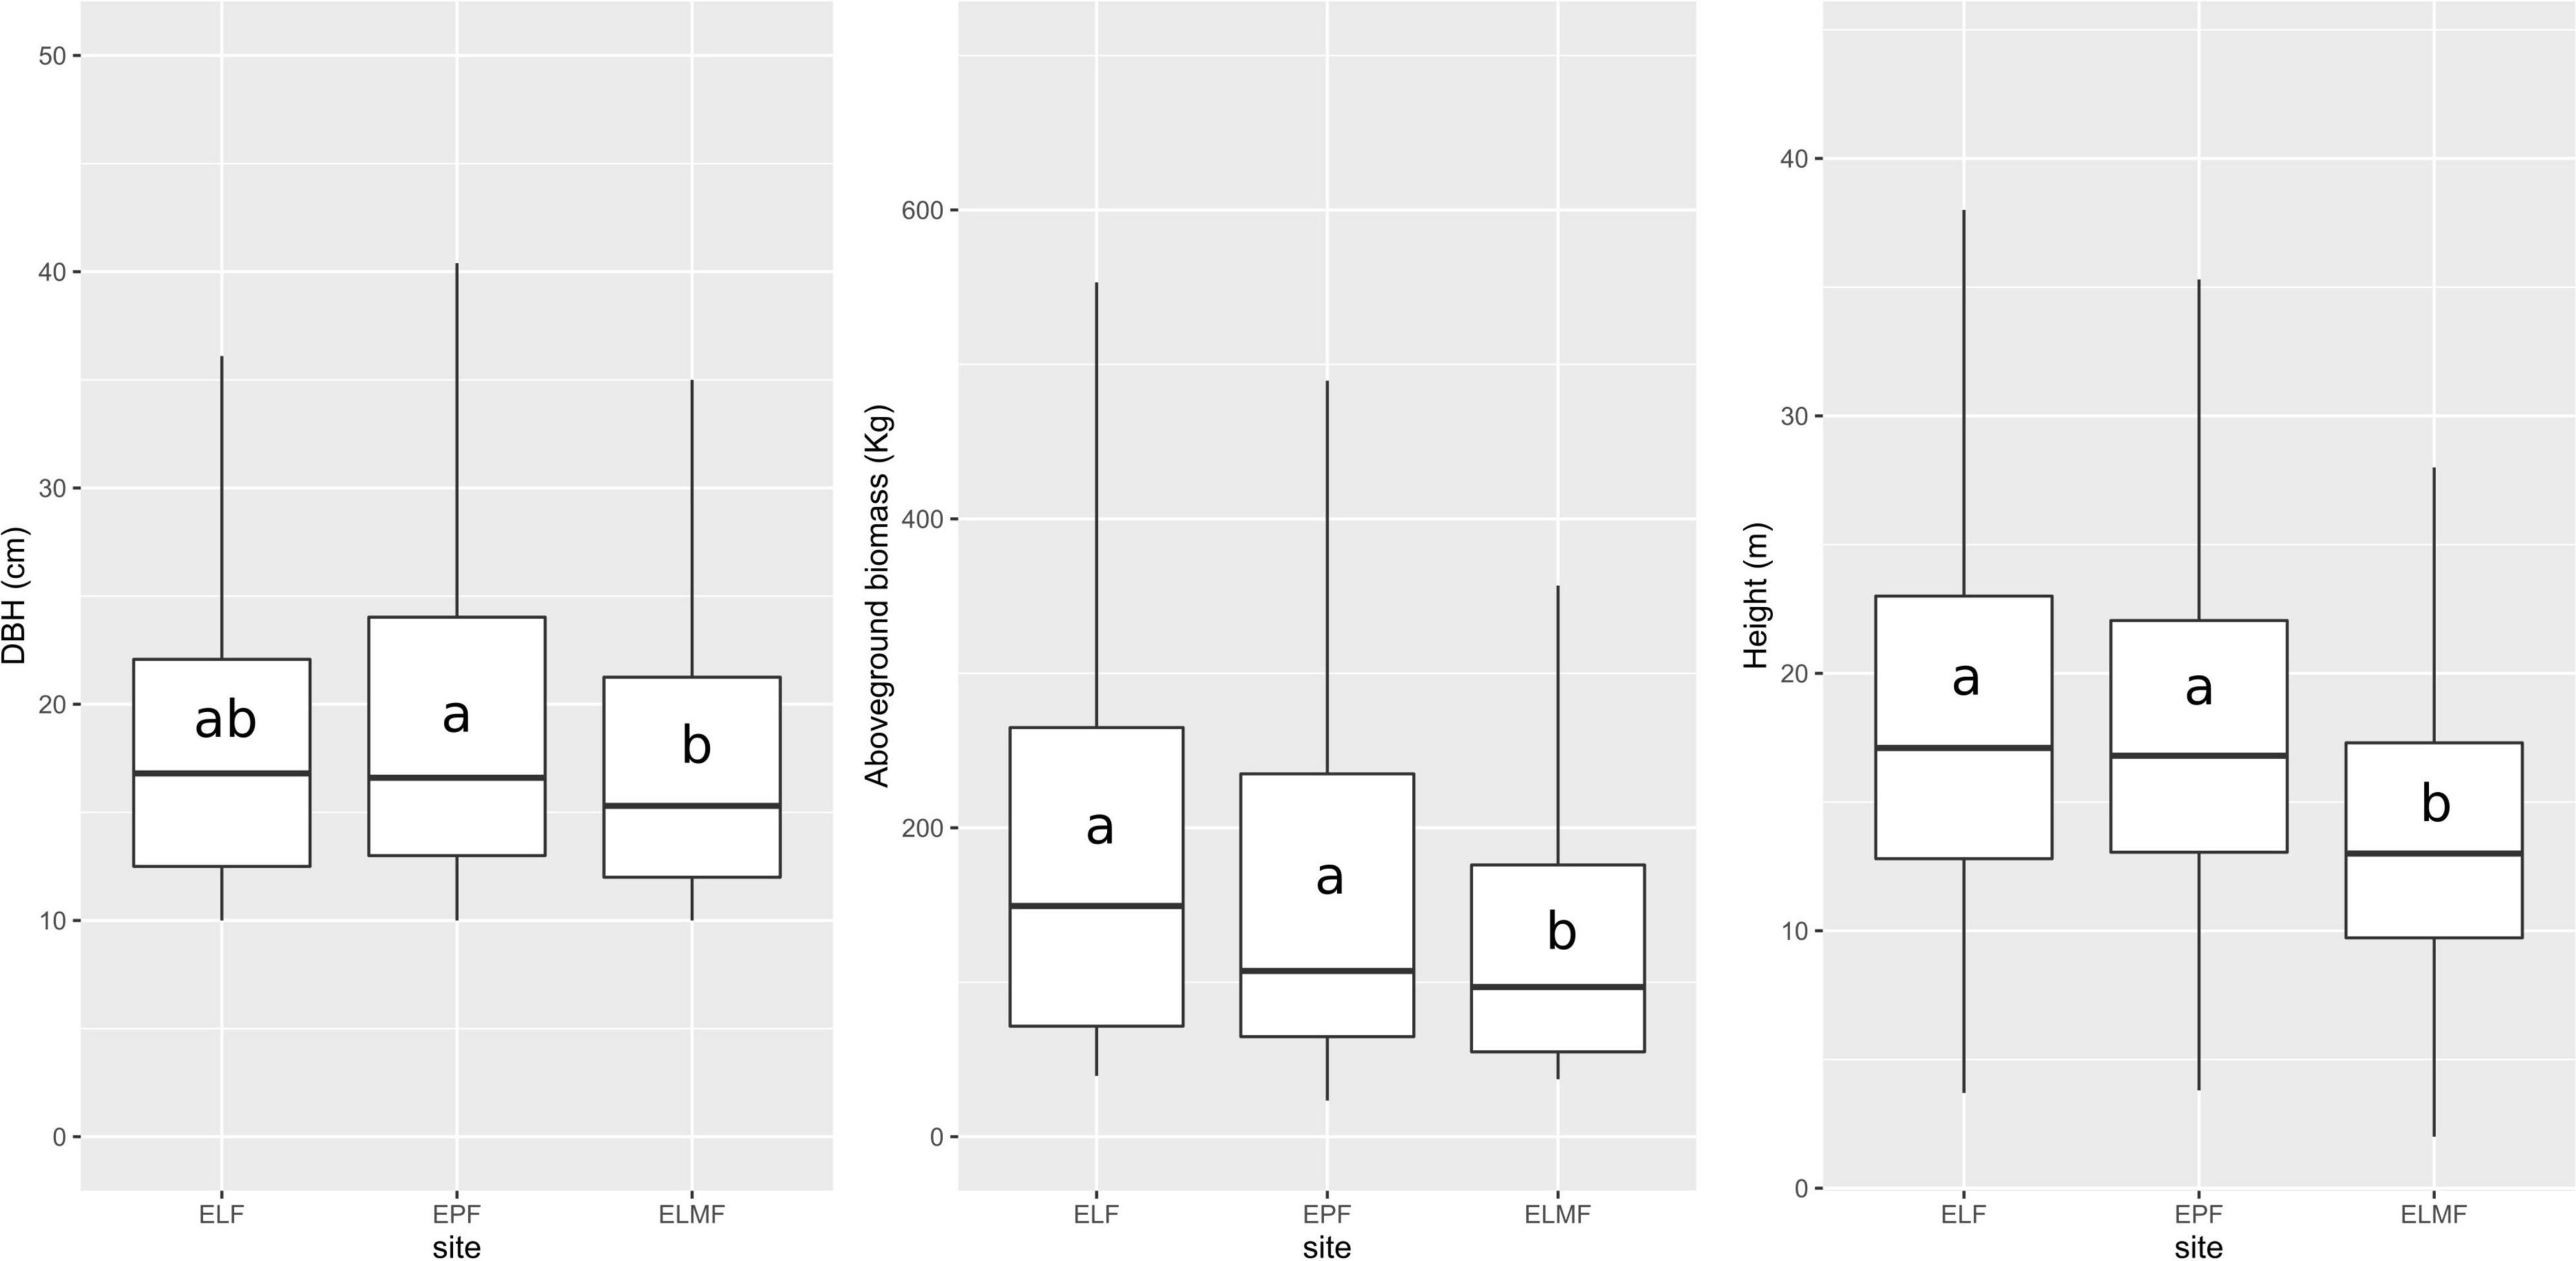
Figure 2. Boxplot of dbh, total height, and AGB of all trees measured per forest type: Evergreen Lowland Forest (ELF), Evergreen Piedmont Forest (EPF), and Evergreen Lower Montane Forest (ELMF). Center line and outside edge of each box indicate the median and interquartile range (IQR = Q3–Q1), respectively. Vertical lines (whiskers) represent values falling within 1.5-IQR value from the upper and lower quartiles. Outliers are not shown due to visualization purposes. Letters show significant differences between forest types according to Mann–Whitney post-hoc test results.
Families with most species per hectare are Fabaceae (17), Rubiaceae (17), Moraceae (15), and Lauraceae (11) in the ELMF; Fabaceae (16), Moraceae (14), Lauraceae (13), and Rubiaceae (13) in the EPF; Fabaceae (16), Meliaceae (13), Moraceae (13), and Sapotaceae (10) in the ELF. The most abundant species in the ELM forest are Mabea standleyi (7%), Otoba glycycarpa (4.7%), Miconia sp. (4.6%), and Eschweilera coriacea (3.6%); in the EPF Pouteria sp. (3.7%), Pseudolmedia laevigata (3.6%), in the ELF Iriartea deltoidea (10.9%), Otoba glycycarpa (4.4%), and Grias neuberthii (4.1%) (Table 4).
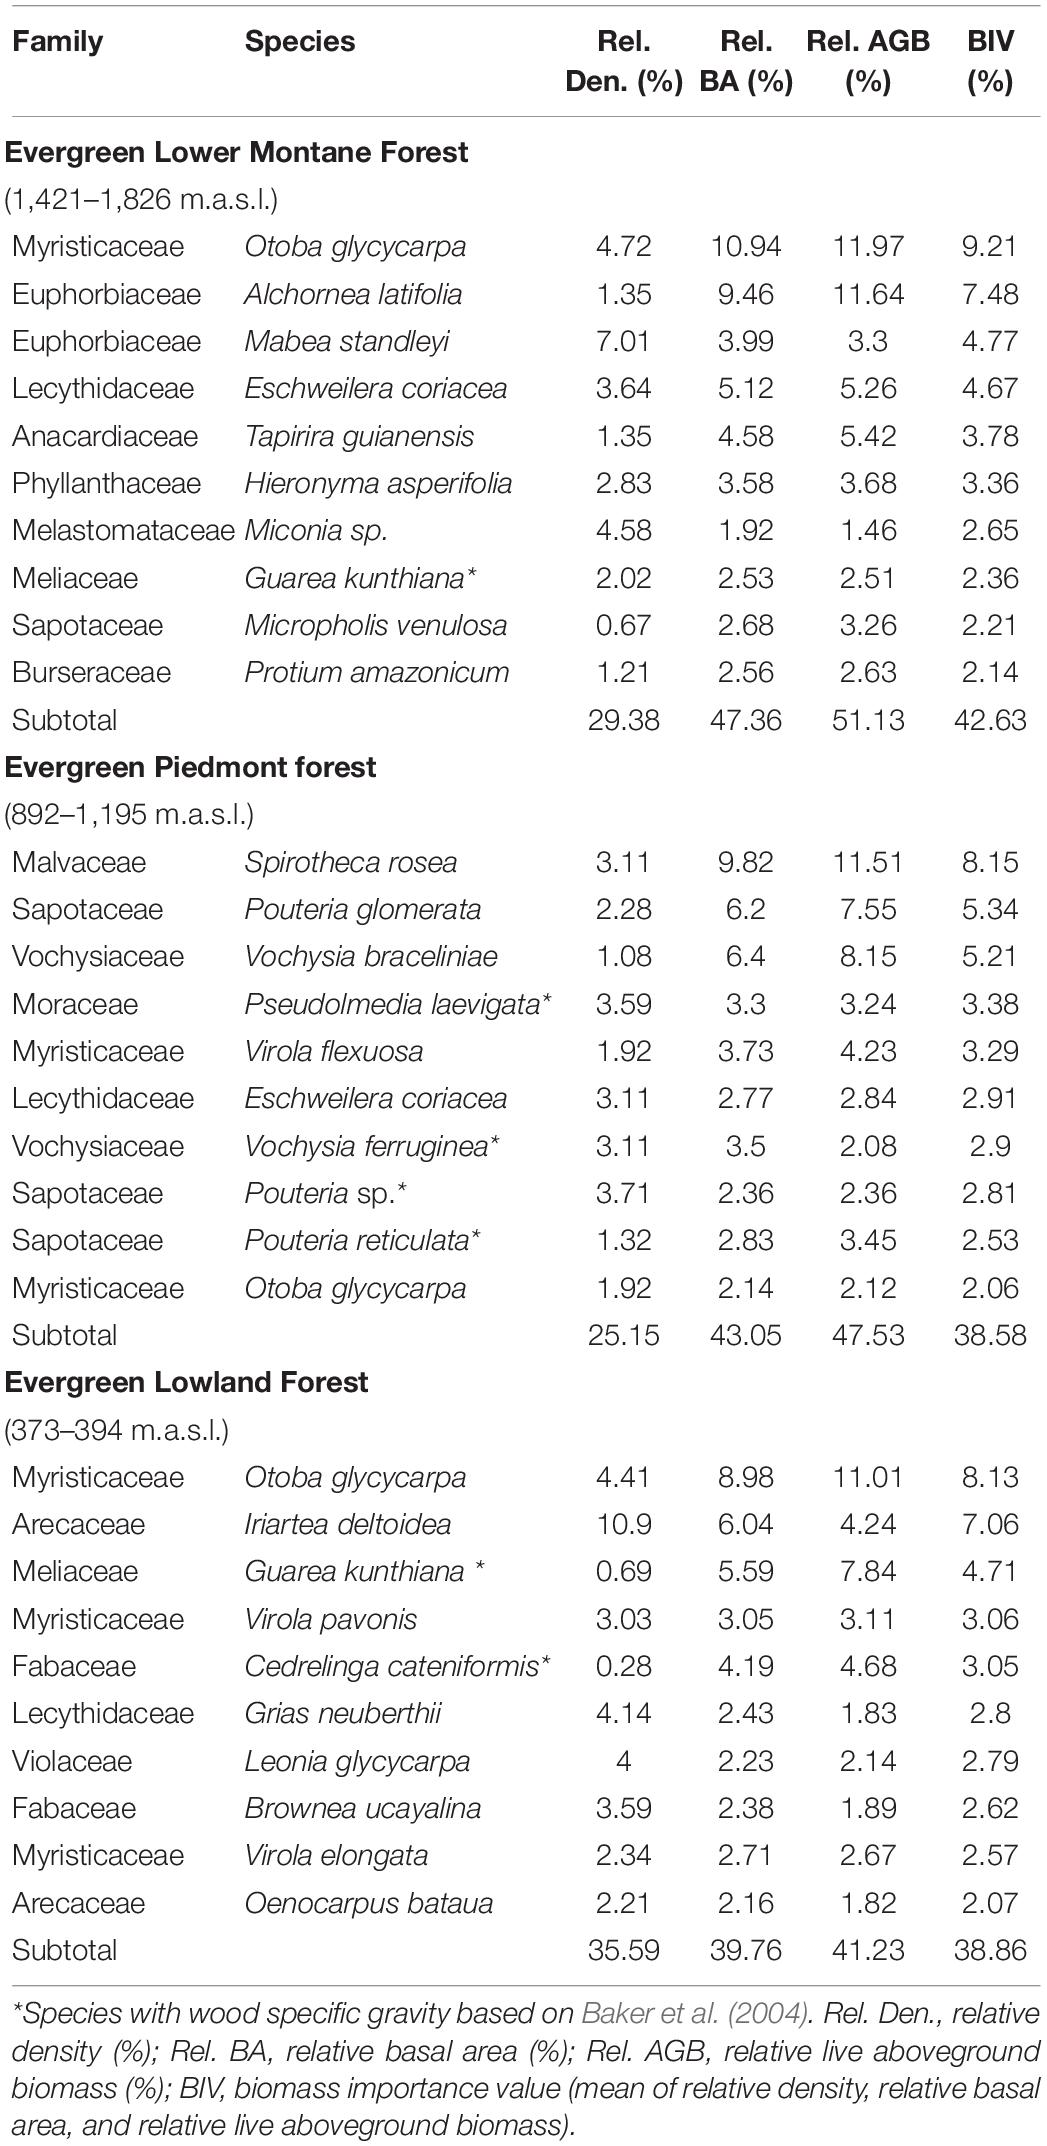
Table 4. Relative density, Relative basal area, Relative live aboveground biomass (AGB) and biomass importance value (BIV) of the 10 most important tree species along the study gradient, ordered according the BIV in each forest.
Bray–Curtis dissimilarity Index maximum value can be found between ELF-1 and ELMF-3 (0.97) and minimum value between ELF-2 and ELF-3 (0.55). Close value to 1 means that the two sites hardly share species and close to 0 that the two plots have very similar composition. In general, lower values can be found between plots of the same site (Table 5).

Table 5. Bray–Curtis dissimilarity Index between plots.
Aboveground Biomass
We found a higher tree density in moderate altitudes (892–1,195 m.a.s.l.), EPF (773), and lower in the Evergreen Lower Montane Forest (687) and ELF (671), but no significant differences were found according to Kruskal–Wallis (p = 0.547). Between forest types, significant differences according to Kruskal–Wallis test were found in all the metrics studied: tree height, dbh, and AGB (Table 6 and Figure 2).
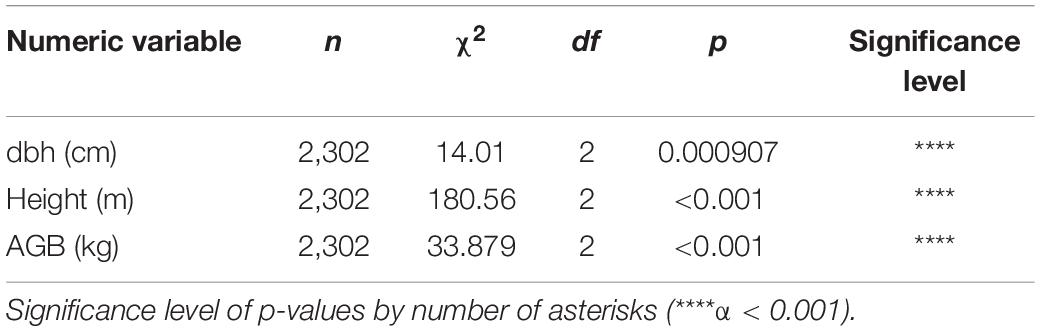
Table 6. Kruskal–Wallis results for height, dbh, and aboveground biomass between forest types.
Within forest types, plots are more homogeneous in ELF (where only significant differences in height were found p < 0.001), followed by EPF (ns for dbh, p < 0.001 for height and p = 0.042 for AGB). In ELMF is where we found more differences among plots (p = 0.002 for dbh, p < 0.001 for height, and p = 0.0052 for AGB; Table 7).
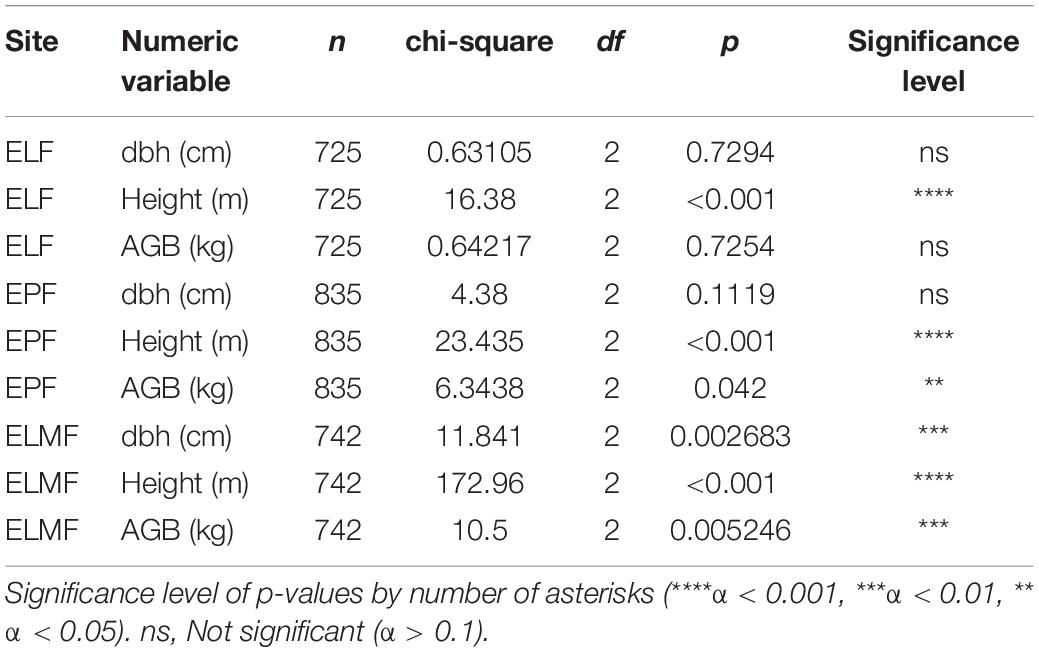
Table 7. Kruskal–Wallis results for height, dbh, and aboveground biomass between plots within forest types.
The 10 most common species concentrate 51, 47, and 41% of AGB, respectively (Table 4). Otoba glycycarpa and Alchornea latifolia were the species with the highest BIV in the Evergreen Lower Montane Forest (1,421–1,826 m.a.s.l.); Spirotheca rosea and Pouteria glomerata in the EPF (892–1,195 m.a.s.l.); and Otoba glycycarpa and Iriartea deltoidea in the ELF (373–394 m.a.s.l.) (Table 4). The highest BIV is for Otoba glycycarpa in the Evergreen Lower Montane Forest (9.21%) and ELF (8.13%) and Spirotheca rosea (8.15%) in the EPF. Also, least abundant tree species contributed with a high percentage of the AGB, that is, Alchornea latifolia 11.64% (1,421–1,826 m.a.s.l.), Vochysia braceliniae 8.15% (892–1,195 m.a.s.l.), Guarea kunthiana 7.84% (373–394 m.a.s.l.).
As a result of the correlation matrix, we found that temperatures T (min, max, and mean) are highly correlated with altitude (> | 0.9|) and annual precipitation (P) with the wettest and driest month. From seven variables, we finally selected two: elevation and annual P. We scaled these independent variables and tested mixed models. We use scaled P, elevation, and richness independent variables as fixed effects and forest type as random effect [AGB = scale (elevation) + scale (annualP) + scale (richness) + random effect (site)], but none of them had a significant effect.
In order to show the positive relationship (although not significant) between elevation (or mean temperature as they are highly correlated) and biomass, in the next figure a linear regression is presented with total AGB per plot by site and elevation.
Discussion
Amazon tropical forests are characterized by their high diversity (Valencia et al., 1994, 2004); however, diversity varies greatly, depending on various factors, such as soils, historical events, altitudinal range, topography, or level of isolation or fragmentation (ter Steege et al., 2000). Diversity in the Ecuadorian Amazon is spatially heterogeneous because of its proximity to the Andes, differences in soil composition, and topography (Unger et al., 2012). Therefore, a wide range of richness values can be found in this region. ter Steege et al. (2000) compared α diversity levels from 268 plots in Amazonian Forests, six of them in Ecuador, and found a Fisher α from 3.6 to 221.8 in general and from 39.2 to 211.0 in Ecuador. Our results for Fisher α (ELMF: 43.85 ± 8.16, EPF: 55.16 ± 8.99, ELF: 37.60 ± 8.95) are within this interval (Table 3).
In our study area, the species composition varies considerably from one plot to another. These variations are greater when differences in elevation are also higher. Thus, according to the Bray–Curtis index (Table 5), within the same forest type, plots located at the same altitude have a similar composition, and those located on a gradient present greater difference. The highest Bray–Curtis values are therefore found between the lowland plots and the last plot of the low montane forest (Table 5). Largest difference in species composition between plots of the same site is found in the Evergreen Low Montane Forest.
In general, richness values (ELMF: 21.1 ± 4.15 N 0.1 ha–1, EPF: 27.2 ± 0.96 N 0.1 ha–1, ELF: 22.69 ± 2.36 N 0.1 ha–1) (Table 3) are similar to those found in other studies conducted in Amazon forests within an elevation range of 350 and 1,000 m.a.s.l. For example, Torres et al. (2020) carried out a study in the Napo Province and obtained richness values that ranged from 23.80 to 32.00 N 0.1 ha–1. The maximum detected by Torres et al. (2020) were in plots located at 900–1,000 m.a.s.l. (32.0 ± 3.39 N 0.1 ha–1), which corresponds to the same elevation of our richest plot (EPF: 272.22 ± 9.62 N ha–1) (Table 3). Also, Patiño et al. (2015) conducted a floristic composition and forest structure study in the EPF (600–700 m.a.s.l.) with similar Simpson (0.94) and Shannon (3.52) values to the ones we found in our study (Table 3). Huamantupa-Chuquimaco (2010) carried out a study in southeastern Peru and, although the number of families and the density of individuals are lower, the number of species found (68 in 5,000 m2) is comparable with our results, especially in the EPF (27.2 ± 0.96 N 0.1 ha–1) and ELF (22.69 ± 2.36 N 0.1 ha–1). However, the number of species recorded in this study are lower than in other parts of Ecuadorian Amazon such as Cuyabeno or Yasuní National Park (Valencia et al., 1994; Pitman et al., 2002), which corresponds to one of the most important biodiversity hotspots in the world (Ramsar, 2018).
Comparing the different ecosystems, we found 33 families that are present in the three types of ecosystems, whereas five (Combretaceae, Cannabaceae, Caricaceae, Bignoniaceae, Polygonaceae) are found only in the ELF, five (Ochnaceae, Ebenaceae, Caryocaraceae, Sabiaceae, Solanaceae) in the EPF, and six (Picramniaceae, Piperaceae, Icacinaceae, Chloranthaceae, Aquifoliaceae, Cunoniaceae) in the Evergreen Lower Montane Forest. There are two of these families (Cunoniaceae and Chloranthaceae) that are not present in any of the 1,170 plots studied by ter Steege et al. (2013). These families were found in the highest plot in the Evergreen Lower Montane Forest (1,826 m.a.s.l.). This may be due to the fact that the studied plots in other studies are located in a lower altitudinal range.
Fabaceae is the most diverse family in all plots studied: 17 sp. in ELMF and 16 sp. in EPF and ELF. This is consistent with other studies in the Peruvian (Gentry and Ortiz, 1993; Huamantupa-Chuquimaco, 2010) and Ecuadorian Amazon (Valencia et al., 1994; Quizhpe et al., 2019) and seems to be a common pattern in the Amazon Basin according to the results of ter Steege et al. (2013). The other more diverse families are Rubiaceae, Moreaceae, Meliaceae, Lauraceae, and Sapotaceae that are included by Gentry and Ortiz (1993) in the group of the most diverse families in neotropics. Iriartea deltoidea was found to be the most abundant species, which agrees with our results of ELF.
Aboveground Biomass
Our AGB values (ELMF: 310.26 ± 81.59 SD Mg ha–1, EPF: 347.73 ± 90.38 SD Mg ha–1, ELF: 377.39 ± 42.73 SD Mg ha–1) (Table 3) are within the ranges of studies carried out in similar ecosystems. Biomass records for Evergreen Lower Montane Forest have been reported between 216.09 and 359.95 Mg ha–1 in an altitude range from 1,421 to 1,826 m.a.s.l. (Nadkarni et al., 2004; Sierra et al., 2007; Unger et al., 2012; Girardin et al., 2014). Higher biomass values (270.37–447.08 Mg ha–1) were reported for EPF values in altitude ranges between 892 and 1,195 (Moser et al., 2011; Unger et al., 2012; Torres et al., 2020; García et al., 2021). Biomass records for ELF values between 349.39 and 426.57 Mg ha–1 in altitude range between 373 and 426 (Girardin et al., 2014; Cabrera Quezada et al., 2019; Tierres et al., 2020).
Significant differences were found in AGB between ELMF and the other two forest types. No significant differences were found between ELF and EPF; however, a trend can be observed of lower biomass as elevation increases (Figure 2 and Table 6). Future studies should focus on investigating specific gravity values for all species and developing local allometric models that include the height variable for accurate biomass calculations (Báez et al., 2015; Phillips et al., 2016).
Forest biomass variability could be linked to the interaction of abiotic factors, such as temperature, precipitation, and nutrient availability (Rutishauser et al., 2015); or factors that influence plant regeneration, such as landslides (Myster, 2020); or species-inherent factors, such as wood density (Keeling and Phillips, 2007). In the mixed models, none of these variables were significant, which casts doubt on the effect of these abiotic factors on biomass in our study plots. However, this may be due to the sample size. The observed trend of biomass increasing with decreasing altitude, or with increasing temperatures, is confirmed in other studies (González-Caro et al., 2020). This also is in agreement with the results obtained for differences between plots (Table 7). Those plots of the same forest type in which there is a greater difference in elevation (ELMF) are those where significant differences were found for all variables (DBH, height, and AGB) (Table 7). Furthermore, in the linear regression between aboveground elevation and altitude, although the relationship is not significant, there is a clear trend (Figure 3). The lowest significance values were found for precipitation, practically ruling out that this is a factor influencing the amount of biomass. This is because the study area does not have significant water deficits.
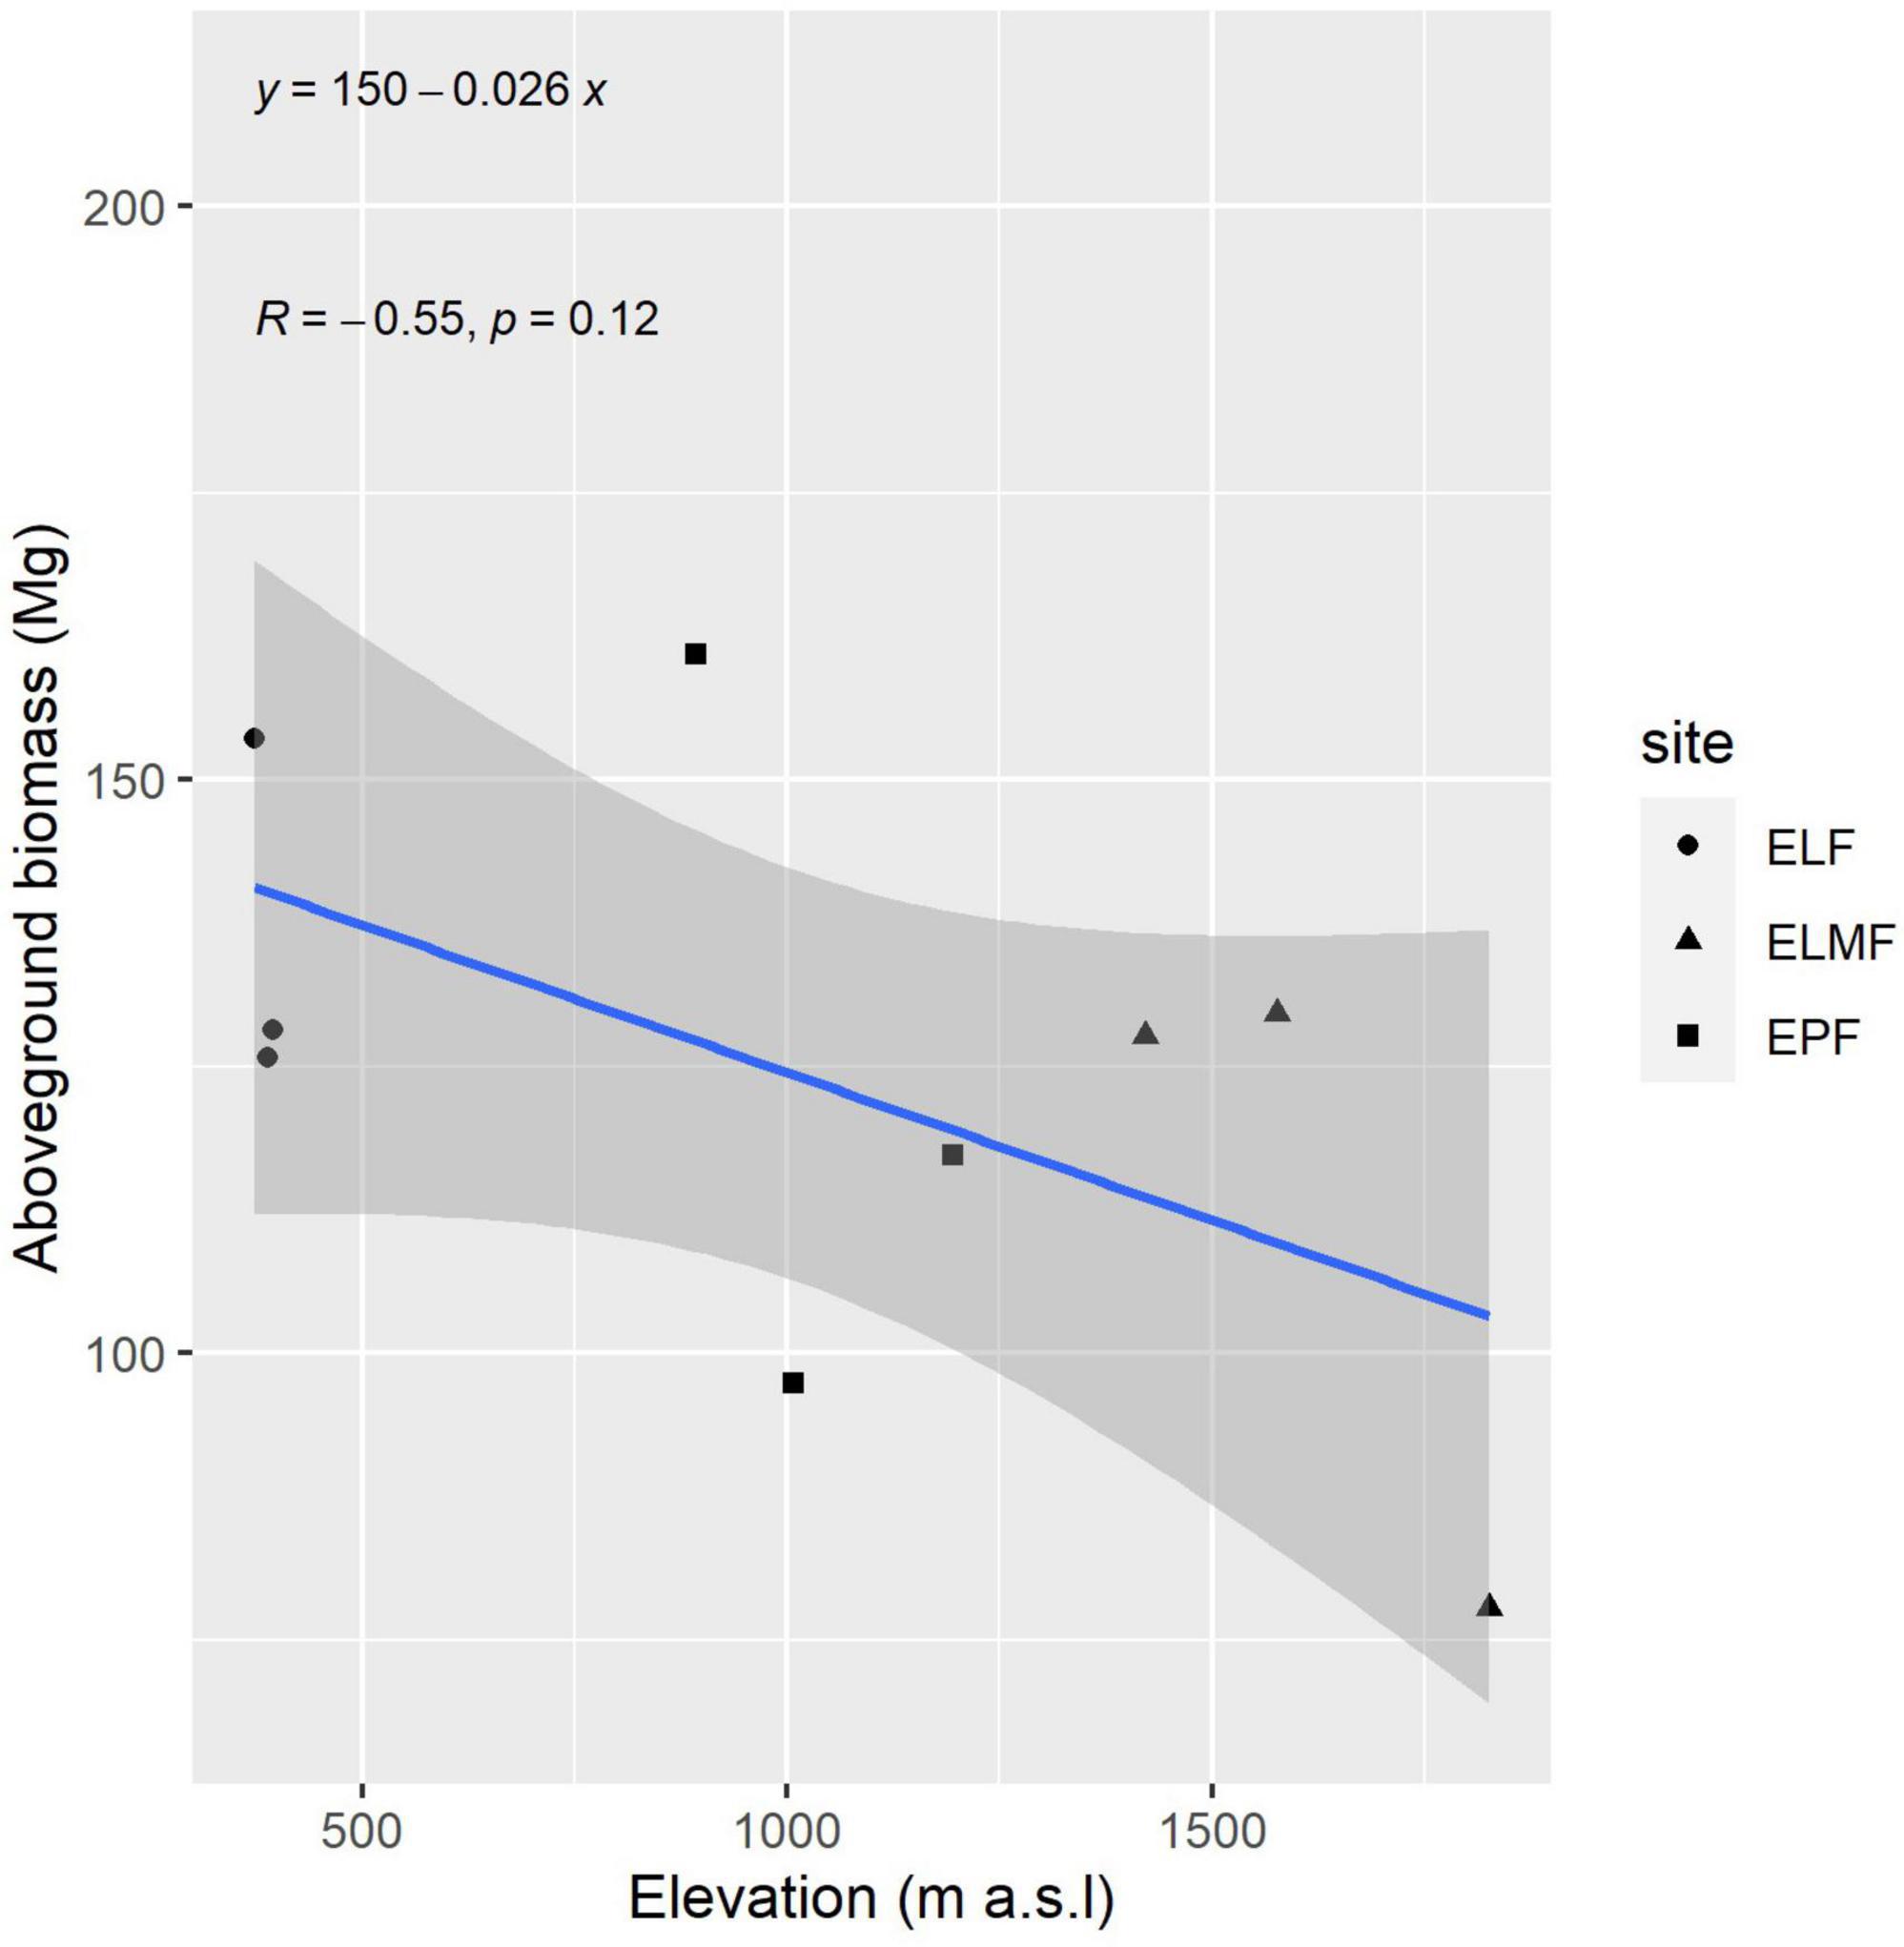
Figure 3. Linear regression of mean AGB and elevation. Gray shadow represents confidence interval.
Most biomass (Figure 2) belongs to individuals that are between 10 and 20 cm in diameter. This corresponds to a negative exponential diametric distribution, commonly known as reverse J–shaped curve. This type of curve is typical of mature stages in low-disturbed forest (Imaña et al., 2011).
The use of mixed models for the present study is a good choice as our data are nested (plots are nested within forest types). The fact that none of the variables are significant may be due to the level of resolution of environmental layers. As we do not have specific meteorological data for the plots studied, we used climatic information from WorldClim, which offers these data at a resolution of 1 km2, which may be too low for our study plots. In addition, WorldClim data were calculated from interpolation, including elevation (Fick and Hijmans, 2017), which makes the independence of the variables studied even less likely.
Land Management Implications
Ecuador has relatively low greenhouse gas emissions (Ritchie and Roser, 2020). However, the country made a strong commitment to reduce these within the framework of Nationally Determined Contributions (Samaniego et al., 2019). Two national strategies stand out to meet the objectives. The first strategy is focused on avoiding forest degradation through the national program “Socio Bosque,” where the state pays an economic incentive to forest owners for their conservation (Jones et al., 2020). The second strategy is focused on increasing carbon stocks through the national restoration program (Wiegant et al., 2020). Forest restoration is the mechanism to increase carbon stocks and counteract greenhouse gas emissions from deforestation and forest degradation (UNFCCC, 2008). The forest restoration is one of the priorities of the world environmental agenda because of its potential for reducing greenhouse gases emissions (Silver et al., 2000; Hawes, 2018). Active restoration helps accelerate the reestablishment of the original biomass (Wheeler et al., 2016; Hietz et al., 2019). For a successful restoration, it is necessary to consider native species with genetic variability (Di Sacco et al., 2021) and its “ecological niche” (Silvertown, 2004; Poorter, 2007). The restoration approach changes, depending on the ecosystem service to be restored. The objectives of restoration could be carbon storage, forests products, biodiversity, and hydrologic ecosystem services (Di Sacco et al., 2021); if the objective of the restoration program is to recover the original carbon stocks, species with potential for carbon sequestration should be used (Cerullo and Edwards, 2019) that maximizes the highest amount of biomass per type of forest and be based on a reference ecosystem that supports the restoration (Gann et al., 2019). This consideration is important for future restoration programs in Ecuador, and this study identified the species with the highest biomass by forest type. Forest restoration in ELM, EPF, and ELMF with a focus on carbon sequestration should prioritize planting of the 10 most significant native species.
Conclusion
In this study, an assessment of the differences in forest structure (i.e., AGB, DBH, height) and floristic composition between three forest types in the Andean–Amazonian region of Ecuador is presented. We used a total of nine plots (three per forest-type) and a combination of non-parametric Kruskal–Wallis test and diversity indicators to elucidate these differences in detail. We found significant differences for all forest structure metrics studied. Higher AGB is found in the lowland forests compared with the other sites, especially with the Evergreen Lower Montane Forest, which is located at higher altitudes.
We also investigated how different environmental variables affect AGB, but only temperature was found to be significant. This is probably due to the relatively low sample size, the closeness of the plots, and the low resolution of the environmental layers (1 km2), as no weather stations are available in the study area.
In relation to the floristic composition, we found that different species dominate the amount of AGB in these forests, which can have important implications in forest management.
Our objective is to expand the sample size in future studies in order to deepen our understanding of the interaction between environmental variables, forest structure, and floristic composition.
Data Availability Statement
The original contributions presented in the study are included in the article/Supplementary Material, further inquiries can be directed to the corresponding author/s.
Author Contributions
MR-B and ER: data processing. BM and MR-B: writing the article. All authors contributed to the article and approved the submitted version.
Funding
The authors gratefully acknowledge the financial support provided by the Secretary of Higher Education, Science, Technology and Innovation SENESCYT–ENSAMBLE Financing Program (Grant/Award No. PIC-17-BENS-002) for the development of the project “Carbon Storage for Three Types of Forest in the Ecuadorian Amazon Region.” The Ministry of the Environment of Ecuador granted a research permit 008-018-IC-FAU/FLO-DPAN/MA.
Conflict of Interest
ER was employed by the Independent Consultant.
The remaining authors declare that the research was conducted in the absence of any commercial or financial relationships that could be construed as a potential conflict of interest.
Publisher’s Note
All claims expressed in this article are solely those of the authors and do not necessarily represent those of their affiliated organizations, or those of the publisher, the editors and the reviewers. Any product that may be evaluated in this article, or claim that may be made by its manufacturer, is not guaranteed or endorsed by the publisher.
Supplementary Material
The Supplementary Material for this article can be found online at: https://www.frontiersin.org/articles/10.3389/ffgc.2022.738585/full#supplementary-material
Footnotes
References
Andino, J. E. G., Pitman, N. C. A., Ulloa, C. U., Romoleroux, K., Fernández, D., Ceron, C., et al. (2019). Trees of Amazonian Ecuador: a taxonomically verified species list with data on abundance and distribution. Ecology 100:e02894. doi: 10.1002/ecy.2894
Báez, S., Malizia, A., Carilla, J., Blundo, C., Aguilar, M., Aguirre, N., et al. (2015). Large-Scale Patterns of Turnover and Basal Area Change in Andean Forests. PLoS One 10:e0126594. doi: 10.1371/journal.pone.0126594
Baker, T. R., Phillips, O. L., Malhi, Y., Almeida, S., Arroyo, L., Di Fiore, A., et al. (2004). Variation in wood density determines spatial patterns inAmazonian forest biomass: wood specific gravity and Amazonian biomass estimates. Glob. Change Biol. 10, 545–562. doi: 10.1111/j.1365-2486.2004.00751.x
Baraloto, C., Rabaud, S., Molto, Q., Blanc, L., Fortunel, C., Hérault, B., et al. (2011). Disentangling stand and environmental correlates of aboveground biomass in Amazonian forests. Glob. Change Biol. 17, 2677–2688. doi: 10.1111/j.1365-2486.2011.02432.x
Blundo, C., Malizia, A., Malizia, L. R., and Lichstein, J. W. (2021). Forest biomass stocks and dynamics across the subtropical Andes. Biotropica 53, 170–178. doi: 10.1111/btp.12858
Bordin, K. M., Esquivel-Muelbert, A., Bergamin, R. S., Klipel, J., Picolotto, R. C., Frangipani, M. A., et al. (2021). Climate and large-sized trees, but not diversity, drive above-ground biomass in subtropical forests. For. Ecol. Manage. 490:119126. doi: 10.1016/j.foreco.2021.119126
Cabrera Quezada, M., Segura Chávez, E., Sinche Chele, F., Maldonado Ortiz, L., and Tierres Mayorga, J. (2019). Estructura y estimación del carbono acumulado en el estrato arbóreo de un bosque siempreverde de tierras bajas. Caso Parque Ecológico Recreacional Lago Agrio, Sucumbíos. Ciencia y Tecnol. 12, 85–92. doi: 10.18779/cyt.v12i2.329
Casanoves, F., Ospina, M., Günter, S., Chacón, M., Villalobos, R., and Cifuentes, M. (2014). Análisis de resultados de la Evaluación Nacional Forestal del Ecuador. Quito: Centro Agronómico Tropical de Investigación y Enseñanza (CATIE).
Casanoves, F., Pla, L., Di Rienzo, J. A., and Díaz, S. (2011). FDiversity: a software package for the integrated analysis of functional diversity. Methods Ecol. Evol. 2, 233–237. doi: 10.1111/j.2041-210X.2010.00082.x
Cerullo, G. R., and Edwards, D. P. (2019). Actively restoring resilience in selectively logged tropical forests. J. Appl. Ecol. 56, 107–118. doi: 10.1111/1365-2664.13262
Chave, J., Andalo, C., Brown, S., Cairns, M. A., Chambers, J. Q., Eamus, D., et al. (2005). Tree allometry and improved estimation of carbon stocks and balance in tropical forests. Oecologia 145, 87–99. doi: 10.1007/s00442-005-0100-x
Chave, J., Coomes, D., Jansen, S., Lewis, S. L., Swenson, N. G., and Zanne, A. E. (2009). Towards a worldwide wood economics spectrum. Ecol. Lett. 12, 351–366. doi: 10.1111/j.1461-0248.2009.01285.x
Chave, J., Réjou-Méchain, M., Búrquez, A., Chidumayo, E., Colgan, M. S., Delitti, W. B. C., et al. (2014). Improved allometric models to estimate the aboveground biomass of tropical trees. Glob. Change Biol. 20, 3177–3190. doi: 10.1111/gcb.12629
Chisholm, R. A., Muller-Landau, H. C., Abdul Rahman, K., Bebber, D. P., Bin, Y., Bohlman, S. A., et al. (2013). Scale-dependent relationships between tree species richness and ecosystem function in forests. J. Ecol. 101, 1214–1224. doi: 10.1111/1365-2745.12132
Di Sacco, A., Hardwick, K. A., Blakesley, D., Brancalion, P. H. S., Breman, E., Cecilio Rebola, L., et al. (2021). Ten golden rules for reforestation to optimize carbon sequestration, biodiversity recovery and livelihood benefits. Glob. Change Biol. 27, 1328–1348. doi: 10.1111/gcb.15498
Duque, A., Peña, M. A., Cuesta, F., González-Caro, S., Kennedy, P., Phillips, O. L., et al. (2021). Mature Andean forests as globally important carbon sinks and future carbon refuges. Nat. Commun. 12:2138. doi: 10.1038/s41467-021-22459-8
Eguiguren, P., Ojeda Luna, T., Torres, B., Lippe, M., and Günter, S. (2020). Ecosystem Service Multifunctionality: decline and Recovery Pathways in the Amazon and Chocó Lowland Rainforests. Sustainability 12:7786. doi: 10.3390/su12187786
Erb, K.-H., Kastner, T., Plutzar, C., Bais, A. L. S., Carvalhais, N., Fetzel, T., et al. (2018). Unexpectedly large impact of forest management and grazing on global vegetation biomass. Nature 553, 73–76. doi: 10.1038/nature25138
Fadrique, B., Báez, S., Duque, Á, Malizia, A., Blundo, C., Carilla, J., et al. (2018). Widespread but heterogeneous responses of Andean forests to climate change. Nature 564, 207–212. doi: 10.1038/s41586-018-0715-9
Feeley, K. J., Silman, M. R., and Duque, A. (2015). Where are the tropical plants? A call for better inclusion of tropical plants in studies investigating and predicting the effects of climate change. Front. Biogeograp. 7, 174–77. doi: 10.21425/F5FBG27602
Fick, S. E., and Hijmans, R. J. (2017). WorldClim 2: new 1-km spatial resolution climate surfaces for global land areas. Int. J. Climatol. 37, 4302–4315. doi: 10.1002/joc.5086
Gann, G. D., McDonald, T., Walder, B., Aronson, J., Nelson, C. R., Jonson, J., et al. (2019). International principles and standards for the practice of ecological restoration. Second Edition Restor. Ecol. 27, S1–S46. doi: 10.1111/rec.13035
García, Y., Arteaga, Y., Torres, B., Bravo, C., and Robles, M. (2021). Biomasa aérea de familias botánicas en un bosque siempreverde piemontano sometido a grados de intervención. Colomb. For. 24, 45–59. doi: 10.14483/2256201X.15939
Gentry, A., and Ortiz, R. (1993). “Patrones de composición florística en la Amazonía peruana. Amazonía Peruana”in Vegetación húmeda tropical en el llano subandino, eds R. Kalliola, M. Puhakka, and W. Danjoy Jyväskylä (Finland: Proyecto Amazonia Universidad de Turku (PAUT)) doi: 10.37360/mpc.20.3.3.10
Girardin, C. A. J., Farfan-Rios, W., Garcia, K., Feeley, K. J., Jørgensen, P. M., Murakami, A. A., et al. (2014). Spatial patterns of above-ground structure, biomass and composition in a network of six Andean elevation transects. Plant Ecol. Diversity 7, 161–171. doi: 10.1080/17550874.2013.820806
González-Caro, S., Duque, Á, Feeley, K. J., Cabrera, E., Phillips, J., Ramirez, S., et al. (2020). The legacy of biogeographic history on the composition and structure of Andean forests. Ecology 101:e03131. doi: 10.1002/ecy.3131
Hawes, M. (2018). Planting carbon storage. Nat. Clim. Change 8, 556–558. doi: 10.1038/s41558-018-0214-x
Hietz, P., Kleinschmidt, S., Mala, B., West, Z., and Schwarzfurtner, K. (2019). Biomass accumulation and carbon sequestration in a reforestation project in La Gamba, Costa Rica. Acta ZooBot Austria 156, 61–77.
Homeier, J., Breckle, S.-W., Günter, S., Rollenbeck, R. T., and Leuschner, C. (2010). Tree Diversity. Biotropica 42, 140–148. doi: 10.1111/j.1744-7429.2009.00547.x
Huamantupa-Chuquimaco, I. (2010). Inusual riqueza, composición y estructura arbórea en el bosque de tierra firme del Pongo Qoñec, Sur Oriente peruano. Rev. peru. Biol. 17, 167–171. doi: 10.15381/rpb.v17i2.23
Imaña, J., Antunes, O., and Rainier, C. (2011). Estructura diamétrica de un fragmento del bosque tropical seco de la región del Eco-Museo del Cerrado, Brasil. Colomb. For. 14, 23–30. doi: 10.14483/udistrital.jour.colomb.for.2011.1.a02
Jones, K. W., Etchart, N., Holland, M., Naughton-Treves, L., and Arriagada, R. (2020). The impact of paying for forest conservation on perceived tenure security in Ecuador. Conserv. Lett. 13:e12710. doi: 10.1111/conl.12710
Keeling, H. C., and Phillips, O. L. (2007). The global relationship between forest productivity and biomass. Glob. Ecol. Biogeogr. 16, 618–631. doi: 10.1111/j.1466-8238.2007.00314.x
Lal, R. (2005). Forest soils and carbon sequestration. For. Ecol. Manage. 220, 242–258. doi: 10.1016/j.foreco.2005.08.015
Lewis, S. L., Sonké, B., Sunderland, T., Begne, S. K., Lopez-Gonzalez, G., van der Heijden, G. M. F., et al. (2013). Above-ground biomass and structure of 260 African tropical forests. Phil. Trans. R. Soc. B 368:20120295. doi: 10.1098/rstb.2012.0295
Ministerio de Ambiente del Ecuador (MAE) (2013). Sistema de Clasificación de los Ecosistemas del Ecuador Continental. Quito: Ministerio del Ambiente del Ecuador
MAE and FAO (2015). Metodología para la Generación de Modelos Alométricos para la Estimación de Biomasa de árboles y bosques. Quito: Ministerio del Ambiente del Ecuador y Organización de las Naciones Unidas para la Alimentación y la Agricultura.
Malhi, Y., Girardin, C. A. J., Goldsmith, G. R., Doughty, C. E., Salinas, N., Metcalfe, D. B., et al. (2017). The variation of productivity and its allocation along a tropical elevation gradient: a whole carbon budget perspective. New Phytol. 214, 1019–1032. doi: 10.1111/nph.14189
Malizia, A., Blundo, C., Carilla, J., Osinaga Acosta, O., Cuesta, F., Duque, A., et al. (2020). Elevation and latitude drives structure and tree species composition in Andean forests: results from a large-scale plot network. PLoS One 15:e0231553. doi: 10.1371/journal.pone.0231553
Margalef, R. (1957). La teoría de la información en ecología. Mem. Real Acad. Cien. Artes Barcelona 32, 373–449.
Moser, G., Leuschner, C., Hertel, D., Graefe, S., Soethe, N., and Iost, S. (2011). Elevation effects on the carbon budget of tropical mountain forests (S Ecuador): the role of the belowground compartment: elevation effects on forest carbon cycling. Glob. Change Biol. 17, 2211–2226. doi: 10.1111/j.1365-2486.2010.02367.x
Myster, R. W. (2020). Disturbance and Response in the Andean Cloud Forest: a Conceptual Review. Bot. Rev. 86, 119–135. doi: 10.1007/s12229-020-09219-x
Nadkarni, N. M., Schaefer, D., Matelson, T. J., and Solano, R. (2004). Biomass and nutrient pools of canopy and terrestrial components in a primary and a secondary montane cloud forest, Costa Rica. For. Ecol. Manage. 198, 223–236. doi: 10.1016/j.foreco.2004.04.011
Pan, Y., Birdsey, R. A., Fang, J., Houghton, R., Kauppi, P. E., Kurz, W. A., et al. (2011). A Large and Persistent Carbon Sink in the World’s Forests. Science 333, 988–993. doi: 10.1126/science.1201609
Patiño, J., Lozano, P., Tipán, C., Navarrete, H., López, R., Asanza, M., et al. (2015). Composición florística y estructura de un bosque siempreverde piemontano de 600 a 700 m s.n.m. en la cuenca del río Piatúa, Napo, Ecuador. Rev. Amazónica Ciencia y Tecnol. 4, 166–214.
Peña, M. A., Feeley, K. J., and Duque, A. (2018). Effects of endogenous and exogenous processes on aboveground biomass stocks and dynamics in Andean forests. Plant Ecol 219, 1481–1492. doi: 10.1007/s11258-018-0895-2
Phillips, J., Duque, Á, Scott, C., Wayson, C., Galindo, G., Cabrera, E., et al. (2016). Live aboveground carbon stocks in natural forests of Colombia. For. Ecol. Manage. 374, 119–128. doi: 10.1016/j.foreco.2016.05.009
Pitman, N. C. A., Terborgh, J. W., Silman, M. R., Núñez, V. P., Neill, D. A., Cerón, C. E., et al. (2002). A Comparison of Tree Species Diversity in Two Upper Amazonian Forests. Ecology 83, 3210–3224. doi: 10.2307/3071854
Poorter, L. (2007). Are Species Adapted to Their Regeneration Niche, Adult Niche, or Both? Am. Nat. 169, 433–442. doi: 10.1086/512045
Poorter, L., van der Sande, M. T., Thompson, J., Arets, E. J. M. M., Alarcón, A., Álvarez-Sánchez, J., et al. (2015). Diversity enhances carbon storage in tropical forests: Carbon storage in tropical forests. Glob. Ecol. Biogeogr. 24, 1314–1328. doi: 10.1111/geb.12364
Quizhpe, W., Benítez, Á, Cuenca, K., Uvidia, H., Huamantupa, I., Muñoz, J., et al. (2019). Forest Diversity and Structure in the Amazonian Mountain Ranges of Southeastern Ecuador. Diversity 11:196. doi: 10.3390/d11100196
R Core Team. (2021). R: A Language and Environment for Statistical Computing. Vienna: R Foundation for Statistical Computing.
Ramsar (2018). Complejo de Humedales Cuyabeno Lagartococha Yasuní. Ecuador: Servicio de Información sobre Sitios Ramsar.
Ritchie, H., and Roser, M. (2020). CO2 and Greenhouse Gas Emissions. Our World in Data. Available online at: https://ourworldindata.org/co2-and-other-greenhouse-gas-emissions (accessed December 15, 2020).
Rutishauser, E., Hérault, B., Baraloto, C., Blanc, L., Descroix, L., Sotta, E. D., et al. (2015). Rapid tree carbon stock recovery in managed Amazonian forests. Curr. Biol. 25, R787–R788. doi: 10.1016/j.cub.2015.07.034
Samaniego, J., Alatorre, J. E., Reyes, O., Ferrer, J., Muñoz, L., and Arpaia, L. (2019). Panorama de las contribuciones determinadas a nivel nacional en América Latina y el Caribe, 2019: avances para el cumplimiento del Acuerdo de París. Santiago: CEPAL.
Sierra, C. A., del Valle, J. I., Orrego, S. A., Moreno, F. H., Harmon, M. E., Zapata, M., et al. (2007). Total carbon stocks in a tropical forest landscape of the Porce region, Colombia. For. Ecol. Manage. 243, 299–309. doi: 10.1016/j.foreco.2007.03.026
Silver, W. L., Ostertag, R., and Lugo, A. E. (2000). The Potential for Carbon Sequestration Through Reforestation of Abandoned Tropical Agricultural and Pasture Lands. Restor. Ecol. 8, 394–407. doi: 10.1046/j.1526-100x.2000.80054.x
Silvertown, J. (2004). Plant coexistence and the niche. Trends Ecol. Evol. 19, 605–611. doi: 10.1016/j.tree.2004.09.003
Sy, V. D., Herold, M., Achard, F., Beuchle, R., Clevers, J. G. P. W., Lindquist, E., et al. (2015). Land use patterns and related carbon losses following deforestation in South America. Environ. Res. Lett. 10:124004. doi: 10.1088/1748-9326/10/12/124004
ter Steege, H., Pitman, N. C. A., Sabatier, D., Baraloto, C., Salomao, R. P., Guevara, J. E., et al. (2013). Hyperdominance in the Amazonian Tree Flora. Science 342:1243092 doi: 10.1126/science.1243092
ter Steege, H., Sabatier, D., Castellanos, H., Van Andel, T., Duivenvoorden, J., Adalardo De Oliveira, A., et al. (2000). An analysis of the floristic composition and diversity of Amazonian forests including those of the Guiana Shield. J. Trop. Ecol. 16, 801–828. doi: 10.1017/S0266467400001735
The Plant List (2013). Version 1.1. Published on the Internet. Available online at: http://www.theplantlist.org (accessed December 15, 2020).
Thornthwaite, C. W. (1948) An approach toward a rational classification of climate. Geogr. Rev. 38, 55–94.
Tierres, J., Chávez, D., Segura, E., and Cabrera, M. (2020). Potencial de carbono en el estrato arbóreo de un bosque siempreverde de tierras bajas, Sucumbíos - Ecuador. Rev. Cubana de Cienc. For. 8, 282–295.
Torres, B., Vasseur, L., López, R., Lozano, P., García, Y., Arteaga, Y., et al. (2020). Structure and above ground biomass along an elevation small-scale gradient: case study in an Evergreen Andean Amazon forest, Ecuador. Agrofor. Syst. 94, 1235–1245. doi: 10.1007/s10457-018-00342-8
UNFCCC (2008). Report of the Conference of the Parties on its Thirteenth session, Held in Bali from 3 to 15 December 2007. New York, NY: United Nations Framework convention on climate change.
Unger, M., Homeier, J., and Leuschner, C. (2012). Effects of soil chemistry on tropical forest biomass and productivity at different elevations in the equatorial Andes. Oecologia 170, 263–274. doi: 10.1007/s00442-012-2295-y
Valencia, R., Balslev, H., and Paz Y Miño, C. G. (1994). High tree alpha-diversity in Amazonian Ecuador. Biodivers. Conserv. 3, 21–28. doi: 10.1007/BF00115330
Valencia, R., Foster, R. B., Villa, G., Condit, R., Svenning, J.-C., Hernandez, C., et al. (2004). Tree species distributions and local habitat variation in the Amazon: large forest plot in eastern Ecuador. J. Ecol. 92, 214–229. doi: 10.1111/j.0022-0477.2004.00876.x
Wheeler, C. E., Omeja, P. A., Chapman, C. A., Glipin, M., Tumwesigye, C., and Lewis, S. L. (2016). Carbon sequestration and biodiversity following 18 years of active tropical forest restoration. For. Ecol. Manage. 373, 44–55. doi: 10.1016/j.foreco.2016.04.025
Wiegant, D., Peralvo, M., van Oel, P., and Dewulf, A. (2020). Five scale challenges in Ecuadorian forest and landscape restoration governance. Land Use Policy 96:104686. doi: 10.1016/j.landusepol.2020.104686
Keywords: aboveground biomass, Ecuadorian Amazon, tree diversity, elevation gradient, Lower Montane Forest, Piedmont Forest, Lowland Forest
Citation: Maza B, Rodes-Blanco M and Rojas E (2022) Aboveground Biomass Along an Elevation Gradient in an Evergreen Andean–Amazonian Forest in Ecuador. Front. For. Glob. Change 5:738585. doi: 10.3389/ffgc.2022.738585
Received: 09 July 2021; Accepted: 11 February 2022;
Published: 06 April 2022.
Edited by:
Larry Jiménez-Ferbans, University of Magdalena, ColombiaReviewed by:
Tammo Reichgelt, University of Connecticut, United StatesEmilio Vilanova, University of California, Berkeley, United States
Copyright © 2022 Maza, Rodes-Blanco and Rojas. This is an open-access article distributed under the terms of the Creative Commons Attribution License (CC BY). The use, distribution or reproduction in other forums is permitted, provided the original author(s) and the copyright owner(s) are credited and that the original publication in this journal is cited, in accordance with accepted academic practice. No use, distribution or reproduction is permitted which does not comply with these terms.
*Correspondence: Byron Maza, Ynlyb252bXJAeWFob28uZXM=
†These authors have contributed equally to this work and share first authorship