 Xiaofan Deng
 Zhe Zhang2*
 Fan Zhao
95% of researchers rate our articles as excellent or good
Learn more about the work of our research integrity team to safeguard the quality of each article we publish.
Find out more
ORIGINAL RESEARCH article
Front. For. Glob. Change , 06 January 2023
Sec. Fire and Forests
Volume 5 - 2022 | https://doi.org/10.3389/ffgc.2022.1073554
This article is part of the Research Topic Fire Disturbance Impacts on Forests and Feedback to Climate Change View all 5 articles
Climate change is becoming increasingly severe. Today, several studies have found that climate change substantially influences the increasing number of forest fires. Regional climate models (RCMs) are currently a vital tool for climate forecasting in researching how to combat forest fires. As China’s forest fire area, Yunnan province has frequent forest fires that generate significant losses, so it is a crucial area for forest fire prevention in China. Therefore, this study uses meteorological observational data from 25 stations in Yunnan over the period 2004–2018 to compares and evaluates the Regional Climate Forecast Model (RegCM) and Weather Research and Forecasting model (WRF) in multiple dimensions. The optimal RCM is then determined for the forest area of Yunnan. The results show that the deviations of RegCM predictions from the spatial mean of the real temperature are less than 3°C, whereas the deviations of WRF are all greater than 3°C. In addition, the RegCM correlation coefficient exceeds 0.8, whereas the WRF correlation coefficient exceeds 0.75. In terms of precipitation, the deviation of RegCM predictions for the whole territory is less than 2 mm, whereas the overall deviation of WRF predictions is great. The correlation coefficient for RegCM and WRF are both less than 0.5, but the RegCM correlation coefficient exceeds that of the WRF. We thus conclude that RegCM is more suitable for predicting the climate of the forest area of Yunnan. This study also provides references for related climate forecasting and research into forest fire dynamics in general.
Forest fires dynamics are one of the main contents of medium- and long-term forecasting of forest fire. It depends mainly on the interaction between climate, vegetation, and human activity. Over the long term, the climate is the main factor that determines forest fire dynamics (Feldmann et al., 2009; Dupuy et al., 2020; Goss et al., 2020). In recent years, the climate has changed drastically, so the accuracy of climate forecasts has become a major subject in forest fire research.
Climate prediction models are currently effective tools for climate forecasting (Boer et al., 2016; Smith et al., 2020; Ban et al., 2021). The regional climate model (RCM) produces regional climate predictions from the global climate model (GCM), but these predictions are inaccurate because of the latter’s horizontal resolution of roughly 250–600 km of the global climate model (Deser et al., 2012; Giorgi and Gutowski, 2015; Giorgi, 2019). Commonly used RCMs include (1) Regional Climate Forecasting Model (RegCM) from the International Centre for Theoretical Physics, (2) Weather Research and Forecasting (WRF) from the National Centers for Environmental Prediction, (3) Climate-Weather Research and Forecasting (CWRF) from the University of Maryland;(4) Providing Regional Climates for Impacts Studies (PRECIS) from the United Kingdom Meteorological Office Hadley Centre, and (5) High-Resolution Limited-Area Model (HIRHAM) from the Danish Meteorological Institute. Previous studies show that RegCM is not suitable for high-latitude regions (Mallet et al., 2017; Shi et al., 2018; Da Silva et al., 2019), WRF and CWRF are suitable for most regions (Raghavan et al., 2016; Garrido et al., 2020; Kuo et al., 2020), PRECIS is suitable for equatorial regions (Centella-Artola et al., 2015), HIRHAM is suitable for polar regions (Dorn et al., 2018). However, other studies reveal many exceptions to these guidelines, especially in regions with unique topographic and climatic characteristics, such as the Yunnan forest area, where the selection of RCMs still requires evaluation with the help of local characteristics data.
The present study compares meteorological observational data from stations in Yunnan from 2004 to 2018 with predictions of the selected RCM for the same period. We then analyze the degree of deviation in multiple dimensions between predictions and observations to determine which RCM is suitable for the forest area of Yunnan based. This study should provide a reference for researching forest fire dynamics and related regional climate predictions research.
Yunnan is located in southwest China (21°8′–29°15′N, 97°31′–106°11′E) and belongs to the highland area (Figure 1). The terrain is unique; it is high in the northwest and low in the southeast, descending stepwise from north to south at an average of 6 m/km. The area has a subtropical highland monsoon climate with small annual temperature differences but large daily temperature differences. It has distinct dry and wet seasons, the topography significantly affects the air temperature, and the three-dimensional climate characteristics are remarkable. The forest area of Yunnan has the highest incidence of forest fires in China (Hong et al., 2007). The forest fire-danger period is generally from December to June of the following year, and the high-fire-danger period is from March to May (People’s Government of Yunnan Province, 2022).
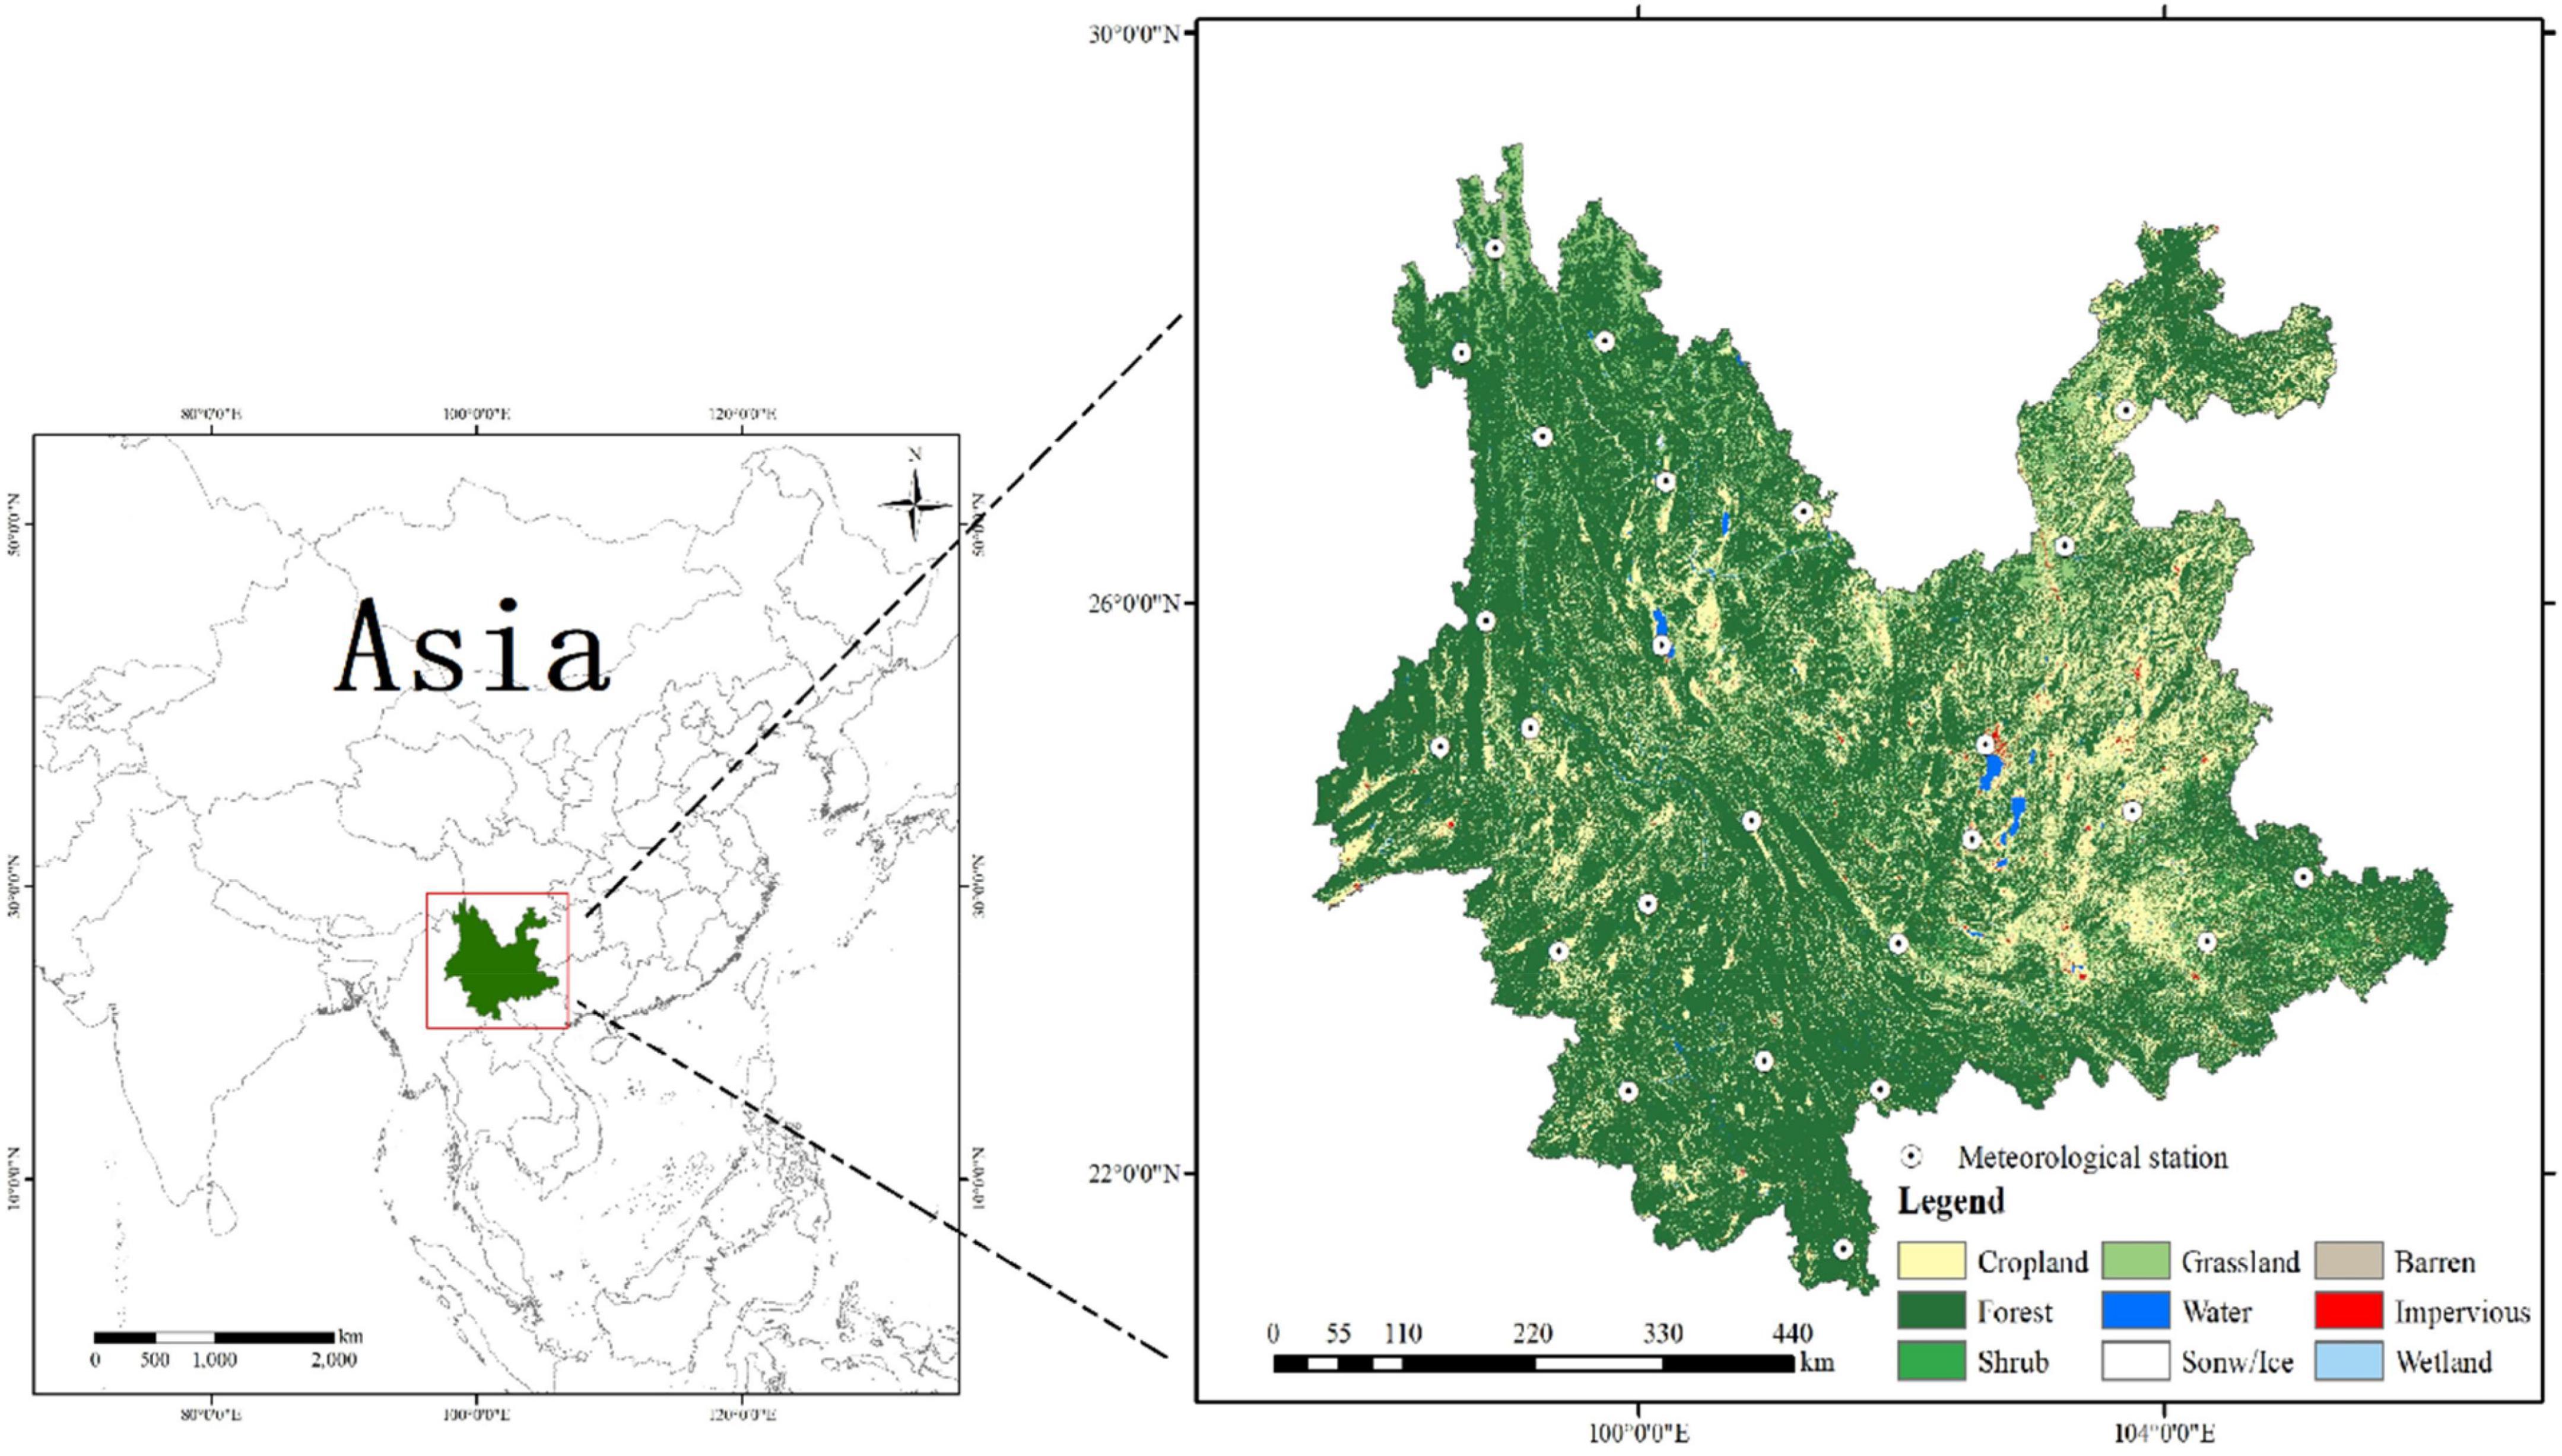
Figure 1. Distribution of meteorological stations in Yunnan forest area.
Regional climate forecasting model is developed by the International Centre for Theoretical Physic and is currently the most used RCM (Giorgi and Bates, 1989; Giorgi et al., 1993; Seth and Giorgi, 1998); the simulation results of different versions of RegCM have demonstrated its applicability in China (Xuejie et al., 2001; Lu et al., 2019; Dong and Shi, 2022). WRF is originally a mesoscale weather forecast model developed jointly by the National Centers for Environmental Prediction, the National Center for Atmospheric Research, and several universities and research institutes (Heikkilä et al., 2011). Numerous studies have confirmed that WRF accurately simulates China’s climate (Gao et al., 2013; Xiang-Hui and Xun-Qiang, 2015; Chen et al., 2018; Entao, 2019). Most of these studies focus on the mean climatology, however, comparison between RegCM and WRF is rare (Gao, 2020), especially for the forest area of Yunnan. Therefore, the present study uses local data from the forest area of Yunnan to evaluate and compare RegCM and WRF (version 4.6 for RegCM and 4.2 for WRF). The running of RegCM and WRF requires the adaptive configuration of several parameters for the simulation area during operation. The simulation area is in the center of the administrative division of Yunnan province (25°30′N, 101°36′E). The horizontal resolution is 10 km, and the buffer area is divided into 10 grids. The dynamical and physical configuration it mainly includes dynamical schemes such as dynamical frame work, vertical layers, and physical schemes such as cumulus convection schemes, land surface settings, planetary boundary layers, microphysical parameterization, and radiation schemes. The configurations of these schemes are based on the experimental data of CORDEX-EA-I, which have been demonstrated to be suitable for East Asia (Guo et al., 2018; Yu et al., 2020; Li et al., 2022). These configurations are given in Table 1 We use the ERA-Interim as the initial and boundary conditions for both RCMs, and the optimal interpolated sea surface temperature from the National Oceanic and Atmospheric Administration as the sea surface temperature (Kanamitsu et al., 2002). Additionally, the simulation period is 15 consecutive years from January 1, 2003, to December 31, 2018 (2003 is the start-up period).
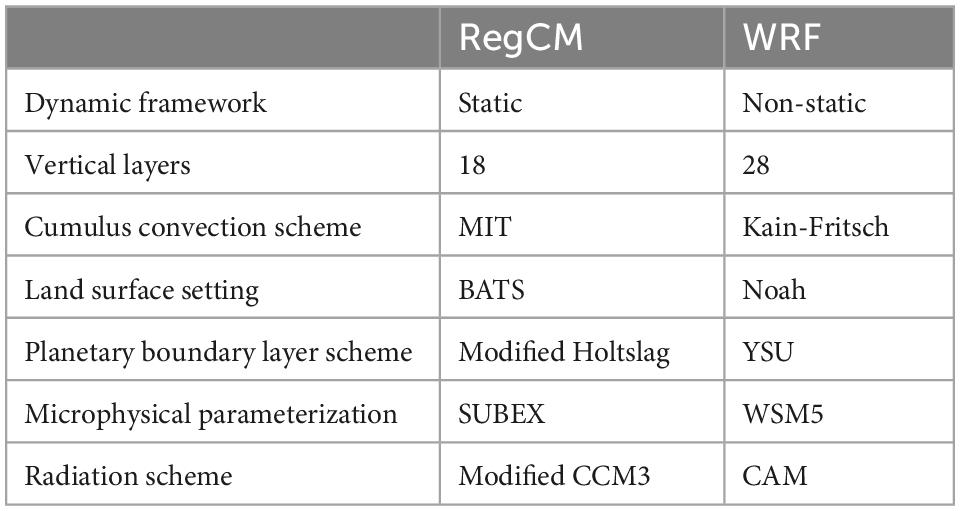
Table 1. The dynamic and physical configuration of regional climate forecast model (RegCM4) and weather research and forecasting model (WRF).
We use the daily meteorological observational data (2004–2018) from 25 stations in Yunnan (Figure 1), as provided by the China National Meteorological Information Center1. The data give air temperature (i.e., average daily air temperature, maximum daily air temperature, minimum daily air temperature), precipitation (20:00–08:00 precipitation, 08:00–20:00 precipitation, 20:00–20:00 total precipitation), relative humidity (average relative humidity, minimum relative humidity), wind speed (average wind speed, maximum wind speed, maximum wind velocity), and other factors such as sunshine hours.
The daily meteorological simulated data were calculated for each year by using both RegCM and WRF. We then analyzed at a progressively more granular degree the deviation of meteorological simulated data from meteorological observation data for (1) 5 years annual average, (2) annual average during the fire-danger period, (3) annual average monthly during the high-fire-danger period, and (4) other dimensions. Finally, the optimal RCM suitable for the forest area of Yunnan is determined based on the degree of deviation. The daily meteorological simulated data derived from these two RCMs are minimum temperature, maximum temperature, average precipitation, total precipitation, minimum relative humidity, maximum wind speed, and average wind speed. However, previous studies (Zhu et al., 2022) show that the maximum temperature and total precipitation are the main drivers of forest fire occurrence in this region, and that the combination of these two factors largely determines an area’s forest fire dynamics. Therefore, we evaluate the maximum temperature (Tmax) and total precipitation (Preci) from the simulated output data were selected as the basis for evaluation.
To quantify the degree of deviation, we use four statistical indicators categorized as temporal or spatial. The first temporal statistical indicator is the root mean square error (RMSE), which reflects the overall difference between predictions and observational data. The RMSE is given by
where ai is the observational data, bi is simulated output data, and Ni is the total number of years. The second temporal statistical indicator is the correlation coefficient R, which measures the linearity of predictions with respect to observational data. R is given by
where is the mean of the observational data, is the mean of the simulated output data, and n is the number of datasets. The third temporal statistical indicator is the significance coefficient p, which is obtained by applying a Pearson correlation analysis, and it reflects the possibility of an event to occur (generally, p < 0.05 means a correlation exists, p < 0.01 means a significant correlation exists, and p < 0.001 means an extremely significant correlation exists).
The spatial statistical indicator is mainly based on raster images formed by Kriging interpolation, which is a linear unbiased estimation of unknown sample points based on the use of regional changes and variation functions as an essential tool. We use Arcgis 10.8 software for interpolation.
Daily observational maximum temperatures at each meteorological station from 2004 to 2018 were used as real data, and data were obtained from (1) 5 years annual average temperature, (2) annual average temperature during the fire-danger period, and (3) annual average monthly temperature during the high-fire-danger period. These data were then compared with the RegCM and WRF results to evaluate the accuracy with which RCM can predict daily maximum air temperature in the forest area of Yunnan.
To clarify how RegCM and WRF simulate the temperature, we divided the period 2004–2018 into three 5 years intervals. We compared the spatial distribution of annual mean temperature differences for RegCM, WRF and real data for three time periods. Figure 2 shows the spatial distribution of the difference between the simulated and real annual average temperatures for each five-year period. The temperatures predicted by RegCM and WRF decrease from south to north, as does the real temperature. The RegCM results are closer to the real temperatures than the WRF results, which deviate significantly from the real temperature. The spatial distribution of the RegCM results for each of the three time periods accurately predicts the temperature over the whole territory, with a negative deviation generally less than 2°C. Only in northwestern Yunnan is the negative deviation greater (up to 5°C). The WRF temperature is accurate only in southeastern Yunnan, where the negative deviation is less than 1°C. In most other areas, the negative deviation exceeds 4°C, especially in northeastern Yunnan, where it reaches 7°C. However, the deviation from 2009 to 2013 exceeds that of the other two periods. Additionally, the WRF produces similar results, with the largest deviation for 2009–2013.
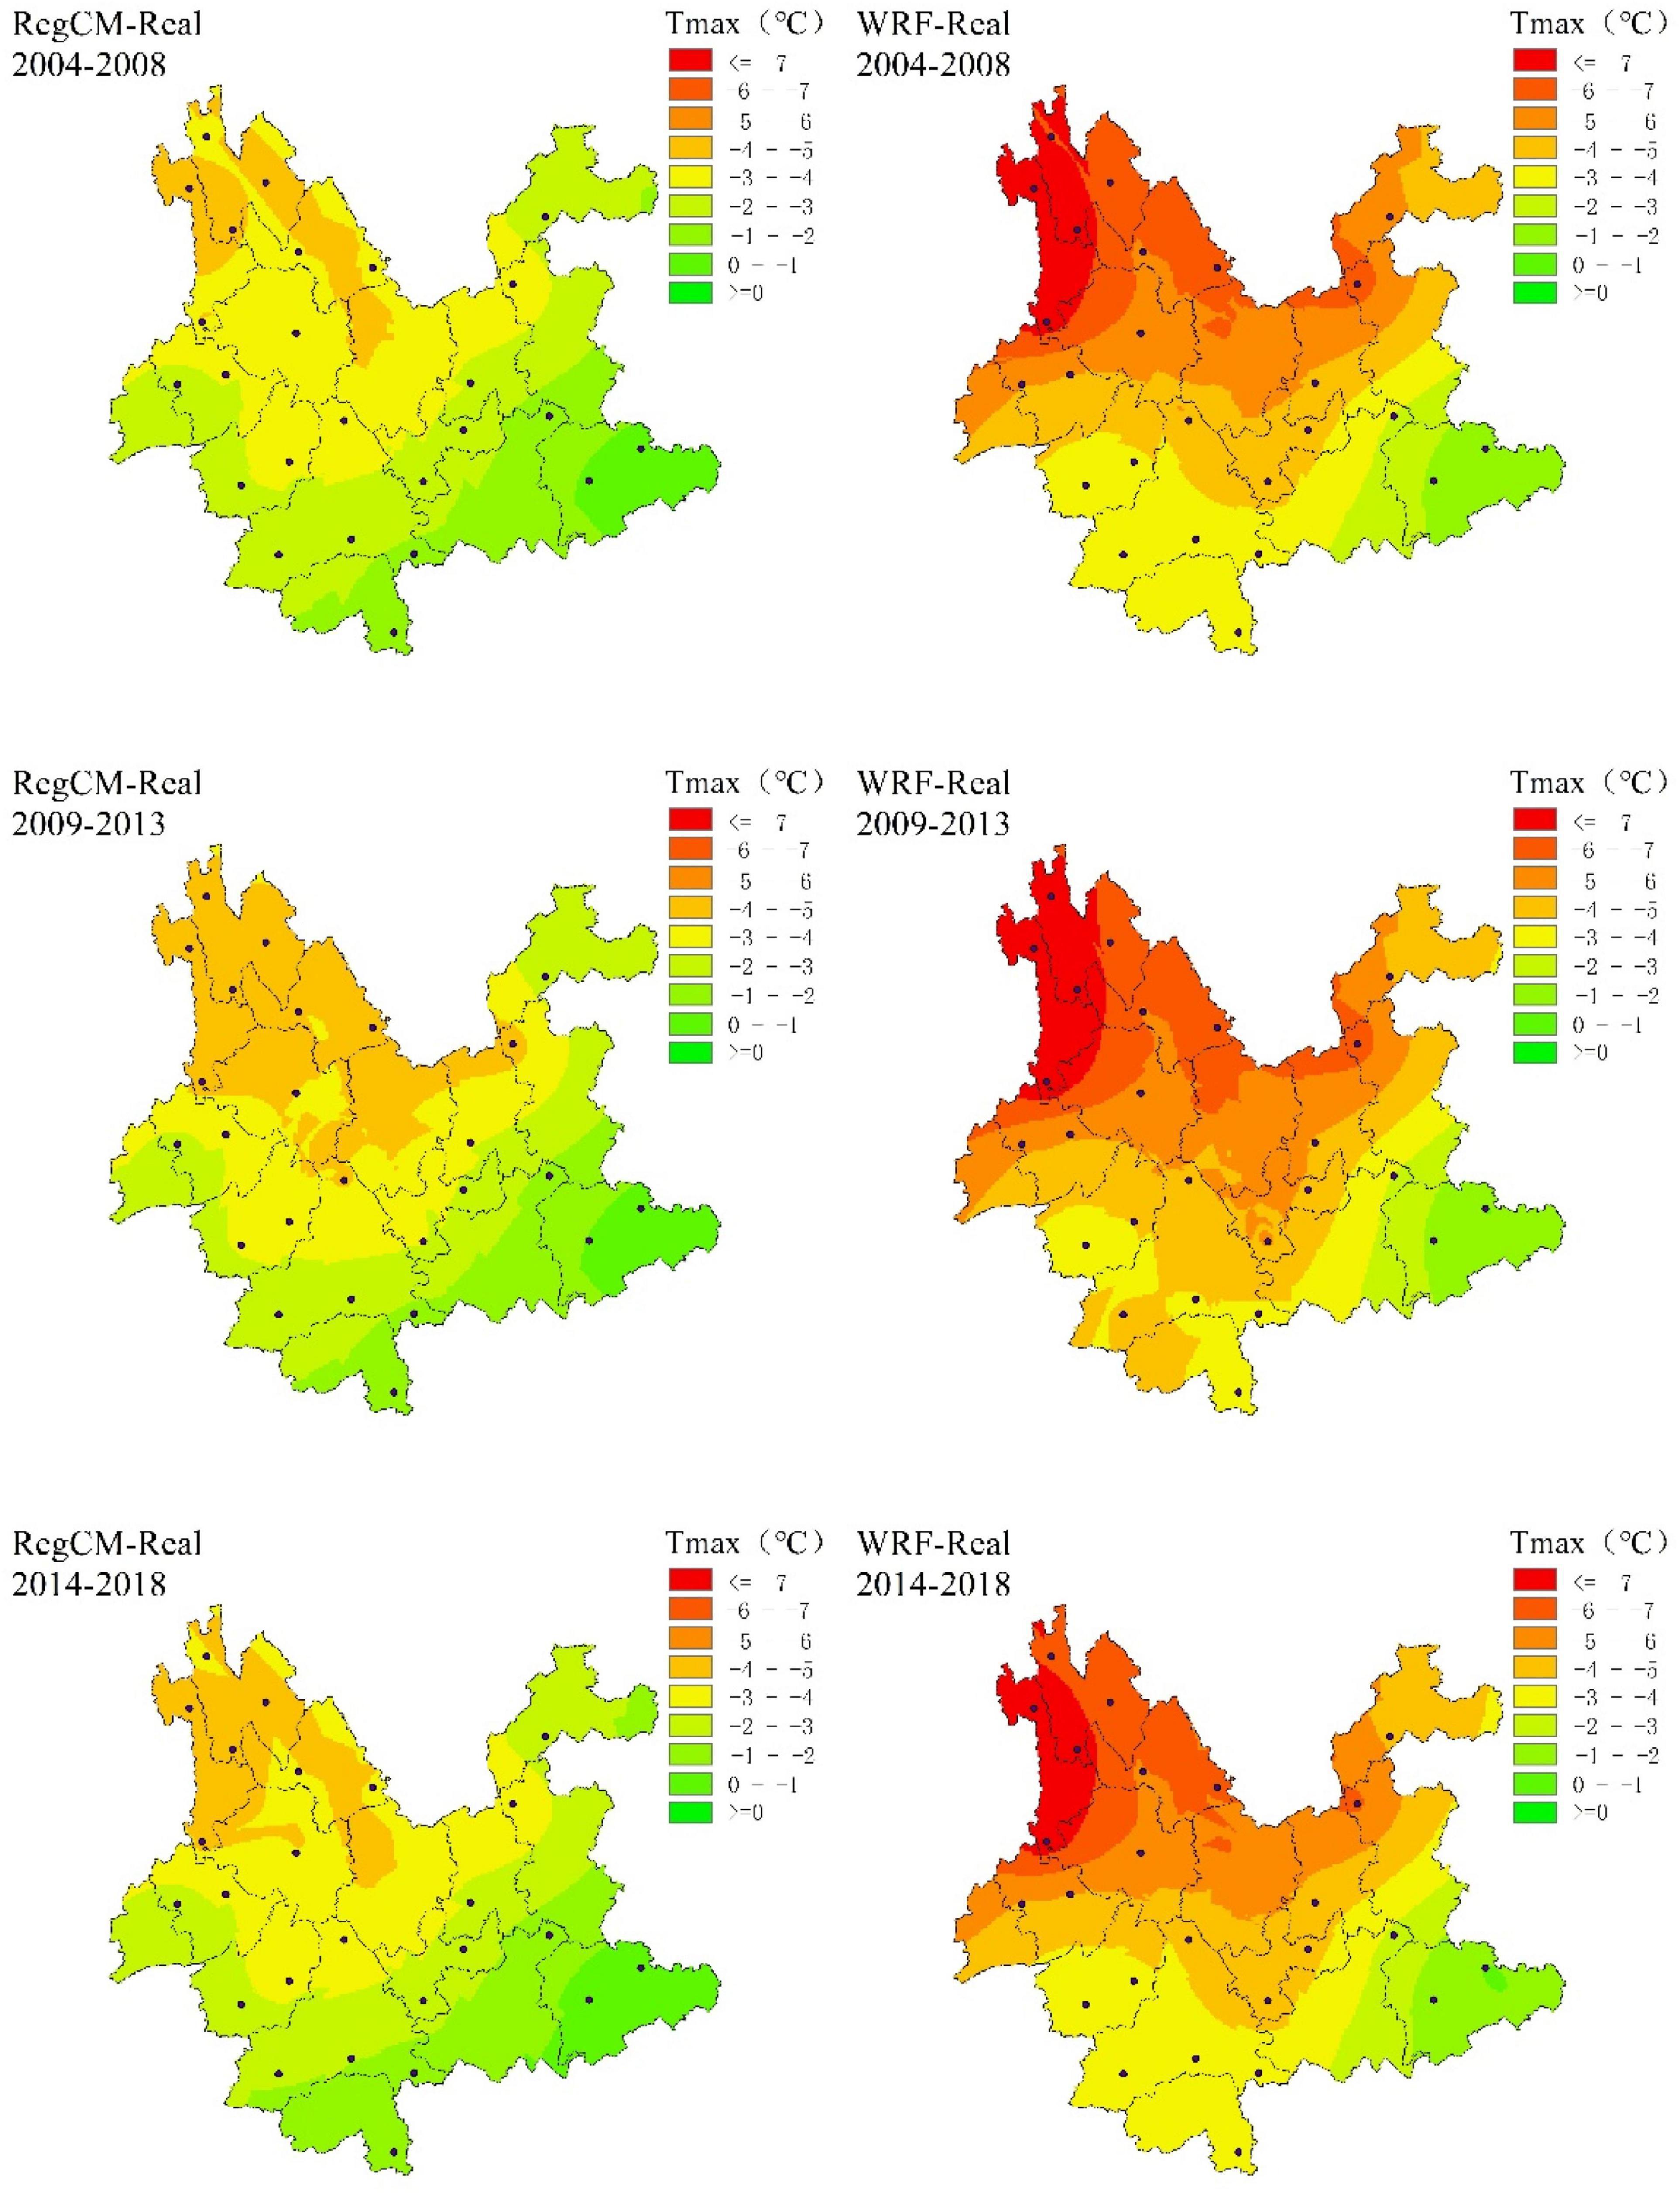
Figure 2. Spatial distribution of the difference in 5 years annual average temperature.
The fire-danger period for the forest area of Yunnan generally extends from December to June of the following year. Thus, we analyze the RCM results over this period. Figure 3 shows the spatial distribution of the differences in the annual mean temperature during the fire-danger period. The RegCM and WRF results are similar to the real results. The RegCM results are accurate for the southern, southwestern, southeastern, and northeastern Yunnan but deviate negatively in northwestern, central, and northern by up to 5°C. The WRF results are accurate only in southeastern Yunnan, the deviation in other areas exceeds 5°C.
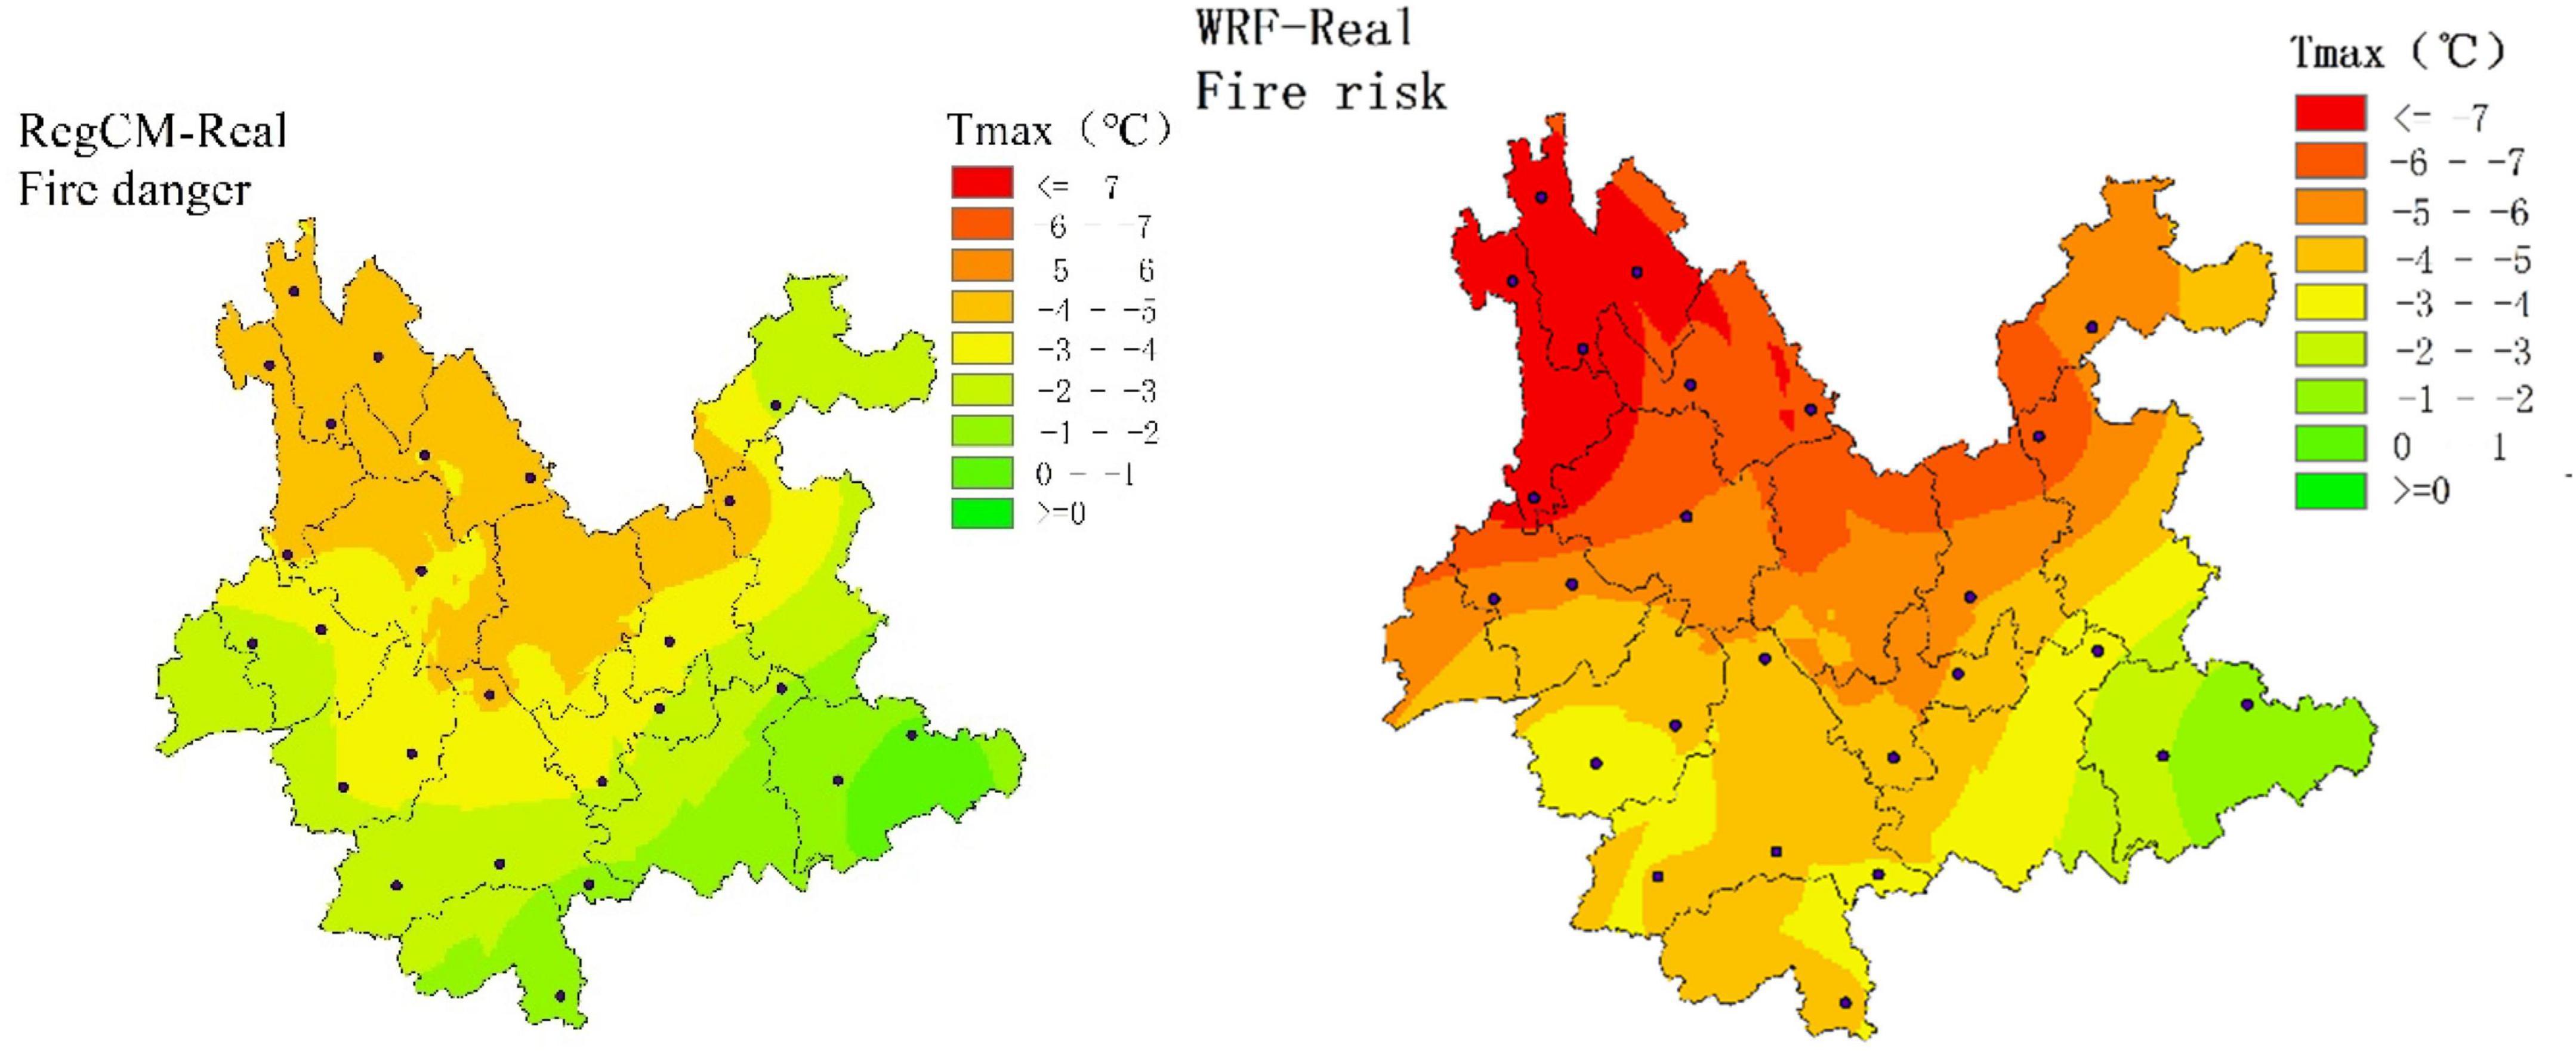
Figure 3. Spatial distribution of the difference in annual average temperature during the fire-danger.
March to May is the high-fire-danger period for the forest area of Yunnan, the vast majority of forest fires occur during this period. To clarify the simulations by RegCM and WRF for the high-fire-danger period, we compare the differences with respect to the real results for March, April, and May of each year. Figure 4 shows that both RCMs accurately predict the real temperatures. The RegCM results have deviated the least from the real temperatures. Figure 5 shows that the RegCM results deviate mainly in western and northwestern Yunnan, but in most areas of western and northwestern Yunnan in March, and it is concentrated in scattered areas in western and northwestern Yunnan in April. The sporadic areas of the month expanded to parts of southwestern Yunnan in May, and the maximum deviation attains 10°C. The overall results of WRF are poor, with negative deviations in the range of 4–7°C.
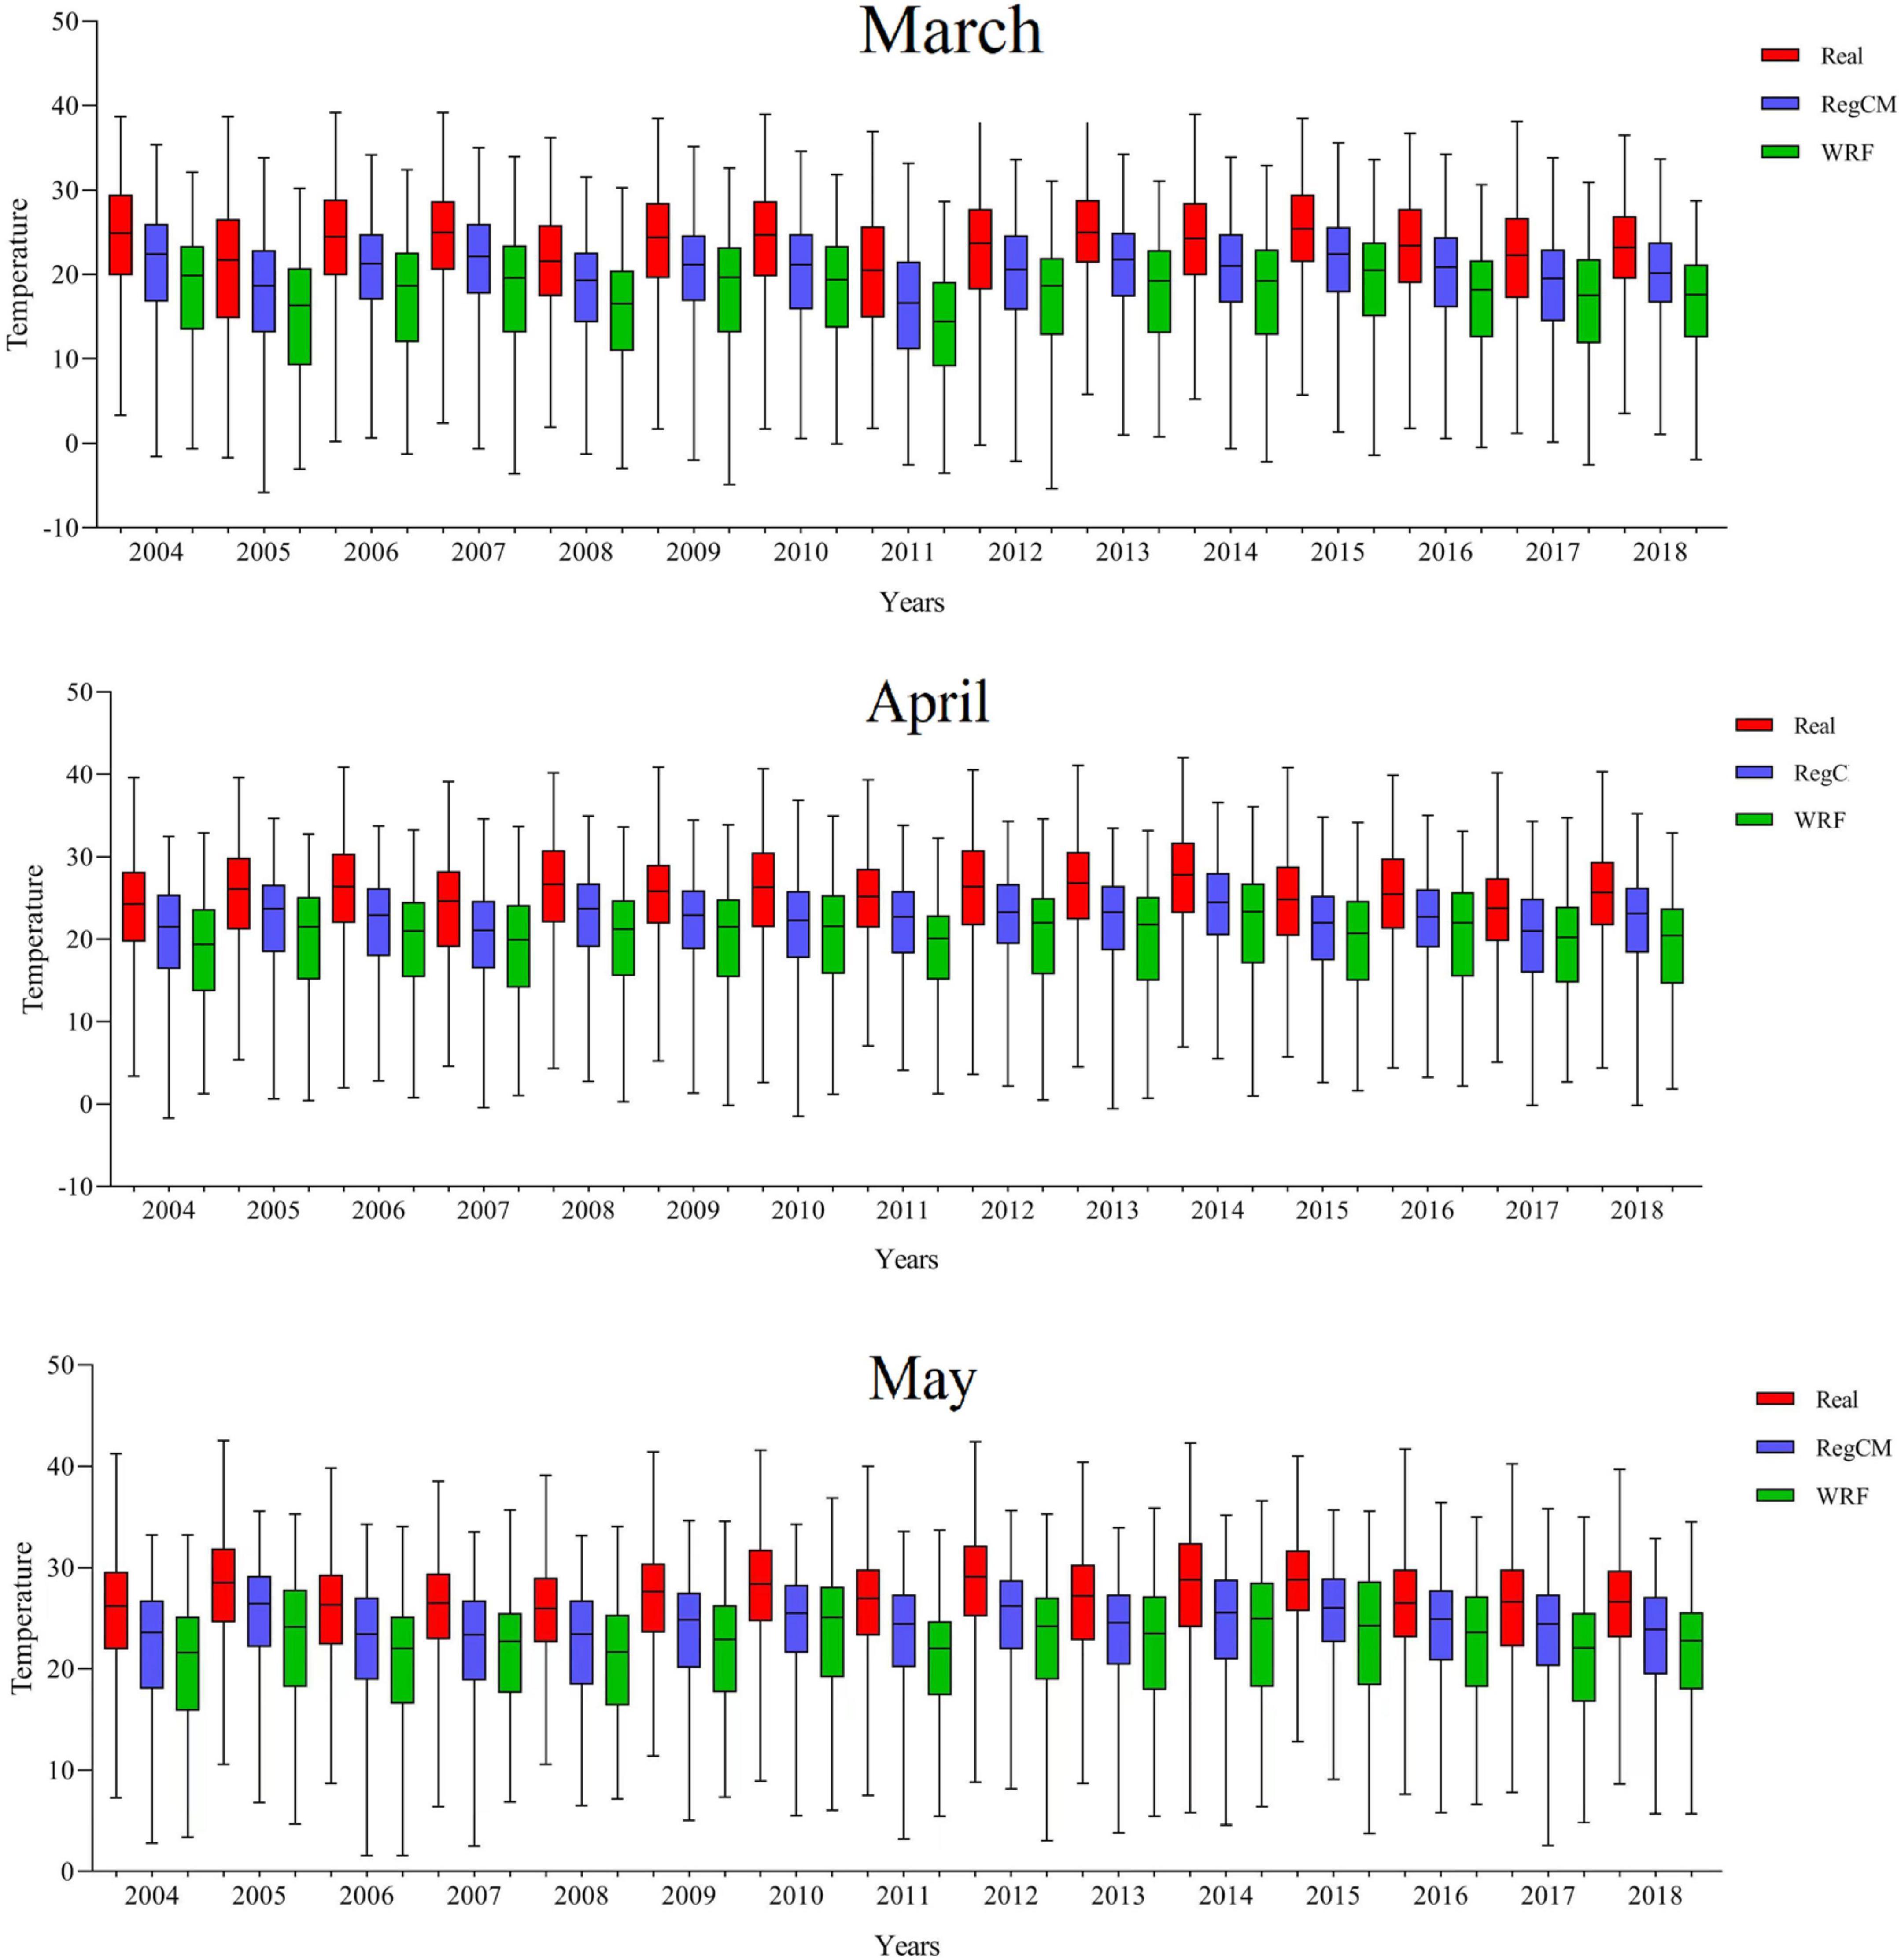
Figure 4. The trend of annual average monthly temperature during the high-fire-danger (unit: °C).
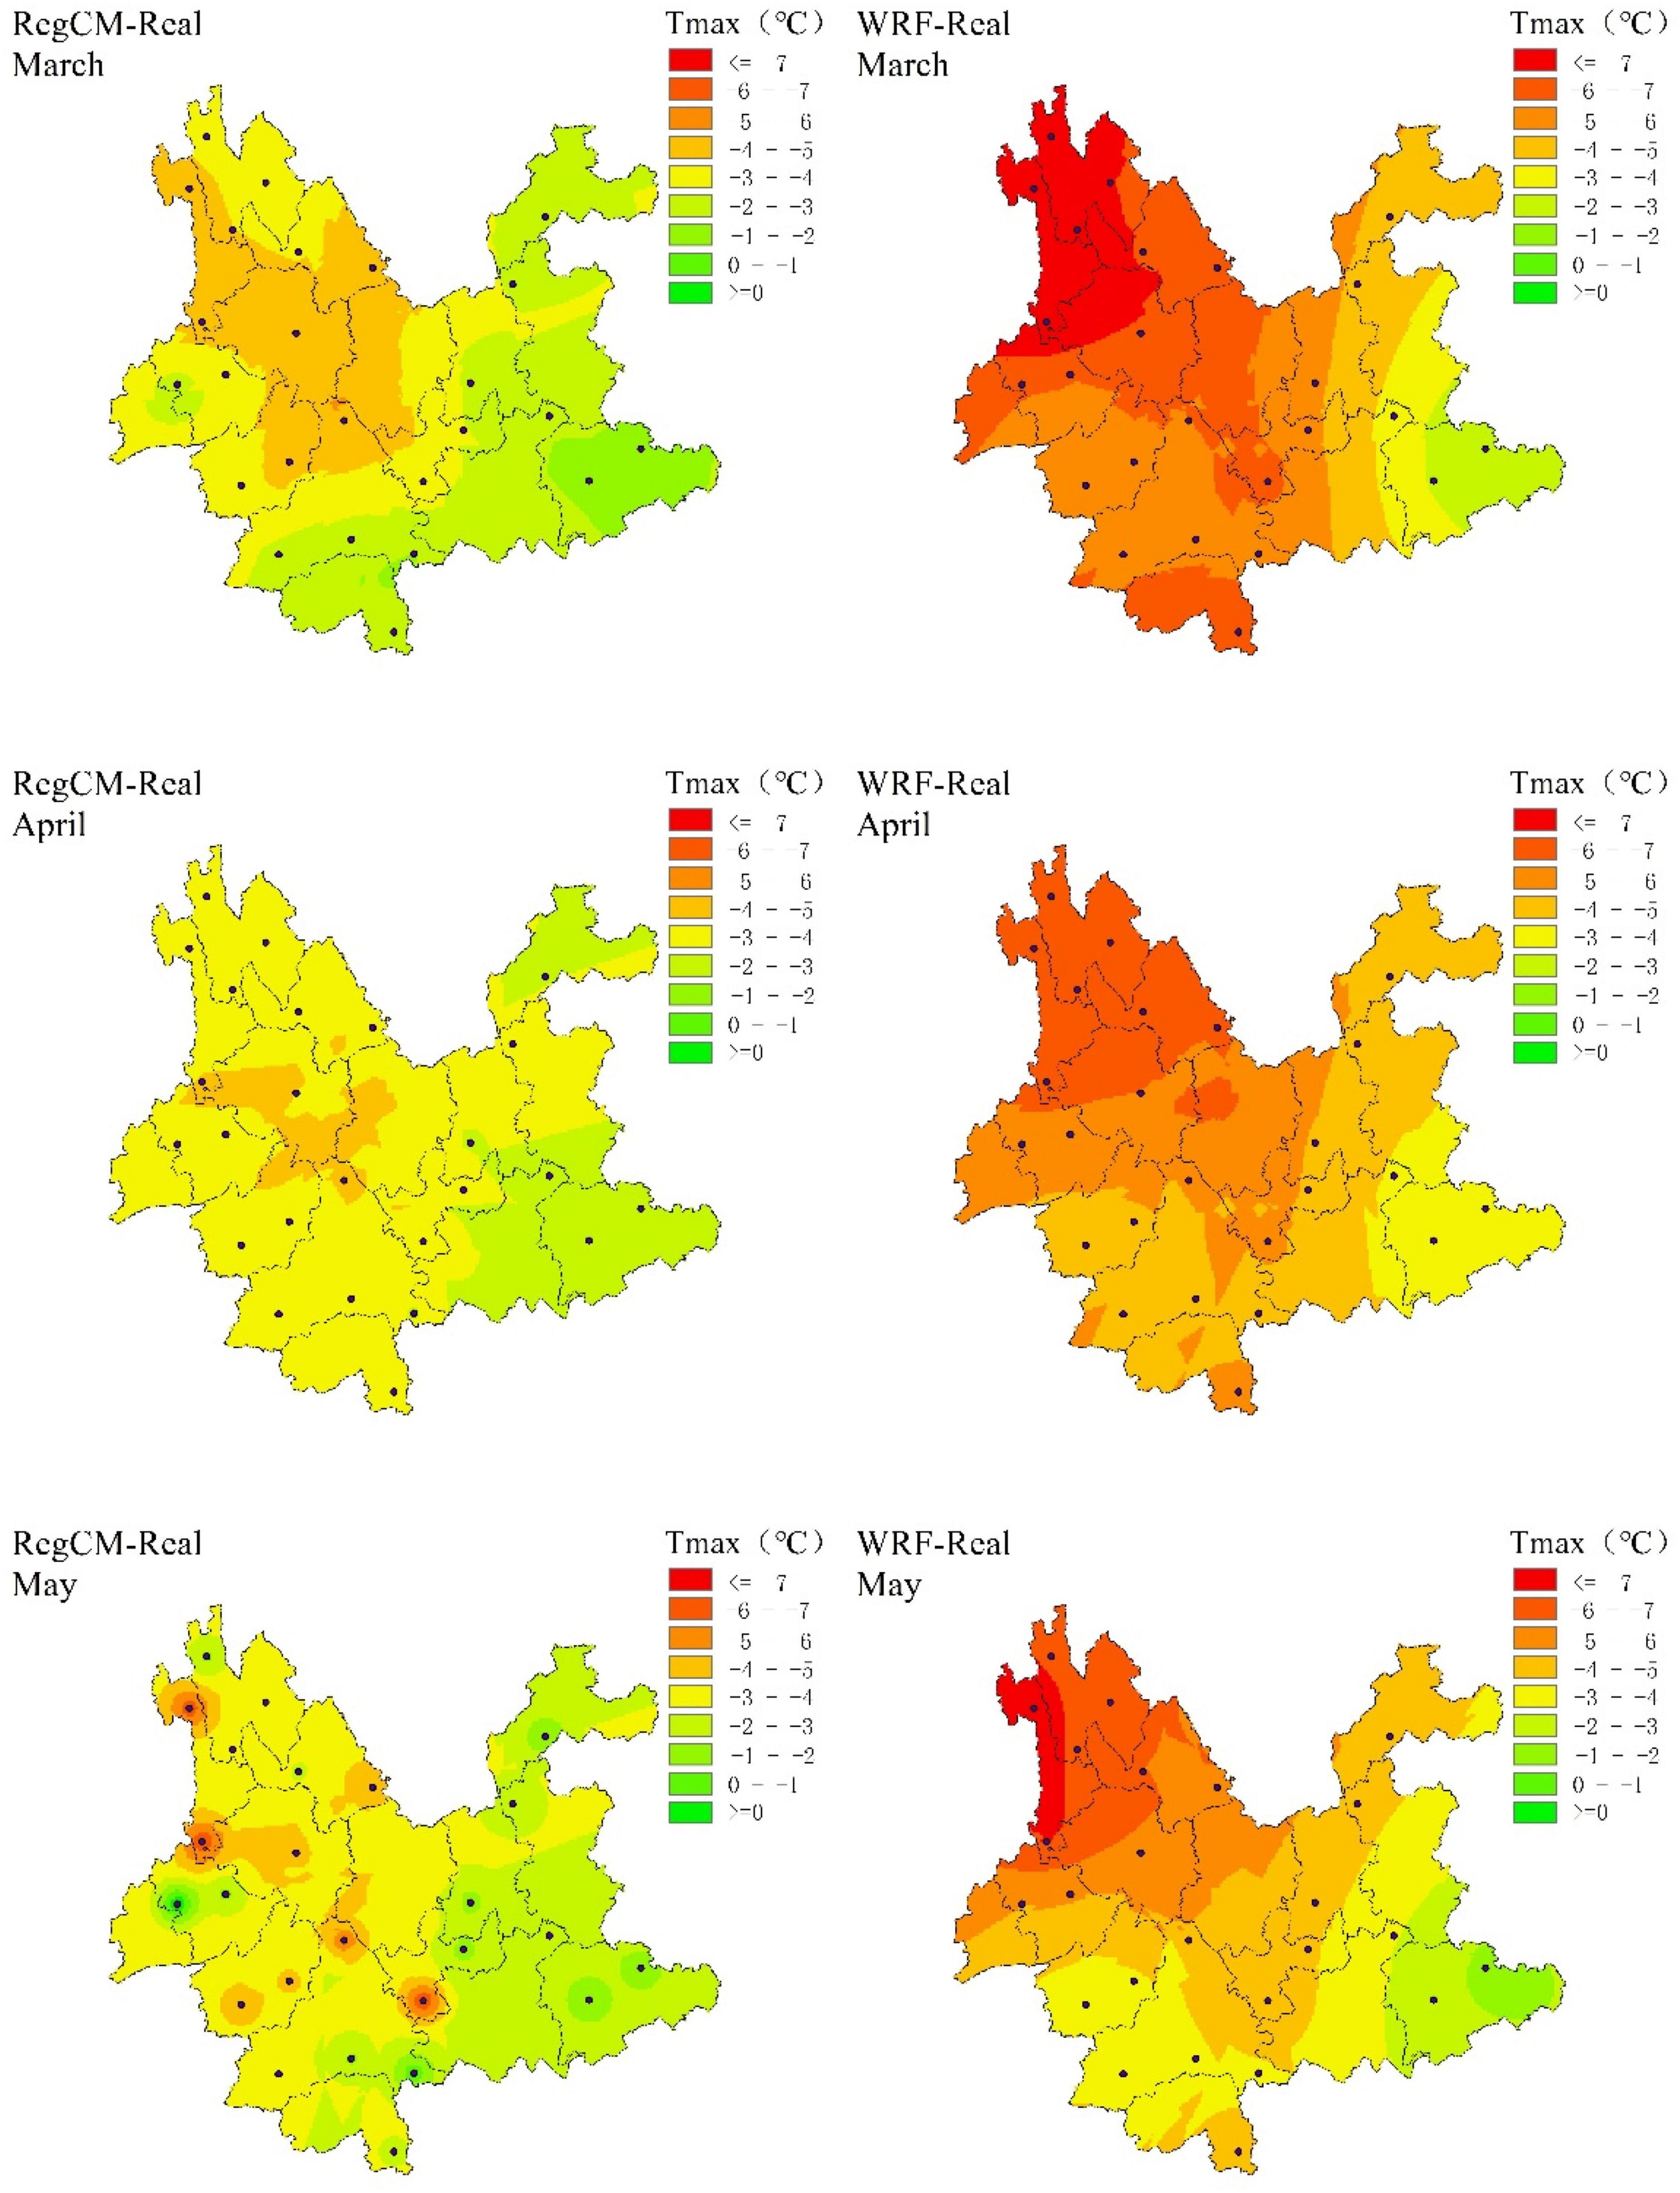
Figure 5. Spatial distribution of the difference in annual average monthly temperature during the high-fire-danger.
We also calculated 5 years average precipitation, annual average precipitation during the fire-danger period and annual average monthly precipitation during the high-fire-danger period using daily observational precipitation data from meteorological stations from 2004 to 2018 as real data. These results were then compared with the results of RegCM and WRF to evaluate the accuracy with which the two RCMs can predict daily total precipitation in the forest area of Yunnan.
To analyze the precipitation results of RegCM and WRF, we divided the period 2004–2018 into three 5 years periods and compared RegCM and WRF with the real annual average precipitation data in these three time periods, respectively. Figure 6 shows the spatial distribution of the difference in annual average precipitation for each 5 years period. The results of RegCM are close to the real precipitation, whereas the WRF results deviate by more than 9-fold. The spatial distribution of the RegCM results for the three periods accurately predicts the precipitation over the whole territory, with a deviation generally less than 3 mm. The WRF results deviate from the real precipitation by less than 3 mm only in southwest Yunnan. In other areas, the deviation exceeds 3 mm, especially in northwest Yunnan, where the deviation exceeds 7 mm.
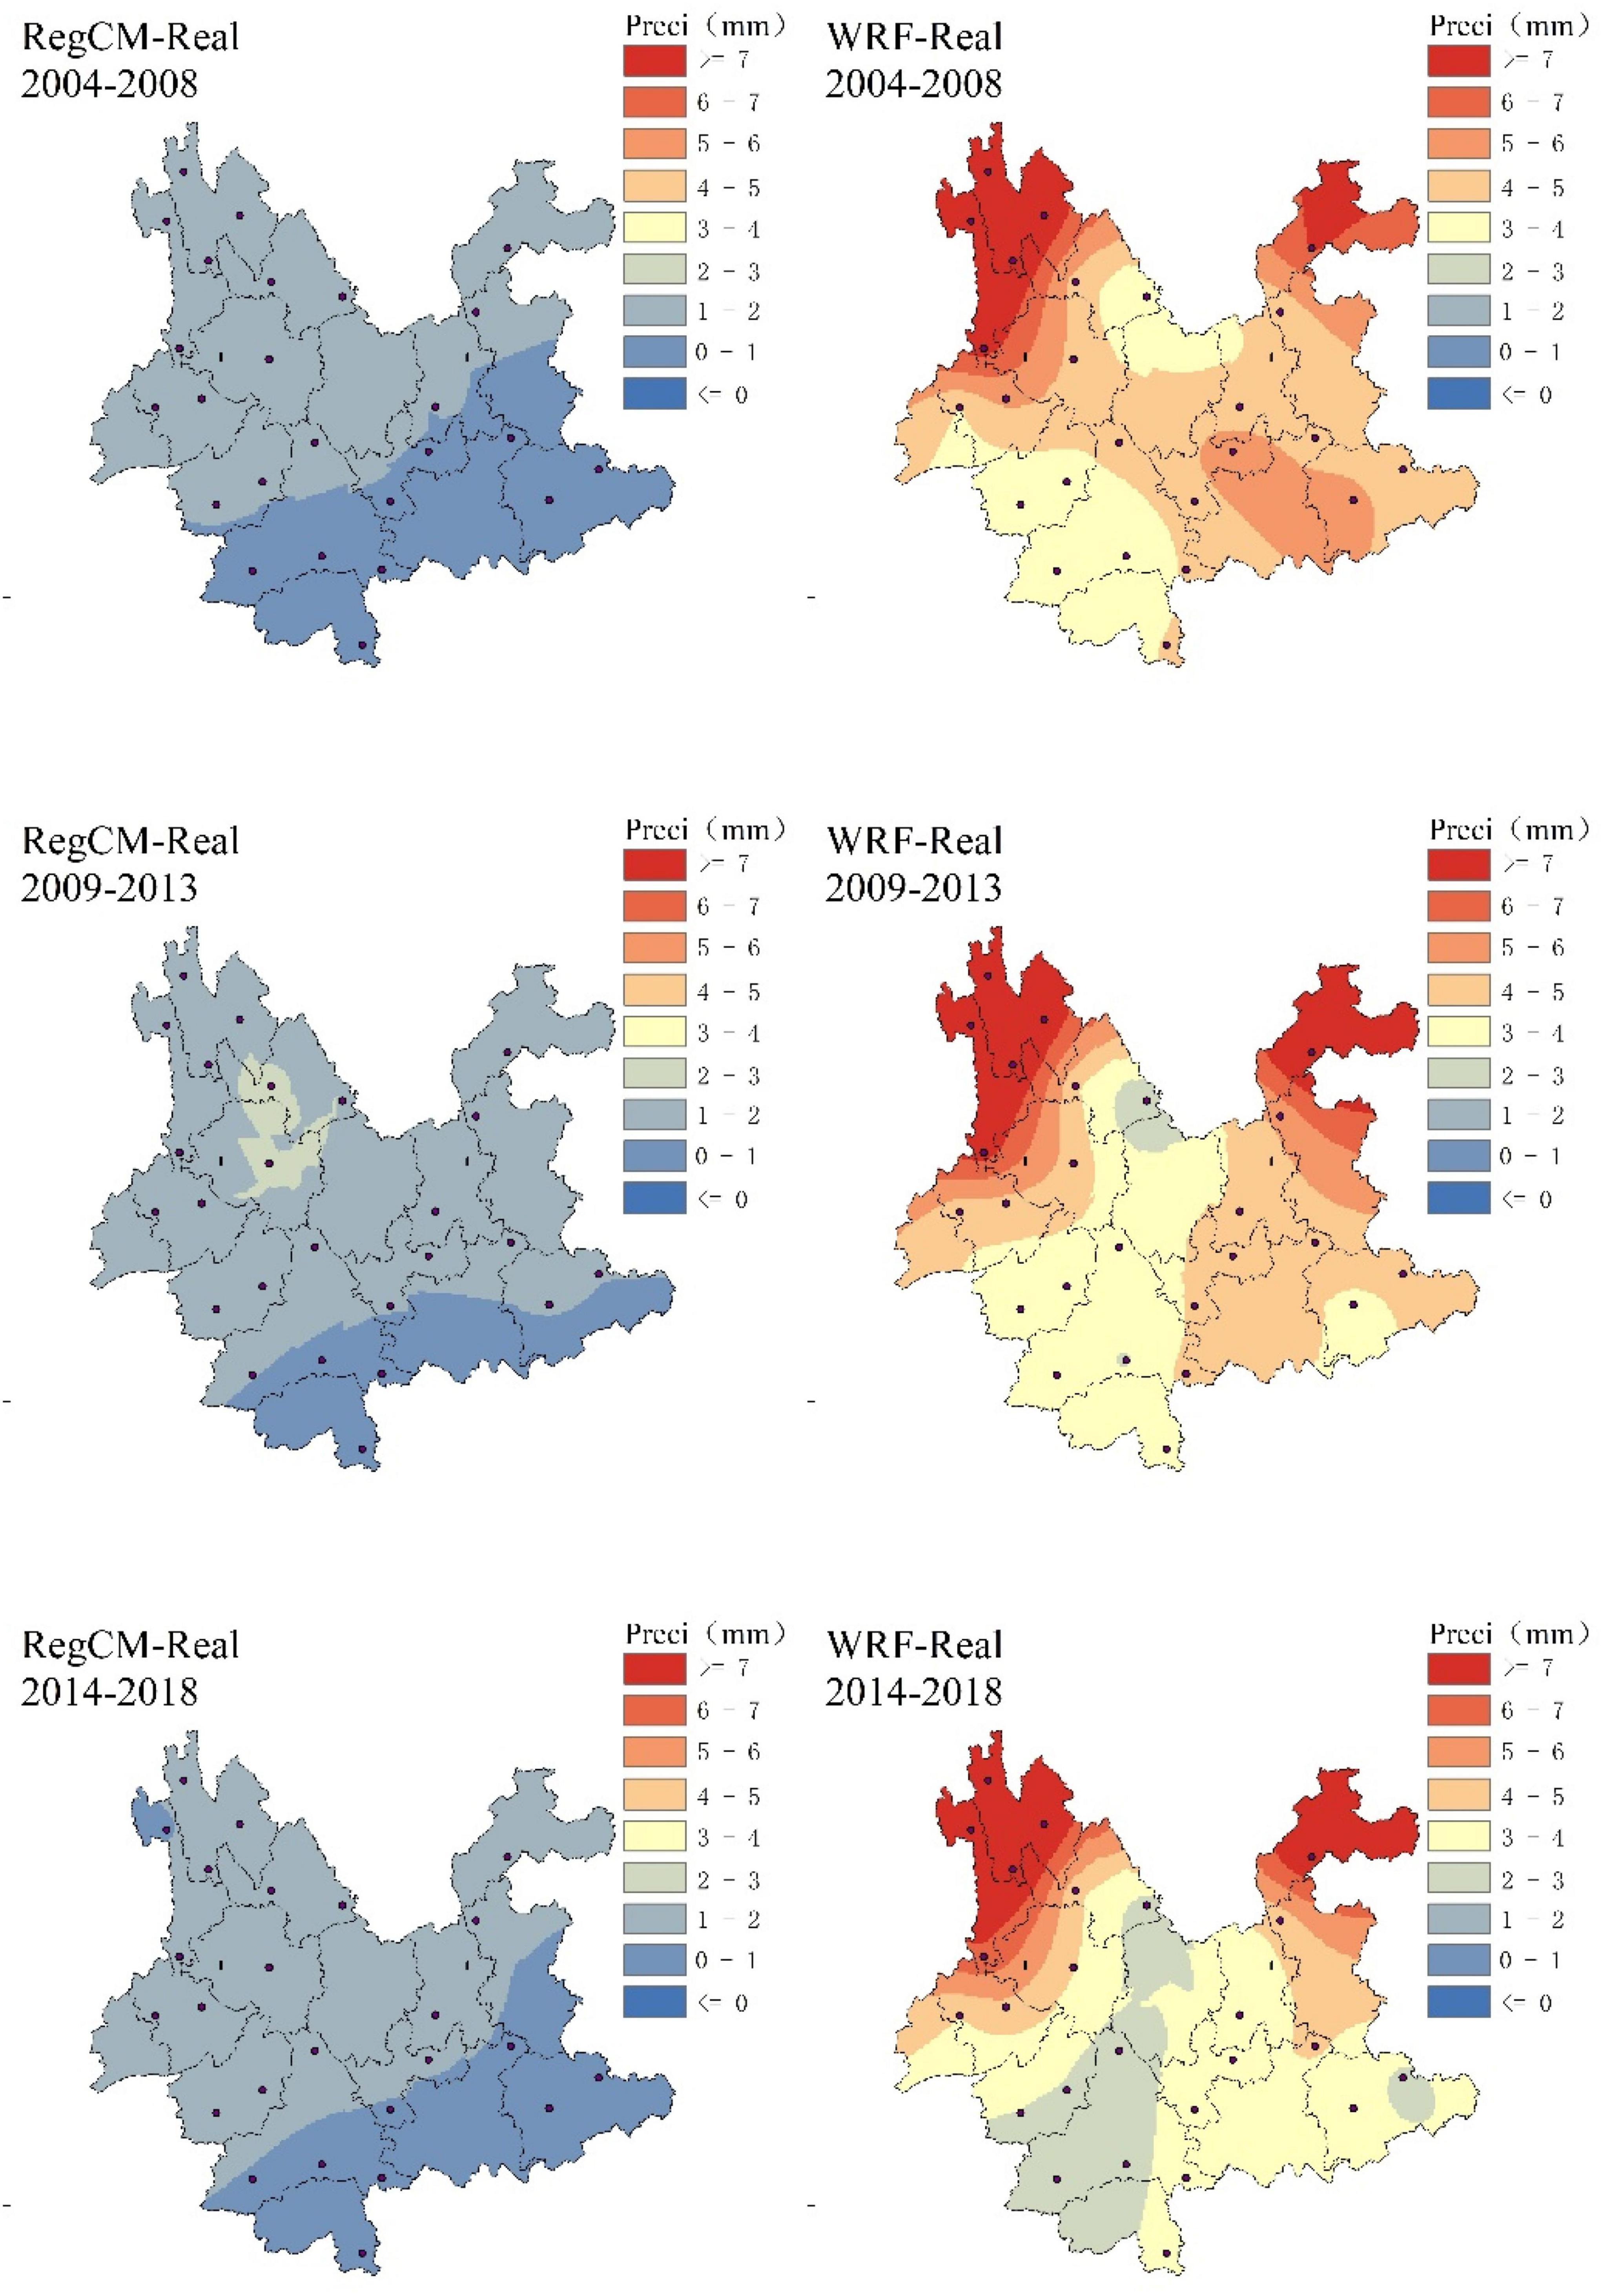
Figure 6. Spatial distribution of the difference in 5 years annual average precipitation.
We now analyze the simulation capability of RegCM and WRF during the fire-danger period. We first compare the daily simulated precipitation results from RegCM and WRF with the real results for the fire-danger period 2004–2018 (see Figure 7). Figure 7 shows the spatial distribution of the difference in annual average precipitation during the fire-danger period. The RegCM and WRF results are similar overall to the real results. The RegCM results are accurate over the entire region, with deviations of less than 3 mm. For the WRF results, the deviations exceed 14 mm over the entire region, with a maximum deviation of 20 mm.
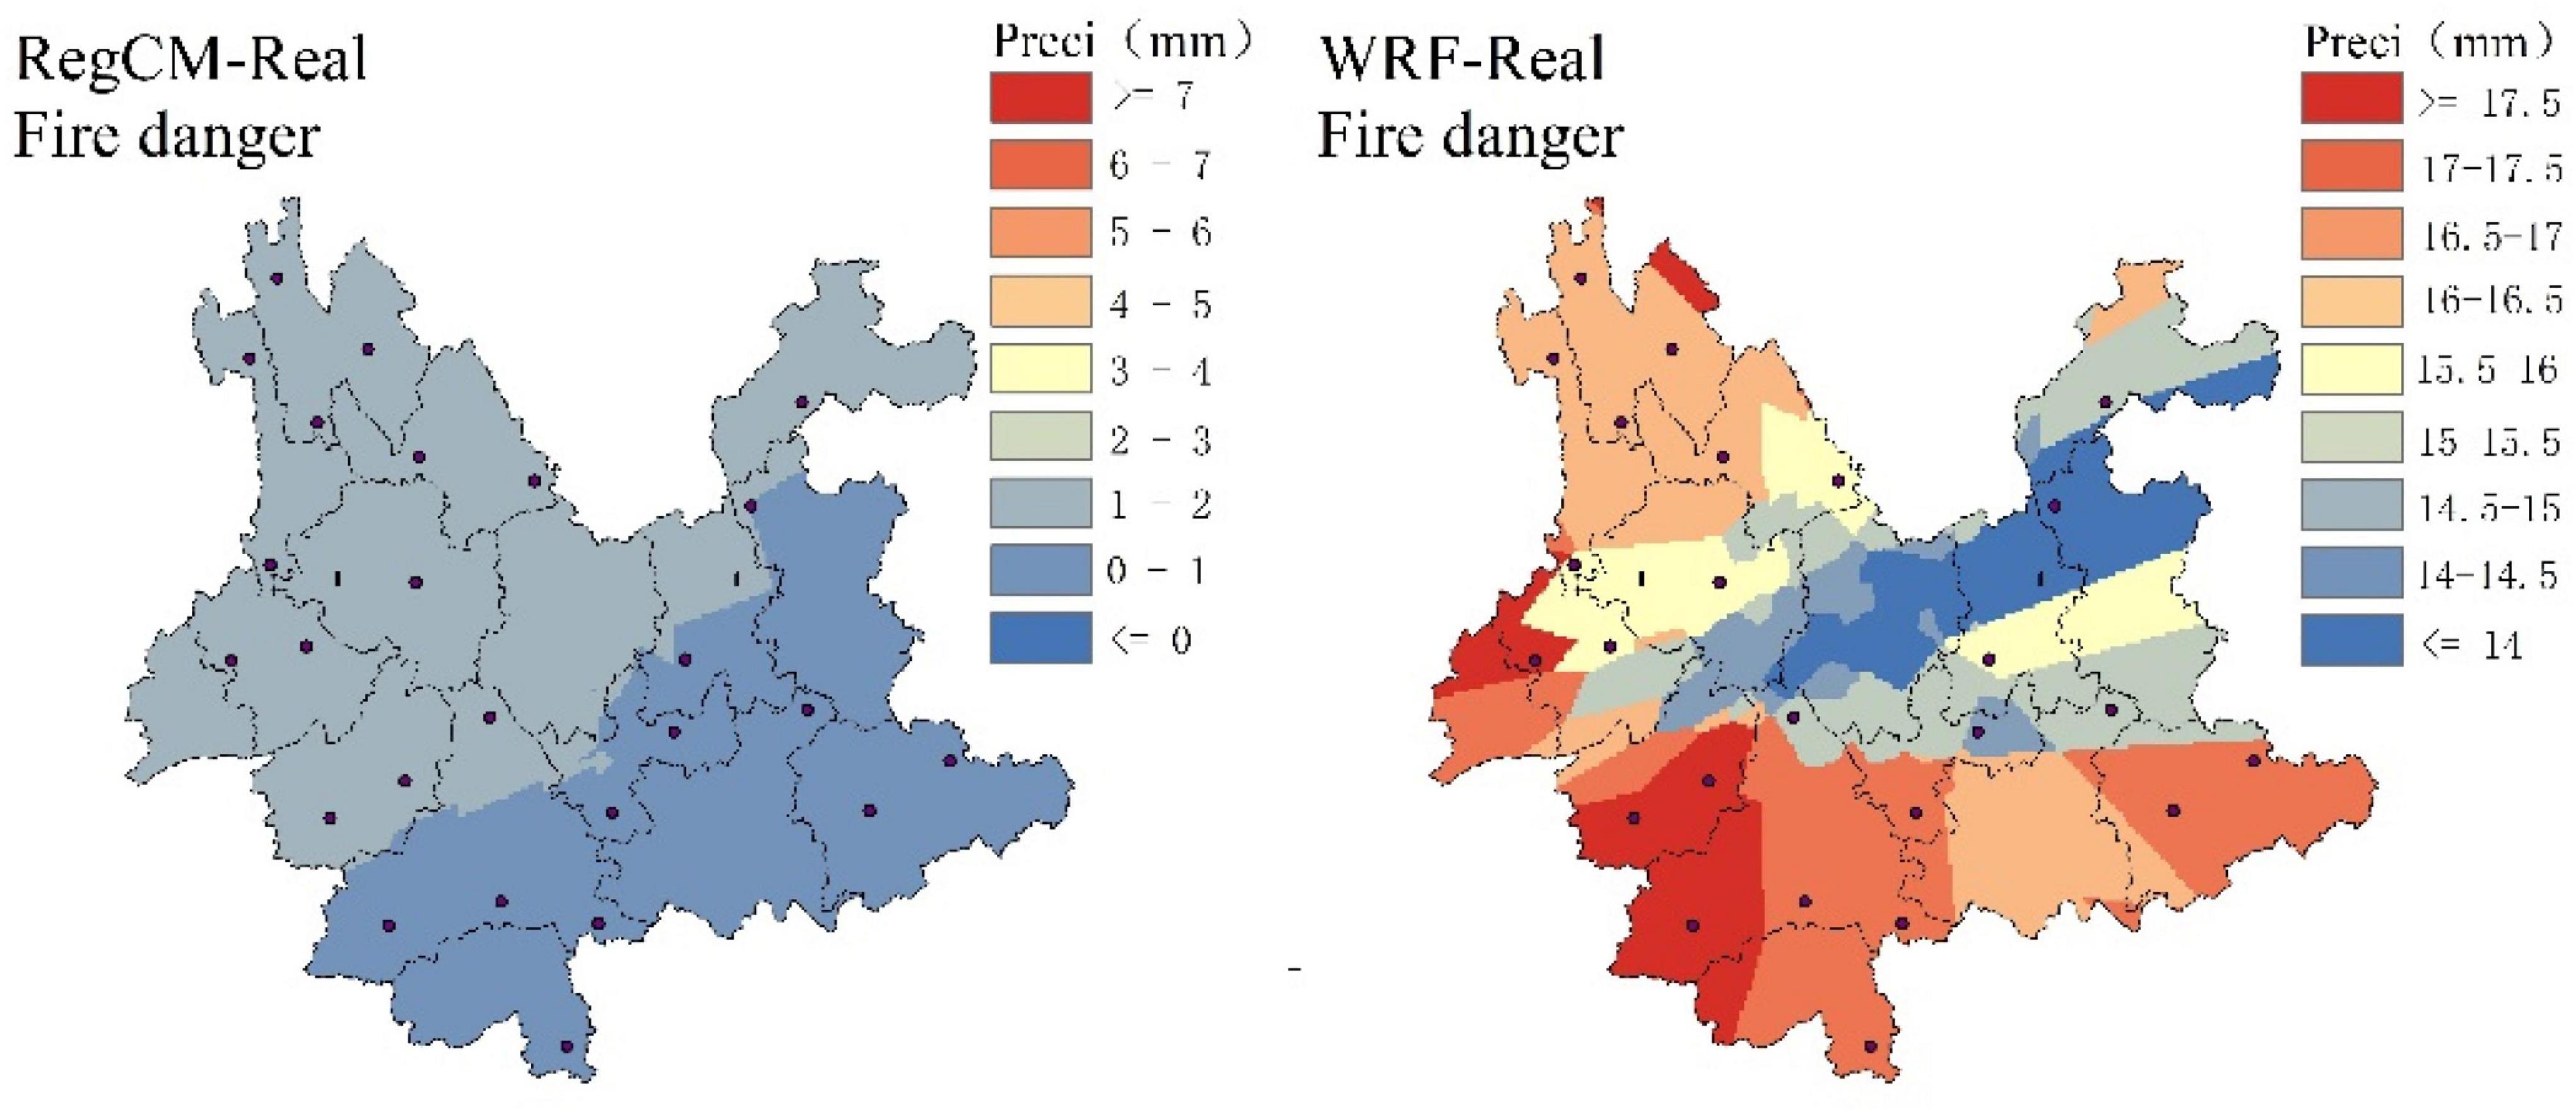
Figure 7. Spatial distribution of the difference in annual average precipitation during the-fire-danger.
We further analyze the simulation details of RegCM and WRF in the high-fire-danger periods by comparing the discrepancies for March, April, and May of each year. Figure 8 shows that the RegCM results deviate little from the real results, whereas the deviation of the WRF results from the real results is over tenfold greater. Figure 9 shows that the RegCM results are accurate over the entire region, whereas the WRF results are generally poor, with deviations of 4–20 mm in most areas.
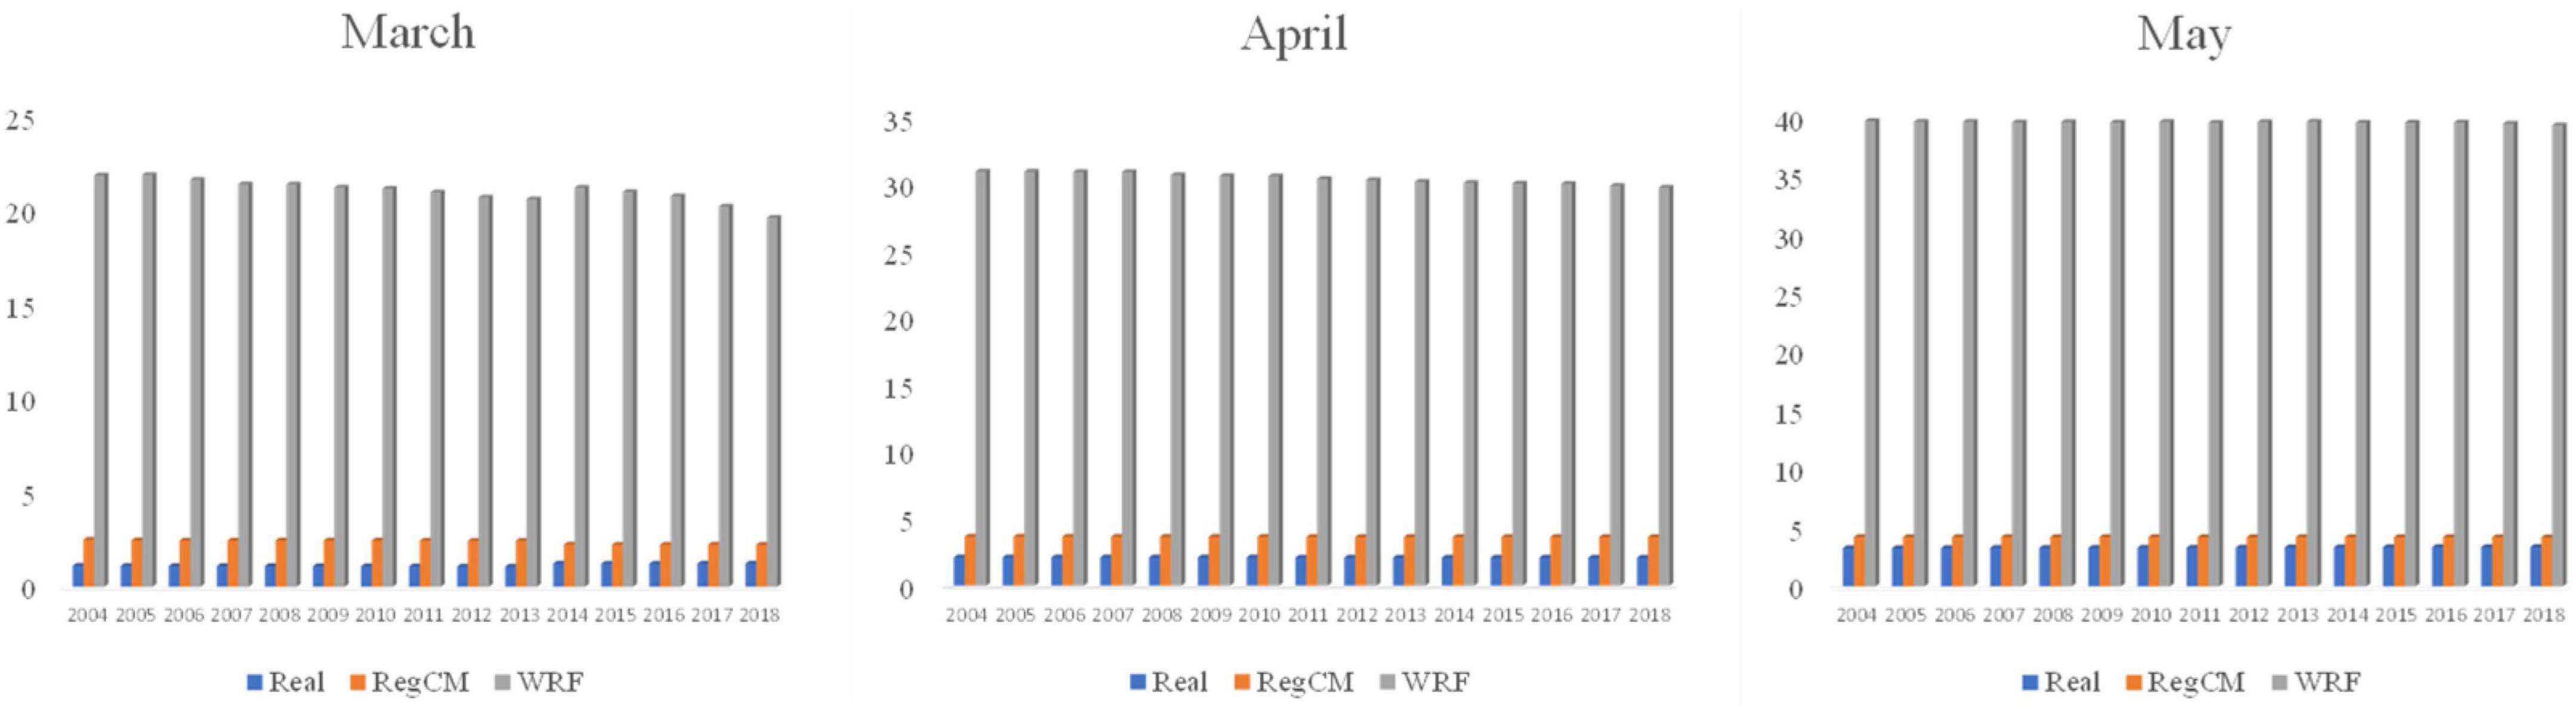
Figure 8. Distribution of annual average daily monthly precipitation during the high-fire danger (unit: mm).
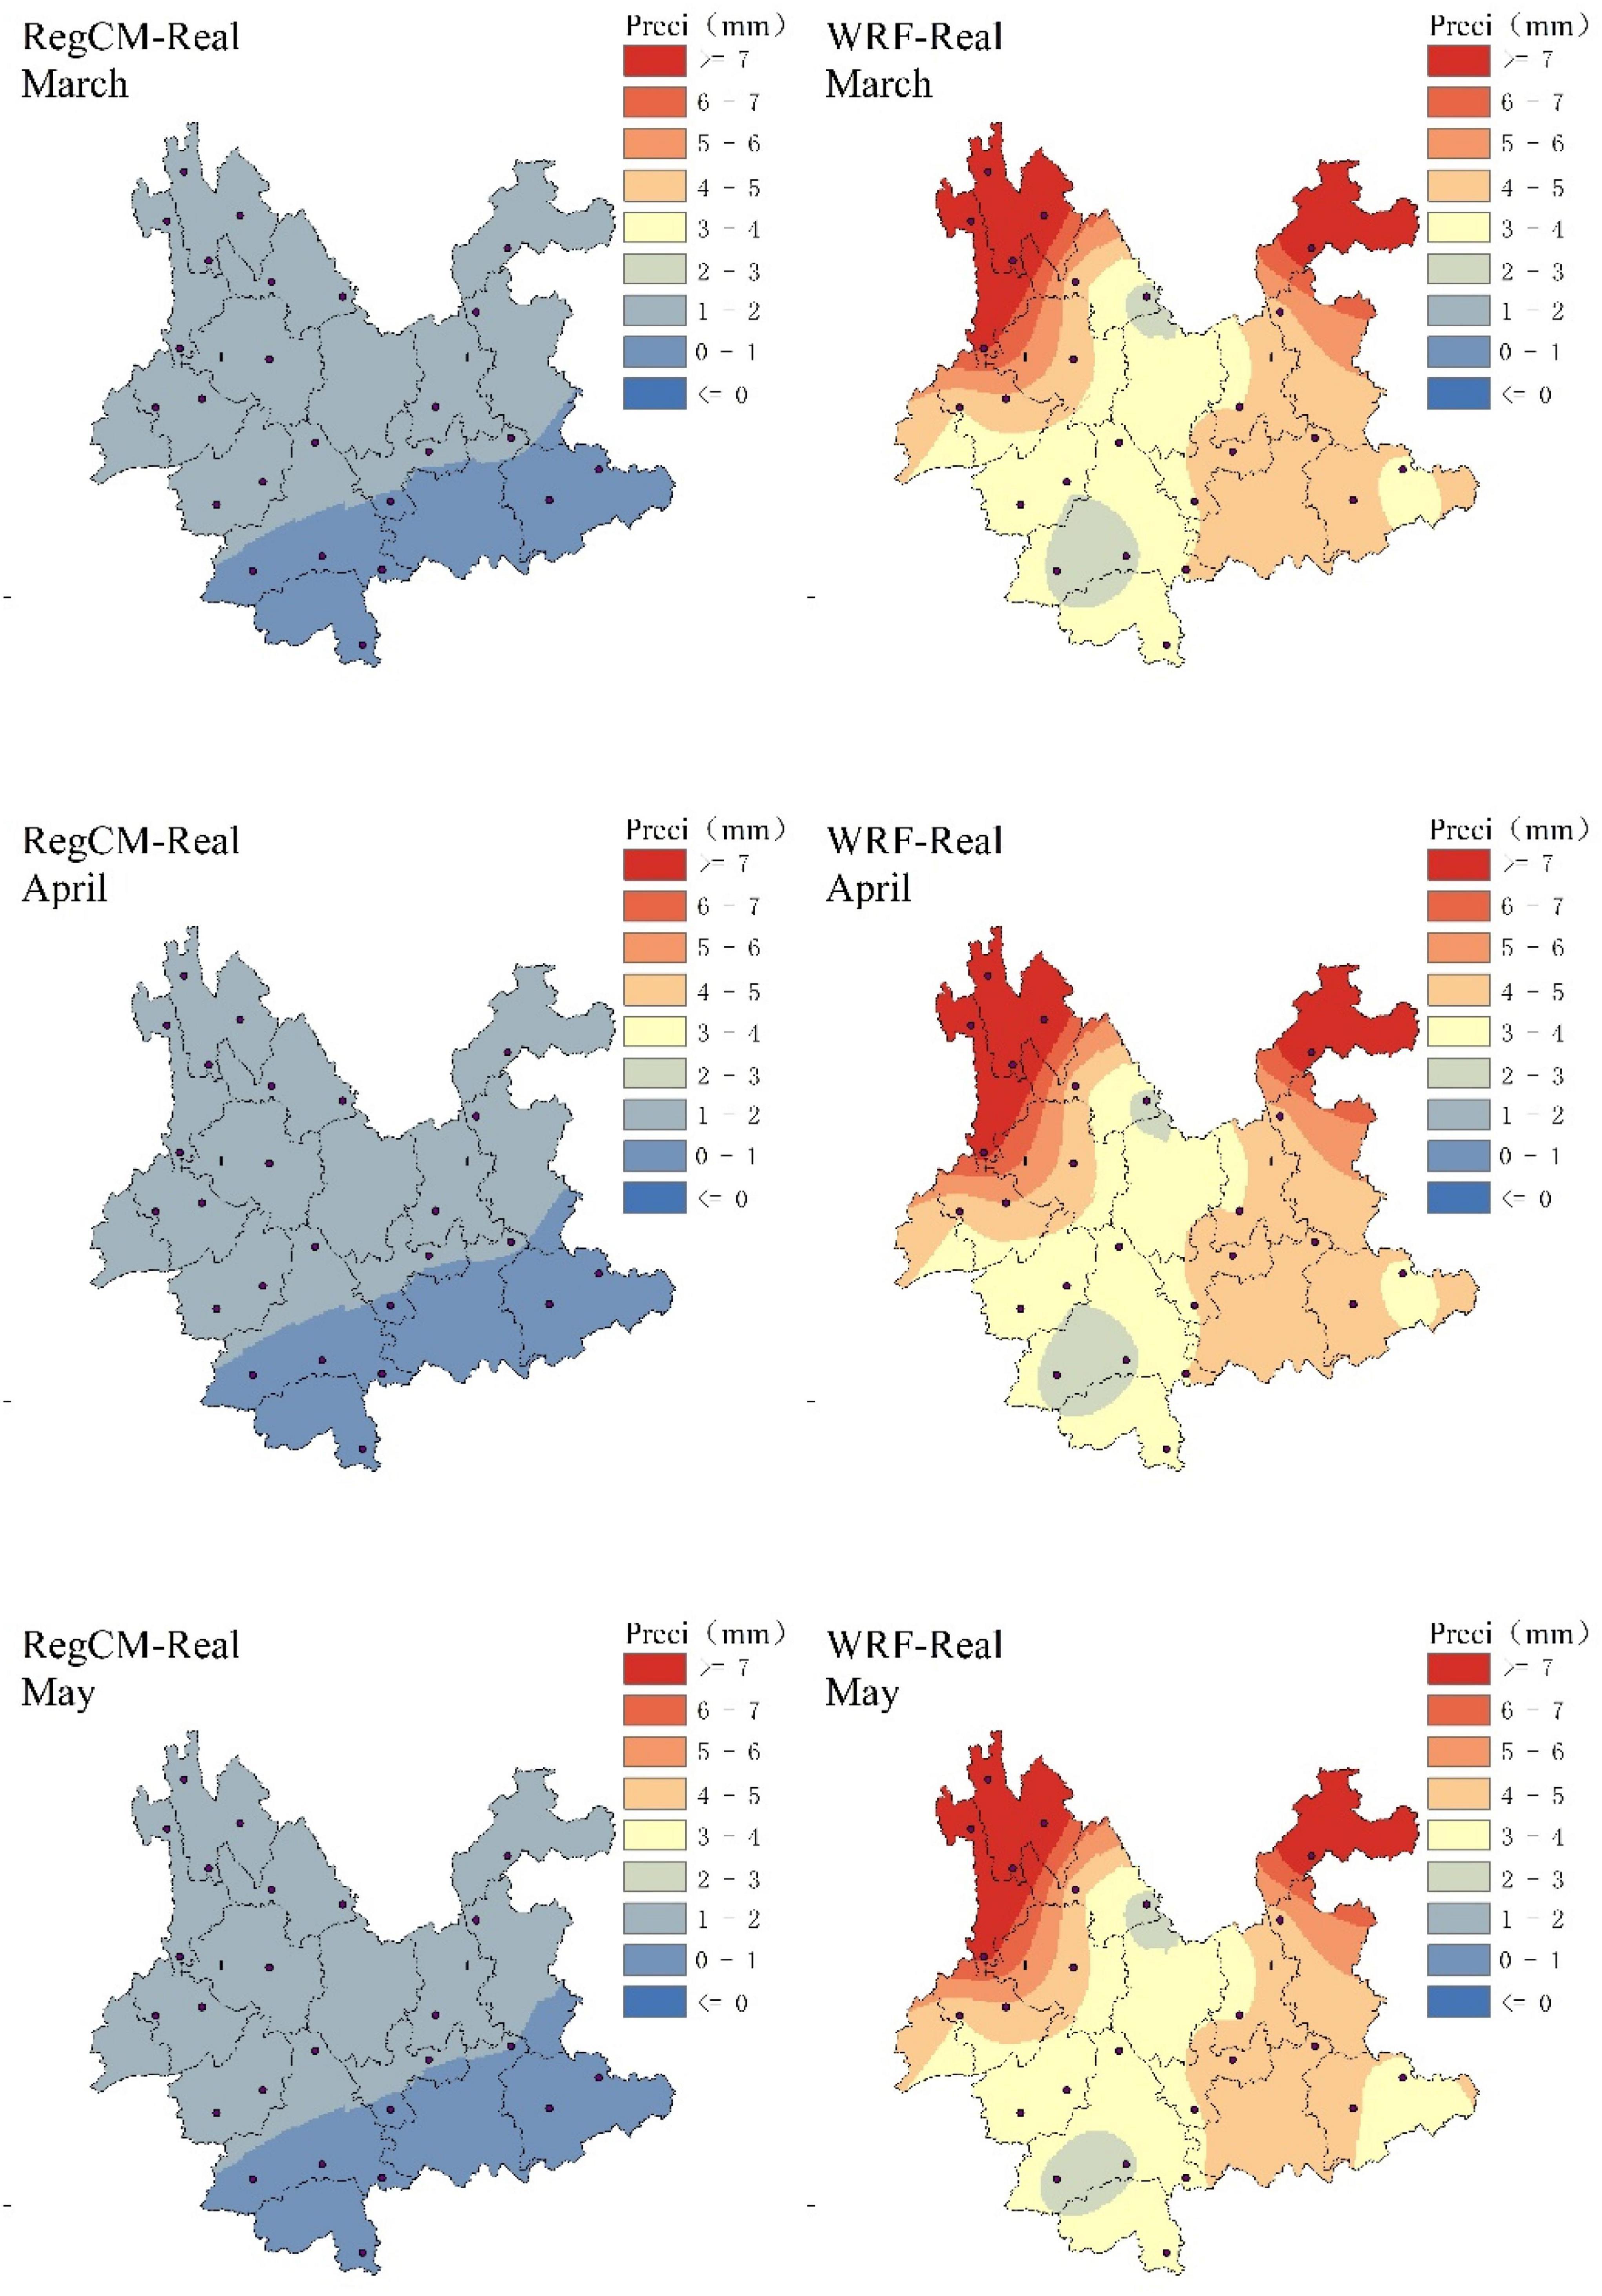
Figure 9. Spatial distribution of the difference in annual average monthly precipitation during the high-fire-danger.
We now statistically compare the RegCM and WRF results with the real temperature results with the help of Taylor plots and the statistical indicators RMSE, correlation coefficient R, confidence p, and standard deviation (STD). Recall that the more the RMSE or STD approaches zero or the more R approaches 1, the better the result, and a correlation is significant when p < 0.01. Table 2 shows the statistical indicators. For the temperature, the RMSE for RegCM is less than that of WRF. The coefficient R is closer to unity for RegCM than WRF, and p < 0.01 for both RegCM and WRF, suggesting that both RegCM and WRF correlate significantly with the real temperature in each dimension, although RegCM is more strongly correlated.
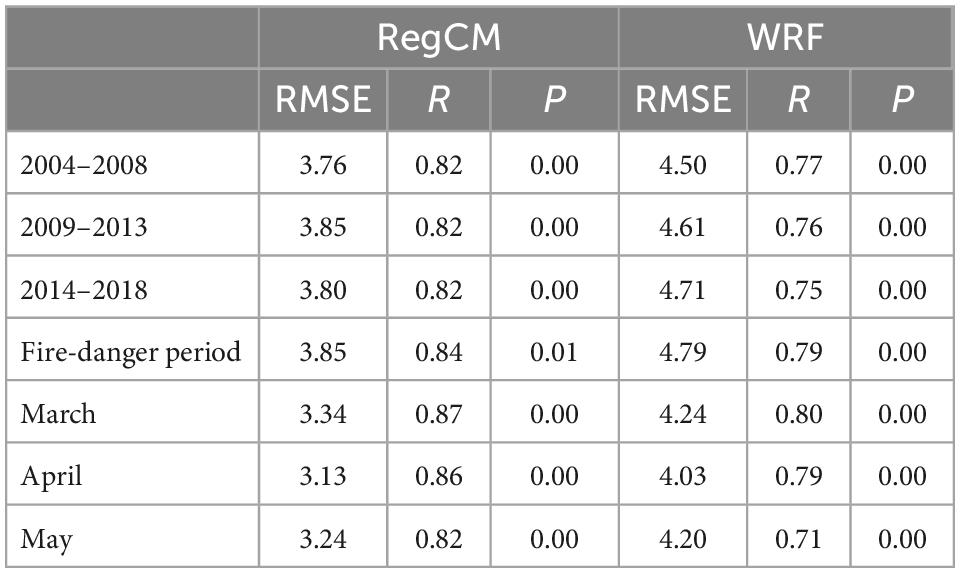
Table 2. Statistical indicators of temperature.
For the datum point of the Taylor chart, RMSE = 0, R = 1, and STD = 0. For a Taylor chart, the closer the prediction point is to the reference point, the better the simulation is. Based on the data given in Table 2, RMSE, R, and STD may be integrated into an extreme value graph to obtain the temperature Taylor graph (Figure 10). In all dimensions in the Taylor diagram, the RegCM result is closer to the datum point than WRF. A temperature Taylor diagram is obtained by integrating RMSE, R, and STD over an extreme value coordinate diagram (Figure 10). In each dimension, the RegCM result is closer to the reference point of the Taylor diagram than the WRF result.
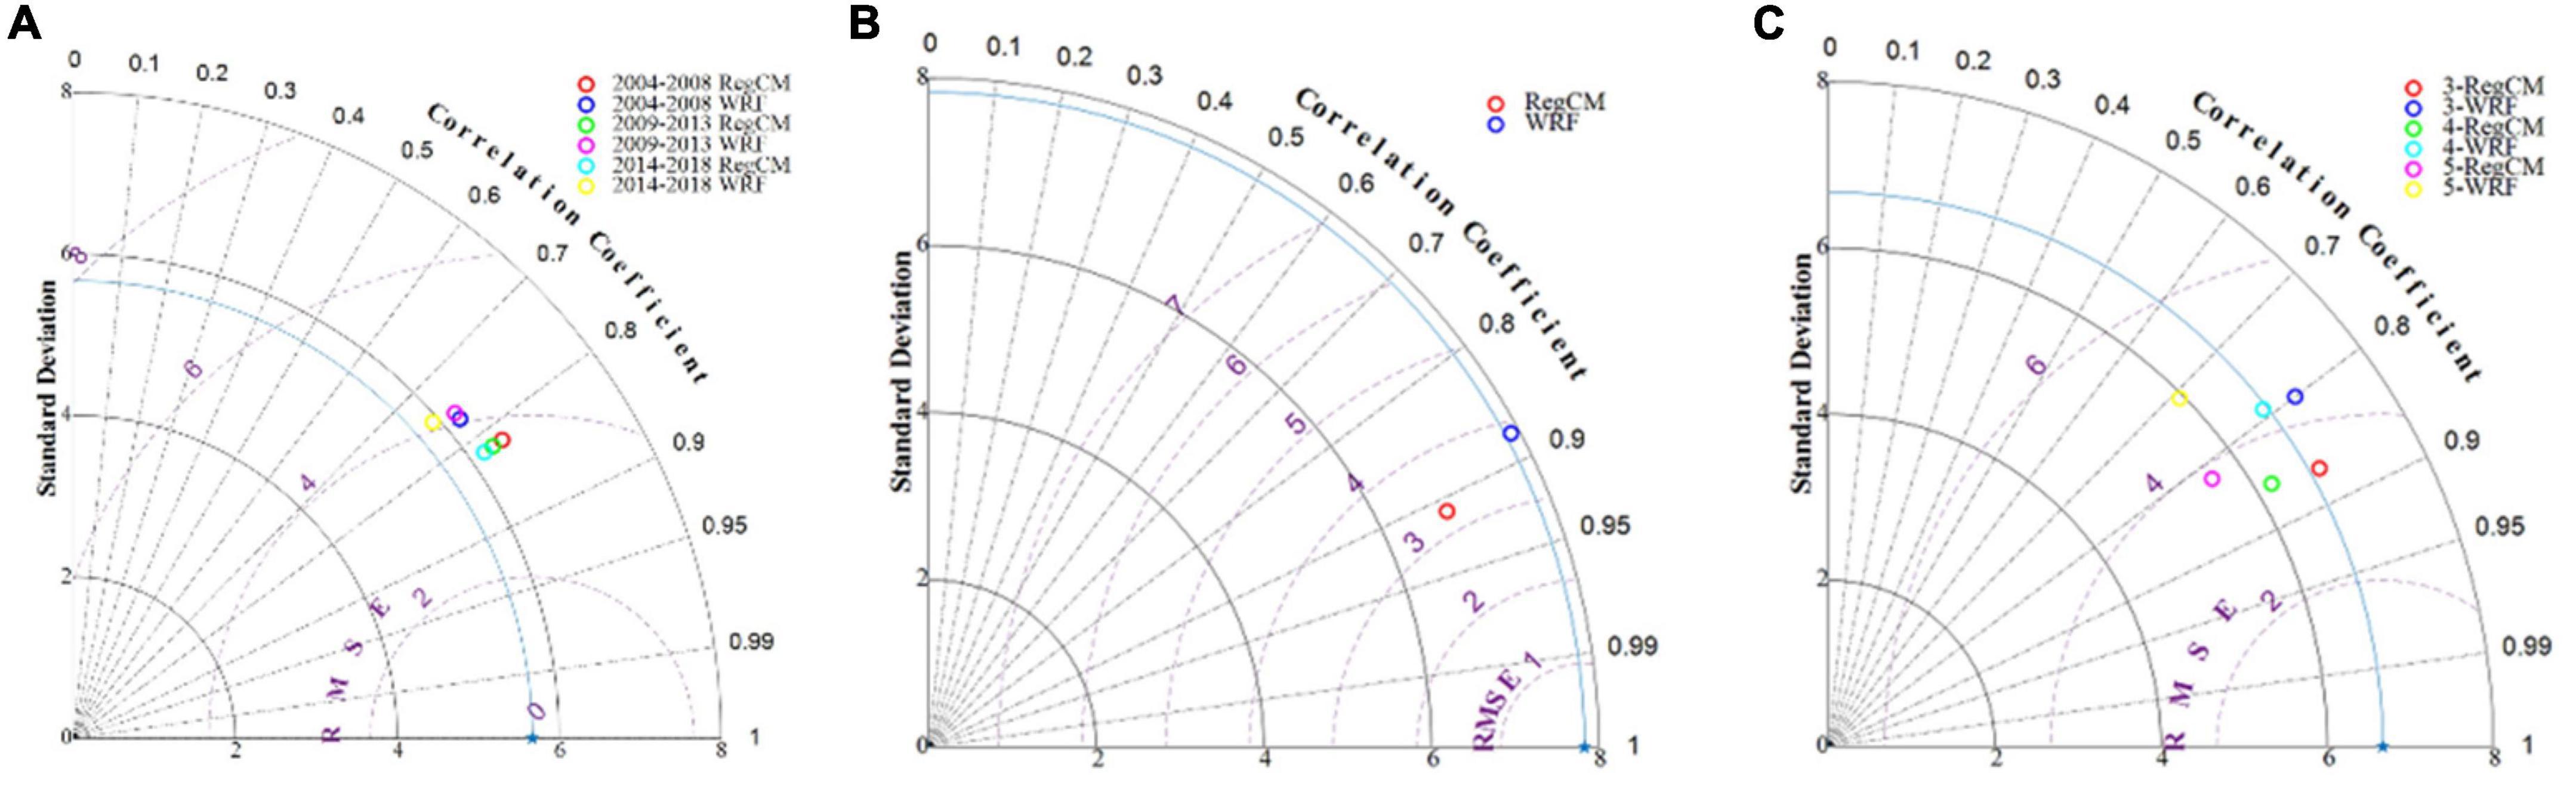
Figure 10. Temperature Taylor diagram. (A) Temperature Taylor diagram every 5 years; (B) Temperature Taylor diagram during the fire-danger period; (C) Temperature Taylor diagram monthly during the high-fire-danger period.
We also statistically compare the RegCM and WRF results with the real precipitation results. As shown in Table 3, the RMSE of the RegCM results is less than that of the WR, the coefficient R of the RegCM results is greater than that of the WRF results, and both RegCM and WRF have p < 0.01, suggesting that both RCMs correlate significantly with the real precipitation in all dimensions. Although the RegCM results correlate more strongly with the real precipitation than the WRF results, R < 0.5 indicates that neither RCM follows the real precipitation. According to the Taylor diagram for precipitation (Figure 11), the RegCM point in each dimension is closer to the reference point than the WRF point.
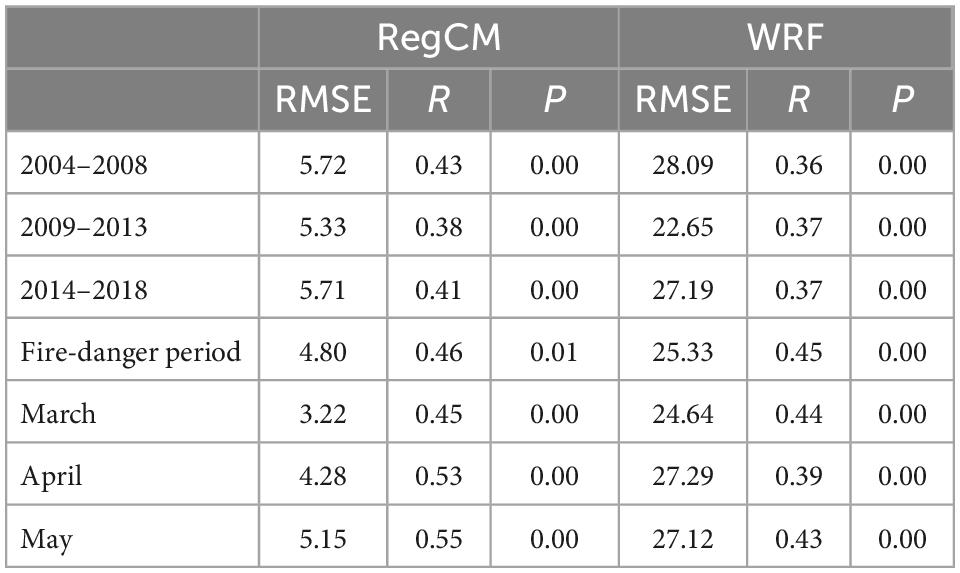
Table 3. Statistical indicators of precipitation.
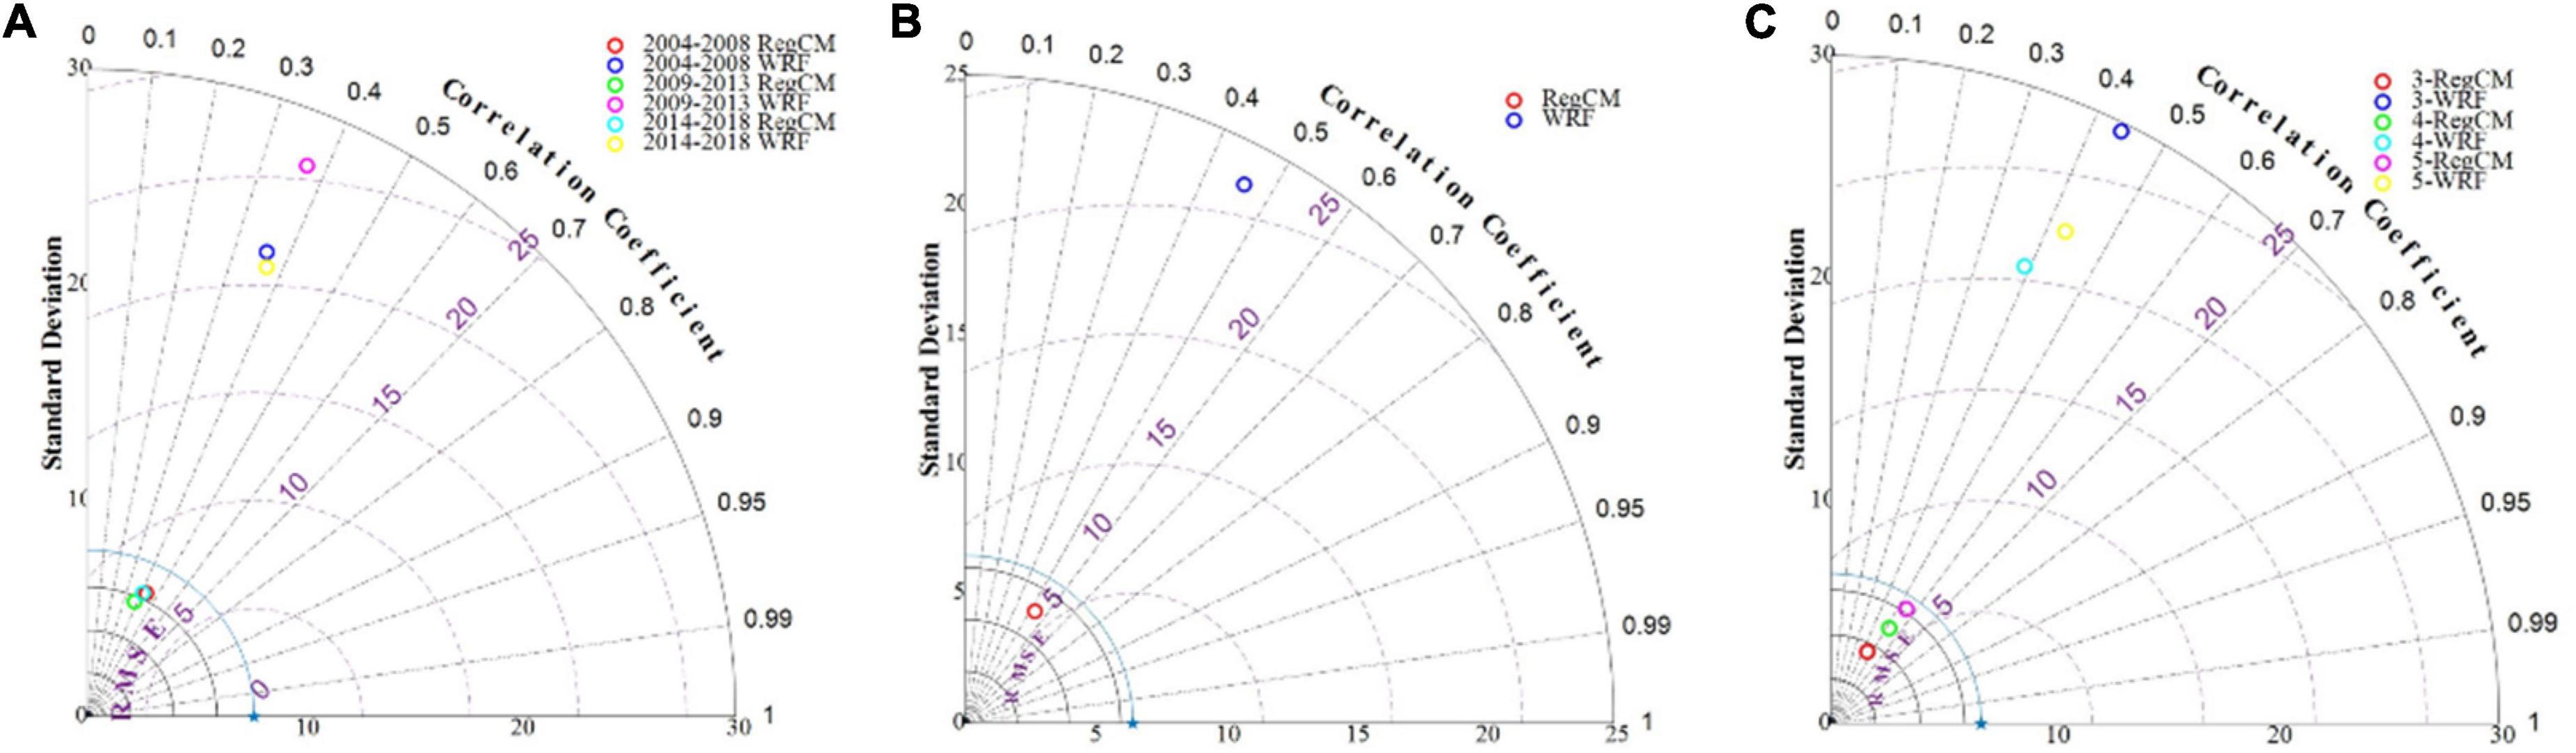
Figure 11. Precipitation Taylor diagram. (A) Precipitation Taylor diagram every 5 years; (B) Precipitation Taylor diagram during the fire-danger period; (C) Precipitation Taylor diagram monthly during the high-fire-danger period.
Regional climate forecast model produces more accurate temperature and precipitation predictions over the entire region than WRF. For temperature, the RegCM results deviate only slightly from the real temperature in most areas except northwest Yunnan, and the deviation decreases during the high-fire-danger period, especially in May. For precipitation, although the RegCM results do not match the real precipitation, the predicted mean precipitation is acceptable in all time periods and over the entire region, which meets the needs of forest- fire forecasting.
The results also clearly show the correlation between RegCM simulated temperature and precipitation, which is mainly attributed to the land surface model (Lynch et al., 1997), the physical parameterization (Lorant et al., 2006), the choice of simulated terrain (Letcher and Minder, 2015), and the choice of the global climate model or reanalysis data (Rummukainen et al., 2001; Landgren et al., 2014). This difficulty can be alleviated by using convective allowable scale regional climate modeling (Stratton et al., 2018), boundary downscaling (Adachi and Tomita, 2020), RCM coupling (Wang et al., 2016), and multi-RCM ensemble averaging (Sørland et al., 2021).
Forest fire dynamics are an important tool for forecasting medium and long-term forest fire danger, and the accuracy of the research results is directly related to the policy designation and effectiveness of local forest management. Based on the results of this study, the direct use of classical RCM still does not fully satisfy the requirements of accurate prediction of forest fire dynamics due to the specificity of terrain and climate. Therefore, only research and construction of RCMs based on the feature data of the study area can meet the requirements. The general steps for developing a suitable RCM are (1) to build an integrated physical model by solving the mathematical equations of a three-dimensional network; (2) add the high-resolution information obtained from the integrated physical model to the GCM to reduce the scale of the coarser horizontal resolution of the GCM; (3) set the boundary conditions based on the interaction between the representative climate system components and their feedback; and, finally, (4) generate comprehensive output for the domain of interest.
The original contributions presented in this study are included in the article/supplementary material, further inquiries can be directed to the corresponding authors.
XD, ZZha, and FZ: conceptualization and writing—reviewing and editing. FZ: funding acquisition. XD, ZZhu, and QW: field investigation, experiment, and data analysis. All authors read and agreed to the published version of the manuscript.
This study was financially supported by the National Natural Science Foundation of China (Grant Nos. 32160374 and 31860234), Yunnan Fundamental Research Projects, China (Grant No. 202101AT070045), and the Foundation of Key Laboratory of State Forestry and Grassland Administration on Forestry Ecological Big Data, Southwest Forestry University (Grant No. 2022-BDG-01).
The authors declare that the research was conducted in the absence of any commercial or financial relationships that could be construed as a potential conflict of interest.
All claims expressed in this article are solely those of the authors and do not necessarily represent those of their affiliated organizations, or those of the publisher, the editors and the reviewers. Any product that may be evaluated in this article, or claim that may be made by its manufacturer, is not guaranteed or endorsed by the publisher.
Adachi, S. A., and Tomita, H. (2020). Methodology of the constraint condition in dynamical downscaling for regional climate evaluation: A review. J. Geophys. Res. Atmos. 125:e2019JD032166. doi: 10.1029/2019JD032166
Ban, N., Caillaud, C., Coppola, E., Pichelli, E., Sobolowski, S., Adinolfi, M., et al. (2021). The first multi-model ensemble of regional climate simulations at kilometer-scale resolution, part I: Evaluation of precipitation. Clim. Dyn. 57, 275–302. doi: 10.1007/s00382-021-05708-w
Boer, G. J., Smith, D. M., Cassou, C., Doblas-Reyes, F., Danabasoglu, G., Kirtman, B., et al. (2016). The decadal climate prediction project (DCPP) contribution to CMIP6. Geosci. Model Dev. 9, 3751–3777. doi: 10.5194/gmd-9-3751-2016
Centella-Artola, A., Taylor, M. A., Bezanilla-Morlot, A., Martinez-Castro, D., Campbell, J. D., Stephenson, T. S., et al. (2015). Assessing the effect of domain size over the Caribbean region using the PRECIS regional climate model. Clim. Dyn. 44, 1901–1918. doi: 10.1007/s00382-014-2272-8
Chen, L., Ma, Z., Li, Z., Wu, L., Flemke, J., and Li, Y. (2018). Dynamical downscaling of temperature and precipitation extremes in China under current and future climates. Atmos. Ocean 56, 55–70. doi: 10.1080/07055900.2017.1422691
Da Silva, F. N., Alves, J. L., and Cataldi, M. (2019). Climate downscaling over South America for 1971–2000: Application in SMAP rainfall-runoff model for Grande River Basin. Clim. Dyn. 52, 681–696. doi: 10.1007/s00382-018-4166-7
Deser, C., Knutti, R., Solomon, S., and Phillips, A. (2012). Communication of the role of natural variability in future North American climate. Nat. Clim. Change 2, 775–779. doi: 10.1038/nclimate1562
Dong, S., and Shi, Y. (2022). Impact of the dynamic vegetation on climate extremes during the wheat growing period over China. Sci. The Total Environ. 819:153079. doi: 10.1016/j.scitotenv.2022.153079
Dorn, W., Rinke, A., Köberle, C., Dethloff, K., and Gerdes, R. (2018). HIRHAM–NAOSIM 2.0: The upgraded version of the coupled regional atmosphere-ocean-sea ice model for Arctic climate studies. Geosci. Model Dev. Discuss. 278, 1–30. doi: 10.5194/gmd-2018-278
Dupuy, J., Fargeon, H., Martin-StPaul, N., Pimont, F., Ruffault, J., Guijarro, M., et al. (2020). Climate change impact on future wildfire danger and activity in southern Europe: A review. Ann. Forest Sci. 77, 1–24. doi: 10.1007/s13595-020-00933-5
Entao, Y. (2019). A warmer, wetter and less windy China in the Twenty-First century as projected by a nested high-resolution simulation using the Weather Research and Forecasting (WRF) model. Asia Pac. J. Atmos. Sci. 55, 53–74. doi: 10.1007/s13143-018-0072-5
Feldmann, H., Schädler, G., and Panitz, H. J. (2009). “Changes in precipitation patterns derived from an ensemble of high resolution RCM simulations,” in Proceddings of the EGU General Assembly Conference Abstracts, (Göttingen: EGU General Assembly), 10002.
Gao, J., Xue, Y., and Wu, S. (2013). Potential impacts on regional climate due to land degradation in the Guizhou Karst Plateau of China. Environ. Res. Lett. 8:044037. doi: 10.1088/1748-9326/8/4/044037
Gao, S. (2020). Dynamical downscaling of surface air temperature and precipitation using RegCM4 and WRF over China. Clim. Dyn. 55, 1283–1302. doi: 10.1007/s00382-020-05326-y
Garrido, J. L., González-Rouco, J. F., Vivanco, M. G., and Navarro, J. (2020). Regional surface temperature simulations over the Iberian Peninsula: Evaluation and climate projections. Clim. Dyn. 55, 3445–3468. doi: 10.1007/s00382-020-05456-3
Giorgi, F. (2019). Thirty years of regional climate modeling: Where are we and where are we going next? J. Geophys. Res. Atmos. 124, 5696–5723. doi: 10.1029/2018JD030094
Giorgi, F., and Bates, G. T. (1989). The climatological skill of a regional model over complex terrain. Monthly Weather Rev. 117, 2325–2347. doi: 10.1175/1520-0493(1989)117<2325:TCSOAR>2.0.CO;2
Giorgi, F., and Gutowski, W. J. Jr. (2015). Regional dynamical downscaling and the CORDEX initiative. Ann. Rev. Environ. Resour. 40, 467–490. doi: 10.1146/annurev-environ-102014-021217
Giorgi, F., Marinucci, M. R., and Bates, G. T. (1993). Development of a second-generation regional climate model (RegCM2). Part I: Boundary-layer and radiative transfer processes. Monthly Weather Rev. 121, 2794–2813. doi: 10.1175/1520-0493(1993)121<2794:DOASGR>2.0.CO;2
Goss, M., Swain, D. L., Abatzoglou, J. T., Sarhadi, A., Kolden, C. A., Williams, A. P., et al. (2020). Climate change is increasing the likelihood of extreme autumn wildfire conditions across California. Environ. Res. Lett. 15:094016. doi: 10.1088/1748-9326/ab83a7
Guo, J., Huang, G., Wang, X., Li, Y., and Yang, L. (2018). Future changes in precipitation extremes over China projected by a regional climate model ensemble. Atmos. Environ. 188, 142–156. doi: 10.1016/j.atmosenv.2018.06.026
Heikkilä, U., Sandvik, A., and Sorteberg, A. (2011). Dynamical downscaling of ERA-40 in complex terrain using the WRF regional climate model. Clim. Dyn. 37, 1551–1564. doi: 10.1007/s00382-010-0928-6
Hong, X. U., Xiao-Peng, Y., and Yong, Z. H. (2007). Study on the forest fire danger forecast in Yunnan Province based on GIS and RS. J. Fujian Forest. Sci. Technol. 34, 85–88.
Kanamitsu, M., Ebisuzaki, W., Woollen, J., Yang, S., Hnilo, J. J., Fiorino, M., et al. (2002). Ncep–doe amip-ii reanalysis (r-2). Bull. Am. Meteorol. Soc. 83, 1631–1644. doi: 10.1175/BAMS-83-11-1631
Kuo, C. C., Gan, T. Y., and Wang, J. (2020). Climate change impact to Mackenzie river Basin projected by a regional climate model. Clim. Dyn. 54, 3561–3581. doi: 10.1007/s00382-020-05177-7
Landgren, O. A., Haugen, J. E., and Førland, E. J. (2014). Evaluation of regional climate model temperature and precipitation outputs over Scandinavia. Clim. Res. 60, 249–264. doi: 10.3354/cr01240
Letcher, T. W., and Minder, J. R. (2015). Characterization of the simulated regional snow albedo feedback using a regional climate model over complex terrain. J. Clim. 28, 7576–7595. doi: 10.1175/JCLI-D-15-0166.1
Li, T., Liu, G., Fang, J., and Tang, J. (2022). Dynamical downscaling of inland and offshore near-surface wind speed over China in CORDEX East Asia Phase I and II experiments. Int. J. Climatol. 42, 6996–7012. doi: 10.1002/joc.7625
Lorant, V., McFarlane, N. A., and Scinocca, J. F. (2006). Variability of precipitation intensity: Sensitivity to treatment of moist convection in an RCM and a GCM. Clim. Dyn. 26, 183–200. doi: 10.1007/s00382-005-0076-6
Lu, C., Huang, G., and Wang, X. (2019). Projected changes in temperature, precipitation, and their extremes over China through the RegCM. Clim. Dyn. 53, 5859–5880. doi: 10.1007/s00382-019-04899-7
Lynch, A., McGinnis, D., Chapman, W. L., and Tilley, J. S. (1997). A multivariate comparison of two land-surface models integrated into an arctic regional climate system model. Ann. Glaciol. 25, 127–131. doi: 10.3189/S0260305500013914
Mallet, M., Solmon, F., Roblou, L., Peers, F., Turquety, S., Waquet, F., et al. (2017). Simulation of optical properties and direct and indirect radiative effects of smoke aerosols over marine stratocumulus clouds during summer 2008 in California with the regional climate model RegCM. J. Geophys. Res. Atmos. 122, 312–337. doi: 10.1002/2017JD026905
People’s Government of Yunnan Province. (2022). General office of yunnan provincial people’s government, yunnan provincial people’s government 2022 forest and grassland fire order 2022. Available online at: http://www.yn.gov.cn/zwgk/zcwj/qtwj/202202/t20220228_237085.html (accessed February 28, 2022).
Raghavan, S. V., Vu, M. T., and Liong, S. Y. (2016). Regional climate simulations over Vietnam using the WRF model. Theoretical Appl. Climatol. 126, 161–182. doi: 10.1007/s00704-015-1557-0
Rummukainen, M., Räisänen, J., Bringfelt, B., Ullerstig, A., Omstedt, A., Willén, U., et al. (2001). A regional climate model for northern Europe: Model description and results from the downscaling of two GCM control simulations. Clim. Dyn. 17, 339–359. doi: 10.1007/s003820000109
Seth, A., and Giorgi, F. (1998). The effects of domain choice on summer precipitation simulation and sensitivity in a regional climate model. J. Clim. 11, 2698–2712. doi: 10.1175/1520-0442(1998)011<2698:TEODCO>2.0.CO;2
Shi, Y., Wang, G., and Gao, X. (2018). Role of resolution in regional climate change projections over China. Clim. Dyn. 51, 2375–2396. doi: 10.1007/s00382-017-4018-x
Smith, D. M., Scaife, A. A., Eade, R., Athanasiadis, P., Bellucci, A., Bethke, I., et al. (2020). North Atlantic climate far more predictable than models imply. Nature 583, 796–800. doi: 10.1038/s41586-020-2525-0
Sørland, S. L., Brogli, R., Pothapakula, P. K., Russo, E., Walle, J. V., Ahrens, B., et al. (2021). COSMO-CLM regional climate simulations in the Coordinated Regional Climate Downscaling Experiment (CORDEX) framework: A review. Geosci. Model Dev. 14, 5125–5154. doi: 10.5194/gmd-14-5125-2021
Stratton, R. A., Senior, C. A., Vosper, S. B., Vosper, S. B., Folwell, S. S., Boutle, I. A., et al. (2018). Pan-African convection-permitting regional climate simulation with the met office unified model: CP4-Africa. J. Clim. 31, 3485–3508. doi: 10.1175/JCLI-D-17-0503.1
Wang, G., Yu, M., Pal, J. S., Mei, R., Bonan, G. B., Levis, S., et al. (2016). On the development of a coupled regional climate–vegetation model RCM–CLM–CN–DV and its validation in Tropical Africa. Clim. Dyn. 46, 515–539. doi: 10.1007/s00382-015-2596-z
Xiang-Hui, K., and Xun-Qiang, B. (2015). Dynamical downscaling of the twentieth century reanalysis for China? Climatic Means during 1981–2010. Atmos. Oceanic Sci. Lett. 8, 166–173. doi: 10.1080/16742834.2015.11447255
Xuejie, G., Zongci, Z., Yihui, D., Ronghui, H., and Giorgi, F. (2001). Climate change due to greenhouse effects in China as simulated by a regional climate model. Adv. Atmos. Sci. 18, 1224–1230. doi: 10.1007/s00376-001-0036-y
Yu, K., Hui, P., Zhou, W., and Tang, J. (2020). Evaluation of multi-RCM high-resolution hindcast over the CORDEX East Asia Phase II region: Mean, annual cycle and interannual variations. Int. J. Climatol. 40, 2134–2152. doi: 10.1002/joc.6323
Keywords: forest fire dynamics, RCM, regional climate forecast model (RegCM), weather research and forecasting model (WRF), climate forecast
Citation: Deng X, Zhang Z, Zhao F, Zhu Z and Wang Q (2023) Evaluation of the regional climate model for the forest area of Yunnan in China. Front. For. Glob. Change 5:1073554. doi: 10.3389/ffgc.2022.1073554
Received: 18 October 2022; Accepted: 14 December 2022;
Published: 06 January 2023.
Edited by:
Tongxin Hu, Northeast Forestry University, ChinaReviewed by:
Cheng He, Nanjing Forest Police College, ChinaCopyright © 2023 Deng, Zhang, Zhao, Zhu and Wang. This is an open-access article distributed under the terms of the Creative Commons Attribution License (CC BY). The use, distribution or reproduction in other forums is permitted, provided the original author(s) and the copyright owner(s) are credited and that the original publication in this journal is cited, in accordance with accepted academic practice. No use, distribution or reproduction is permitted which does not comply with these terms.
*Correspondence: Zhe Zhang,  emhlLmplc3N5LnpoYW5nQGdtYWlsLmNvbQ==; Fan Zhao, ZnpoYW9Ac3dmdS5lZHUuY24=
Disclaimer: All claims expressed in this article are solely those of the authors and do not necessarily represent those of their affiliated organizations, or those of the publisher, the editors and the reviewers. Any product that may be evaluated in this article or claim that may be made by its manufacturer is not guaranteed or endorsed by the publisher.
Research integrity at Frontiers
Learn more about the work of our research integrity team to safeguard the quality of each article we publish.