 Edoardo Alterio1
 Thomas Campagnaro1,2Lorenzo Sallustio3Sabina Burrascano2,4Laura Casella5
 Tommaso Sitzia1,2*
- 1Department of Land, Environment, Agriculture and Forestry, Università degli Studi di Padova, Legnaro, Italy
- 2National Biodiversity Future Center, Palermo, Italy
- 3Department of Biosciences and Territory, Università degli Studi del Molise, Pesche, Italy
- 4Department of Environmental Biology, Sapienza Università di Roma, Roma, Italy
- 5Department for the Monitoring and Protection of the Environment and for Biodiversity Conservation, Institute for Environmental Protection and Research, Roma, Italy
Natura 2000 is a European network of protected sites that should enable natural habitats to be maintained or restored at a favorable conservation status. Progress toward this objective must be periodically reported by states members of the European Union. We investigated how forest management plans might provide data to support the reporting. The study was done in the forests of the Dolomites and Venetian Prealps, Italy. Here, about 200 forest management plans, divided into several forest compartments, have been drawn up and revised every 10–15 years. Stand structure variables were retrieved from past (OR, 1970–1980) and more recent revisions (NR, 2000–2010) of 331 forest compartments ranging between 0.35 and 53.1 ha. In the beech and spruce forest habitat types (coded 9130 and 9410 in Annex I of the Directive 92/43/EEC, respectively), we found an increase from OR to NR in the density of large trees (from 32 to 46/ha and from 31 to 50/ha, respectively for the two habitats), basal area (from 27.3 to 31.5 m2/ha and from 31 to 34.5 m2/ha), mean diameter (from 34.1 to 36.2 cm and from 33.9 to 36 cm) and Gini index (from 0.35 to 0.37 and from 0.33 to 0.36). Pursuant to the Directive 92/43/EEC, the conservation status of these two habitat types should be taken as “favorable” with regards to the criterion related to the habitats’ specific structure and functions that are necessary for its long-term maintenance. We conclude that forest management plans provide a great portion of the information needed for assessing and monitoring the conservation status of forest habitat types in the Natura 2000 framework.
1. Introduction
The Natura 2000 network of protected sites covers about 20% of the terrestrial European area of which 50% is forested, representing nearly 25% of the total European forest area. These sites are established to conserve more than 200 natural and semi-natural habitat types listed and identified by a 4-digit code in the Annex I of the Directive 92/43/EEC (Habitats Directive) of which 85 are forests, 29 of which have a priority status related to their uniqueness and degree of threat. Moreover, 184 species listed in the European Union Nature directives are linked to forests (European Commission, 2015; European Environment Agency, 2020). For that reason, most of the Natura 2000 aims of conserving, protecting, monitoring, and restoring habitats and biodiversity are addressed toward forests (Campagnaro et al., 2019; European Commission, 2019, 2021).
Historically the objective of forest planning was to achieve timber harvest in order to maximize the income yield of forest owners (Boncina, 2011). However, in the last century the integration of other forest values into forest plans has been proposed (Başkent et al., 2005), such as carbon sequestration, production of water (Başkent and Mumcu Küçüker, 2010), and non-timber goods (like mushrooms and berries) (Aldea et al., 2012), and even adaptation principles for reducing climate warming (Janowiak et al., 2014). Today, forest management plans aim to modulate over space and time the timber production and the provision of all the other forest ecosystem services (Bettinger et al., 2009). For example, the need to integrate biodiversity and nature conservation into forest management planning is widely acknowledged (Kangas and Kuusipalo, 1993; Boncina, 2011; Trentanovi et al., 2018; Nagaike, 2020), and could be intended as a two-way integration, with forest plans both being improved by and providing practical tools to nature conservation planning and biodiversity conservation monitoring. Despite this, the potential contribution of forest management plans to habitat monitoring is still largely neglected (Brukas and Sallnäs, 2012).
Forest management planning is based on two main processes: (i) the assessment of the forest state through a detailed forest inventory and (ii) the planning of recommended treatments to undertake the desired objectives (Brukas and Sallnäs, 2012). One key feature of forest plans is the fact that they are revised over time and thus represent long time series of stand structural data across extensive areas.
Stand structural data have been related to forest biodiversity via a wide set of research applications. In general, forest biodiversity changes among the different stand structures induced by different management intensities (Paillet et al., 2010; Sitzia et al., 2017; Burrascano et al., 2021). The relation between stand structural data and a range of taxonomic groups of forest biodiversity has been investigated both through local observations (Ranius and Jansson, 2000; Grove, 2002; Nascimbene et al., 2007; Noreika et al., 2019) and by using species habitat suitability models (Edenius and Mikusiński, 2007; Flaherty et al., 2012). This topic was also addressed by using the stand structural data collected in national forest inventories that were used either as biodiversity indicators (Smith et al., 2008; Corona et al., 2011; Chirici et al., 2012; Rondeux et al., 2012; Coote et al., 2013; Gao et al., 2014; Kovac et al., 2014; Alberdi et al., 2018), or for the assessment of the conservation status of forest habitat types within Natura 2000 sites (Alberdi et al., 2019; Kovac et al., 2020). However, a relevant limit of national forest inventories for biodiversity monitoring is their coarse spatial resolution, since they usually provide data aggregated for national level or at most regional level, whereas they seem less profitable or even not suitable for small-scale analysis.
Our hypothesis is that the large amount of stand structural data stored in forest management plans is useful for monitoring the conservation status of the forest habitat types in the Natura 2000 network regarding the criterion related to the habitats’ specific structure and functions that are necessary for its long-term maintenance, mentioned in the article 1 of the Habitats Directive.
This potential was assessed both at the regional scale and across habitat types, using a subsample of management plans of the forests of the Dolomites and Venetian Prealps, north-eastern Italy. Analyzing the variations in time of a group of stand structural indicators retrieved or calculated from forest management plan data, we aimed at answering the following questions: (i) What is the extent and direction of the changes of the stand structural indicators over time, and what do they indicate of biodiversity? (ii) Are these changes recordable in forest habitat types as defined by the Habitats Directive, and may they contribute to the assessment of conservation status in Natura 2000 network? (iii) Which stand structural indicators are the best indicators of habitat conservation status?
2. Materials and methods
2.1. Study area
The study was done in the forests of the Dolomites and Venetian Prealps, north-eastern Italy (Figure 1). Most of these forests, if owned by public entities, are administered by Veneto, one of the second-level Italian administrative levels, through about 200 forest management plans, divided into several management units called compartments, and revised every 10–15 years.
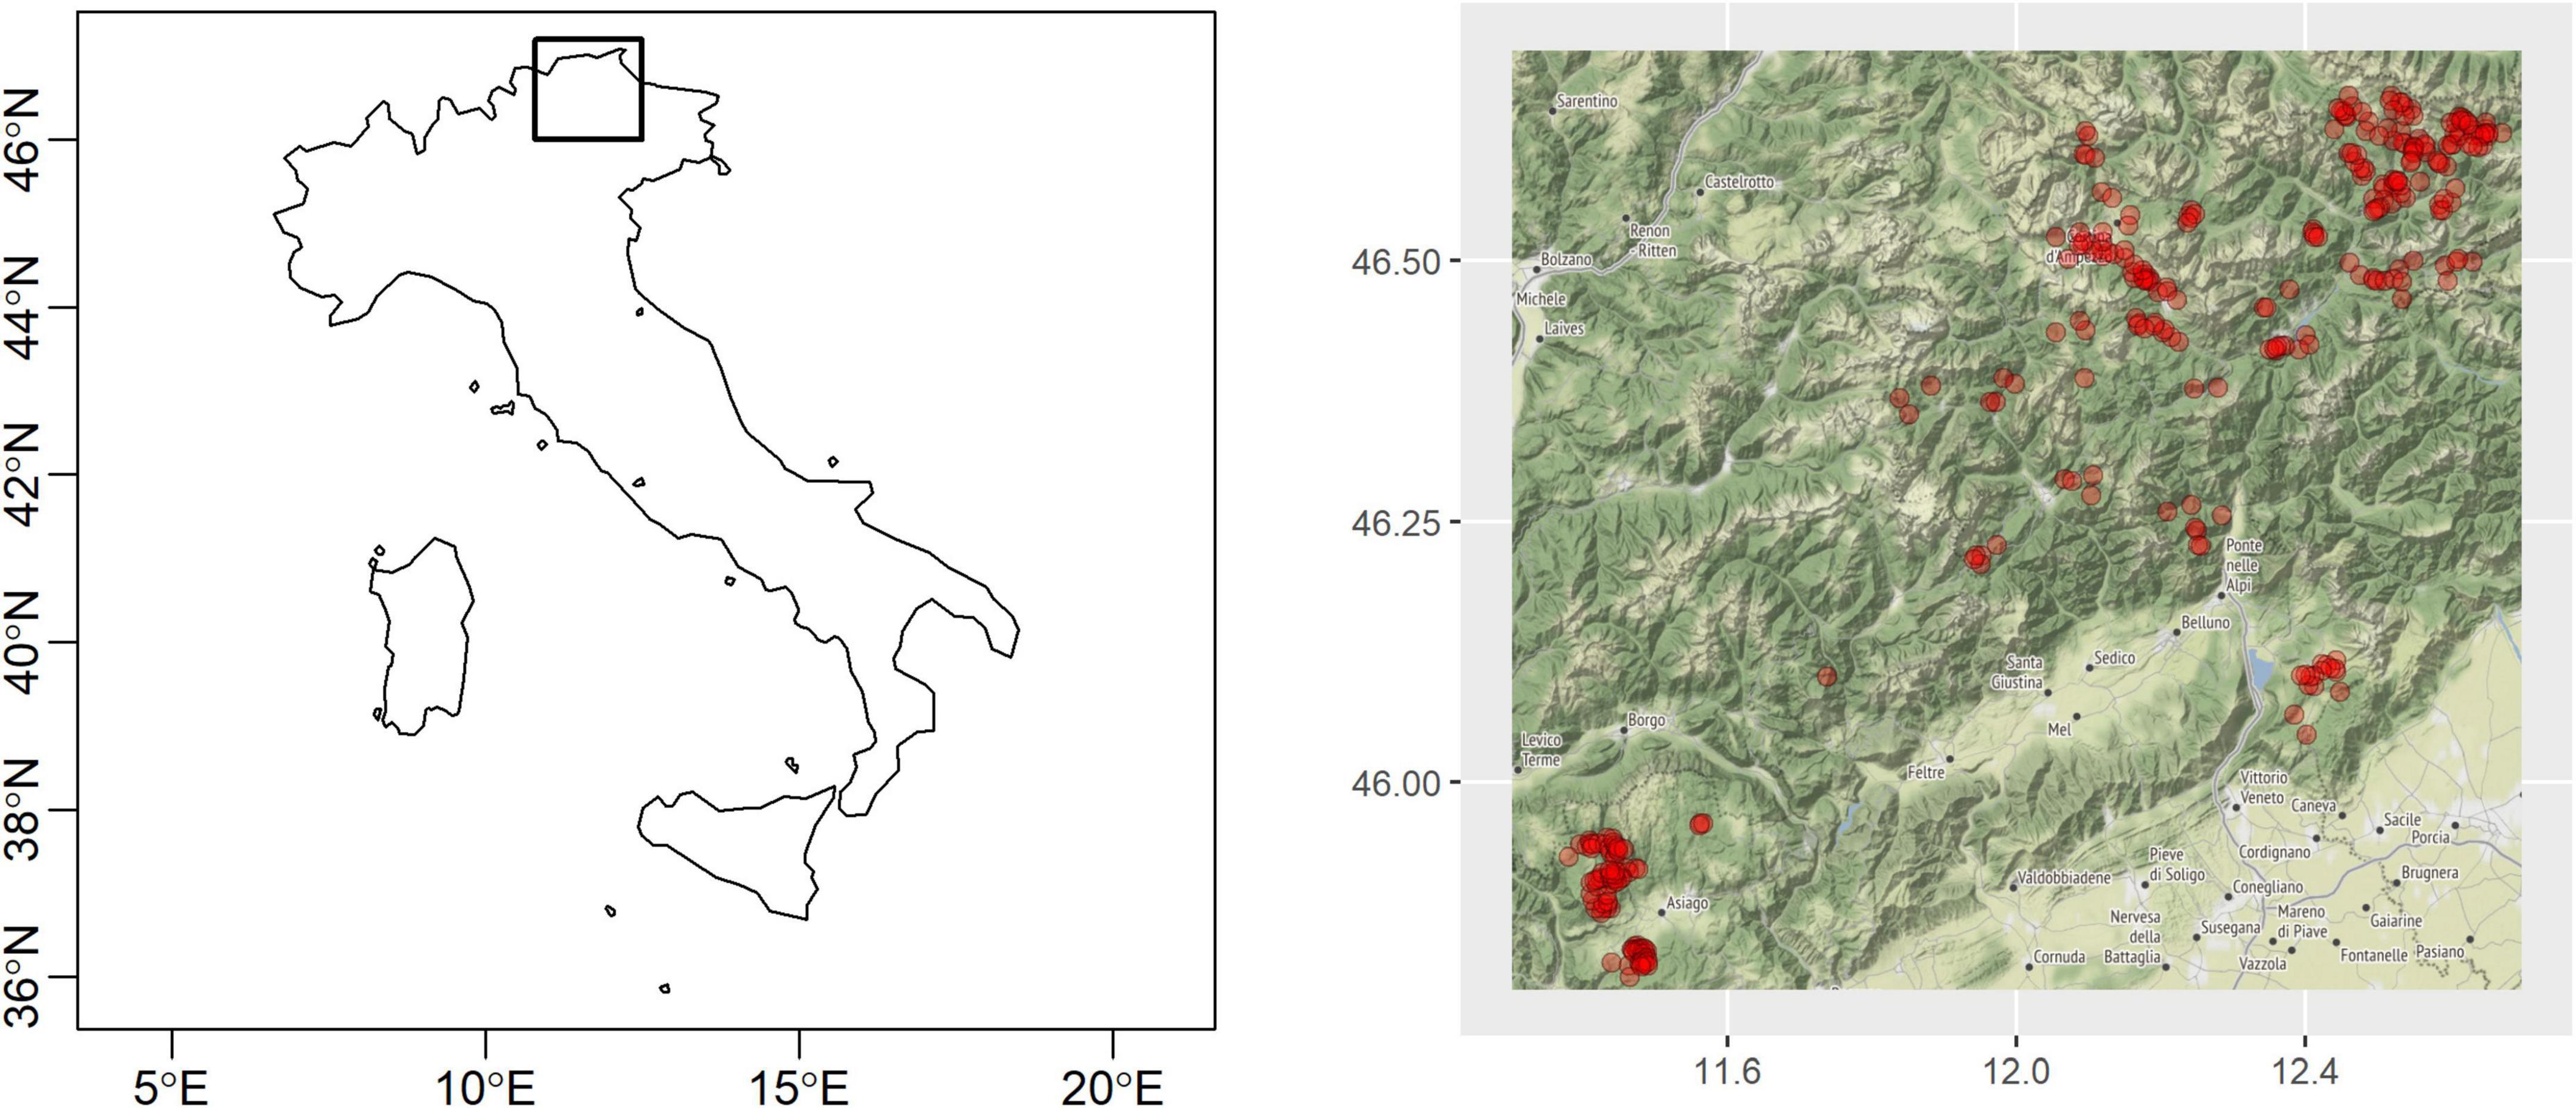
Figure 1. The study was done in the forests of the Dolomites and Venetian Prealps, north-eastern Italy. The black square in the left panel marks the study area. Red points in the right panel are the centroids of the 331 management units (compartments) belonging to forest management plans that form the sample analyzed in this study.
2.2. Data collection
We used stand structure data collected during surveys for the definition of forest management plans, across management units called forest compartments. These were selected based on forest features and data availability over time. Forest management plans usually have an operating validity of ten years after which they are revised. Data were retrieved from an old revision (OR, 1970–1980) and a recent revision (NR, 2000–2010). Some of the plans were paper-only documents; therefore, we entered the data included in them in a digital database built for the purpose of this study. The final database contained data of 331 forest compartments (Figure 1), covering 4,847 hectares, with each compartment ranging from 0.35 to 53.1 hectares. The 93% of the compartments was mainly devoted to productive function. The 69% of the whole compartments area fell within the Natura 2000 network. Of this area, the 87% was covered by forest habitat types. In the 331 analyzed forest compartments, both during OR and NR field surveys, the field protocol and the variable collected were the same. The diameter at breast eight (DBH) and the species were collected for all living tree having DBH ≥17.5 cm. Afterwards, the stand volume was calculated by the practitioners that drew up the forest management plans using volume tables. The data retrieved from each of the 331 analyzed forest compartments were: DBH (for each tree), species (for each tree) and stand volume (of the whole compartment). Trees collected belonged to six tree species: silver fir (Abies alba), European beech (Fagus sylvatica), larch (Larix decidua), Norway spruce (Picea abies), Swiss pine (Pinus cembra), and Scots pine (Pinus sylvestris).
2.3. Data analysis: Indicators of forest stand structure
We collected values of the following variables: density of trees (per hectare; n/ha), density of large trees (DBH > 50 cm; per hectare; n/ha) basal area (per hectare; m2/ha), mean diameter (cm), stand volume (per hectare; m3/ha), number of tree species (per forest compartment; n), relative tree species abundance (per forest compartment; %), Shannon index, and Gini index. These variables can be regarded as indicators of ecosystem structure and functions, in accordance with the definitions given by the national biodiversity monitoring plan (Angelini et al., 2016). Hereafter, the term indicator will be used to refer to both parameters and indices. For each forest compartment of both OR and NR a value of each of the abovementioned indicators was obtained or calculated according to the following lines.
The stand volume was already available from the forest management plans, so it was just collected and joined to the database. Forest plans included lists of trees sampled during forest inventories, reporting species and DBH. From the lists we calculated the density of trees and the density of large trees for each forest compartment. Density of trees and density of large trees per hectare were obtained dividing the area of the compartments by the conversion ratio of one hectare. The cumulative basal area of each forest compartment was calculated from the DBH lists using the equation based on the formula for the area of a circle. Basal area of forest compartments was converted into basal area per hectare dividing the area of the compartments by the conversion ratio of one hectare. The mean diameter was calculated from the mean basal area using the inverse of the formula for the area of a circle. Mean basal area was obtained dividing the basal area per hectare by the density of trees per hectare. The number of tree species was the count of tree species which had at least one individual in the forest compartment. The relative tree species abundance per each tree species in each forest compartment was the ratio between the density of each tree species and the density of all trees within the forest compartment. Relative tree species abundances were rounded to one decimal place and then multiplied by 100 to have integer values corresponding to cover percentages.
The Shannon index was used as a spatially inexplicit index of tree species diversity according to the following formula:
where pi is the proportion of individuals belonging to i species on the total number of the individuals belonging to the sample. The Shannon index was calculated through the diversity() function from “vegan” R package (Oksanen et al., 2022).
The Gini index was used as a spatially inexplicit index of tree size diversity where the size was the DBH. For the Gini index calculation we conformed to the following steps: (i) sorting DBH values in ascending order and calculating the basal area; (ii) computing the proportions of cumulative basal area per hectare and the proportions of the cumulative density of trees per hectare; plotting the proportions of cumulative basal area per hectare and the proportions of the cumulative density of trees per hectare on y- and x-axis, respectively and visualizing the so called Lorenz curve; computing the ratio of the area between the Lorenz curve and the 45° line to the area under the 45° line as the Gini index (Sterba, 2008; Katholnig, 2012).
2.4. Time variations of the structural indicators
The time variation analysis was focused on (i) comparing the OR to the NR among the 331 forest compartments as well as (ii) among specific forest habitat types.
In the last case, forest compartments were grouped according to the dominant forest habitat type (dominant in terms of relative surface covered on the total surface of the compartment). We only used the forest compartments where the relative cover of the dominant forest habitat type was higher than 80%. To assess the cover of forest habitat types we overlapped the map of the compartments on the maps of the habitat types within Natura 2000 sites. The maps of the habitat types were available from a regional database (Regione del Veneto – Agricoltura e Foreste, 2020). The forest habitat types that met the above-mentioned criteria were (i) Illyrian Fagus sylvatica forests (Aremonio-Fagion) (91K0) (6 forest compartments); (ii) Asperulo-Fagetum beech forests (9130) (43 forest compartments); (iii) Acidophilous Picea forests of the montane to alpine levels (Vaccinio-Piceetea) (9410) (135 forest compartments); (iiii) the Alpine Larix decidua and/or Pinus cembra forests (9420) (one forest compartment). Due to the low representativity of the sample of the habitat types 91K0 and 9420, the analysis of time variations was only focused on the habitat types 9130 and 9410. Statistical differences of each indicator between OR and NR were analyzed through two-sample hypothesis testing. Since in most cases we could not satisfy the assumptions of normal distribution and homoscedasticity, we used the non-parametric Wilcoxon–Mann–Whitney test (W-statistic and α < 0.05) through the wilcox.test() function from “stats” R package (R Core Team, 2021).
Differences in the means of their relative tree species abundance were analyzed among the two forest plan revisions and three of the six tree species in the database: silver fir, European beech, and Norway spruce, which together accounted for almost 91 and 95% of all trees in OR and NR, respectively. Relative tree species abundance violated both normal distribution and homoscedasticity assumptions because of the abundance of zero values (absence of tree species in forest compartments), resulting in a zero-inflated count-data distribution. Therefore, we used a zero-inflated generalized linear model assuming the negative binomial distribution [zeroinfl() function from “pscl” R package (Zeileis et al., 2008)]. Model performance was tested against a generalized linear model and a zero-inflated generalized linear model, both assuming the Poisson distribution, through the Vuong’s test (vuong() function from “pscl” R package). We used the Anova() function from the “car” R package (Fox et al., 2021) to obtain the ANOVA table for the zero-inflated model with type III and F as test statistic. All statistics were performed using the R software (R Core Team, 2021).
2.5. Correlation between indicators
A correlation analysis was performed to assess the presence of intercorrelations between all the indicators used in this study. The aim of this analysis was to highlight the effective number of indicators useful for forest habitat conservation assessment by the detection of specific redundancies (Schall et al., 2018; Keren et al., 2019; Alterio et al., 2021). In this analysis, for each indicator, we pooled the OR and NR samples into one new sample, consisting of 662 replicates (two replicates for each of the 331 forest compartments). The correlation was performed using the Spearman test through the cor() function from the “stats” R package (R Core Team, 2021).
3. Results
3.1. Time variations of the structural indicators in the 331 forest compartments
All the indicators analyzed in this study showed an increase of their mean values between OR and NR. Except for the density of trees (W = 58582; p = 0.12) and the number of tree species (W = 55969; p = 0.61), the differences found were statistically significant according to the Wilcoxon–Mann–Whitney test (W ≥ 61556, p < 0.01) (Figure 2). In the case of the density of trees, the OR mean was 336 (±125, the standard deviation) per hectare whereas the NR mean was 344 (±107) per hectare. The mean density of large trees was 28 (±19) per hectare in OR and 46.1 (±23.2) per hectare in NR. The OR mean basal area was 28.9 (±9.3) m2 per hectare and it reached the value of 33.2 (±8.5) m2 per hectare in the NR. The mean of mean diameter was 33.6 (±3.9) cm in OR and 35.5 (±3.9) cm in the NR. The mean stand volume moved from 307 (±117) m3 per hectare in OR to 357 (±104) m3 per hectare in NR. Mean number of tree species was 3.08 (±0.9) in OR and 3.11 (±0.9) in NR. The Shannon index showed a strong increase, moving from an average value of 0.57 (±0.32) of the OR to an average value of 0.64 (±0.34) of the NR. The Gini index increased, moving from an average value of 0.33 (±0.04) of the OR to 0.36 (±0.04) of the NR.
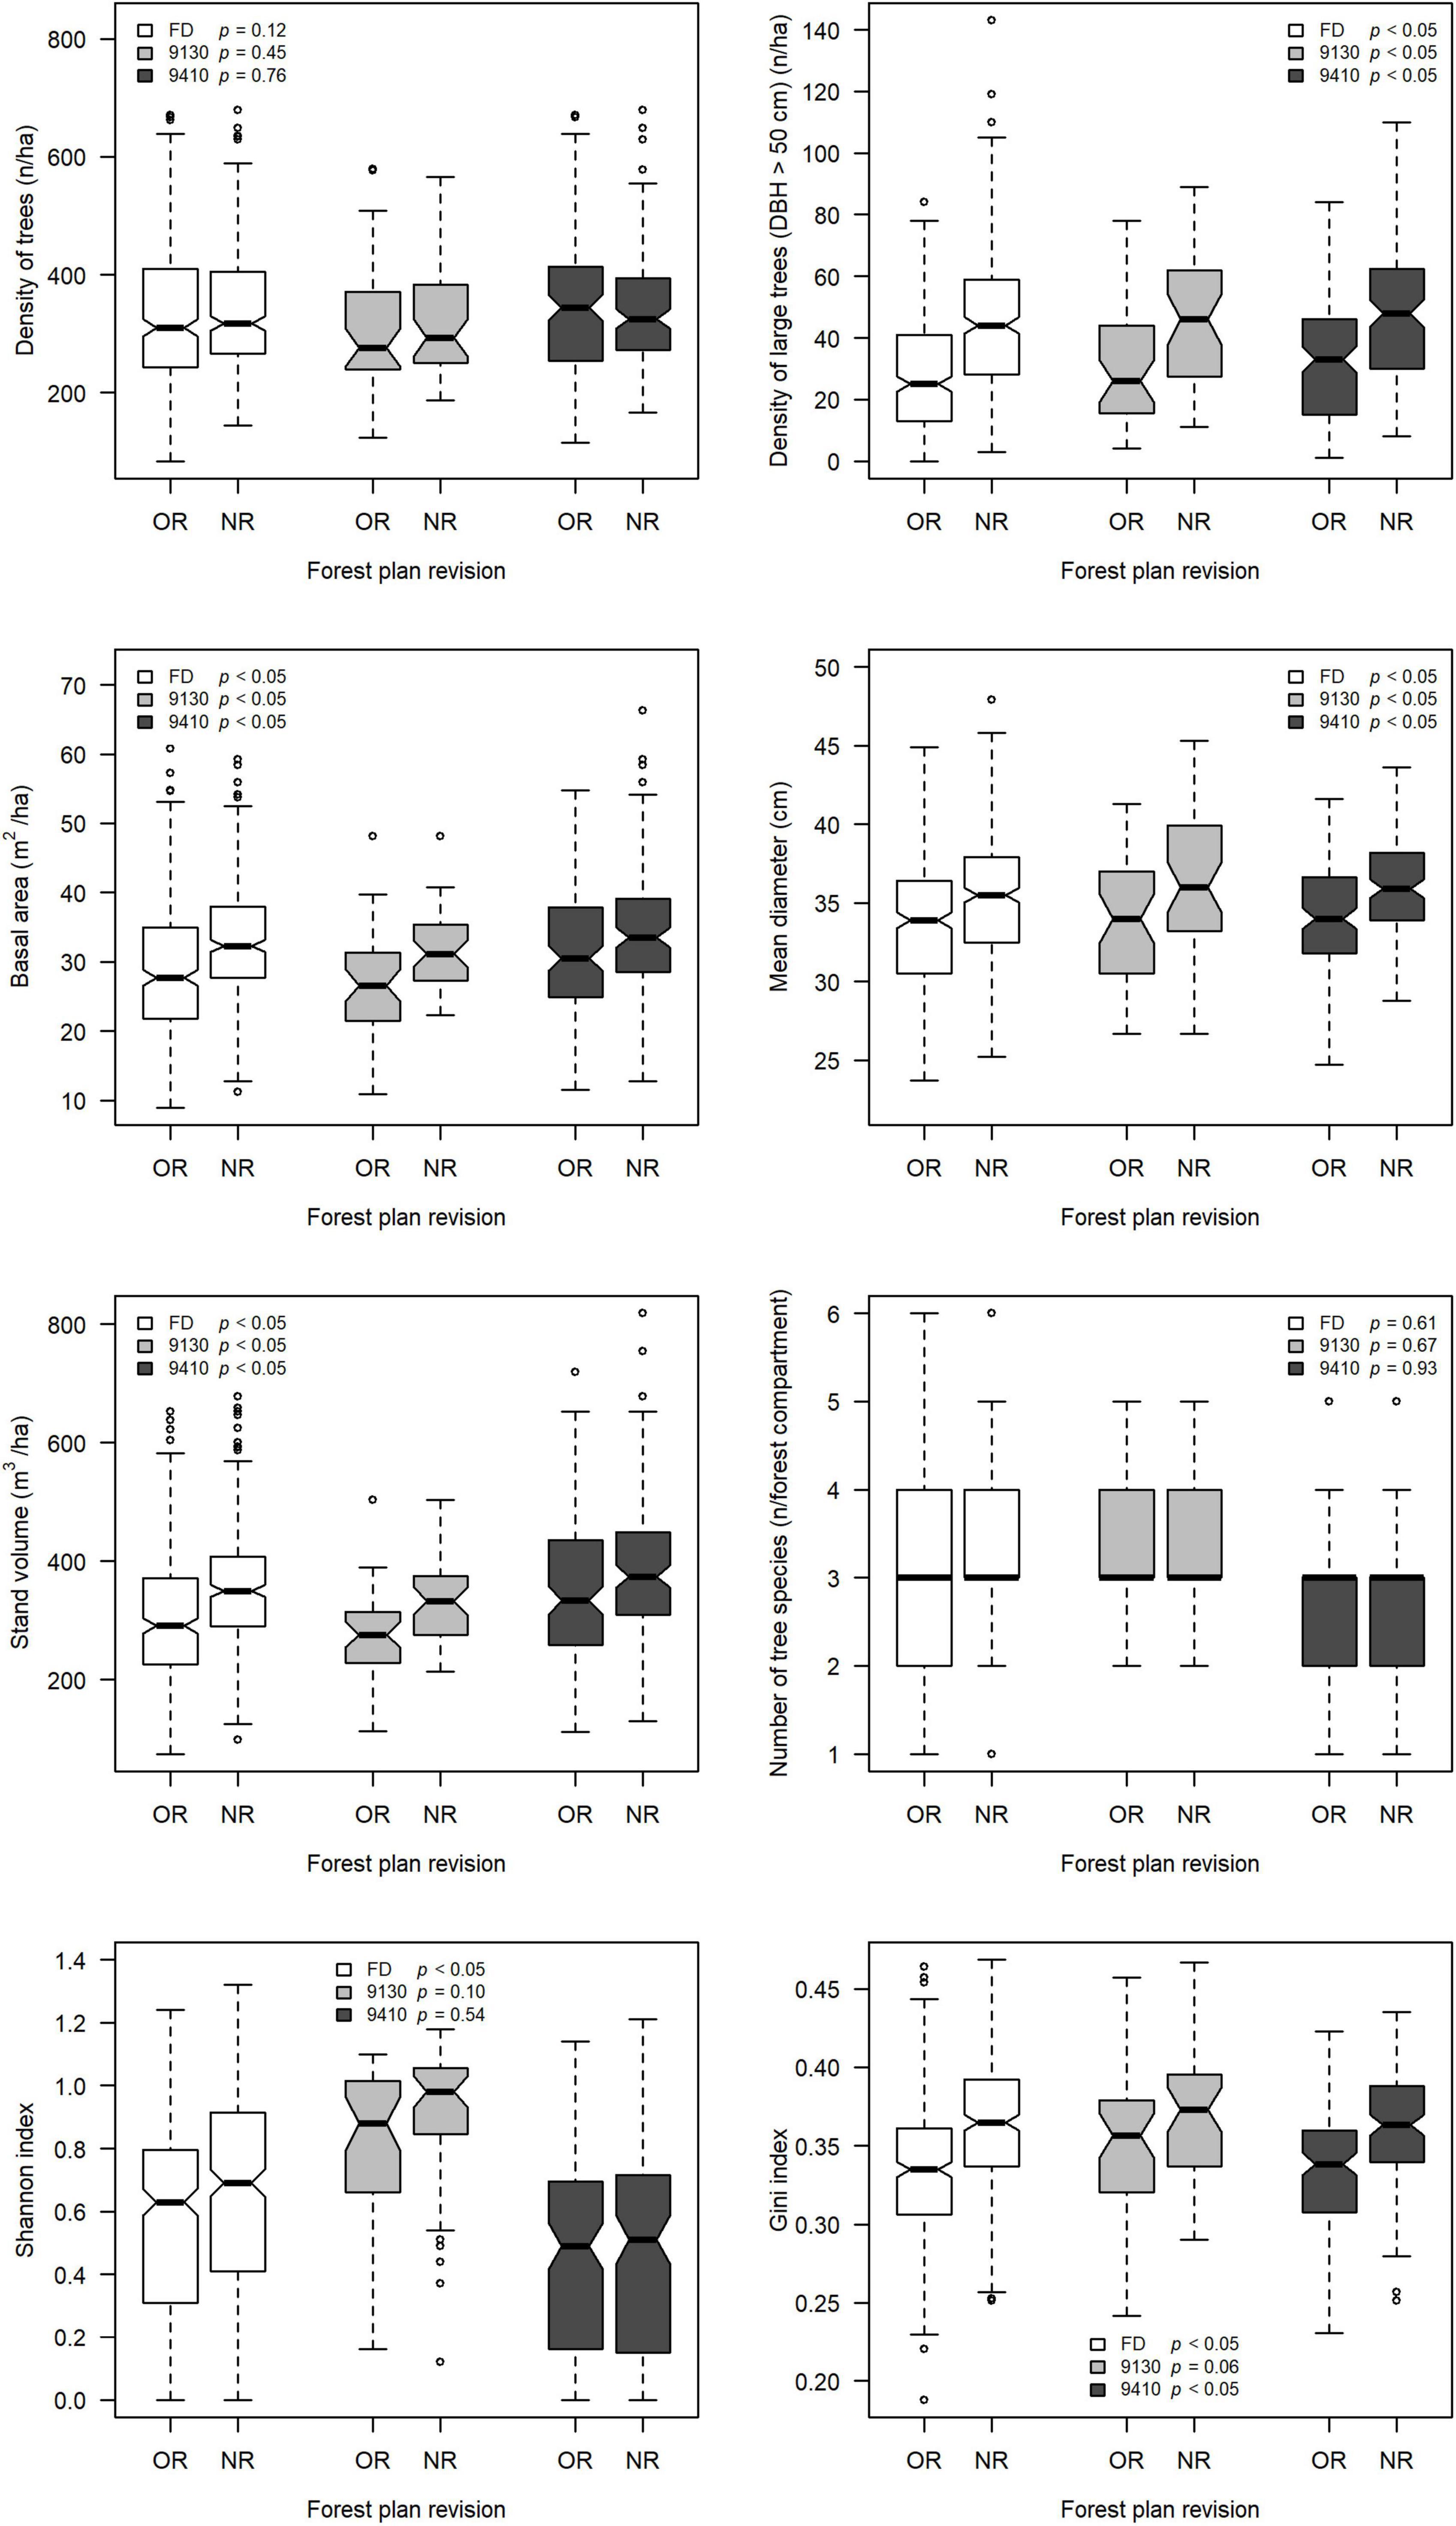
Figure 2. The boxplots compare the distribution of the values of each of the structural indicators used in this study among OR (old revision) and the NR (new revision) of forest management plans. White boxplots refer to the whole of the 331 forest compartments belonging to the analyzed sample (FD = full database; n = 331); gray boxplots refer to the sample of forest compartments dominated by 9130 forest habitat type (n = 43); dark gray boxplots refer to the sample of forest compartments dominated by 9410 forest habitat type (n = 135). The p-values from the Wilcoxon–Mann–Whitney test are displayed in the panels.
Relative tree species abundance of silver fir, European beech, and Norway spruce changed among forest plan revision and species. The effect of tree species was significant (F = 235.28, p < 0.01), and it was clear that the most abundant species was Norway spruce, followed by silver fir and European beech. This pattern was consistent across forest plan revision. There was no significant effect of forest plan revision (F = 2.60, p = 0.11), neither interaction (F = 1.14, p = 0.32). However, weak changes in relative three species abundance among OR and NR was detected, with an increase of mean relative abundance of beech against a relative decrease of fir and spruce (Figure 3A).
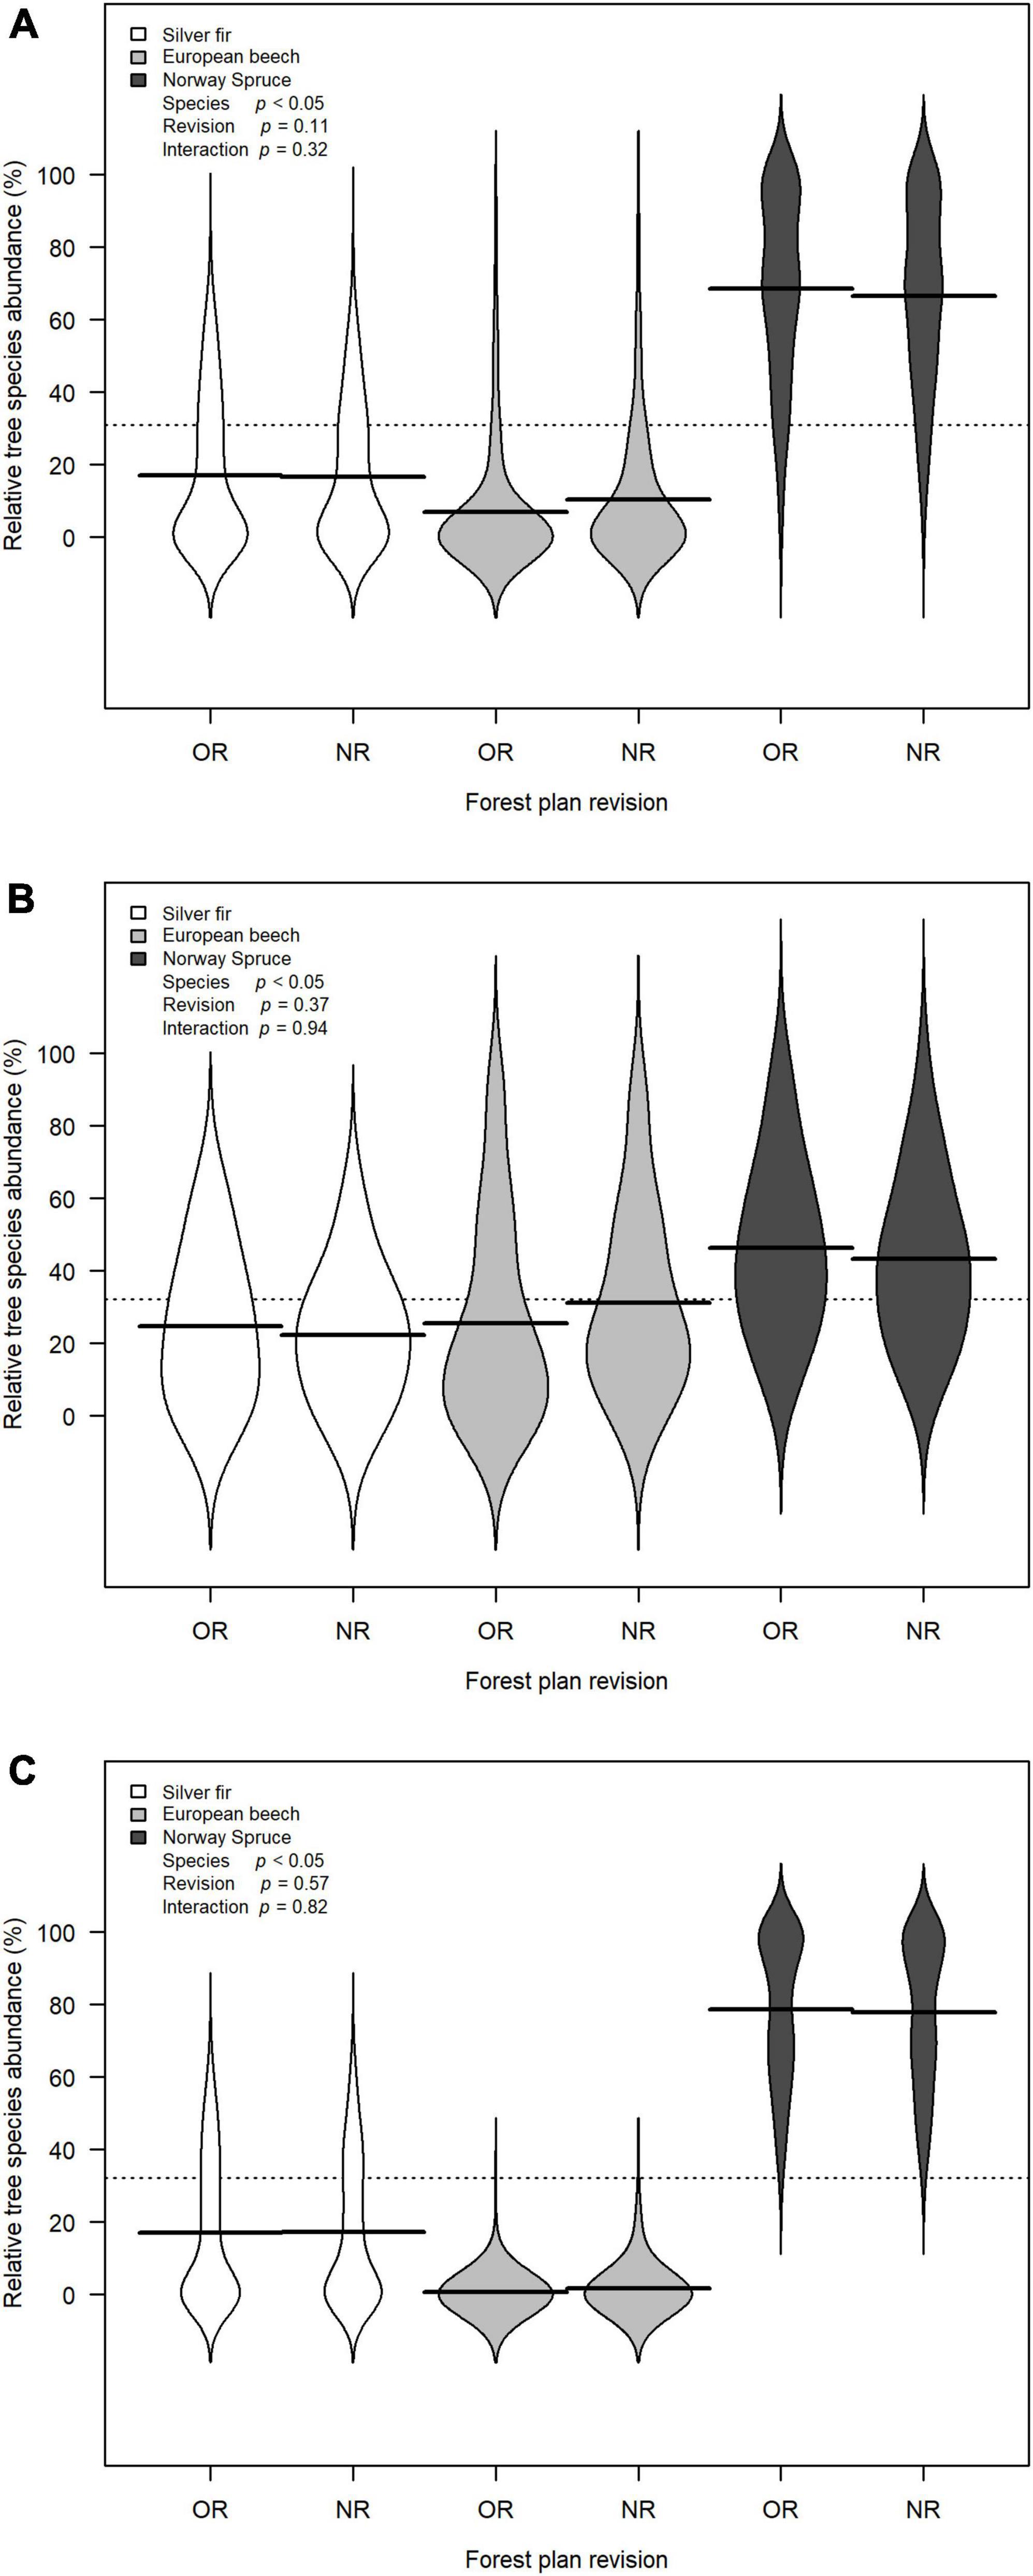
Figure 3. Bean plots showing the relative tree species abundance distributions of the three most frequent species collected in forest management plans: silver fir, European beech, Norway spruce. Two relative tree species abundance distributions are depicted for each species: one for the old revision (OR) and one for the new revision (NR) of forest management plans. Black solid lines are the bean means, representing the mean of each relative tree species abundance distribution. Black dotted line is the overall mean. p-Values are from the F test for the zero-inflated general linear model to test the effect of the species, the forest plan revision, and their interaction. (A) Full database of forest compartments (n = 331); (B) forest compartments dominated by 9130 forest habitat type (n = 43); (C) forest compartments dominated by 9410 forest habitat type (n = 135).
3.2. Time variations of the structural indicators in Natura 2000 forest habitat types
Regarding 9130 forest habitat type, in the OR, the mean values of the density of trees, the density of large trees, the basal area, the mean diameter, the stand volume, the number of species, the Shannon index, and the Gini index were respectively 311 (±112) per hectare, 32 (±20) per hectare, 27.3 (±7.1) m2 per hectare, 34.1 (±3.9) cm, 279 (±71) m3 per hectare, 3.28 (±0.81), 0.81 (±0.26), 0.35 (±0.04). In the NR, the respective values were 321 (±97) per hectare, 46 (±22) per hectare, 31.5 (±5.6) m2 per hectare, 36.2 (±5.0) cm, 326 (±64) m3 per hectare, 3.35 (±0.78), 0.88 (±0.24), 0.37 (±0.04). Statistically significant differences among OR and NR were found for the density of large trees, the basal area, the mean diameter and the stand volume (W ≥ 1152, p < 0.05) and marginally significant differences for Gini index (W = 1143, p = 0.06), whereas the other indicators did not show any statistical difference among OR and NR (density of trees: W = 1012, p = 0.45; number of tree species: W = 970, p = 0.67; Shannon index: W = 1113, p = 0.10) (Figure 2).
There was no significant effect of forest plan revision on relative tree species abundance of fir, beech, and spruce (F = 0.80, p = 0.37). However, as also observed on the whole of 331 forest compartments, mean relative tree species abundance changed showing an increase of beech and a reduction of fir and spruce. Relative three species abundance statistically changed among species (F = 5.04, p < 0.01) and no interaction of species and forest plan revision was detected (F = 0.06, p = 0.94) (Figure 3B).
Regarding 9410 forest habitat type, in the OR, the mean values of the density of trees, the density of large trees, the basal area, the mean diameter, the stand volume, the number of species, the Shannon index, and the Gini index were respectively 350 (±119) per hectare, 31 (±19) per hectare, 31.0 (±9.5) m2 per hectare, 33.9 (±3.7) cm, 347 (±126) m3 per hectare, 2.95 (±0.88), 0.45 (±0.31), 0.33 (±0.04). In the NR, the respective values were 343 (±99) per hectare, 50 (±26) per hectare, 34.5 (±8.8) m2 per hectare, 36.0 (±3.6) cm, 389 (±116) m3 per hectare, 2.96 (±0.86), 0.48 (±0.33), 0.36 (±0.04). Except for the density of trees, the number of tree species, and the Shannon index (W = 8917, p = 0.76; W = 9168, p = 0.93; W = 9508, p = 0.54; respectively), in the other cases, the differences were statistically significant (W ≥ 10964, p < 0.01) among OR and NR (Figure 2).
Again, no significant effect of forest plan revision on relative tree species abundance of silver fir, European beech, and Norway spruce was found (F = 0.33, p = 0.57) (Figure 3C).
3.3. Correlation between structural indicators
Twenty of the 28 possible associations between structural indicators (excluding correlations between the same indicator) were significant (p < 0.05). Among them, three correlations showed Spearman’s rho values greater than 0.7. The basal area was correlated with the density of trees (Spearman’s rho = 0.72, p < 0.01) and with the stand volume (Spearman’s rho = 0.93, p < 0.01). A significant and positive correlation was also found between the mean diameter and the density of large trees (Spearman’s rho = 0.84, p < 0.01). Other significant and positive correlations, even if lower than 0.7, were detected between the density of large trees and the stand volume (Spearman’s rho = 0.62, p < 0.01) and between the density of large trees and the Gini index (Spearman’s rho = 0.60, p < 0.01) (Table 1).
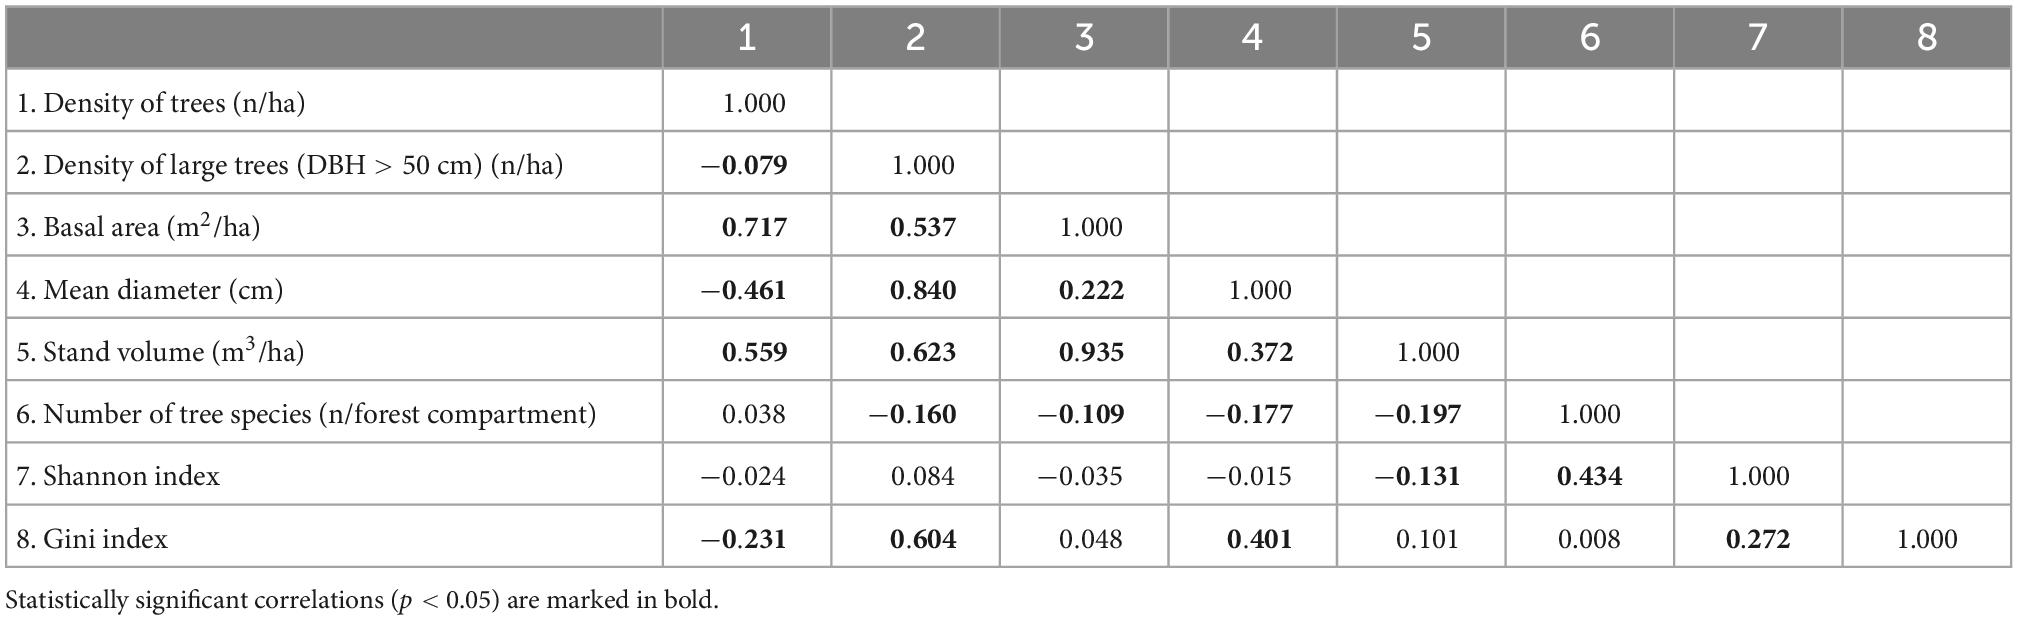
Table 1. Correlation matrix between structural indicators (Spearman correlation test).
4. Discussion
4.1. The ecological meaning of the structural indicators: What the analyzed indicators tell us on the quality of forest habitats?
The results obtained from the analysis of the whole of the forest compartments show that structural indicators increased in recent times according to the data retrieved from the latest analyzed revision of the forest management plans. Despite the highlighted trend, an exhaustive knowledge about the ecological meaning of these structural changes is still lacking. One of the main questions still standing about stand structural indicators is if they are able to tell us really what we expect from them (Noss, 1999). Results from research investigations demonstrate that some taxonomic groups benefit from peculiar stand structural conditions which are evidenced by the increase of some structural indicators. For instance, Grove (2002) found that the number of species of saproxylic beetles was positively related to the basal area of larger trees (with DBH > 45 cm). Similar results were obtained in old oak (Quercus robur) forests of the south-eastern Sweden, where the species richness of saproxylic beetles was higher in stands with larger trees, diameters, and basal area (Ranius and Jansson, 2000). Nascimbene et al. (2007) explored the influence of tree age and related parameters of trees on lichens communities in spruce forests. The authors found that species richness and composition of lichens increased with larger tree size. The basal area of trees also matters for birds (Le Roux et al., 2015), suggesting that individual trees work similarly to the habitat islands according to the island biogeography theory in relation to bird diversity. Regarding the relationship between stand volume and biodiversity, Noreika et al. (2019) found that stand volume had positive correlations with woody (shrubs and trees) and ectomycorrhizal fungi species diversity from 100 10 × 10 permanent forest plots in southern Estonia. The authors highlighted that high-diverse forest ecosystems are also high-productive forests, and that forest management and timber production may be coupled with biodiversity conservation in well-functioning forest ecosystems. The beneficial effect of forest biodiversity on forest productivity is well known in forest science and scientists describe this effect through the so-called diversity-productivity relationship (Bohn and Huth, 2016; Bourdier et al., 2016; Forrester and Bauhus, 2016; Liang et al., 2016; Jactel et al., 2018; Noreika et al., 2019; Qiao et al., 2021). According to diversity-productivity relationship, the biodiversity of forests seems to be mutually and positively related to forest productivity, quantified as growth in terms of basal area or stand volume or biomass. If we explore the diversity-productivity relationship by the opposite point of view, we may also infer that the increment of basal area and stand volume positively affects forests biodiversity. If the tree species richness and diversity is considered as an example of biodiversity (Zeller and Pretzsch, 2019), then some of the indicators used in this study, such as the basal area, the stand volume, and the Shannon index of tree species are strongly related. Regarding the structural complexity and diversification of the stand and their relationship with forest biodiversity, many studies have demonstrated that the increase of tree-size variation may enhance several components of forest biodiversity such as the variety of understory vegetation and bird diversity (Bourdier et al., 2016). Tree size variability is usually connected to stand structural complexity which can affect a variety of organisms living in forest habitats (Brosofske et al., 2001; Hijii et al., 2001; Ishii et al., 2004; Pastorella and Paletto, 2013). The Gini index was here tested as a reliable indicator to assess tree size variability of a forest stand starting from the data stored in forest management plans. The indicators here monitored can be used as valid proxies of habitat conditions, and forest management plans provide them with a fine spatial resolution and time continuity. Other indicators could be tested for the same purpose, including those based on the position of trees and on the nearest-neighbor algorithm (when information on the geographical position of a sample of trees are available) (Pommerening, 2002; Szmyt, 2014; Pommerening and Grabarnik, 2019).
4.2. Structural indicators and conservation status of Natura 2000 forest habitat types
Several technical manuals propose methods for monitoring the structure of Natura 2000 forest habitat types. Here, the analysis of the vegetation is usually the first and much fundamental step proposed. The analysis of vegetation is aimed to assess any change in the species composition and species diversity of the forest layer (Evans and Arvela, 2011; Angelini et al., 2016). The Shannon index was used in the present study for assessing the tree canopy diversity in the forest habitats starting from lists of tree species collected in forest management plans. In both 9130 and 9410 habitat types the tree canopy diversity increased among OR and NR, even if the differences were not significant. Recorded tree canopy diversity variations seem to be linked to changes of the relative frequencies of tree species, rather than to an increase of number of tree species. Previous research investigations of stand dynamics in beech forests reported declining tree species diversity because of the abandonment of silvicultural practices (Heiri et al., 2009; Durak, 2012). In this work, changes of relative tree species abundance were recorded, especially in 9130 forest habitat type, where European beech has gained relative abundance at the expense of Norway spruce, silver fir, and larch (Figure 3), affecting the balancing of relative frequencies, and thus the increasing of Shannon index. In mixed fir, spruce and beech forests, increasing compositional importance of beech has already been documented in Italian Alpine forests as an effect of tree harvesting cessation (Sitzia et al., 2018).
Other structural indicators cited in manuals for forest habitat conservation assessment are the density of trees, the density of large trees, the basal area, and the mean diameter (Angelini et al., 2016; European Environment Agency, 2018). In this study, in both 9130 and 9410 habitat types, the density of large trees, the basal area, and the mean diameter increased in recent times according to the data retrieved from the latest analyzed revision of the forest management plans. According to this framework, the results obtained in this study demonstrate that the structural complexity of the forest habitat types under investigation has increased over time, as highlighted by the values of the adopted indicators. Data contained in forest management plans can be used to calculate most of the structural indicators included in manuals for evaluation and monitoring the conservation status of Natura 2000 forest habitats.
4.3. Selecting a shortlist of indicators from the analysis of their intercorrelation
The correlation between indicators found in this study are consistent with the results reported in other papers, and in particular with those found by Cantarello and Newton (2008). In particular, the basal area per hectare was strongly correlated with both the density of trees and the stand volume. According to Kovač et al. (2016), stand volume and basal area are considered as assuming the same ecological meaning. Our results could help where just a part of the indicators used in this study are applicable, and thus, the choice between one indicator rather than another it is something that matters in terms of reliability of the analysis.
4.4. On the spatial scale versatility of forest management plans data for the conservation status and degree assessment
A notable advantage offered by forest management plans is that they provide data useful for the different monitoring required by the Habitats Directive which have different spatial scales and spatial resolutions. In this light, it is important to stress on the difference between conservation status and conservation degree of Natura 2000 habitats. Article 11 of the Habitats Directive obliges Member States to undertake surveillance of the conservation status of the natural habitats and species of Community interest. The surveillance is expressed through the Reporting (article 17) which is undertaken every 6 years, providing information on the implementation of conservation measures and their impacts on the conservations status of habitats and species concerned. Reporting allows to monitor the conservation status across the whole of a biogeographical region within a Member State. However, at site level, the assessment of the status of conservation of habitats and species is also required, according to the Article 6, to ensure the conservation status of individual sites (Alberdi et al., 2019). Thus, the conservation status of specific sites, should not be confused with the conservation status according to the article 17 of the Habitats Directive, that describes the overall status of habitats and species across the whole of a biogeographical region within each Member State. That is why the term “degree of conservation” has been introduced for describing the conservation status at site level (Evans and Arvela, 2011). National forest inventories have been tested as source of data for the assessment of conservation status (Corona et al., 2011; Chirici et al., 2012; Kovac et al., 2020). However, a relevant limit of national forest inventories is their coarse spatial resolution, since they usually provide data aggregated for national level or at most regional level. Thus, they are less useful or even not suitable for assessing the degree of conservation at site level or at other sub-national levels. However, also forest management plans data may have some limitations and the findings of the present study must be seen considering them. The first limitation deals with the variability of the inventory methods which may vary at space or time scales. The inventory methods can be different among administrative regions or among States, making it necessary the correction of large datasets through data harmonisations. Moreover, at the time scales the inventory methods can change because of updating of methodologies. A second potential limitation deals with the spatial resolution of the data stored in forest plans. Sometimes, the inventory methods used in forest management plans are designed to give a general description of forest characteristics at coarse spatial resolution, such as a mountain district. Thus, attention must be given when analysing forest management plans data at the forest stand scale. However, this is not the case of the dataset used in this article, where the data from OR and NR were collected with the same methodologies and the sampling method was based on the census of all the trees present in the forest compartments. We started from the raw data and from the tables collecting the sampled trees and their dendrometric characteristics. In this way, the structural indicators strongly reflect the structure of each forest stand with a fine resolution.
The article shows that forest management plans have a great spatial scale versatility for habitat conservation assessment. They can be used to assess the conservation degree of a sample of forest habitat types belonging to specific Natura 2000 sites, as shown in this study, as well as in the assessment of the forest conservation status within the whole of a member state. Forest management plans have a great potential for this purpose, especially given the fact that in many cases the plans cover the majority or the whole of the forests within Natura 2000 sites. However, despite the Italian national law which obliges public forest owners to draw up forest management plans and which has been in force since 1923, only the 18% of the national forests are covered by forest management plans (Rete Rurale Nazionale, 2019). Similar planning instruments are also required in other EU states.
5. Conclusion
The indicators here monitored can be used for describing structural variations of forest habitats across time. Their values were often found to be correlated to species diversity and habitat quality. All the indicators have been calculated through data collected from forest management plans, that demonstrated to be precious sources of forest stand information available with a fine spatial resolution and time continuity. The information they store allow to assess the conservation degree of specific forest habitat types at site level, as well as the conservation status of a wider area, providing strong benefits for effective forest habitat conservation assessments.
In this exemplary case, forests management plans provided the data needed to assert that the conservation status of the habitat types 9130 and 9410 should be taken as “favorable” with regards to the criterion related to the habitats’ specific structure and functions that are necessary for its long-term maintenance, a criterion mentioned by the article 1 of the Habitats Directive. Results also showed that some of the indicators tested are intercorrelated. The analysis of correlation supported the choice between one indicator rather than another and the identification of the sufficient number of indicators to use in monitoring.
Possible limitations of forest management plans data must be considered, especially those regarding the diversity of inventory methods among space and time which may be solved through the harmonization of the methodologies. These limitations could be addressed in future research.
Data availability statement
The original contributions presented in this study are included in the article/supplementary material, further inquiries can be directed to the corresponding author.
Author contributions
EA: conceptualization, formal analysis, investigation, methodology, and writing—original draft, review, and editing. TS: conceptualization, formal analysis, investigation, methodology, writing—original draft, review, and editing, funding acquisition, and supervision. TC: conceptualization, methodology, and writing—original draft, review, and editing. LS: conceptualization, methodology, writing, review, and editing. SB and LC: writing, review, and editing. All authors contributed to the article and approved the submitted version.
Funding
EA was supported by a Ph.D. grant funded by Fondo per lo Sviluppo e la Coesione (FSC), within the Piano Stralcio “Ricerca e innovazione 2015–2017”. The authors acknowledge the support of the NBFC to the University of Padova, funded by the Italian Ministry of University and Research, PNRR, Missione 4 Componente 2, “Dalla ricerca all’impresa”, Investimento 1.4, Project CN00000033.
Acknowledgments
We wish to express our sincere thanks to Andrea Rizzi for the helpful technical support, to Luca Nicolò Frigo for the precious help during the implementation of the dataset, and to Elena Osipova for her useful comments to the manuscript.
Conflict of interest
The authors declare that the research was conducted in the absence of any commercial or financial relationships that could be construed as a potential conflict of interest.
Publisher’s note
All claims expressed in this article are solely those of the authors and do not necessarily represent those of their affiliated organizations, or those of the publisher, the editors and the reviewers. Any product that may be evaluated in this article, or claim that may be made by its manufacturer, is not guaranteed or endorsed by the publisher.
References
Alberdi, I., Condés, S., Mcroberts, R. E., and Winter, S. (2018). Mean species cover: A harmonized indicator of shrub cover for forest inventories. Eur. J. For. Res. 137, 265–278. doi: 10.1007/s10342-018-1110-7
Alberdi, I., Nunes, L., Kovac, M., Bonheme, I., Cañellas, I., Rego, F. C., et al. (2019). The conservation status assessment of natura 2000 forest habitats in Europe: Capabilities, potentials and challenges of national forest inventories data. Ann. For. Sci. 76:34. doi: 10.1007/s13595-019-0820-4
Aldea, J., Martínez-Peña, F., and Diaz-Balteiro, L. (2012). Integration of fungal production in forest management using a multi-criteria method. Eur. J. For. Res. 131, 1991–2003. doi: 10.1007/S10342-012-0649-Y/TABLES/6
Alterio, E., Cislaghi, A., Bischetti, G. B., and Sitzia, T. (2021). Exploring correlation between stand structural indices and parameters across three forest types of the southeastern Italian alps. Forests 12:1645. doi: 10.3390/F12121645
Angelini, P., Casella, L., Grignetti, A., and Genovesi, P. (2016). Manuali per il monitoraggio di specie e habitat di interesse comunitario (Direttiva 92/43/CEE) in Italia: Habitat. ISPRA, serie manuali e linee guida, 142/2016. Available online at: https://www.isprambiente.gov.it/public_files/direttiva-habitat/Manuale-142-2016.pdf (accessed February 10, 2022).
Başkent, E. Z., and Mumcu Küçüker, D. M. (2010). Incorporating water production and carbon sequestration into forest management planning: A case study in Yalnızçcam planning unit. For. Syst. 19, 98–111. doi: 10.5424/FS/2010191-01171
Başkent, E. Z., Köse, S., and Keleş, S. (2005). The forest management planning system of Turkey: Constructive criticism towards the sustainable management of forest ecosystems. Int. For. Rev. 7, 208–217. doi: 10.1505/IFOR.2005.7.3.208
Bettinger, F., Boston, K., Siry, P. K., and Grebner, D. L. (2009). Forest management and planning. London: Elsevier.
Bohn, F. J., and Huth, A. (2016). The importance of forest structure to biodiversity–productivity relationships. R. Soc. Open Sci. 4:160521. doi: 10.1098/RSOS.160521
Boncina, A. (2011). Conceptual approaches to integrate nature conservation into forest management: A central European perspective. Int. For. Rev. 13, 13–22. doi: 10.1505/146554811798201152
Bourdier, T., Cordonnier, T., Kunstler, G., Piedallu, C., Lagarrigues, G., and Courbaud, B. (2016). Tree size inequality reduces forest productivity: An analysis combining inventory data for ten European species and a light competition model. PLoS One 11:e0151852. doi: 10.1371/journal.pone.0151852
Brosofske, K. D., Chen, J., and Crow, T. R. (2001). Understory vegetation and site factors: Implications for a managed Wisconsin landscape. For. Ecol. Manag. 146, 75–87. doi: 10.1016/S0378-1127(00)00447-3
Brukas, V., and Sallnäs, O. (2012). Forest management plan as a policy instrument: Carrot, stick or sermon? Land Use Policy 29, 605–613. doi: 10.1016/J.LANDUSEPOL.2011.10.003
Burrascano, S., Trentanovi, G., Paillet, Y., Heilmann-Clausen, J., Giordani, P., Bagella, S., et al. (2021). Handbook of field sampling for multi-taxon biodiversity studies in European forests. Ecol. Indic. 132:108266. doi: 10.1016/J.ECOLIND.2021.108266
Campagnaro, T., Sitzia, T., Bridgewater, P., Evans, D., and Ellis, E. C. (2019). Half earth or whole earth: What can natura 2000 teach us? Bioscience 69, 117–124. doi: 10.1093/biosci/biy153
Cantarello, E., and Newton, A. C. (2008). Identifying cost-effective indicators to assess the conservation status of forested habitats in natura 2000 sites. For. Ecol. Manag. 256, 815–826. doi: 10.1016/j.foreco.2008.05.031
Chirici, G., McRoberts, R. E., Winter, S., Bertini, R., Bröändli, U. B., Asensio, I. A., et al. (2012). National forest inventory contributions to forest biodiversity monitoring. For. Sci. 58, 257–268. doi: 10.5849/forsci.12-003
Coote, L., Dietzsch, A. C., Wilson, M. W., Graham, C. T., Fuller, L., Walsh, A. T., et al. (2013). Testing indicators of biodiversity for plantation forests. Ecol. Indic. 32, 107–115. doi: 10.1016/J.ECOLIND.2013.03.020
Corona, P., Chirici, G., McRoberts, R. E., Winter, S., and Barbati, A. (2011). Contribution of large-scale forest inventories to biodiversity assessment and monitoring. For. Ecol. Manag. 262, 2061–2069. doi: 10.1016/j.foreco.2011.08.044
Durak, T. (2012). Changes in diversity of the mountain beech forest herb layer as a function of the forest management method. For. Ecol. Manag. 276, 154–164. doi: 10.1016/J.FORECO.2012.03.027
Edenius, L., and Mikusiński, G. (2007). Utility of habitat suitability models as biodiversity assessment tools in forest management. Scand. J. For. Res. 21, 62–72. doi: 10.1080/14004080500486989
European Commission (2015). Natura 2000 and forests: Part I - II. Technical Report -2015 -088. Luxembourg: European Commission.
European Commission (2019). The european green deal. Communication from the commission to the European parliament, the council, the European economic and social committee and the committee of the regions, COM(2019) 640 final. Brussels: European Commission.
European Commission (2021). New EU forest strategy for 2030. Communication from the commission to the European parliament, the council, the European economic and social committee and the committee of the regions, COM(2021) 572 Final. Brussels: European Commission.
European Environment Agency (2018). Examples of components of habitat condition per habitat group and their links with potential typical species elaborated for 2007-2012 reporting. From explanatory notes & guidelines for the period 2007-2012. Appendix 5: Structure and functions and selectin. Copenhagen: European Environment Agency.
European Environment Agency (2020). State of nature in the EU – results from reporting under the nature directives 2013-2018. Luxembourg: Publications Office of the European Union. doi: 10.2800/088178
Evans, D., and Arvela, M. (2011). Assessment and reporting under article 17 of the habitats directive. Explanatory notes & guidelines for the period 2007-2012. Final version. Brussels. Available online at: http://bd.eionet.europa.eu/article17/FAQ (accessed January 28, 2022).
Flaherty, S., Close, A., and Lurz, P. W. W. (2012). The impact of forest stand structure on red squirrel habitat use. Forestry 85, 437–444. doi: 10.1093/FORESTRY/CPS042
Forrester, D. I., and Bauhus, J. (2016). A review of processes behind diversity–productivity relationships in forests. Curr. For. Rep. 2, 45–61. doi: 10.1007/s40725-016-0031-2
Fox, J., Weisberg, S., and Price, B. (2021). car: Companion to applied regression. Thousand Oaks, CA: Sage.
Gao, T., Hedblom, M., Emilsson, T., and Nielsen, A. B. (2014). The role of forest stand structure as biodiversity indicator. For. Ecol. Manag. 330, 82–93. doi: 10.1016/j.foreco.2014.07.007
Grove, S. J. (2002). Tree basal area and dead wood as surrogate indicators of saproxylic insect faunal integrity: A case study from the Australian lowland tropics. Ecol. Indic. 1, 171–188. doi: 10.1016/s1470-160x(01)00016-4
Heiri, C., Wolf, A., Rohrer, L., and Bugmann, H. (2009). Forty years of natural dynamics in Swiss beech forests: Structure, composition, and the influence of former management. Ecol. Appl. 19, 1920–1934. doi: 10.1890/08-0516.1
Hijii, N., Umeda, Y., and Mizutani, M. (2001). Estimating density and biomass of canopy arthropods in coniferous plantations: An approach based on a tree-dimensional parameter. For. Ecol. Manag. 144, 147–157. doi: 10.1016/S0378-1127(00)00367-4
Ishii, H. T., Tanabe, S., and Hiura, T. (2004). Exploring the relationships among canopy structure, stand productivity, and biodiversity of temperate forest ecosystems. For. Sci. 50, 342–355. doi: 10.1093/FORESTSCIENCE/50.3.342
Jactel, H., Gritti, E. S., Drössler, L., Forrester, D. I., Mason, W. L., Morin, X., et al. (2018). Positive biodiversity–productivity relationships in forests: Climate matters. Biol. Lett. 14, 12–15. doi: 10.1098/rsbl.2017.0747
Janowiak, M. K., Swanston, C. W., Nagel, L. M., Brandt, L. A., Butler, P. R., Handler, S. D., et al. (2014). A practical approach for translating climate change adaptation principles into forest management actions. J. For. 112, 424–433. doi: 10.5849/JOF.13-094
Kangas, J., and Kuusipalo, J. (1993). Integrating biodiversity into forest management planning and decision-making. For. Ecol. Manag. 61, 1–15. doi: 10.1016/0378-1127(93)90186-Q
Katholnig, L. (2012). Growth dominance and gini-index in even-aged and in uneven-aged forests. Vienna: University of Natural Resources and Applied Life Sciences.
Keren, S., Svoboda, M., Janda, P., and Nagel, T. A. (2019). Relationships between structural indices and conventional stand attributes in an old-growth forest in southeast Europe. Forests 11:4. doi: 10.3390/F11010004
Kovac, M., Bauer, A., and Ståhl, G. (2014). Merging national forest and national forest health inventories to obtain an integrated forest resource inventory – experiences from Bavaria, Slovenia and Sweden. PLoS One 9:e100157. doi: 10.1371/journal.pone.0100157
Kovac, M., Gasparini, P., Notarangelo, M., Rizzo, M., Cañellas, I., Fernández-de-Uña, L., et al. (2020). Towards a set of national forest inventory indicators to be used for assessing the conservation status of the habitats directive forest habitat types. J. Nat. Conserv. 53:125747. doi: 10.1016/j.jnc.2019.125747
Kovač, M., Kutnar, L., and Hladnik, D. (2016). Assessing biodiversity and conservation status of the natura 2000 forest habitat types: Tools for designated forestlands stewardship. For. Ecol. Manag. 359, 256–267. doi: 10.1016/j.foreco.2015.10.011
Le Roux, D. S., Ikin, K., Lindenmayer, D. B., Manning, A. D., and Gibbons, P. (2015). Single large or several small? Applying biogeographic principles to tree-level conservation and biodiversity offsets. Biol. Conserv. 191, 558–566. doi: 10.1016/J.BIOCON.2015.08.011
Liang, J., Crowther, T. W., Picard, N., Wiser, S., Zhou, M., Alberti, G., et al. (2016). Positive biodiversity-productivity relationship predominant in global forests. Science 354:aaf8957. doi: 10.1126/SCIENCE.AAF8957/SUPPL_FILE/LIANG-SM.PDF
Nagaike, T. (2020). The role of biodiversity concerns in regional and nationwide forest management plans of Japan -do forest plans promote conservation? For. Policy Econ. 118:102250. doi: 10.1016/J.FORPOL.2020.102250
Nascimbene, J., Marini, L., and Nimis, P. L. (2007). Influence of forest management on epiphytic lichens in a temperate beech forest of northern Italy. For. Ecol. Manag. 247, 43–47. doi: 10.1016/j.foreco.2007.04.011
Noreika, N., Helm, A., Öpik, M., Jairus, T., Vasar, M., and Reier, Ü, et al. (2019). Forest biomass, soil and biodiversity relationships originate from biogeographic affinity and direct ecological effects. Oikos 128, 1653–1665. doi: 10.1111/OIK.06693
Noss, R. F. (1999). Assessing and monitoring forest biodiversity: A suggested framework and indicators. For. Ecol. Manag. 115, 135–146. doi: 10.1016/S0378-1127(98)00394-6
Oksanen, J., Simpson, G., Blanchet, F., Kindt, R., Legendre, P., Minchin, P., et al. (2022). vegan: Community ecology package. R package version 2.6–2. Available online at: https://CRAN.R-project.org/package=vegan (accessed December 22, 2022).
Paillet, Y., Bergès, L., HjÄltén, J., Ódor, P., Avon, C., Bernhardt-Römermann, M., et al. (2010). Biodiversity differences between managed and unmanaged forests: Meta-analysis of species richness in Europe. Conserv. Biol. 24, 101–112. doi: 10.1111/j.1523-1739.2009.01399.x
Pastorella, F., and Paletto, A. (2013). Stand structure indices as tools to support forest management: An application in Trentino forests (Italy). J. For. Sci. 59, 159–168. doi: 10.17221/75/2012-jfs
Pommerening, A. (2002). Approaches to quantifying forest structures. Forestry 75, 305–324. doi: 10.1093/forestry/75.3.305
Pommerening, A., and Grabarnik, P. (2019). Individual-based methods in forest ecology and management. First. Cham: Springer Nature Switzerland. doi: 10.1007/978-3-030-24528-3
Qiao, X., Zhang, N., Zhang, C., Zhang, Z., Zhao, X., and von Gadow, K. (2021). Unravelling biodiversity–productivity relationships across a large temperate forest region. Funct. Ecol. 35, 2808–2820. doi: 10.1111/1365-2435.13922/SUPPINFO
Ranius, T., and Jansson, N. (2000). The influence of forest regrowth, original canopy cover and tree size on saproxylic beetles associated with old oaks. Biol. Conserv. 95, 85–94. doi: 10.1016/S0006-3207(00)00007-0
Regione del Veneto – Agricoltura e Foreste (2020). Pianificazione forestale. Available online at: https://www.regione.veneto.it/web/agricoltura-e-foreste/programmazione-silvopastorale (accessed September 11, 2020).
Rete Rurale Nazionale (2019). RaF Italia 2017-2018 – Rapporto sullo stato delle foreste e del settore forestale in Italia. Rome: Rete Rurale Nazionale.
Rondeux, J., Bertini, R., Bastrup-Birk, A., Corona, P., Latte, N., McRoberts, R. E., et al. (2012). Assessing deadwood using harmonized national forest inventory data. For. Sci. 58, 269–283. doi: 10.5849/forsci.10-057
Schall, P., Schulze, E. D., Fischer, M., Ayasse, M., and Ammer, C. (2018). Relations between forest management, stand structure and productivity across different types of central European forests. Basic Appl. Ecol. 32, 39–52. doi: 10.1016/J.BAAE.2018.02.007
Sitzia, T., Campagnaro, T., Dainese, M., Cassol, M., Dal Cortivo, M., Gatti, E., et al. (2017). Contrasting multi-taxa diversity patterns between abandoned and non-intensively managed forests in the southern Dolomites. IForest 10, 845–850. doi: 10.3832/ifor2181-010
Sitzia, T., Piazzi, C., Barazzutti, G., and Campagnaro, T. (2018). Abandonment of timber harvesting favours European beech over silver fir: Evidence from Val Tovanella nature reserve in the southern Dolomites (Northern Italy). Res. Eco.Mont 10, 17–27. doi: 10.1553/eco.mont-10-2s17
Smith, G. F., Gittings, T., Wilson, M., French, L., Oxbrough, A., O’Donoghue, S., et al. (2008). Identifying practical indicators of biodiversity for stand-level management of plantation forests. Biodivers. Conserv. 17, 991–1015. doi: 10.1007/S10531-007-9274-3/TABLES/9
Sterba, H. (2008). Diversity indices based on angle count sampling and their interrelationships when used in forest inventories. Forestry 81, 587–597. doi: 10.1093/forestry/cpn010
Szmyt, J. (2014). Spatial statistics in ecological analysis: From indices to functions. Silva Fenn. 48, 1–31. doi: 10.14214/sf.1008
Trentanovi, G., Campagnaro, T., Rizzi, A., and Sitzia, T. (2018). Synergies of planning for forests and planning for natura 2000: Evidences and prospects from northern Italy. J. Nat. Conserv. 43, 239–249. doi: 10.1016/j.jnc.2017.07.006
Zeileis, A., Kleiber, C., and Jackman, S. (2008). Regression models for count data in R. J. Stat. Softw. 27, 1–25. doi: 10.18637/jss.v027.i08
Keywords: protected areas, forest management, stand structure, nature conservation, Habitats Directive, Natura 2000
Citation: Alterio E, Campagnaro T, Sallustio L, Burrascano S, Casella L and Sitzia T (2023) Forest management plans as data source for the assessment of the conservation status of European Union habitat types. Front. For. Glob. Change 5:1069462. doi: 10.3389/ffgc.2022.1069462
Received: 13 October 2022; Accepted: 19 December 2022;
Published: 06 January 2023.
Edited by:
Claudia Cocozza, University of Florence, ItalyReviewed by:
Taras Parpan Парпан, Ukrainian Research Institute of Mountain Forestry, UkraineJarosław Socha, University of Agriculture in Krakow, Poland
Copyright © 2023 Alterio, Campagnaro, Sallustio, Burrascano, Casella and Sitzia. This is an open-access article distributed under the terms of the Creative Commons Attribution License (CC BY). The use, distribution or reproduction in other forums is permitted, provided the original author(s) and the copyright owner(s) are credited and that the original publication in this journal is cited, in accordance with accepted academic practice. No use, distribution or reproduction is permitted which does not comply with these terms.
*Correspondence: Tommaso Sitzia,  dG9tbWFzby5zaXR6aWFAdW5pcGQuaXQ=