 Zhi Hu1,2
 Huanjiong Wang
 Junhu Dai
95% of researchers rate our articles as excellent or good
Learn more about the work of our research integrity team to safeguard the quality of each article we publish.
Find out more
ORIGINAL RESEARCH article
Front. For. Glob. Change , 30 November 2022
Sec. Forest Ecophysiology
Volume 5 - 2022 | https://doi.org/10.3389/ffgc.2022.1061191
This article is part of the Research Topic Changing Seasons: How is Global Warming Affecting Forest Phenology? View all 5 articles
Woody plant species in temperate regions must withstand a cold winter and freezing events through cold acclimation and dormancy in autumn and winter. However, how seasonal changes in dormancy depth and cold hardiness affect the frost risk of temperate species is unclear because few studies have assessed dormancy depth and cold hardiness simultaneously. In this study, an experiment was conducted to estimate the dormancy depth and cold hardiness of five common woody temperate plant species during the winter of 2018/2019 in Beijing, China. Twigs of each species were collected at different dates during winter and the timing of budburst was monitored under the same forcing conditions. The dormancy depth was quantified as growing degree day (GDD) requirements of spring events. Simultaneously, the cold hardiness of buds at each sampling date was determined based on the electrical conductivity of the holding solution. Two indices (chilling accumulation and cold hardiness index) were used to simulate the past dynamics of dormancy depth, spring phenology, and cold hardiness from 1952 to 2021. The maximum dormancy depth of the study species was observed between early October and early December, and thereafter decreased exponentially. The cold hardiness peaked in mid-winter (end of December) through cold acclimation and thereafter decreased in spring (deacclimation). During the past 70 years, the budburst date (first flowering date or first leaf date) of five species was estimated to have advanced significantly, and dormancy depth in early spring was predicted to have increased owing to the warming-associated decrease in chilling accumulation. However, cold hardiness has decreased because of weakened acclimation and accelerated deacclimation under a warming climate. The frost risk before and after budburst remained unchanged because of the reduction in occurrence and severity of low-temperature events and earlier late spring frosts. The present methods could be generalized to estimate and predict the seasonal changes in dormancy depth and cold hardiness of temperate species in the context of climate change.
Perennial plants in a temperate region must adapt to a climate with significant seasonal variation so as to complete their growth and development processes. Cold temperatures in winter not only affect the metabolic processes of plants (Sakai and Weiser, 1973; Kreyling et al., 2015; Pardee et al., 2017) but also cause formation of intracellular ice crystals in plant tissues (Larcher, 2003) and may lead to cell death. To adapt to seasonal changes in climate, temperate plants have evolved specific developmental rhythms and phenology (Basler and Körner, 2014). Recent climatic changes have dramatically altered plant phenophases, such as leaf unfolding, flowering, and leaf senescence (Zohner and Renner, 2014; Ge et al., 2015; Menzel et al., 2020). With phenological change (e.g., earlier budburst), the risk of frost damage may increase accordingly (Hänninen and Tanino, 2011; Richardson et al., 2018). Therefore, quantifying the seasonal changes in dormancy depth and cold hardiness is important for accurately assessing the potential cold damage to plants under climate change.
To cope with freezing temperatures, temperate deciduous plants formate terminal buds in autumn and enter a state of dormancy in winter, with no active growth and low metabolic activity (Anderson et al., 2010). There are two primary phases in the dormant period of buds (Junttila and Hänninen, 2012). Triggered by a shortening photoperiod and lowering temperatures in autumn, buds first enter a state of endodormancy, during which the onset of growth is prevented by endogenous signals (Lang et al., 1987). A prolonged exposure to chilling temperature could help to release endodormancy. When the chilling is fulfilled, buds reach a state of ecodormancy, in which budburst and spring growth are prevented by unfavorable environmental factors. Budburst occurs when ecodormant buds are exposed to forcing temperatures for a period of time.
Along with changes in status of dormancy are the changes in plant tolerance against freezing temperatures. Cold acclimation leads to the development of cold hardiness in plants. The shorter photoperiod in association with lower temperatures in autumn initiate and strengthen cold acclimation (e.g., Arora et al., 2003; Beck et al., 2004; Kalberer et al., 2006). Upon exposure to warmer temperatures in spring, plants lose the cold hardiness acquired during acclimation by the process of deacclimation (Flynn and Wolkovich, 2018; Roeber et al., 2022).
Dormancy induction and cold acclimation in autumn are both driven by short photoperiods and low temperatures. However, seasonal changes in dormancy depth and cold hardiness may not be fully synchronized, because low temperatures in winter reduce dormancy depth but increase cold hardiness. The maximum dormancy depth may occur shortly after dormancy induction, whereas the maximum cold hardiness generally occurs during the coldest period of winter (Charrier et al., 2011). A warming climate may reduce the cold hardiness of plants and cause plants to be more sensitive to freezing temperatures (Tao et al., 2021). Other than freezing temperatures prior to budburst, the risk of cold damage after budburst (also known as false spring) may be altered due to the earlier budburst under a warming climate (Gu et al., 2008; Ault et al., 2013). Given that few studies have assessed dormancy depth and cold hardiness of temperate plants simultaneously, how seasonal changes in dormancy depth and cold hardiness affect frost risk is unclear.
In this study, a controlled experiment was conducted on five temperate deciduous plants in Beijing, China, during the winter of 2018/2019 to assess seasonal changes in dormancy depth and cold hardiness. Two bioclimatic indices (chilling accumulation and cold hardiness index) were used to describe the effects of environmental factors on dormancy depth and cold hardiness, respectively. The trends in dormancy depth and cold hardiness from 1952 to 2021 were estimated using the bioclimatic indices calculated from historical climate data. Furthermore, historical frost risk before and after budburst was determined using the estimated cold hardiness and budburst dates. The aims of this study were (1) to evaluate the seasonal variations in dormancy depth and cold hardiness in temperate plants and (2) to assess the risk of exposure of temperate species to frost events over the last seven decades.
Five deciduous broadleaved species of two trees (Fraxinus chinensis and Salix babylonica) and three shrubs (Jasminum nudiflorum, Forsythia suspensa, and Syringa oblata), widely distributed in temperate regions of China, were selected for the study. The sampling site was located in the Olympic Forest Park in northern Beijing (40°01′3.00″N, 116°23′2.98″E). Meteorological data (daily minimum and maximum temperatures and precipitation) for the period 1951–2021 in the study area were obtained from the China Meteorological Data Service Center.1 The annual mean temperature and annual total precipitation in Beijing are 12.47°C and 586.92 mm (average for 1981–2010), respectively, and a trend for significant warming in the study area over the past 70 years is apparent (Figure 1A).
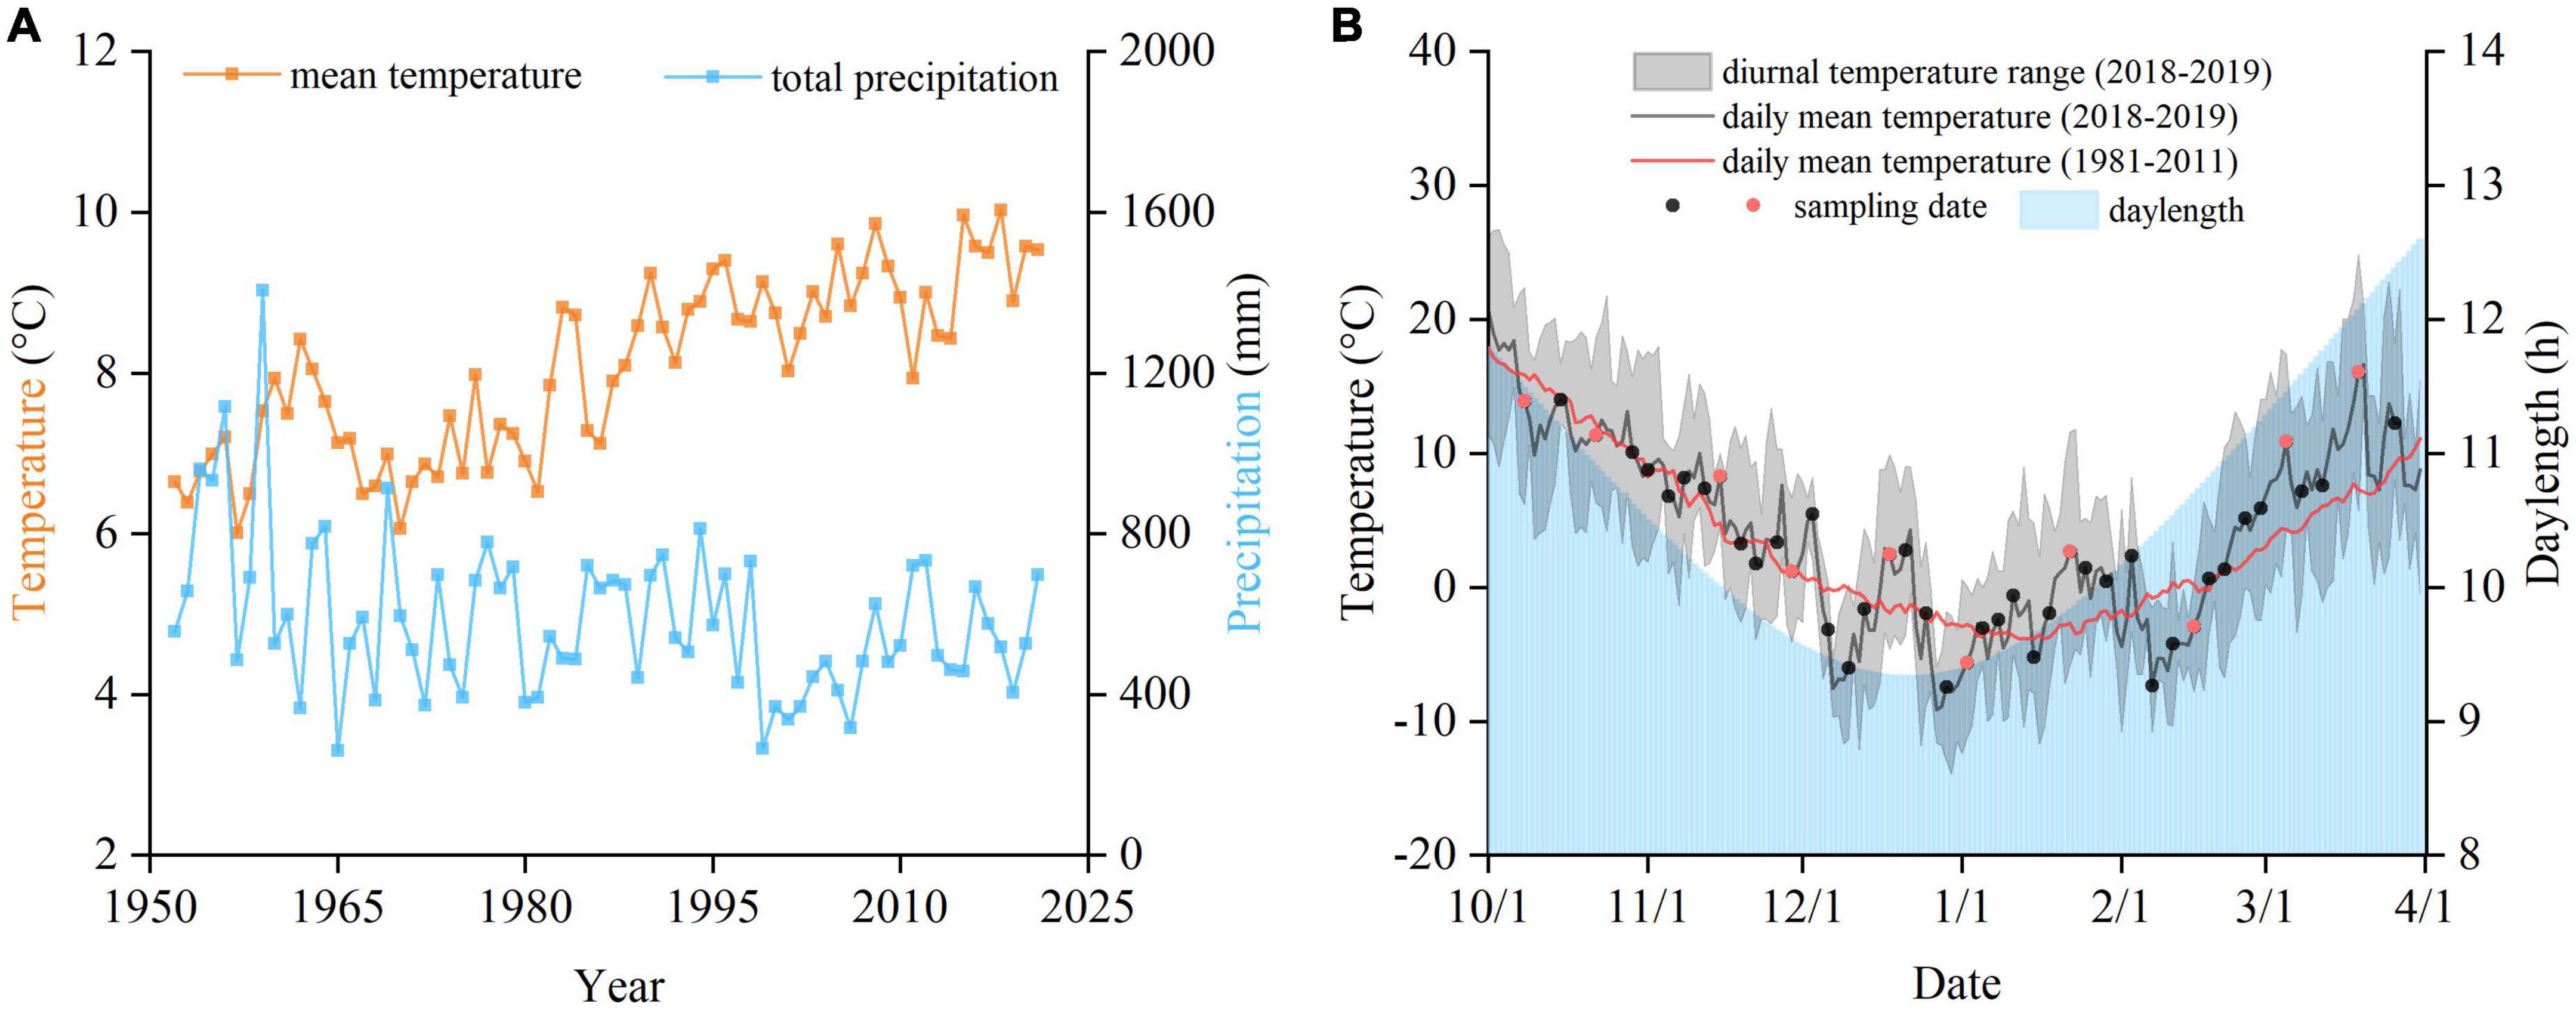
Figure 1. Meteorological data for autumn–winter–spring (September to May) of the study area. (A) Mean temperature and annual total precipitation from 1952 to 2021. (B) Temperature and daylength during the experimental period, and sampling dates for measurement of dormancy depth (black circles) and for measurement of both dormancy depth and cold hardiness (red circles).
Twigs of each species were collected from 8 October, 2018 to 26 March, 2019. To assess the seasonal change in dormancy depth, twigs were sampled every 3–4 days, resulting in 42 collections in total. Because the pre-treatment time for measuring cold hardiness was longer than that for estimating dormancy depth, separate samples for determination of cold hardiness were collected every 15–20 days, resulting in 10 collections in total (Figure 1B).
Five individuals of each species were selected for measurement of dormancy depth. One twig (bearing winter buds) approximately 20–30 cm long was collected from each individual on each sampling date. Samples were transported to the laboratory immediately after collection. We placed five twigs from each species in a glass bottle (0.25 L) containing tap water and transferred the bottles to growth chambers (Ningbo Jiangnan Instrument Factory). The growth chambers were set to day/night temperatures of 25°C/15°C and a photoperiod of 14 h/10 h (light/dark) with a flux density of 100 μmol⋅m–2⋅s–1. A tray filled with water was placed inside the growth chamber to ensure that the relative humidity was maintained at approximately 70%. To prevent blockage of the xylem in the twigs, the base of the stems was pruned, and the water in the bottles was replaced weekly.
The development of each twig was monitored every 2 days. The first leaf date (FLD) and first flowering date (FFD) were recorded. The FLD was defined as the date when at least one leaf in a twig was fully unfolded, corresponding to BBCH 11. The FFD was defined as the date when the first flower on a twig had fully opened, corresponding to BBCH 60 (Meier, 2001). We only investigated the first spring event of each species. For two species that flowered earlier than leaf unfolding (J. nudiflorum and F. suspensa), the FFD was recorded. For the other three species (F. chinensis, S. babylonica, and S. oblata), the FLD was recorded.
The growing degree day (GDD) requirement of FFD or FLD in the growth chamber was used to represent the dormancy depth (Dantec et al., 2014) or to assess the relationship between chilling and GDD requirement (Laube et al., 2014). The GDD requirement was calculated as the accumulation of temperature greater than a certain threshold. For twigs sampled before 1 January, 2019, only the GDD in the growth chamber was calculated because the ambient temperature was below 5°C, whereas for twigs sampled after this date, the GDD already accumulated outdoors was also included. The equation used to calculate GDD was:
where GDDR represents the GDD requirement of FLD and FFD; t1 is the date when GDD starts to accumulate (1 January, 2019); ts is the sampling date; tf is the date of onset of FLD or FFD averaged from five twigs; To(t) is the daily mean temperature outdoors at date t; Tg(t) is the daily mean temperature inside the growth chamber, which was 20.83°C based on the day/night temperature and photoperiod set in the growth chamber; and Tb is the threshold temperature for GDD, which was set at 5°C based on previous studies (Kramer, 1994; Peaucelle et al., 2019; Wang et al., 2020a). All twigs were observed for 55 days after the sampling date (corresponding to 871°C⋅days, i.e., the average GDD from January to May in Beijing).
To describe the seasonal variation in dormancy depth, the variation in GDDR (average of five individuals per species) with sampling date was plotted. Based on the shape of the curve, an exponential function was used to fit the changes in GDDR (after the date of deepest dormancy):
where a, b, and c are parameters, and date is the number of days since 1 October, 2018. The parameters were estimated using the least-squares method.
Previous studies showed that the GDDR of spring events is associated with chilling accumulation (CA) during winter (Fu et al., 2014; Wang et al., 2020b). Therefore, CA can be used as a bioclimatic index of dormancy depth. CA was calculated with the equation:
where CA is the chilling accumulation. t0 is the date when CA started to accumulate (1 November, 2018), ts is the sampling date. To(t) is the daily mean temperature at date t.
An exponential function between CA and GDDR was established for each species:
where a1, b1, and c1 are parameters estimated using the least-squares method.
For each species, 30 twigs bearing dormant buds from 5 individuals were collected. The collected samples were randomly divided into six groups and preserved in plastic bags. The collected samples were first washed with deionized water. Subsequently, five groups were placed in programmable freezers each maintained at a different target temperature, and one group was placed in a 5°C refrigerator (living control). The target temperatures of the five programmable freezers were adjusted according to the changes in cold hardiness (Table 1; Lenz et al., 2013; Vitasse et al., 2014; Vitra et al., 2017). All programmable freezers were cooled from 5°C at a rate of 6°C h–1 until the target temperature was attained. The samples were kept at the target temperature for 4 h and then returned to 5°C at a rate of 6°C h–1. Finally, the dormant buds were removed from the twigs and placed in test tubes with 25 mL deionized water. The test tubes were placed in the refrigerator at 5°C for 24 h. The conductivity (S1, i.e., electrolyte leakage after treatment) of the water in the test tubes was measured with a conductivity meter, and then the electrical conductivity (S) was measured again after autoclaving the samples at 120°C for 30 min. The relative conductivity (E) was calculated by combining the conductivity of deionized water (S0) with the following equation:
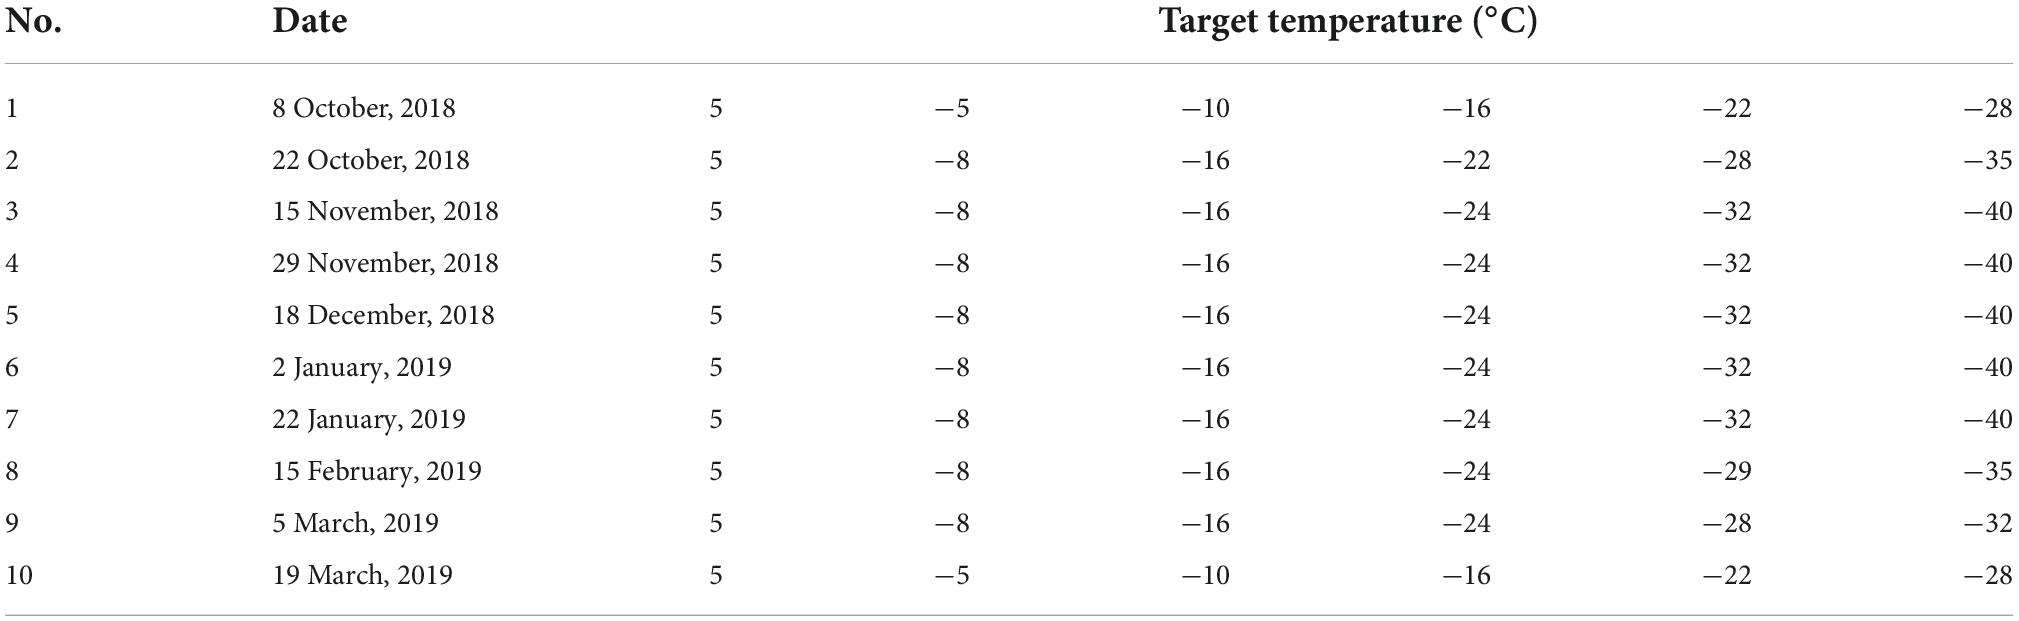
Table 1. Target temperatures of each treatment at different sampling dates.
The relationship between E and the target temperature (T) was analyzed by logistic regression:
where E(T) is the relative conductivity at temperature T, and i, j, and K are model parameters. The temperature at a relative conductivity of 50%, i.e., the semi-lethal temperature (LT50), represents cold hardiness (Vitasse et al., 2014).
To describe the seasonal variation in cold hardiness, the cold hardiness (LT50) of each species (averaged from five individuals) with sampling dates was plotted. Because the cold hardiness initially increased and thereafter decreased during the study period, a double logistic function was used to fit the curves:
where x is the sampling date, y is the cold hardiness at date x, and k0, k1, and k2 are parameters estimated using a least-squares method.
To simulate the seasonal variation in cold hardiness, the cold hardiness model proposed by Leinonen (1996) was modified and a normalized cold hardiness index (CHI) was constructed. CHI = 0 represents the lowest cold hardiness and CHI = 1 represents the strongest cold hardiness. We use [R(t)] to represent the CHI on day t. [R(t)] on day t depends on the CHI on the preceding day [R(t - 1)], the potential cold hardiness on day t [Rc(t)] and on day t - 1 [Rc(t - 1)]:
where w is the weight of potential cold hardiness Rc(t) on actual cold hardiness. w was set to 5, because the R(t) corresponded better with the measured cold hardiness when w = 5 compared with other values (2, 3, 4, and 6, 7, 8). The calculation of CHI started on 1 October. Because the outdoor temperature was still approximately 18°C on 1 October, it was assumed that cold acclimation had not started yet. The R(t) on 1 October was set to its minimum value (zero), and then R(t) on the next day was calculated with a daily scale.
The potential cold hardiness [Rc(t)] was determined by the effect of temperature [RT(t)], the effect of photoperiod [Rp(t)], and hardening capacity (CR). The process of cold acclimation before the winter solstice is driven by temperature and photoperiod (Kalberer et al., 2007), whereas deacclimation is mainly driven by temperature (Leinonen et al., 1997). Therefore, Rc(t) was calculated as:
where RT(t) is the effect of temperature on cold hardiness, and RP(t) is the effect of photoperiod on cold hardiness. The equations for calculation of RT(t) and RP(t) are:
where Tup is the maximum temperature limit, which was set to 10°C, Tlow is the minimum temperature limit, which was set to −16°C (Leinonen, 1996), and T(t) is the daily mean temperature on date t.
where Pup is the maximum daylength limit, which was set to 14 h, Plow is the minimum daylength limit, which was set to 8 h, and P(t) is the photoperiod on date t, which is calculated based on the latitude and the day of the year (Forsythe et al., 1995).
CR is assumed to increase linearly from 1 October to the winter solstice and thereafter decrease linearly from 1 to 0 from the winter solstice to the onset of spring events. Thus, the equation for calculation of CR is:
Regarding the initial value of CR on 1 October, a set of values (0, 0.1, 0.2, 0.3, and 0.4) were tested, and the correlation coefficient between CHI and measured cold hardiness was largest at CR = 0.2. Therefore, the initial value of CR was set to 0.2.
After calculation of the daily CHI for each species, a linear regression model was calibrated to simulate cold hardiness (CH):
where m is the slope and n is the intercept, estimated with the least squares method. CH is the cold hardiness measured in the experiment. CHI is the daily cold hardiness index [R(t)].
Using the daily mean temperature data during 1952–2021, CA from 1 November to each day until the end of April was calculated for each species based on Equation 3. The course of dormancy depth (GDDR) over the last 70 years was estimated through Equation 4, and the interannual spring phenology was simulated as the date when GDDR was attained. We also obtained the long-term FLD and FFD data of five species in Beijing from the China Phenological Observation Network (CPON) during 1963–2018. The historical phenological data were collected at the Summer Palace, about 12 km from the sampling site of the experiment. We compared the simulated spring phenology with the long-term observed data to verify the robustness of phenological simulation.
The daily CHI from 1 October to 30 April was calculated for each year and Equation 13 was used to transform CHI into cold hardiness of each species. Finally, the interannual changes in dormancy depth (on 1 March, because after this date the daily mean temperature is always >5°C) and maximum cold hardiness were analyzed.
Based on the simulated cold hardiness, we identified historical frost events (1952–2021) from the previous winter (1 November) to spring as the dates when daily minimum temperatures equal or below the estimated cold hardiness.
Furthermore, we adopted a widely used false spring index (FSI) to quantify the likelihood of damage to occur after budburst (Marino et al., 2011; Chamberlain et al., 2019).
where LFD is the last frost date in spring (the last day when daily minimum temperature <-2.2°C). BBD represents the budburst date, i.e., FLD or FFD of each species. Negative values indicate no-risk situations, whereas a positive FSI indicates cold damage occurred to young flowers or leaves.
For most species, budburst did not occur in the earliest-collected samples with sufficient GDD (871°C⋅days, equivalent to the outdoor GDD from January to May in Beijing), indicating that the twigs were in the maximum dormancy. For S. babylonica, the samples collected before 21 October underwent budburst, indicating that dormancy induction was not complete. However, budburst failed to occur in the samples collected between 21 October and 8 November, indicating that the buds entered deep dormancy during this period. Overall, maximum dormancy depth generally occurred between 1 October and 3 December. Thereafter, all species showed a clear exponential decrease in dormancy depth (Figure 2). An exponential function was used to fit the change in GDDR with sampling dates. This function simulated the variation in dormancy depth with R2 ranging from 0.59 (F. chinensis) to 0.94 (F. suspensa). Therefore, the exponential function accurately reflected the change in dormancy depth over time.
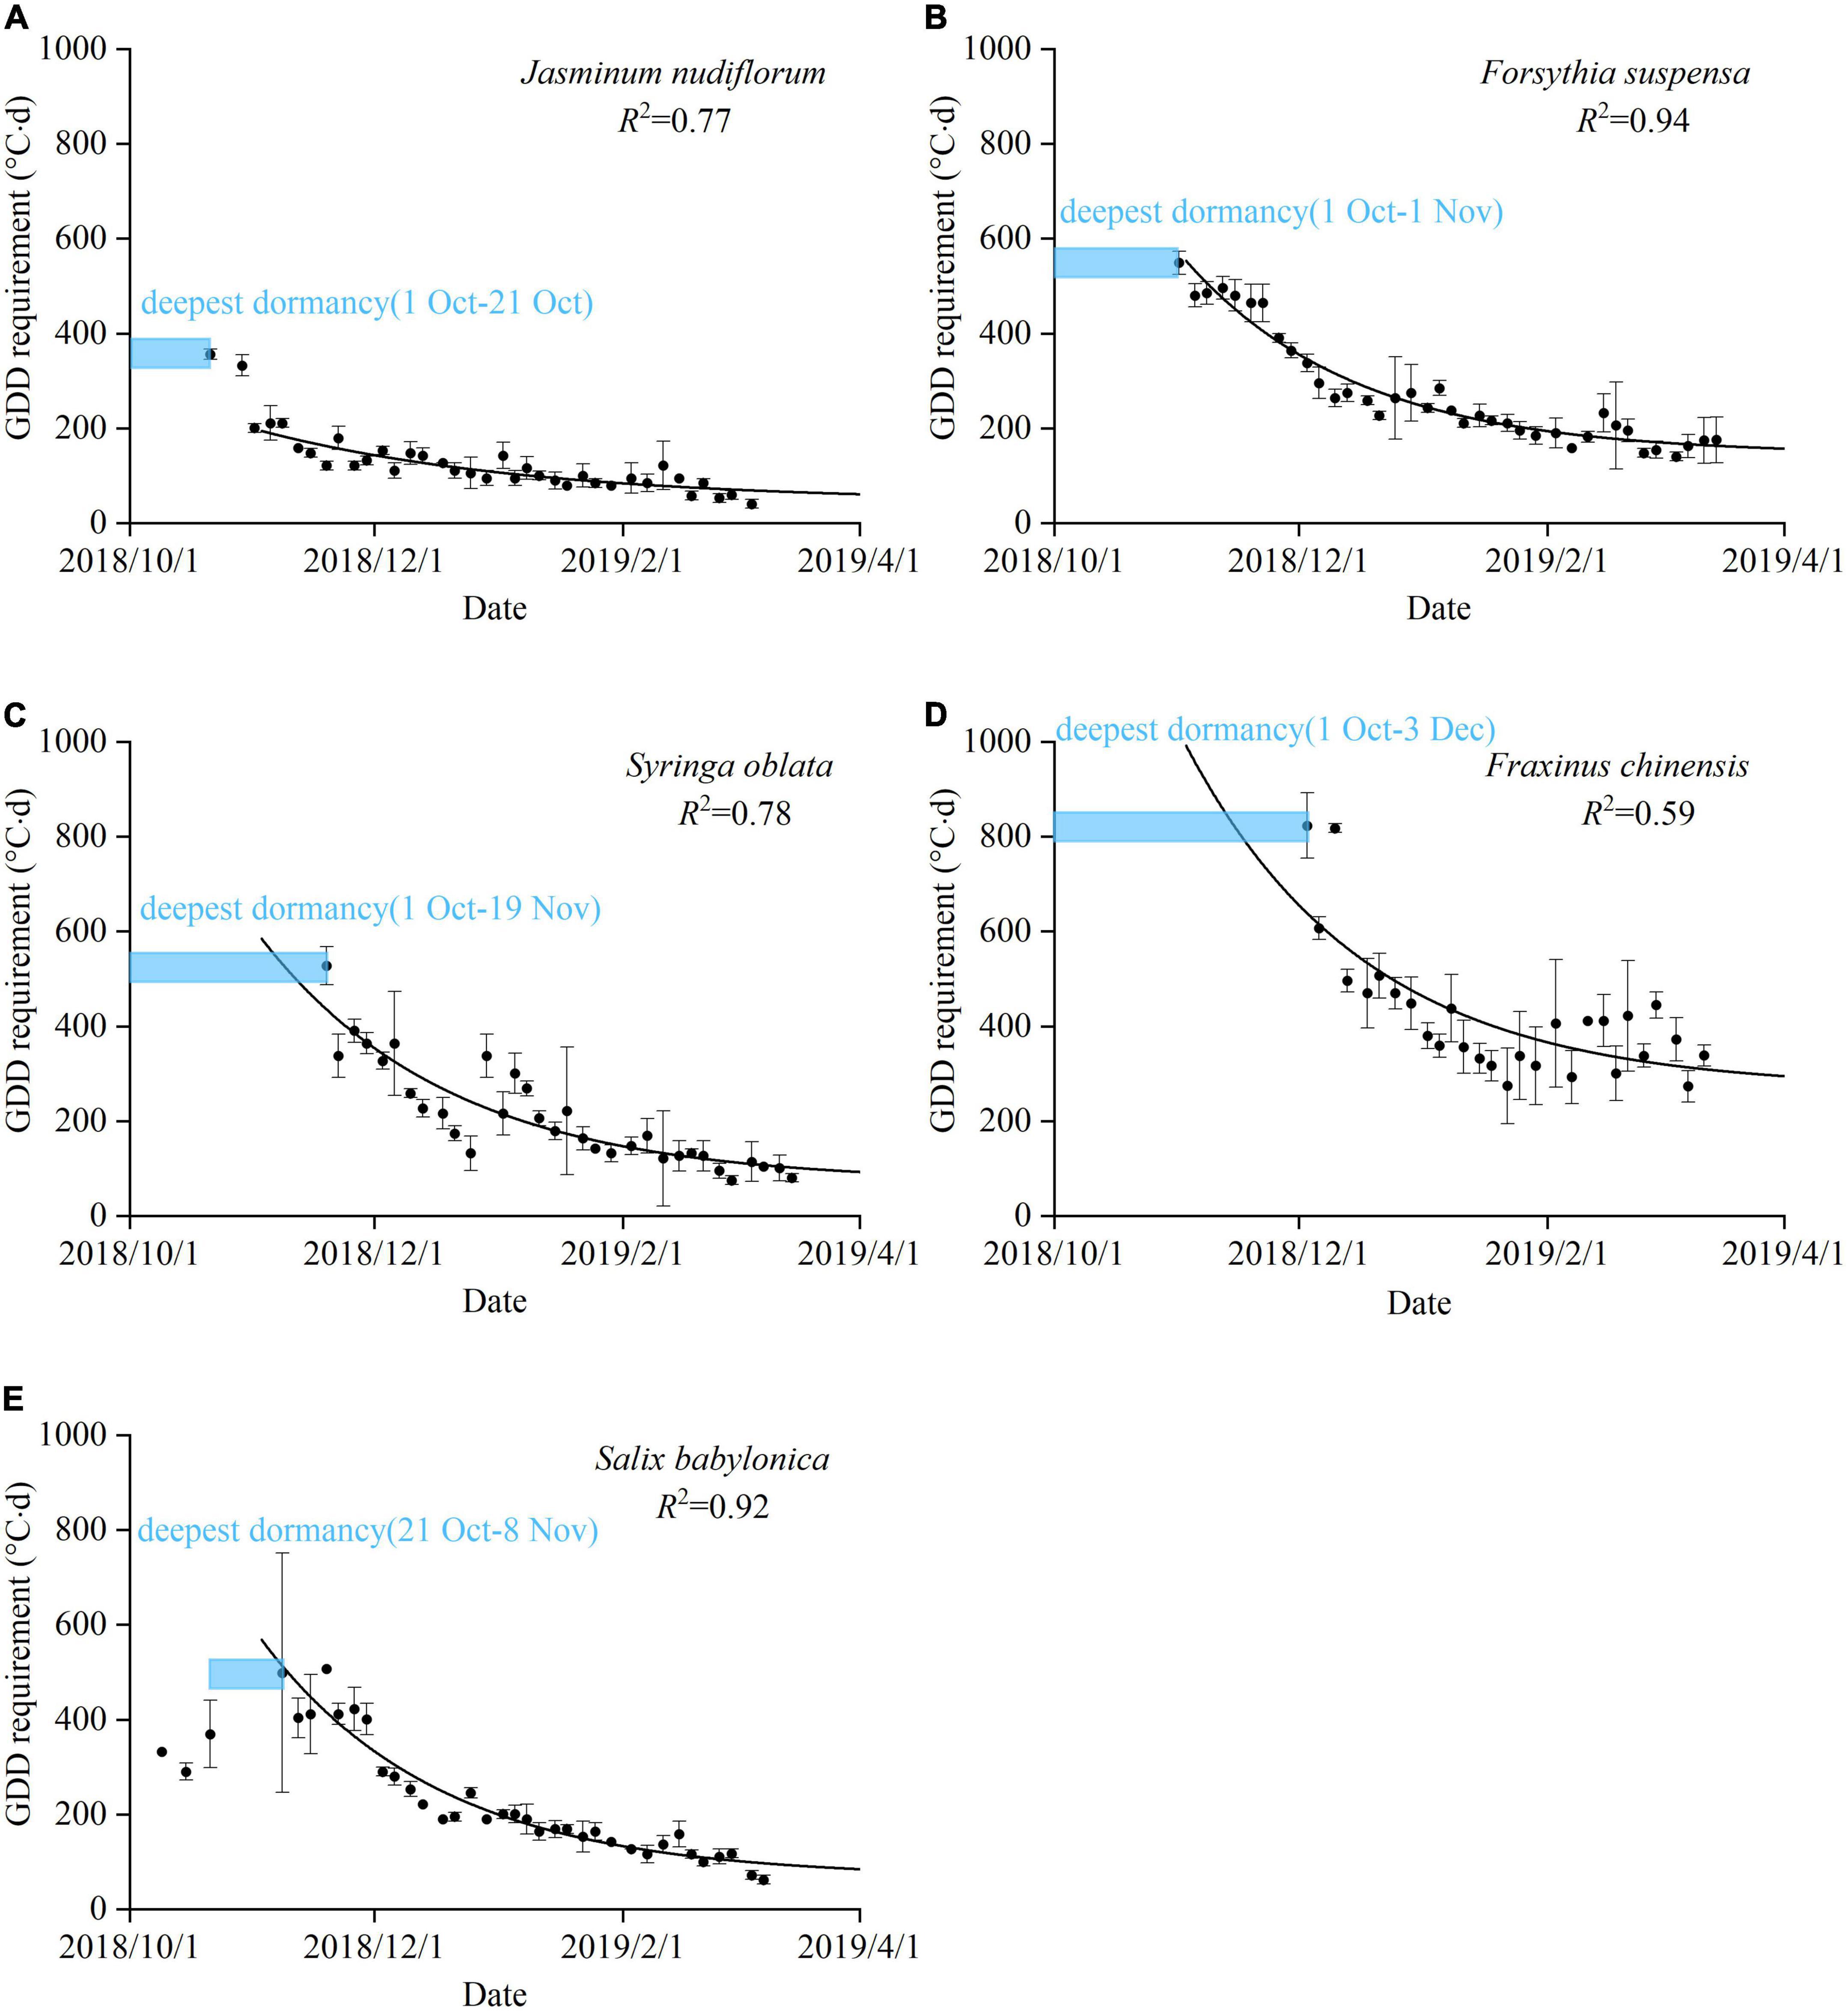
Figure 2. Seasonal variation in dormancy depth for five species. A blue box indicates the period of maximum dormancy depth, i.e., budburst did not occur even with sufficient growing degree days (GDD = 871°C⋅days, equivalent to the GDD from January to May in Beijing). Black dots: the GDD requirement (GDDR) of plants observed in the experiment. Error bars: standard deviation of five twigs. R2: coefficient of determination for the exponential function. (A) J. nudiflorum, (B) F. suspensa, (C) S. oblata, (D) F. chinensis, and (E) S. babylonica.
The CA was correlated negatively and exponentially with GDDR (Figure 3). For all species, the GDDR decreased rapidly with increase in CA. However, when CA attained a certain threshold, the effect of CA on GDDR decreased. The R2 of the exponential function between GDDR and CA ranged from 0.61 to 0.95, indicating that CA was a good indicator of dormancy depth.
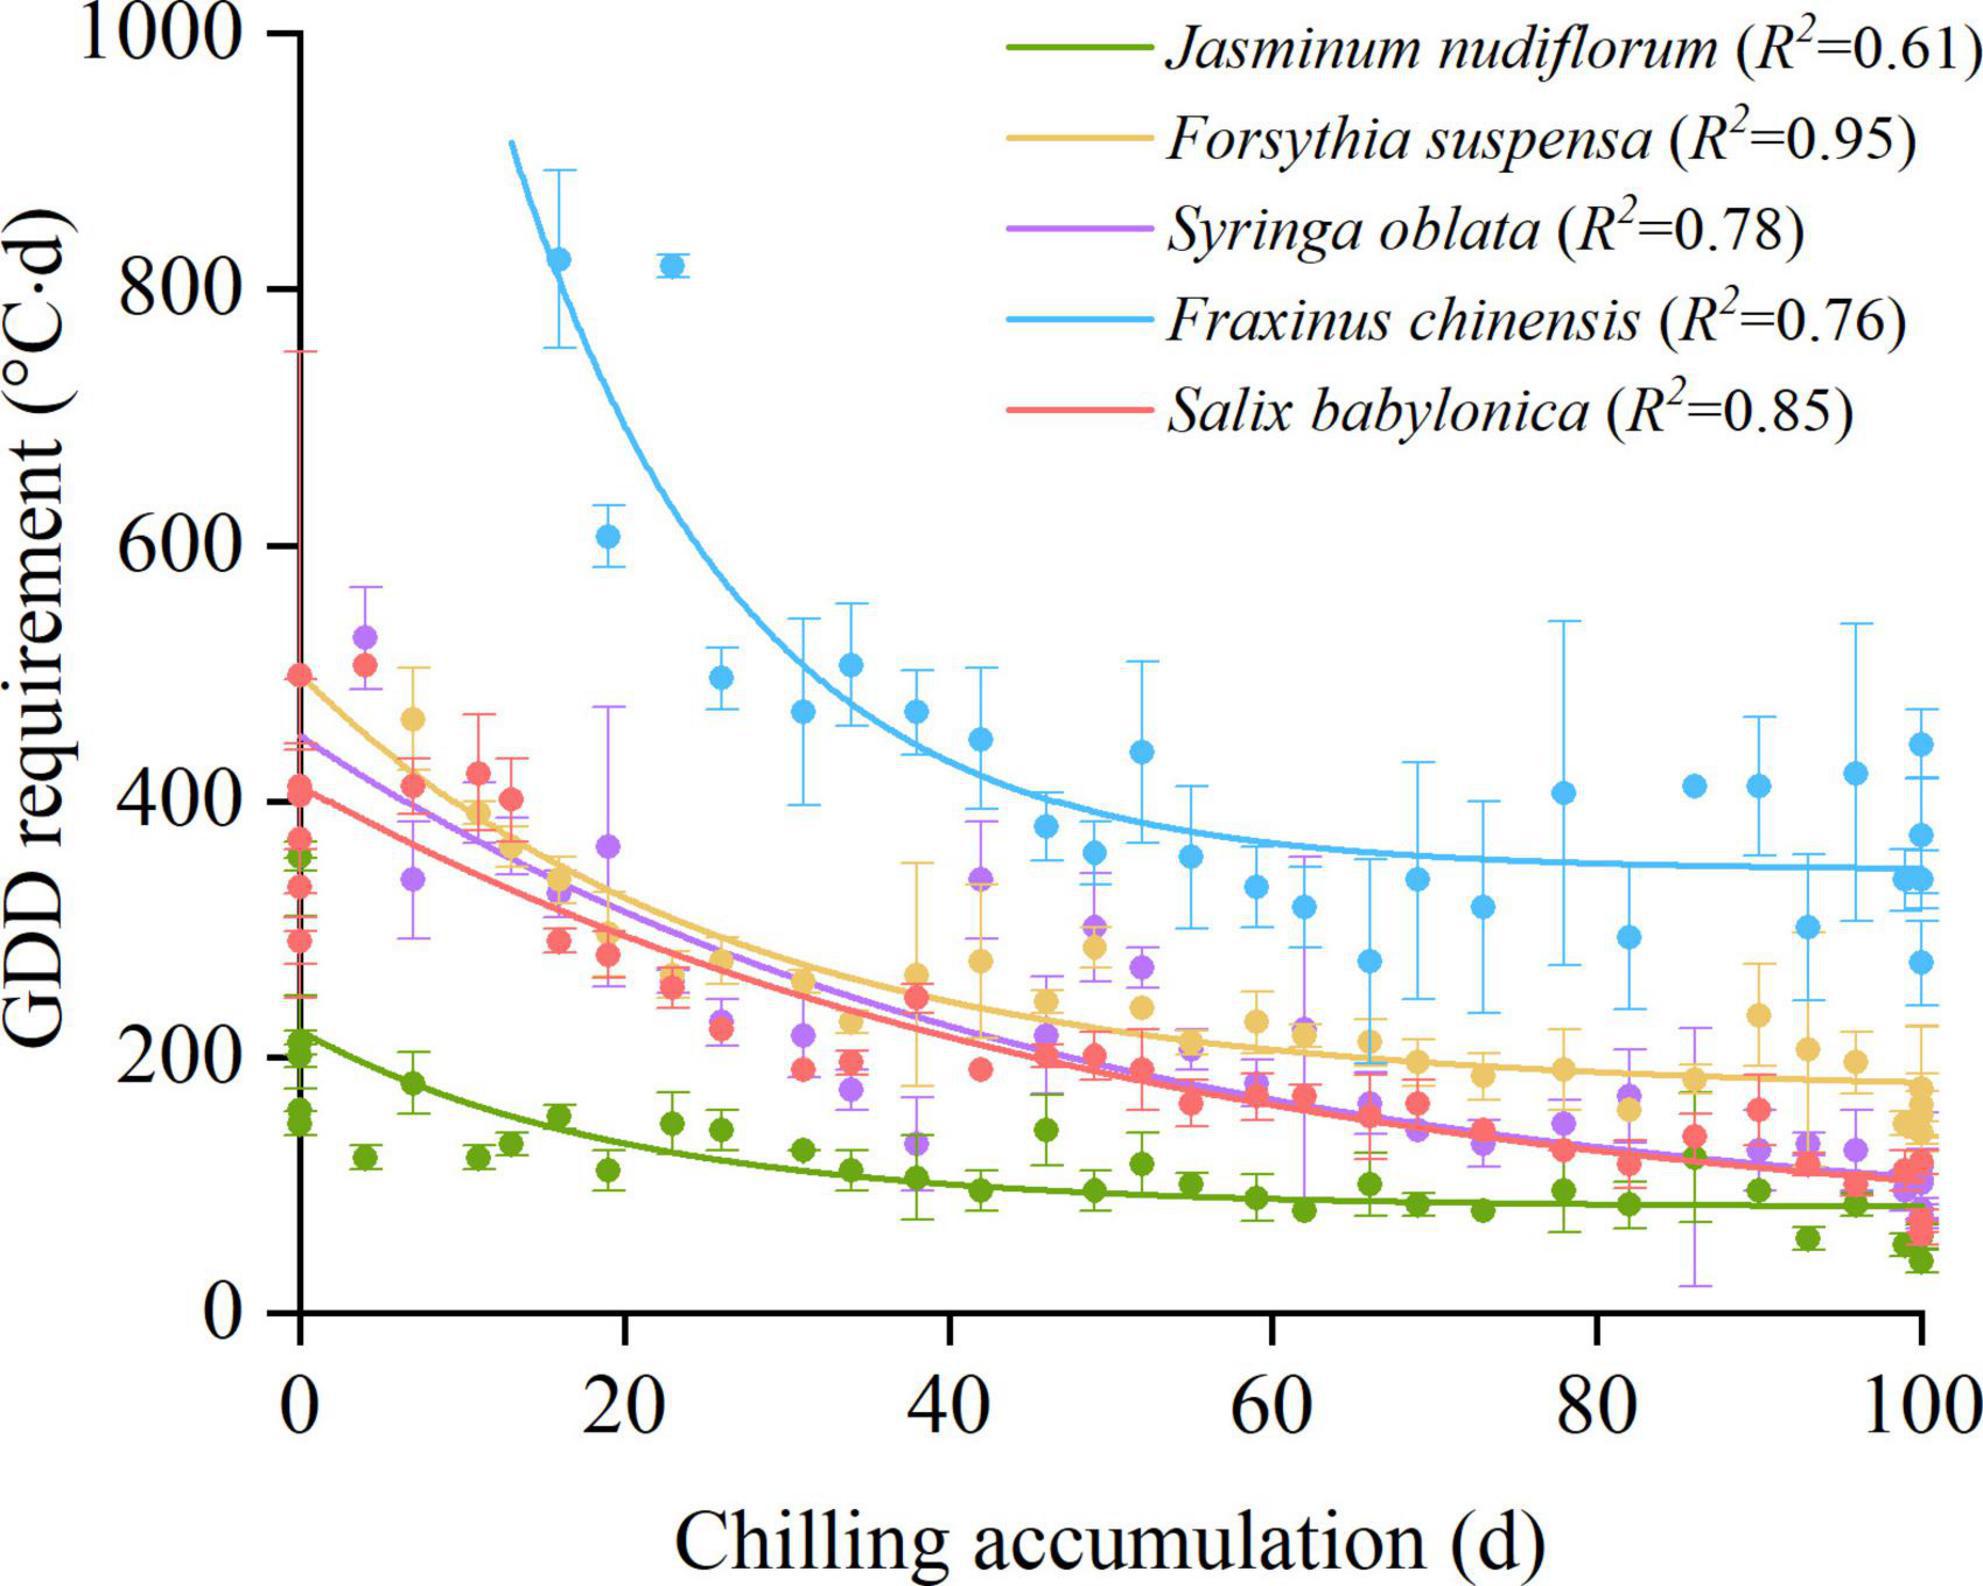
Figure 3. Relationships between chilling accumulation and growing degree day requirements (GDDR). Error bars: standard deviation.
The cold hardiness of all species initially increased from autumn to mid-winter and thereafter decreased from mid-winter to spring (Figure 4). The maximum cold hardiness was observed between 29 November (S. babylonica) and 22 January (J. nudiflorum and F. chinensis). F. chinensis had the strongest cold hardiness of −11.45°C on 1 October, which increased to −27.68°C on 23 December. Jasminum nudiflorum had the weakest cold hardiness of −5.16°C on 1 October, which only increased to −18.34°C on 30 December. The temporal variation in cold hardiness for the five species was expressed by a double logistic function with R2 ranging from 0.83 (J. nudiflorum and F. chinensis) to 0.91 (S. oblata). The maximum cold hardiness (Figure 4) was observed later than the maximum dormancy depth (Figure 2) for all species.
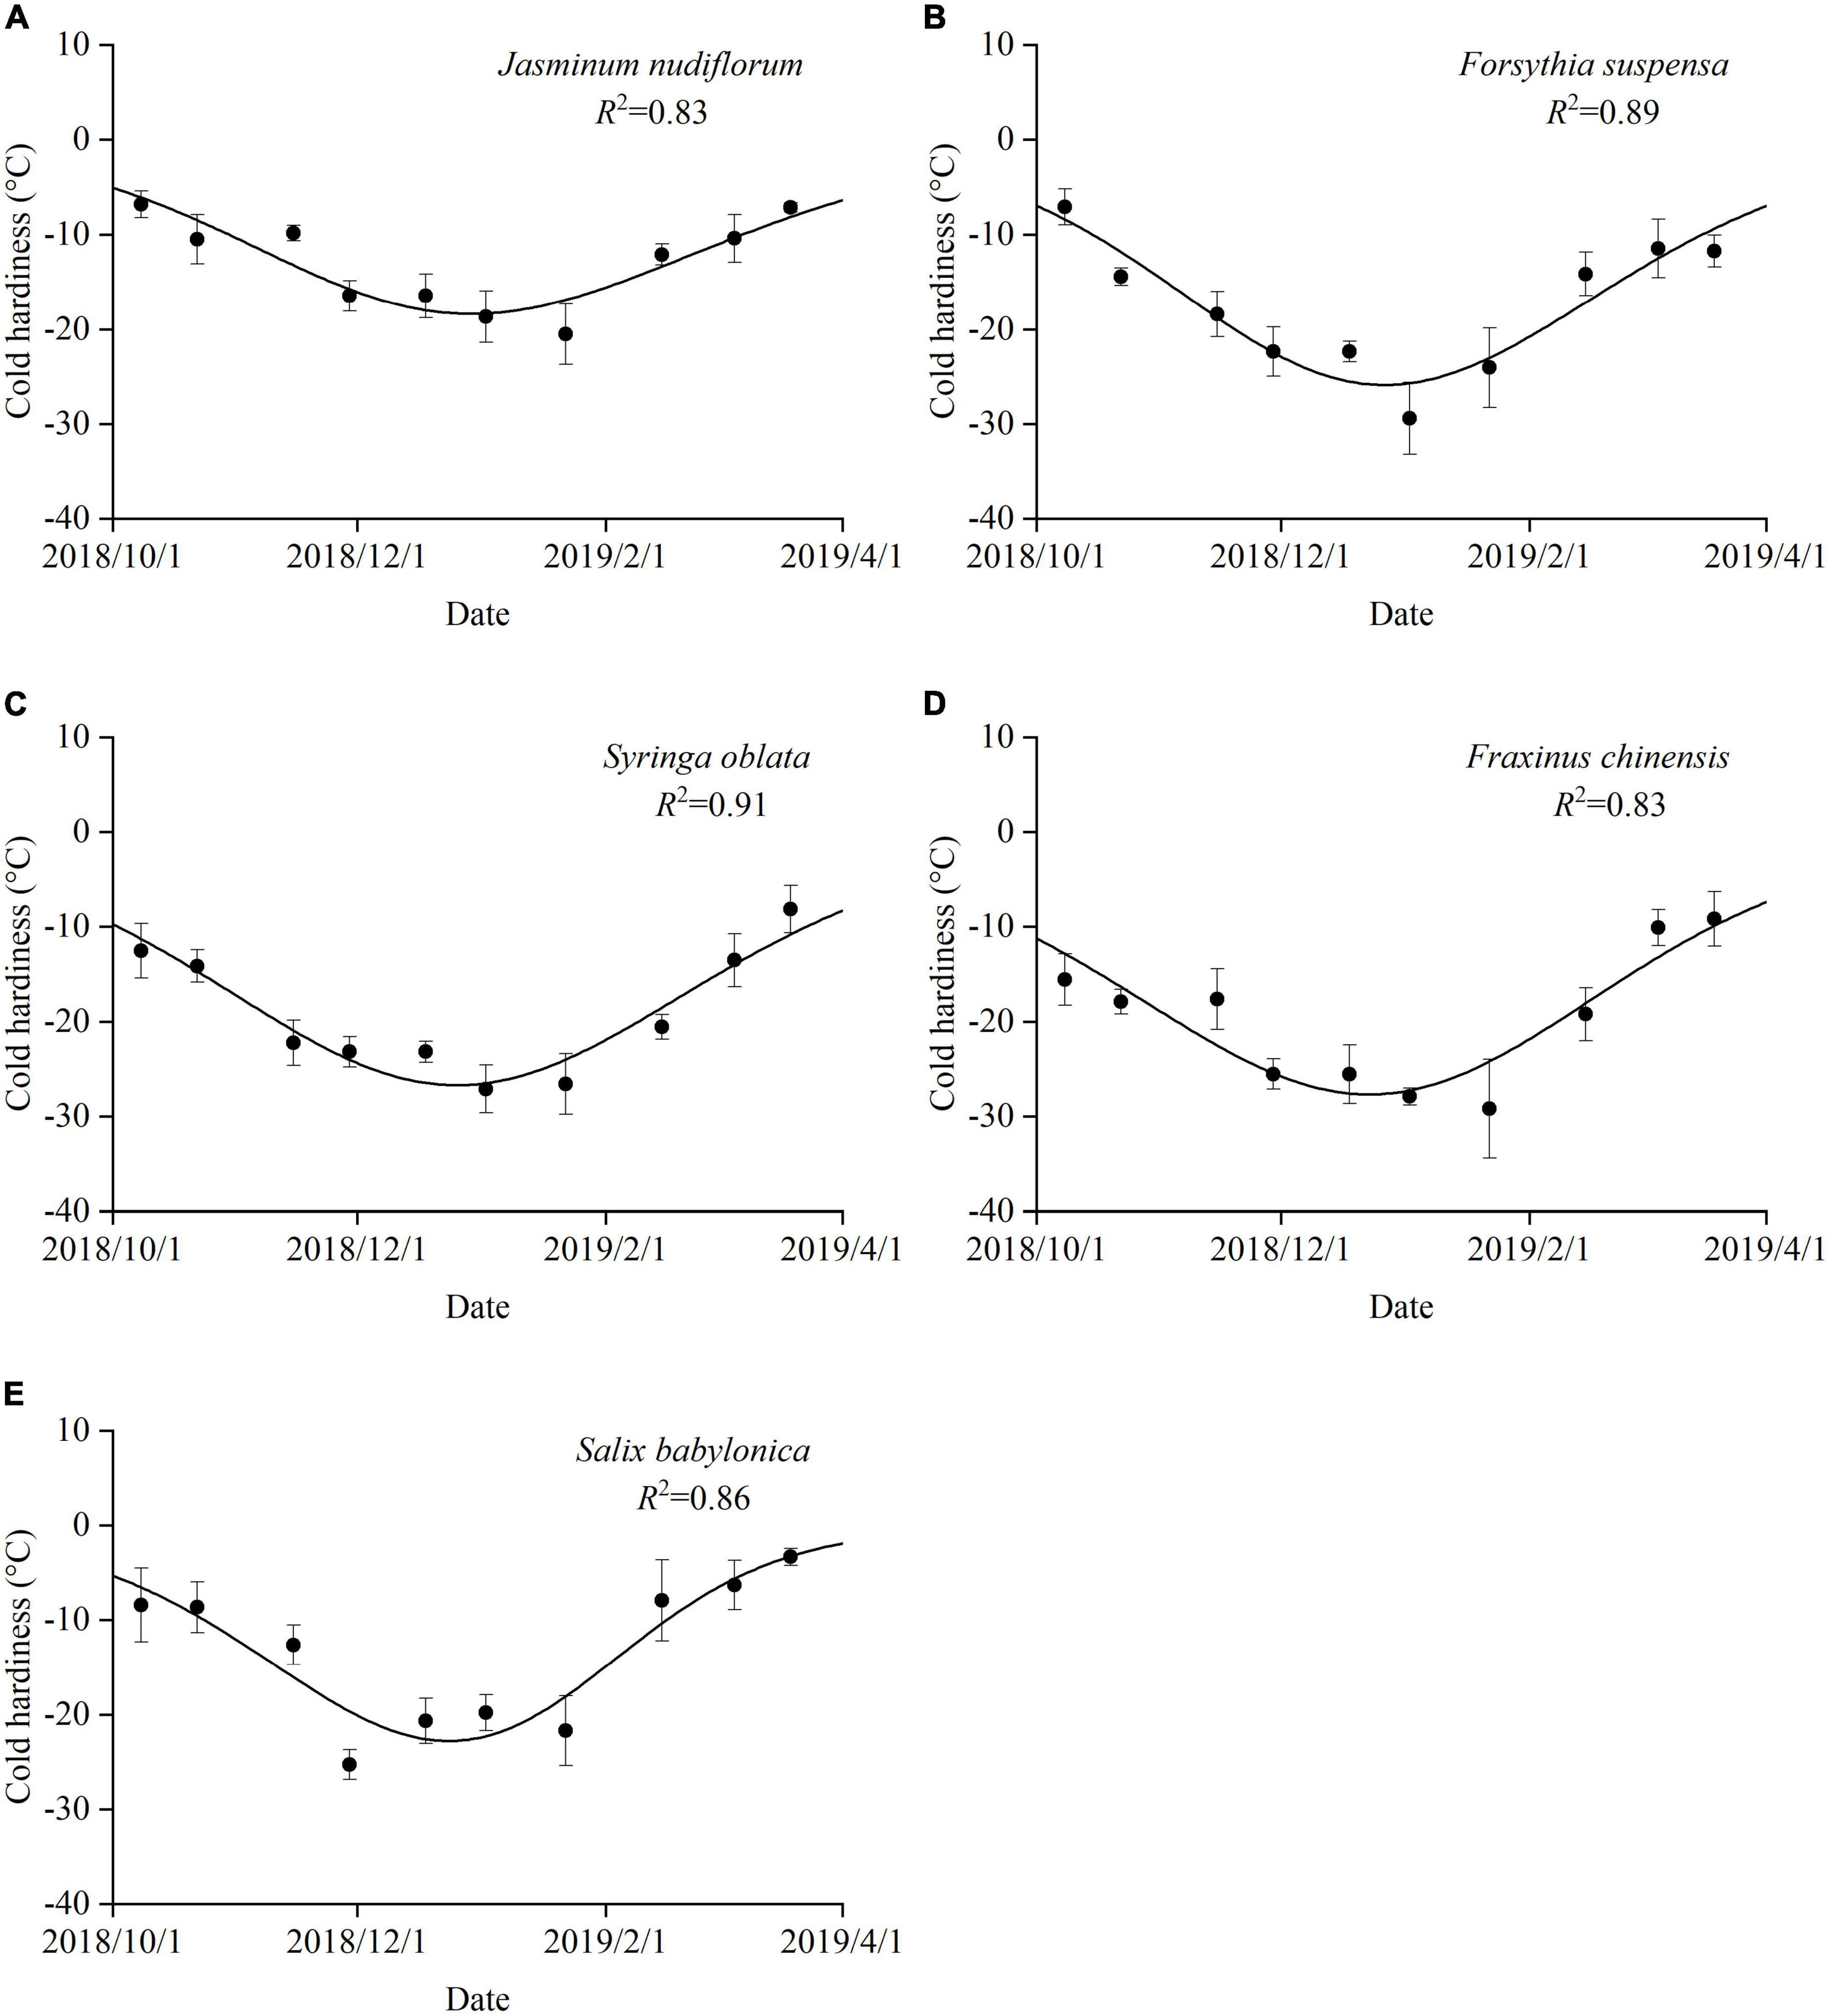
Figure 4. Seasonal variations in cold hardiness for five species. Error bars: standard deviation. R2: coefficient of determination for the double logistic function. (A) J. nudiflorum, (B) F. suspensa, (C) S. oblata, (D) F. chinensis, and (E) S. babylonica.
The cold hardiness measured by the electrical conductivity method was correlated significantly and negatively with CHI for all species (Figure 5). The Pearson correlation coefficients (r) ranged from 0.82 (S. babylonica) to 0.93 (F. suspensa). In the processes of both cold acclimation and deacclimation, CHI corresponded well with cold hardiness, indicating that CHI may be used as an indicator of actual cold hardiness.
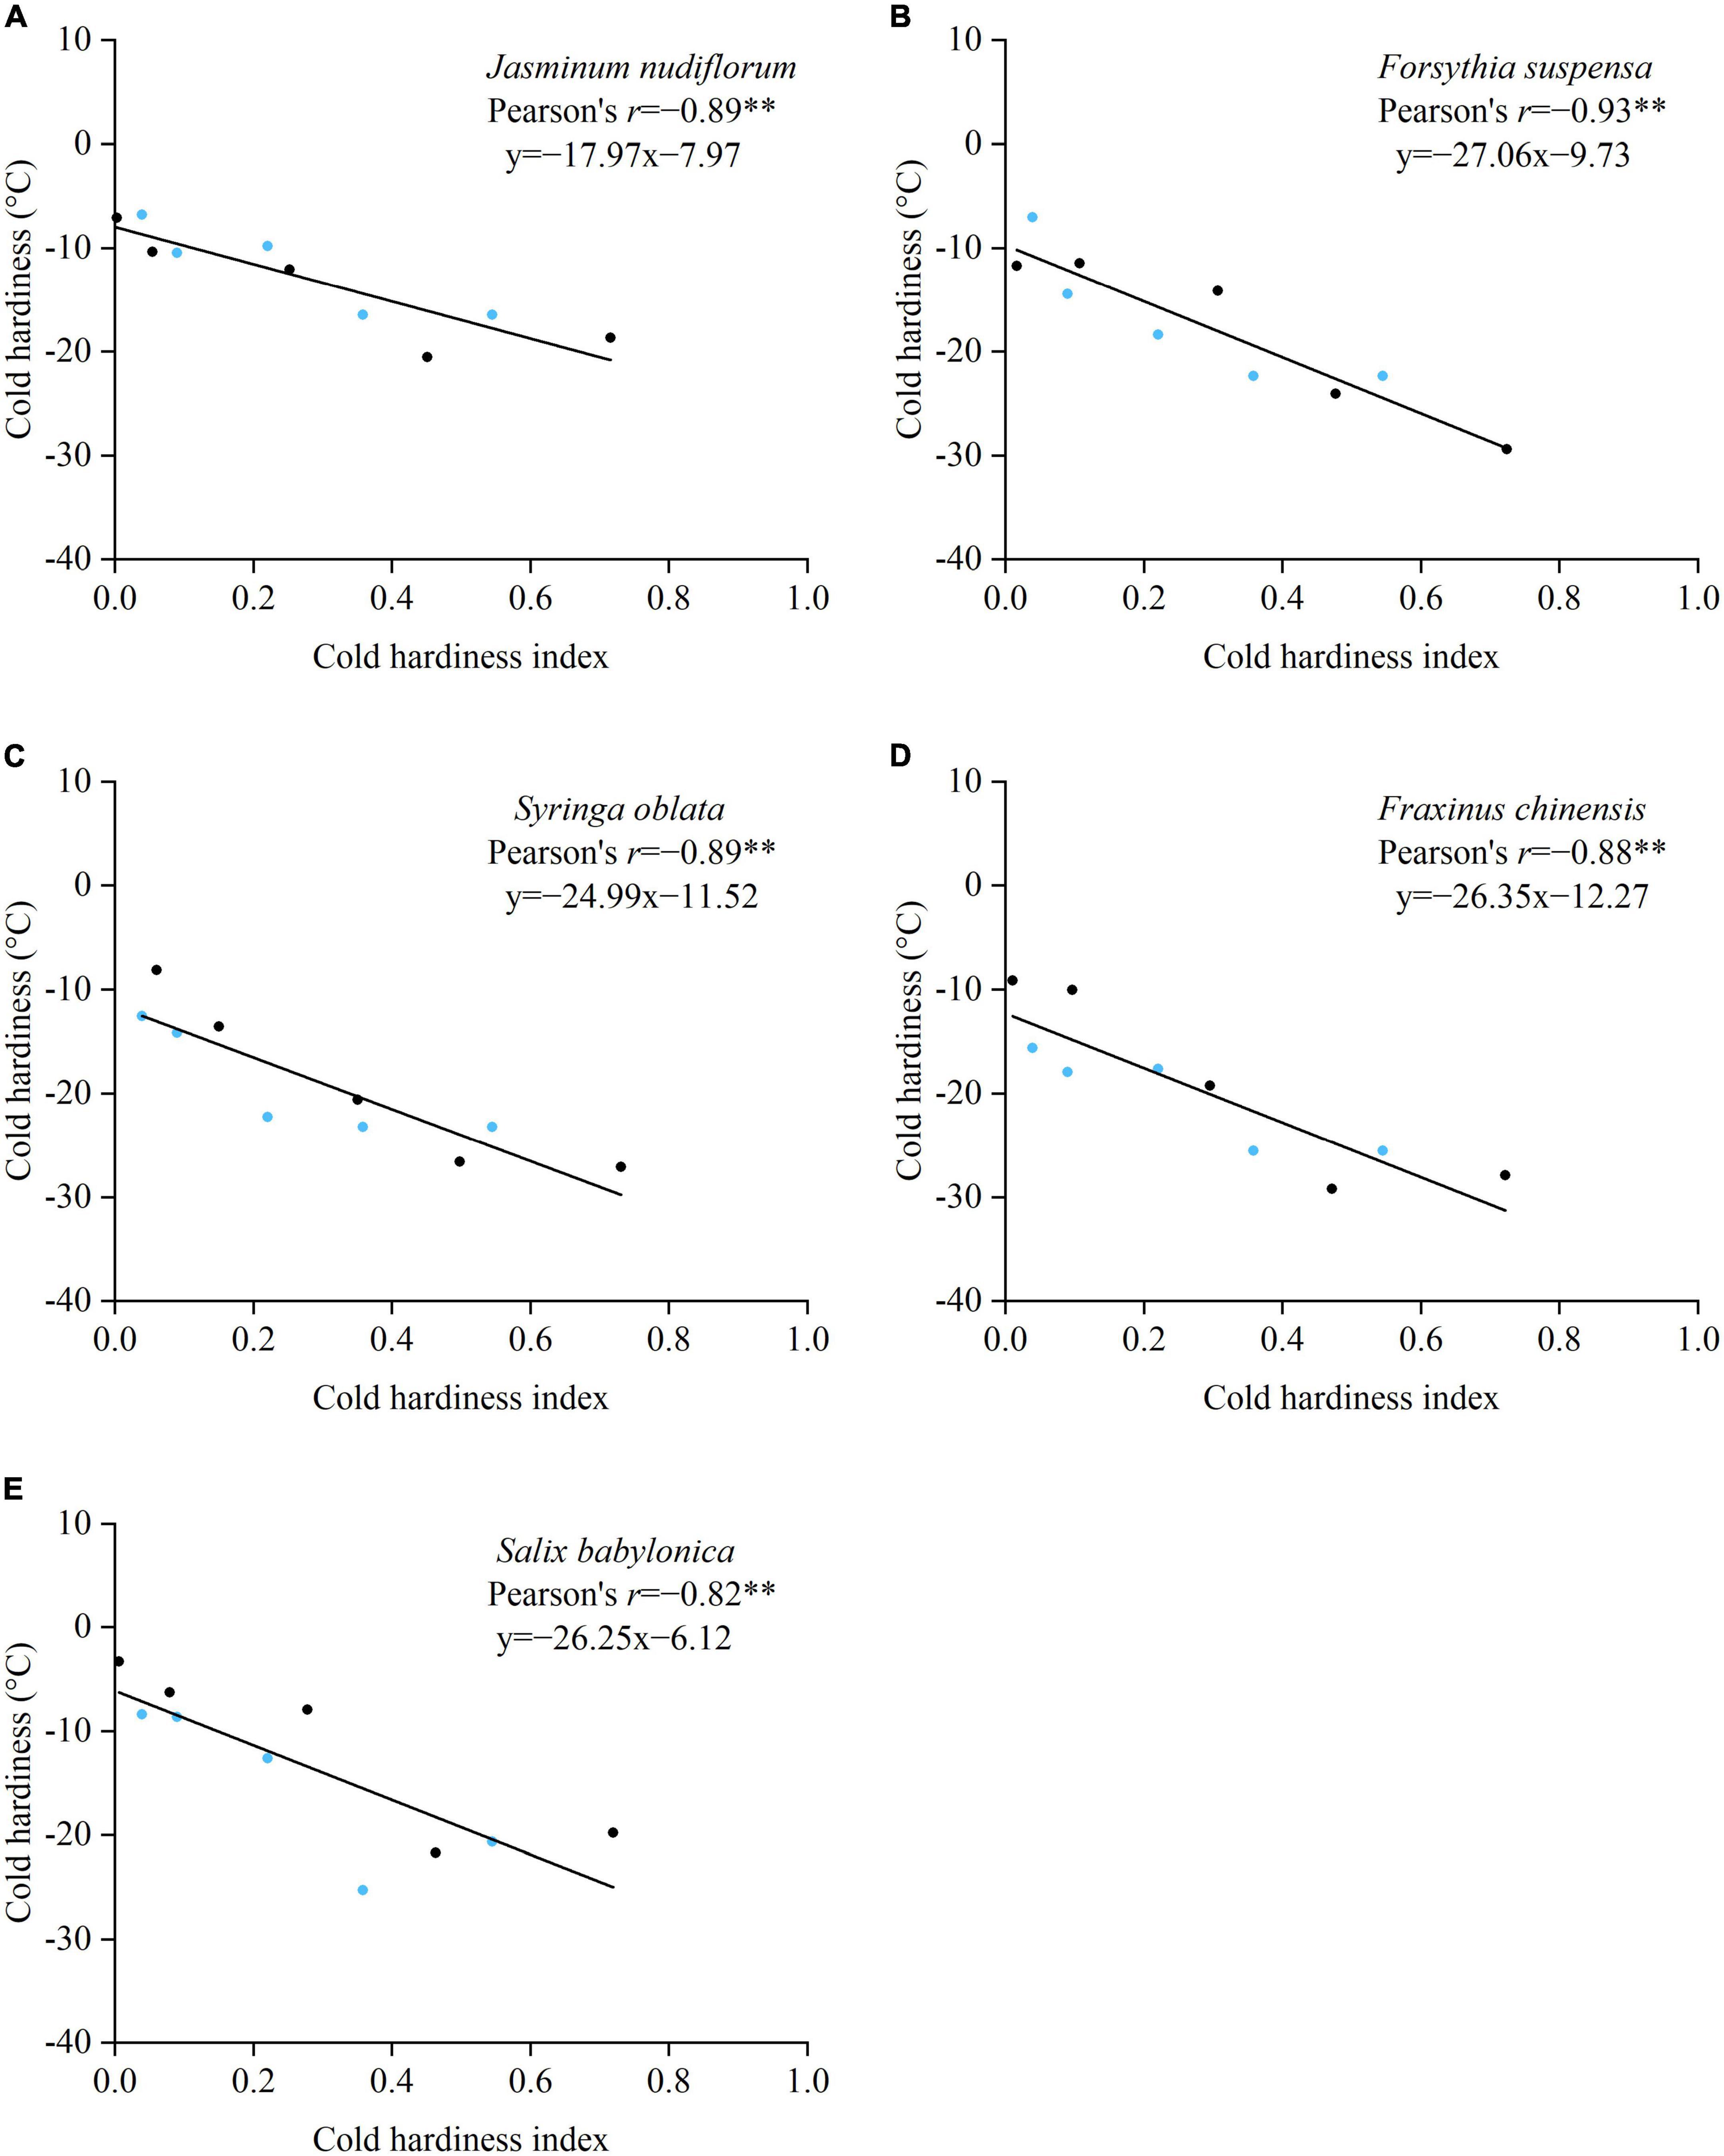
Figure 5. Relationships between cold hardiness measured with the electrical conductivity method and cold hardiness index estimated from Equation 8 for five species. Blue dots: samples in the process of cold acclimation. Black dots: samples in the process of deacclimation. **p < 0.01. (A) J. nudiflorum, (B) F. suspensa, (C) S. oblata, (D) F. chinensis, and (E) S. babylonica.
Over the past 70 years, the CA from the preceding 1 November to the mean date of spring events decreased significantly with a linear trend of 3.0 days decade–1 (Figure 6A). Accordingly, the GDDR of spring events (on 1 March) significantly increased for all species, and ranged from 0.06°C⋅days decade–1 (J. nudiflorum) to 2.17°C⋅days decade–1 (S. babylonica) (Figures 6B–D). Therefore, dormancy depth in early spring increased in strength for all species in the context of climate warming.
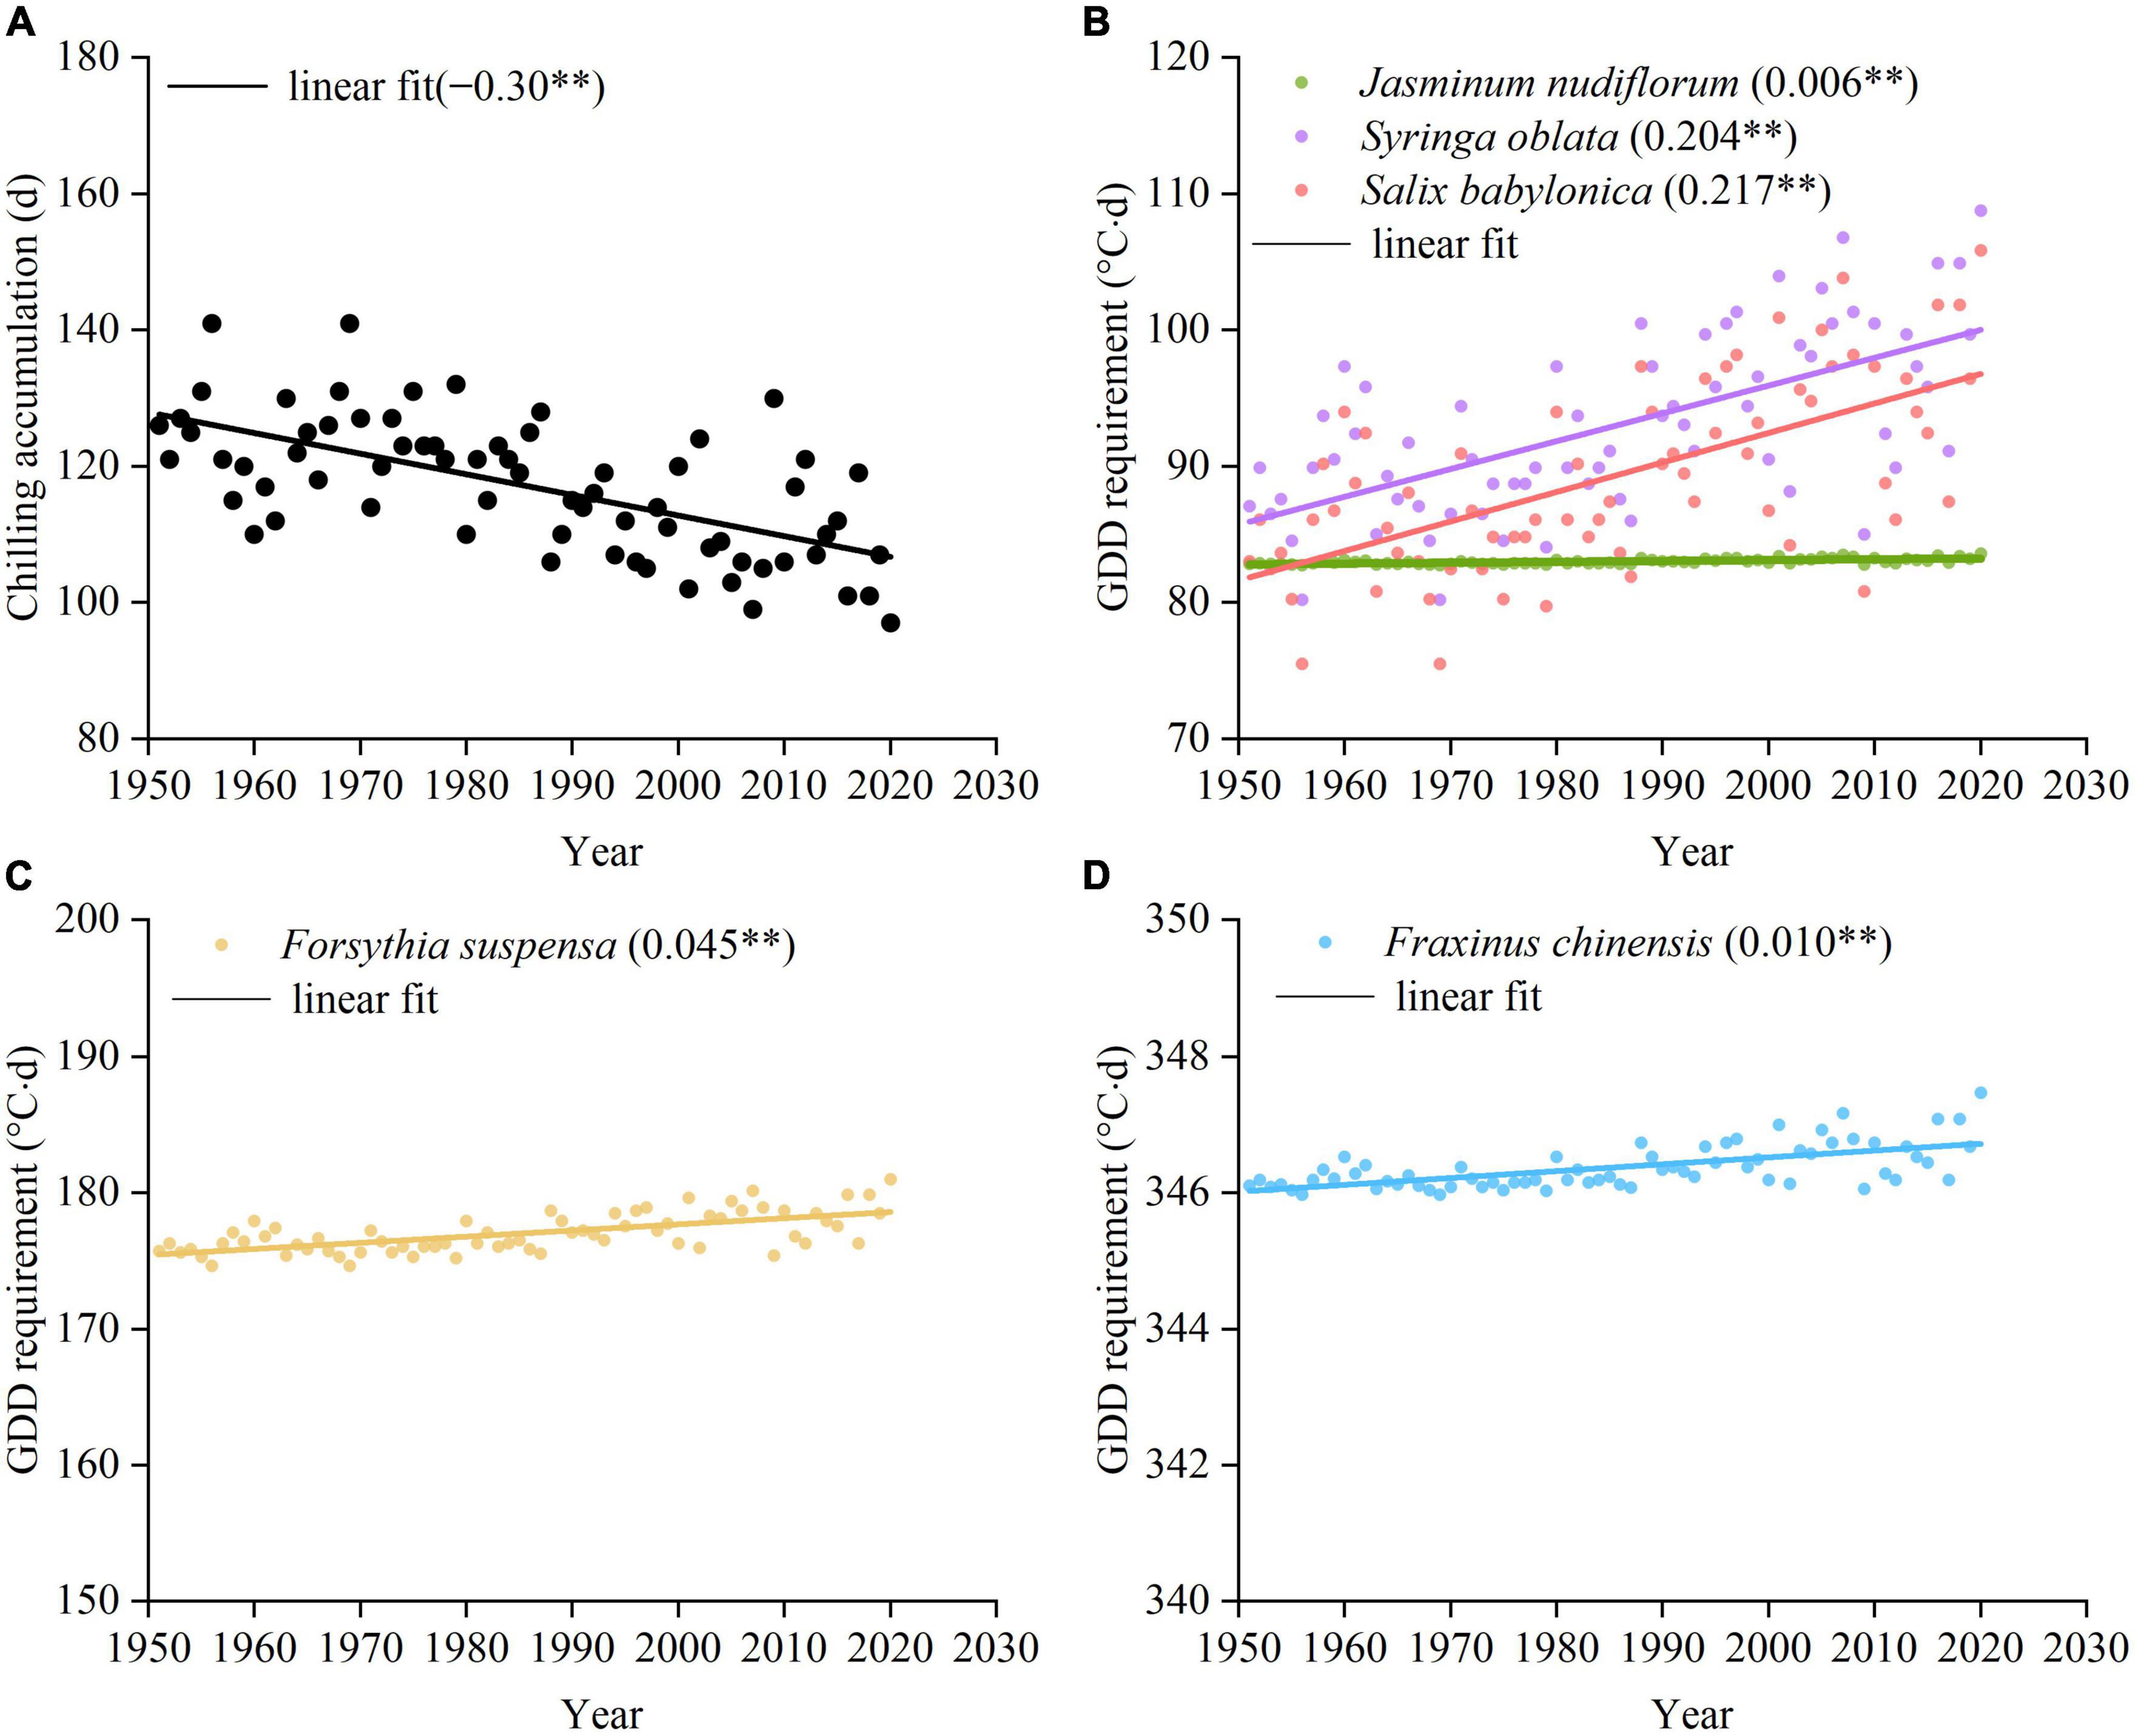
Figure 6. Chilling accumulation and growing degree day requirement (GDDR) of spring events over the past 70 years. The GDDR is simulated by the exponential function between GDDR and CA (Equation 4). (A) Chilling accumulation of five species. (B) GDDR of J. nudiflorum, S. oblata, and S. babylonica, (C) GDDR of F. suspensa, and (D) GDDR of F. chinensis. The linear slope and significance level for each species are shown in parentheses. **p < 0.01.
The maximum CHI showed a trend of significant decrease over time for all species (Figure 7A). The changes in cold hardiness were simulated by a linear regression function between CHI and the measured cold hardiness for each species (Figure 7B). All species showed a significant decrease in cold hardiness with trends ranging from 0.22°C decade–1 (J. nudiflorum) to 0.39°C decade–1 (S. babylonica). Therefore, the reduced duration and magnitude of low winter temperatures have weakened the cold hardiness of all species to varying degrees.
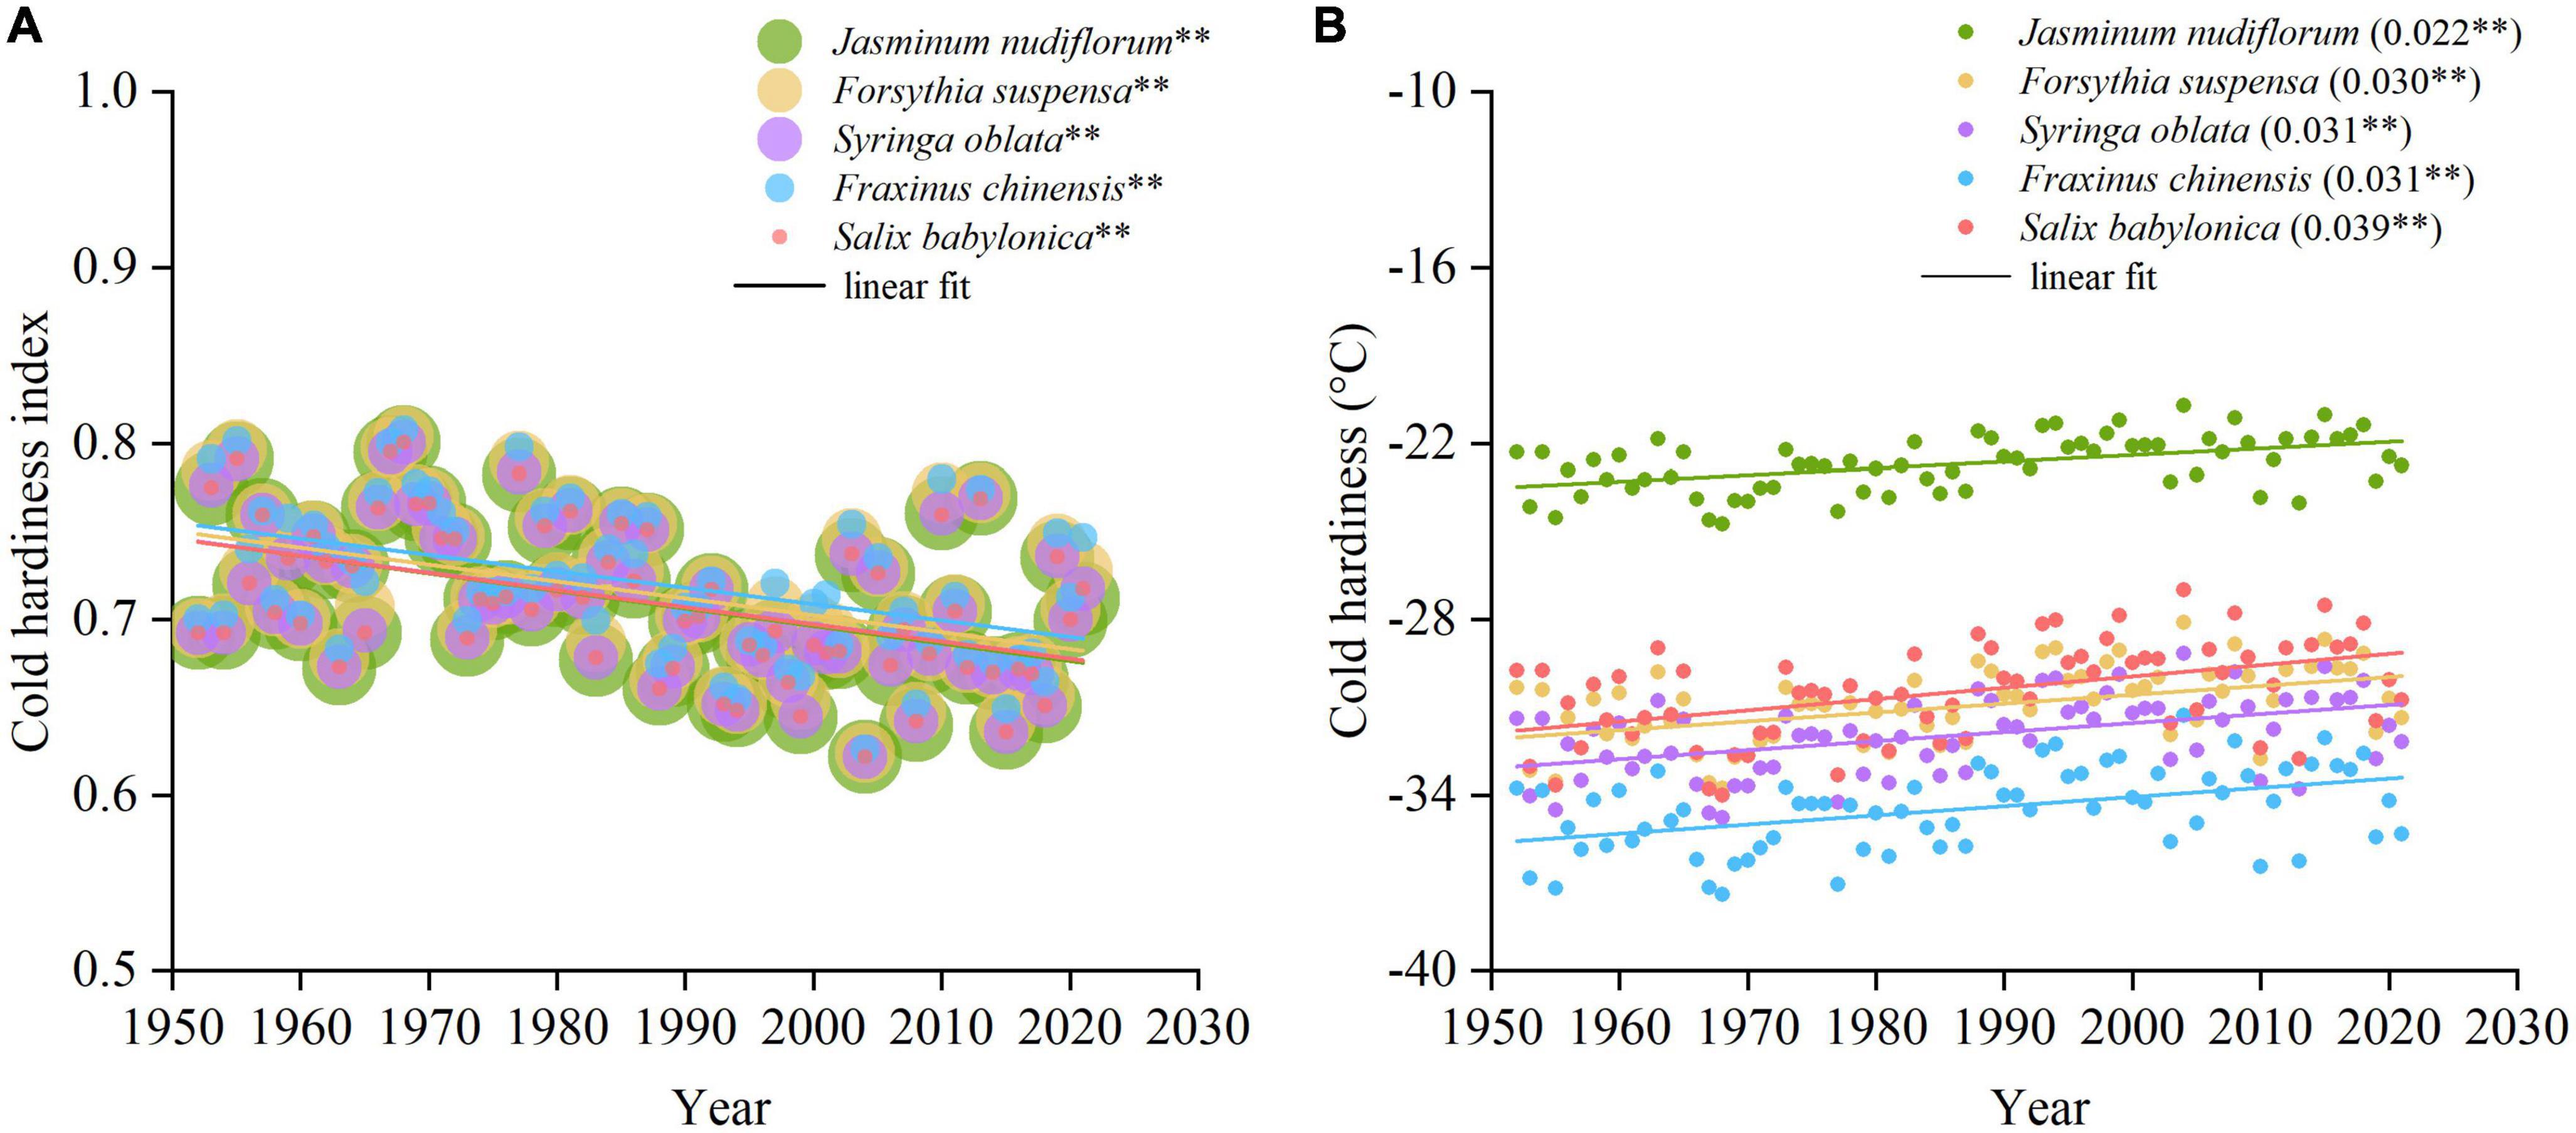
Figure 7. Changes in maximum cold hardiness index (CHI) and cold hardiness for five species in the past 70 years (1952–2021). (A) Maximum CHI. (B) Maximum cold hardiness simulated by CHI. The slopes and significance levels of the linear function are shown in parentheses. **p < 0.01.
To identify the historical frost events before or after budburst, we first simulated the annual FLD or FFD using the phenological model based on CA-GDDR functions. The results showed that the simulated budburst dates of five species advanced by 2.12 days decade–1 to 2.44 days decade–1 over the past 70 years (Supplementary Figure 1). Then, we validated the simulated spring phenology with the long-term observation data at a nearby site in Beijing. The results showed that the simulated spring phenology correlated positively and significantly with the observations (Figure 8), suggesting that the phenological models in this study well reflect the interannual changes in the spring phenology of all experimental species. However, the linear regression lines between the simulated and observed dates deviated from the 1:1 line for three species (J. nudiflorum, F. suspensa and F. chinensis), possibly because of the phenological differentiation between populations and the difference in microclimate between two locations.
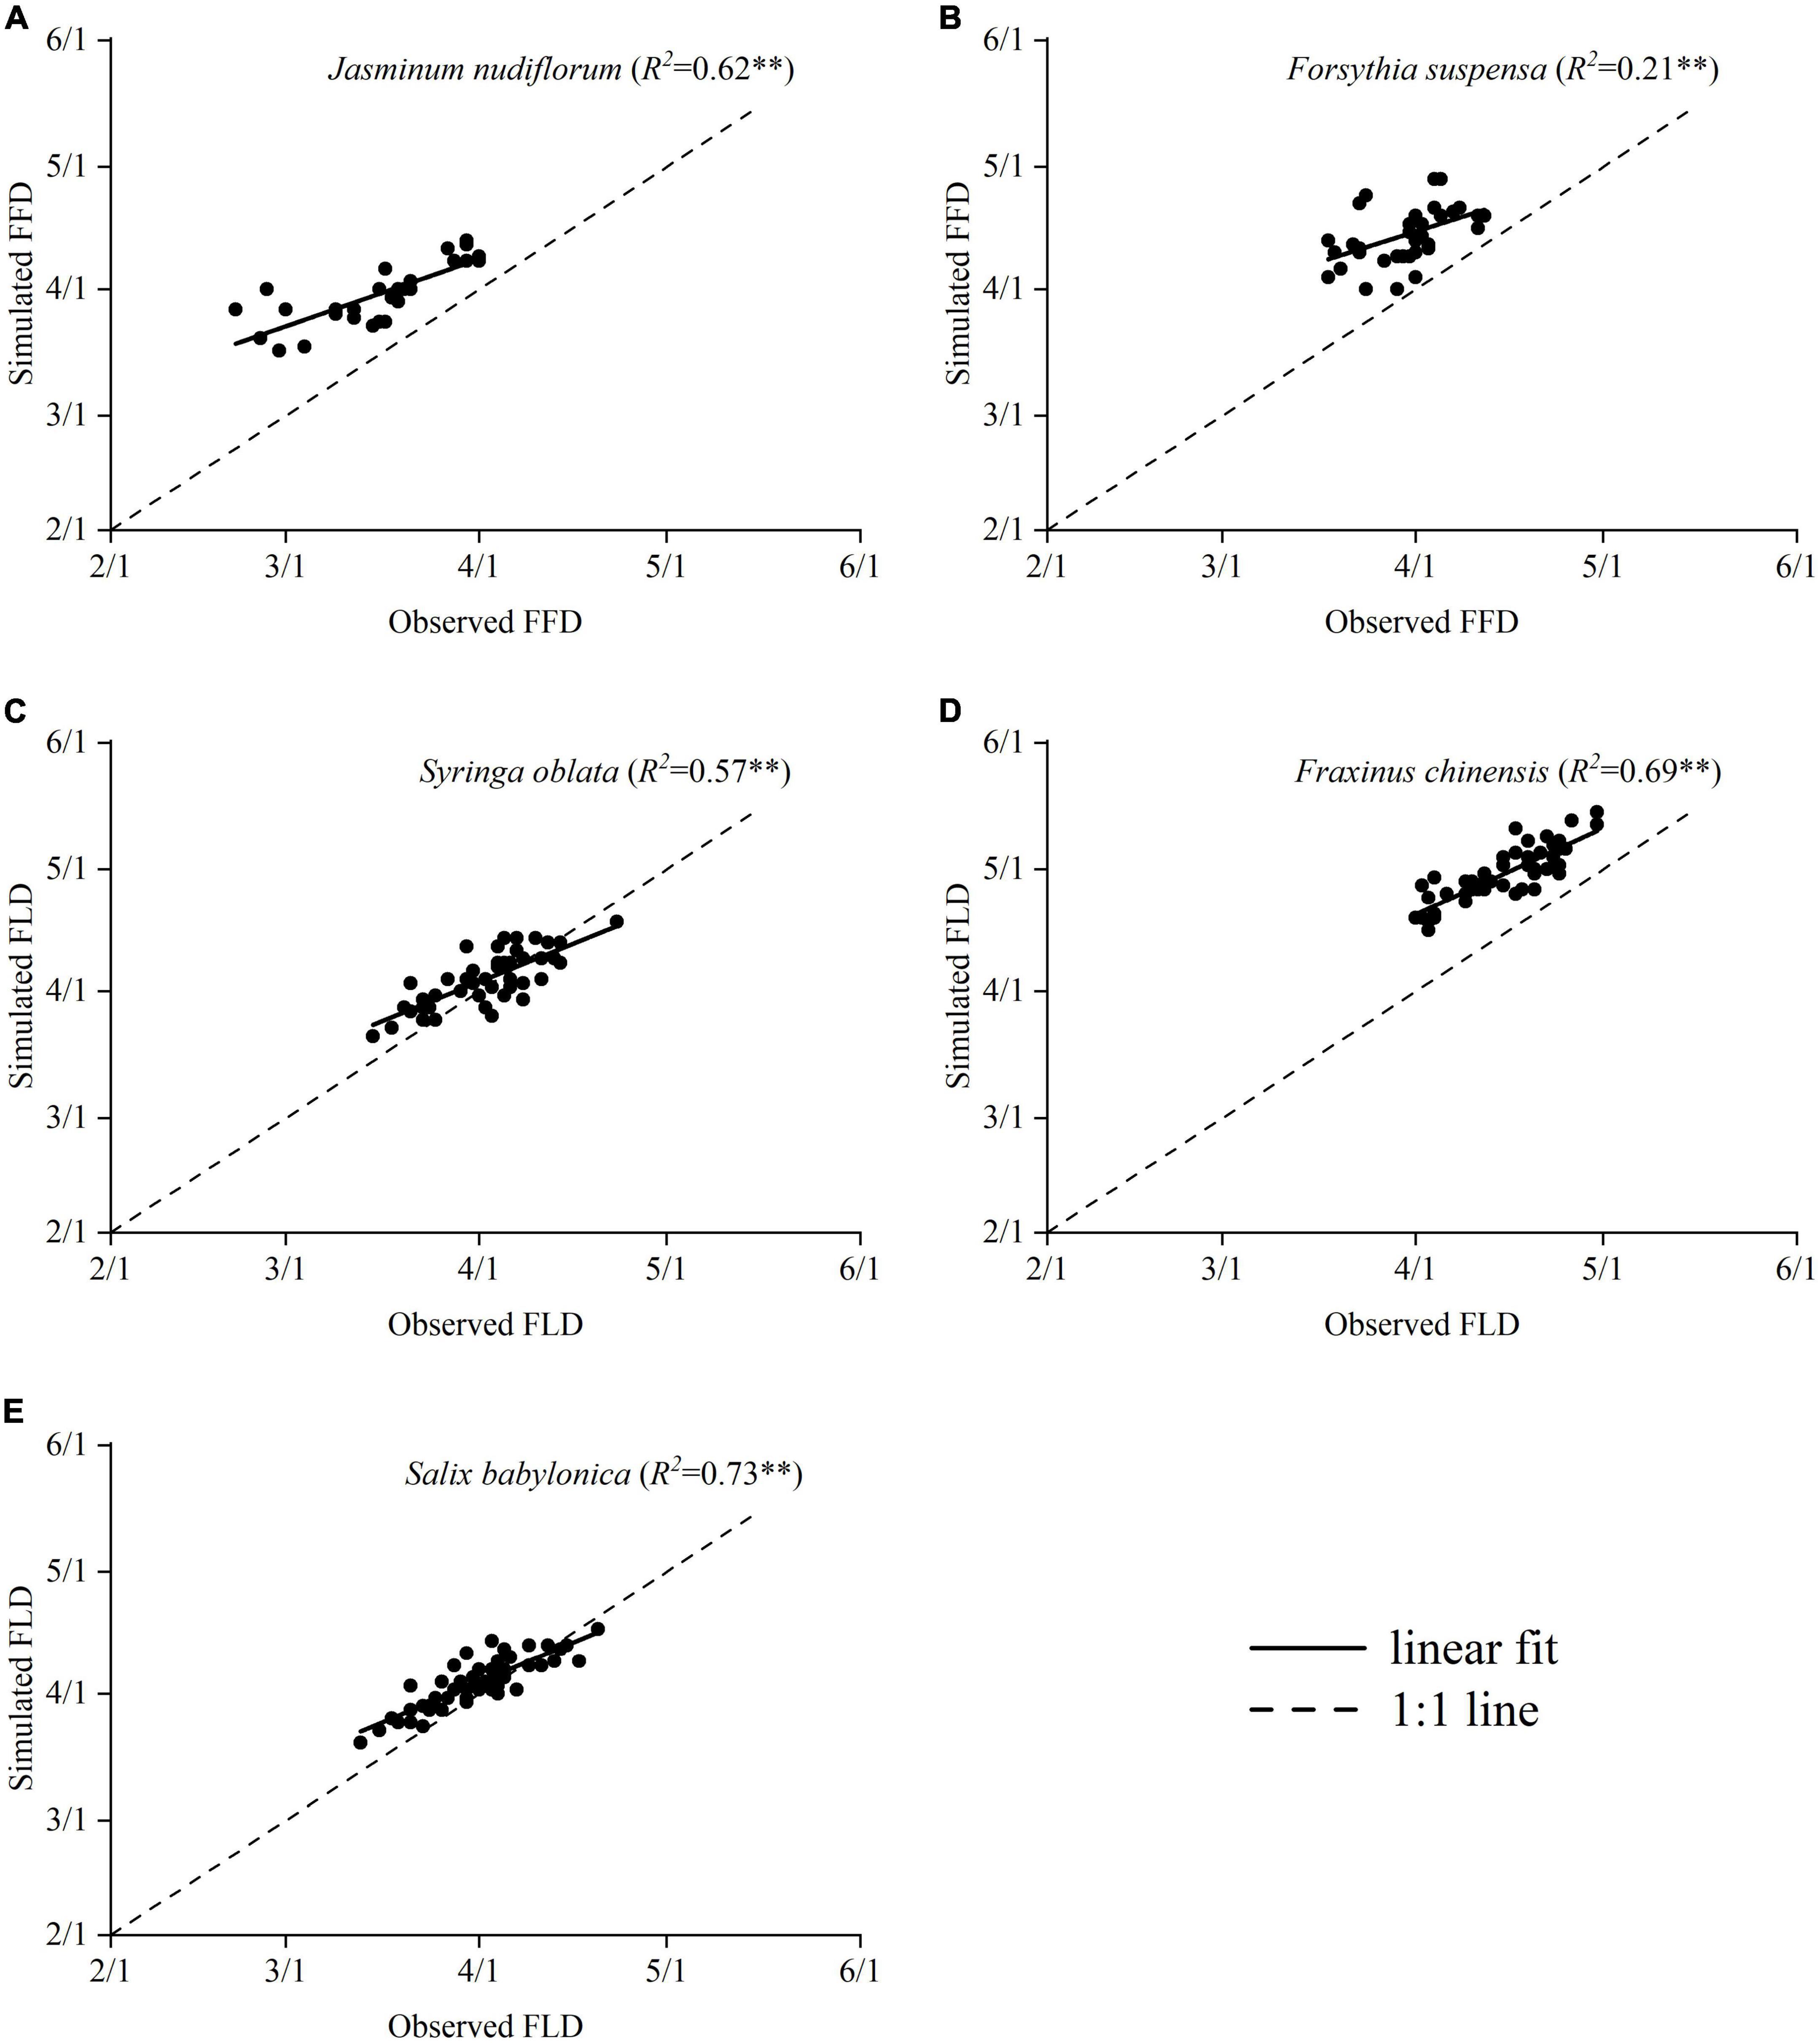
Figure 8. Relationships between simulated spring events and observed spring events. FLD, the first leaf date; FFD, first flowering date. The black dotted line represents when the observed and simulated values are equal. **p < 0.01. (A) J. nudiflorum, (B) F. suspensa, (C) S. oblata, (D) F. chinensis, and (E) S. babylonica.
When comparing daily minimum temperatures and cold hardiness simulated by CHI, we found that the frost events before budburst rarely occurred in the past 70 years. Frost events only occurred several times in 4 years (1966, 1969, 1971, and 1979/1981) for J. nudiflorum and S. babylonica, but occurred only in one year (1966) for the other 3 species (Supplementary Table 1). Thus, the species investigated here have adapted to the seasonal temperature variation of the study area to a great extent.
We also assessed the post-budburst frost events in the past seven decades. The results showed that frost damage (positive FSI) only occurred in three species. Frost damage on young leaves or flowers occurred in 2, 1, and 1 years (all before 1970) on J. nudiflorum, S. oblata and S. babylonica, respectively (Figure 9). Furthermore, there were no significant trends in FSI due to the synchronous advance of the last frost date and budburst date in response to climate warming (Supplementary Figure 1).
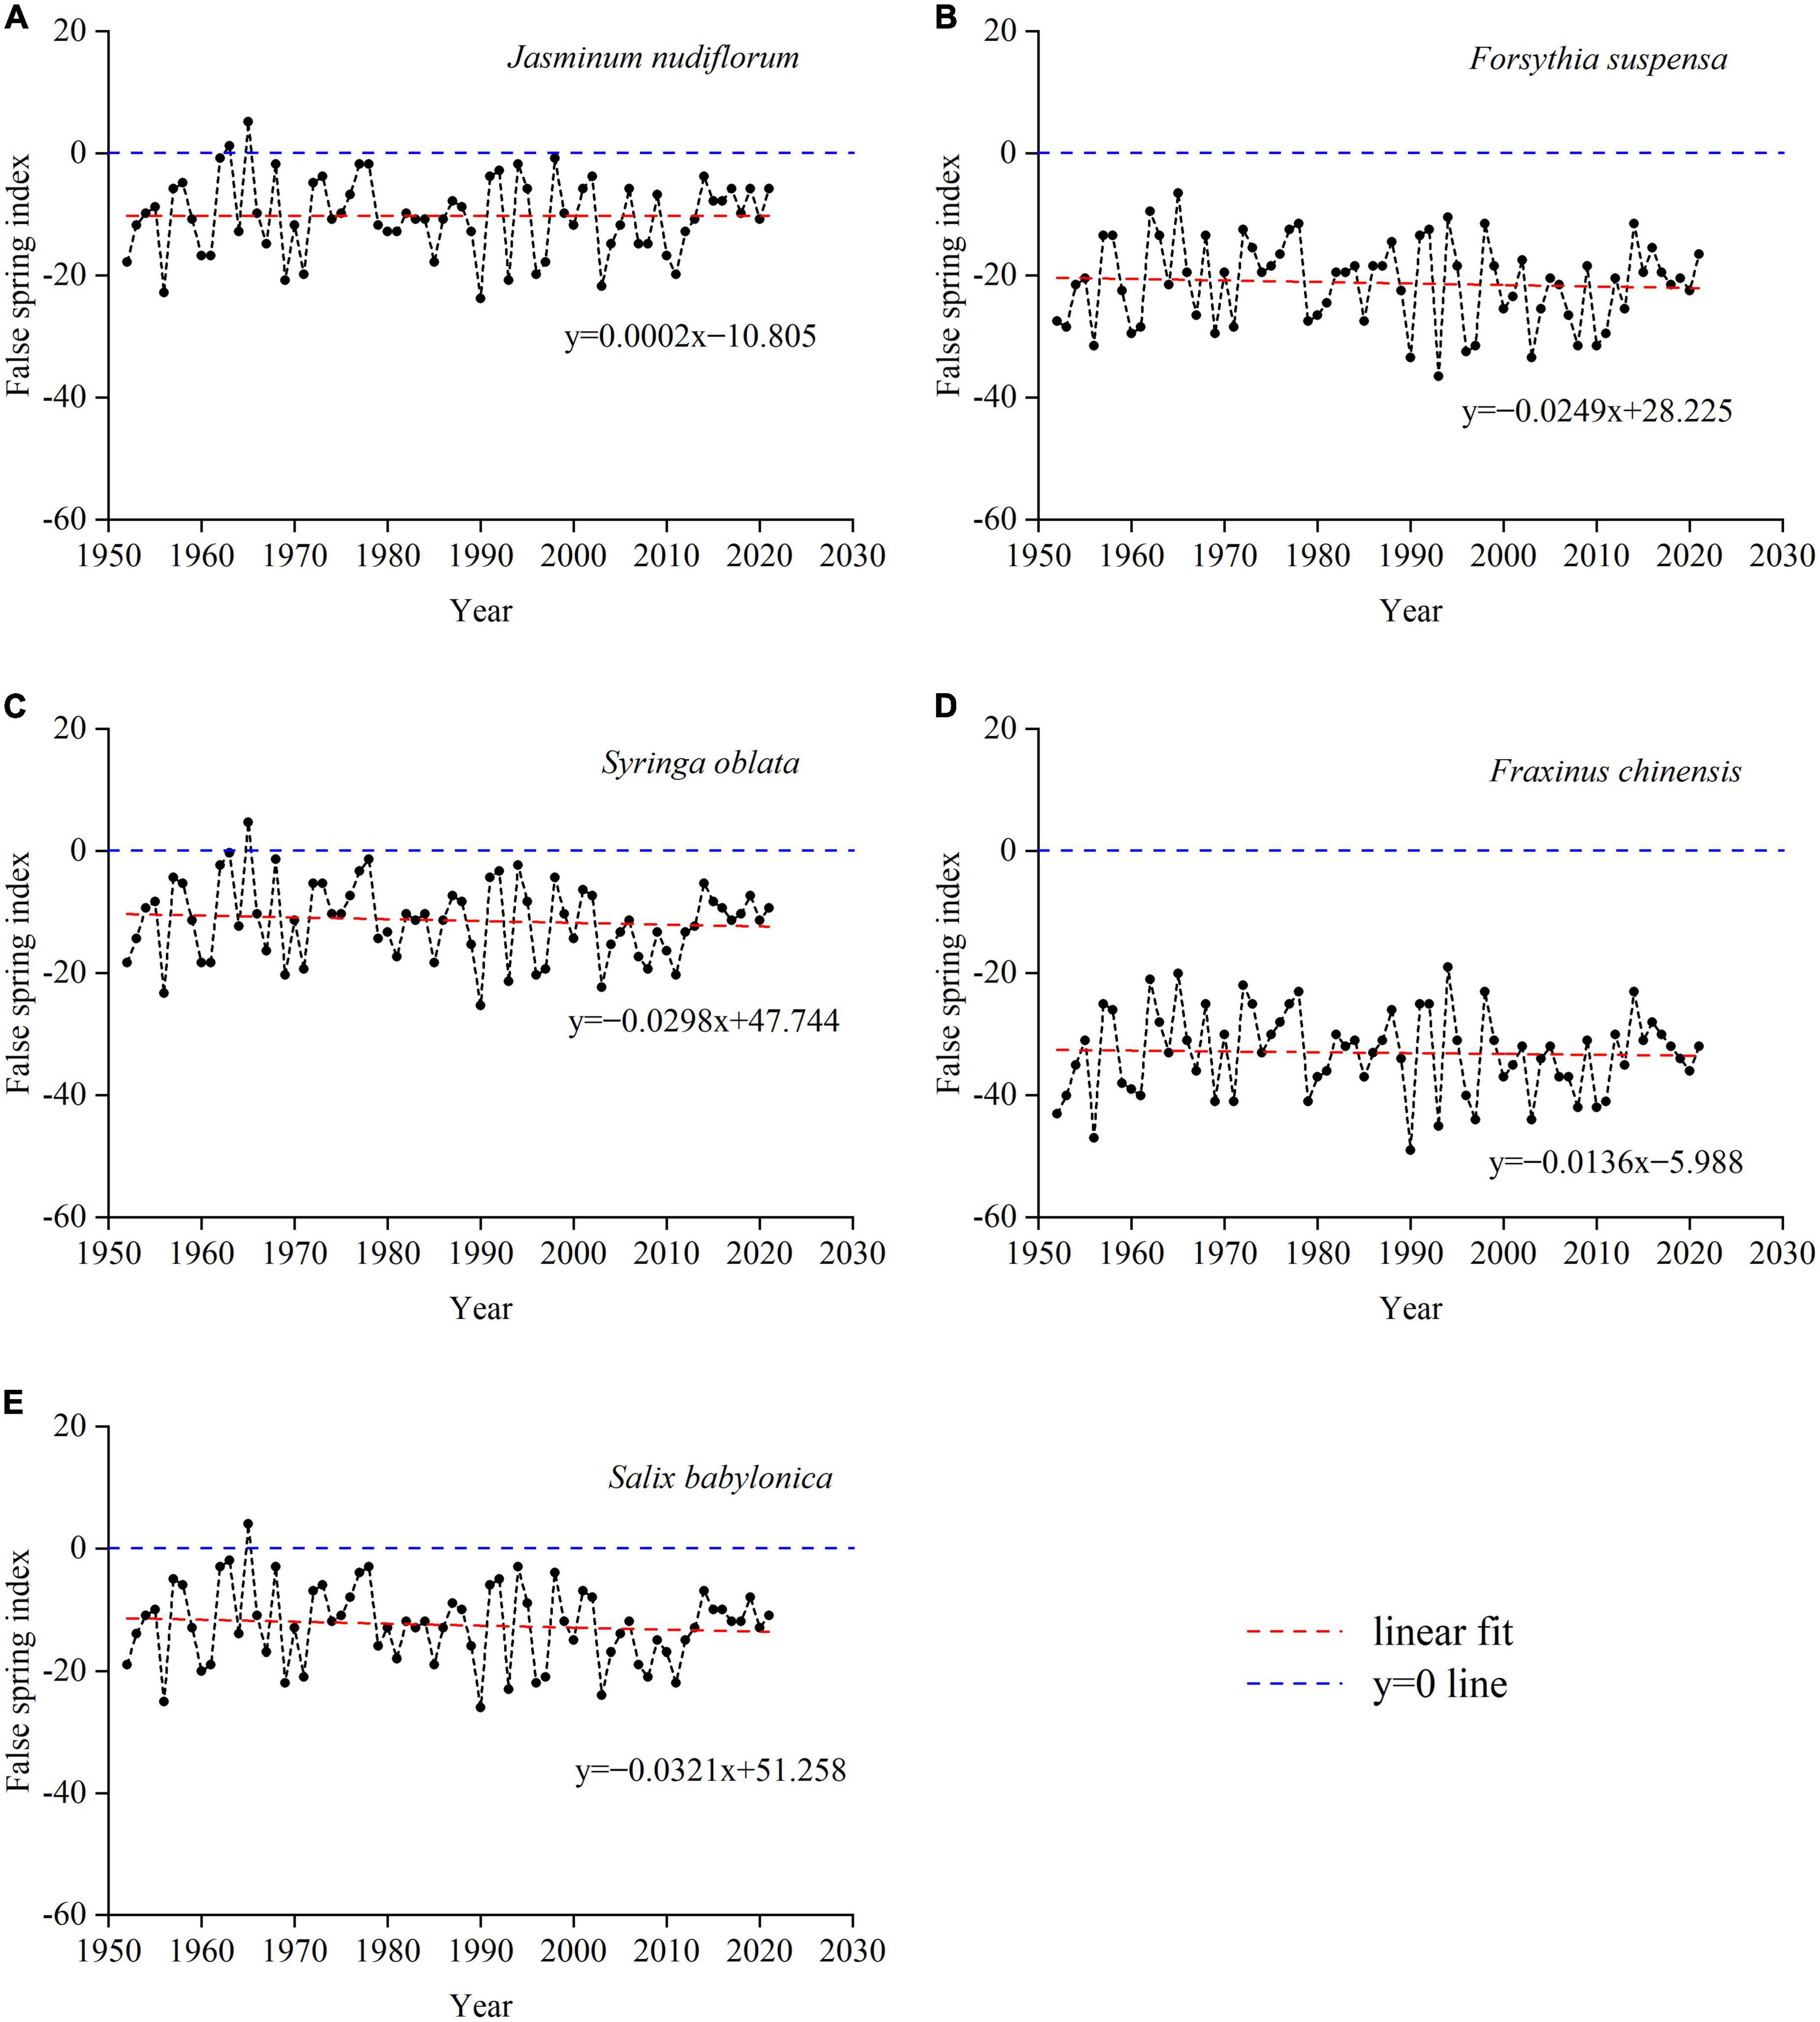
Figure 9. Changes in false spring index (FSI) for five species in the past 70 years (1952–2021). (A) J. nudiflorum, (B) F. suspensa, (C) S. oblata, (D) F. chinensis, and (E) S. babylonica.
After endodormancy induced by the shortened daylength and lower temperatures in autumn, budburst in temperate trees and shrubs may not occur even in a growth-promoting environment (Campoy et al., 2011; Basler and Körner, 2012; Singh et al., 2017). In the present study, the maximum dormancy generally occurred between 1 October and 3 December for all five study species. This result is in accordance with previous findings. For example, the maximum dormancy depth of peach in Georgia, USA, was observed between late October and early December (Weinberger, 1950). Similarly, Campoy et al. (2011) reported that the maximum dormancy depth for apple usually occurred 1–2 months after the autumn equinox, which was consistent with the present results.
The release of endodormancy requires a certain amount of CA. In the current study, the dormancy level gradually decreased with increase in CA after plants attained the maximum dormancy. This result confirmed the effects of CA observed in previous studies. For example, the GDD requirements for budburst of seven temperate species gradually decrease with increase in chilling duration in Ontario, Canada (Man et al., 2017). The GDD requirement for budburst of European beech (Fagus sylvatica) is negatively correlated with duration of chilling (Vitasse and Basler, 2013). The effects of CA on dormancy depth are also evident in observational data for 30 perennial species in Europe (Wang et al., 2020b). Although chilling plays a similar role in the dormancy release of temperate species, the different sensitivity of GDD requirements to CA among species may lead to varying phenological responses to climate warming (Hu et al., 2022).
The cold hardiness of the five temperate species increased from the beginning of October, with the maximum cold hardiness observed at the end of December. This pattern has been reported in previous studies. For example, experiments on two Japanese cultivars of tea plant (‘Yabukita’ and ‘Yutakamidori’) in Kagoshima showed that cold hardiness gradually increases from the beginning of December to a maximum value in mid-February of the following year and thereafter steadily decreases (Kimura et al., 2021). The cold hardiness of twigs of 11 woody plant species at different altitudes in central France increases from early November to late winter (January–February) and then gradually decreases until budburst (Charrier et al., 2013). The cold hardiness of four woody plant species in Switzerland gradually decreases from the end of January to the beginning of April (Vitra et al., 2017). During the transition from autumn to winter, plant tissues start to harden owing to the decrease in temperature and the shortening of daylength (Beck et al., 2004), whereas cold deacclimation is mainly driven by progressively warmer temperatures in spring. Maximum cold hardiness differed among the five species, ranging between −18°C and −28°C, in the current investigation. The maximum cold hardiness of fruit-oriented walnut can attain −28°C, whereas that of wood-oriented walnut is −35°C (Charrier et al., 2011). Nordic Betula species and other cold-adapted species can tolerate temperatures lower than −70°C at full dormancy (Körner, 2012).
The CA and CHI provided sufficient indications of seasonal variations in dormancy and cold hardiness. The present simulations indicated that dormancy depth is increasing owing to decreased chilling. Similar results have been observed in previous studies. For instance, Wang et al. (2022) reported that insufficient chilling under climate warming has led to an increase in dormancy depth, which has approximately halved the rate of advance of spring phenology caused by increased forcing.
Temperate species with long life cycles have evolved the ability to cope with low seasonal temperatures within their distribution range. This explains why we detected very few frost events before budburst in the past 70 years (Supplementary Table 1). Since lower temperatures are more effective for cold acclimation, the present study simulated a decrease in cold hardiness from the previous autumn to spring under climate warming. The decreased cold hardiness may cause a higher risk of frost damage. However, the occurrence of extremely low-temperature events decreased significantly under warming (Griffiths et al., 2005). Therefore, combined with decreased cold hardiness and frequency of low-temperature events, frost risk prior to budburst would not change significantly. The results of this study confirmed this assumption, as no frost events were simulated to occur in recent years.
The budburst date of temperate plants is now earlier owing to the influence of climate warming (Menzel et al., 2006; Ge et al., 2015). As a result, plants may be at increased risk of frost damage after budburst (Chamberlain et al., 2019). However, the earlier last frost date in a warmer climate tends to reduce the spring frost risk (Park et al., 2021). Thus, considering both the changes in spring phenology and the frequency of frost events, the post-budburst frost risk may vary among regions. This study found that the frost risk to young leaves and flowers did not change significantly. In Switzerland, the risk of spring frost exposure and subsequent potential damage has increased for four tree species at the vast majority of stations located at elevations higher than 800 m while remaining unchanged at lower elevations (Vitasse et al., 2018). A recent study showed that the frequency of frosts in late spring has increased to a greater extent in Europe and East Asia than in North America from 1959 to 2017 (Zohner et al., 2020).
In this study, the dormancy depth and cold hardiness of five temperate woody plant species in Beijing were assessed from autumn to the following spring using growth chamber and conductivity measurements. The maximum dormancy occurred between early October and early December, which thereafter gradually decreased. The cold hardiness increased from the beginning of October until the end of December and thereafter decreased. The maximum dormancy and maximum cold hardiness were non-synchronized because of the different responses of dormancy and cold hardiness to low temperatures in winter. The bioclimatic indices CA and CHI satisfactorily represented seasonal changes in dormancy and cold hardiness, respectively. Using functions between CA and GDD requirements, the budburst date (FFD or FLD) of the five species was simulated to become significantly earlier and the dormancy depth in early spring was indicated to have increased owing to insufficient CA over the past 70 years. At the same time, winter warming has led to a significant reduction in cold hardiness. The frost risk before or after budburst remained stable because of the reduction in occurrence and severity of low-temperature events and earlier late spring frosts. The experimental methods and bioclimatic indices proposed in this study may be used to simulate frost risk in other regions and under different climate-change scenarios.
The original contributions presented in this study are included in the article/Supplementary material, further inquiries can be directed to the corresponding authors.
HW designed the study. ZH and HW performed the experiment, and wrote the manuscript. ZH and SL analyzed the data. JD revised the manuscript. All authors contributed to the article and approved the submitted version.
This work was funded by the National Natural Science Foundation of China (Grant No. 41871032) and the National Key R&D Program of China (Grant No. 2018YFA0606102).
The authors declare that the research was conducted in the absence of any commercial or financial relationships that could be construed as a potential conflict of interest.
All claims expressed in this article are solely those of the authors and do not necessarily represent those of their affiliated organizations, or those of the publisher, the editors and the reviewers. Any product that may be evaluated in this article, or claim that may be made by its manufacturer, is not guaranteed or endorsed by the publisher.
The Supplementary Material for this article can be found online at: https://www.frontiersin.org/articles/10.3389/ffgc.2022.1061191/full#supplementary-material
Anderson, J. V., Horvath, D. P., Chao, W. S., and Foley, M. E. (2010). “Bud dormancy in perennial plants: a mechanism for survival,” in Dormancy and Resistance in Harsh Environments, eds E. Lubzens, J. Cerda, and M. Clark (Berlin: Springer), 69–90. doi: 10.1007/978-3-642-12422-8
Arora, R., Rowland, L. J., and Tanino, K. (2003). Induction and release of bud dormancy in woody perennials: a science comes of age. HortScience 38, 911–921. doi: 10.21273/hortsci.38.5.911
Ault, T. R., Henebry, G. M., De Beurs, K. M., Schwartz, M. D., Betancourt, J. L., and Moore, D. (2013). The false spring of 2012, earliest in North American record. EOS 94, 181–182. doi: 10.1002/2013EO200001
Basler, D., and Körner, C. (2012). Photoperiod sensitivity of bud burst in 14 temperate forest tree species. Agric. For. Meteorol. 165, 73–81. doi: 10.1016/j.agrformet.2012.06.001
Basler, D., and Körner, C. (2014). Photoperiod and temperature responses of bud swelling and bud burst in four temperate forest tree species. Tree Physiol. 34, 377–388. doi: 10.1093/treephys/tpu021
Beck, E. H., Heim, R., and Hansen, J. (2004). Plant resistance to cold stress: mechanisms and environmental signals triggering frost hardening and dehardening. J. Biosci. 29, 449–459. doi: 10.1007/BF02712118
Campoy, J. A., Ruiz, D., and Egea, J. (2011). Dormancy in temperate fruit trees in a global warming context: a review. Sci. Hortic. 130, 357–372. doi: 10.1016/j.scienta.2011.07.011
Chamberlain, C. J., Cook, B. I., García, de Cortázar-Atauri, I., and Wolkovich, E. M. (2019). Rethinking false spring risk. Glob. Chang. Biol. 25, 2209–2220. doi: 10.1111/gcb.14642
Charrier, G., Bonhomme, M., Lacointe, A., and Améglio, T. (2011). Are budburst dates, dormancy and cold acclimation in walnut trees (Juglans regia L.) under mainly genotypic or environmental control? Int. J. Biometeorol. 55, 763–774. doi: 10.1007/s00484-011-0470-1
Charrier, G., Cochard, H., and Améglio, T. (2013). Evaluation of the impact of frost resistances on potential altitudinal limit of trees. Tree Physiol. 33, 891–902. doi: 10.1093/treephys/tpt062
Dantec, C. F., Vitasse, Y., Bonhomme, M., Louvet, J. M., Kremer, A., and Delzon, S. (2014). Chilling and heat requirements for leaf unfolding in European beech and sessile oak populations at the southern limit of their distribution range. Int. J. Biometeorol. 58, 1853–1864. doi: 10.1007/s00484-014-0787-7
Flynn, D. F. B., and Wolkovich, E. M. (2018). Temperature and photoperiod drive spring phenology across all species in a temperate forest community. New Phytol. 219, 1353–1362. doi: 10.1111/nph.15232
Forsythe, W. C., Rykiel, E. J., Stahl, R. S., Wu, H., and Schoolfield, R. M. (1995). A model comparison for daylength as a function of latitude and day of year. Ecol. Modell. 80, 87–95. doi: 10.1016/0304-3800(94)00034-F
Fu, Y. H., Piao, S., Zhao, H., Jeong, S. J., Wang, X., Vitasse, Y., et al. (2014). Unexpected role of winter precipitation in determining heat requirement for spring vegetation green-up at northern middle and high latitudes. Glob. Chang. Biol. 20, 3743–3755. doi: 10.1111/gcb.12610
Ge, Q., Wang, H., Rutishauser, T., and Dai, J. (2015). Phenological response to climate change in China: a meta-analysis. Glob. Chang. Biol. 21, 265–274. doi: 10.1111/gcb.12648
Griffiths, G. M., Chambers, L. E., Haylock, M. R., Manton, M. J., Nicholls, N., Baek, H. J., et al. (2005). Change in mean temperature as a predictor of extreme temperature change in the Asia-Pacific region. Int. J. Climatol. 25, 1301–1330. doi: 10.1002/joc.1194
Gu, L., Hanson, P. J., Post, W., Mac Kaiser, D. P., Yang, B., et al. (2008). The 2007 eastern US spring freeze: Increased cold damage in a warming world? Bioscience 58, 253–262. doi: 10.1641/B580311
Hänninen, H., and Tanino, K. (2011). Tree seasonality in a warming climate. Trends Plant Sci. 16, 412–416. doi: 10.1016/j.tplants.2011.05.001
Hu, Z., Wang, H., Dai, J., Ge, Q., and Lin, S. (2022). Stronger spring phenological advance in future warming scenarios for temperate species with a lower chilling sensitivity. Front. Plant Sci. 13:830573. doi: 10.3389/fpls.2022.830573
Junttila, O., and Hänninen, H. (2012). The minimum temperature for budburst in Betula depends on the state of dormancy. Tree Physiol. 32, 337–345. doi: 10.1093/treephys/tps010
Kalberer, S. R., Arora, R., Leyva-Estrada, N., and Krebs, S. L. (2007). Cold hardiness of floral buds of deciduous azaleas: dehardening, rehardening, and endodormancy in late winter. J. Am. Soc. Hortic. Sci. 132, 73–79. doi: 10.21273/jashs.132.1.73
Kalberer, S. R., Wisniewski, M., and Arora, R. (2006). Deacclimation and reacclimation of cold-hardy plants: current understanding and emerging concepts. Plant Sci. 171, 3–16. doi: 10.1016/j.plantsci.2006.02.013
Kimura, K., Yasutake, D., Oki, T., Yoshida, K., and Kitano, M. (2021). Dynamic modelling of cold-hardiness in tea buds by imitating past temperature memory. Ann. Bot. 127, 317–326. doi: 10.1093/aob/mcaa197
Körner, C. (2012). Alpine Treelines: Functional Ecology of the Global High Elevation Tree Limits. Basel: Springer Science & Business Media.
Kramer, K. (1994). A modelling analysis of the effects of climatic warming on the probability of spring frost damage to tree species in The Netherlands and Germany. Plant. Cell Environ. 17, 367–377. doi: 10.1111/j.1365-3040.1994.tb00305.x
Kreyling, J., Schmid, S., and Aas, G. (2015). Cold tolerance of tree species is related to the climate of their native ranges. J. Biogeogr. 42, 156–166. doi: 10.1111/jbi.12411
Lang, G. A., Early, J. D., Martin, G. C., and Darnell, R. L. (1987). Endo-, para-, and ecodormancy: physiological terminology and classification for dormancy research. HortScience 22, 371–377.
Laube, J., Sparks, T. H., Estrella, N., Höfler, J., Ankerst, D. P., and Menzel, A. (2014). Chilling outweighs photoperiod in preventing precocious spring development. Glob. Chang. Biol. 20, 170–182. doi: 10.1111/gcb.12360
Leinonen, I. (1996). A simulation model for the annual frost hardiness and freeze damage of scots pine. Ann. Bot. 78, 687–693. doi: 10.1006/anbo.1996.0178
Leinonen, I., Repo, T., and Hänninen, H. (1997). Changing environmental effects on frost hardiness of scots pine during dehardening. Ann. Bot. 79, 133–138. doi: 10.1006/anbo.1996.0321
Lenz, A., Hoch, G., Vitasse, Y., and Körner, C. (2013). European deciduous trees exhibit similar safety margins against damage by spring freeze events along elevational gradients. New Phytol. 200, 1166–1175. doi: 10.1111/nph.12452
Man, R., Lu, P., and Dang, Q. L. (2017). Insufficient chilling effects vary among boreal tree species and chilling duration. Front. Plant Sci. 8:1354. doi: 10.3389/fpls.2017.01354
Marino, G. P., Kaiser, D. P., Gu, L., and Ricciuto, D. M. (2011). Reconstruction of false spring occurrences over the southeastern United States, 1901-2007: an increasing risk of spring freeze damage? Environ. Res. Lett. 6:024015. doi: 10.1088/1748-9326/6/2/024015
Meier, U. (2001). Growth Stages of Mono-and Dicotyledonous Plants: BBCH Monograph, 2nd Edn. Berlin: Federal Biological Research Centre for Agriculture and Forestry.
Menzel, A., Sparks, T. H., Estrella, N., Koch, E., Aaasa, A., Ahas, R., et al. (2006). European phenological response to climate change matches the warming pattern. Glob. Chang. Biol. 12, 1969–1976. doi: 10.1111/j.1365-2486.2006.01193.x
Menzel, A., Yuan, Y., Matiu, M., Sparks, T., Scheifinger, H., Gehrig, R., et al. (2020). Climate change fingerprints in recent European plant phenology. Glob. Chang. Biol. 26, 2599–2612. doi: 10.1111/gcb.15000
Pardee, G. L., Inouye, D. W., and Irwin, R. E. (2017). Direct and indirect effects of episodic frost on plant growth and reproduction in subalpine wildflowers. Glob. Chang. Biol. 24, 848–857. doi: 10.1111/ijlh.12426
Park, I. W., Ramirez-Parada, T., and Mazer, S. J. (2021). Advancing frost dates have reduced frost risk among most North American angiosperms since 1980. Glob. Chang. Biol. 27, 165–176. doi: 10.1111/gcb.15380
Peaucelle, M., Janssens, I. A., Stocker, B. D., Descals Ferrando, A., Fu, Y. H., Molowny-Horas, R., et al. (2019). Spatial variance of spring phenology in temperate deciduous forests is constrained by background climatic conditions. Nat. Commun. 10:5388. doi: 10.1038/s41467-019-13365-1
Richardson, A. D., Hufkens, K., Milliman, T., Aubrecht, D. M., Furze, M. E., Seyednasrollah, B., et al. (2018). Ecosystem warming extends vegetation activity but heightens vulnerability to cold temperatures. Nature 560, 368–371. doi: 10.1038/s41586-018-0399-1
Roeber, V. M., Schmülling, T., and Cortleven, A. (2022). The photoperiod?: handling and causing stress in plants. Front. Plant Sci. 12:781988. doi: 10.3389/fpls.2021.781988
Sakai, A., and Weiser, C. J. (1973). Freezing resistance of trees in North America with reference to tree regions. Ecology 54, 118–126. doi: 10.2307/1934380
Singh, R. K., Svystun, T., AlDahmash, B., Jönsson, A. M., and Bhalerao, R. P. (2017). Photoperiod- and temperature-mediated control of phenology in trees – a molecular perspective. New Phytol. 213, 511–524. doi: 10.1111/nph.14346
Tao, Z., Xu, Y., Ge, Q., Dai, J., and Wang, H. (2021). Reduced frost hardiness in temperate woody species due to climate warming: a model-based analysis. Clim. Change 165:35. doi: 10.1007/s10584-021-03074-4
Vitasse, Y., and Basler, D. (2013). What role for photoperiod in the bud burst phenology of European beech. Eur. J. For. Res. 132, 1–8. doi: 10.1007/s10342-012-0661-2
Vitasse, Y., Lenz, A., and Körner, C. (2014). The interaction between freezing tolerance and phenology in temperate deciduous trees. Front. Plant Sci. 5:541. doi: 10.3389/fpls.2014.00541
Vitasse, Y., Schneider, L., Rixen, C., Christen, D., and Rebetez, M. (2018). Increase in the risk of exposure of forest and fruit trees to spring frosts at higher elevations in Switzerland over the last four decades. Agric. For. Meteorol. 248, 60–69. doi: 10.1016/j.agrformet.2017.09.005
Vitra, A., Lenz, A., and Vitasse, Y. (2017). Frost hardening and dehardening potential in temperate trees from winter to budburst. New Phytol. 216, 113–123. doi: 10.1111/nph.14698
Wang, H., Dai, J., Peñuelas, J., Ge, Q., Fu, Y. H., and Wu, C. (2022). Winter warming offsets one half of the spring warming effects on leaf unfolding. Glob. Chang. Biol. 28, 6033–6049. doi: 10.1111/gcb.16358
Wang, H., Wang, H., Ge, Q., and Dai, J. (2020a). The interactive effects of chilling, photoperiod, and forcing temperature on flowering phenology of temperate woody plants. Front. Plant Sci. 11:443. doi: 10.3389/fpls.2020.00443
Wang, H., Wu, C., Ciais, P., Peñuelas, J., Dai, J., Fu, Y., et al. (2020b). Overestimation of the effect of climatic warming on spring phenology due to misrepresentation of chilling. Nat. Commun. 11:4945. doi: 10.1038/s41467-020-18743-8
Weinberger, J. H. (1950). Chilling requirements of peach varieties. Proc. Am. Soc. Hortucultural Sci. 56, 122–128.
Zohner, C. M., Mo, L., Renner, S. S., Svenning, J. C., Vitasse, Y., Benito, B. M., et al. (2020). Late-spring frost risk between 1959 and 2017 decreased in North America but increased in Europe and Asia. Proc. Natl. Acad. Sci. U S A. 117, 12192–12200. doi: 10.1073/pnas.1920816117
Keywords: spring phenology, climate change, dormancy, cold hardiness, experiment
Citation: Hu Z, Lin S, Wang H and Dai J (2022) Seasonal variations of cold hardiness and dormancy depth in five temperate woody plants in China. Front. For. Glob. Change 5:1061191. doi: 10.3389/ffgc.2022.1061191
Received: 04 October 2022; Accepted: 16 November 2022;
Published: 30 November 2022.
Edited by:
Qing-Lai Dang, Lakehead University, CanadaReviewed by:
Rongzhou Man, Ontario Ministry of Northern Development, Mines, Natural Resources and Forestry, CanadaCopyright © 2022 Hu, Lin, Wang and Dai. This is an open-access article distributed under the terms of the Creative Commons Attribution License (CC BY). The use, distribution or reproduction in other forums is permitted, provided the original author(s) and the copyright owner(s) are credited and that the original publication in this journal is cited, in accordance with accepted academic practice. No use, distribution or reproduction is permitted which does not comply with these terms.
*Correspondence: Huanjiong Wang, d2FuZ2hqQGlnc25yci5hYy5jbg==; Junhu Dai, ZGFpamhAaWdzbnJyLmFjLmNu
Disclaimer: All claims expressed in this article are solely those of the authors and do not necessarily represent those of their affiliated organizations, or those of the publisher, the editors and the reviewers. Any product that may be evaluated in this article or claim that may be made by its manufacturer is not guaranteed or endorsed by the publisher.
Research integrity at Frontiers
Learn more about the work of our research integrity team to safeguard the quality of each article we publish.