
94% of researchers rate our articles as excellent or good
Learn more about the work of our research integrity team to safeguard the quality of each article we publish.
Find out more
ORIGINAL RESEARCH article
Front. For. Glob. Change , 06 January 2022
Sec. Tropical Forests
Volume 4 - 2021 | https://doi.org/10.3389/ffgc.2021.775341
This article is part of the Research Topic Drivers of Mangrove Forest Change and its Effects on Biodiversity and Ecosystem Services View all 13 articles
 Clare Duncan1,2*
 Jurgenne H. Primavera3,4
 Nicholas A. O. Hill5,6†
 Dominic C. J. Wodehouse7
 Heather J. Koldewey1,4
Opportunities to boost climate change mitigation and adaptation (CCMA) and sustainable conservation financing may lie in enhancing blue carbon sequestration, particularly in developing nations where coastal ecosystems are extensive and international carbon markets offer comparatively attractive payments for environmental stewardship. While blue carbon is receiving increased global attention, few credit-generating projects are operational, due to low credit-buyer incentives with uncertainty in creditable emissions reductions and high project costs. Little empirical guidance exists for practitioners to quantify return-on-investment (ROI) and viability of potential projects, particularly for rehabilitation where multiple implementation options exist with diverse associated costs. We map and model drivers of mangrove natural regeneration (NR) using remote sensing (high-resolution satellite imagery segmentation and time-series modeling), and subsequent carbon sequestration using field- and literature-derived data, across abandoned aquaculture ponds in the Philippines. Using project-specific cost data, we then assess ROI for a hypothetical rehabilitation-focused mangrove blue carbon project at a 9.68 ha abandoned pond over a 10-year timeframe, under varied rehabilitation scenarios [NR vs. assisted natural regeneration (ANR) with planting], potential emissions reduction accreditation methodologies, carbon prices and discount rates. NR was faster in lower-lying ponds with lower tidal exposure (greater pond dike retention). Forecasted carbon sequestration was 3.7- to 5.2-fold and areal “greenbelt” regeneration 2.5- to 3.4-fold greater in our case study under ANR than NR. Variability in modeled sequestration rates drove high uncertainty and credit deductions in NR strategies. ROI with biomass-only accreditation was low and negative under NR and ANR, respectively. ROI was greater under ANR with inclusion of biomass and autochthonous soil carbon; however, neither strategy was highly profitable at current voluntary market carbon prices. ANR was the only scenario that fulfilled coastal protection greenbelt potential, with full mangrove cover within 10 years. Our findings highlight the benefits of ANR and soils inclusion in rehabilitation-oriented blue carbon projects, to maximize carbon sequestration and greenbelt enhancement (thus enhance pricing with potential bundled credits), and minimize forecasting uncertainty and credit-buyers’ perceived risk. An ANR rehabilitation strategy in low-lying, sea-facing abandoned ponds with low biophysical intervention costs may represent large blue carbon CCMA opportunities in regions with high aquaculture abandonment.
Coastal ecosystems, such as mangrove forests, are among the world’s most productive ecosystems, maintaining high levels of biodiversity (Thompson and Rog, 2019) and delivering substantial ecosystem services to support local- to global-scale human well-being relative to their spatial coverage (Donato et al., 2011; McLeod et al., 2011; Curnick et al., 2019). Particularly pertinent in the current global climate emergency is their ability to support climate change mitigation and adaptation (CCMA) across the world’s coasts, due to high relative sequestration and storage of “blue carbon,” and protecting coastal communities and infrastructure from increasingly frequent storm conditions (Donato et al., 2011; Lee et al., 2014; Duncan et al., 2016; Hochard et al., 2019). Despite their importance, mangroves remain in global decline due to high coastal land-use demand and extractive dependency (Richards and Friess, 2016; Thomas et al., 2017; Bunting et al., 2018; Friess et al., 2019), facing substantial future challenges from abiotic climate change processes (Lovelock et al., 2015; Ward et al., 2016). In some regions, extensive historical mangrove loss to production land-uses such as aquaculture ponds (Richards and Friess, 2016; Kauffman et al., 2017; Bunting et al., 2018; Goldberg et al., 2020) has led to their rehabilitation being high on national coastal management and conservation agendas (Primavera and Esteban, 2008; Phan et al., 2015; Lee et al., 2019). To promote incentives for conservation intervention, increasing empirical scientific focus is now placed on identifying investible mangrove ecosystem service benefits, in particular for blue carbon projects (e.g., The Blue Natural Capital Financing Facility, 2021; Zeng et al., 2021). Such opportunities could unlock sustainable conservation financing, particularly in low- and middle-income nations where international carbon markets could offer comparatively attractive payments for environmental stewardship (Thompson et al., 2014). However, high perceived risk in blue carbon permanence, uncertainty in creditable emissions forecasting in the absence of blue carbon-specific quantification methodologies, large project costs and political risk have meant that mangroves’ high CCMA potential has historically been largely unrealized in terms of operational blue carbon projects (Locatelli et al., 2014; Wylie et al., 2016; Herr et al., 2017).
In 2020, a major milestone was reached with the first blue carbon emissions reduction/sequestration quantification methodology approved under the Verified Carbon Standard that now enables inclusion of disproportionately large carbon sequestration in the soil compartment of blue carbon ecosystems (Verra, 2020a). This is likely to now herald a wealth of emerging blue carbon projects globally. To capitalize on this opportunity, a challenge to the design and implementation of blue carbon projects now lies in the ability of practitioners to assess potential return-on-investment (ROI), and hence their viability, prior to embarking on extensive and costly project registration and verification processes. While a major driver of potential blue carbon project costs is likely to be spatial scale, variation in initiation and on-going budget requirements will also depend on project implementation design. This is particularly true for rehabilitation-oriented mangrove management, where multiple intervention options exist with diverse associated costs and probability of long-term success (Bayraktarov et al., 2016; Lee et al., 2019; Wodehouse and Rayment, 2019; Su et al., 2021). Managers may adopt Ecological Mangrove Rehabilitation, with interventions to reinstate former hydrology in converted lands (e.g., abandoned aquaculture ponds, salt ponds, and agricultural land) to facilitate natural mangrove regeneration [hereafter “natural regeneration” (NR); Lewis and Brown, 2014], or more costly Assisted Natural Regeneration (hereafter “ANR”). ANR employs (a) (community-based) out-planting of nursery-reared or naturally available wildings to supplement NR in sites with more challenging or sub-optimal conditions, and (b) optional restoration of hydrology [e.g., breaching of aquaculture pond banks (“dikes”) where required] (Primavera et al., 2012b; Mangrove Action Project, 2021). Either strategy may be optimal for a given site, with faster and denser mangrove regeneration enhancing credit generation, associated ecosystem services (e.g., coastal protection, fisheries enhancement), and therefore pricing under co-benefit accreditation schemes (Plan Vivo, 2013). However, quantitative evaluation of which rehabilitation strategy may be financially optimal in a given context remains challenging. Research to date has quantified investible blue carbon opportunities and ROI utilizing broad mean project costs across large spatial scales and contexts (e.g., Jakovac et al., 2020; Taillardat et al., 2020; Zeng et al., 2021). However, the relative ecological outcomes of mangrove NR and ANR strategies are rarely considered in empirical studies, and these authors know of no existing study to date that explores variation in blue carbon credit generation potential and ROI under differing rehabilitation intervention strategies. This empirical data gap presents a particular challenge for managers designing potential small-scale (and community-based) blue carbon projects with minimal implementation budgets. There is thus a significant gap between the theory and practice of mangrove blue carbon projects that may represent a barrier to the development of operational projects to date despite the high interest.
The guiding principles underpinning successful implementation of NR-oriented rehabilitation are tidal connectivity to a viable source of mangrove propagules, favorable intertidal position [i.e., elevation above mean sea level (a.m.s.l.)] and low tidal energy exposure for rapid propagule establishment and regeneration in former mangrove areas (Lewis and Brown, 2014). By contrast, ANR can bolster NR rates in favorable sites (see also Huxham et al., 2010) and/or supplant NR where one or more of these conditions is sub-optimal, thus enhancing mangrove regeneration rates and strengthening coastal protection (“greenbelts”) in the face of rapidly advancing climate change (Primavera et al., 2012b; Mangrove Action Project, 2021). However, ANR can incur substantial costs (Primavera et al., 2012b; Bayraktarov et al., 2016), which must be weighed against the relative potential carbon credit returns vs. NR alone (i.e., ROI) to assess whether the approach is justified. Drivers of mangrove NR have been extensively established in experimental and site-specific field studies (e.g., Balke et al., 2011; Kamali and Hashim, 2011); however, their empirical quantification across larger scales (e.g., between sites) is absent, hindering out ability to predict (rates of) site-specific carbon sequestration potential from NR relative to ANR. Furthermore, ANR may buffer natural inter-annual variability in propagule availability and/or stochastic perturbations, thereby reducing uncertainty in emissions reduction forecasting and associated credit reductions (see Verra, 2019), but this remains empirically unquantified across rehabilitation projects. These data gaps may be a reason that all currently registered blue carbon projects do not fully account for NR in their ex ante project emissions reduction forecasts [ANR strategies only: Blue Ventures, 2019; Mikoko Pamoja, 2020; rewetting/soil stabilization from reinstated hydrology only: Conservation International, 2021]. Remote sensing has long been applied in largely inaccessible mangroves to successfully track changes in their distribution and functioning (Wang et al., 2019), and high resolution imagery has recently been employed to track fine-scale (tree-specific) landward mangrove expansion (Whitt et al., 2020). Similar high resolution monitoring of NR and ANR rates combined with spatial analysis across landscape-scales may enable quantification of NR rate drivers and relative rehabilitation and emissions reduction potential under similar conditions. However, to date, these approaches have not been employed to enhance our predictive capacity in predicting carbon sequestration in areas under different management regimes and in evaluating potential blue carbon project scenario options.
To close these identified data gaps and investigate the relative efficacy of ANR over NR-oriented mangrove blue carbon projects, here we model potential carbon sequestration and credit generation potential in a hypothetical project using a case study abandoned aquaculture pond in West Visayas, Philippines. The Philippines has experienced substantial mangrove loss: approximately 50% of the former 500,000 ha (Spalding et al., 2010) disappeared over the last century, due primarily to “extensive” (large area but shallow depth) brackish-water pond aquaculture development in former mangrove areas (Primavera, 2005). Some of the highest pond densities occur in the West Visayas region (Primavera and Esteban, 2008; Department of Agriculture of the Philippines – Bureau of Fisheries and Aquatic Resources, 2020). Development is largely unregulated, and despite laws mandating 50–100 m greenbelts (Primavera et al., 2012a), ponds are often built to the shoreline. Abandonment is high (Samson and Rollon, 2011; Primavera et al., 2012a), due primarily to bank (“dike”) breaches in sea-facing ponds over low productivity (Primavera et al., 2014). Legal mandates in the Philippines dictate that government-leased ponds that are abandoned must be reverted to public lands and rehabilitated to mangrove forest by the relevant government department. However, a myriad of confounding factors, centered predominantly on low political will, means cancelation and reversion rarely occurs: large areas of ponds built in former mangrove lie fallow and the few canceled leases are often absorbed and re-tenured or operated illegally, thus the long-term persistence of any naturally regenerated (NR) mangroves within abandoned ponds is not secured (Primavera et al., 2014). If better regulated and enforced, abandoned pond tenure reversion could afford a major rehabilitated-oriented emissions reduction opportunity in the Philippines, with minimal physical intervention required to generate blue carbon additionality (natural dike breaching; Primavera et al., 2014). Herein, we explore the potential for this abandoned pond blue carbon opportunity under NR and assisted NR (ANR; e.g., planting) strategies. First, we map mangrove NR (n = 8) and ANR (n = 1) at annual time-steps at identified abandoned aquaculture ponds, using a novel image classification approach with open access high resolution imagery. Second, we use open access spatial data to model the main drivers of these time-series NR rates of mangrove areal coverage across abandoned ponds. Third, we employ model-derived and observed NR and ANR rates (and uncertainty) to predict mangrove regeneration across a hypothetical 10-year time period at our case study abandoned pond, and apply field- and literature-derived rehabilitated mangrove carbon sequestration data to forecast potential rehabilitated carbon stocks at the site under these scenarios. Finally, we apply approved emissions reduction quantification protocols (Verra, 2020b) under potential accreditation methodologies, alongside ANR project cost data, varied potential voluntary market carbon prices and discount rates, to explore variability in relative ROI across NR and ANR scenarios at our case study site. Here we hypothesize slower (and more variable) areal regeneration and carbon sequestration under NR, and greater ROI with ANR over NR after deduction of biophysical project costs.
Via inspection of high-resolution Google Earth (GE) Red-Green-Blue (RGB) imagery for 2018–2019 (Google Earth Pro, 2019), we selected NR abandoned aquaculture ponds (those with mangroves present) in West Visayas (Figure 1) as study sites under the following criteria: (1) they were located in the coastal zone of Panay or Guimaras islands; (2) they were sea- or estuary-facing (breached pond dikes immediately adjacent to these water bodies), i.e., they had direct hydrological access for moderate-distance propagule dispersal from adjacent established mangrove stands; (3) there was high-resolution GE RGB imagery coverage from the point of sea- or estuary-facing dike breaching (e.g., beginning of the process of NR), and; (4) at least three high-resolution RGB imagery time-points were available post-dike breaching. Under these criteria, we identified seven abandoned ponds with high-resolution RGB imagery to quantify mangrove NR over time, covering Buenavista, Leganes, Barotac Nuevo, and San Dionisio municipalities in Iloilo Province, and Panay, Roxas City, and Ivisan municipalities in Capiz Province (Figure 1).
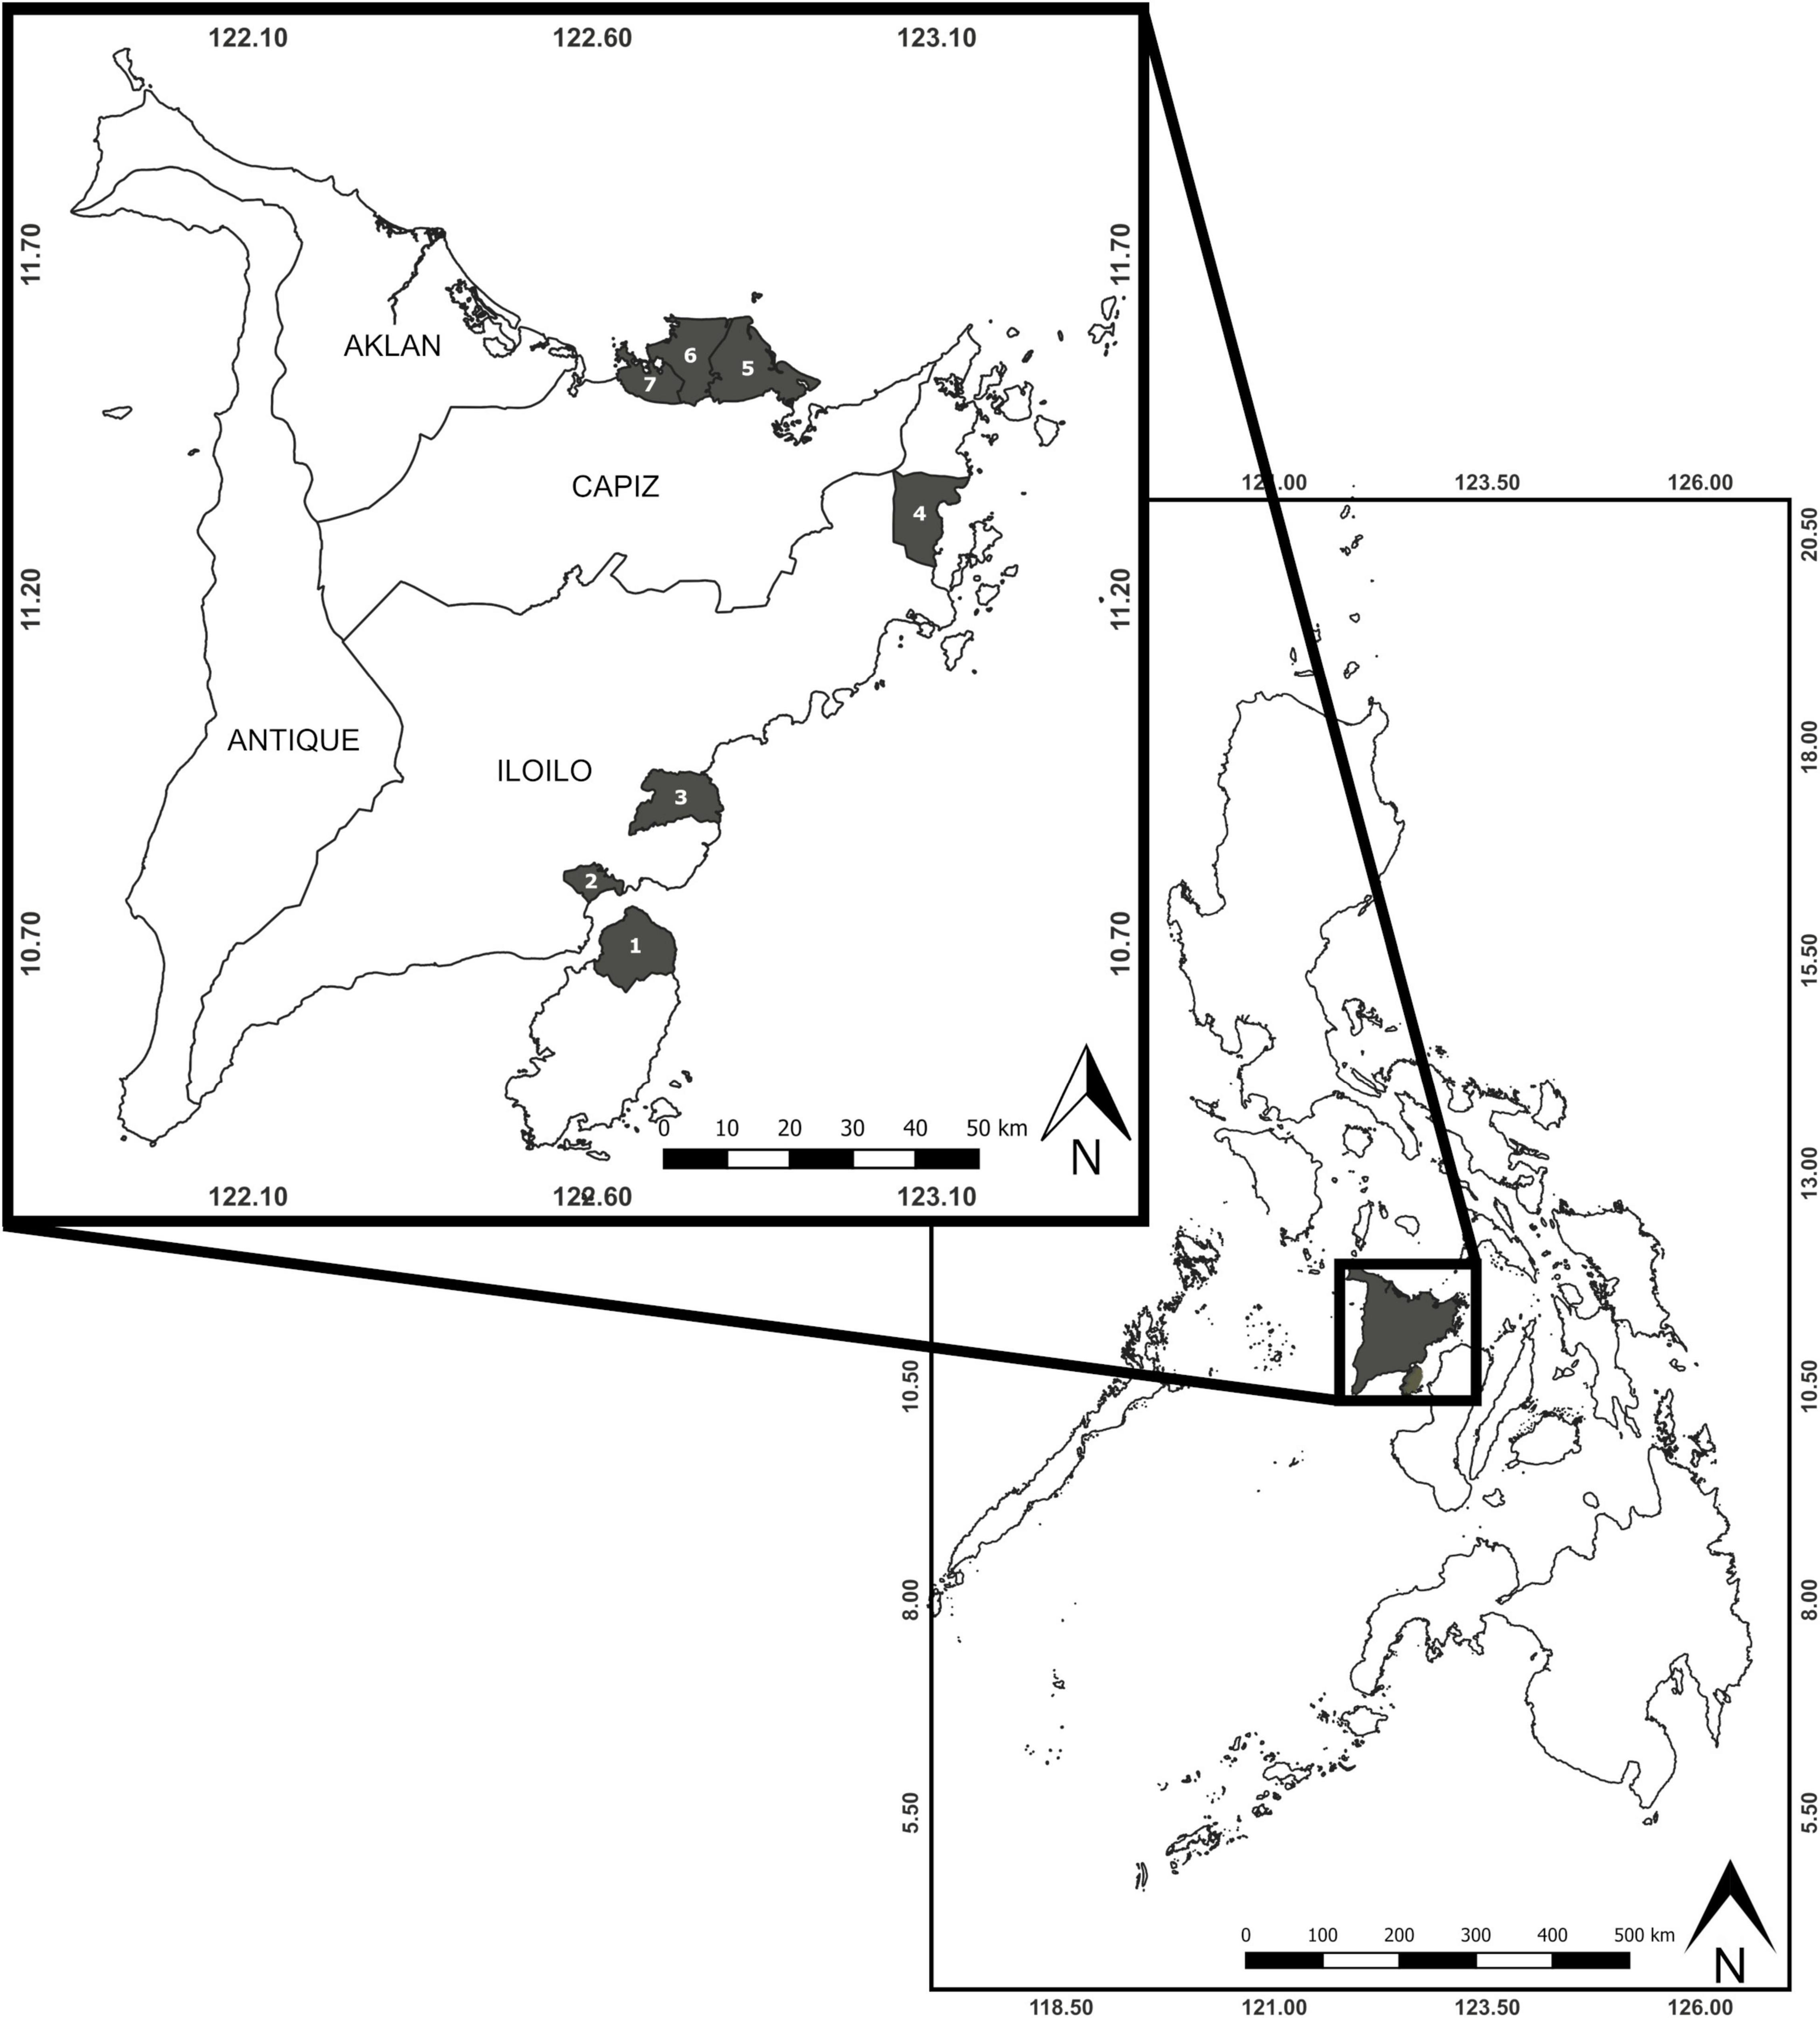
Figure 1. Locations of municipalities with abandoned aquaculture ponds examined within this study, within Iloilo and Capiz Provinces, West Visayas, Philippines. (1) Buenavista, Guimaras, Iloilo [n = 1 naturally-regenerating (NR) abandoned aquaculture pond]; (2) Leganes, Iloilo [n = 1 NR and n = 1 assisted naturally-regenerating (ANR; planted) abandoned pond]; (3) Barotac Nuevo, Iloilo (n = 1 NR abandoned pond); (4) San Dionisio, Iloilo (n = 1 NR abandoned pond); (5) Panay, Capiz (n = 1 NR abandoned pond); (6) Roxas City, Capiz (n = 1 NR abandoned pond), and; (7) Ivisan, Capiz (n = 1 NR abandoned pond).
In addition, we selected one abandoned pond site, Leganes Katunggan ecopark, Iloilo, known to have experienced early NR (2005–2009) followed by ANR. Here, sea-facing pond dikes were breached by wave action between 2005 and 2008, enabling tidal and mangrove dispersal re-connection, and in 2009 tenure status of the pond was secured by the Leganes local government unit (LGU; Primavera et al., 2012b). ANR consisted of initial out-planting of ∼20,000 seedlings (mainly Avicennia marina, with some Sonneratia alba and Rhizophora sp.) in 3.5 ha of the mid- to upper-intertidal pond zone over 2009–2011 under the Zoological Society of London (ZSL) Philippines’ Community-based Mangrove Rehabilitation Project, followed by further planting of ∼63,000 seedlings over the remaining 6.18 ha over 2012–2015 under Leganes LGU governance. Small-scale voluntary planting activities continue in the erosion-prone sea-facing area of the pond post-2015 (Loma and Batislaon, 2021, pers. comm. 2021). In all cases, rehabilitation labor and expenses for wilding collection and out-planting were provided through voluntary activity from student groups, local fisherfolk, government employees and civil society organization groups, and seedling nursery and plantation maintenance conducted in collaboration between local fisherfolk and Leganes LGU. For further rehabilitation and site details see Primavera et al. (2012b) and Duncan et al. (2016).
For each identified abandoned pond, we exported all available historical RGB GE imagery at the highest possible spatial resolution from the point of pond dike breaching onward (to 1st August 2019). We reduced initial high-resolution RGB imagery datasets for each abandoned pond to retain a single image for each available year since dike breaching, with, where possible, the selected annual (day-time) image: (1) having no cloud cover present [three sites had one image in the time-series with partial cloud cover: Basiao, Ivisan (2008: 25.00% of images), Matnog, Ivisan (2013: 14.29% of images) and Talon, Roxas City (2013: 11.11% of images)]; (2) being obtained at low-tide [22 of 55 images were acquired at high tide; mean 39.97% (0-75.00%) per site], and; (3) being acquired within a similar time of year as all other imagery within a site’s time-series (see Supplementary Table 1). In addition to the original RGB bands, we derived additional indices using the “jpeg” (Urbanek, 2019) and “raster” (Hijmans et al., 2019) packages in R v.3.6.1 (R Development Core Team, 2019): The Green-Red Vegetation Index (GRVI), an index describing vegetation “greenness” from RGB imagery (Motohka et al., 2010) in the absence of near-infrared bands in the initial imagery to quantify, e.g., the Normalized Difference Vegetation Index (Pettorelli, 2013), and a “high reflectance” index (Red+Green+Blue), to aid in identifying features such as man-made structures and bare ground. Outputted stacked rasters (all raw bands and indices: n = 5) for each time-point were then georeferenced in QGIS v.3.8.3 (QGIS Development Team, 2019), to 1 m2 resolution, against site-specific ground control points. Ground control points were created in GE, using the most recent available high-resolution RGB imagery, using easily identifiable features (e.g., corners of pond dikes, buildings, and centers of trees) that were static through entire time-series [mean 9.44 (5-18) points per site].
Time-point-specific georeferenced stacked rasters for each abandoned pond were then split into individual band and index rasters, and Simple Linear Iterative Clustering (SLIC) superpixels segmentation (Achanta et al., 2012) was applied across all site-specific rasters (n = 5) for each time-point in SAGA GIS v.7.3.0 (Conrad et al., 2015). The starting superpixel size was set to four pixels (4 m2), with a minimum output segment size of one pixel (1 m2), and segmentation conducted over a maximum of 100 iterations per time-point. Owing to low spectral resolution in input imagery (e.g., RGB and two derived indices only), classification algorithms were not applied to outputted segmented imagery; instead, segments representing mangroves were manually extracted via inspection against original high-resolution RGB GE imagery (≥25% of a segment with mangrove present) in QGIS. While we acknowledge that this approach possibly overestimated mangrove cover, the same rule was applied to all imagery, thus not impacting estimated rates of mangrove regeneration within- and between-abandoned ponds. Time-point-specific extracted mangrove segments were then dissolved, and areal estimates of mangrove cover calculated.
Two variables were created to proxy local-scale propagule availability, using Philippines’ extant mangrove cover in 2010 (Long et al., 2014): “adjacent mangrove extent” and “distance to source population” (Table 1). To index “adjacent mangrove extent,” 2010 mangrove cover (hectares) was clipped to a buffer of 2.5 km from the boundaries of each abandoned pond and its area extracted (R package “rgeos”: Bivand et al., 2019). To index “distance to source population,” 2010 mangrove cover was analyzed for contiguous patches (“clump” function: Hijmans et al., 2019), polygonized in QGIS, and the minimum distance between each abandoned pond and its nearest mangrove patch ≥10 ha in area extracted (Bivand et al., 2019). Two variables were created to proxy exposure to wave energy (propagule and sediment retention) within abandoned ponds, using digitized sea- or estuary-facing pond dikes from the most recent image in the respective time-series of high-resolution RGB GE imagery: “proportional remaining pond dikes” and “relative dike protection” (see Table 1 for calculation methods). Finally, two variables were created to proxy (variation in) ground elevation, using 30 m resolution Shuttle Radar Terrain Model (SRTM) Digital Elevation Model (DEM) data (year 2000: United States Geological Survey, 2014): “mean pond elevation” (m: mean elevation across all SRTM DEM pixels within each abandoned pond extent) and “variation in pond elevation” [coefficient of variation (CV) in elevation (m) across all SRTM DEM pixels within each abandoned pond extent] (Table 1).
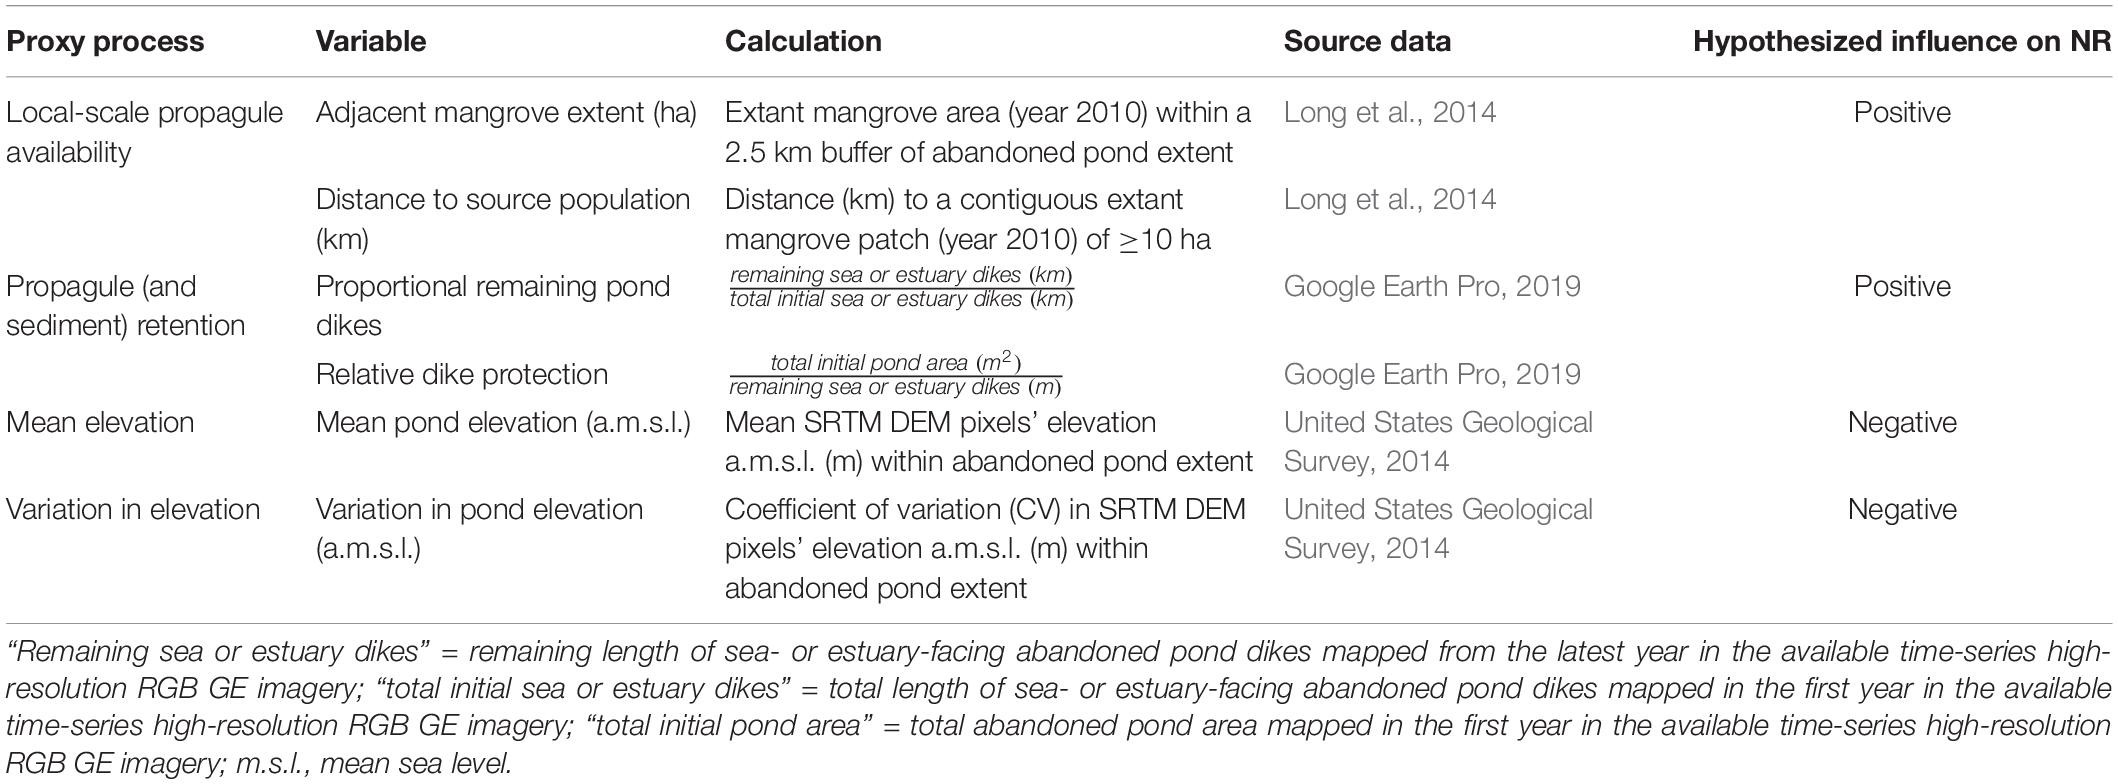
Table 1. Variables employed in statistical analysis of potential drivers of natural regeneration (NR) rates in abandoned aquaculture ponds.
To establish rates of mangrove regeneration (areal increase) over time, we first constructed abandoned pond-specific time-series linear regression models with mangrove area (ha) as a response variable and year as the explanatory variable. Linear models predicting rate of areal increase were conducted only across years until which abandoned pond-specific areal increase “leveled-off.” “Leveling-off” of rates of areal increase were established via the following approach for each abandoned pond: (1) the “peak maxima rate” (PMR) and “pre-peak minima rate” (PPMR: minimum observed rate of areal increase prior to the PMR) (ha year–1) across the time-series were identified; (2) if the PMR was located at the end of the time-series or fewer than two rate datapoints were observed post-PMR, no “leveling-off” was identified; (3) if there was no PPMR in the time-series, “leveling-off” was only established when a post-PMR rate reached below the 25% quantile of the observed distribution of rates across the time-series (Q25); (4) if a post-PMR continuing decline in rate was observed, “leveling-off” was established immediately after the PMR if all post-PMR rates were below the PPMR; (4) if additional rate increases above the PPMR were observed post-PMR, “leveling-off” was established at the point at which the rate dropped below Q25 post- the final peak, and; (5) if additional rate increases below the PPMR were observed post-PMR, “leveling-off” was established at the first point at which the rate dropped below Q25 post-PMR. We acknowledge that conducting pond-specific time-series analyses only to the point of “leveling-off” reduced our linear regression sample sizes; however, ponds (and high-resolution imagery availability) were not consistent in time since dike breaching (or ANR) and analysis of full time-series datasets would have artificially deflated quantified NR rates in some ponds (i.e., those with longer time-series data available; see Supplementary Table 1) where mangrove cover NR rates decrease over time.
Two proxy response variables were then employed to explore drivers of rates of NR in abandoned ponds: “rate of areal increase” (mean slope estimates from the initial regressions for each pond: ha year–1) and “time-to-leveling” (number of years post dike-breaching at which areal increase rates were observed to “level-off”). A list of candidate linear models was created for each response variable: (1) no interactions were anticipated between explanatory variables, and so all candidate models included additive terms; (2) variables proxying the same process (i.e., “adjacent mangrove extent” (ha) and “distance to source population” (km), and “proportional remaining pond dikes” and “relative dike protection”) were not considered within the same models, and; (3) to avoid overparameterization of model fits, only three- and single-variable models were constructed for “rate of areal increase” (ha year–1; n = 8 observations; 27 candidate models) and “time-to-leveling” (years; n = 4 observations; six candidate models) response variables, respectively. Models were ranked via AICc values (Akaike, 1974; Hurvich and Tsai, 1989), and best-fitting model(s) for each response variable were selected based on a threshold of delta AICc < 2 (Burnham and Anderson, 2002). Best-fitting model(s) for each response variable were then employed to site data for the Leganes Katunggan pond, to predict long-term rates of NR at the abandoned pond without planting activities.
We calculated carbon sequestration from mangrove NR and ANR in the Leganes Katunggan abandoned pond over a 10 year period, representing 2005–2015, under three scenarios: (1) best-fitting model-predicted “rate of areal increase” (ha year–1) (run using mean model estimates minus and plus 1 s.e.), (2) observed “rate of areal increase” under NR (2005–2009), and (3) observed “rate of areal increase” under ANR (planting: 2009–2013) at the site (run using ANR Leganes Katunggan-specific mean time-series model estimate plus and minus 1 s.e.). For each scenario, additional mangrove cover was applied at annual increments under the model-predicted or observed rates above. Annual carbon sequestration rates in soil and biomass compartments were applied to regenerated areas at each time-step. The low-intertidal, sea-facing, fringing nature of the studied abandoned ponds lends their soils to trapping relatively high levels of allochthonous (non-mangrove) organic carbon (Kusumaningtyas et al., 2019; Sasmito et al., 2020). Published soil carbon sequestration rates observed in NR fringing abandoned aquaculture ponds in Southeast Asia (0-10 years) were used in NR scenarios (1-2), assuming 1 cm year–1 accretion rates (Sidik et al., 2019) [2.29 ± 0.96 (1 s.d.) Mg C ha–1 year–1: Duncan et al., 2016 (Philippines); Salmo and Gianan, 2019 (Philippines); Sidik et al., 2019 (Indonesia)]. In NR scenarios, we applied published estimates of mangrove above- and below-ground biomass carbon sequestration (0-22 years) in NR abandoned ponds [1.18 ± 1.07 (1 s.d.) Mg C ha–1 year–1: Duncan et al., 2016 (Philippines); Salmo and Gianan, 2019 (Philippines); Elwin et al., 2019 (Thailand)]. In the ANR scenario (3), we used Leganes Katunggan site-specific soil carbon sequestration rates, also assuming 1 cm year–1 accretion rates, from 0 to 10 years post planting [3.27 ± 1.09 (1 s.d.) Mg C ha–1 year–1: Duncan unpublished data], and above- and below-ground biomass carbon sequestration rates from 0 to 5 years post planting {1.56 ± 0.47 (1 s.d.) Mg C ha–1 year–1: Duncan et al., 2016) and 5-10 years post planting [0.73 ± 0.83 (1 s.d.) Mg C ha–1 year–1: Duncan unpublished data]. For each scenario (and under each areal cover increase rate (see above)}, we generated a range of predicted carbon stock estimates (site Mg C) over 2005-2015 from a normal distribution of the mean and s.d. of sequestration rates above (n = 30 per compartment). Under all scenarios, an initial year of carbon stock from existing mangrove vegetation [e.g., 2004-2005 mapped mangrove cover: 0.38 ha (2005 imagery)] at the above NR carbon sequestration rates was first added.
We converted site-level standing carbon stock projections to Mg CO2e via application of a 3.67 conversion factor (Kauffman and Donato, 2012). We then calculated transactional carbon sequestration potential under three potential emissions reduction accreditation methodologies: B, only above- and below-ground biomass CO2e emissions reduction creditable; BAS, biomass CO2e and additional autochthonous soil organic carbon CO2e emissions reduction creditable, and TOT, biomass CO2e and all additional soil organic carbon CO2e emissions reduction creditable. We calculated autochthonous soil organic carbon contributions for the BAS methodology via calculation of allochthonous organic carbon deductions using Needleman et al. (2018) from mean study sample soil organic carbon content (SOC; %). For NR scenarios (1, 2), mean literature-derived sample SOC (3.60%: Duncan et al., 2016; Sidik et al., 2019; Salmo and Gianan, 2019) was used to estimate autochthonous soil carbon contributions of 53.28% for the 10-year time-series. For the ANR scenario (3), we assumed that the literature-derived NR autochthonous carbon contribution estimate applied for years 0–5, and then applied field-derived mean sample SOC for the site at 10 years of age (5.94%: Duncan et al., unpublished data) and autochthonous soil carbon contributions of 74.14% for years 5–10, due to substantially increased mangrove biomass across this latter half of the time-series. We therefore used a mean of 63.71% autochthonous soil carbon contributions for the ANR scenario (3).
For each scenario and potential accreditation methodology, uncertainty in projected total (all relevant compartments) emissions reduction potential was calculated as:
where PER = projected total project emissions reductions (CO2e). In accordance with approved blue carbon methodologies (VM0007 revision for tidal wetlands: Verra, 2020b), deductions of creditable emissions were then made in any scenario for which the allowable precision level (15%) was exceeded, as:
In the absence of >2 annual data points for mangrove cover in observed NR (2005–2009), uncertainty in scenario 2 was assumed equal to that observed in projected sequestration under scenario 1 (model-predicted NR). We deducted non-permanence credit withholding buffers (Verra, 2019, 2020b) of 30% from net carbon sequestration in ANR scenario 3 to reflect moderate natural risks at the site (typhoons), and increased this buffer to 35% to reflect potential increased erosion/scouring in sea-facing ponds without out-planted saplings (Huxham et al., 2010; Balke et al., 2011; Primavera et al., 2012b).
For each scenario and potential accreditation methodology, we calculated the number of carbon credits generated (units of 1 Mg CO2e per credit) at annual increments and carried any carbon sequestration not having generated credits (<1 Mg CO2e) over to the following year. We calculated transactional carbon credit potential (USD) via application of three different carbon prices and three potential discount rates at annual increments. For each simulated year, i, discounting was applied to potential ROI from potential annual credit sales (dROIp,d) as:
where, Credits = scenario- and potential accreditation methodology-specific mean number of carbon credits generated, Price = carbon price applied [p = USD $2.51 (mean 2020 voluntary market price); USD $9.70 (mean 2020 Afforestation/Reforestation project voluntary market price: Forest Trends’ Ecosystem Marketplace, 2021), or; USD $25.00 Mg CO2e–1 (hypothetical inflated price for associated human well-being and biodiversity benefits and with demand assumed to rise to 500 Mt CO2e year–1: Turner et al., 2021)], and Discount = discount rate applied [d = 1.50% (Stern, 2007; Weitzman, 2007); 3.50% (HM Treasury, 2020), or; 4.25% (Nordhaus, 2017)]. We then summed simulated ROI for all years under each combination of rehabilitation scenario, potential accreditation methodology, carbon price and discount rate. In ANR scenario 3, we also removed the realized biophysical costs of rehabilitation incurred for wilding collection, nursery operation and out-planting for ∼83,000 seedlings over 9.68 ha and 6 years at Leganes Katunggan pond (USD 3,835.68: Supplementary Table 2; Primavera et al., 2012b). This rehabilitation cost is substantially lower than the literature-derived median cost from projects in developing nations applied over the same area (USD 10,831.84: Taillardat et al., 2020), owing to strong community engagement, voluntary labor and the implementation of science-based ANR protocols (Primavera et al., 2012b) in the Leganes Katunggan rehabilitation efforts. In potential accreditation methodologies BAS and TOT, costs of soil carbon baseline quantification and 0–15 cm depth monitoring at 3 year intervals are also removed under all scenarios (USD 1,170.00; Supplementary Table 2). Under the assumption that realized costs of registration and verification are similar across hypothetical NR and ANR rehabilitation-oriented blue carbon projects, we do not include these costs. However, we stress that these costs are substantial (∼USD 40,000 for project registration and verification over our hypothetical 9.68 ha case study over 10 years: Verra, 2020c).
Our analysis of identified abandoned ponds in West Visayas found within-pond natural mangrove regeneration (following dike breaching) from as early as 2005 (Leganes Katunggan) to 2013 (Panay, Capiz) (see Table 2, Figure 2, and Supplementary Figures 1A–F). Abandoned pond characteristics varied widely, with total pond area ranging from 1.58 (Basiao, Ivisan, Capiz) to 17.90 ha (Buenavista, Guimaras, Iloilo), adjacent mangrove extent (within a 2.5 km buffer) from 0.56 (Balagon and Napnud, Leganes, Iloilo) to 108.67 ha (Barotac Nuevo, Iloilo), distance to source population (nearest 10 ha patch) from 0.02 (San Dionisio, Iloilo) to 11.64 km (Roxas City, Capiz), proportional dikes remaining from 0.36 (Leganes Katunggan) to 0.95 (Buenavista, Guimaras), relative dike protection from 89.98 (Basiao, Ivisan, Capiz) to 526.35 m2 m–1 (Leganes Katunggan), SRTM DEM-derived mean pond elevation from 0.42 (Roxas City, Capiz) to 3.63 m (San Dionisio), and variation (CV) in pond elevation from 17.34% (San Dionisio) to 341.39% (Balagon and Napnud, Leganes) (see Table 2).
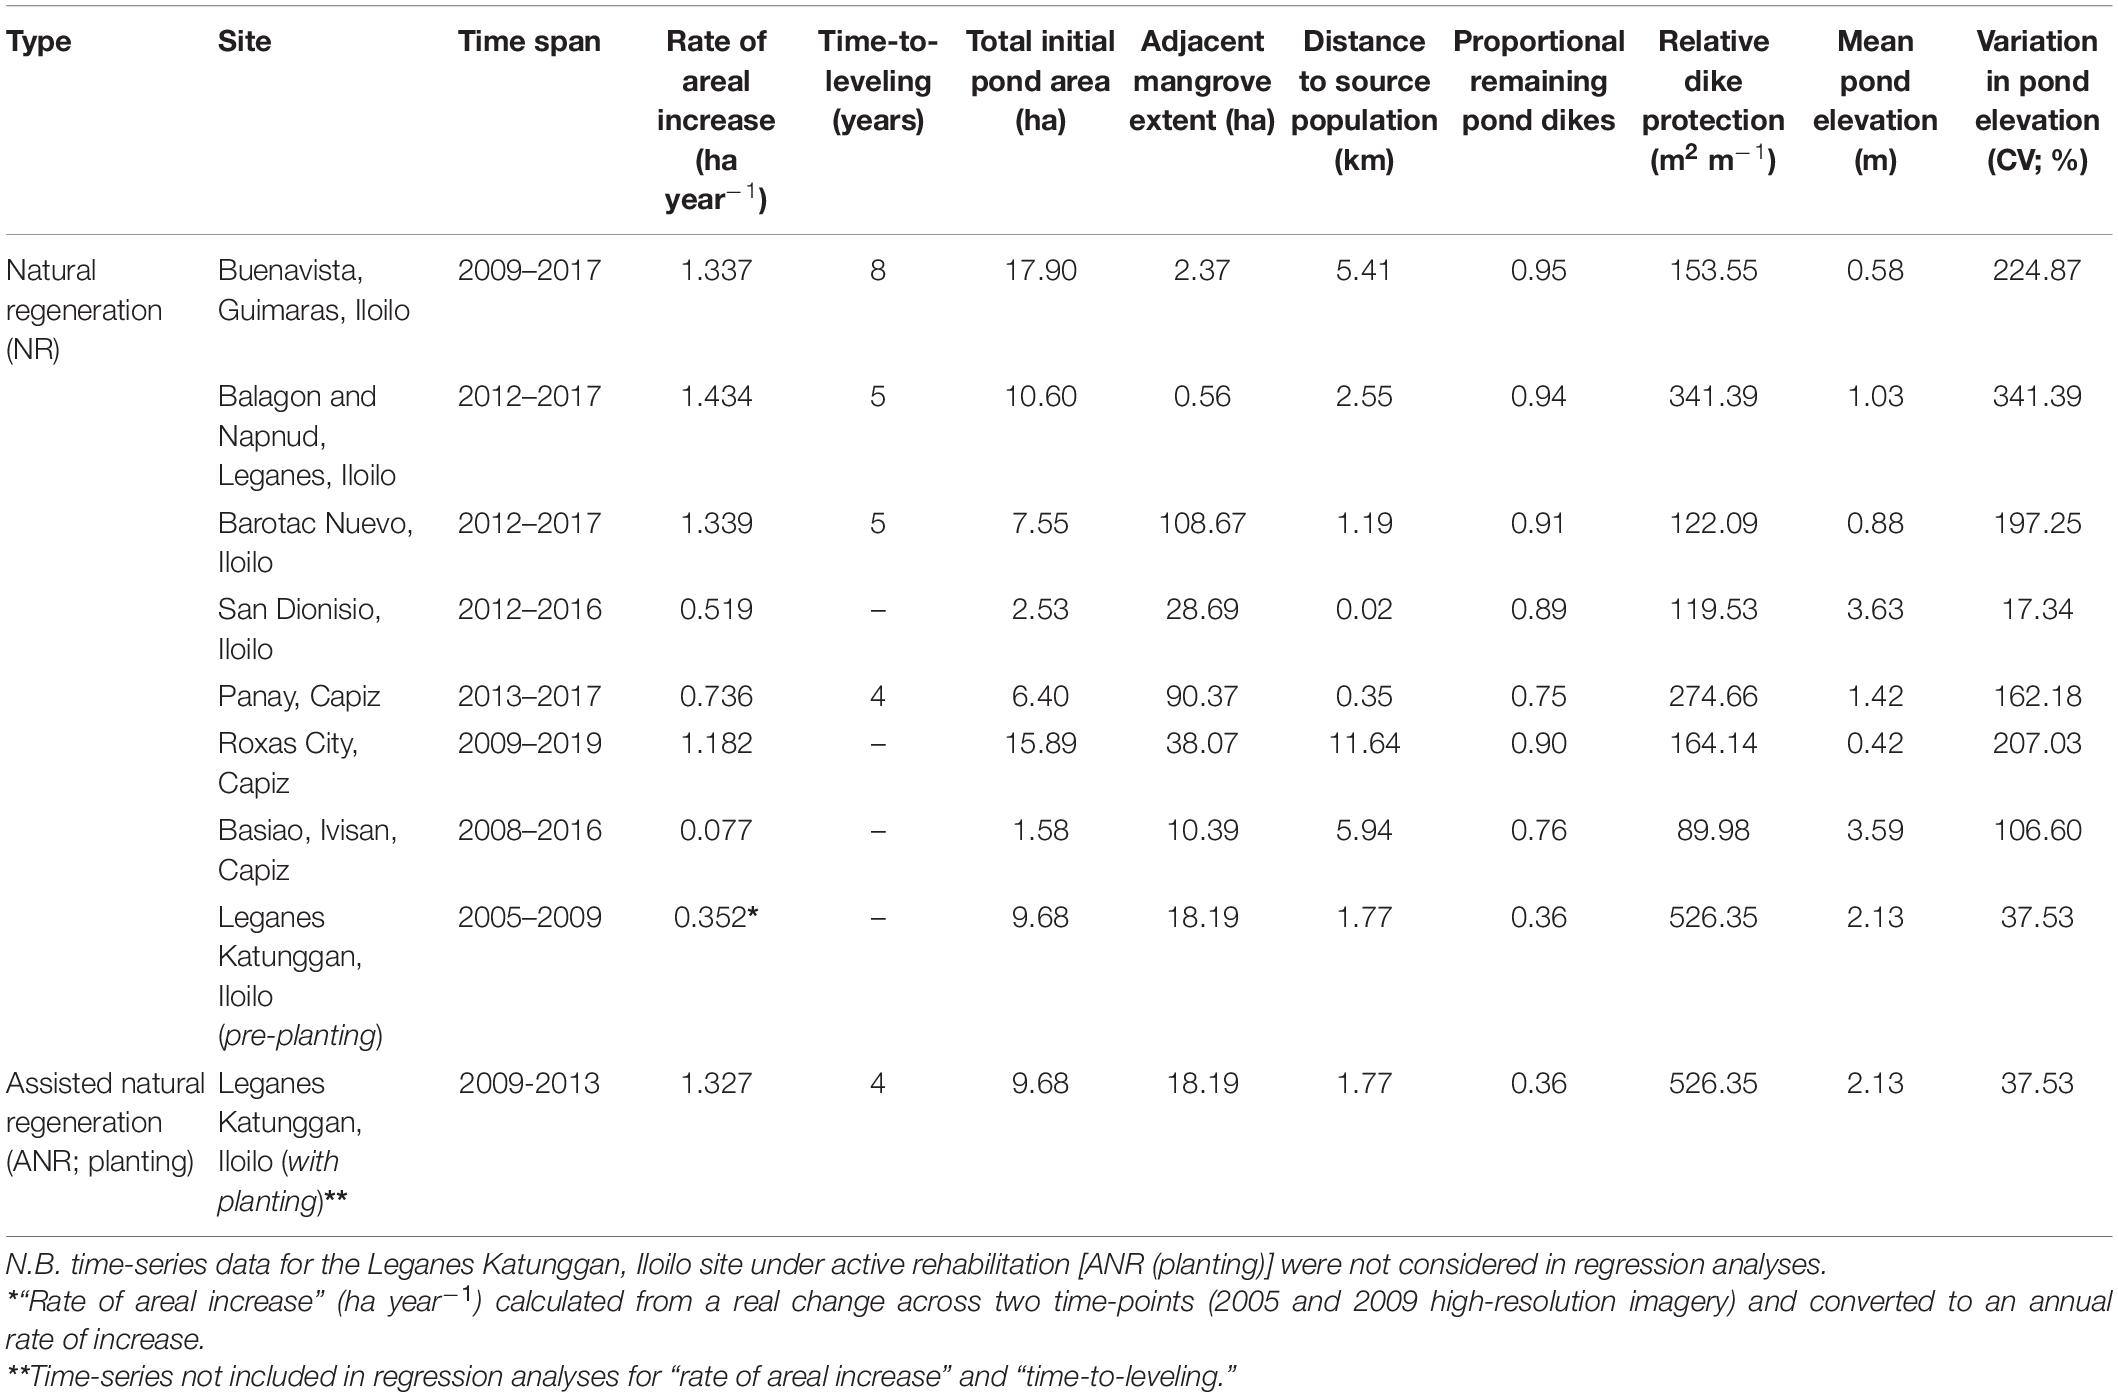
Table 2. Summary statistics for “rate of areal increase” and “time-to-leveling” and proxies of potential drivers of regeneration speed for all abandoned aquaculture ponds considered in this study.
Figure 2. Imagery segmentation classification of available annual Google Earth RGB imagery from abandoned pond dike breaching at (A) the Leganes Katunggan, Iloilo study site over 2005–2019 [natural regeneration (NR) to 2009, followed by assisted natural regeneration with planting (ANR) from 2009; see Figures 3H,I], and (B) the Roxas City, Capiz study site (NR over 2009–2019; see Figure 3F). See Supplementary Figures 1A–F for all remaining NR abandoned pond sites.
“Rate of areal increase” under NR was highly variable across abandoned pond time-series, ranging from 0.077 ± 0.007 (1 s.e.) ha year–1 at Basiao, Ivisan to 1.434 ± 0.146 (1 s.e.) ha year–1 at Balagon and Napnud, Leganes. Among the highest “rate of areal increase” was observed during assisted natural regeneration [ANR (planting): 2009?2013] at the Leganes Katunggan pond [1.327 ± 0.157 (1 s.e.) ha year–1]; however, this rate was exceeded under NR at three sites [Balagon and Napnud, Leganes; Barotac Nuevo: 1.339 ± 0.215 (1 s.e.) ha year–1; Buenavista, Guimaras: 1.337 ± 0.198 (1 s.e.) ha year–1] (Table 2, Figures 2, 3, and Supplementary Figures 1A–F). “Leveling” of rates of areal increase was not reached in three non-case study NR abandoned ponds, possibly owing to recent (2012) and slow regeneration at San Dionisio, slow early regeneration at Roxas City, and very slow regeneration at Basiao, Ivisan (Table 2, Figures 2, 3, and Supplementary Figure 1). “Time-to-leveling” for the remaining ponds was lowest (4 years) at the small (6.40 ha) and moderately quickly regenerating Panay abandoned pond and under ANR at the Leganes Katunggan pond (Table 2 and Figure 3).
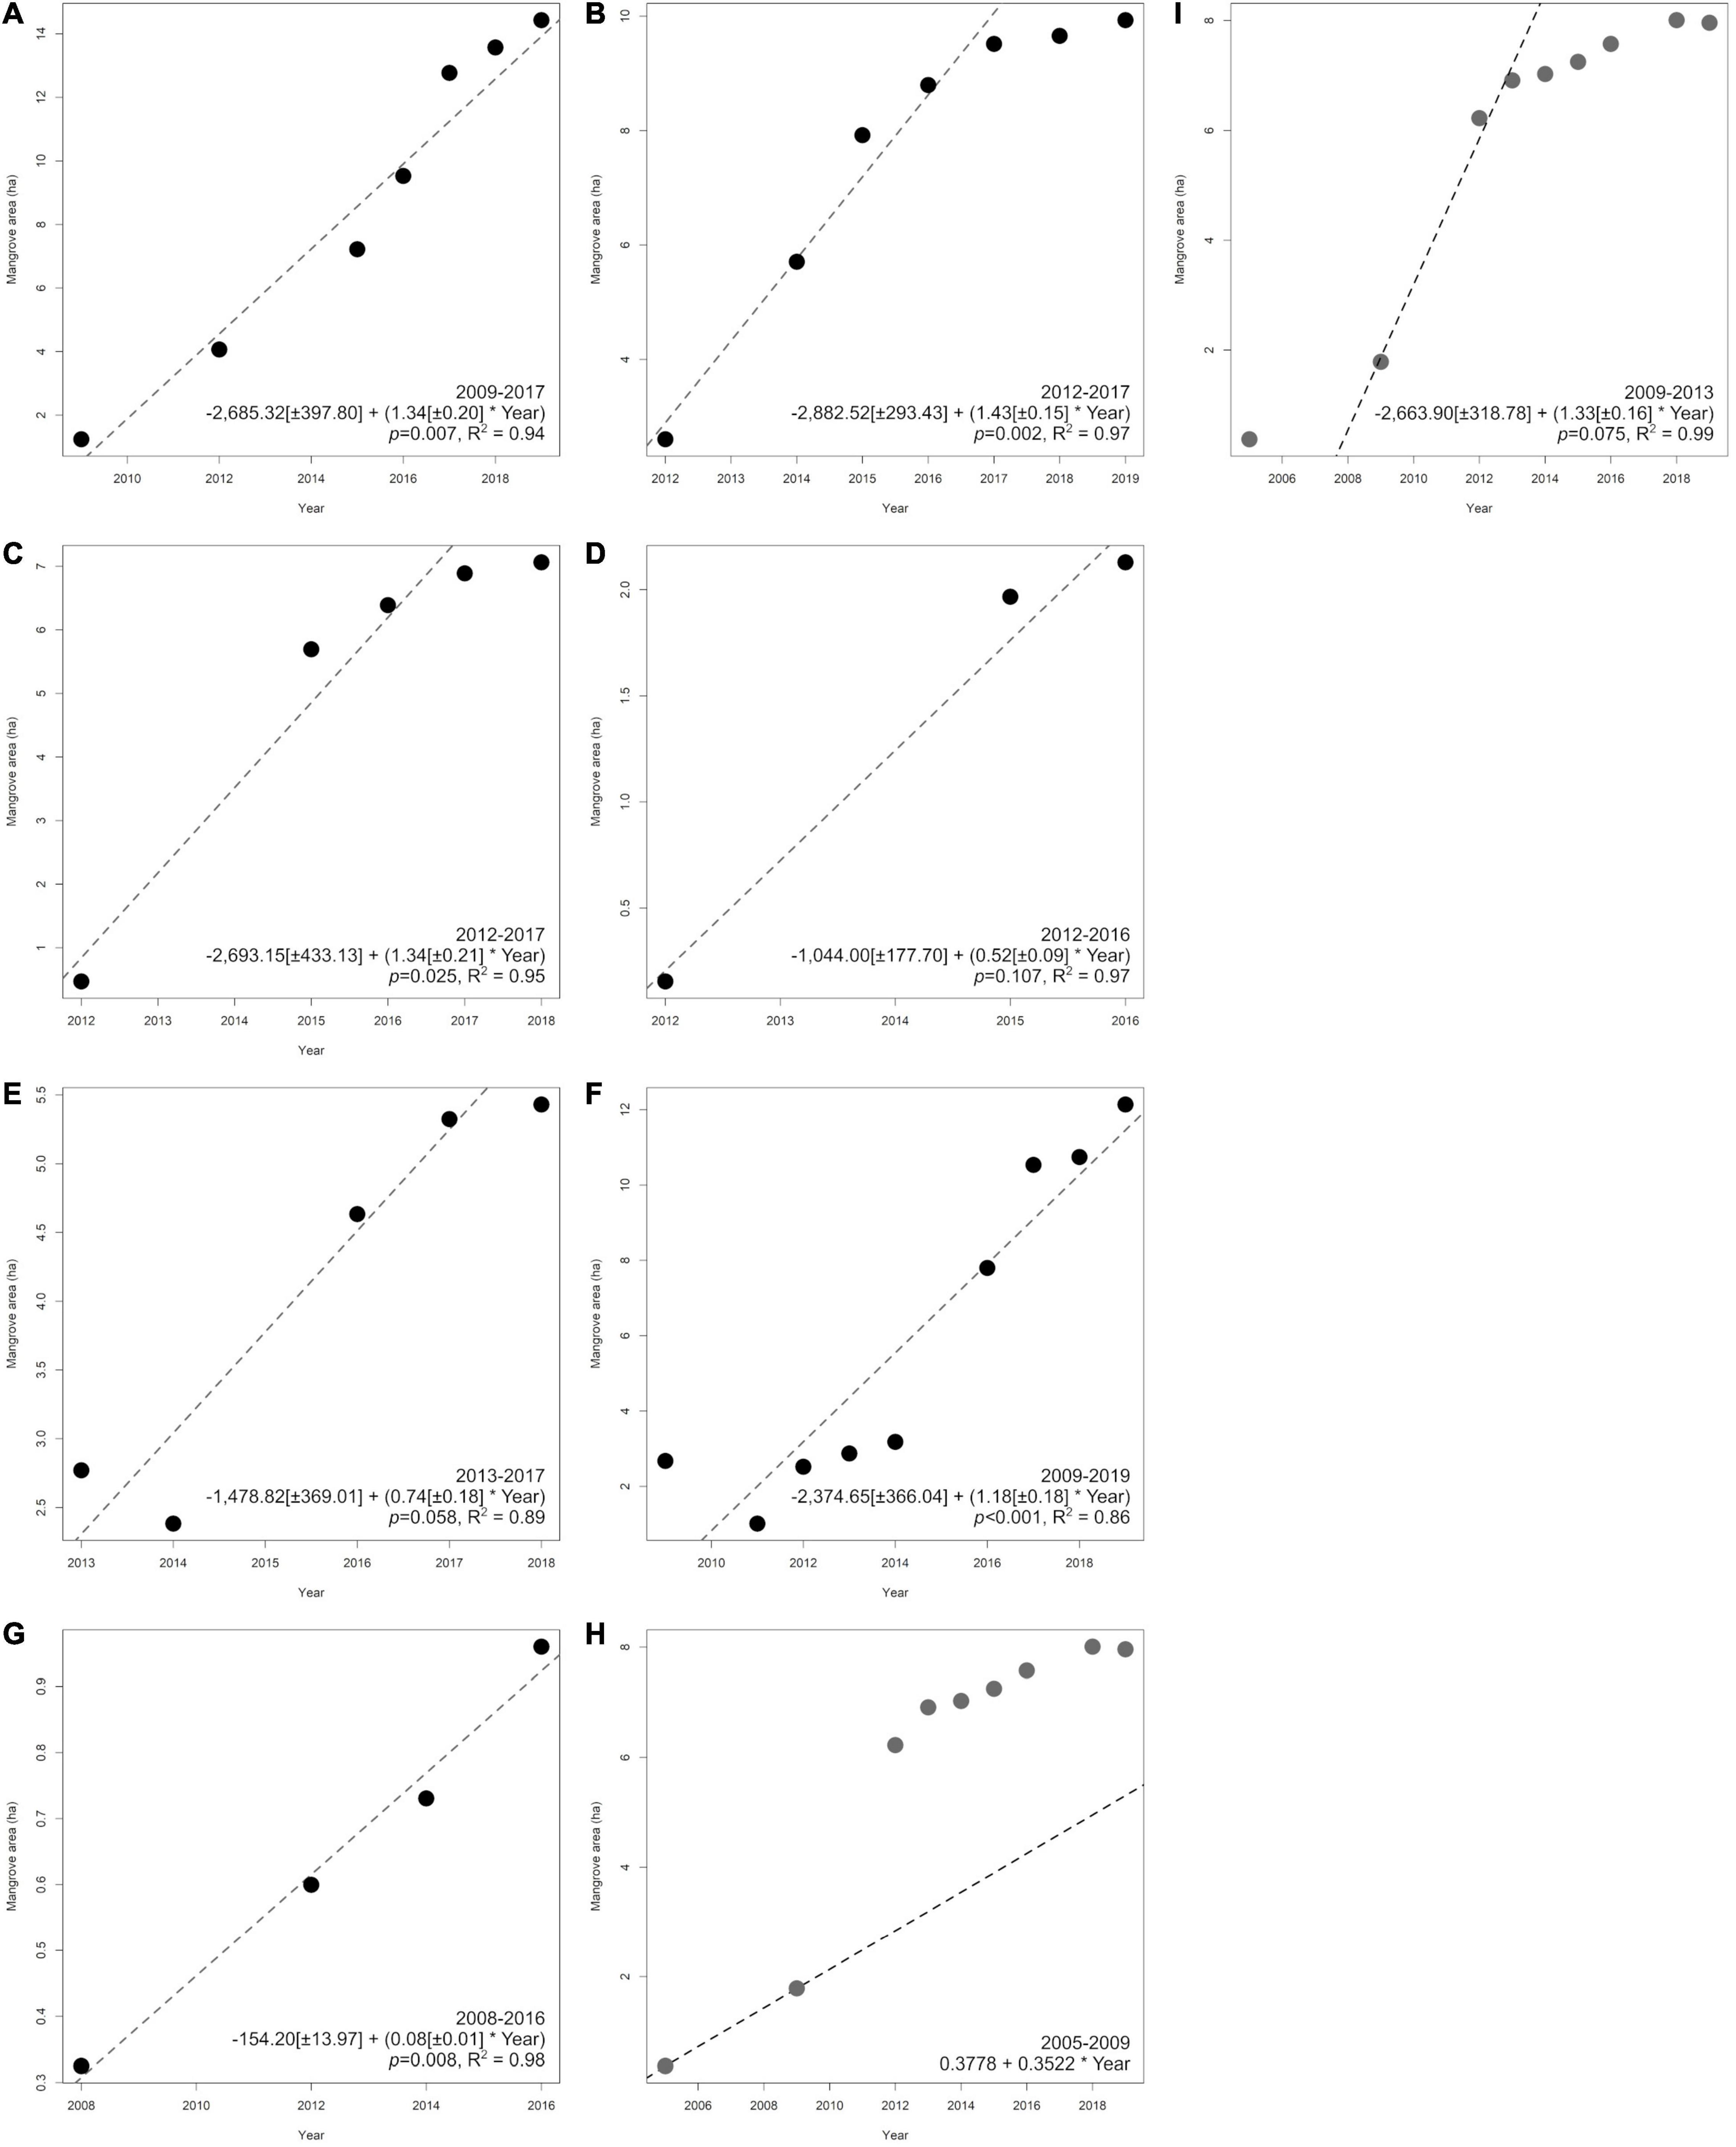
Figure 3. Plots of mangrove area (ha) through classified time-series high-resolution RGB GE imagery to identified “leveling-off” of rates areal gain for all abandoned aquaculture ponds [rates in ponds (D,F,G) were not observed to “level-off” within the analyzed time-series]. Dashed lines show time-series linear regression models of mangrove area (ha) predicted by time (year). Naturally-regenerating abandoned ponds: (A) Buenavista, Guimaras; (B) Balagon and Napnud, Leganes; (C) Barotac Nuevo; (D) San Dionisio; (E) Panay; (F) Roxas City; (G) Basiao, Ivisan. Actively-rehabilitated abandoned pond (planting): (H) natural regeneration (NR) pre-planting (2005-2009) and (I) assisted natural regeneration (ANR) with planting (2009-2013) at Leganes Katunggan abandoned pond. N.B. “rate of areal increase” (ha year–1) was calculated from a real change between the two time-points of 2005 and 2009 imagery and a constant rate applied to year 2019 for Leganes Katunggan abandoned pond in panel (H) (see also Table 3).
In order to enhance predictive power, we selected our “best-fitting” model explaining variation in “rate of areal increase” (ha year–1) across NR abandoned ponds as the more complex of two models with delta AICc < 2 (Table 3). This model included the negative effect of mean pond elevation (m a.m.s.l.) [intercept = 0.47 ± 0.35 (1 s.e.), β1 = –0.30 ± 0.06 (1 s.e.), t1 = –5.18] and the positive effect of proportional remaining pond dikes [β2 = 1.12 ± 0.37 (1 s.e.), t2 = 3.00] (5 d.f., p = 0.002, multiple R2 = 0.91: Table 3 and Figure 4). Mean model-predicted “rate of areal increase” under NR at the Leganes Katunggan abandoned pond (0.247 ha year–1) was lower than that observed at the site under early NR (0.352 ha year–1: 2005–2009), and substantially lower than that observed at the site under ANR (1.327 ha year–1; 2009–2013) (Figures 2, 3 and Table 2). We found no significant effect of any explanatory variable in explaining variation in, and therefore no “best-fitting” model for, “time-to-leveling” (years) across NR abandoned ponds.
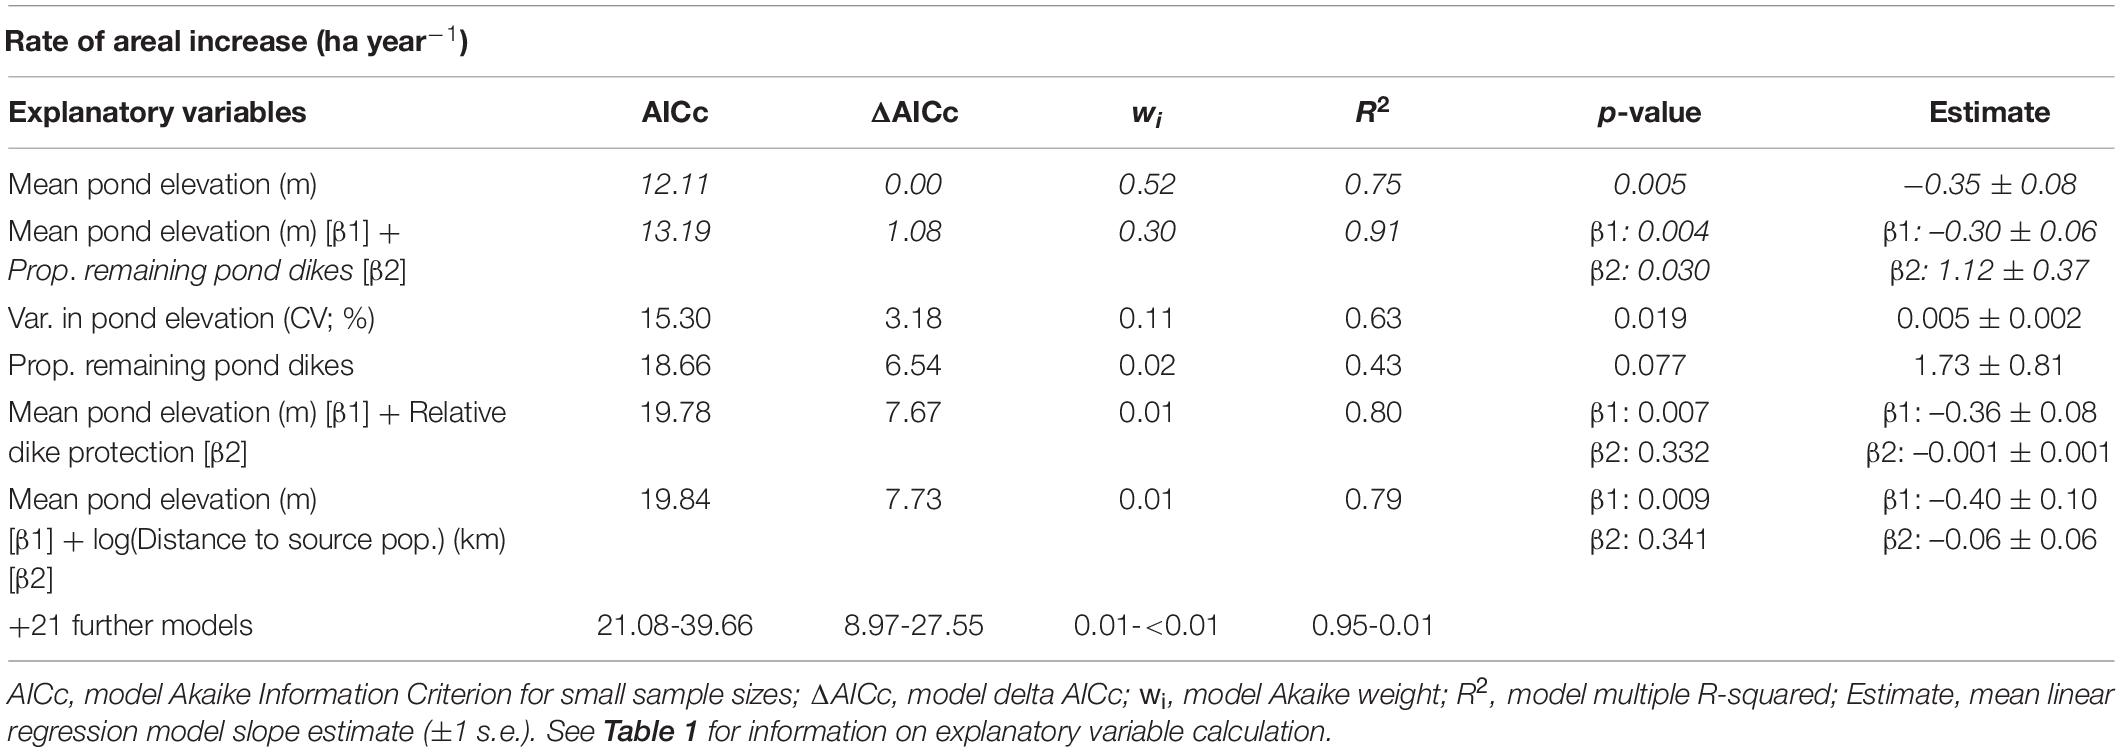
Table 3. Top six best-fitting candidate linear models for “rate of areal increase.”
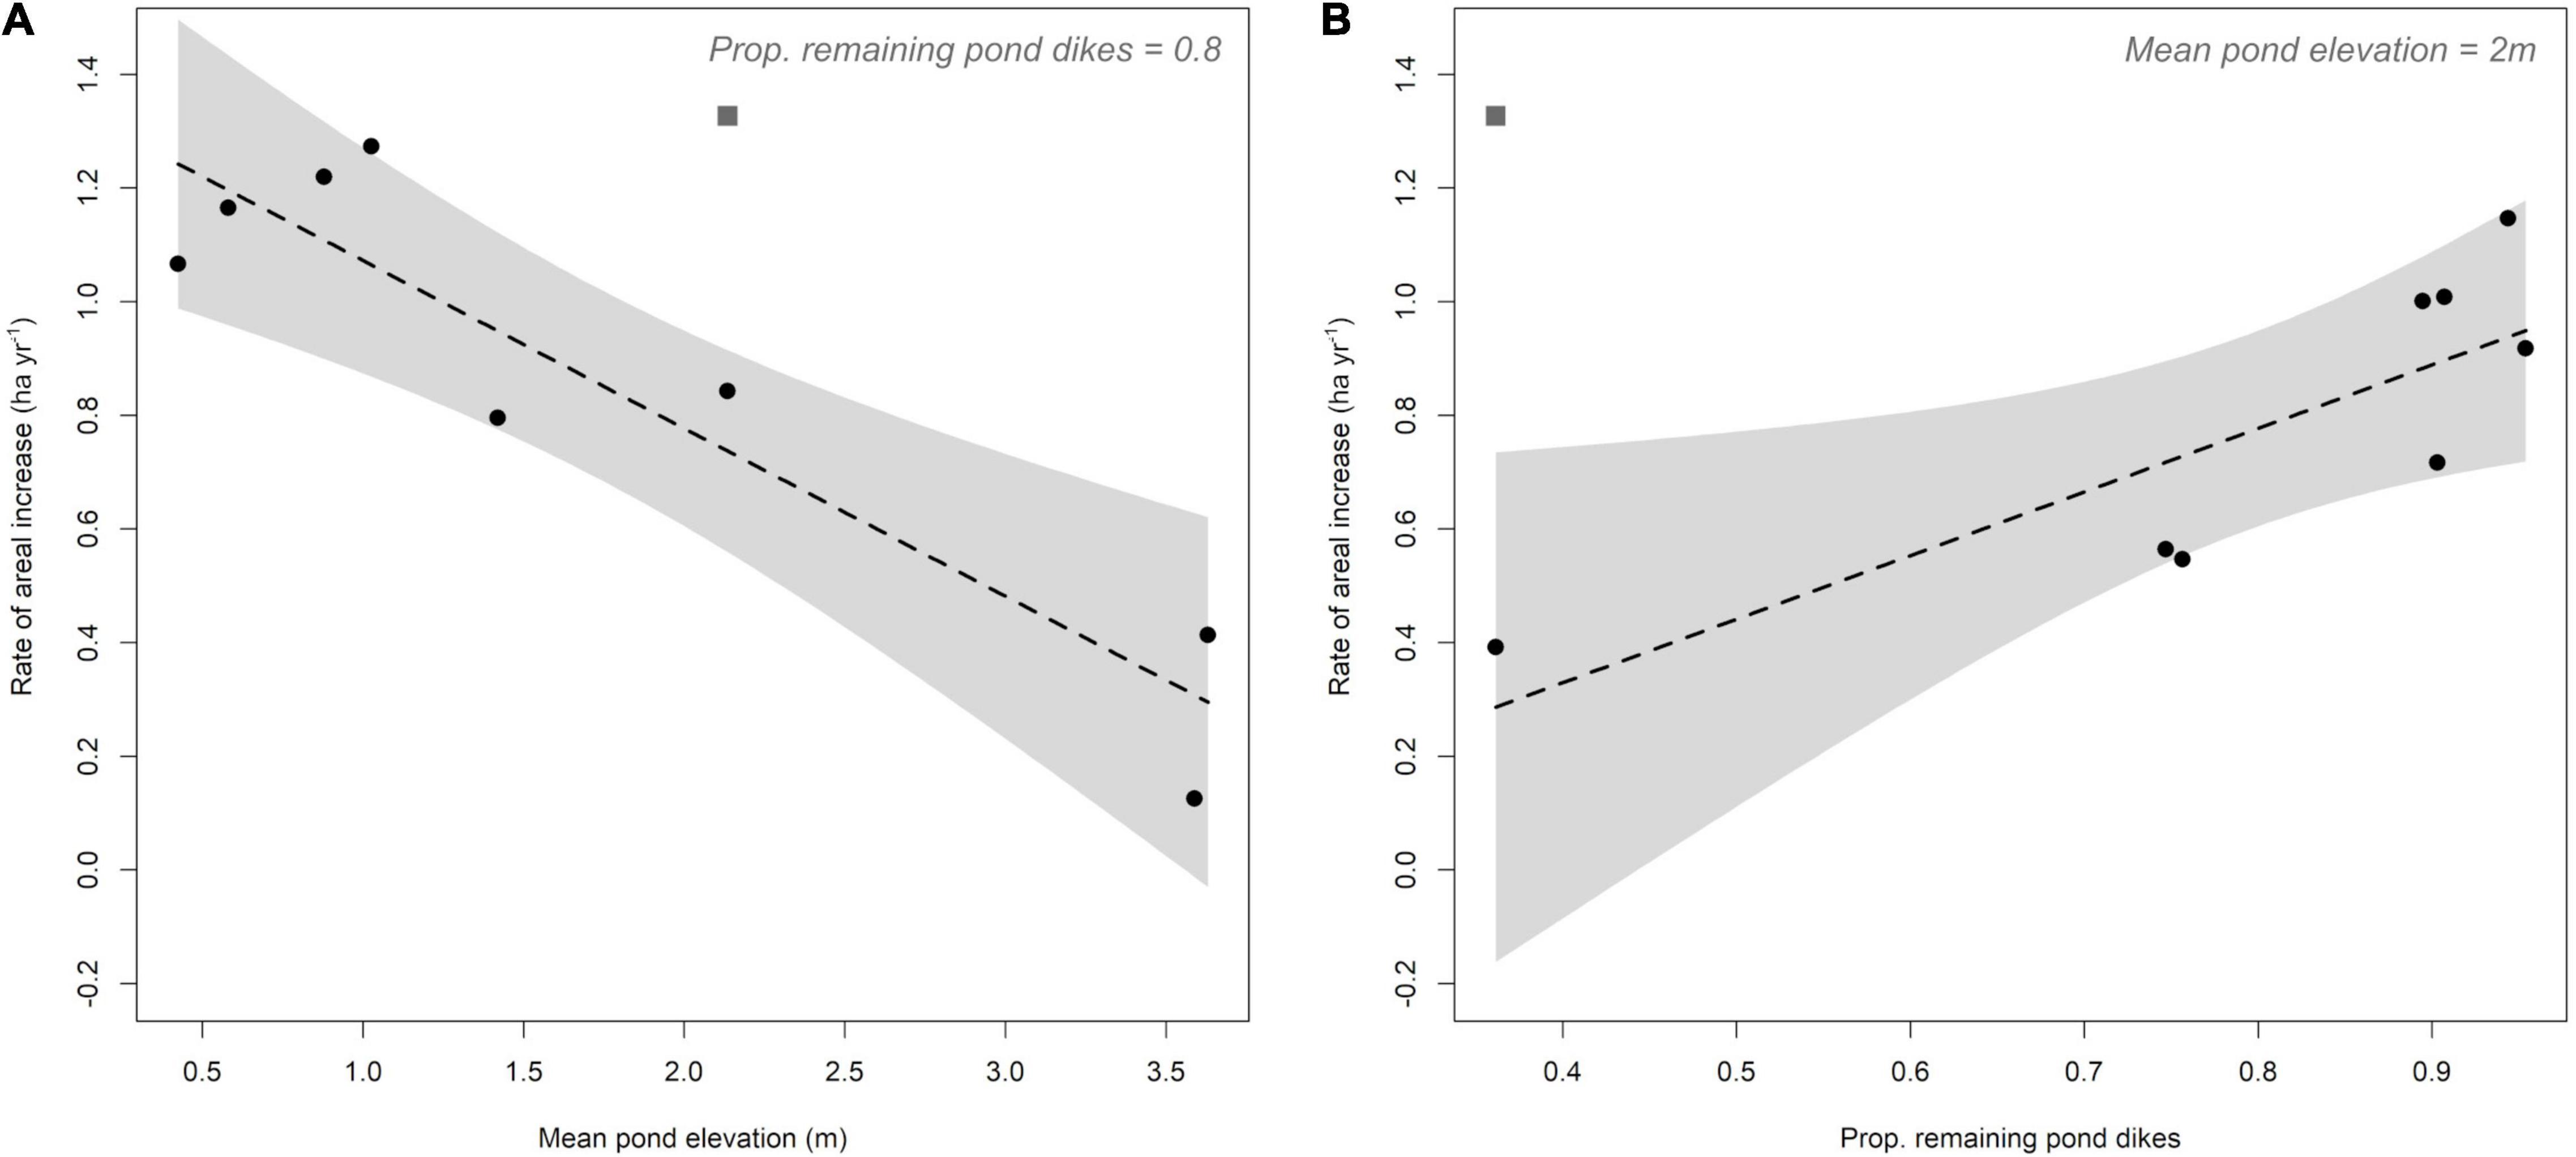
Figure 4. Partial regression plots from the best-fitting linear regression model for “rate of areal increase” [mean pond SRTM DEM elevation (m; β1) + proportion of remaining pond dikes (β2)] for naturally-regenerating (NR) abandoned aquaculture ponds – black circles [model: intercept = 0.47 ± 0.35 (1 s.e.), β1 = –0.30 ± 0.06 (1 s.e.), β2 = 1.12 ± 0.37 (1 s.e.), 5 d.f., t1 = –5.18, t2 = 3.00, p = 0.002, multiple R2 = 0.91]. (A) Partial regression plot of the relationship between rate of areal increase (ha year–1) and mean pond SRTM DEM elevation (m), where proportion of remaining pond dikes = 0.8; (B) partial regression plot of the relationship between rate of areal increase and proportion of remaining pond dikes, where mean pond SRTM DEM elevation = 2 m. The dark gray square in each partial regression plot denotes the rate of areal increase observed under assisted natural regeneration [ANR (planting): 2009–2013] at the Leganes Katunggan, Iloilo abandoned pond. Gray shaded areas delimit the 95% confidence intervals of the partial regression model fits.
Owing to variation in model-predicted and observed rates of NR and ANR (Table 2 and Figure 4), simulated rehabilitated mangrove area at the Leganes Katunggan abandoned pond across the 2005–2015 hypothetical simulation period varied widely in the three rehabilitation scenarios. Predicted mangrove cover varied from 2.84 ha under the best-fitting model-predicted NR (1) to full pond cover (9.68 ha) under the ANR (3) scenarios at Leganes Katunggan (Table 4). Accordingly, predicted soil and biomass organic carbon sequestration across the three scenarios was similarly variable, for example with mean soil and biomass gain ranging from 40.65 to 20.98 Mg under the best-fitting model-predicted NR scenario 1 to 227.25 and 96.11 Mg under the observed ANR scenario 3, respectively (Table 4). Wide variation (±1 s.e.) in best-fitting model-predicted rates of areal increase at the site resulted in wide variation in predicted mangrove cover (range: 0.28-5.41 ha) and soil and biomass organic carbon sequestration (range: 4.23–118.36 and 0.00–119.18 Mg, respectively) under scenario 1. Total predicted soil carbon sequestration was in all cases substantially greater than total predicted biomass carbon sequestration (Table 4). Uncertainty in total potential project emissions exceeded the allowable uncertainty threshold (15%) under NR (scenarios 1, 2) for all potential accreditation methodologies: B, 26.28% (11.28% deduction applied); BAS, 21.38% (6.38% deduction applied); TOT, 20.01% (5.01% deduction applied). Uncertainty in total project emissions did not exceed the 15% allowable uncertainty threshold under ANR for any methodology.
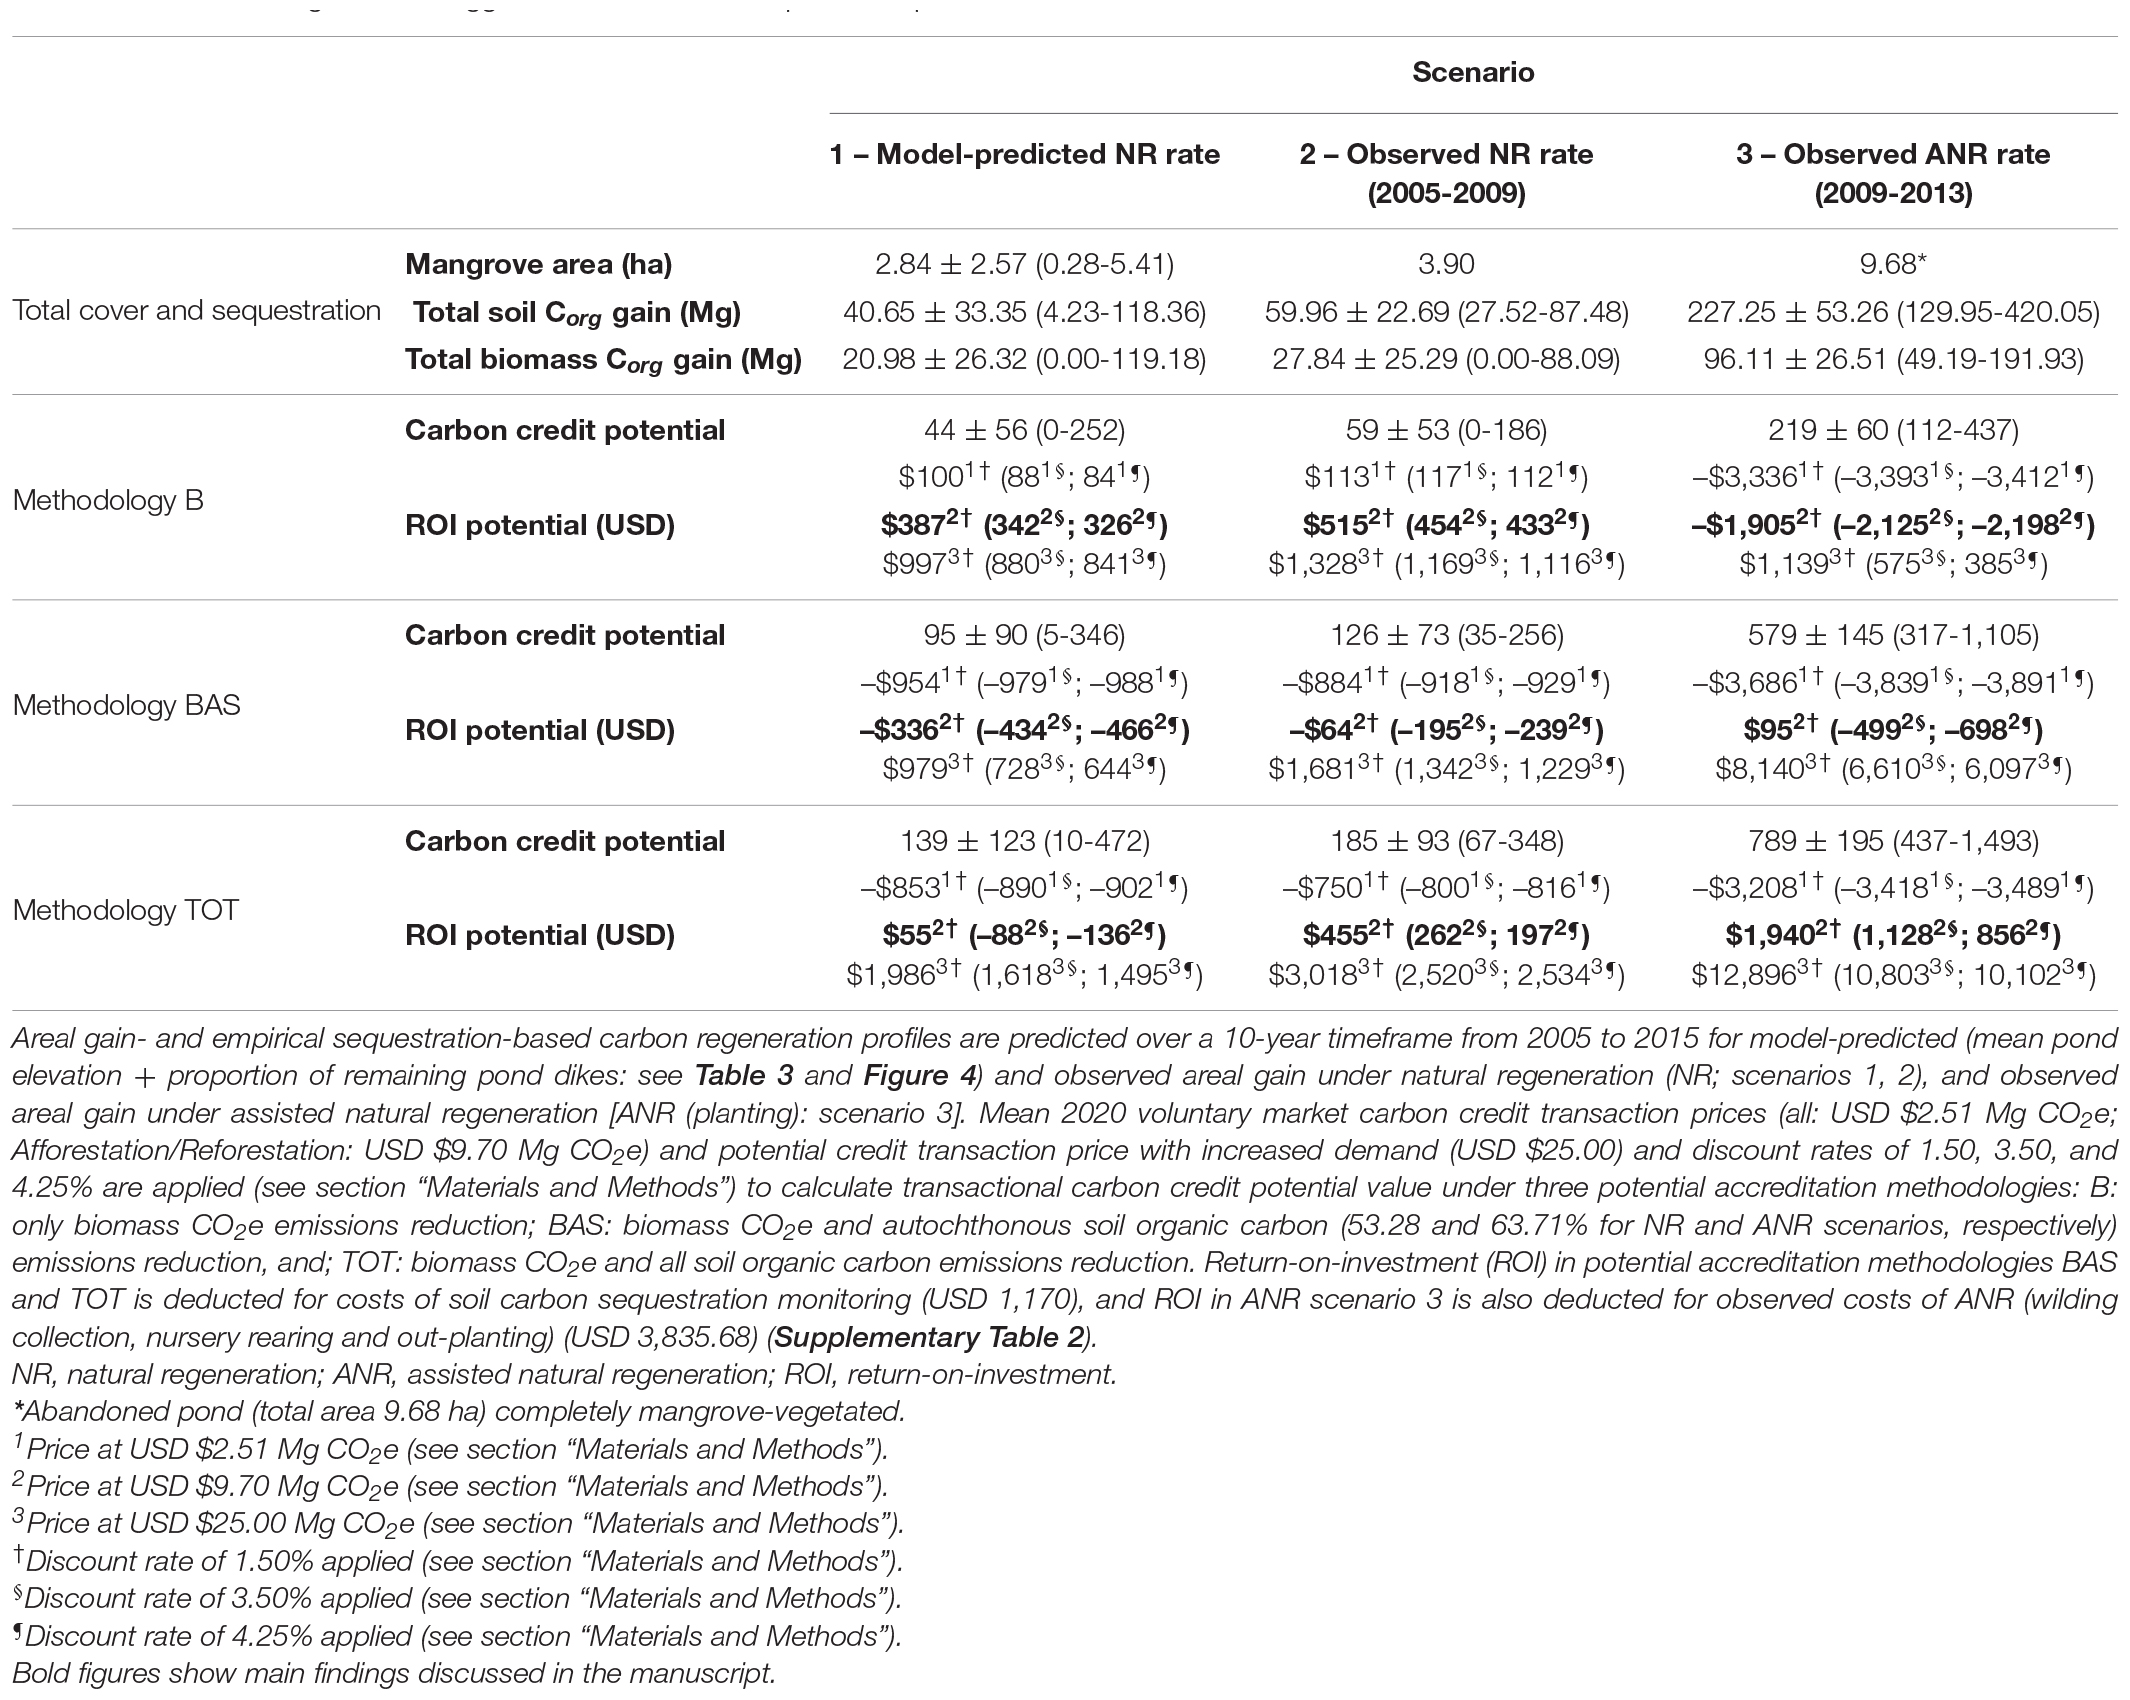
Table 4. Potential mangrove carbon sequestration profiles and voluntary market carbon credit transaction potential from model-predicted and observed regeneration rate scenarios at the Leganes Katunggan, Iloilo abandoned aquaculture pond.
Increasing proportion of soil carbon inclusion in transactional credit potential quantification (methodologies B to TOT: biomass-only to all biomass and soil carbon assumed creditable) substantially increased predicted project carbon credit potential under all scenarios (Table 4). However, high costs of soil compartment monitoring (USD 1,170; Supplementary Table 2) reduced mean predicted return-on-investment (ROI) under model-predicted and observed NR scenarios under potential accreditation methodology BAS to below that of biomass-only accreditation B. Focusing at a central USD $9.70 Mg CO2e potential voluntary carbon market price and a 1.5% discount rate, positive ROI was forecasted under model-predicted NR scenarios 1 and 2 under potential accreditation methodology B (USD $387 and $515, respectively) but negative ROI forecasted under methodology BAS (USD –$336 and –$64, respectively) (Table 4). ROI under potential accreditation methodology TOT was also lower than under biomass-only methodology B under model-predicted NR scenario 1 (USD –$332 relative) and observed NR scenario 2 (USD –$60 relative) (Table 4). The ANR scenario 3 resulted in the greatest predicted biomass and soil organic carbon sequestration and carbon credit potentials (Table 4). High costs of ANR (USD $3,835.68; Supplementary Table 2) under scenario 3 resulted in negative mean predicted ROI under potential accreditation methodology B (biomass-only: economic loss of USD –$1,905). Predicted risk of negative ROI with ANR (scenario 3) was absent under potential accreditation methodologies BAS and TOT at potential voluntary carbon market prices ≥ $9.70 and a 1.5% discount rate despite soil compartment monitoring costs [all biomass and (autochthonous) soil carbon assumed creditable], where predicted ROI exceeded that under both NR scenarios 1 and 2 (e.g., USD $431 and $1,885 relative to scenario 1, and USD $159 and $1,485 relative to scenario 2, respectively) (Table 4). However, negative ROI was predicted under ANR scenario 3 with potential accreditation methodology BAS at discount rates ≥ 3.5% (Table 4). A higher carbon price of $25.00 predicted positive ROI under all scenarios and potential accreditation methodologies. Here, forecasted ROI was similar across all scenarios with biomass-only accreditation, B: USD $997 under model-derived NR scenario 1; $1,328 under observed NR scenario 2, and; $1,139 under ANR scenario 3 (Table 4). Forecasted ROI with potential accreditation methodologies BAS and TOT was, however, substantially higher under ANR scenario 3 than under NR scenarios [USD $7,161 and $10,910 relative to model-predicted NR scenario 1, respectively, and USD $6,459 and $9,878 relative to observed NR scenario 2, respectively (at 1.5% discount rate)] (Table 4).
Little empirical guidance currently exists to enable mangrove rehabilitation practitioners to evaluate the potential ROI and viability of blue carbon project options. Our study provides the first to these authors’ knowledge that explores drivers and variation in mangrove regeneration rates in converted coastal areas at multi-site scales, and to quantify relative ROI in potential rehabilitation-oriented blue carbon project scenario options. We observed substantial variation in mangrove NR across abandoned aquaculture ponds, with the best-fitting model explaining faster NR rates in lower-lying (pioneer low- to mid-intertidal zone species) and less exposed ponds (greater dike retention). Mangrove recolonization was substantially faster and less variable (lower risk) in our case study pond under assisted natural regeneration (ANR; planting 2009–2013) than under either observed (2005–2009) or best-fitting model-predicted NR according to site conditions (Tables 2, 4). This translated to 3.7- to 5.2-fold greater carbon sequestration and 2.5- to 3.4-fold greater greenbelt regeneration (coastal protection: predicted pond mangrove coverage) over our hypothetical 10-year forecasting period with ANR. However, deducting generated potential carbon credit finance for realized project costs, ROI was low under all scenarios at current mean Afforestation/Reforestation project voluntary market carbon prices and ANR afforded a more optimal (higher ROI) rehabilitation strategy over NR only where mangrove soil compartment carbon sequestration was included in potential accreditation methodologies in our case study pond site. Projected financial returns (ROI) from ANR with autochthonous soil carbon inclusion (potential accreditation methodology BAS) were moreover negative and similar to those under NR at higher discount rates, highlighting that neither option may be appropriate under a small-scale blue carbon project financing-only lens at current credit prices. However, where site conditions (i.e., elevation, exposure) are less optimal, our findings reveal the relative merit of ANR over slower and more variable NR to strengthen coastal protection greenbelts more quickly in the face of accelerating global climate change, which may attract additional prospective investors to inflate realized project credit payments (Plan Vivo, 2013; Beeston et al., 2020; The Blue Natural Capital Financing Facility, 2021) toward those that also substantially maximize ROI over NR alone (Turner et al., 2021). We therefore urge prospective managers to consider these context–dependencies in local conditions constraining rapid NR, as well as to identify co-benefit credit pricing opportunities to ensure positive and greater relative ROI from blue carbon project. Overall, our approach provides a means to quantify mangrove regeneration and its drivers in converted lands across relevant (i.e., multi-site) geographic contexts and utilize these to evaluate rehabilitation-oriented blue carbon project scenarios that take in to account these enabling processes in local conditions, and “plug-in” forecasted project-specific costs.
While, as mangrove regeneration rates for our Leganes Katunggan, Iloilo case study were greatest under the forecasted ANR scenario (1.327 vs. 0.247 ha year–1 in best-fitting model-derived NR scenario 1 and 0.352 ha year–1 in observed NR scenario 2), we observed wide variability in NR rates across the seven studied NR abandoned ponds that were in three cases greater than the case study ANR scenario (Table 2). Our employed methodology and an absence of ground truth data meant we were unable to conduct time-series classification accuracy assessment. However, we are confident that our mapping approach combining manual visual classification of high-resolution imagery segmentation produced high accuracy (with low variability due to a single visual classifier analyzing each image) in estimated NR rates, and therefore that the rates quantified reflect context-dependence in NR drivers across sites. Depending on pond-specific conditions, ANR could still enhance some high NR rates observed by enhancing stem density, soil stability and inter-individual facilitation (Huxham et al., 2010) even under their apparently optimal local conditions. Our study could identify only one case study pond in which multiple regeneration processes (early NR followed by ANR: Primavera et al., 2012b) had occurred in the region, and further empirical and/or experimental study of mangrove NR vs. ANR rates at ponds with varying site-specific conditions is needed to identify the conditions at which ANR becomes redundant to background NR rates (see also Wodehouse and Rayment, 2019). Further mapping and quantification of NR across varied and more numerous abandoned ponds would also be beneficial in refining driver models: only eight abandoned ponds were identified here and we did not observe wide ranges of propagule supply within our model dataset (Table 2). We observed high NR rates in ponds with lower intertidal elevation (∼0.4–0.1 m a.m.s.l.) and low exposure (∼90% sea-facing dike retention) (Table 2). However, it is possible that the high NR rates observed at some abandoned ponds (Table 2) are driven by other known NR-influencing factors such as propagule supply (Balke et al., 2011; Lewis and Brown, 2014), where low sample size and variation in our dataset did not enable detection of a relationship, contrary to our hypothesis (Table 1). Interactions with factors that it was not possible to include in our landscape-level analysis, such as substrate type and salinity, could also have further driven variation in observed NR rates. We searched the high pond abandonment West Visayas coastal zone (∼31% of production from the Philippines total 239,323 ha of coastal aquaculture ponds: Department of Agriculture of the Philippines – Bureau of Fisheries and Aquatic Resources, 2020) exhaustively for study ponds, but a lack of high resolution imagery pre-2009 resulting in non-inclusion of many NR ponds for which we could not establish time of NR initiation. Future quantification of pond abandonment and NR could be evaluated against, and potentially supplemented by, mapping with longer-term moderate resolution imagery (e.g., Landsat) (Duncan et al., 2018; Baloloy et al., 2020); however the fine-scale of mangrove regeneration (i.e., individual tree establishment) may reduce the utility of these methods. Going forward, the generation of greater quantities of high resolution RGB imagery with existing and to-be-deployed satellite constellations will substantially enhance our ability to map and monitor newly abandoned coastal areas and refine NR driver models (Curnick et al., 2021).
Higher regeneration rates under ANR translated to substantially greater carbon sequestration and credit potential than under slower and more variable NR (Table 4). However, contrary to our predictions, application of blue carbon Verified Carbon Standard accreditation protocols (Verra, 2020b) and deduction of project costs (Supplementary Table 2) at current mean Afforestation/Reforestation project voluntary market carbon prices (USD $9.70 Mg CO2e; Forest Trends’ Ecosystem Marketplace, 2021), resulted in ROI not only lower than NR scenarios but negative (net losses of USD $1,905 to $2,198) under the ANR scenario at Leganes Katunggan under biomass-only potential accreditation methodology (B). Biomass carbon sequestration at the case study ANR abandoned pond with sub-optimal conditions (elevation, exposure) is at the lower end of empirical estimates for rehabilitating mangroves (Sasmito et al., 2019), and biomass-only carbon emissions reductions may be sufficient to return positive ROI relative to ANR project costs in different contexts. However, our case study illustrates that biomass-only accreditation, accounting for only a small proportion of full emissions reduction portfolios, returns lower relative ROI in ANR rehabilitation-only blue carbon project scenarios. Thus NR may be the appropriate strategy under biomass-only accreditation in small-scale potential blue carbon projects at current mean credit prices (Afforestation/Reforestation projects). Relative ROI under ANR increased to marginally to substantially greater with methodologies with increased inclusion of soil compartment emissions reductions at a 1.5% discount rate (Table 4); yet, projected ROI under ANR with autochthonous soil carbon inclusion (methodology BAS) was negative and similar to that projected under NR at higher discount rates ≥ 3.5%. Thus neither NR nor ANR rehabilitation option may be appropriate under a small-scale blue carbon project financing-only lens with soil carbon inclusion at current credit prices, where soil compartment monitoring and verification inhibits ROI, unless additional co-benefits can drive higher credit pricing (see Plan Vivo, 2013; Mikoko Pamoja, 2020). Importantly, ANR was the only rehabilitation scenario that forecasted full mangrove cover within the 10-year time frame at the 9.58 ha Leganes Katunggan case study pond (upper NR estimate: 3.90 ha cover; Table 4). ANR therefore establishes wider greenbelts more quickly in abandoned ponds with sub-optimal NR conditions (i.e., elevation and exposure), which is critical for surge reduction in typhoon-prone areas and where national greenbelt mandates are a long way from being met (Primavera et al., 2012a). This additional CCMA benefit could furthermore strengthen ANR blue carbon projects with accreditors enabling higher payments for “bundled” co-benefits (e.g., Plan Vivo, 2013), allowing them to further recoup implementation costs from enhanced coastal resilience. This could see the relative ROI of ANR approaches outweighing that of NR alone at levels similar to those reported here at USD $25.00 Mg CO2e prices: ∼4.8- to 8.3-fold greater relative ROI under ANR with autochthonous soil carbon inclusion (BAS methodology) (Table 4). ANR project scenarios moreover have the potential to be designed to further enhance site-specific carbon sequestration (Bai et al., 2021; Rahman et al., 2021) and associated co-benefits (coastal protection: Duncan et al., unpublished data) through introducing greater species and taxonomic diversity at early rehabilitation stages. The limited number of and wide variation in empirical studies on carbon sequestration in NR abandoned ponds in SE Asia furthermore drove high uncertainty in emissions reductions under NR scenarios (see section “Materials and Methods”; Table 4). Further on-ground research to quantify carbon sequestration in NR rehabilitating mangroves and their drivers may serve to reduce uncertainty in potential emissions reductions and therefore potential buyer confidence in ex ante NR-generated blue carbon credits. At present, this uncertainty, combined with uncertainty in model-derived NR rates (Figure 4), triggered deductions in project scenario emissions under NR for all potential accreditation methodologies (5.01–11.28% deductions). Coupled with increased natural risk from soil erosion at the exposed site (5% additional non-permanence buffer applied; Verra, 2019), this could sum to substantial perceived project risk to credit-buyers. Instead, blue carbon project developers could seek to increase potential project viability in terms of credit sales by prioritizing reduced uncertainty (ANR rehabilitation strategies) over slow and variable NR alone. Here, a combination of perceived risk reduction (i.e., lower discounting) alongside faster rates of mangrove greenbelt regeneration may attract substantial interest from other relevant industry investors to drive up credit pricing and realized ROI (see Beeston et al., 2020; Sumaila et al., 2021). This reduction of credit-buyers’ perceived risk with ANR rehabilitation efforts may also be combined with less costly conservation actions (i.e., avoided deforestation/degradation) to maximize both pricing and carbon sequestration in larger-scale blue carbon project planning (see Mikoko Pamoja, 2020; Conservation International, 2021; The Blue Natural Capital Financing Facility, 2021).
There remain other substantial practical considerations that should be factored in to the development of blue carbon projects beyond those that could be explored in our case study. First, we conducted case study-specific non-permanence risk assessment (Verra, 2019), where low exposure in coastal configuration (adjacent island) reduces risk from highly frequent typhoon events in the country, resulting in moderate non-permanence credit buffers (30–35%). Natural disaster risk, and others such as political risk, in other potential sites may exceed certification thresholds (Verra, 2019) or mean that non-permanence buffers drastically restrict potential ROI without active intervention to reduce stochastic threats to permanence in susceptible regions. Second, our study considered low-intensity, sea-facing abandoned ponds for which the need for physical rehabilitation interventions to reinstate hydrology are minimal (natural storm-driven dike breaching: Primavera et al., 2014). On-site physical intervention costs on initiation to make projects additional (Verra, 2020b) (e.g., dike breaching in less exposed sites and/or additional hydrological interventions) for NR rehabilitated-oriented projects in other contexts may be substantial (Su et al., 2021). With potential physical intervention costs applied, our hypothetical 9.68 ha) case study project would not be financially viable under either rehabilitation strategy at current voluntary carbon market prices (USD $9.70 Mg CO2e–1: Forest Trends’ Ecosystem Marketplace, 2021; see also Thompson et al., 2014). Furthermore, costs to both NR and ANR blue carbon project strategies may increase substantially where community engagement for project activities is low or absent (Primavera et al., 2012b). Variation in such project-specific biophysical costs may tip the balance of relative ROI between rehabilitation strategy options (NR vs. ANR), and high costs may in some cases make all options prohibitively expensive. Most importantly, our quantification of project costs is simplistic, focusing only on biophysical costs. In reality, any blue carbon project requires large budgets for certification standard fees (registration and verification) and any technical capacity not held by the proponent organization. These costs can be substantial (∼USD 40,000 for our hypothetical case study: Verra, 2020c), and realization of an operational blue carbon project, let alone sufficient financial ROI, is often not possible without early impact or seed investment from a non-credit purchasing body (see Mikoko Pamoja, 2020; The Blue Natural Capital Financing Facility, 2021). Put together, these cost and risk context-dependencies invite application and extension of the approaches developed herein to other and wider mangrove blue carbon rehabilitation contexts, urge caution to prospective blue carbon project developers and conduct of driver analyses such as performed here to evaluate real-world project scenario options.
With the arrival of the approved blue carbon Verified Carbon Standard methodology (Verra, 2020a,b) we are likely to see a rapid increase in demand for blue carbon credits in the coming years. To maximize blue carbon’s potential to advance global CCMA efforts and unlock sustainable conservation financing, it will now be imperative to evaluate the economic viability of potential blue carbon project scenario options prior to embarking on lengthy and costly project registration processes. With this study, we provide an approach to quantify the ROI and viability of potential rehabilitation-oriented blue carbon project scenarios, using projected biophysical project costs and multi-site scale ecological models to predict rates of transactional credit generation against likely biophysical cost. We employ a case study in which biophysical rehabilitation intervention requirements are minimal, revealing potentially substantial carbon sequestration and reduced uncertainty in such moderate-scale ANR rehabilitation blue carbon projects now able to incorporate significant soil carbon compartments. While ANR rehabilitation costs in other contexts are highly variable and can be considerable (Su et al., 2021), our case study is representative of coastal mangrove rehabilitation opportunities across large parts of SE Asia where coastal aquaculture and pond abandonment is extensive (Richards and Friess, 2016; Goldberg et al., 2020). We thus highlight a potential opportunity for additional ANR blue carbon projects in SE Asian countries such as the Philippines, where much former mangrove extent has already been cleared, rates of loss are decreasing (Spalding et al., 2010; Goldberg et al., 2020), national mandates forbid further unplanned deforestation (Primavera et al., 2012a), and coastal greenbelt rehabilitation for CCMA is high on the political agenda. Instead, ANR rehabilitation-oriented blue carbon strategies in abandoned, sea-facing ponds under non-private ownership, and for which tenure reversal and political will strengthening are the limiting factors to additionality, represent a widespread, comparatively low-cost CCMA opportunity. Generating the co-benefit of reducing perceived risk to credit-buyers and more rapidly strengthening coastal greenbelts in typhoon-prone regions, such a strategy could moreover attract higher credit pricing and advance national CCMA mitigation strategies, where ANR strategies could have substantially greater (∼4.8- to 8.3-fold) relative ROI than NR alone. It is important to stress that any implemented ANR rehabilitation approach for blue carbon credit generation should employ scientifically-founded guiding principles, and that traditionally-performed widespread mangrove planting (inappropriate species, intertidal locations) is highly unlikely to produce successful blue carbon projects (Primavera et al., 2012b; Lee et al., 2019) or positive financial returns (as yet unstudied). Approaches such as those developed herein can guide optimal site-specific rehabilitation implementation options within such a strategy to maximize potential sustainable conservation financing.
The original contributions presented in the study are included in the article/Supplementary Material, further inquiries can be directed to the corresponding author.
CD, JP, and HK conceived the research ideas. CD collected the data, performed analyses, and wrote the first draft of the manuscript. All authors contributed critically to wrote the final draft of the manuscript and approved the submitted version.
CD was supported by the AXA Research Fund and the Zoological Society of London Challenge Fund. HK was supported by the Bertarelli Foundation. Initial field data collection (Philippines) was generously supported by the Darwin Initiative (21-010) and the Rufford Foundation (15169-1).
The authors declare that the research was conducted in the absence of any commercial or financial relationships that could be construed as a potential conflict of interest.
All claims expressed in this article are solely those of the authors and do not necessarily represent those of their affiliated organizations, or those of the publisher, the editors and the reviewers. Any product that may be evaluated in this article, or claim that may be made by its manufacturer, is not guaranteed or endorsed by the publisher.
The authors acknowledge and thank the fisherfolk communities of barangays Nabitasan and Gua-an, Leganes, Iloilo for their on-going efforts in the rehabilitation and maintenance of Leganes Katunggan ecopark, and for field assistance and logistical support. The authors also thank LGU Leganes, and in particular Sir Wilson A. Batislaon, Leganes Municipal Environment and Natural Resource Officer (MENRO), and Mayor Vincente P. Jaen II and former-Mayor Adolfo E. Jaen for the rehabilitation, creation and maintenance of Leganes Katunggan ecopark, as well as for access, support and assistance. The authors thank all ZSL-CMRP staff for physical rehabilitation efforts and training, and particularly Rona Joy A. Loma and Rodney L. Golbeque for cost estimate inputs. The authors acknowledge the voluntary efforts of the following groups for physical mangrove rehabilitation at Leganes Katunggan Ecopark (2009–2015): Nabitasan National High School, Rotary Club Jaro Chapter, United Church of Christ, Leganes National High School, Department of Agriculture-Bureau of Fisheries and Aquatic Resources (DA-BFAR), Provincial Environment and Natural Resources Office (PENRO)-Iloilo, University of Iloilo - PHINMA, and Lapayon National High School.
The Supplementary Material for this article can be found online at: https://www.frontiersin.org/articles/10.3389/ffgc.2021.775341/full#supplementary-material
Achanta, R., Shaji, A., Smith, K., Lucchi, A., Fua, P., and Süsstrunk, S. (2012). SLIC Superpixels compared to state-of-the-art superpixel methods. IEEE Trans. Pattern Analy. Mach. Intellig. 34, 2274–2282. doi: 10.1109/TPAMI.2012.120
Akaike, H. (1974). A new look at the statistical model identification. IEEE Trans. Autom. Control 19, 716–723. doi: 10.1109/TAC.1974.1100705
Bai, J., Meng, Y., Gou, R., Lyu, J., Dai, Z., Diao, X., et al. (2021). Mangrove diversity enhances plant biomass production and carbon storage in Hainan island, China. Funct. Ecol. 35, 774–786. doi: 10.1111/1365-2435.13753
Balke, T., Bouma, T. J., Horstman, E. M., Webb, E. L., Erftemeijer, P. L. A., and Herman, P. M. J. (2011). Windows of opportunity: thresholds to mangrove seedling establishment on tidal flats. Mar. Ecol. Prog. Ser. 440, 1–9. doi: 10.3354/meps09364
Baloloy, A. B., Blanco, A. C., Santa Ana, R. R. C., and Nadaoka, K. (2020). Development and application of a new mangrove vegetation index (MVI) for rapid and accurate mangrove mapping. ISPRS J. Photogram. Remote Sens. 166, 95–117. doi: 10.1016/j.isprsjprs.2020.06.001
Bayraktarov, E., Saunders, M., Abdullah, S., Mills, M., Beher, J., Possingham, H. P., et al. (2016). The cost and feasibility of marine coastal restoration. Ecol. Applic. 26, 1055–1074. doi: 10.1890/15-1077
Beeston, M., Cuyvers, L., and Vermilye, J. (2020). Blue Carbon: Mind the Gap. Geneva: Gallifrey Foundation.
Bivand, R., Rundel, C., Pebesma, E., Stuetz, R., Hufthammer, K. O., Giraudoux, P., et al. (2019). ‘rgeos’ Interface to Geometry Engine – Open Source (‘GEOS’). R Package v.0.5-2. Available online at: http://cran.r-project.org/web/packages/rgeos/index.html (accessed September 2019).
Blue Ventures (2019). Tahiry Honko Community Mangrove Project, Southwest Madagascar: Plan Vivo Project Design Document. Available online at: https://www.planvivo.org/Handlers/Download.ashx?IDMF=39070798-4292-4797-9ab2-7db77a9afe63 (accessed May 2021).
Bunting, P., Rosenqvist, A., Lucas, R. M., Rebelo, L.-M., Hilarides, L., Thomas, N., et al. (2018). The global mangrove watch – a new 2010 global baseline of mangrove extent. Remote Sens. 10:1669. doi: 10.3390/rs10101669
Burnham, K. P., and Anderson, D. R. (2002). Model Selection and Inference: A Practical Information-Theoretic Approach, 2nd Edn, New York, NY: Springer-Verlag.
Conrad, O., Bechtel, B., Bock, M., Dietrich, H., Fischer, E., Gerlitz, L., et al. (2015). System for Automated Geoscientific Analyses (SAGA) v.2.1.4. Geosci. Model Dev. 8, 1991–2007. doi: 10.5194/gmd-8-1991-2015
Conservation International [CI] (2021). Blue Carbon Project Gulf of Morrosquillo “Vida Manglar”: CCB & VCS Project Description. Available online at: https://registry.verra.org/app/projectDetail/VCS/2290 (accessed May 2021).
Curnick, D. J., Davies, A., Duncan, C., Freeman, R., Jacoby, D., Shelley, H., et al. (2021). SmallSats: a new technological frontier in ecology and conservation? Remote Sens. Ecol. Conserv. doi: 10.1002/rse2.239
Curnick, D. J., Pettorelli, N., Amir, A. A., Balke, T., Barbier, E. B., Crooks, S., et al. (2019). The value of small mangrove patches. Science 363:239. doi: 10.1126/science.aaw0809 [Epub ahead of print].
Department of Agriculture of the Philippines – Bureau of Fisheries and Aquatic Resources [DA-BFAR] (2020). Philippine Fisheries Profile 2019. Available online at: https://www.bfar.da.gov.ph/publication (accessed May 2021).
Donato, D. C., Kauffman, J. B., Murdiyarso, D., Kurnianto, S., Stidham, M., and Kanninen, M. (2011). Mangroves among the most carbon-rich forests in the tropics. Nat. Geosci. 4, 293–297. doi: 10.1038/ngeo1123
Duncan, C., Owen, H. J. F., Thompson, J. R., Koldewey, H. J., Primavera, J. H., and Pettorelli, N. (2018). Satellite remote sensing to monitor mangrove forest resilience and resistance to sea level rise. Methods Ecol. Evol. 9, 1837–1852. doi: 10.1111/2041-210X.12923
Duncan, C., Primavera, J. H., Pettorelli, N., Thompson, J. R., Loma, R. J. A., and Koldewey, H. J. (2016). Rehabilitating mangrove ecosystem service: a case study on abandoned pond reversion from Panay Island, Philippines. Mar. Pollut. Bull. 109, 772–782. doi: 10.1016/j.marpolbul.2016.05.049
Elwin, A., Bukoski, J. J., Jintana, V., Robinson, E. J. Z., and Clark, J. M. (2019). Preservation and recovery of mangrove ecosystem carbon stocks in abandoned shrimp ponds. Nat. Sci. Rep. 9:18275. doi: 10.1038/s41598-019-54893-6
Forest Trends’ Ecosystem Marketplace (2021). ‘Market in Motion’, State of the Voluntary Carbon Markets 2021, Installment 1. Washington, DC: Forest Trends Association.
Friess, D. A., Rogers, K., Lovelock, C. E., Krauss, K. W., Hamilton, S. E., Lee, S. Y., et al. (2019). The state of the world’s mangrove forests: past, present and future. Annu. Rev. Environ. Resour. 44, 89–115. doi: 10.1146/annurev-environ-101718-033302
Goldberg, L., Lagomasino, D., Thomas, N., and Fatoyinbo, T. (2020). Global declines in human-driven mangrove loss. Glob. Chang. Biol. 26, 5844–5855. doi: 10.1111/gcb.15275
Herr, D., von Unger, M., Laffoley, D., and McGivern, A. (2017). Pathways for implementation of blue carbon initiatives. Aquat. Conserv. 27, 116–129. doi: 10.1002/aqc.2793
Hijmans, R. J., van Etten, J., Sumner, M., Cheny, J., Bevan, A., et al. (2019). ‘raster’: Geographic Data Analysis and Modeling. R Package v.3.0-7. Available online at: http://cran.r-project.org/web/packages/raster/index.html (accessed September 2019).
HM Treasury (2020). The Green Book – Central Government Guidance on Appraisal and Evaluation v3.0. London: HM Treasury.
Hochard, J. P., Hamilton, S., and Barbier, E. B. (2019). Mangroves shelter coastal economic activity from cyclones. Proc. Natl. Acad. Sci. U.S.A. 116, 12232–12237. doi: 10.1073/pnas.1820067116
Hurvich, C. M., and Tsai, C. L. (1989). Regression and time series model selection in small samples. Biometrika 76, 297–307. doi: 10.1093/biomet/76.2.297
Huxham, M., Kumara, M. P., Jayatissa, L. P., Krauss, K. W., Kairo, J., Lang’at, J., et al. (2010). Intra- and interspecific facilitation in mangroves may increase resilience to climate change threats. Philos. Trans. R. Soc. B Biol. Sci. 365, 2127–2135. doi: 10.1098/rstb.2010.0094
Jakovac, C. C., Latawiec, A. E., Lacerda, E., Lucas, I. L., Korys, K. A., Iribarrem, A., et al. (2020). Costs and carbon benefits of mangrove conservation and restoration: a global analysis. Ecol. Econ. 176:106758. doi: 10.1016/j.ecolecon.2020.106758
Kamali, B., and Hashim, R. (2011). Mangrove restoration without planting. Ecol. Eng. 37, 387–391. doi: 10.1016/j.ecoleng.2010.11.025
Kauffman, J. B., Arifanti, V. B., Trejo, H. H., García, M. C. J., Norfolk, J., Cifuentes, M., et al. (2017). The jumbo footprint of a shrimp: carbon losses from mangrove deforestation. Front. Ecol. Environ. 15:183–188. doi: 10.1002/fee.1482
Kauffman, J. B., and Donato, D. C. (2012). Protocols for the Measurement, Monitoring and Reporting of Structure, Biomass and Carbon Stocks in Mangrove Forests. Bogor: CIFOR.
Kusumaningtyas, M. A., Hutahaean, A. A., Fischer, H. W., Pérez-Mayo, M., Ransby, D., and Jennerjahn, T. C. (2019). Variability in the organic carbon stocks, sources, and accumulation rates of Indonesian mangrove ecosystems. Estuar. Coast. Shelf Sci. 218, 310–323. doi: 10.1016/j.ecss.2018.12.007
Lee, S. Y., Hamilton, S. E., Barbier, E. B., Primavera, J. H., and Lewis, R. R. III (2019). Better restoration policies are needed to conserve mangrove ecosystems. Nat. Ecol. Evol. 3, 870–872. doi: 10.1038/s41559-019-0861-y
Lee, S. Y., Primavera, J. H., Dahdouh-Guebas, F., McKee, K., Bosire, J. O., Cannicci, S., et al. (2014). Ecological role and services of tropical mangrove ecosystems: a reassessment. Glob. Ecol. Biogeogr. 23, 726–743. doi: 10.1111/geb.12155
Lewis, R. R. III, and Brown, B. (2014). Ecological Mangrove Rehabilitation: A Field Manual for Practitioners. Mangrove Action Project. Gatineau: Canadian International Development Agency.
Locatelli, T., Binet, T., Kairo, J. G., King, L., Madden, S., Patenaude, G., et al. (2014). Turning the tide: how blue carbon payments for ecosystem services (PES) might help save mangrove forests. Ambio 43, 981–995. doi: 10.1007/s13280-014-0530-y
Long, J. B., Napton, N., Giri, C., and Graesser, J. (2014). A mapping and monitoring assessment of the Philippines’ mangrove forests from 1990 to 2010. J. Coast. Res. 30, 260–271. doi: 10.2112/JCOASTRES-D-13-00057.1
Lovelock, C. E., Cahoon, D. R., Friess, D. A., Guntenspergen, G. R., Krauss, K. W., Reef, R., et al. (2015). The vulnerability of Indo-Pacific mangrove forests to sea-level rise. Nature 526, 559–563. doi: 10.1038/nature15538
Mangrove Action Project [MAP] (2021). “CBEMR” Mangrove Restoration. Available online at: https://mangroveactionproject.org/mangrove-restoration/ (accessed May 2021).
McLeod, E., Chmura, G. L., Bouillon, S., Salm, R., Björk, M., Duarte, C. M., et al. (2011). A blueprint for blue carbon: Toward an improved understanding of the role of vegetated coastal habitats in sequestering CO2. Front. Ecol. Environ. 9, 552–560. doi: 10.1890/110004
Mikoko Pamoja (2020). Mikoko Pamoja Mangrove Conservation for Community Benefit: Plan Vivo Project Design Document. Available online at: https://www.planvivo.org/Handlers/Download.ashx?IDMF=3faf7087-dec2-41ca-8a67-42a98e21c59d (accessed May 2021).
Motohka, T., Nasahara, K. N., Oguma, H., and Tsuchida, S. (2010). Applicability of green-red vegetation index for remote sensing of vegetation phenology. Remote Sens. 2, 2369–2387. doi: 10.3390/rs2102369
Needleman, B. A., Emmer, I. M., Emmett-Mattox, S., Crooks, S., Megonigal, J. P., Myers, D., et al. (2018). The science and policy of the verified carbon standard methodology for Tidal Wetlands and Seagrass Restoration. Estuar. Coasts 41, 2159–2171. doi: 10.1007/s12237-018-0429-0
Nordhaus, W. D. (2017). Revisiting the social cost of carbon. Proc. Natl. Acad. Sci. U.S.A. 114, 1518–1523. doi: 10.1073/pnas.1609244114
Pettorelli, N. (2013). The Normalized Difference Vegetation Index. Oxford: Oxford Academic Press. doi: 10.1093/acprof:osobl/9780199693160.001.0001
Phan, L. K., van Thiel de Vries, J. S. M., and Stive, M. J. F. (2015). Coastal mangrove squeeze in the Mekong Delta. J. Coast. Res. 31, 233–243. doi: 10.2112/JCOASTRES-D-14-00049.1
Plan Vivo (2013). The Plan Vivo Standard for Community Payments for Ecosystem Services Programmes. Available online at: https://www.planvivo.org/Handlers/Download.ashx?IDMF=a677d7d1-ce55-4925-aeea-71b8c95caf1c (accessed May 2021).
Primavera, J. H. (2005). Mangroves, fishponds and the quest for sustainability. Science 310, 57–59. doi: 10.1126/science.1115179
Primavera, J. H., and Esteban, J. M. A. (2008). A review of mangrove rehabilitation in the Philippines: successes, failures and future prospects. Wetlands Ecol. Manag. 16, 345–358. doi: 10.1007/s11273-008-9101-y
Primavera, J. H., Savaris, J. P., Bajoyo, B. E., Coching, J. D., Curnick, D. J., Golbeque, R. L., et al. (2012b). Manual on Community-Based Mangrove Rehabilitation – Mangrove Manual Series No. 1. London: Zoological Society of London.
Primavera, J. H., Rollon, R. N., and Samson, M. S. (2012a). “The pressing challenges of mangrove rehabilitation: pond reversion and coastal protection,” in Treatise on Estuarine and Coastal Science: Ecohydrology and Restoration, Vol. 10, eds L. Chicharo and M. Zalewski (Amsterdam: Elsevier), 217–244. doi: 10.1016/B978-0-12-374711-2.01010-X
Primavera, J. H., Yap, W. G., Savaris, J. P., Loma, R. J. A., Moscoso, A. D. E., Coching, J. D., et al. (2014). Manual on Mangrove Reversion of Abandoned and Illegal Brackish Water Fishponds – Mangrove Manual Series No. 2. London: Zoological Society of London.
QGIS Development Team (2019). QGIS Geographic Information System v.3.8.3-Zanzibar. Chicago, IL: Open Source Geospatial Foundation Project.
R Development Core Team (2019). R: A Language and Environment for Statistical Computing. v.3.6.1. Vienna: R Foundation for Statistical Computing.
Rahman, M. M., Zimmer, M., Ahmed, I., Donato, D., Kanzaki, M., and Xu, M. (2021). Co-benefits of protecting mangroves for biodiversity conservation and carbon storage. Nat. Commun. 12:3875. doi: 10.1038/s41467-021-24207-4
Richards, D. R., and Friess, D. A. (2016). Rates and drivers of mangrove deforestation in Southeast Asia, 2000-2012. Proc. Natl. Acad. Sci. U.S.A. 113, 344–349. doi: 10.1073/pnas.1510272113
Salmo, S. G., and Gianan, E. L. D. (2019). Post-disturbance carbon stocks and rates of sequestration: Implications on “blue carbon” estimates in the Philippines. Philipp. Sci. Lett. 12, 122–132.
Samson, M. S., and Rollon, R. N. (2011). “Mangrove revegetation potentials of brackish-water pond areas in the Philippines,” in Aquaculture and the Environment – A Shared Density, ed. B. Slagjona (Riejeka: InTech), 31–50.
Sasmito, S. D., Kuzyakov, Y., Lubis, A. A., Murdiyarso, D., Hutley, L. B., Bachri, S., et al. (2020). Organic carbon burial and sources in soils of coastal mudflat and mangrove ecosystems. CATENA 187:104414. doi: 10.1016/j.catena.2019.104414
Sasmito, S. D., Taillardat, P., Clendenning, J. N., Cameron, C., Friess, D. A., Murdiyarso, D., et al. (2019). Effect of land-use and land-cover change on mangrove blue carbon: a systematic review. Glob. Change Biol. 25, 4291–4302. doi: 10.1111/gcb.14774
Sidik, F., Adame, M. F., and Lovelock, C. E. (2019). Carbon sequestration and fluxes of restored mangroves in abandoned aquaculture ponds. J. Indian Ocean Reg. 15, 1–16. doi: 10.1080/19480881.2019.1605659
Spalding, M., Kainuma, M., and Collins, L. (2010). World Atlas of Mangroves. London: Earthscan. doi: 10.4324/9781849776608
Stern, N. H. (2007). The Economics of Climate Change: The Stern Review. Cambridge: Cambridge University Press. doi: 10.1017/CBO9780511817434
Su, J., Friess, D. A., and Gasparatos, A. (2021). A meta-analysis of the ecological and economic outcomes of mangrove restoration. Nat. Commun. 12:5050. doi: 10.1038/s41467-021-25349-1
Sumaila, U. R., Walsh, M., Hoareau, K., Cox, A., Teh, L., Abdallah, P., et al. (2021). Financing a sustainable ocean economy. Nat. Commun. 12:3259. doi: 10.1038/s41467-021-23168-y
Taillardat, P., Thompson, B. S., Garneau, M., Trottier, K., and Friess, D. A. (2020). Climate change mitigation potential of wetlands and the cost-effectiveness of their restoration. Interf. Focus 10:20190129. doi: 10.1098/rsfs.2019.0129
The Blue Natural Capital Financing Facility [BNCFF] (2021). BNCFF Blue Prints Series No. 3: Mangroves Conservation as a Carbon Asset: Protecting Habitats and Empowering Communities. Available online at: https://bluenaturalcapital.org/wp2018/wp-content/uploads/2021/09/03-Carbon-Asset-Generation_final.pdf (accessed May 2021).
Thomas, N., Lucas, R., Bunting, P., Hardy, A., Rosenqvist, A., and Simard, M. (2017). Distribution and drivers of global mangrove forest change, 1996-2010. PLoS One 12:e0179302. doi: 10.1371/journal.pone.0179302
Thompson, B. S., Clubbe, C. P., Primavera, J. H., Curnick, D., and Koldewey, H. J. (2014). Locally assessing the economic viability of blue carbon: a case study from Panay Island, the Philippines. Ecosyst. Serv. 8, 128–140. doi: 10.1016/j.ecoser.2014.03.004
Thompson, B. S., and Rog, S. M. (2019). Beyond ecosystem services: using charismatic megafauna as flagship species for mangrove forest conservation. Environ. Sci. Policy 102, 9–17. doi: 10.1016/j.envsci.2019.09.009
Turner, G., Helmke, E., Tetteh-Wright, T. A., Pitt, C., Oraee, A., Koch, A., et al. (2021). Future Demand, Supply and Prices for Voluntary Carbon Credits – Keeping the Balance. London: Liebreich Associates.
United States Geological Survey [USGS] (2014). Shuttle Radar Topography (SRTM) 1 Arc-Second Global. College Park, MD: University of Maryland.
Urbanek, S. (2019). ‘jpeg’: Read and Write JPEG Images. R Package v.0.1-8.1. Available online at: http://cran.r-project.org/web/packages/jpeg/index.html (accessed September 2019).
Verra (2019). VCS AFOLU Non-Permanence Risk Tool, Version 4.0. Available online at: https://verra.org/wp-content/uploads/2019/09/AFOLU_Non-Permanence_Risk-Tool_v4.0.pdf (accessed May 2021).
Verra (2020a). First Blue Carbon Conservation Methodology Expected to Scale Up Finance for Coastal Restoration & Conservation Activities. Available online at: https://verra.org/first-blue-carbon-conservation-methodology-expected-to-scale-up-finance-for-coastal-restoration-conservation-activities/ (accessed May 2021).
Verra (2020b). VCS Methodology VM0007 version 1.6: REDD+ Methodology Framework (REDD-MF). Available online at: https://verra.org/wp-content/uploads/2020/09/VM0007-REDDMF_v1.6.pdf (accessed May 2021).
Verra (2020c). VCS Programme Fee Schedule v4.1. Available online at: https://verra.org/wp-content/uploads/2020/04/Program-Fee-Schedule_v4.1.pdf (accessed May 2021).
Wang, L., Jia, M., Yin, D., and Tian, J. (2019). A review of remote sensing for mangrove forests: 1956-2018. Remote Sens. Environ. 231:111223. doi: 10.1016/j.rse.2019.111223
Ward, R. D., Friess, D. A., Day, R. H., and MacKenzie, R. A. (2016). Impacts of climate change on mangrove ecosystems: a region by region overview. Ecosyst. Health Sustain. 2:e01211. doi: 10.1002/ehs2.1211
Weitzman, M. L. (2007). A review of the stern review on the economics of climate change. J. Econ. Literat. 45, 703–724. doi: 10.1257/jel.45.3.703
Whitt, A. A., Coleman, R., Lovelock, C. E., Gillies, C., Ierodiaconou, D., Liyanapathirana, M., et al. (2020). March of the mangroves: drivers of encroachment into southern temperate saltmarsh. Estuar. Coast. Shelf Sci. 240:106776. doi: 10.1016/j.ecss.2020.106776
Wodehouse, D. C. J., and Rayment, M. B. (2019). Mangrove area and propagule number planting targets produce sub-optimal rehabilitation and afforestation outcomes. Estuar. Coast. Shelf Sci. 222, 91–202. doi: 10.1016/j.ecss.2019.04.003
Wylie, L., Sutton-Grier, A. E., and Moore, A. (2016). Keys to successful blue carbon projects: Lessons learned from global case studies. Mar. Policy 65, 76–84. doi: 10.1016/j.marpol.2015.12.020
Keywords: mangroves, carbon emissions reduction, rehabilitation, natural regeneration, blue carbon, remote sensing
Citation: Duncan C, Primavera JH, Hill NAO, Wodehouse DCJ and Koldewey HJ (2022) Potential for Return on Investment in Rehabilitation-Oriented Blue Carbon Projects: Accounting Methodologies and Project Strategies. Front. For. Glob. Change 4:775341. doi: 10.3389/ffgc.2021.775341
Received: 13 September 2021; Accepted: 07 December 2021;
Published: 06 January 2022.
Edited by:
Dominic A. Andradi-Brown, World Wildlife Fund, United StatesReviewed by:
Yan Gao, Universidad Nacional Autonoma de Mexico, MexicoCopyright © 2022 Duncan, Primavera, Hill, Wodehouse and Koldewey. This is an open-access article distributed under the terms of the Creative Commons Attribution License (CC BY). The use, distribution or reproduction in other forums is permitted, provided the original author(s) and the copyright owner(s) are credited and that the original publication in this journal is cited, in accordance with accepted academic practice. No use, distribution or reproduction is permitted which does not comply with these terms.
*Correspondence: Clare Duncan, Y2xhcmUuZHVuY2FuQGlvei5hYy51aw==
†ORCID: Nicholas A. O. Hill, orcid.org/0000-0002-5921-0091
Disclaimer: All claims expressed in this article are solely those of the authors and do not necessarily represent those of their affiliated organizations, or those of the publisher, the editors and the reviewers. Any product that may be evaluated in this article or claim that may be made by its manufacturer is not guaranteed or endorsed by the publisher.
Research integrity at Frontiers
Learn more about the work of our research integrity team to safeguard the quality of each article we publish.