 Lisa Elena Fuchs
 Levi Orero
 Stephen Ngoima2
 Shem Kuyah
- 1International Centre for Research in Agroforestry (ICRAF), Nairobi, Kenya
- 2Department of Botany, Jomo Kenyatta University of Agriculture and Technology (JKUAT), Nairobi, Kenya
- 3United Nations Environment Programme (UNEP) Technical University of Denmark (DTU) Partnership, Copenhagen, Denmark
Agroforestry has potential to address the adverse effects of climate change through carbon sequestration, increasing biodiversity and improving adaptive capacity and resilience among smallholder farmers. However, this potential is context specific and insufficiently quantified in smallholder faming systems, partly because of inherent variability of smallholder farms. Our study aimed to determine the tree/shrub diversity and carbon stocks in different agroforestry systems within smallholder farms in two 100 km2 sites, the so-called lower and middle Nyando sites, in western Kenya. In both, context-specific agroforestry adoption had been promoted among households of four community associations through an asset-based community development (ABCD) approach. Their farms were assessed and compared with those of relevant comparison samples. Trees and shrubs were inventoried on a total of 106 farms, and their formations classified in five major agroforestry practices: hedgerows, multipurpose trees on farm (MPT), riparian buffers, woodlots, and boundary planting. To assess above-ground biomass (AGB) of individual trees/shrubs, diameter at breast height measurements were taken. Strong regional differences were considered in data analysis and presentation. Altogether, 3,353 and 6,346 trees/shrubs were inventoried in the lower and middle Nyando sites, respectively. AGB was significantly higher in middle than in lower Nyando. Woodlots had the highest amount of AGB carbon stock, while MPT had the highest diversity of tree/shrub species in all the groups. Conversely, boundary planting had the highest number of trees/shrubs inventoried and hence was the most common agroforestry practice across all the samples in both regions. Dominant AGB contributor species were Grevillea robusta (37.8%) in middle, and Eurphobia tirucalli (16.5%) in lower Nyando. This study provides empirical evidence that asset-based and community-driven selection and implementation of both tree/shrub species and agroforestry practices can contribute positively to species and practice diversity, which are associated with AGB carbon stock levels and wider agro-ecosystem diversity. This study hence provides benchmark information that is relevant for SDG goal 15 on “life on land,” and various specific targets, and can inform sustainable establishment of carbon sink facilities by supporting smallholders to uptake contextually suitable and economically sensible agroforestry practices in an overall effort to foster and support sustainable development.
Introduction
Efforts to combat climate change in the agriculture, forestry, and other land use (AFOLU) sectors hinge on reducing greenhouse gas emissions and increasing carbon sequestration in all land use systems, including agroforestry. Agroforestry is among the most promising land use strategies to mitigate climate change through carbon sequestration while helping rural communities improve their livelihoods and adapt to a changing climate (Thorlakson and Neufeldt, 2012; Ranjitkar et al., 2016; Quandt et al., 2017). Trees planted in crop and in pasture fields contribute to climate change mitigation by binding carbon in biomass and by raising soil organic carbon levels. A 2016 assessment showed that 43% of all agricultural land globally had at least 10% tree cover in 2010 (Zomer et al., 2016). The same study also illustrated that in many developing countries, there are large unproductive croplands and land considered as degraded that could be transformed into productive agroforestry systems. Whereas the positive role of agroforestry in climate change mitigation is recognized in the scientific literature and global land restoration debates (Thorlakson and Neufeldt, 2012; Ranjitkar et al., 2016; Quandt et al., 2017), the role of smallholder agroforestry systems has remained insufficiently explored. Better knowledge about their contribution to climate change mitigation can contribute to focus support and priorities on good land use practices to enhance climate change adaptation and mitigation in developing countries and contribute significantly to SDG goal 15 on “life on land,” and various specific targets, including 15.1, 15.2, 15.3, 15.5, 15.9, in eastern Africa specifically, and contributes to 15.a and 15.b. The study also interacts with goals 1, 2, 5, 8, 13, 16, and 17.
Agroforestry has been recognized as a suitable land use system in fragile areas and smallholder systems because of its potential to diversify and sustain production for increased social, economic and environmental benefits when compared with treeless alternatives (Roshetko et al., 2006). These systems maintain high tree densities and may contain high carbon stocks. When combined with crops and pasture, trees and shrubs can increase food and feed production locally, creating a positive impact on food security (Thorlakson and Neufeldt, 2012; Franzel et al., 2014; Sileshi et al., 2014; Quandt et al., 2017). When used on degraded lands, woody perennials offer potential for increased carbon stocks because of increased biomass production, and have a positive impact on biodiversity (Chazdon, 2008). Increasing living biomass in agricultural landscapes can reduce pests (Pumari et al., 2015), and may increase crop production because of the impacts of trees on soil fertility, soil moisture, soil nutrients, wind speed and microclimate (Kuyah et al., 2016). The role of agroforestry in enhancement of biodiversity underpins the provision of these ecosystem services (Kuyah et al., 2016). Trees are often conserved on farms through selectively retaining trees or shrubs in crop or pasture fields or planting new naturally occurring ones, a practice that is recognized as farmer-managed natural regeneration (FMNR) (Garrity et al., 2010; Haglund et al., 2011; Weston et al., 2015; Reij and Garrity, 2016). These trees provide benefits that would otherwise be sourced from the forest, reducing pressure on forests and creating habitats for different flora and fauna on agricultural lands (McNeely and Schroth, 2006).
Scientific evidence shows that agroforestry systems have a large potential for climate protection (Zomer et al., 2016). Globally, agricultural lands with trees stock an average of 21.4 Mg ha–1 of carbon stocks in biomass. In western Kenya, two studies estimated carbon in agroforestry systems to be 17 Mg ha–1 in aboveground biomass (Kuyah et al., 2012a) and 5 Mg ha–1 in belowground biomass (Kuyah et al., 2012b), totaling 22 Mg ha–1 of carbon in living biomass. Because of high biomass, agroforestry systems can store more carbon compared to crop and pasture fields without trees (Nair, 1993; Budiadi and Ishii, 2010). However, the amount stored is context specific and varies depending on factors such as agroforestry practice, type of species, age of agroforestry system, management influence, and environmental conditions (Luedeling et al., 2011; Kuyah et al., 2014). Yet, methodological challenges such as lack of standardized methods and limited number of allometric biomass equations render it difficult to accurately estimate carbon stocks in agroforestry systems (Sileshi et al., 2014). This is partly due to difficulties associated with biomass assessment in smallholder systems, which are highly heterogeneous (Kuyah et al., 2012a). For instance, the overall carbon sink potential is insufficiently quantified with respect to specific agroforestry practices. Furthermore, Rosenstock et al. (2019) showed that the absence of standardized tools to report on agroforestry has led to it often not being included in measurement, reporting and verification systems under the UNFCC. This leads to agroforestry not being considered in many developing countries’ achievements toward reaching their Nationally Determined Contributions (NDCs) despite them explicitly mentioning agroforestry as priority activity (Rosenstock et al., 2019). This has important implications, specifically for the quantification of smallholder systems’ contribution to developing countries’ NDCs and the counting of smallholder agroforestry carbon toward global targets. These limitations have led to lack of data, varying conclusions, and a fragmented understanding of the role of agroforestry in climate change and development.
Most smallholder farming systems in Kenya pursue conventional agricultural intensification, which has contributed to greenhouse gas emissions, soil degradation and loss of biodiversity. This challenge has spurred increased interest in sustainable intensification, and the potential of agroforestry systems to couple agricultural production, carbon sequestration and biodiversity conservation. Agroforestry also provides opportunities for smallholder farmers to benefit from existing and emerging opportunities in carbon markets (Roshetko et al., 2006; Seeberg-Elverfeldt et al., 2009). While the multifaceted positive roles agroforestry can play have been widely documented, the contribution that individual agroforestry practices can make has received little attention in previous studies. Compared to carbon storage potential of different tree species that has been identified for various regions on the African continent (Brown, 1997; Ketterings et al., 2001; Zewdie et al., 2009; Kuyah et al., 2012a,2014; Mugasha et al., 2013; Negash et al., 2013; Mokria et al., 2018), the carbon storage potential of different agroforestry practices in western Kenya has not been explored in detail. The objective of this study was to determine the effects of agroforestry promotion through the implementation of an asset-based community-driven development (ABCD) pilot project in western Kenya, which promoted asset-based, community-selected, and context-specific climate-smart agricultural practices, including selected agroforestry practices, on the diversity of tree and shrub species and carbon stocks in general, and on carbon stocks in selected agroforestry practices and tree and shrub species in particular. By providing insights into the diversity of tree species and carbon stored in different agroforestry practices, this study provides benchmark information that can allow various actors to promote evidence-based and sustainable establishment of carbon sink facilities by supporting smallholders to uptake the most suitable and economical agroforestry practices in a given area in an overall effort to support sustainable community development.
Methodology
Study Site
The study was conducted in two 10 km by 10 km benchmark sites along the Nyando River basin in western Kenya (Figure 1). The so-called lower and middle Nyando “blocks” are sentinel research sites that were initially defined in the context of the Western Kenya Integrated Ecosystem Management Project (WKIEMP). The project identified these sites along the three major rivers in western Kenya, Rivers Nzoia, Yala, and Nyando, and collected comprehensive social, economic and biophysical data in three sites along each of these rivers (Verchot et al., 2008). Within these sites, the World Agroforestry Centre (ICRAF), in collaboration with the Coady International Institute, implemented an ABCD pilot project between 2010 and 2014. The ABCD approach to international development, drawing on earlier works focusing on the empowerment of marginalized groups and areas in urban inner cities of the United States (Kretzmann and McKnight, 1993), was comprehensively adapted for the international development context by the Coady International Institute and has been implemented in various countries of the global South since the early 2000s (Mathie and Cunningham, 2008; Mathie et al., 2009, 2017; Ghore, 2015). With the help of various ABCD tools, communities define their own development priorities in view of existing assets, strengths, and related opportunities. In line with these community-defined priorities, the project supported targeted agricultural and agroforestry practices that are based on and responsive to the relevant communities’ identities (who they are), interests (their rational calculations), and preferences (what they like) (Fuchs et al., 2019a,b). By supporting community-selected and community-driven activities, the project pursued various overarching aims, including rehabilitation of degraded land in the basin through the sustainable inclusion of trees and shrubs on farm to improve environmental services, alongside increased food security and improved livelihoods. The project worked with four community groups, two in lower Nyando and two in middle Nyando, with a total membership of 116 from 98 households (see Table 1).
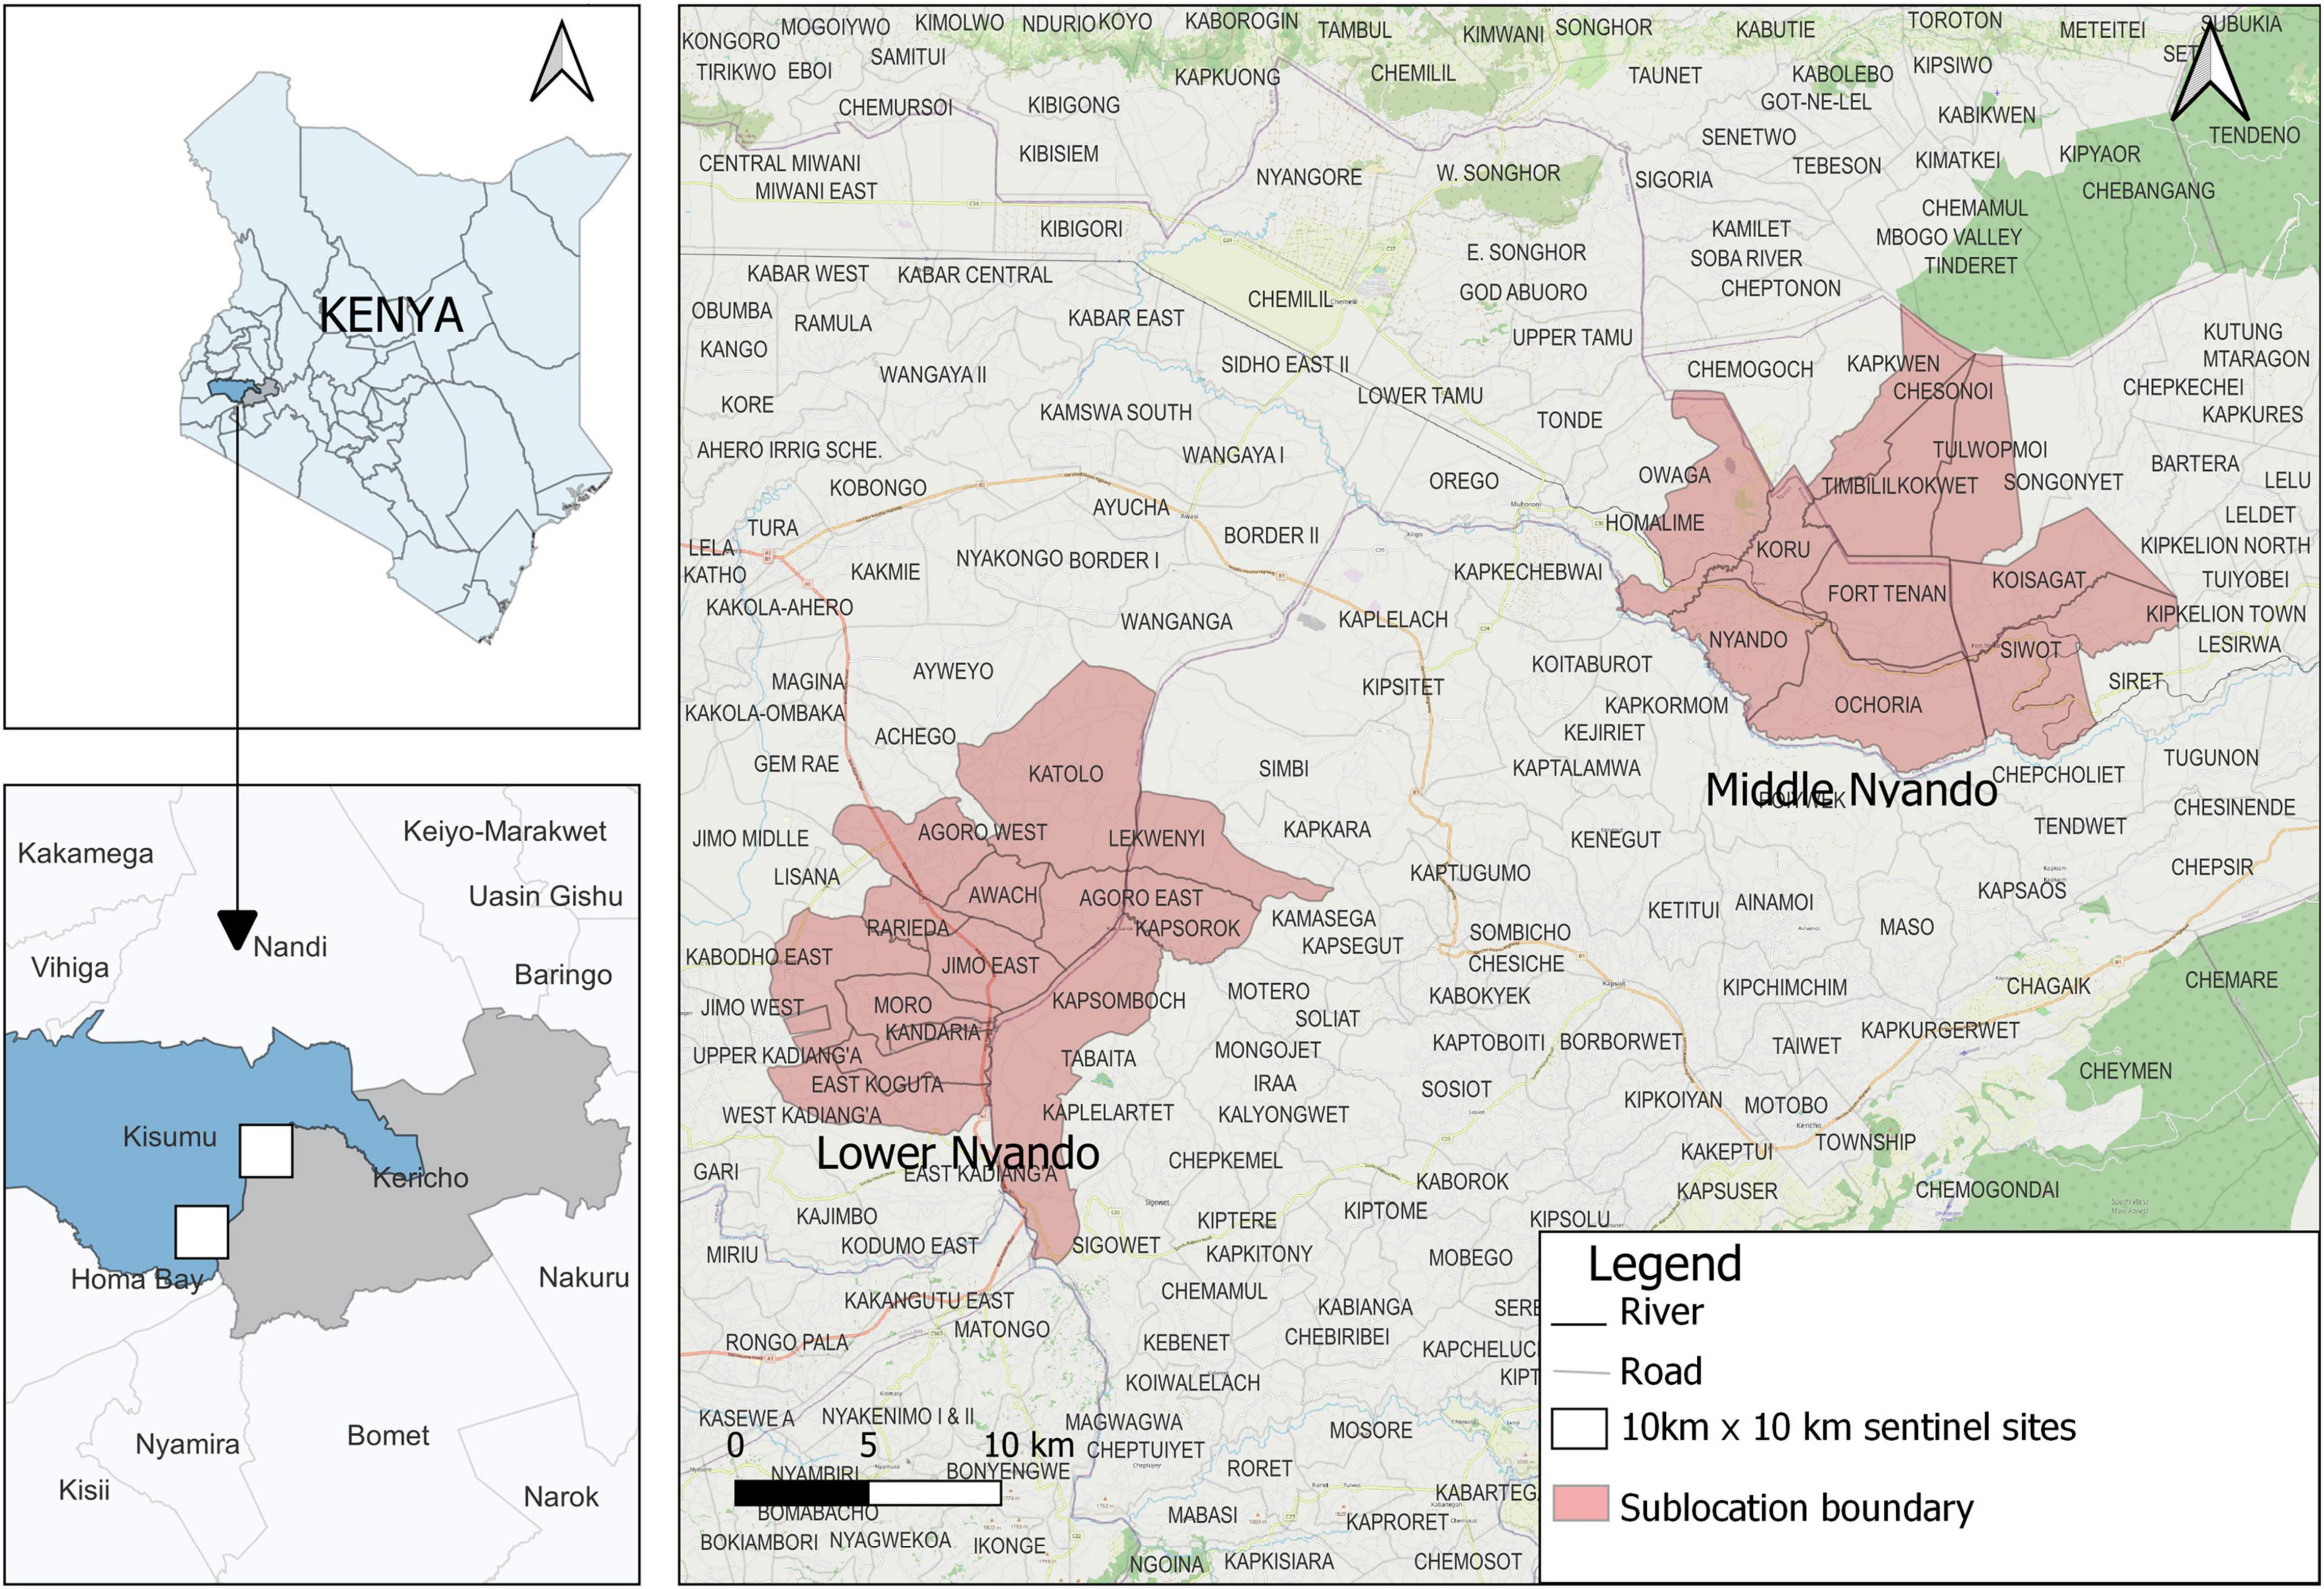
Figure 1. The lower and middle Nyando research sites.
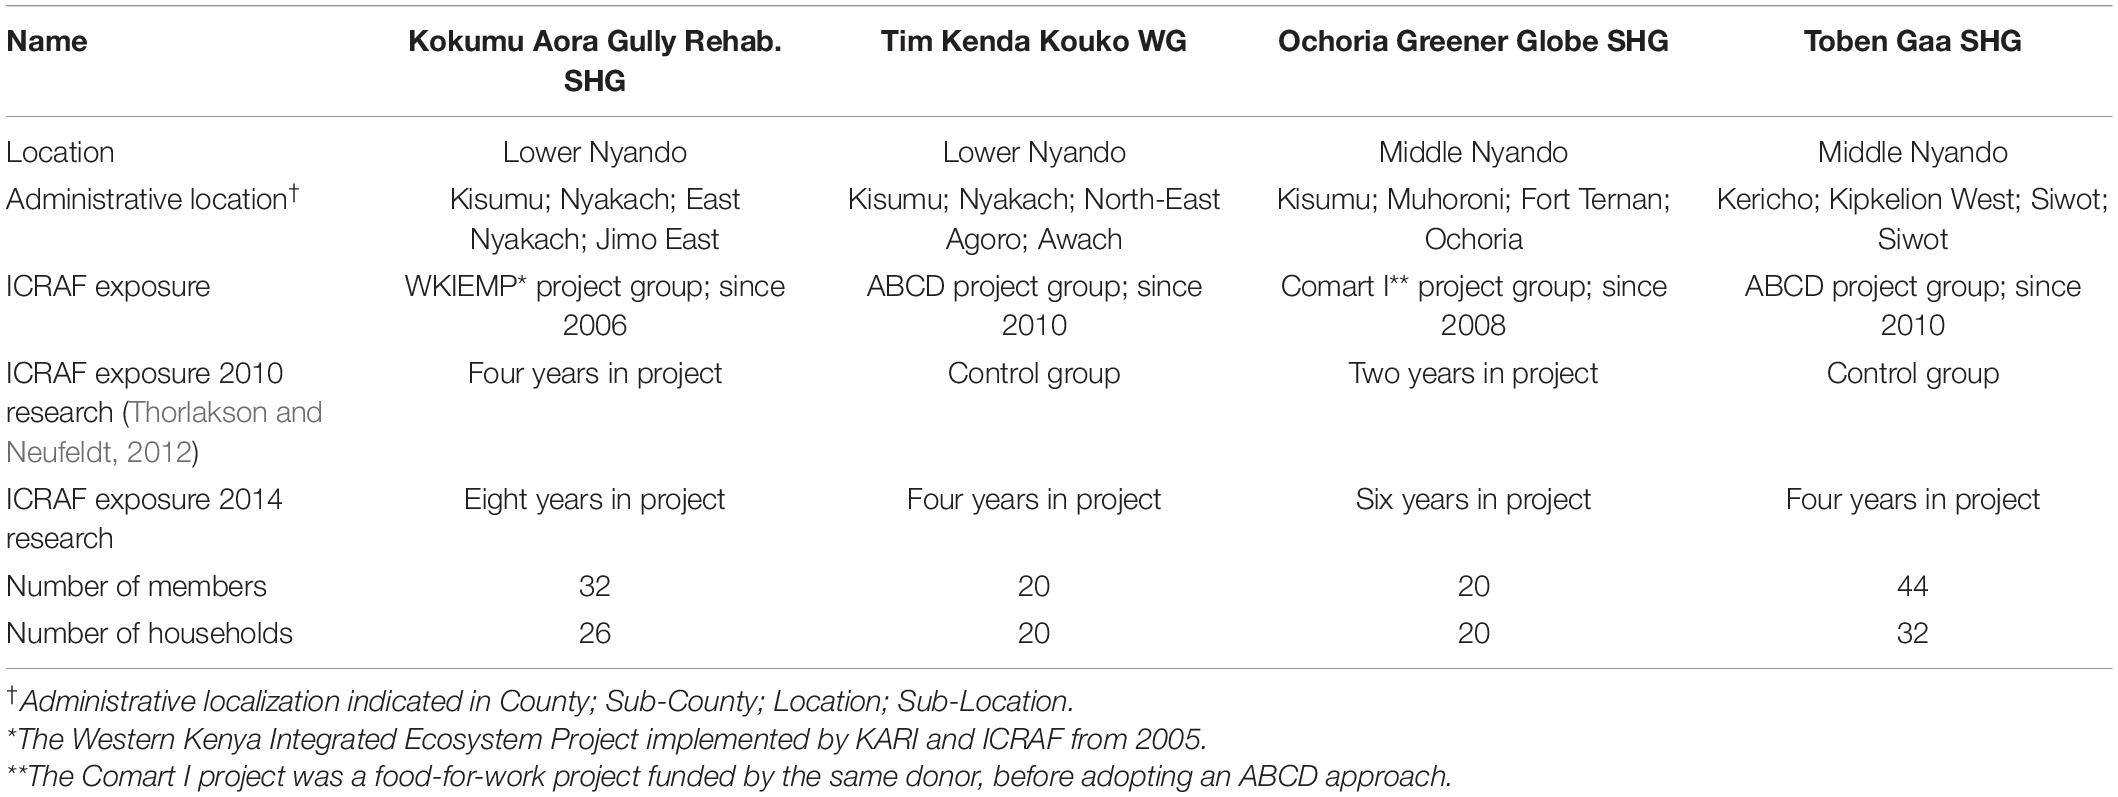
Table 1. Self-Help Groups (SHG) and Women’s Group (WG) participating in the asset-based community-driven development (ABCD) pilot project in Lower and Middle Nyando in Western Kenya.
The lower Nyando site is in Kisumu County at latitude 0° 7′ N, longitude 34° 24′ E, with an elevation range of 1,000–1,300 m above sea level. The middle Nyando site is in Kericho County at latitude 0° 24′ S, longitude 35° 43′ E, with an elevation range of 1,300–1,800 m above sea level. The climate in the Nyando River basin varies from humid to sub- humid. Rainfall in both lower and middle Nyando is bimodal; long rains occur between March and May, while short rains occur between October and November. Mean annual rainfall in lower Nyando and middle Nyando ranges between 800 and 1,200 mm and 1,200–1,600 mm, respectively. The mean annual minimum and the maximum temperature ranges between 12 and 16°C and 29–31°C in lower Nyando and 9–14°C and 27–31°C in lower Nyando. Dominant soil types are luvisols and gleysols in lower Nyando and leptosols and cambisols in middle Nyando (Verchot et al., 2008).
Agriculture is the main land use activity in the region and a vast majority of the population in the basin depend on agriculture for their livelihood (Boye et al., 2008). The mean farm size is two acres in lower Nyando and three acres in middle Nyando (Fuchs and Neufeldt, 2014). Agricultural activities in the area include livestock keeping and subsistence crops farming of maize, beans, sorghum, and millet, while coffee and sugarcane are the main commercial crops. The Nyando River basin is one of the most degraded of all the river basins in the Kenyan portion of Lake Victoria alongside Yala River and Nzoia River basins (World Bank, 2010). Besides food crops, shrubs and grasses make up the dominant vegetation. Livestock grazing and charcoal burning have been cited as the leading cause of low vegetation diversity in the area (World Bank, 2010).
Field Measurements
Inventory measurements were conducted on farms of households that were previously selected for ICRAF’s ABCD climate change adaptation and mitigation pilot project. The surveyed households included members of eight community groups, evenly distributed across the blocks. In both blocks, two of the research groups had participated in the project (project groups) and two had not (control groups). Basic characteristics, including location, dominant land use, mean land size and approximate age of group members, were kept constant between each project group and its control group. Altogether, the research groups had 256 members from 189 households (see Table 2).
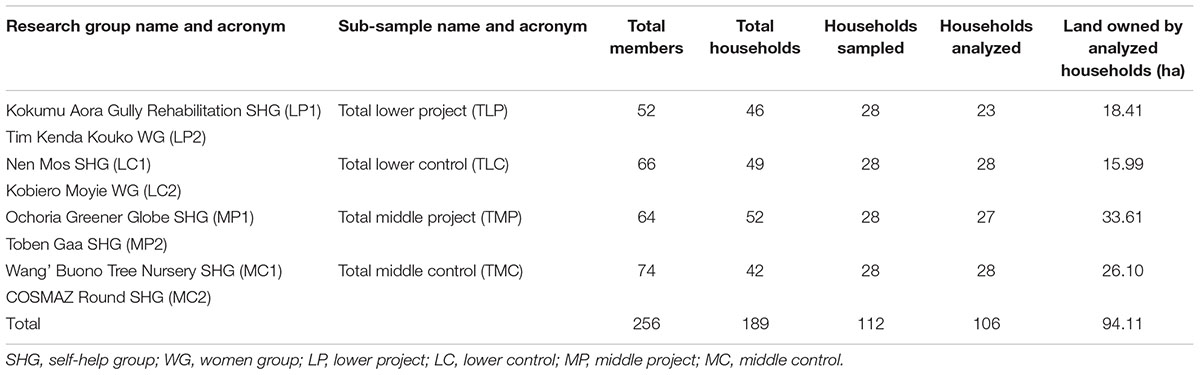
Table 2. Overview of community groups, households and land size included in the research.
Given the difference in household numbers in each research group, and due to limited funding and time to carry out the research, 14 households were selected from each of the eight groups by applying a stratified random sampling method. The sub-sample size was considered sufficient to capture the variation in spatial land size, tree/shrub species and their biomass across the study area. Hence, a total of 112 households were interviewed and their farms surveyed between May and September 2016.
Agroforestry practices found on individual farms of the surveyed households were classified according to the predominant arrangement and management of the trees/shrubs that were present, in line with terminology used in Nair (1993). Tree/shrub arrangements assessed were classified in five different practices: hedgerows, multipurpose trees on farm (MPTs), riparian buffers, woodlots, and boundary planting. To assess biomass of individual trees/shrubs, diameters at breast height (DBH) measurements were taken from each tree/shrub at 1.3 m above the ground level, using a regular tape measure held horizontally and tightly over bark. In case of bifurcations, forks, or swollen sections at the 1.3 m mark, appropriate protocols for measurement were followed. The DBH of the separate stems was calculated as the square root of the sum of squares of individual stems (West, 2009). The scientific name of the tree/shrub was recorded where known; and the local or English name of the species was recorded where the scientific name could not be identified in the field. The area (hectare, ha) under agroforestry practice was determined by using a Geographic Positioning System (GPS, Trimble JUNO 3D). The stretch of land under boundary planting was recorded as length in meters.
Data Analysis
The tree data were grouped into five DBH classes of [< 10, 10–20, 20–30, 30–40, and > 40 cm] to present frequency and biomass estimates of trees/shrubs in different diameter classes. The five classes were enough to achieve adequate spread of diameter classes of the sample. Shannon-Weiner diversity index (H) was used to describe the alpha diversity in each agroforestry practice. Different species were counted, and diversity index and other statistical analyses were calculated based on counts and proportion of individuals using Microsoft Excel and R (R Core Team, 2016).
Species specific allometric equations by Tumwebaze et al. (2013) were used to estimate the biomass of Markhamia lutea (AGB = 0.07502 × DBH2.42) and Grevillea robusta (AGB = 0.01 × DBH1.81). The equation by Kuyah et al. (2013) for eucalyptus (AGB = 0.085 × DBH2.471) was applied to trees of this genera. Biomass for the rest of the species was determined using the generic equation for trees in agricultural landscapes in western Kenya (AGB = 0.091 × DBH2.472) (Kuyah et al., 2012a). The sum of biomass estimates of individual trees/shrubs in different agroforestry practices was divided by respective land area to obtain biomass in Mg ha–1. Biomass for trees in boundary planting was converted to Mg ha–1 by calculating the area occupied by boundary trees and assuming a width of 2 meters (Reppin et al., 2019).
Data from a total of 106 households were considered in the analysis after removing six households whose values were considerably different from other observations in the dataset (see Table 2). Quantitative biophysical data was triangulated with qualitative interview data. Data presentation in the results section follows the following sequence in most sub-sections: (a) results from the entire dataset, (b) regionally differentiated results, and (c) comparison of results between project and control groups that are aggregated at landscape level, and hence separately for both regions. Considering the importance of the biophysical context on land use and management in the region, and the interest in highlighting project effects, comparing the four “group-in-site” sub-samples, namely (total) lower project, (total) lower control, (total) middle project, and (total) middle control, is fundamental. In some instances, comparisons of individual research groups and their control groups are added.
Results
Descriptive Statistics
The descriptive analyses of the dataset are shown in Table 3. The size of the land owned, and land operated was significantly higher in the middle region than in the lower region samples. Furthermore, the number of male-headed households was significantly higher in middle, while the age of the head of household was significantly higher in lower Nyando (Table 3). In the lower Nyando sample, there were no significant differences between project and control groups in any characteristic. In the middle Nyando sample, the size of land operated was higher in the project than in the control groups.
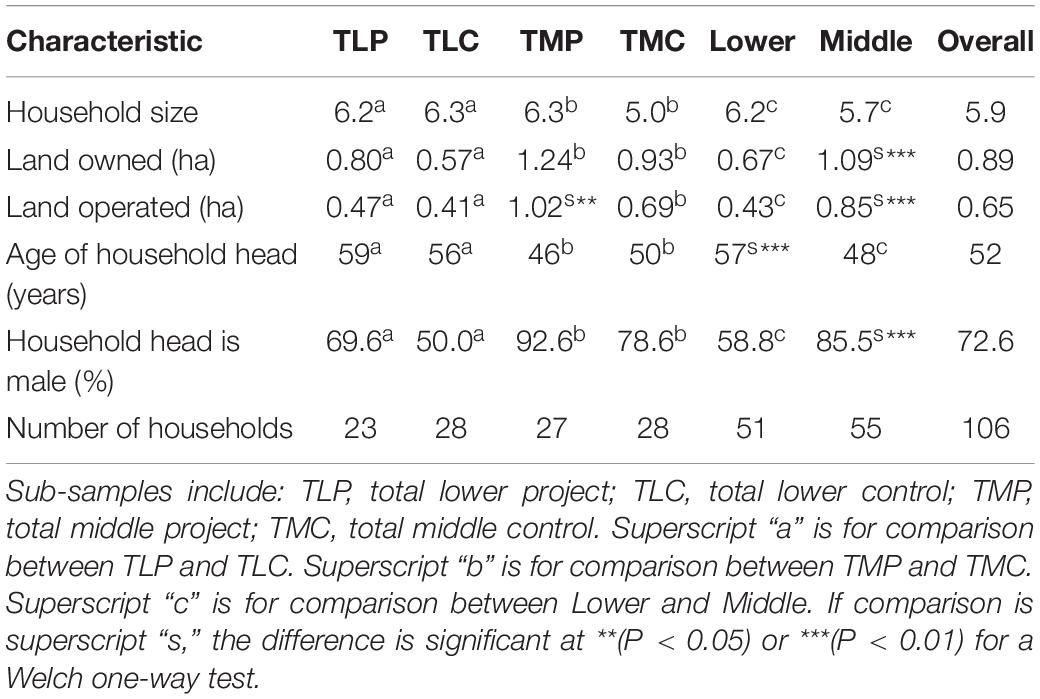
Table 3. Summary of household socioeconomic characteristics.
Tree and Shrub Species Number and Size Distribution
A total of 9,699 trees/shrubs were inventoried, 3,353 (35%) on farms surveyed in lower Nyando and 6,346 (65%) on middle Nyando farms (Table 4). Overall, the total number of trees, the species diversity, and biomass were significantly higher on farms assessed in middle Nyando than in lower Nyando. One-way ANOVA test (with no assumption of equal variances) was used to assess differences in mean tree density (per hectare) between regions, then between aggregated project and control groups within the regions (Table 5).
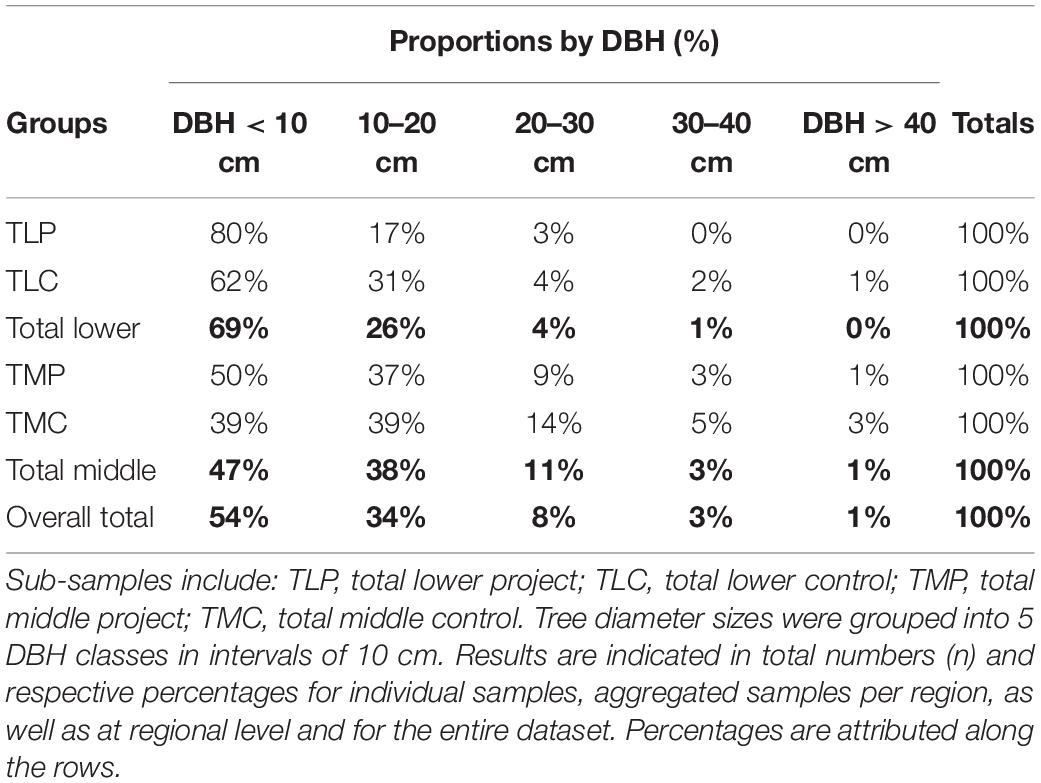
Table 4. Distribution of tree/shrub sizes across sub-samples and regions.
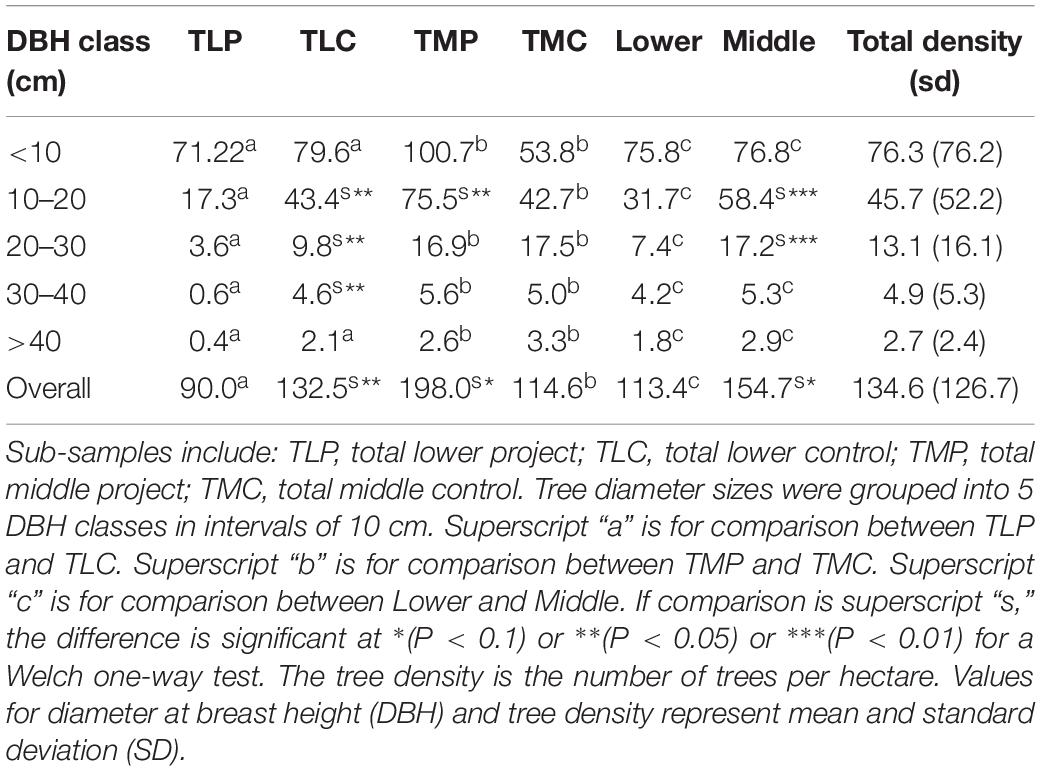
Table 5. Vegetation structure (tree density per ha) comparing differences across sub-samples and regions (using one-way ANOVA).
Altogether, tree densities for DBH < 10 cm and DBH (30–40 cm) were the highest and lowest, respectively. For trees of DBH > 10 cm, mean tree density was significantly different (P < 0.05) between lower and middle Nyando regions. Households in the middle Nyando region reported significantly greater tree densities than the lower Nyando region for trees of DBH > 10 cm. Mean tree densities for some DBH classes differed significantly between lower project and lower control groups and also between middle project and middle control groups. Overall, lower project had the highest tree/shrub densities per hectare compared to lower control, middle project, and middle control (Table 5). However, we acknowledge that the smaller size of land in middle project groups (Table 4) and proportion of trees (Figure 2), likely contributed to the very high tree density, especially for the younger trees of DBH < 20 cm. It is noteworthy that the percentages of smaller diameter trees/shrubs (DBH < 10 cm) were higher among all project groups than among their respective control groups (Table 4); indicating that a higher proportion of the tree population found on the farms of project group members were younger in age and had been planted or maintained within the previous years.
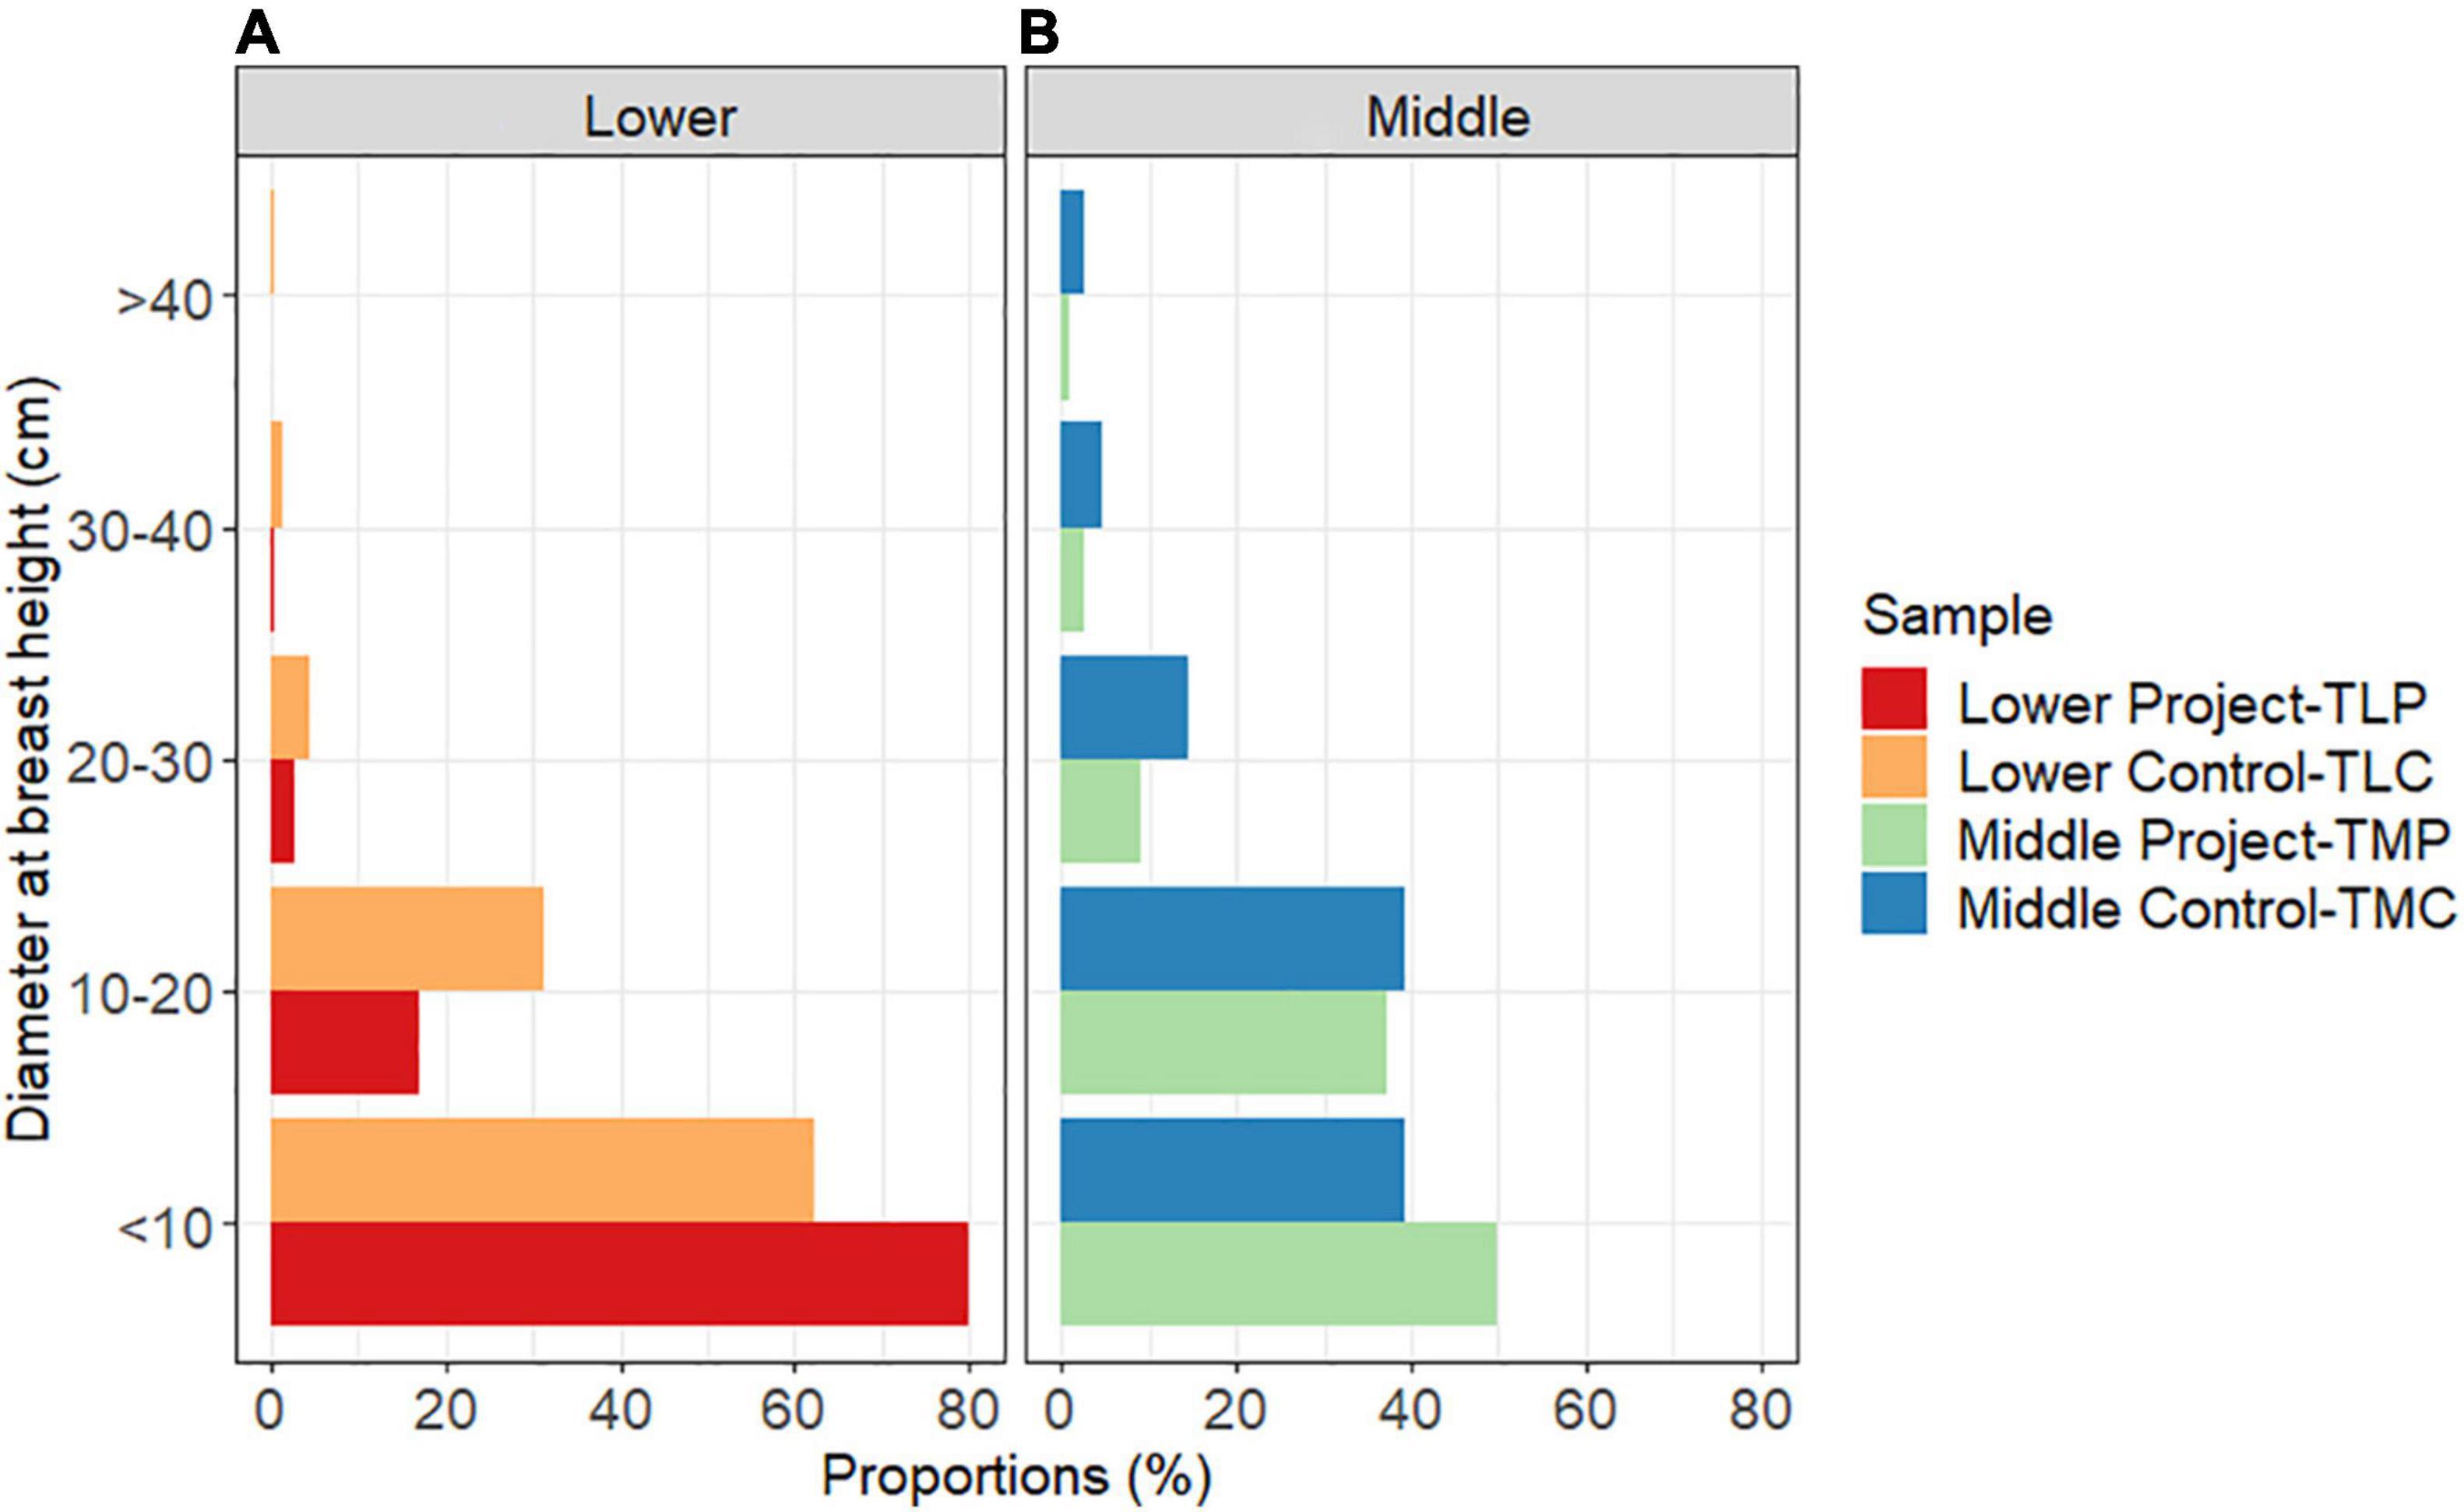
Figure 2. The proportion of trees and shrubs inventoried in (A) lower and (B) middle Nyando sub-samples.
Looking at the data at a landscape level (Table 4), and hence aggregating the data from the project groups and the control groups in each region, the lower control groups had 1.6 times more trees/shrubs than the lower project groups (Table 4). Conversely, the middle project sample had 2.4 times higher numbers of trees/shrubs on farm than the middle control sample (Table 4). While project and control groups in lower Nyando had almost equal numbers in small diameter trees (DBH < 10 cm), these represented a considerably higher percentage for the lower project (79%) than the lower control groups (62%) (Figure 2). Intermediary diameter trees/shrubs (10–40 cm) were almost three times as many in absolute terms in lower control than in lower project, representing 37% in the lower control and 20% in the lower project samples. Large diameter trees/shrubs (DBH < 40 cm) were scarce in both lower project and lower control (Table 4). In middle Nyando, the middle project sample had more than twice as many trees overall, more than three times as many in the small diameter class, and almost twice as many in the medium diameter class. Similar to lower Nyando, this translated to higher percentages of trees on farm being small diameter trees in the middle project sample (50%) than in the middle control sample (39%), reiterating the fact that more trees were planted among project groups than among control groups in previous years. While overall few in numbers, large diameter trees/shrubs (DBH > 40 cm) were fewer (1%) in the middle project than in the middle control samples (3%).
Tree and Shrub Species Diversity in Different Agroforestry Practices
The total of 9,699 trees and shrubs inventoried belonged to 102 species and were found throughout an area of 11.104 hectares and 12,198.102 m. This area had 106 households and the trees were distributed over five agroforestry practices across the lower and middle Nyando regions. Overall, according to the Shannon-Weiner index, the diversity of the entire sample was 3.08 (± 0.01). The diversity index in middle Nyando was 2.83 (± 0.01), and hence slightly higher than 2.74 (± 0.01) in lower Nyando (see Table 6).
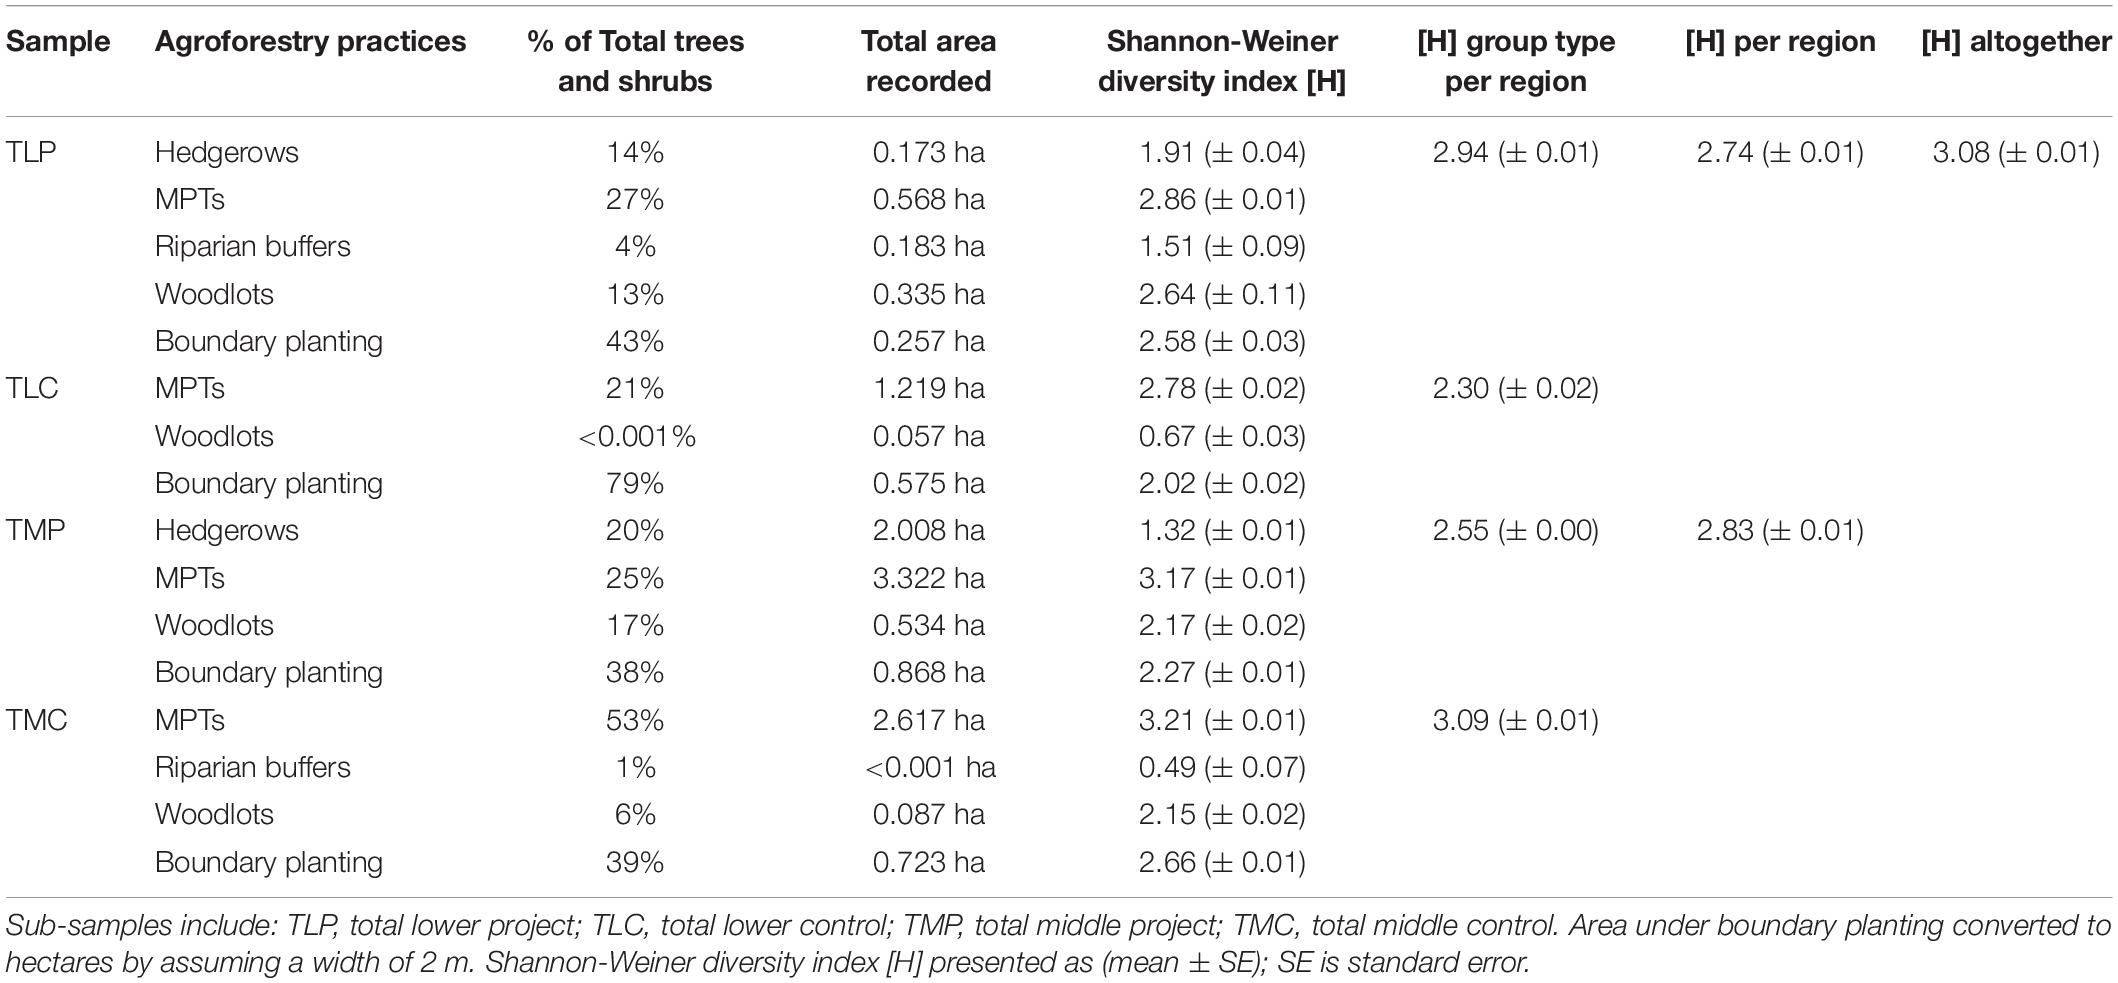
Table 6. Species diversity in various agroforestry practices across sub-samples and regions.
In the lower block, 48 species were identified, nine of which were indigenous and 39 were exotic tree species. Of the 48 species, 37 were tree and 11 were shrub species. Furthermore, 1,261 saplings, trees/shrubs of DBH < 2.5 cm of various species, were counted in the region. The most common exotic trees were Grevillea robusta and Euphorbia tirucalli and indigenous trees were Balanites aegyptiaca and Markhamia lutea in lower Nyando. The total lower project sample had a higher species diversity than lower control sample at 2.94 (± 0.01) and 2.30 (± 0.02), respectively. These trees were also utilized in more diverse agroforestry practices in the lower project than in the lower control samples. Trees/shrubs were found in five different agroforestry practices in lower project sample, compared to three practices in lower control groups. The most popular arrangement of these trees, and hence the most common agroforestry practice, was boundary planting in both total project and control samples in lower Nyando. Overall, in lower Nyando, 43 and 79% of trees/shrubs were inventoried in boundary planting arrangements in lower project and lower control samples, respectively. Tree and shrubs species’ diversity varied across the different agroforestry practices identified in lower project and lower control. Multipurpose trees on farmland had the highest diversity index, 2.82 (± 0.01) and 2.78 (± 0.02), in lower project and lower control samples, respectively.
In middle Nyando, 39 indigenous and 56 exotic species, and hence a total of 95 tree/shrub species were inventoried; of which 67 were tree and 28 were shrub species. Furthermore, 5,468 saplings of various species were counted in the region. The most common exotic trees were Grevillea robusta, Cupressus lusitanica, while the most common indigenous trees were Spathodea campanulata and Markhamia lutea. The middle project sample had a lower species diversity than the middle project sample, with a Shannon-Weiner diversity-index [H] of 2.55 (± 0.00) and 3.09 (± 0.01), respectively. The middle project and middle control samples both had four different agroforestry practices each. Boundary planting had the highest number of trees/shrubs in the middle project sample (38%), while most trees/shrubs in the middle project sample were found in multipurpose trees on farmland (MPTs) arrangements (53%). In both the middle project and the middle control samples, MPTs was the agroforestry practice with the highest tree and shrub species diversity at 3.17 (± 0.01) and 3.21 (± 0.01), respectively.
Interestingly, hedgerows were only planted by project groups in both regions, while riparian buffers were only found in the lower project and middle control samples. The three other practices were recorded in all four sub-samples.
Trees and Shrubs Biomass Estimates and Carbon Stocks
Across the entire sample, present mean AGB per farm was estimated at 8.33 Mgha–1. Concerning the regional differences, the total estimated mean AGB per farm of the 55 farms assessed in middle Nyando was 13.49 Mgha–1 and hence significantly higher (P < 0.001) than the 2.77 Mgha–1 assessed on the 51 farms in lower Nyando (Table 7). Farms in lower project groups had significantly lower biomass estimates that farms in lower control groups. On the other hand, farms in middle project groups had significantly higher biomass estimates than those in middle control groups.
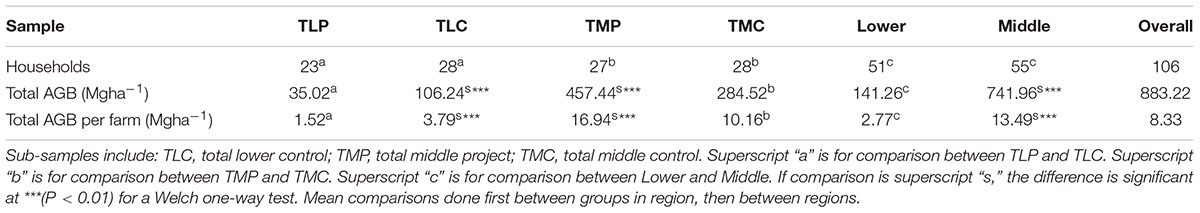
Table 7. Trees and shrubs biomass estimates across sub-samples and regions.
Biomass Contributors by Diameters at Breast Height Class
Overall, trees with DBH of 10–20 cm (39.2%), and DBH less than 10 cm (23.7%) contributed the most AGB in the whole sample. In middle Nyando, 78.7% of AGB was contributed by trees that had a DBH of less than 30 cm. In lower Nyando, the majority of AGB (86.2%) was also from trees with DBH that was less than 30 cm. However, middle Nyando had more AGB (11%) from large high biomass trees (DBH > 40 cm) compared to only 5.7% in lower Nyando. Trees with DBH of less than 30 cm contributed the most AGB (89%) in the lower Nyando project sample (TLP). Similarly, most of the biomass in the lower Nyando control sample (TLC) was found in intermediary diameter trees (10–30 cm). Consequently, they contributed most of the AGB (see Figure 3). Trees with DBH of less than 20 cm contributed over half of the AGB in the middle project and middle control samples. High biomass trees (DBH > 40 cm) stocked a small fraction of the estimated AGB in lower Nyando; 7 and 5% in the lower project and in the lower control samples, respectively. At the same time, higher intermediary diameter trees (DBH = 30–40 cm) held a considerable proportion (11%) of AGB in the lower control sample, unlike in the lower project sample (3%). Conversely, they stocked a significant proportion of biomass in middle Nyando; 11% in the middle project and 10% in the middle control samples, respectively. All results are included in Figure 3.
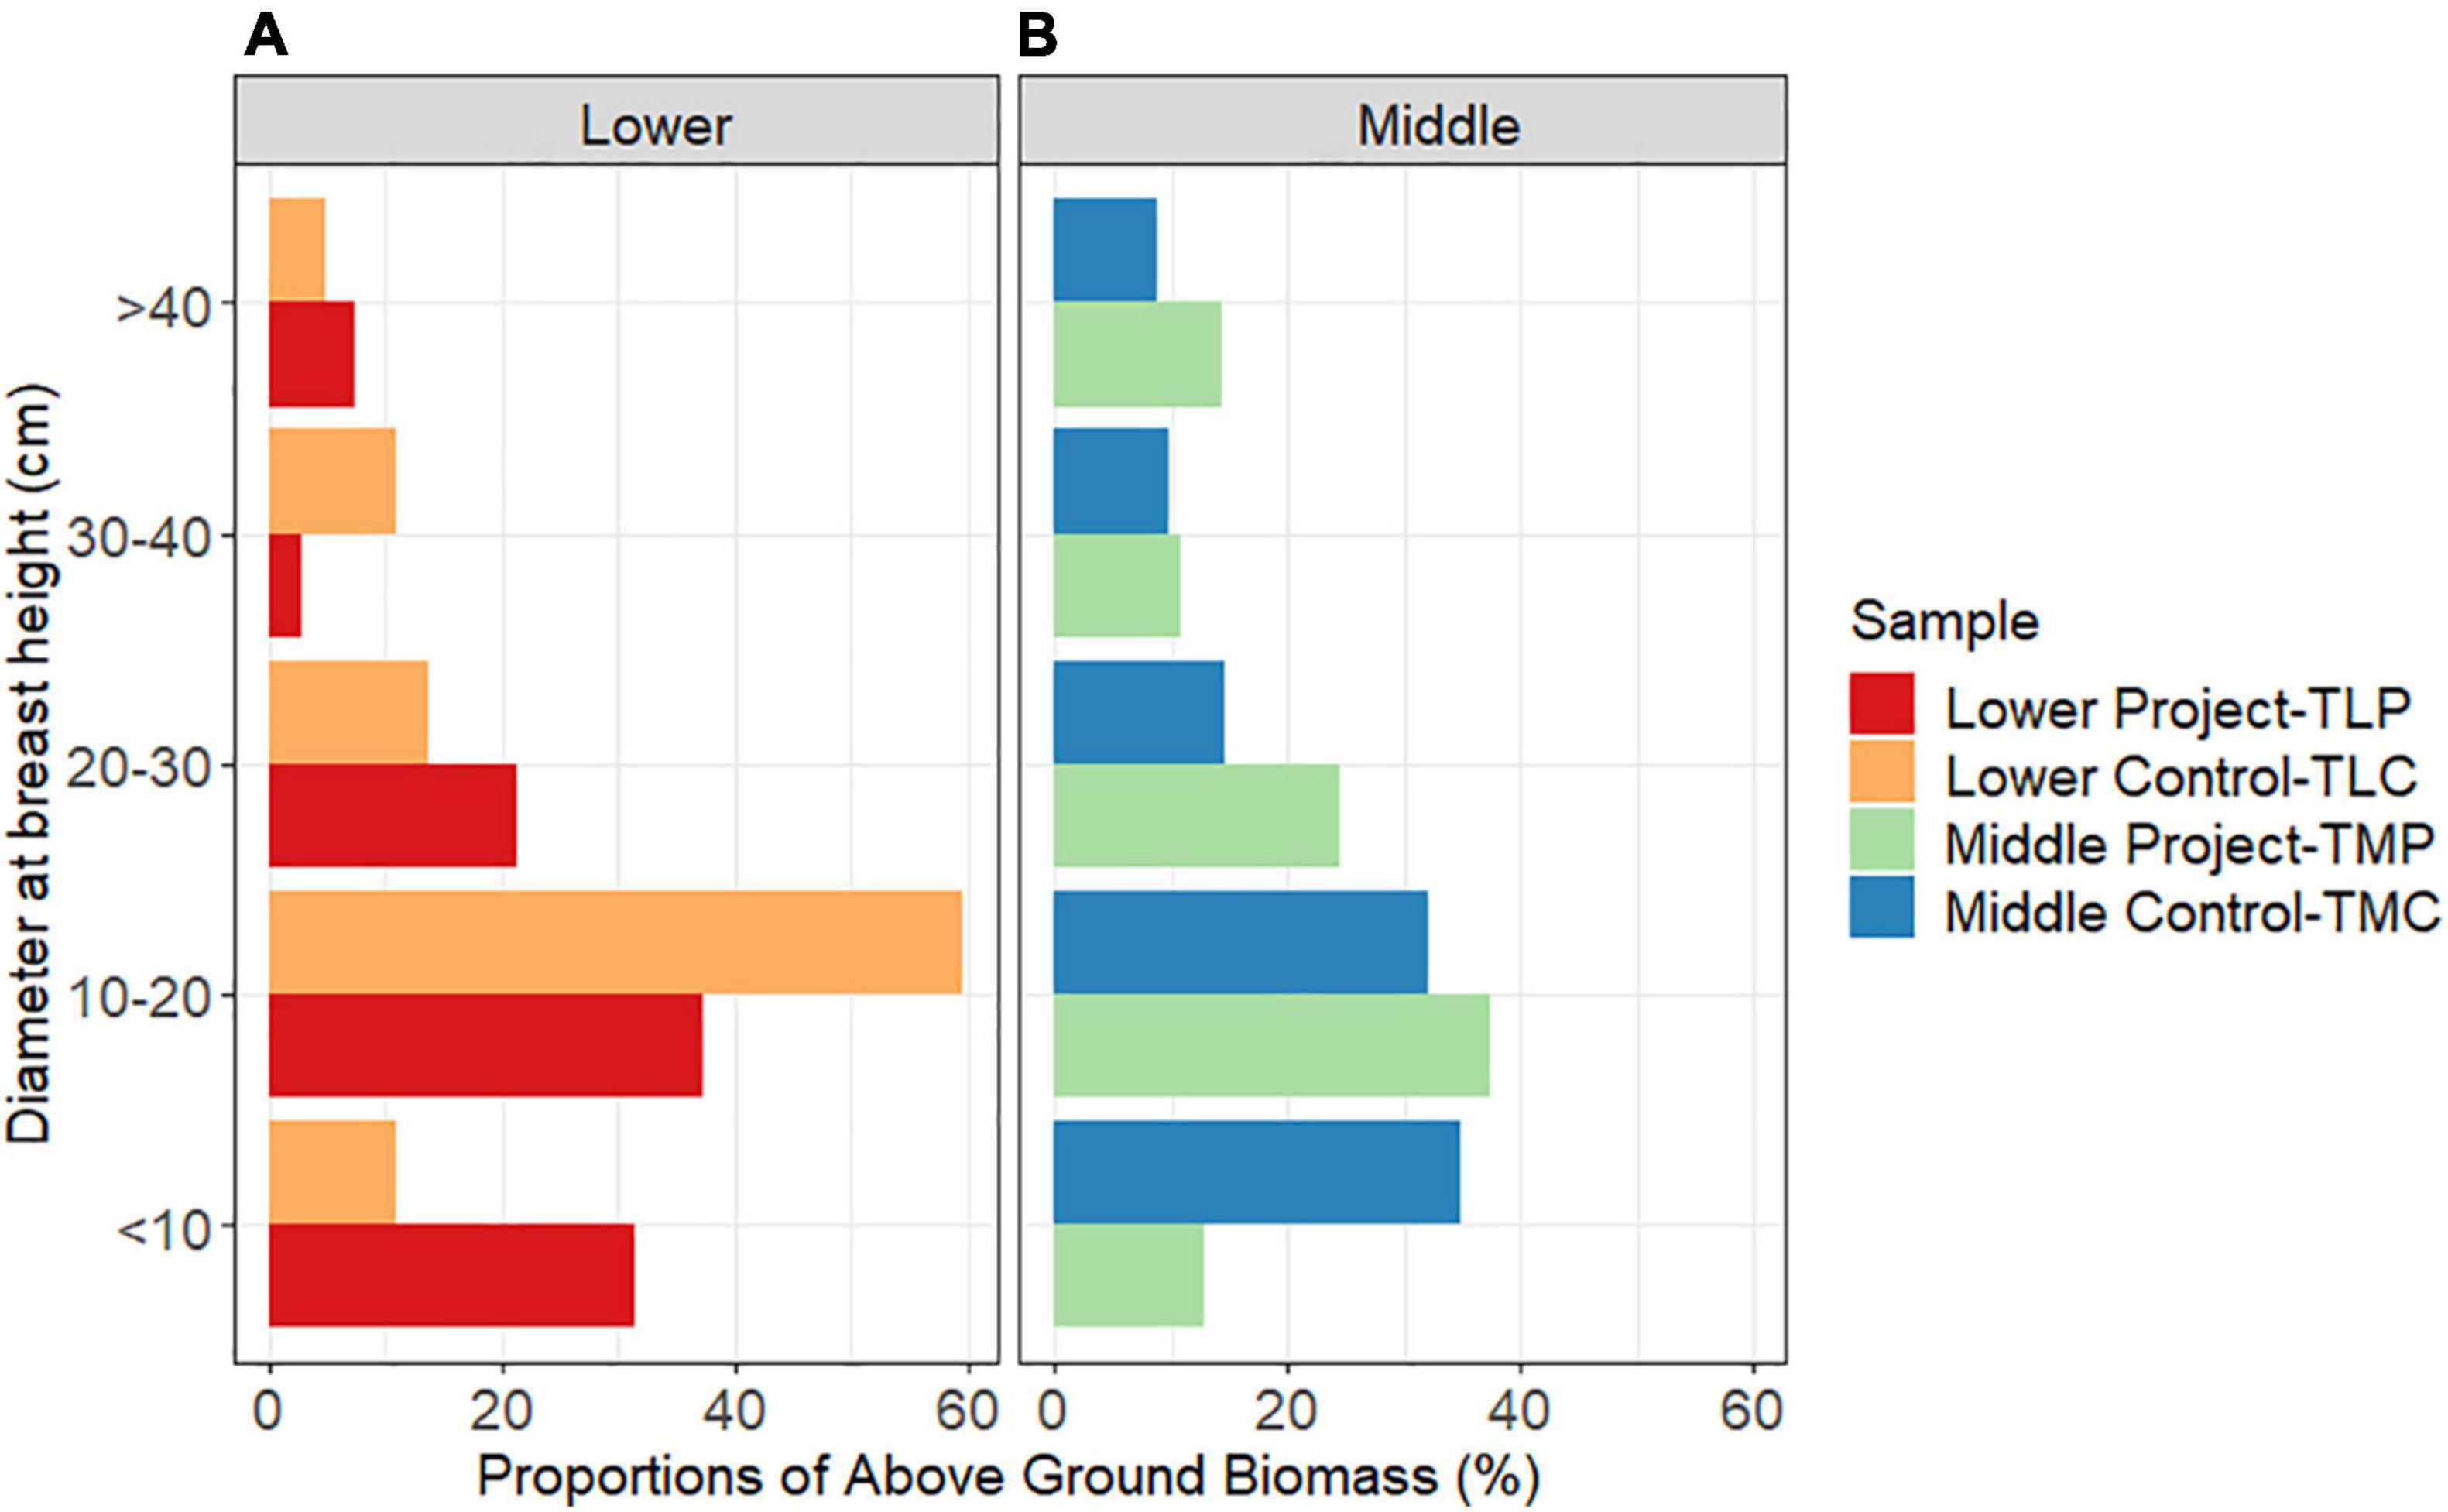
Figure 3. Biomass estimates in (A) lower and (B) middle Nyando sub-samples.
Biomass Estimates Per Agroforestry Practice
Considering one of the core contributions of this paper, biomass stock potentials of different tree and shrub arrangements, the assessment of AGB of various agroforestry practices provided interesting insights. Woodlots contributed most AGB per farm with 7.92 Mg/ha, boundary planting contributed 4.91 Mg/ha, hedgerows had 5.22 Mg/ha, and MPTs contributed 1.76 Mg/ha. Riparian buffers contributed the highest AGB per farm at 114.53 Mg/ha but was excluded1 from further analysis because it included data from only two households. In lower Nyando, riparian buffers contributed most AGB per farm, followed by boundary planting and hedgerows (Table 8). In middle Nyando, riparian buffers contributed the most AGB per farm, followed by woodlots, hedgerows, and boundary planting (Table 8).
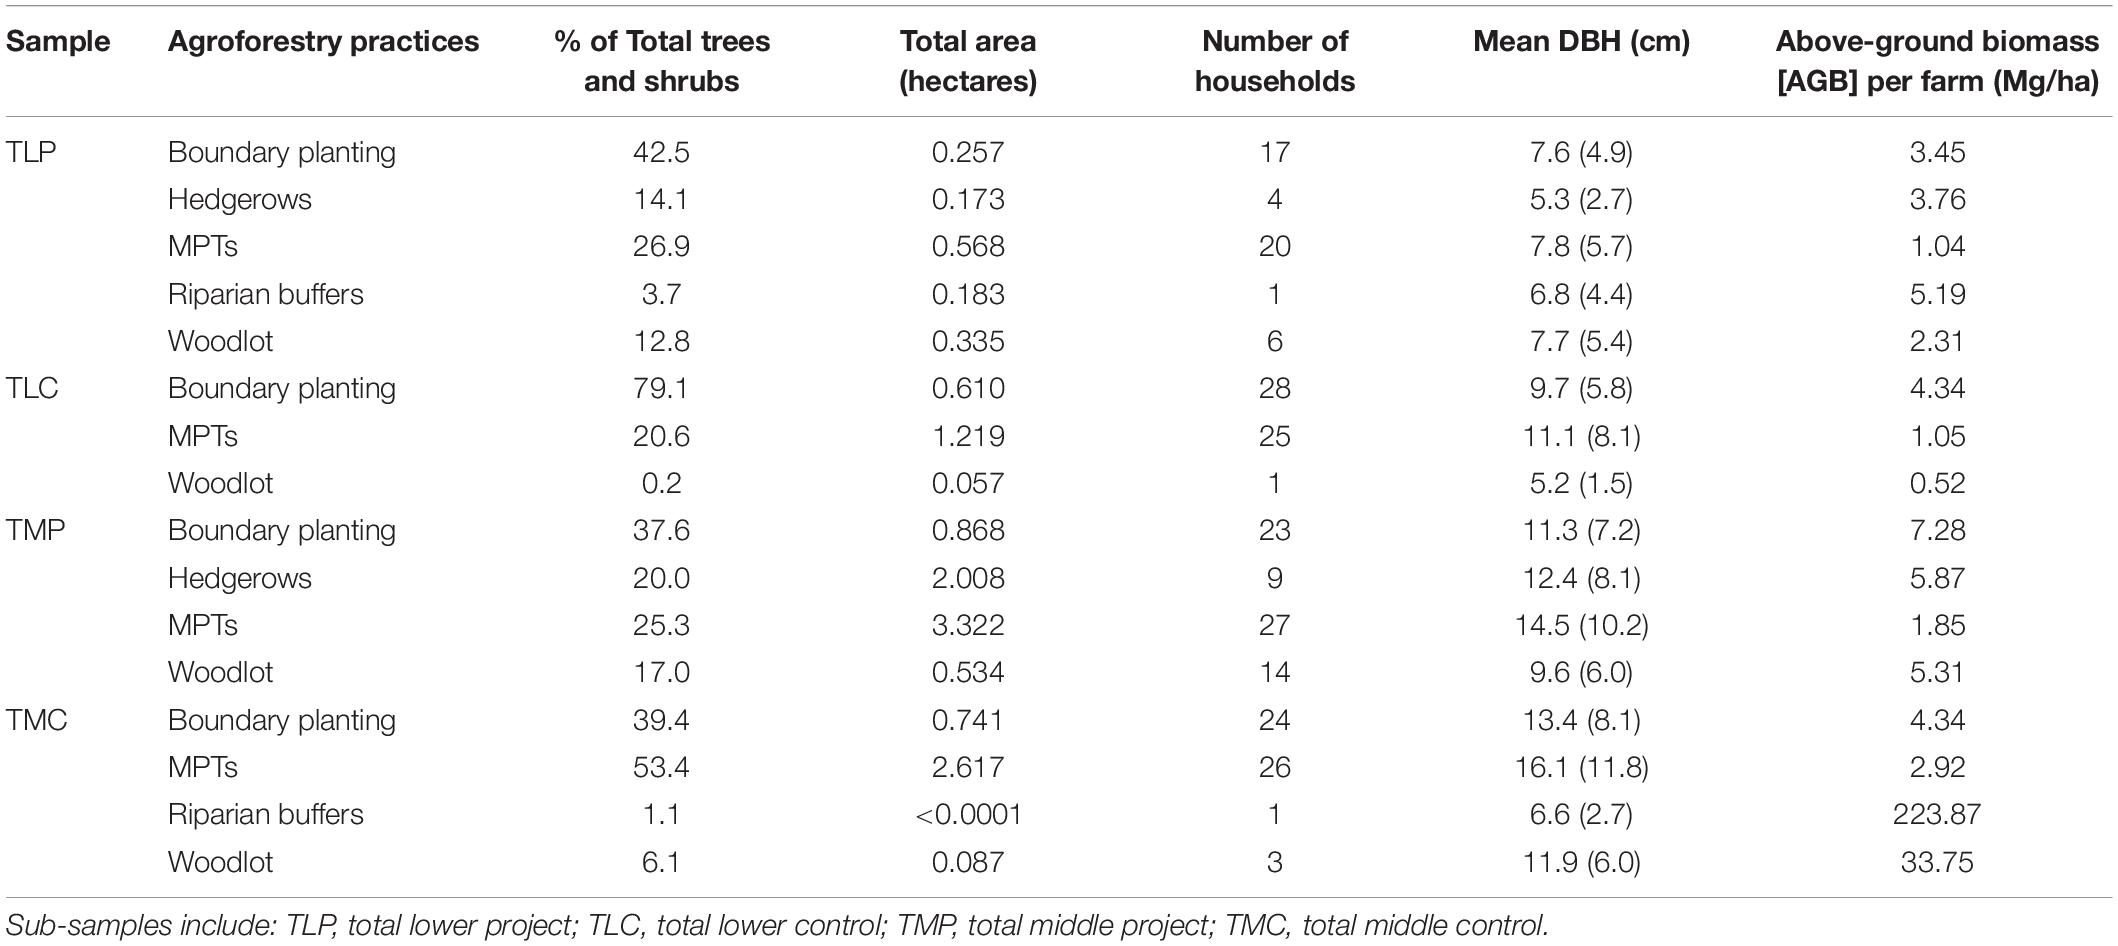
Table 8. Estimated AGB per agroforestry practice across sub-samples.
In the lower project sample, riparian buffers contributed the most biomass, followed by hedgerows (Table 8). In lower control, boundary planting contributed the most biomass, which was also the practice that contributed the most biomass in the middle project groups (Table 8). Riparian buffers and woodlots contributed the first and second most biomass in the middle control sample, respectively. However, this can be attributed to the small sample sizes, which makes the contribution by boundary planting at 4.34 Mg/ha also considerable.
Dominant Biomass Contributor Species
Certain individual tree and shrub species, both indigenous and exotic, contributed over-proportionally to total biomass estimates across the two regions. Overall, Grevillea robusta contributed 34.1% of total biomass, Eucalyptus sp. contributed 4.8%, while Ficus sur contributed 4.6%. In lower Nyando, Eurphobia tirucalli contributed 16.5% of total biomass, Balanites aegyptiaca contributed 15.1% while Grevillea robusta contributed 14.4% of biomass within the site. In middle Nyando, Grevillea robusta was the highest dominant biomass contributor with 37.8% of sample total, Ficus sur contributed 5.4% while Croton macrostachyus contributed 5.3% of total site biomass. Among those species that contributed AGB > 0.2 Mg, which represents the minimum threshold set for relative dominance in this study, the top three in each group type are considered (see Figure 4).
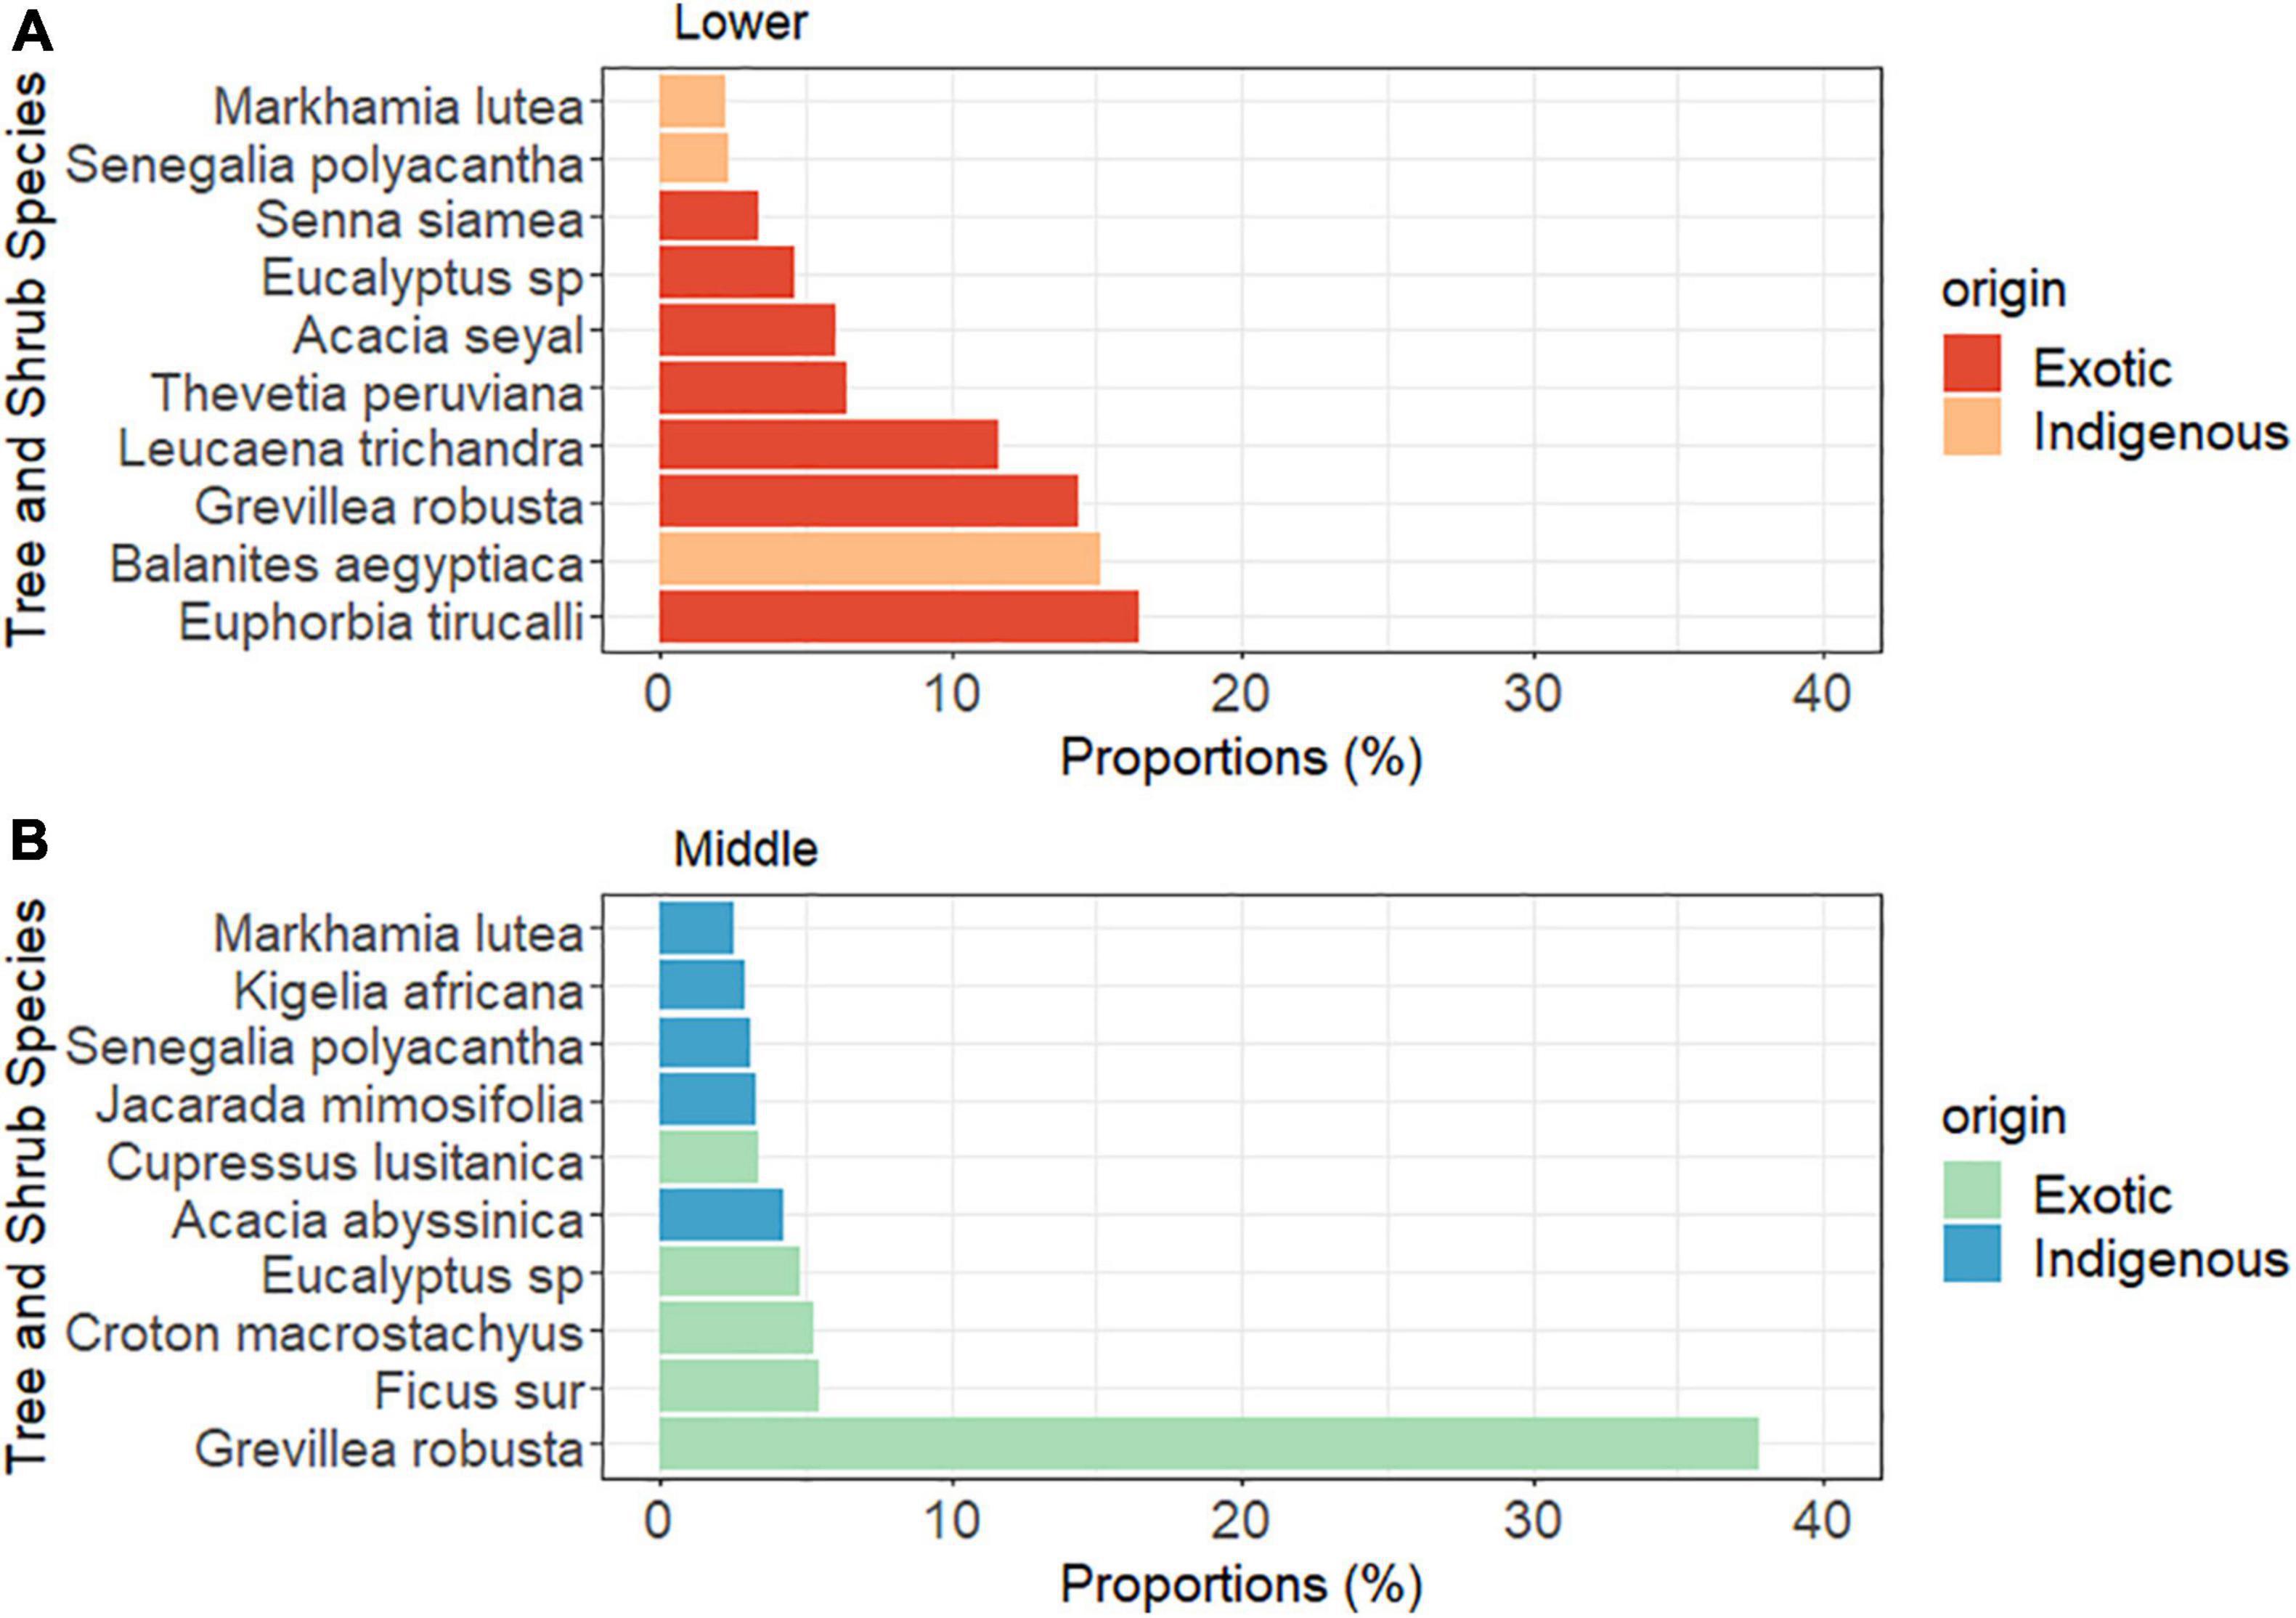
Figure 4. The distribution of dominant tree and shrub species with the 10 highest AGB estimates in (A) lower and (B) middle Nyando sub-samples.
Dominant trees in the lower project sample were Balanites aegyptiaca, Grevillea robusta, and Thevetia peruviana, which held 27.8, 12.1, and 11.9% of the total biomass respectively, while Euphorbia tirucalli, Grevillea robusta, and Leucaena trichandra held 20.3, 15.1, and 14.7% of the total biomass in the lower control sample (see upper section of Figure 4). In middle Nyando, Grevillea robusta, Eucalyptus sp., and Ficus sur held 50.9, 4.7, and 4.1% in the middle project sample, while Grevillea robusta, Croton macrostachyus, and Ficus sur held 16.9, 11.3, and 7.5%, respectively, in the middle control sample (see lower section of Figure 4). Overall, the top three dominant biomass contributors were exotic species. All three dominant contributors in middle Nyando were exotic species, while two out of three dominant species in lower Nyando were exotic. In all group-in-site samples (lower project, lower control, middle project, and middle control), at least two out of the top three dominant tree species in the other samples were of exotic origin.
Discussion
Understanding the Extent and Drivers of Differences in Tree Numbers, Species Diversity and Overall Above-Ground Biomass
Overall, the number of inventoried trees and shrubs was much higher, and there were considerably higher numbers of large diameter trees, in middle Nyando than in lower Nyando. Conversely, the landscape in lower Nyando was dominated by low-biomass trees/shrubs, which contributed to lower AGB within the site. Large trees were few, most likely because of considerable harvesting for fuel wood, timber and charcoal burning in the past, as indicated in Boye (2002). The dominance of low and intermediary-biomass trees also points toward farmers having integrated new trees/shrubs in their farms and/or allowed for natural regeneration. In that vein, many interviewed households across all four project groups suggested that their engagement in agroforestry was driven by an interest in socio-ecological services provided by trees on farm that had been promoted in project trainings. While the tree density was higher due to the smaller size of farms owned among lower project than lower control sample households, the former had considerably fewer trees/shrubs on farm than the latter despite having obtained tree/shrubs seedlings through the project. Qualitative data showed that the Lower Project 2 research group was essentially composed of elderly widowed women, which had contributed to low engagement in agroforestry and hence to low tree numbers, species diversity and overall AGB. Interview data revealed other barriers to engagement in agroforestry in lower Nyando, including frequent dry spells, and an absence of reliable water sources, which had led to the drying up of the seedlings in the community tree nursery. Furthermore, control group members had seemingly adopted practices that were promoted to project groups by virtue of being neighbors and relatives. The project hence had a spill-over effect and contributed to the adoption of agroforestry among the control group members, similar to observation made in Noordin et al. (2001).
On the other hand, the middle project sample had considerably higher number of trees and shrubs than the middle control sample. A larger proportion of the trees/shrubs in the middle project were small diameter trees than in the control sample, while the proportion of larger diameter trees/shrubs was higher in the middle control sample. According to the qualitative data, middle project households planted many seedlings and prioritized seedling survival. The high seedling survival rate was partly related to ICRAF trainings that emphasized the value of conserving and planting more trees/shrubs on farm. Middle Project 1 members reported having collectively decided to eliminate all goats from their households, which had previously browsed on young trees/shrubs and had hence inhibited seedling survival, as observed in Alain and Serigne (2007). The implementation of seedling survival-enhancing techniques was also evident from the high number of saplings recorded in the middle project sample. Similarly, large-biomass trees, which were remnants of the natural degraded forest and had been preserved through FMNR, were frequent among both project and control groups in this region. Further, the high proportion of AGB stemming from large diameter trees in Middle Control 2 research group was related to the presence and protection of a few, but very large indigenous trees, among which Kigelia africana, Ficus sur, and Jacaranda mimosifolia, whose DBH were between 60.5 and 102.5 cm.
Diversity in Agroforestry Practices, Species Diversity, and Impact on Above-Ground Biomass
Boundary planting was the most common agroforestry practice in both regions, and most trees/shrubs recorded were inventoried in this arrangement. This popularity might be attributed to the fact that farmers used trees/shrubs to fortify their farm boundaries, either between farms or between sections within the same farm, in line with the findings of Nyaga et al. (2015). However, boundary planting, overall, had low diversity, which might be attributed to the farmers’ preference for Grevillea robusta and Leucaena species for fuel wood, fodder, timber, and shading. However, Grevillea robusta was the largest single contributor of AGB in the study sample. Among the five inventoried practices, riparian buffer planting was the least common, since only a few farmers’ farms were bordering a river. Considering the small sample and the small area under the practice, AGB from riparian buffers was considerable. The highest tree/shrub species diversity was recorded in MPTs, which can be attributed to the various purposes that these diverse trees have, including provision of fruits, use of leaves as vegetables, fertilizer and their shade and aesthetic value. Woodlots also had high diversity in all the samples, except in the lower control sample, where only one farmer had planted a woodlot. Overall, high diversity in woodlots can be attributed to the fact that woodlots are primarily planted for fuel wood, in line with findings of Akinnifesi et al. (2008), and that farmers typically opt for different fast-growing trees/shrubs to diversify the source of this valuable commodity (Iiyama et al., 2014; Yonemitsu et al., 2014). Hedgerows were exclusively found in the project samples in both regions and were mostly planted with Grevillea robusta. Low diversity and high frequency of Grevillea robusta in hedgerows can be equated with hedgerows being primarily used for shade in coffee sections on-farm, specifically in Middle Project 1, while in they were used to shade food crops in Lower Project 1.
Overall, engagement in agroforestry contributed to improved biodiversity on agricultural lands, which agrees with the findings of Scherr (1995) and McNeely and Schroth (2006). Farmers in both regions had more exotic trees/shrubs than indigenous trees, which can be attributed to fuel wood, fodder and fertilizer being sourced from fast-growing exotic trees/shrub species like Grevillea robusta and Leucaena species. This was also reported in terms of farmer preference for particular trees/shrubs that match their interests (Nyaga et al., 2015). The species diversity in the lower project sample was higher than in the lower control sample, and lower in the middle project than in the middle control sample, despite the significantly higher number of trees/shrubs found in the middle project sample.
Overall Biomass Estimates, Biomass Per Tree/Shrub Size, and Dominant Contributor Species
In the total lower project sample, a total of 805 “project” trees/shrubs, which farmers indicated having planted during or after the project, contained about 2.27 Mgha–1 of AGB per farm, while holding 479 trees/shrubs containing 2.65 Mgha–1 that farmers had planted out of their own initiative before the project or that had been found on the land previously. Similarly, 3,245 “project” trees/shrubs containing 6.74 Mgha–1 of the total biomass estimates per farm in the middle project sample were inventoried, compared to 1,209 containing 6.03 Mgha–1, which farmers had planted previously or found on their land. These results illustrate that conservation of large old diameter trees is important because they only represented 1% of the total number of trees/shrubs inventoried, but contained 22% of the AGB. Since the numbers of trees planted during or after the project were by far higher than pre-existing trees in both regions, future AGB increases in both areas is likely. In the lower project sample, AGB was directly proportional to the number of agroforestry practices and the numbers of trees/shrubs inventoried, while the AGB was proportional to the number of trees/shrubs inventoried in the lower control sample. In the middle project and middle control samples, biomass results were mainly influenced by a large number of moderate size trees/shrubs, their diversity and the presence of large diameter trees, similar to the observation of Kuyah et al. (2014) in Malawi.
Overall, species diversity, number of trees/shrubs, large trees/shrubs and biomass were significantly higher in middle Nyando than in lower Nyando. This is likely due to the high frequency of high-biomass trees/shrubs and the overall number of trees in all diameter classes, as well as the fact that farms were bigger overall and that there was more remnant primary forest in middle Nyando than in lower Nyando. Favorable climatic condition potentially contributed to more and bigger trees/shrubs in middle than in lower Nyando as well. Furthermore, adoption of seedling survival-enhancing farm management techniques was witnessed among MP1 members. These assumptions are in line with the assertions of Ordonez et al. (2014) on the role of socio-ecological factors in shaping the diversity pattern.
The most dominant tree species in terms of biomass, or the tree species which contributed most to the estimated AGB, were different in all the four sub-samples across the two regions. Altogether, the most dominant species were Grevillea robusta, Eucalyptus sp., Ficus sur, Croton macrostachyus, Balanites aegyptiaca, Acacia abyssinica, Jacaranda mimosifolia, Senegalia polyancatha, Euphorbia tirucalli, and Cupressus lusitanica. Various explanations can be invoked for the dominance of these species. First, farmers seemed to be hesitant to cut the remaining few old indigenous Balanites aegyptiaca, Ficus sur and Acacia abyssinica trees. The readily available source of fuel wood from the faster growing Grevillea robusta that all farmers planted in their farms might have contributed to that. In addition, Senegalia polyancatha grew very fast in lower Nyando because farmers pollarded the trees and the remaining stems were left on the farm, and therefore stocked further carbon. Abundance of Senna siamea and Leucaena trichandra was likely related to them being planted by many farmers as a source of fodder for their livestock during the dry spells. Furthermore, the presence of Euphorbia tilucalli can potentially be related to its cultural value, since it is traditionally planted around the homestead belonging to members of the Luo community as an indicator that the household is headed by a man (Oloo et al., 2013). The tree furthermore provides a reliable source of fuel wood. Thevetia peruviana, considered as an invasive species, specifically in open areas, continued to spread very fast, and farmers used it for fuel wood and construction poles (GISD, 2010). Eucalyptus species, belonging to the most common fast-growing tree species, were also planted by many farmers as a source of fuel wood and timber. Cupressus lusitanica, another fast-growing species, is a good source of timber when it is fully mature, and farmers are likely to have allowed it to grow for a prolonged period for that reason, especially in middle Nyando. Croton macrostachyus grows very fast and farmers in middle Nyando integrated it in their coffee farms for shading.
Conclusion
A total of five agroforestry practices were documented in the lower and middle Nyando Blocks. In the total project and control samples in both region, boundary planting was the most common agroforestry practice. Conversely, MPTs on farmland had the highest species diversity across all four sub-samples. Biomass estimates were highest in woodlots on farmland where trees/shrubs contributed more AGB than other practices. This is a clear indication that agroforestry practices such as MPTs, woodlots and boundary planting, and fast-growing multipurpose trees/shrubs like Grevillea robusta, Leucaena sp., Markhamia lutea among other species, whose products and area of planting can allow for its prolonged growth on-farm, contribute significantly to smallholder agroforestry carbon in western Kenya. The biomass estimates, and tree/shrub species diversity established in this study provide benchmark information that can enable national and international policy makers and implementers to promote agroforestry practices, particularly MPTs and boundary planting, that constitute suitable, viable and economical technologies for adapting to and mitigating the adverse effects of climate change. This information can make an important contribution to NDC definition, as well as measurement, reporting and verification. The study furthermore illustrates that ABCD approaches are suitable for the identification and sustainable implementation of context-specific options. It hence demonstrates the positive relation between deliberate project designs to preserve and foster community agency, the co-creation of sustainable land use options, and long-lasting environmental impact; and proposes a sustainable process contributing to SDG goal 15 on “life on land.”
Data Availability Statement
The datasets presented in this study can be found in online repositories. The names of the repository/repositories and accession number(s) can be found below: Orero et al. (2021).
Ethics Statement
Ethical review and approval was not required for the study on human participants in accordance with the local legislation and institutional requirements. Written informed consent for participation was not required for this study in accordance with the national legislation and the institutional requirements.
Author Contributions
LF: conceptualization, funding acquisition, investigation, methodology, project administration, resources, supervision, validation, writing—original draft, and writing—reviewing and editing. LO: data curation, formal analysis, methodology, software, validation, visualization, and writing—reviewing and editing. SN: conceptualization, data curation, formal analysis, investigation, methodology, and writing—original draft. SK: conceptualization, methodology, and writing—reviewing and editing. HN: funding acquisition and supervision. All authors contributed to the article and approved the submitted version.
Funding
This work was supported by funds that World Agroforestry (ICRAF) obtained from the Comart Foundation, a private Canadian charitable foundation, via the Coady International Institute, Nova Scotia, Canada. The publication is further supported by the Biovision Foundation through DPE-010 ABCD-RK.
Conflict of Interest
The authors declare that the research was conducted in the absence of any commercial or financial relationships that could be construed as a potential conflict of interest.
Publisher’s Note
All claims expressed in this article are solely those of the authors and do not necessarily represent those of their affiliated organizations, or those of the publisher, the editors and the reviewers. Any product that may be evaluated in this article, or claim that may be made by its manufacturer, is not guaranteed or endorsed by the publisher.
Acknowledgments
We extend gratitude to John Obuom, William Osanya, Michael and Mark Olewe for the assistance they provided during the entire data collection period. Finally, We are also grateful to various ICRAF staff for their support in statistical analysis (John Nyagah, Mulugeta Mokria), with GIS analyses (Muhammad M. Ahmat), and field work coordination (Lang’at Kipkorir).
Footnotes
- ^ The mean AGB/ha under riparian buffers was very high. This was first attributed to the species (eucalyptus) and that they grow next to a river. Furthermore, the relative area with the trees is small leading to a high AGB/ha.
References
Akinnifesi, F. K., Sileshi, G., Ajayi, O. C., Chirwa, P. W., Kwesiga, F. R., and Harawa, R. (2008). Contributions of agroforestry research and development to livelihood of smallholder farmers in Southern Africa: 2. Fruit, medicinal, fuelwood and fodder tree systems. Agric. J. 3, 76–88.
Alain, A., and Serigne, T. K. (2007). Carbon sequestration in tropical agroforestry systems. Agric. Ecosyst. Environ. 99, 15–27.
Boye, A. (2002). Preliminary Baseline Report: Nyando River basin. Nairobi: International Centre for Research in Agroforestry.
Boye, A., Verchot, L., and Zomer, R. (2008). Baseline Report Yala and Nzoia River Basins: Western Kenya Integrated Ecosystem Management Project Findings from the Baseline Surveys. Nairobi: International Centre for Research in Agorforestry.
Brown, S. (1997). Estimating Biomass and Biomass Change of Tropical Forests: A Primer. FAO Forestry Paper. Rome: Food and Agriculture Organization.
Budiadi, B., and Ishii, H. R. (2010). Comparison of carbon sequestration between multiple-crop, single-crop and monoculture agroforestry systems of Melaleuca in Java, Indonesia. J. Trop. For. Sci. 22, 378–388.
Chazdon, R. L. (2008). Beyond deforestation: restoring forests and ecosystem services on degraded lands. Science 320, 1458–1460. doi: 10.1126/science.1155365
Franzel, S., Carsan, S., Lukuyu, B., Sinja, J., and Wambugu, C. (2014). Fodder trees for improving livestock productivity and smallholder livelihoods in Africa. Curr. Opin. Environ. Sustain. 6, 98–103. doi: 10.1016/j.cosust.2013.11.008
Fuchs, L. E., and Neufeldt, H. (2014). Reducing Subsistence Farmers‘ Vulnerability to Climate Change: Evaluating the Outcomes, Challenges and Way Forward of a Comart Project in Nyando River Basin. Internal Report. Nairobi: International Centre for Research in Agorforestry.
Fuchs, L. E., Orero, L., Namoi, N., and Neufeldt, H. (2019a). How to effectively enhance sustainable livelihoods in smallholder systems: a comparative study from Western Kenya. Sustainability 11:1564. doi: 10.3390/su11061564
Fuchs, L. E., Peters, B., and Neufeldt, H. (2019b). Identities, interests, and preferences matter: fostering sustainable community development by building assets and agency in western Kenya. Sustain. Dev. 27, 704–712. doi: 10.1002/sd.1934
Garrity, D. P., Akinnifesi, F. K., Ajayi, O. C., Weldesemayat, S. G., Mowo, J. G., Kalinganire, A., et al. (2010). Evergreen agriculture: a robust approach to sustainable food security in Africa. Food Secur. 2, 197–214. doi: 10.1007/s12571-010-0070-7
Ghore, Y. (2015). Producer-Led Value Chain Analysis: The Missing Link in Value Chain Development A Tool for Effective Engagement of Small Producers. Antigonish, NS: Coady.
GISD (2010). Global Invasive Species Database Online Data Sheet. Thevetia Peruviana (tree). Munich: Global Invasive Species Database.
Haglund, E., Ndjeunga, J., Snook, L., and Pasternak, D. (2011). Dry land tree management for improved household livelihoods: farmer managed natural regeneration in Niger. J. Environ. Manag. 92, 1696–1705. doi: 10.1016/j.jenvman.2011.01.027
Iiyama, M., Neufeldt, H., Dobie, P., Njenga, M., Ndegwa, G., and Jamnadass, R. (2014). The potential of agroforestry in the provision of sustainable woodfuel in sub-Saharan Africa. Curr. Opin. Environ. Sustain. 6, 138–147. doi: 10.1016/j.cosust.2013.12.003
Ketterings, Q. M., Coe, R., Van Noordwijk, M., Ambagau’, Y., and Palm, C. A. (2001). Reducing uncertainty in the use of allometric biomass equations for predicting above-ground tree biomass in mixed secondary forests. For. Ecol. Manag. 146, 199–209. doi: 10.1016/S0378-1127(00)00460-6
Kretzmann, J. P., and McKnight, J. L. (1993). Building Communities from the Inside Out: A Path Toward Finding and Mobilizing a Community’s Assets. Victoriaville, QC: Canadian CED Network, doi: 10.1017/CBO9781107415324.004
Kuyah, S., Dietz, J., Muthuri, C., Noordwijl, M., and Neufeldt, H. (2013). Allometry and partitioning of above- and below-ground biomass in farmed eucalyptus species dominant in Western Kenyan agricultural landscape. Biomass Bioene. 55, 276–281.
Kuyah, S., Johannes, D., Muthuri, C., Jamnadass, R., Mwangi, P., Coe, R., et al. (2012a). Allometric equations for estimating biomass in agricultural landscapes: I. Aboveground biomass. Agric. Ecosyst. Environ. 158, 216–224.
Kuyah, S., Johannes, D., Muthuri, C., Jamnadass, R., Mwangi, P., Coe, R., et al. (2012b). Allometric equations for estimating biomass in agricultural landscapes II. Agric. Ecosyst. Environ. 158, 225–234.
Kuyah, S., Öborn, I., Jonsson, M., Dahlin, A. S., Muthuri, C., Malmer, A., et al. (2016). Trees in agricultural landscapes enhance provision of ecosystem services in Sub-Saharan Africa. Biodiver. Sci. Ecosyst. Serv. Manag. 12, 255–273. doi: 10.1080/21513732.2016.1214178
Kuyah, S., Sileshi, W. G., Njoloma, J., Mng’omba, S., and Neufeldt, H. (2014). Estimating aboveground tree biomass in three different miombo woodlands and associated land use systems in Malawi. Biomass Bioene. 66, 214–222. doi: 10.1016/j.biombioe.2014.02.005
Luedeling, E., Sileshi, G., and Dietz, J. (2011). “Advances in agroforestry,” in Advances in Agroforestry, eds B. M. Kumar and P. K. R. Nair (Berlin: Springer Science and Business Media, +Business Media), 61–83.
Mathie, A., and Cunningham, G. (2008). From Clients to Citizens: Communities Changing the Course of their Own Development. Rugby: Practical Action.
Mathie, A., Cunningham, G., and Peters, B. (2017). Asset-Based and Citizen-Led Development: Participant Manual. Antigonish, NS: ABCD Publications.
Mathie, A., Cunningham, G., and Puntenney, D. (2009). From Clients to Citizens: Deepening the Practice of Asset-based and Citizen-led Development. Antigonish, NS: Coady International Institute.
McNeely, J. A., and Schroth, G. (2006). Agroforestry and biodiversity conservation – traditional practices, present dynamics, and lessons for the future. Biodiver. Conserv. 15, 549–554. doi: 10.1007/s10531-005-2087-3
Mokria, M., Mekuria, W., Gebrekirstos, A., Aynekulu, E., Belay, B., Gashaw, T., et al. (2018). Mixed-species allometric equations and estimation of aboveground biomass and carbon stocks in restoring degraded landscape in northern Ethiopia. Environ. Res. Lett. 13:024022. doi: 10.1088/1748-9326/aaa495
Mugasha, W. A., Eid, T., Bollandsås, O. M., Malimbwi, R. E., Chamshama, S. A. O., Zahabu, E., et al. (2013). Allometric models for prediction of above- and belowground biomass of trees in the miombo woodlands of Tanzania. For. Ecol. Manag. 310, 87–101. doi: 10.1016/j.foreco.2013.08.003
Nair, P. K. R. (1993). An Introduction to Agroforestry. London: Kluwer Academic Publishers, doi: 10.1016/0378-1127(95)90008-X
Negash, M., Starr, M., Kanninen, M., and Berhe, L. (2013). Allometric equations for estimating aboveground biomass of Coffea arabica L. grown in the Rift Valley escarpment of Ethiopia. Agrofor. Syst. 87, 953–966. doi: 10.1007/s10457-013-9611-3
Noordin, Q., Niang, A., Jama, B., and Nyasimi, M. (2001). Scaling up adoption and impact of agroforestry technologies: experiences from Western Kenya. Dev. Pract. 11, 509–523. doi: 10.1080/09614520120066783
Nyaga, J., Borrios, E., Muthuri, C. W., Oborn, I., Matiru, V., and Sinclair, F. L. (2015). Evaluating factors influencing heterogeneity in agroforestry adoption and practices within smallholder farms in Rift Valley, Kenya. Agric. Ecosyst. Environ. 212, 106–118. doi: 10.1016/j.agee.2015.06.013
Oloo, J. O., Makenzi, P. M., Gowland, J., and Ali Shaukat Abdulrazack, M. (2013). Influence of traditions/customs and beliefs/norms on women in tree growing in Siaya County, Kenya. Glob. J. Environ. Sci. Technol. 1, 1–6.
Ordonez, C. J., Leudeling, E., Kindt, R., Tata, L. H., Horja, D., Jamnadass, R., et al. (2014). Constraints and opportunities for tree diversity management along the forest transition curve to achieve multifunctional agriculture. Curr. Opin. Environ. Sustain. 6, 54–60. doi: 10.1016/j.cosust.2013.10.009
Orero, L., Fuchs, L., and Ngoima, S. (2021). Asset-Based Adaptation Project Promotes Tree and Shrub Diversity and Above-Ground Carbon Stocks in Smallholder Systems in Western Kenya. Harvard Dataverse, V1, UNF:6:1y0Il4cQEDq3YA9yl7wEyg==[fileUNF]. Available online at: https://doi.org/10.7910/DVN/UE9DLE
Pumari, L., Midega, C., and Jonsson, M. (2015). Effects of agroforestry on pest, disease and weed control: a meta-analysis. Basic Appl. Ecol. 16, 573–582. doi: 10.1016/j.baae.2015.08.006
Quandt, A., Neufeldt, H., and McCabe, J. T. (2017). The role of agroforestry in building livelihood resilience to floods and drought in semiarid Kenya. Ecol. Soc. 22:10. doi: 10.5751/ES-09461-220310
R Core Team (2016). R: A Language and Environment for Statistical Computing. Vienna: R Foundation for Statistical Computing.
Ranjitkar, S., Sujakhu, N. M., Merz, J., Kindt, R., Xu, J., Matin, M. A., et al. (2016). Suitability analysis and projected climate change impact on banana and coffee production zones in Nepal. PLoS One 11:e0163916. doi: 10.1371/journal.pone.0163916
Reij, C., and Garrity, D. (2016). Scaling up farmer-managed natural regeneration in Africa to restore degraded landscapes. Biotropica 48, 834–843. doi: 10.1111/btp.12390
Reppin, S., Kuyah, S., de Neergaard, A., Oelofse, M., and Rosenstock, T. S. (2019). Contribution of agroforestry to climate change mitigation and livelihoods in Western Kenya. Agrofor. Syst. 94, 203–220. doi: 10.1007/s10457-019-00383-7
Rosenstock, T. S., Wilkes, A., Jallo, C., Namoi, N., Bulusu, M., Suber, M., et al. (2019). Making trees count: measurement and reporting of agroforestry in UNFCCC national communications of non-Annex I countries. Agric. Ecosyst. Environ. 284:106569.
Roshetko, J. M., Lasco, R. D., and Angeles, M. S. D. (2006). Smallholder agroforestry systems for carbon storage. Mitig. Adapt. Glob. Change 12, 219–242. doi: 10.1007/s11027-005-9010-9
Scherr, S. J. (1995). Economic factors in farmer adoption of agroforestry: patterns observed in Western Kenya. World Dev. 23, 787–804. doi: 10.1016/0305-750X(95)00005-W
Seeberg-Elverfeldt, C., Schwarze, S., and Zeller, M. (2009). Carbon finance options for smallholders’ agroforestry in Indonesia. Int. J. Commons 3, 108–130.
Sileshi, G. W., Mafongoya, P. L., Akinnifesi, F. K., Phiri, E., Chirwa, P., Beedy, T., et al. (2014). Agroforestry: fertilizer trees. Encycl. Agric. Food Syst. 1, 222–234.
Thorlakson, T., and Neufeldt, H. (2012). Reducing subsistence farmers’ vulnerability to climate change: evaluating the potential contributions of agroforestry in western Kenya. Agric. Food Secur. 1:15. doi: 10.1186/2048-7010-1-15
Tumwebaze, S. B., Bevilacqua, E., Brigs, R., and Volka, T. A. (2013). Allometric biomass equations for tree species used in agroforestry systems in Uganda. Agrofor. Syst. 87, 781–795.
Verchot, L., Zomer, R., Learmo, I., and Muchoki, F. (2008). Baseline Report Nyando River Basin. Nairobi: International Centre for Research in Agorforestry.
West, P. W. (2009). Tree and Forest Measurement, 2nd Edn. Germany: Springer, doi: 10.1007/978-3-540-95966-3
Weston, P., Hong, R., Kaboré, C., and Kull, C. A. (2015). Farmer-managed natural regeneration enhances rural livelihoods in Dryland West Africa. Environ. Manag. 55, 1402–1417. doi: 10.1007/s00267-015-0469-1
World Bank (2010). Kenya–Western Kenya Integrated Ecosystem Management Project (English). Washington, DC: World Bank.
Yonemitsu, A., Njenga, M., Iiyama, M., and Matsushita, S. (2014). Household fuel consumption based on multiple fuel use strategies: a case study in Kibera slums. APCBEE Proc. 10, 331–340. doi: 10.1016/j.apcbee.2014.10.062
Zewdie, M., Olsson, M., and Verwijst, T. (2009). Above-ground biomass production and allometric relations of Eucalyptus globulus Labill. coppice plantations along a chronosequence in the central highlands of Ethiopia. Biomass Bioene. 33, 421–428. doi: 10.1016/j.biombioe.2008.08.007
Keywords: asset-based community development, agroforestry, above-ground biomass, carbon stocks, smallholder carbon, nationally determined contributions, multipurpose trees
Citation: Fuchs LE, Orero L, Ngoima S, Kuyah S and Neufeldt H (2022) Asset-Based Adaptation Project Promotes Tree and Shrub Diversity and Above-Ground Carbon Stocks in Smallholder Agroforestry Systems in Western Kenya. Front. For. Glob. Change 4:773170. doi: 10.3389/ffgc.2021.773170
Received: 09 September 2021; Accepted: 24 December 2021;
Published: 14 January 2022.
Edited by:
Tapan Kumar Nath, University of Nottingham Malaysia Campus, MalaysiaReviewed by:
Abdus Subhan Mollick, Khulna University, BangladeshTarit Kumar Baul, University of Chittagong, Bangladesh
Copyright © 2022 Fuchs, Orero, Ngoima, Kuyah and Neufeldt. This is an open-access article distributed under the terms of the Creative Commons Attribution License (CC BY). The use, distribution or reproduction in other forums is permitted, provided the original author(s) and the copyright owner(s) are credited and that the original publication in this journal is cited, in accordance with accepted academic practice. No use, distribution or reproduction is permitted which does not comply with these terms.
*Correspondence: Lisa Elena Fuchs, TC5GdWNoc0BjZ2lhci5vcmc=
†ORCID: Lisa Elena Fuchs, orcid.org/0000-0002-8342-6087; Levi Orero, orcid.org/0000-0003-0071-8592; Shem Kuyah, orcid.org/0000-0001-7692-585X; Henry Neufeldt, orcid.org/0000-0002-0880-9395